
Year 1 Report - ncrste.msstate.edu fileWaheed Uddin, Ph.D., P.E. Director, CAIT [email protected]...
24
Waheed Uddin, Ph.D., P.E. Director, CAIT [email protected] Year 1 Report Year 1 Report US DOT RSPA US DOT RSPA Air Quality Project Air Quality Project October 2001 October 2001 Students Sergio Garza (Ph.D. Student) Javier Garcia (M.S. Student) Lucy Phillips (Senior) Air Quality Project Director Mississippi State University (NCRST-E Lead University)
Transcript of Year 1 Report - ncrste.msstate.edu fileWaheed Uddin, Ph.D., P.E. Director, CAIT [email protected]...

Waheed Uddin, Ph.D., P.E.Director, [email protected]
Year 1 ReportYear 1 Report
US DOT RSPAUS DOT RSPAAir Quality ProjectAir Quality Project
October 2001October 2001
StudentsSergio Garza (Ph.D. Student)Javier Garcia (M.S. Student)
Lucy Phillips (Senior)
Air Quality Project DirectorMississippi State University (NCRST-E Lead University)

US DOT RSPAAir Quality Project
Year 1 Year 1 Project Partners Project Partners
• CAIT, University of Mississippi• Skyborne, Inc.
Other Cooperative AgenciesOther Cooperative Agencies• City of Oxford, Mississippi• City of Tupelo, Mississippi• Tupelo Regional Airport Authority, Mississippi• Mississippi Department of Environmental Quality (DEQ)

US DOT RSPAAir Quality Project
Primary Air PollutantsPrimary Air Pollutants• Stratosphere ( 6 – 30 miles above surface )
Upper – atmospheric Ozone (Good Ozone)natural occurrence
• Troposphere ( Ground-level, above earth surface )Ground-level Ozone (Bad Ozone)toxic to living organismsVOC + NO2 + heat + sunlight = ground-level Ozone (O3)
• Nitrogen Dioxide (NO2)Absorbs the blue band of light and forms “smog”Contributes to chronics lung diseases such as asthma and “Silo filler’s disease”

US DOT RSPAAir Quality Project
SmogAir QualityAir Quality
Clean Air Act, Section 309 Public Law 91-604, 1970. 1990 Clean Air Act Amendments
• 1990 Clean Air Act Amendments direct the U.S. Environmental Protection Agency (EPA) to implement strong environmental policies and regulations that will ensure cleaner air quality.
• EPA established National Ambient Air Quality Standards for various “criteria” pollutants that adversely affect human health and welfare.
•Affects public health•Affects quality of life•Changes from day to day•Air Quality Index (AQI)•Information available to public
0 – 64
65 - 8485 - 104
105 - 124125 - 374
(*)
O3 (ppb)8-hour
301+AQI
201-300151-200101-150
51-1000-51
AIR QUALITY
Good
Moderate
Unhealthy(for sensitive groups)
Unhealthy
Hazardous
Very Unhealthy
EPA StandardO3 1-hour: 120 ppb
-
-125 - 164
165 - 204205 - 404
405 - 504
O3 (ppb)1-hour
* When 8-hour O3 concentrations exceed 374 ppb, AQI values of 301 or higher must be calculated with 1-hour O3 concentrations
AQI scale by EPA

US DOT RSPAAir Quality Project
Clean Air Act RequirementsClean Air Act RequirementsNational Ambient Air Quality StandardsNational Ambient Air Quality Standards
• 1970 Clean Air Act, Section 309 Public Law 91-604 § 12(a), 42 U.S.C. § 7609, was passed by the U.S. Congress in 1970
(Annual average)0.053 ppmNitrogen dioxide (NO2)
(24-hour average)0.14 ppmSulfur dioxide (SO2)
(Annual average)0.03 ppmSulfur dioxide (SO2)
(1-hour average)35 ppmCarbon monoxide (CO)
(8-hour average)9 ppmCarbon monoxide (CO)
(Annual average)50 microgram/m3Particular matter (PM10)
(24-hour average)150 microgram/m3Particular matter (PM10)
(24-hour average)*65 microgram/m3Particular matter (PM2.5)
(Annual average)*15 microgram/m3Particular matter (PM2.5)
0.08 ppm
0.12 ppm
(8-hour average)*Ground-level Ozone (O3)
(1-hour average)Ground-level Ozone (O3)
Maximum Concentration Standard Maximum Concentration Standard ––NAAQSNAAQSPollutantsPollutants
* New proposed standard
US DOT RSPAAir Quality Project
O3
Mod
e rat
e
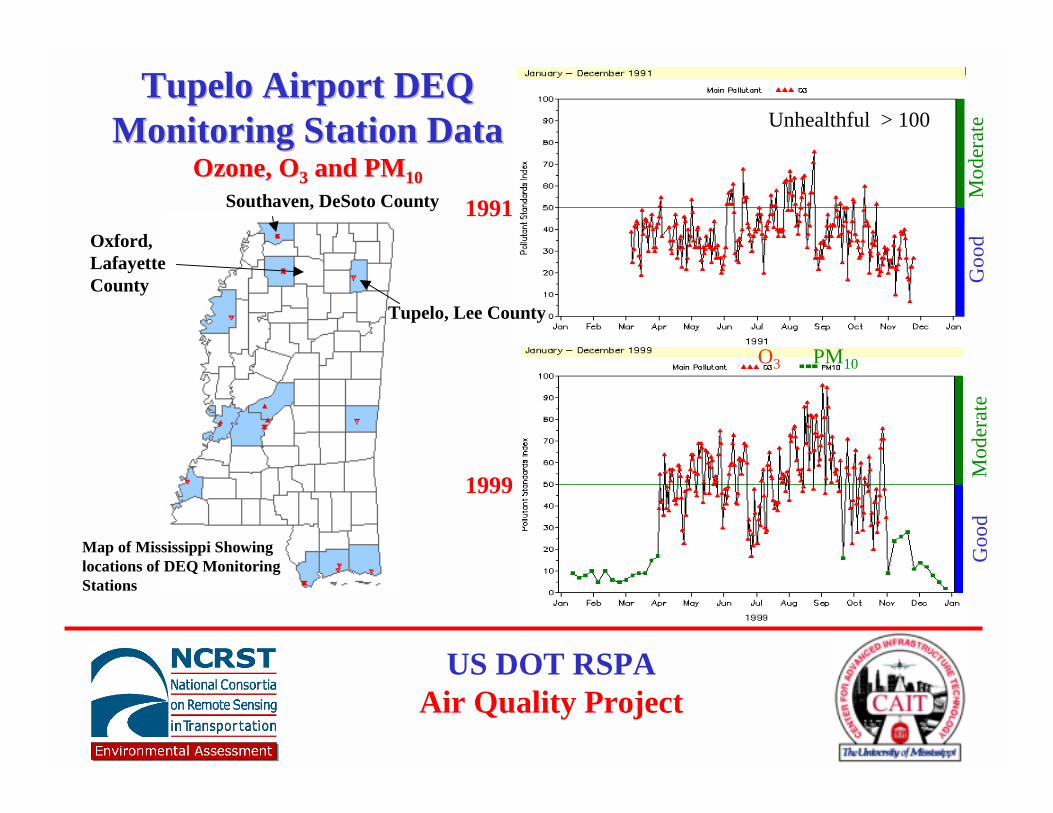
Map of Mississippi Showing locations of DEQ Monitoring Stations
PM10
Unhealthful > 100
Goo
dM
ode r
ate
Goo
d
1999
1991
Tupelo Airport DEQ Tupelo Airport DEQ Monitoring Station DataMonitoring Station Data
Ozone, OOzone, O33 and PMand PM1010
Tupelo, Lee County
Southaven, DeSoto County
Oxford, Lafayette County

US DOT RSPAAir Quality Project
DeSoto County, MS
O3
Good
Moderate
Unhealthful
DeSotoDeSoto DEQ Monitoring Station DataDEQ Monitoring Station DataOzone, OOzone, O33

US DOT RSPAAir Quality Project
10-310-410-510-6 10-2 10-1 109108107106105104103102101
Cosmic rays
γγγγ rays
X rays
Ultraviolet (UV)
VisibleNear-IRM
id-IRThermal IR
Microwave
Television
andradioWavelength (µµµµm) Wavelength (µµµµm)
0.4 0.5 0.6 0.7 (µµµµm)
UV Near-infrared (IR)
Visible(1 mm) (1 m)
BL
UE
GR
EE
N
RE
D
10-310-410-510-6 10-2 10-1 109108107106105104103102101
Cosmic rays
γγγγ rays
X rays
Ultraviolet (UV)
VisibleNear-IRM
id-IRThermal IR
Microwave
Television
andradioWavelength (µµµµm) Wavelength (µµµµm)
0.4 0.5 0.6 0.7 (µµµµm)
UV Near-infrared (IR)
Visible(1 mm) (1 m)
BL
UE
GR
EE
N
RE
D
10-310-410-510-6 10-2 10-1 109108107106105104103102101
Cosmic rays
γγγγ rays
X rays
Ultraviolet (UV)
VisibleNear-IRM
id-IRThermal IR
Microwave
Television
andradioWavelength (µµµµm) Wavelength (µµµµm)
0.4 0.5 0.6 0.7 (µµµµm)
UV Near-infrared (IR)
Visible(1 mm) (1 m)
BL
UE
GR
EE
N
RE
D
The Electromagnetic SpectrumThe Electromagnetic Spectrum
• UV – Ultraviolet• VIS – Visible• IR – Infrared
• Ozone (O3): 280 – 300 nm• Nitrogen Dioxide (NO2): 435 nm
Wavelength Range Required

US DOT RSPAAir Quality Project
200
100
50
20
10
5
22600 2700 2800 2900 3000 3100
O3
SO 2
Wavelength (A)
Absorption coefficients of SO2 and O34,300 4,400 4,500 4,600 4,700 4,800
0.1
0.2
0.3
0.4
0.5
0.6
0.7
0.8
0.9
1.0
1.1
1.2
1.3
1.4
1.5
1.6
1.7
NO2 : 2.6 X 1017 cm-3
L = 10 cmLINE BROADENINGEQUIVALENT TOAMBIENT CONDITIONS
WAVELENGTH (A)
NO2 ABSORPTION CURVE
NO
2 ABS
OR
PTIO
N C
OEF
FIC
IEN
T (c
m-1
) x L
(cm
)
Absorption Spectra of OAbsorption Spectra of O33 and NOand NO22

US DOT RSPAAir Quality Project
• USA– Skyborne, Inc.– NOAA ETL
• Germany– Elight Laser System– Ozone Profiler
• Russia– Mobile LIDAR
• Japan– LEKKO VII CO2
Gas Laser System

US DOT RSPAAir Quality Project
Schematic ofSchematic of SkyborneSkyborne DIAL SystemDIAL SystemLASER 1 ( λ 1)
LASER 2 ( λ 2)
Beam Combiner
Pellicle
100% Reflecting Mirror
Detector 3
Pellicle
CalibrationCell Detector 2
100% Reflectingx10 BeamExpander
BeamSteeringMirror
1/2 mTarget Gas
Field Stop(Variable Aperture)Focusing Optics
29" DOBSONIAN NEWTONIANREFLECTING TELESCOPE(Receiving Telescope)
Outgoing Laser Beam
Return Beam
DETECTOR 1
Narrow BandpassFilter
(1)
(1)
(2)
(3) (8)
(4) 5% (7)10 %
90 % (9) (10)
(5)
95 %
(28)
(6)(12)
(11)
(13)(27)
(14)
Lambda Physik Excimer Dye Lasers

US DOT RSPAAir Quality Project
Test Site Test Site –– Year 1 DIAL MeasurementsYear 1 DIAL Measurements
• Effects of traffic type and volume, traffic gridlock, and urban growth on air pollution
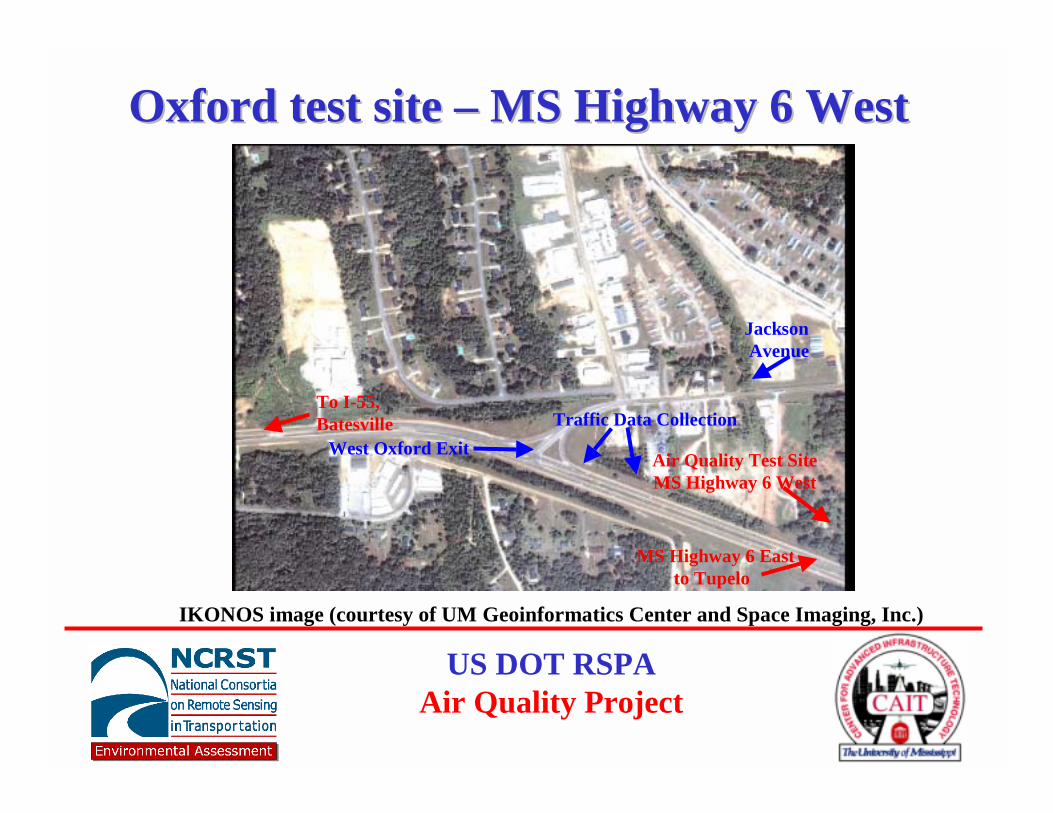
• Rural area and low traffic site: Northern MississippiOxford, MS: Rural small university town; surrounded by three major state highways (MS Highway 6, MS Highway 7, and SR 30) and Interstate I-55 about 24 miles to the west
US DOT RSPAAir Quality Project
Oxford test site Oxford test site –– MS Highway 6 WestMS Highway 6 West
Air Quality Test Site MS Highway 6 West
Traffic Data Collection
MS Highway 6 Eastto Tupelo
JacksonAvenue
West Oxford Exit
To I-55, Batesville
IKONOS image (courtesy of UM Geoinformatics Center and Space Imaging, Inc.)

US DOT RSPAAir Quality Project
DIAL Truck
MS Highway 6 West
Survey of test site
SkyborneSkyborne DIAL truck at Oxford, MS test siteDIAL truck at Oxford, MS test site
Newtonian telescope inside DIAL truck
MS Highway 6 WestMS Highway 6 West

US DOT RSPAAir Quality Project
Skyborne Skyborne DIAL calibrations DIAL calibrations -- Oxford test siteOxford test site
NO2 Calibration cell showing brownish color against blue sky

US DOT RSPAAir Quality Project
RealReal--time time Lidar Lidar signal of signal of Skyborne Skyborne DIALDIAL
Skyborne Excimer Laser System
Laser beam in NO2 band
US DOT RSPAAir Quality Project
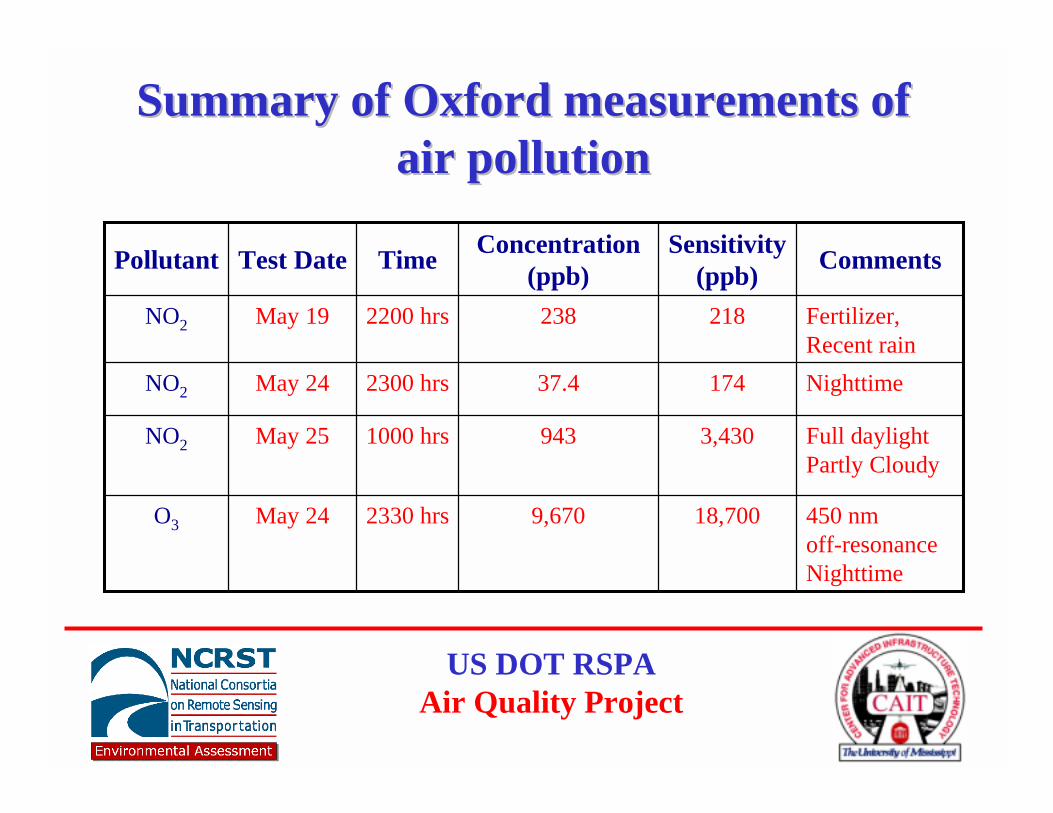
450 nm off-resonance Nighttime
18,7009,6702330 hrsMay 24O3
3,430
174
218
Sensitivity (ppb)
Full daylight Partly Cloudy
9431000 hrsMay 25NO2
Nighttime37.42300 hrsMay 24NO2
Fertilizer, Recent rain
2382200 hrsMay 19NO2
CommentsConcentration (ppb)TimeTest DatePollutant
Summary of Oxford measurements of Summary of Oxford measurements of air pollutionair pollution

US DOT RSPAAir Quality Project
Traffic data collection, MS Highway 6 Traffic data collection, MS Highway 6 Oxford test siteOxford test site
Automatic Traffic Counts, April 25, 2001
West Oxford Exit Intersection on MS Highway 6
Manual Traffic CountsApril 24, 2001
Air Quality Test Site MS Highway 6, Oxford

US DOT RSPAAir Quality Project
Year 1 DIAL Measurements Year 1 DIAL Measurements -- Oxford Test SiteOxford Test SiteTotal Hourly Traffic Volume May 24-26, 2001
MS Highway 6, OxfordCalculated from Automatic Counts
0
200
400
600
800
1,000
1,200
1,400
1,600
1,800
2,0007:
00
9:00
11:0
0
13:0
0
15:0
0
17:0
0
19:0
0
21:0
0
23:0
0
1:00
3:00
5:00
7:00
9:00
11:0
0
13:0
0
15:0
0
17:0
0
19:0
0
21:0
0
23:0
0
1:00
3:00
5:00
Time, hours
Hwy 6 East, Outside LaneHwy 6 East, Inside LaneHwy 6 West, Outside LaneHwy 6 West, Inside LaneHwy 6 East, 2 Lanes CombinedHwy 6 West, 2 Lanes CombinedHwy 6 Total, All Lanes Combined
May 24, 2001 May 25, 2001
Daily Traffic Data assuming same hourly distribution every day
NOTE:
May 24, 200111:00 PM, NO2 Measured 37.4 ppb11:30 PM, O3 Measured
May 26, 2001
May 25, 2001, 10:00 AM NO2 Measured 943 ppb
6:00
Daytime Traffic Volume = 6.4 times Nighttime Traffic VolumeDaytime NO2 = 25 times Nighttime NO2

US DOT RSPAAir Quality Project
Air pollution data measured on May 24 and 25 at Air pollution data measured on May 24 and 25 at MS Highway 6 and weather dataMS Highway 6 and weather data
Goodwin Creek, Batesville, MS Air Temperature, May 24 - May 26, 2001
0
5
10
15
20
25
30
35
7:00
9:00
11:0
0
13:0
0
15:0
0
17:0
0
19:0
0
21:0
0
23:0
0
1:00
3:00
5:00
7:00
9:00
11:0
0
13:0
0
15:0
0
17:0
0
19:0
0
21:0
0
23:0
0
1:00
3:00
5:00
7:00
Time, hours
Tem
pera
ture
, °C
May 24, 200111:00 PM, NO2 Measured 37.4 ppb11:30 PM, O3 Measured
May 24, 2001 May 25, 2001 May 26, 2001
May 25, 200110:00 AM, NO2 Measured 943 ppb
Air Temperature, oC
Goodwin Creek, Batesville, MS Wind Velocity, May 24 - May 26, 2001
0
1
2
3
4
5
6
7
8
9
10
7:00
9:00
11:0
0
13:0
0
15:0
0
17:0
0
19:0
0
21:0
0
23:0
0
1:00
3:00
5:00
7:00
9:00
11:0
0
13:0
0
15:0
0
17:0
0
19:0
0
21:0
0
23:0
0
1:00
3:00
5:00
7:00
Time, hours
Win
d V
eloc
ity, m
/s
May 24, 200111:00 PM, NO2 Measured 37.4 ppb11:30 PM, O3 Measured
May 24, 2001 May 25, 2001 May 26, 2001
May 25, 200110:00 AM, NO2 Measured 943 ppb
ft / s32.81
0
Wind Velocity, m/s
US DOT RSPAAir Quality Project
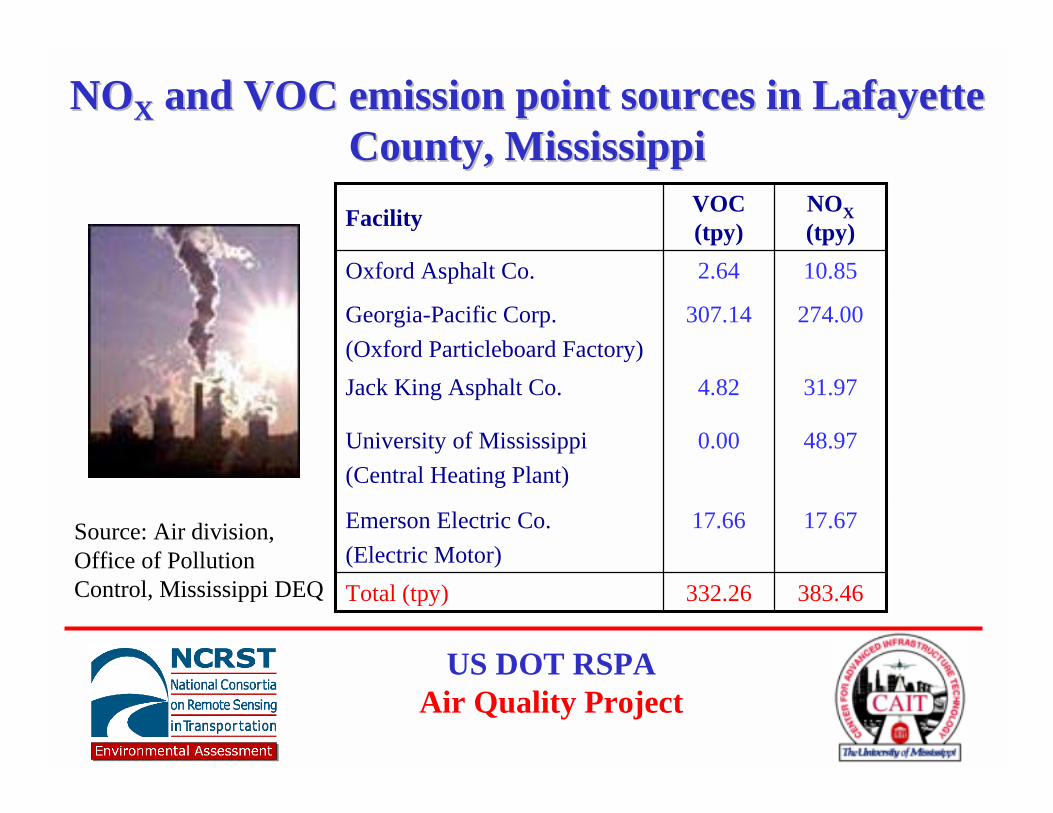
NONOXX and VOC emission point sources in Lafayette and VOC emission point sources in Lafayette County, MississippiCounty, Mississippi
383.46332.26Total (tpy)
17.6717.66Emerson Electric Co. (Electric Motor)
48.970.00University of Mississippi(Central Heating Plant)
31.974.82Jack King Asphalt Co.
274.00307.14Georgia-Pacific Corp. (Oxford Particleboard Factory)
10.852.64Oxford Asphalt Co.
NOX(tpy)
VOC (tpy)Facility
Source: Air division, Office of Pollution Control, Mississippi DEQ

US DOT RSPAAir Quality Project
Review of Air Pollution ModelsReview of Air Pollution Models �� ADAM (Air force dispersion assessment model) �� ADMS-3 (Atmospheric dispersion modeling system) �� ASPEN (Assessment system for population exposure nationwide) �� BLP (Bouyant line and point source model) �� CALINE4 (Steady-state Gaussian dispersion model) �� CDM2 (Climatological dispersion model) �� CMAQ (Community modeling air quality) �� CTDMPLUS (Complex terrain dispersion model plus algorithms for unstable situations) �� DEGADIS (Dense gas dispersion model) �� EKMA (Empirical, city-specific model) �� EMS-HAP (Missions modeling system for hazardous pollutants) �� HYSPLIT (NOAA Transport and dispersion model) �� ISC3 (Industrial source complex model) �� MESOPUFF II (Short term, regional scale puff model) �� OBODM (Open burn/open detonation model) �� OCD (Offshore and coastal dispersion model) �� OZIPR (One-dimensional photochemical box model) �� PLUVUEII (Model for estimating visual range reduction and atmospheric discoloration) �� RAM (Gaussian-plume multiple source air quality algorithm) �� REMSAD (Regulatory modeling system for aerosols and deposition) �� RPM-IV (Reactive plume model) �� SDM (Shoreline dispersion model) �� SLAB (Model for denser-than-air releases) �� SMOKE (Emission data processing for point, area, mobile, and biogenic sources) �� UAM-IV (Urban airshed model) �� UAM-V (The UAM-V photochemical modeling system)
US DOT RSPAAir Quality Project
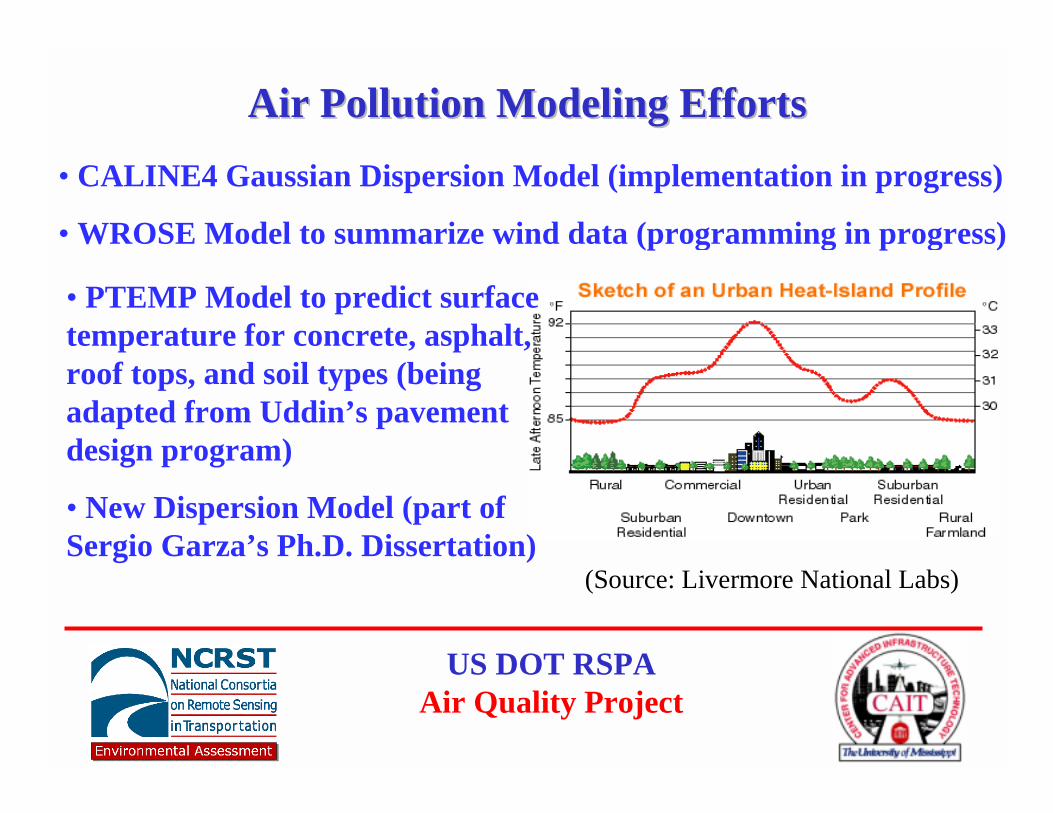
Air Pollution Modeling EffortsAir Pollution Modeling Efforts• CALINE4 Gaussian Dispersion Model (implementation in progress)
• WROSE Model to summarize wind data (programming in progress)
• PTEMP Model to predict surface temperature for concrete, asphalt, roof tops, and soil types (being adapted from Uddin’s pavement design program)
• New Dispersion Model (part of Sergio Garza’s Ph.D. Dissertation)
(Source: Livermore National Labs)
US DOT RSPAAir Quality Project
Concluding RemarksConcluding Remarks• Year 1 real-time DIAL measurements completed successfully
on MS Highway 6, Oxford, Lafayette County, MS (May 2001)• Daytime NO2 concentration on May 25 significantly higher
than nighttime NO2 concentration on May 24• High NO2 concentration associated with higher traffic volume• Abnormally high NO2 observed on May 19 nighttime (after
heavy rain, possibly because of the presence of time-release fertilizer on the site)
• The available pathlength limited the sensitivity of NO2 and O3measurements; longer pathlength planned for Year 2 measurements