Yamato Group Overview of Consolidated Results
17
Copyright© YAMATO HOLDINGS CO., LTD. All rights reserved. Yamato Group Overview of Consolidated Results <1 st Quarter of Fiscal Year Ending March 2022> August 13, 2021
Transcript of Yamato Group Overview of Consolidated Results
Copyright© YAMATO HOLDINGS CO., LTD. All rights reserved.
Yamato Group Overview of Consolidated Results
<1st Quarter of Fiscal Year Ending March 2022>
August 13, 2021
1Copyright© YAMATO HOLDINGS CO., LTD. All rights reserved.
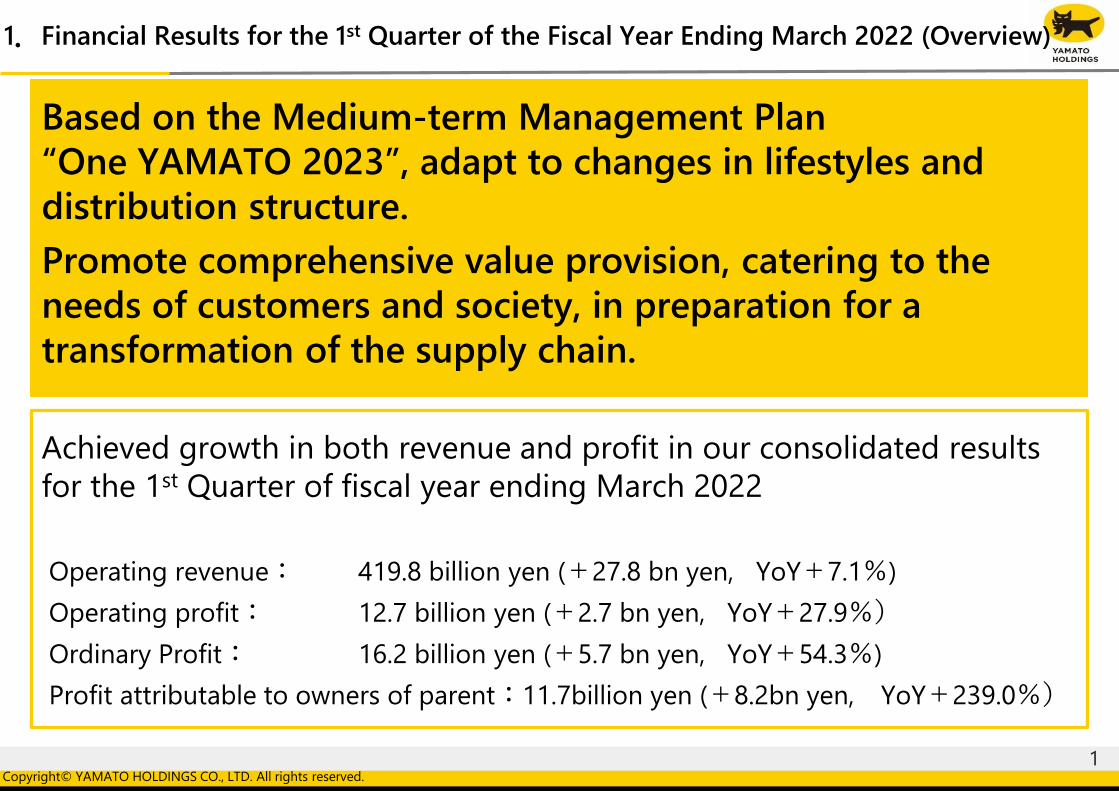
Achieved growth in both revenue and profit in our consolidated results
for the 1st Quarter of fiscal year ending March 2022
Operating revenue: 419.8 billion yen (+27.8 bn yen, YoY+7.1%)
Operating profit: 12.7 billion yen (+2.7 bn yen, YoY+27.9%)
Ordinary Profit: 16.2 billion yen (+5.7 bn yen, YoY+54.3%)
Profit attributable to owners of parent:11.7billion yen (+8.2bn yen, YoY+239.0%)
Based on the Medium-term Management Plan
“One YAMATO 2023”, adapt to changes in lifestyles and
distribution structure.
Promote comprehensive value provision, catering to the
needs of customers and society, in preparation for a
transformation of the supply chain.
1.Financial Results for the 1st Quarter of the Fiscal Year Ending March 2022 (Overview)
2Copyright© YAMATO HOLDINGS CO., LTD. All rights reserved.
2.Strengthen Corporate Logistics Business
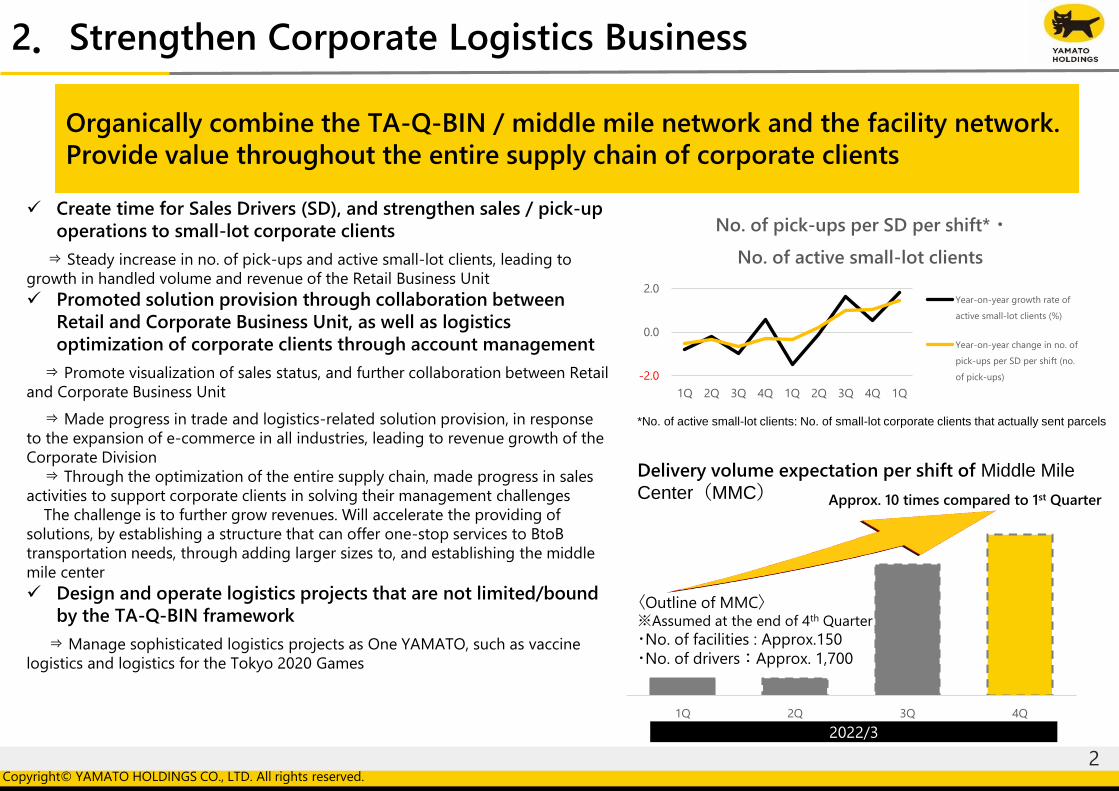
Create time for Sales Drivers (SD), and strengthen sales / pick-up
operations to small-lot corporate clients
⇒ Steady increase in no. of pick-ups and active small-lot clients, leading to
growth in handled volume and revenue of the Retail Business Unit
Promoted solution provision through collaboration between
Retail and Corporate Business Unit, as well as logistics
optimization of corporate clients through account management
⇒ Promote visualization of sales status, and further collaboration between Retail
and Corporate Business Unit
⇒ Made progress in trade and logistics-related solution provision, in response
to the expansion of e-commerce in all industries, leading to revenue growth of the
Corporate Division
⇒ Through the optimization of the entire supply chain, made progress in sales
activities to support corporate clients in solving their management challenges
The challenge is to further grow revenues. Will accelerate the providing of
solutions, by establishing a structure that can offer one-stop services to BtoB
transportation needs, through adding larger sizes to, and establishing the middle
mile center
Design and operate logistics projects that are not limited/bound
by the TA-Q-BIN framework
⇒ Manage sophisticated logistics projects as One YAMATO, such as vaccine
logistics and logistics for the Tokyo 2020 Games
Organically combine the TA-Q-BIN / middle mile network and the facility network.
Provide value throughout the entire supply chain of corporate clients
-2.0
0.0
2.0
1Q 2Q 3Q 4Q 1Q 2Q 3Q 4Q 1Q
No. of pick-ups per SD per shift* ・
No. of active small-lot clients
Year-on-year growth rate of
active small-lot clients (%)
Year-on-year change in no. of
pick-ups per SD per shift (no.
of pick-ups)
*No. of active small-lot clients: No. of small-lot corporate clients that actually sent parcels
1Q 2Q 3Q 4Q
Delivery volume expectation per shift of Middle Mile
Center(MMC)
〈Outline of MMC〉※Assumed at the end of 4th Quarter
・No. of facilities : Approx.150
・No. of drivers:Approx. 1,700
Approx. 10 times compared to 1st Quarter
2022/3
3Copyright© YAMATO HOLDINGS CO., LTD. All rights reserved.
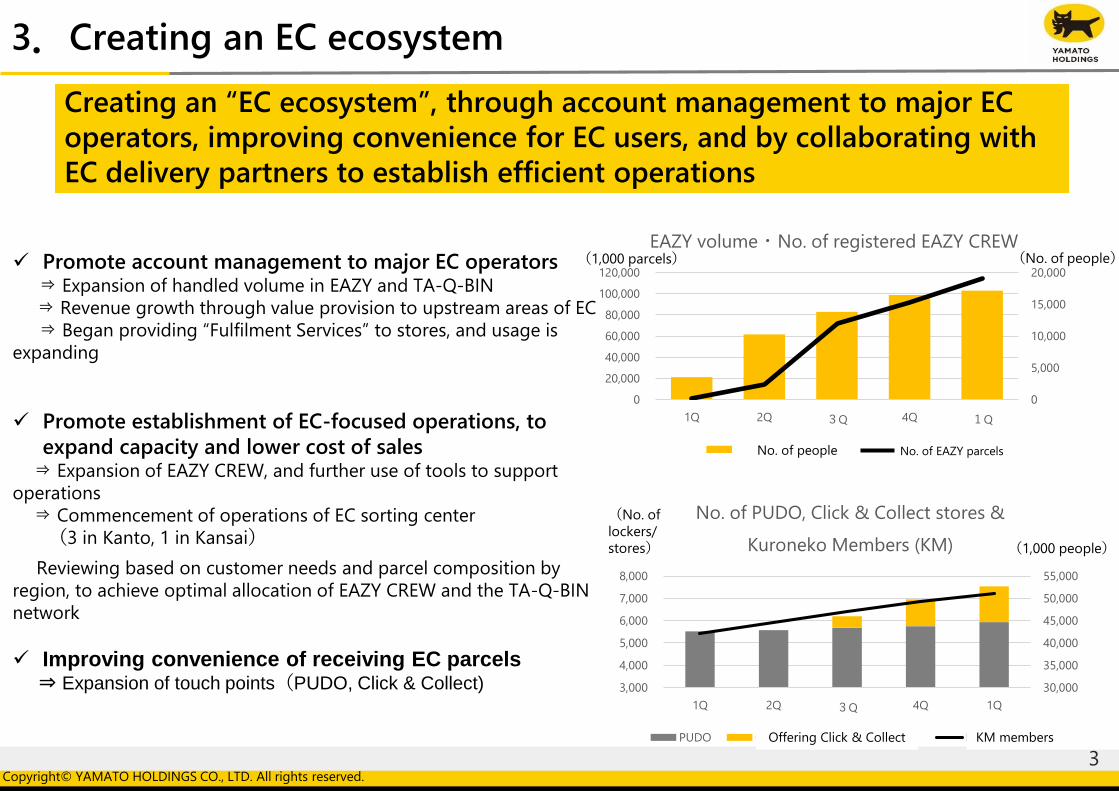
Creating an “EC ecosystem”, through account management to major EC
operators, improving convenience for EC users, and by collaborating with
EC delivery partners to establish efficient operations
3.Creating an EC ecosystem
Promote account management to major EC operators⇒ Expansion of handled volume in EAZY and TA-Q-BIN
⇒ Revenue growth through value provision to upstream areas of EC
⇒ Began providing “Fulfilment Services” to stores, and usage is
expanding
Promote establishment of EC-focused operations, to
expand capacity and lower cost of sales⇒ Expansion of EAZY CREW, and further use of tools to support
operations
⇒ Commencement of operations of EC sorting center
(3 in Kanto, 1 in Kansai)
Reviewing based on customer needs and parcel composition by
region, to achieve optimal allocation of EAZY CREW and the TA-Q-BIN
network
Improving convenience of receiving EC parcels⇒ Expansion of touch points(PUDO, Click & Collect)
0
5,000
10,000
15,000
20,000
0
20,000
40,000
60,000
80,000
100,000
120,000
1Q 2Q 3Q 4Q 1Q
EAZY volume ・ No. of registered EAZY CREW
人数(人) EAZY個数(千個)
30,000
35,000
40,000
45,000
50,000
55,000
3,000
4,000
5,000
6,000
7,000
8,000
1Q 2Q 3Q 4Q 1Q
No. of PUDO, Click & Collect stores &
Kuroneko Members (KM)
PUDO Click&Collect導入店舗数(店) KM会員(千人)
(1,000 parcels)
(1,000 people)
(No. of
lockers/
stores)
(No. of people)
No. of people No. of EAZY parcels
Offering Click & Collect KM members
4Copyright© YAMATO HOLDINGS CO., LTD. All rights reserved.
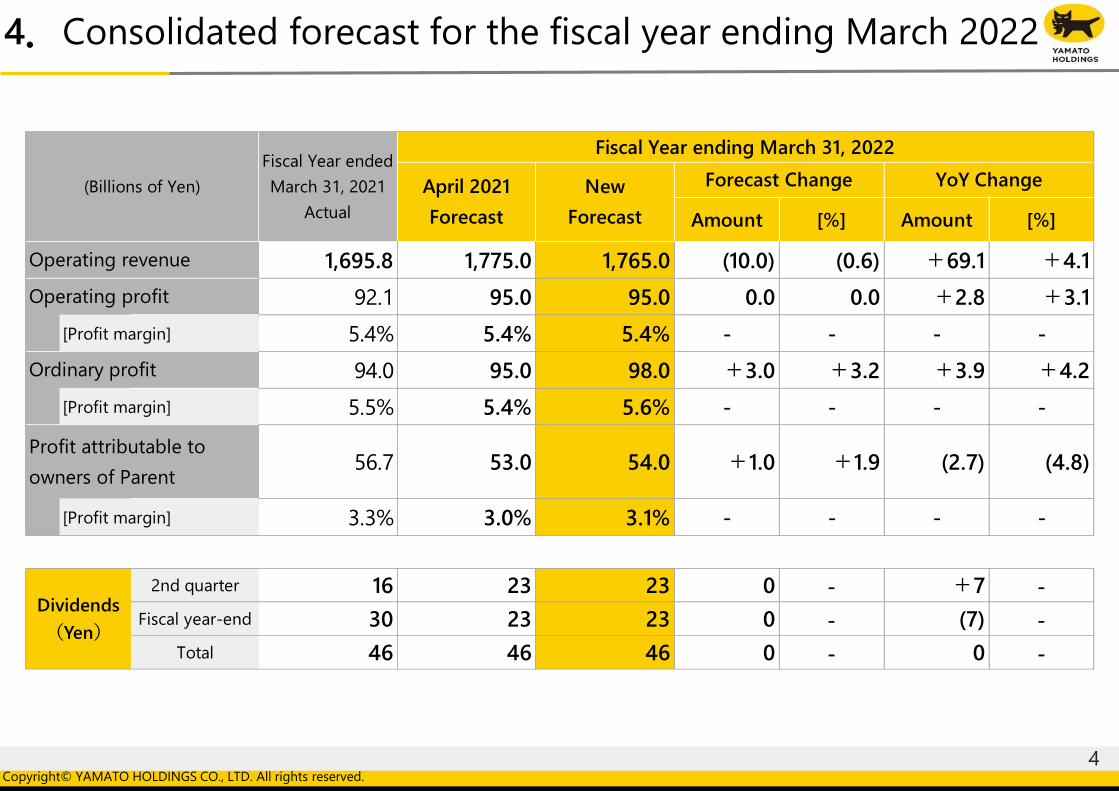
4.Consolidated forecast for the fiscal year ending March 2022
Amount [%] Amount [%]
1,695.8 1,775.0 1,765.0 (10.0) (0.6) +69.1 +4.1
92.1 95.0 95.0 0.0 0.0 +2.8 +3.1
[Profit margin] 5.4% 5.4% 5.4% - - - -
94.0 95.0 98.0 +3.0 +3.2 +3.9 +4.2
[Profit margin] 5.5% 5.4% 5.6% - - - -
56.7 53.0 54.0 +1.0 +1.9 (2.7) (4.8)
[Profit margin] 3.3% 3.0% 3.1% - - - -
2nd quarter 16 23 23 0 - +7 -
Fiscal year-end 30 23 23 0 - (7) -
Total 46 46 46 0 - 0 -
(Billions of Yen)
Fiscal Year ended
March 31, 2021
Actual
Fiscal Year ending March 31, 2022
April 2021
Forecast
New
Forecast
Forecast Change YoY Change
Operating revenue
Operating profit
Ordinary profit
Profit attributable to
owners of Parent
Dividends
(Yen)
5Copyright© YAMATO HOLDINGS CO., LTD. All rights reserved.
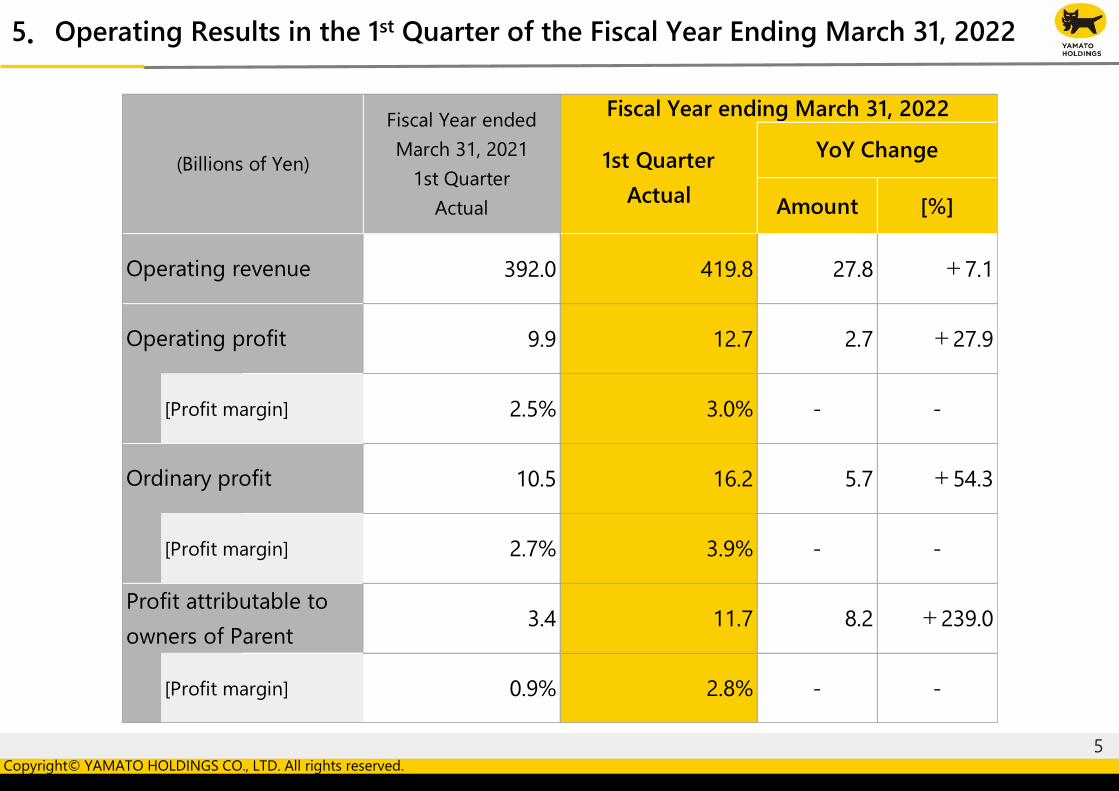
5.Operating Results in the 1st Quarter of the Fiscal Year Ending March 31, 2022
Amount [%]
392.0 419.8 27.8 +7.1
9.9 12.7 2.7 +27.9
[Profit margin] 2.5% 3.0% - -
10.5 16.2 5.7 +54.3
[Profit margin] 2.7% 3.9% - -
3.4 11.7 8.2 +239.0
[Profit margin] 0.9% 2.8% - -
Ordinary profit
Profit attributable to
owners of Parent
(Billions of Yen)
Fiscal Year ended
March 31, 2021
1st Quarter
Actual
Fiscal Year ending March 31, 2022
1st Quarter
Actual
YoY Change
Operating revenue
Operating profit
6Copyright© YAMATO HOLDINGS CO., LTD. All rights reserved.
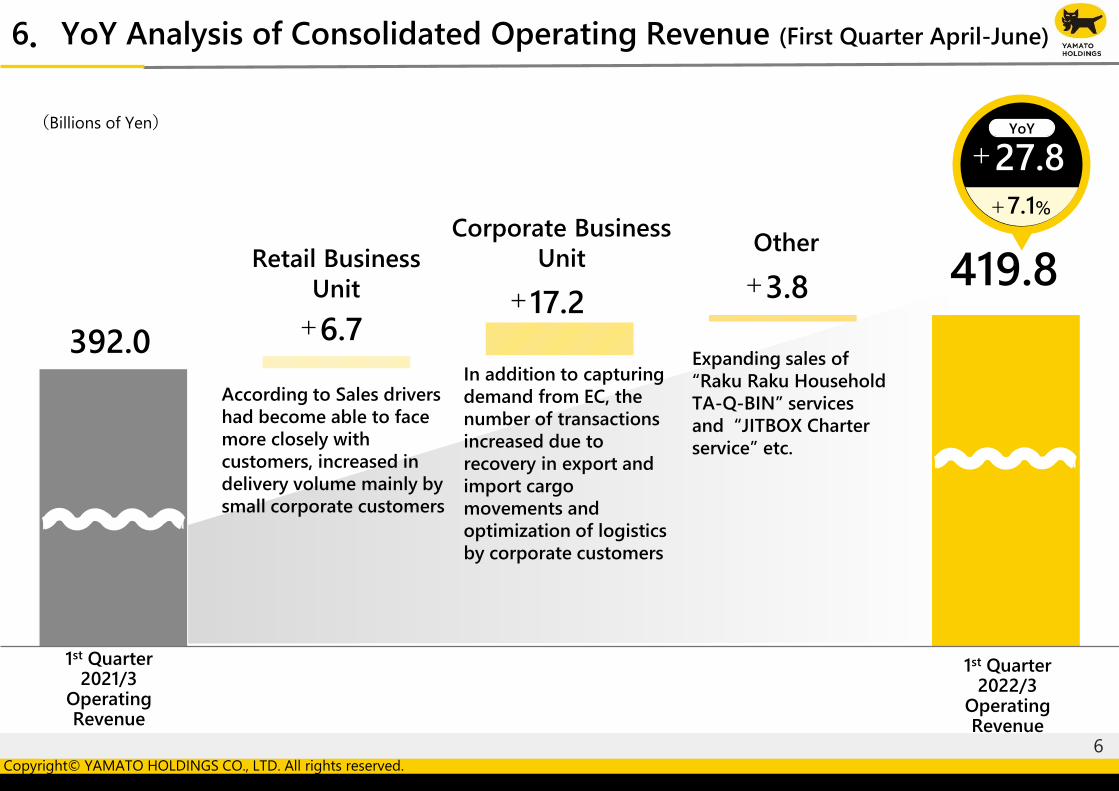
6.YoY Analysis of Consolidated Operating Revenue (First Quarter April-June)
419.8
According to Sales drivers
had become able to face
more closely with
customers, increased in
delivery volume mainly by
small corporate customers
In addition to capturing
demand from EC, the
number of transactions
increased due to
recovery in export and
import cargo
movements and
optimization of logistics
by corporate customers
Retail Business
Unit
Corporate Business
Unit
1st Quarter2021/3
OperatingRevenue
392.0
YoY
+27.8
+7.1%
+17.2+6.7
Other
+3.8
(Billions of Yen)
1st Quarter2022/3
OperatingRevenue
Expanding sales of
“Raku Raku Household
TA-Q-BIN” services
and “JITBOX Charter
service” etc.
7Copyright© YAMATO HOLDINGS CO., LTD. All rights reserved.
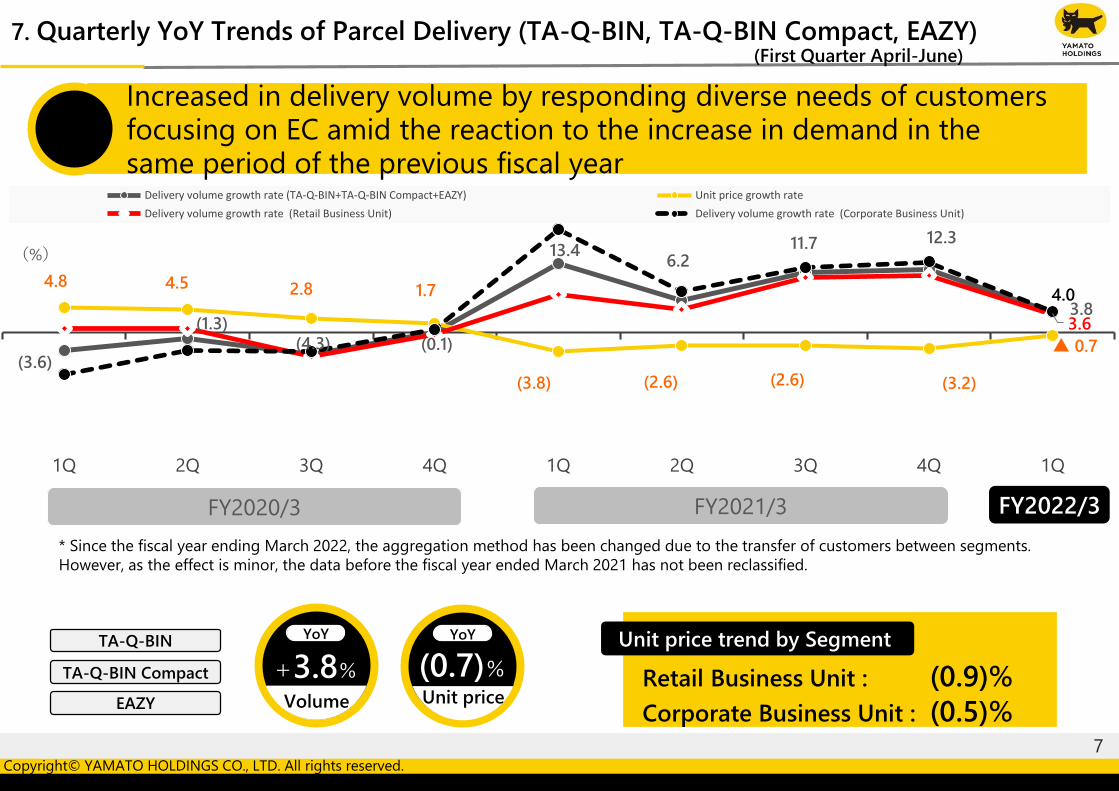
(3.6)
(1.3)(4.3) (0.1)
13.4 6.2
11.7 12.3
3.8
4.8 4.5 2.8 1.7
(3.8) (2.6) (2.6) (3.2)
▲ 0.7
3.6
4.0
1Q 2Q 3Q 4Q 1Q 2Q 3Q 4Q 1Q
Delivery volume growth rate (TA-Q-BIN+TA-Q-BIN Compact+EAZY) Unit price growth rate
Delivery volume growth rate (Retail Business Unit) Delivery volume growth rate (Corporate Business Unit)
7. Quarterly YoY Trends of Parcel Delivery (TA-Q-BIN, TA-Q-BIN Compact, EAZY) (First Quarter April-June)
Increased in delivery volume by responding diverse needs of customers focusing on EC amid the reaction to the increase in demand in the same period of the previous fiscal year
(%)
FY2020/3 FY2022/3
Unit price trend by Segment
Retail Business Unit : (0.9)%
Corporate Business Unit : (0.5)%
YoY
+3.8%
Volume
YoY
(0.7)%
Unit price
FY2021/3
* Since the fiscal year ending March 2022, the aggregation method has been changed due to the transfer of customers between segments.
However, as the effect is minor, the data before the fiscal year ended March 2021 has not been reclassified.
TA-Q-BIN
TA-Q-BIN Compact
EAZY
8Copyright© YAMATO HOLDINGS CO., LTD. All rights reserved.
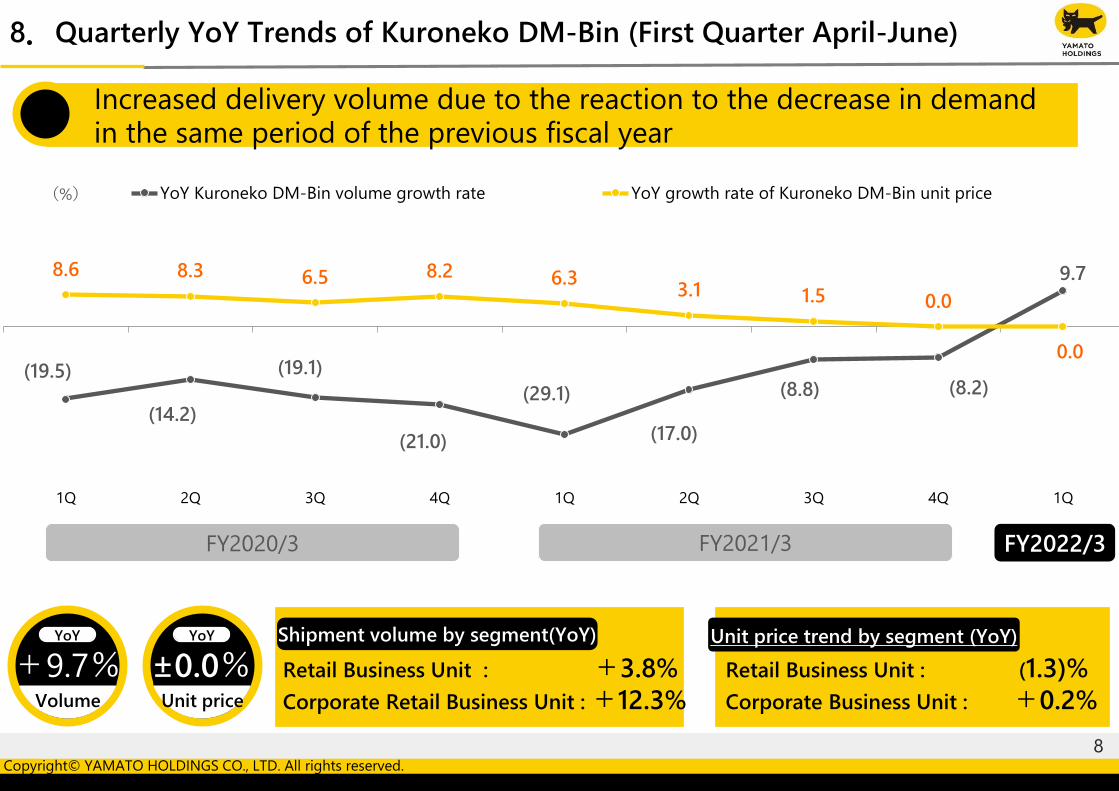
8.Quarterly YoY Trends of Kuroneko DM-Bin (First Quarter April-June)
(%)
Retail Business Unit : +3.8%
Corporate Retail Business Unit : +12.3%
Unit price trend by segment (YoY)
Retail Business Unit : (1.3)%
Corporate Business Unit : +0.2%
YoY
+9.7%Volume
YoY
±0.0%Unit price
Increased delivery volume due to the reaction to the decrease in demand in the same period of the previous fiscal year
FY2020/3 FY2022/3FY2021/3
(19.5)
(14.2)
(19.1)
(21.0)
(29.1)
(17.0)
(8.8) (8.2)
9.78.6 8.3 6.5 8.2 6.3 3.1 1.5 0.0
0.0
1Q 2Q 3Q 4Q 1Q 2Q 3Q 4Q 1Q
YoY Kuroneko DM-Bin volume growth rate YoY growth rate of Kuroneko DM-Bin unit price
Shipment volume by segment(YoY)
9Copyright© YAMATO HOLDINGS CO., LTD. All rights reserved.
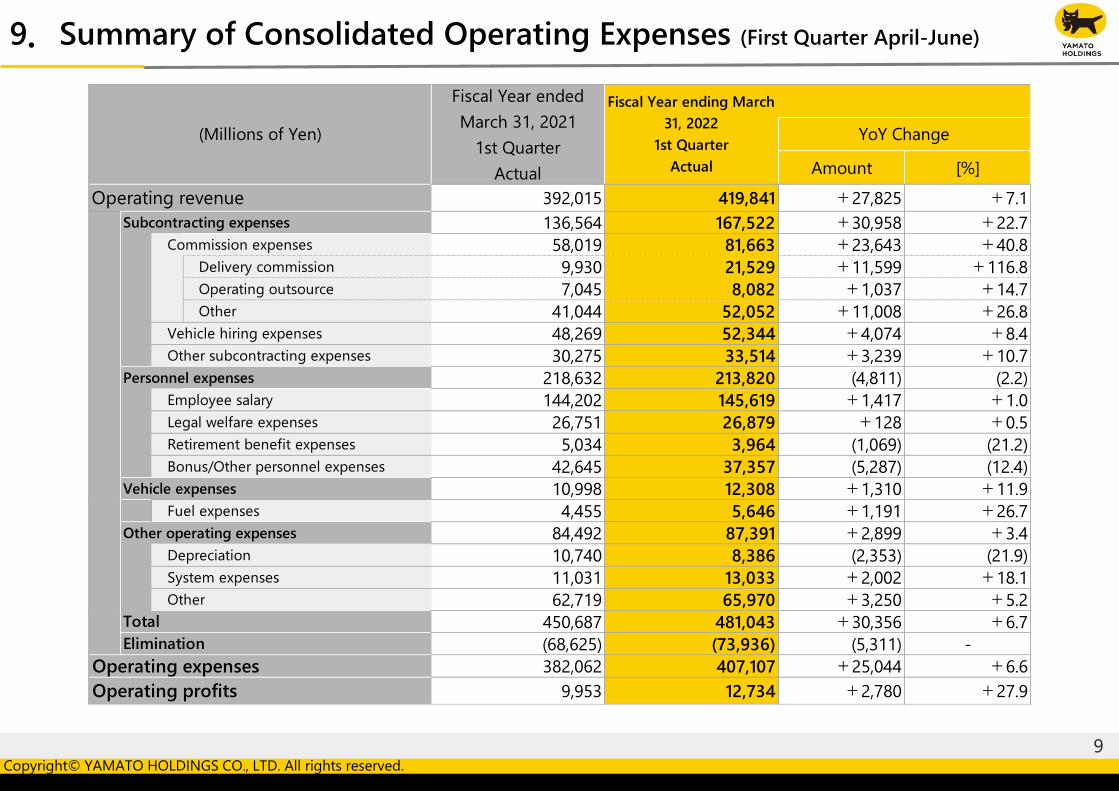
9.Summary of Consolidated Operating Expenses (First Quarter April-June)
Amount [%]
392,015 419,841 +27,825 +7.1
136,564 167,522 +30,958 +22.7
Commission expenses 58,019 81,663 +23,643 +40.8
Delivery commissionDelivery commission 9,930 21,529 +11,599 +116.8
Operating outsourceOperating outsource 7,045 8,082 +1,037 +14.7
OtherOther 41,044 52,052 +11,008 +26.8
Vehicle hiring expenses 48,269 52,344 +4,074 +8.4
Other subcontracting expenses 30,275 33,514 +3,239 +10.7
218,632 213,820 (4,811) (2.2)
Employee salary 144,202 145,619 +1,417 +1.0
Legal welfare expenses 26,751 26,879 +128 +0.5
Retirement benefit expenses 5,034 3,964 (1,069) (21.2)
Bonus/Other personnel expenses 42,645 37,357 (5,287) (12.4)
10,998 12,308 +1,310 +11.9
Fuel expenses 4,455 5,646 +1,191 +26.7
84,492 87,391 +2,899 +3.4
Depreciation 10,740 8,386 (2,353) (21.9)
System expenses 11,031 13,033 +2,002 +18.1
Other 62,719 65,970 +3,250 +5.2
450,687 481,043 +30,356 +6.7
(68,625) (73,936) (5,311) -
382,062 407,107 +25,044 +6.6
9,953 12,734 +2,780 +27.9
Operating expenses
Operating profits
Subcontracting expenses
Personnel expenses
Vehicle expenses
Other operating expenses
Total
Elimination
YoY Change
Operating revenue
(Millions of Yen)
Fiscal Year ended
March 31, 2021
1st Quarter
Actual
Fiscal Year ending March
31, 2022
1st Quarter
Actual
10Copyright© YAMATO HOLDINGS CO., LTD. All rights reserved.
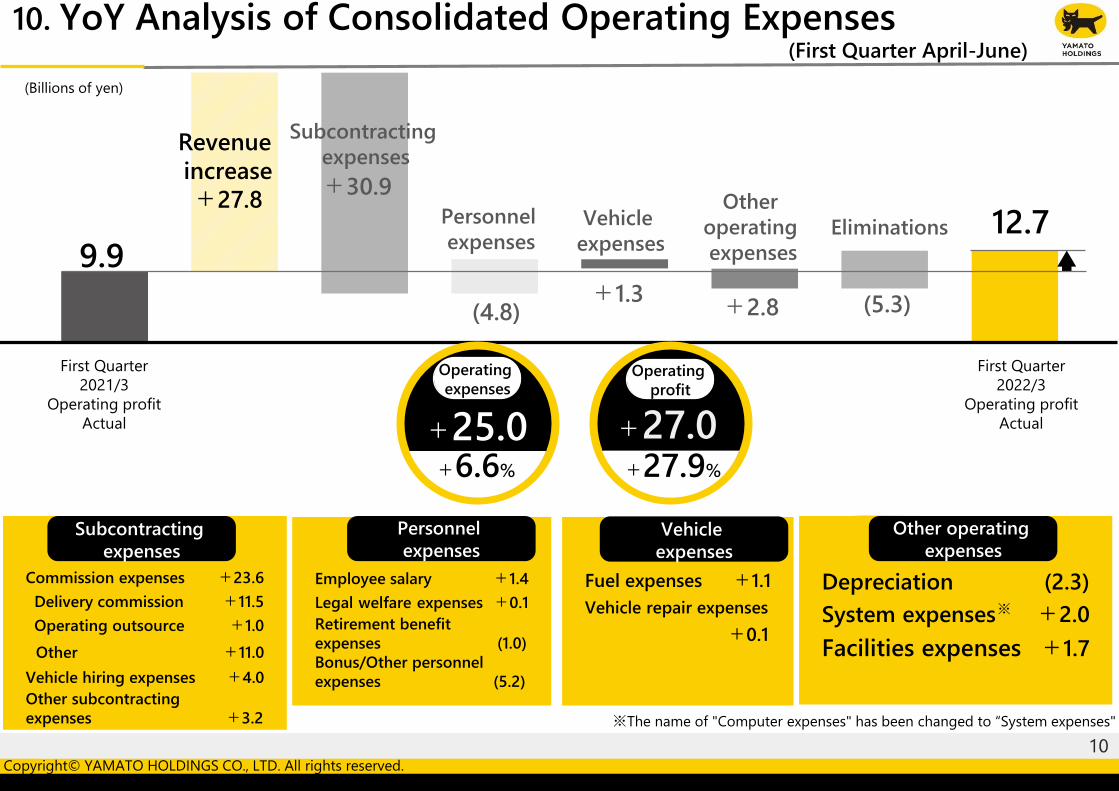
+1.3
Revenue
increase
+27.8
+2.8
9.912.7
Depreciation (2.3)
System expenses +2.0
Facilities expenses +1.7
Commission expenses +23.6
Delivery commission +11.5
Operating outsource +1.0
Other +11.0
Vehicle hiring expenses +4.0
Other subcontracting
expenses +3.2
Employee salary +1.4
Legal welfare expenses +0.1
Retirement benefit
expenses (1.0)
Bonus/Other personnel
expenses (5.2)
Fuel expenses +1.1
Vehicle repair expenses
+0.1
+30.9
10. YoY Analysis of Consolidated Operating Expenses (First Quarter April-June)
(4.8) (5.3)
※
Subcontracting
expenses
Personnel
expensesVehicle
expenses
Other
operating
expenses
Eliminations
First Quarter
2021/3
Operating profit
Actual
First Quarter
2022/3
Operating profit
Actual
Personnel
expensesSubcontracting
expenses
Vehicle
expenses
Other operating
expenses
(Billions of yen)
Operating
expenses
+6.6%
Operating
profit
+27.0+25.0+27.9%
※The name of "Computer expenses" has been changed to “System expenses"
11Copyright© YAMATO HOLDINGS CO., LTD. All rights reserved.
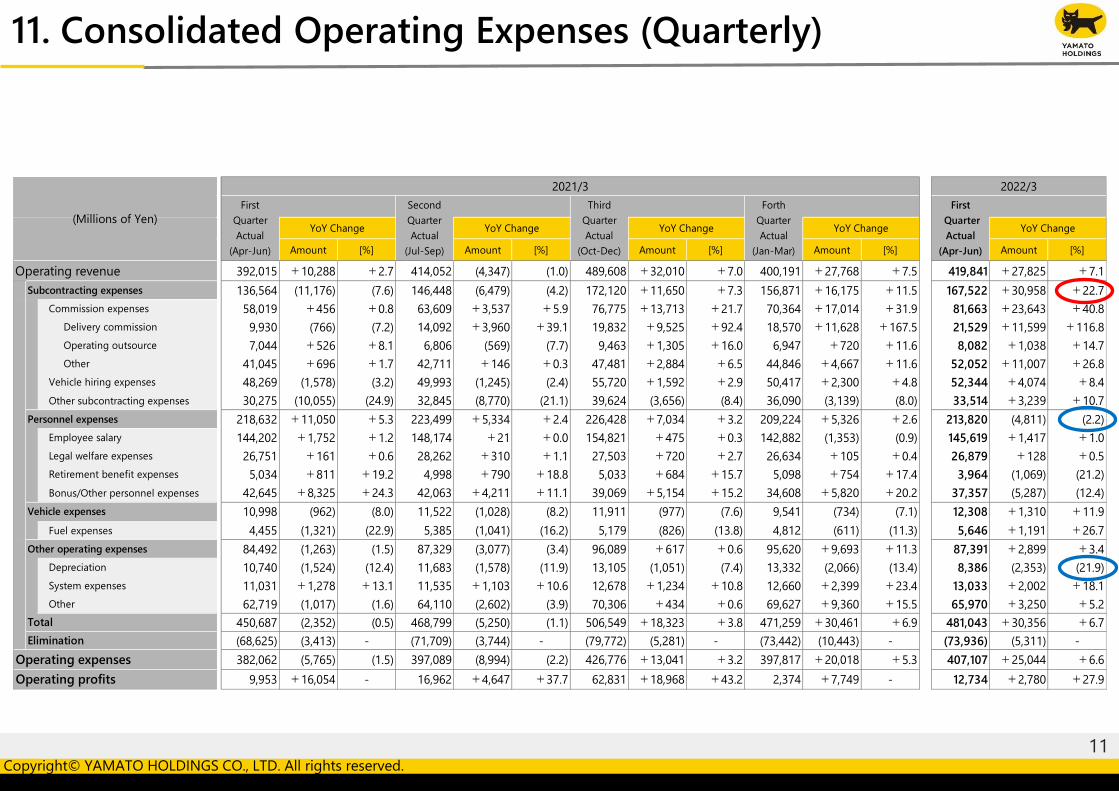
Amount [%] Amount [%] Amount [%] Amount [%] Amount [%]
392,015 +10,288 +2.7 414,052 (4,347) (1.0) 489,608 +32,010 +7.0 400,191 +27,768 +7.5 419,841 +27,825 +7.1
136,564 (11,176) (7.6) 146,448 (6,479) (4.2) 172,120 +11,650 +7.3 156,871 +16,175 +11.5 167,522 +30,958 +22.7
Commission expenses 58,019 +456 +0.8 63,609 +3,537 +5.9 76,775 +13,713 +21.7 70,364 +17,014 +31.9 81,663 +23,643 +40.8
Delivery commission 9,930 (766) (7.2) 14,092 +3,960 +39.1 19,832 +9,525 +92.4 18,570 +11,628 +167.5 21,529 +11,599 +116.8
Operating outsource 7,044 +526 +8.1 6,806 (569) (7.7) 9,463 +1,305 +16.0 6,947 +720 +11.6 8,082 +1,038 +14.7
Other 41,045 +696 +1.7 42,711 +146 +0.3 47,481 +2,884 +6.5 44,846 +4,667 +11.6 52,052 +11,007 +26.8
Vehicle hiring expenses 48,269 (1,578) (3.2) 49,993 (1,245) (2.4) 55,720 +1,592 +2.9 50,417 +2,300 +4.8 52,344 +4,074 +8.4
Other subcontracting expenses 30,275 (10,055) (24.9) 32,845 (8,770) (21.1) 39,624 (3,656) (8.4) 36,090 (3,139) (8.0) 33,514 +3,239 +10.7
218,632 +11,050 +5.3 223,499 +5,334 +2.4 226,428 +7,034 +3.2 209,224 +5,326 +2.6 213,820 (4,811) (2.2)
Employee salary 144,202 +1,752 +1.2 148,174 +21 +0.0 154,821 +475 +0.3 142,882 (1,353) (0.9) 145,619 +1,417 +1.0
Legal welfare expenses 26,751 +161 +0.6 28,262 +310 +1.1 27,503 +720 +2.7 26,634 +105 +0.4 26,879 +128 +0.5
Retirement benefit expenses 5,034 +811 +19.2 4,998 +790 +18.8 5,033 +684 +15.7 5,098 +754 +17.4 3,964 (1,069) (21.2)
Bonus/Other personnel expenses 42,645 +8,325 +24.3 42,063 +4,211 +11.1 39,069 +5,154 +15.2 34,608 +5,820 +20.2 37,357 (5,287) (12.4)
10,998 (962) (8.0) 11,522 (1,028) (8.2) 11,911 (977) (7.6) 9,541 (734) (7.1) 12,308 +1,310 +11.9
Fuel expenses 4,455 (1,321) (22.9) 5,385 (1,041) (16.2) 5,179 (826) (13.8) 4,812 (611) (11.3) 5,646 +1,191 +26.7
84,492 (1,263) (1.5) 87,329 (3,077) (3.4) 96,089 +617 +0.6 95,620 +9,693 +11.3 87,391 +2,899 +3.4
Depreciation 10,740 (1,524) (12.4) 11,683 (1,578) (11.9) 13,105 (1,051) (7.4) 13,332 (2,066) (13.4) 8,386 (2,353) (21.9)
System expenses 11,031 +1,278 +13.1 11,535 +1,103 +10.6 12,678 +1,234 +10.8 12,660 +2,399 +23.4 13,033 +2,002 +18.1
Other 62,719 (1,017) (1.6) 64,110 (2,602) (3.9) 70,306 +434 +0.6 69,627 +9,360 +15.5 65,970 +3,250 +5.2
450,687 (2,352) (0.5) 468,799 (5,250) (1.1) 506,549 +18,323 +3.8 471,259 +30,461 +6.9 481,043 +30,356 +6.7
(68,625) (3,413) - (71,709) (3,744) - (79,772) (5,281) - (73,442) (10,443) - (73,936) (5,311) -
382,062 (5,765) (1.5) 397,089 (8,994) (2.2) 426,776 +13,041 +3.2 397,817 +20,018 +5.3 407,107 +25,044 +6.6
9,953 +16,054 - 16,962 +4,647 +37.7 62,831 +18,968 +43.2 2,374 +7,749 - 12,734 +2,780 +27.9Operating profits
(Millions of Yen)
Operating revenue
Subcontracting expenses
Personnel expenses
Vehicle expenses
Total
Elimination
Other operating expenses
YoY Change
2022/3
YoY Change
Operating expenses
Forth
Quarter
Actual
(Jan-Mar)
YoY Change YoY Change YoY Change
First
Quarter
Actual
(Apr-Jun)
First
Quarter
Actual
(Apr-Jun)
2021/3
Second
Quarter
Actual
(Jul-Sep)
Third
Quarter
Actual
(Oct-Dec)
11. Consolidated Operating Expenses (Quarterly)
12Copyright© YAMATO HOLDINGS CO., LTD. All rights reserved.
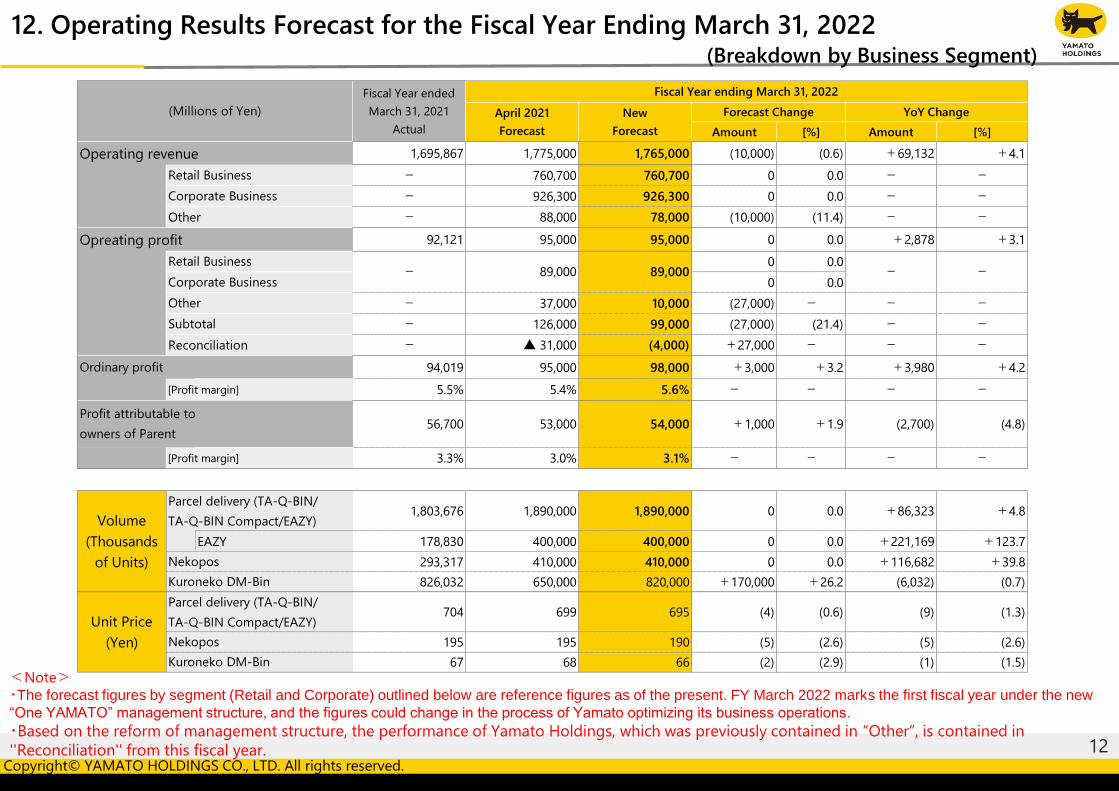
<Note>
・The forecast figures by segment (Retail and Corporate) outlined below are reference figures as of the present. FY March 2022 marks the first fiscal year under the new
“One YAMATO” management structure, and the figures could change in the process of Yamato optimizing its business operations.
・Based on the reform of management structure, the performance of Yamato Holdings, which was previously contained in “Other”, is contained in
''Reconciliation'' from this fiscal year.
12. Operating Results Forecast for the Fiscal Year Ending March 31, 2022(Breakdown by Business Segment)
Amount [%] Amount [%]
Operating revenue 1,695,867 1,775,000 1,765,000 (10,000) (0.6) +69,132 +4.1
- 760,700 760,700 0 0.0 - -
- 926,300 926,300 0 0.0 - -
- 88,000 78,000 (10,000) (11.4) - -
Opreating profit 92,121 95,000 95,000 0 0.0 +2,878 +3.1
0 0.0
0 0.0
- 37,000 10,000 (27,000) - - -
- 126,000 99,000 (27,000) (21.4) - -
- ▲ 31,000 (4,000) +27,000 - - -
94,019 95,000 98,000 +3,000 +3.2 +3,980 +4.2
[Profit margin] 5.5% 5.4% 5.6% - - - -
56,700 53,000 54,000 +1,000 +1.9 (2,700) (4.8)
[Profit margin] 3.3% 3.0% 3.1% - - - -
1,803,676 1,890,000 1,890,000 0 0.0 +86,323 +4.8
EAZY 178,830 400,000 400,000 0 0.0 +221,169 +123.7
293,317 410,000 410,000 0 0.0 +116,682 +39.8
826,032 650,000 820,000 +170,000 +26.2 (6,032) (0.7)
704 699 695 (4) (0.6) (9) (1.3)
195 195 190 (5) (2.6) (5) (2.6)
67 68 66 (2) (2.9) (1) (1.5)
(Millions of Yen)
Fiscal Year ended
March 31, 2021
Actual
Forecast Change YoY Change
Fiscal Year ending March 31, 2022
April 2021
Forecast
New
Forecast
Ordinary profit
Retail Business
Corporate Business
Other
Retail Business- 89,000 - -
Corporate Business
Other
Subtotal
Reconciliation
89,000
Profit attributable to
owners of Parent
Volume
(Thousands
of Units)
Parcel delivery (TA-Q-BIN/
TA-Q-BIN Compact/EAZY)
Nekopos
Kuroneko DM-Bin
Unit Price
(Yen)
Parcel delivery (TA-Q-BIN/
TA-Q-BIN Compact/EAZY)
Nekopos
Kuroneko DM-Bin
13Copyright© YAMATO HOLDINGS CO., LTD. All rights reserved.
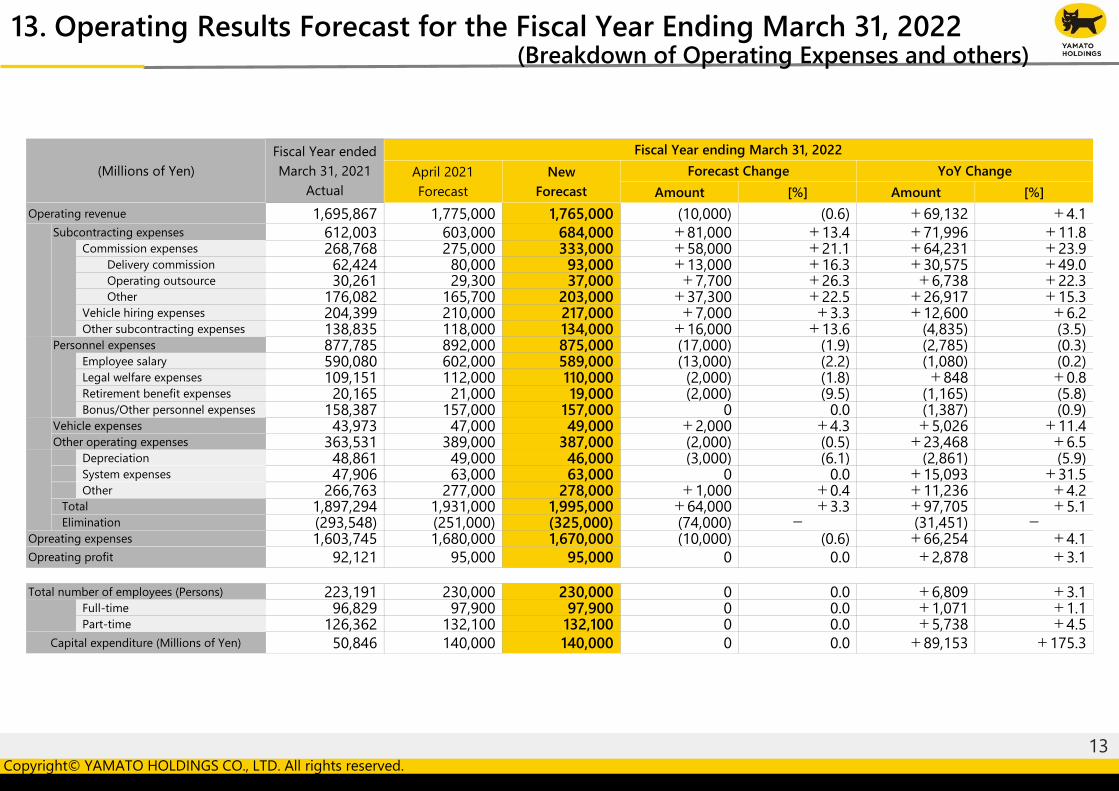
13. Operating Results Forecast for the Fiscal Year Ending March 31, 2022(Breakdown of Operating Expenses and others)
Amount [%] Amount [%]
1,695,867 1,775,000 1,765,000 (10,000) (0.6) +69,132 +4.1
612,003 603,000 684,000 +81,000 +13.4 +71,996 +11.8 Commission expenses 268,768 275,000 333,000 +58,000 +21.1 +64,231 +23.9
Delivery commission 62,424 80,000 93,000 +13,000 +16.3 +30,575 +49.0Operating outsource 30,261 29,300 37,000 +7,700 +26.3 +6,738 +22.3Other 176,082 165,700 203,000 +37,300 +22.5 +26,917 +15.3
Vehicle hiring expenses 204,399 210,000 217,000 +7,000 +3.3 +12,600 +6.2 Other subcontracting expenses 138,835 118,000 134,000 +16,000 +13.6 (4,835) (3.5)
877,785 892,000 875,000 (17,000) (1.9) (2,785) (0.3) Employee salary 590,080 602,000 589,000 (13,000) (2.2) (1,080) (0.2)
Legal welfare expenses 109,151 112,000 110,000 (2,000) (1.8) +848 +0.8Retirement benefit expenses 20,165 21,000 19,000 (2,000) (9.5) (1,165) (5.8)
Bonus/Other personnel expenses 158,387 157,000 157,000 0 0.0 (1,387) (0.9)43,973 47,000 49,000 +2,000 +4.3 +5,026 +11.4
363,531 389,000 387,000 (2,000) (0.5) +23,468 +6.5 Depreciation 48,861 49,000 46,000 (3,000) (6.1) (2,861) (5.9)
System expenses 47,906 63,000 63,000 0 0.0 +15,093 +31.5Other 266,763 277,000 278,000 +1,000 +0.4 +11,236 +4.2
1,897,294 1,931,000 1,995,000 +64,000 +3.3 +97,705 +5.1(293,548) (251,000) (325,000) (74,000) - (31,451) -1,603,745 1,680,000 1,670,000 (10,000) (0.6) +66,254 +4.1
92,121 95,000 95,000 0 0.0 +2,878 +3.1
223,191 230,000 230,000 0 0.0 +6,809 +3.1Full-time 96,829 97,900 97,900 0 0.0 +1,071 +1.1Part-time 126,362 132,100 132,100 0 0.0 +5,738 +4.5
50,846 140,000 140,000 0 0.0 +89,153 +175.3
Forecast Change YoY Change
Fiscal Year ending March 31, 2022
April 2021
Forecast
New
Forecast
(Millions of Yen)
Fiscal Year ended
March 31, 2021
Actual
Operating revenue
Subcontracting expenses
Personnel expenses
Vehicle expenses
Other operating expenses
Total
Elimination
Opreating expenses
Opreating profit
Total number of employees (Persons)
Capital expenditure (Millions of Yen)
Reference material
15Copyright© YAMATO HOLDINGS CO., LTD. All rights reserved.
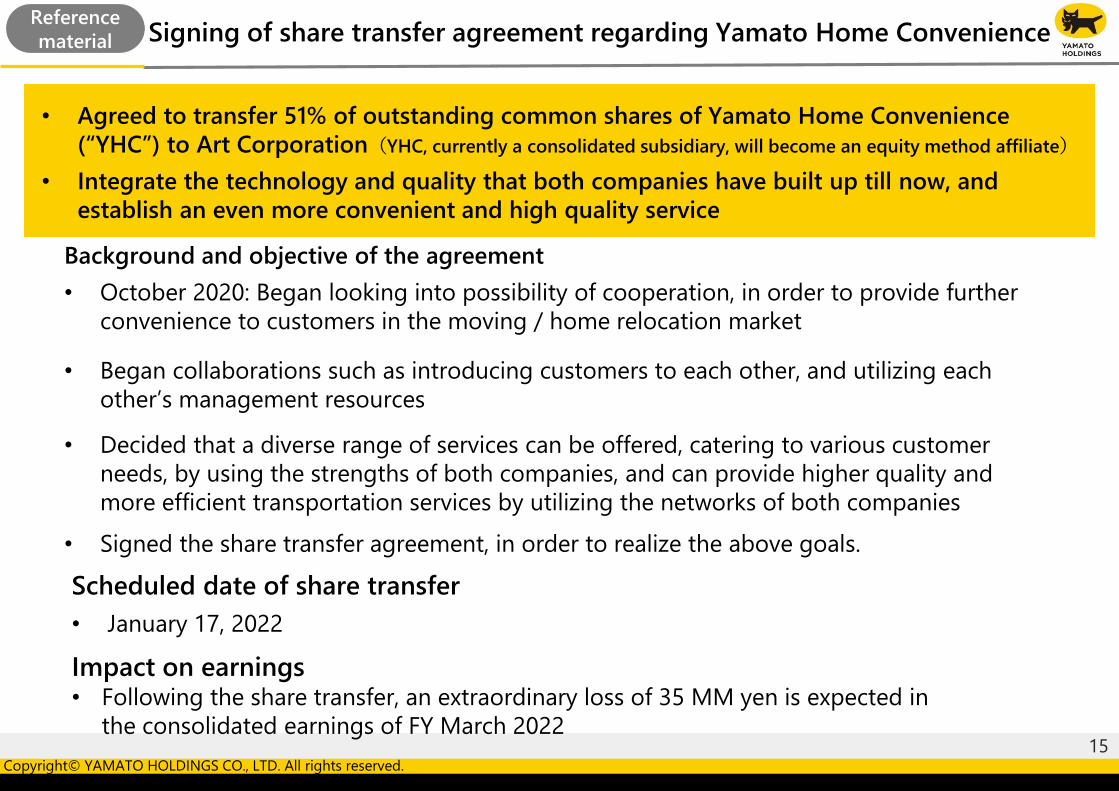
Signing of share transfer agreement regarding Yamato Home ConvenienceReference
material
• Agreed to transfer 51% of outstanding common shares of Yamato Home Convenience
(“YHC”) to Art Corporation(YHC, currently a consolidated subsidiary, will become an equity method affiliate)
• Integrate the technology and quality that both companies have built up till now, and
establish an even more convenient and high quality service
Background and objective of the agreement
• October 2020: Began looking into possibility of cooperation, in order to provide further
convenience to customers in the moving / home relocation market
• Began collaborations such as introducing customers to each other, and utilizing each
other’s management resources
• Decided that a diverse range of services can be offered, catering to various customer
needs, by using the strengths of both companies, and can provide higher quality and
more efficient transportation services by utilizing the networks of both companies
• Signed the share transfer agreement, in order to realize the above goals.
Scheduled date of share transfer
• January 17, 2022
Impact on earnings• Following the share transfer, an extraordinary loss of 35 MM yen is expected in
the consolidated earnings of FY March 2022
この内容は、投資判断の参考となる情報の提供を目的としたもので、投資勧誘を目的としたものではありません。提供情報の内容については
万全を期しておりますが、完全性、正確性を保証するものではありません。いかなる情報も、不的確な記載や誤植等を含む可能性があります。
銘柄の選択、投資の最終決定は、ご自身の判断でなさるようにお願いいたします。当社としては一切の責任を負いかねますのでご承知ください。
免責事項
Copyright© YAMATO HOLDINGS CO., LTD. All rights reserved.
This material is intended for informational purposes only and is not a solicitation or offer to buy or sell securities or related financial
instruments. Ultimately it is the responsibility of investors to select and buy securities and the Company assumes no responsibility
for investors who act on the basis of this material.
Disclaimer