Yamaha Corporation · Yamaha Corporation Analyst and Investor Briefing on the Second Quarter of the...
32
Yamaha Corporation Analyst and Investor Briefing on the Second Quarter of the Fiscal Year Ending March 31, 2014 (FY2014.3) November 1, 2013
-
Upload
phungkhuong -
Category
Documents
-
view
215 -
download
0
Transcript of Yamaha Corporation · Yamaha Corporation Analyst and Investor Briefing on the Second Quarter of the...

Yamaha CorporationAnalyst and Investor Briefing on the Second Quarter of the Fiscal
Year Ending March 31, 2014 (FY2014.3)
November 1, 2013

2
Overview of Performance in the First Half of FY2014.3 (Six Months)
First half sales and income increased year-on-year and exceeded previous projections announced on July 31.
Although sales of musical instruments and audio equipment improved over 1Q results on a local currency basis, actual first half sales were down from the same period of the previous year.
The electronic devices business recorded robust sales.
Exchange rates had a major impact on operating income, and actual income amounted to ¥13.7 billion, up year-on-year and against previous projections.
Results SummaryResults Summary
Note: FY2013.3 figures have been adjusted to reflect segment composition changes effective from FY2014.3

3
(Billions of yen)
123125105EUR
969880US$
127130101EUR979979US$
+25.1%10.0(5.1%)
+273.4%12.5(6.3%)
3.3(1.9%)
Net Income(Net Income Ratio)
+22.5%11.0(5.6%)
+120.6%13.5(6.8%)
6.1(3.5%)
Ordinary Income(Ordinary Income Ratio)
+18.9%11.5 (5.9%)
+100.7%13.7 (6.9%)
6.8(3.9%)
Operating Income(Operating Income Ratio)
+0.6%196.5+11.8%197.7176.8Net Sales
Changes from previous projection
FY2014.3 1H
previous projections
Changes from same period of
the previous year
FY2014.3 1H
results
FY2013.3 1H
results
Exchange Rate (yen)Exchange Rate (yen)
Net SalesNet Sales
Operating Income
Operating Income
Performance in the First Half of FY2014.3Performance in the First Half of FY2014.3
4
7.54.7
9.62.3
2.6
3.0
1.2
0.5
-0.9
0.7
0.3
0.5
115.0 126.5 126.9
41.548.748.5
10.19.57.912.4
12.0 11.9
Net SalesNet Sales Operating IncomeOperating Income
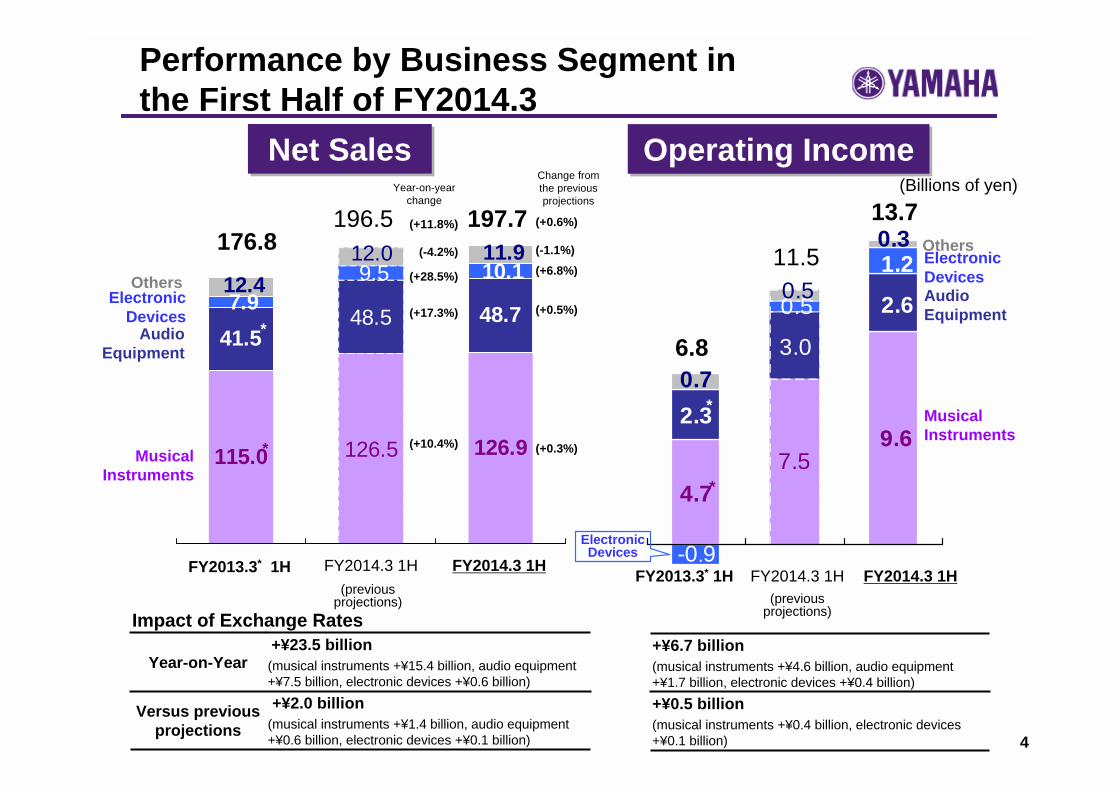
Performance by Business Segment in the First Half of FY2014.3
176.8196.5 197.7
6.8
13.7
11.5
Year-on-year change
(+10.4%)
(+17.3%)
(+28.5%)
(-4.2%)
(+11.8%)
Change from the previous projections
(+0.3%)
(+0.5%)
(+6.8%)(-1.1%)
(+0.6%)
*
*
*
*
Musical Instruments
Electronic Devices
Audio Equipment
Others
Musical Instruments
Electronic DevicesAudio Equipment
Others
(Billions of yen)
(musical instruments +¥1.4 billion, audio equipment +¥0.6 billion, electronic devices +¥0.1 billion)
+¥2.0 billionVersus previous projections
(musical instruments +¥15.4 billion, audio equipment +¥7.5 billion, electronic devices +¥0.6 billion)
+¥23.5 billionYear-on-Year
Impact of Exchange Rates
(musical instruments +¥0.4 billion, electronic devices +¥0.1 billion)
+¥0.5 billion
(musical instruments +¥4.6 billion, audio equipment +¥1.7 billion, electronic devices +¥0.4 billion)
+¥6.7 billion
Electronic Devices
(previous projections)
FY2014.3 1HFY2014.3 1HFY2013.3* 1H(previous
projections)
FY2014.3 1HFY2014.3 1HFY2013.3* 1H

5
6.8
13.7
FY2013.3 1H FY2014.3 1H
FY2014.3 1H (previous projections)
FY2014.3 1H
11.5
Decrease in actual
SG&A
2.0
Decrease in actual
sales and production
-0.313.7
FY2014.3 1H Operating Income AnalysisDecrease in
actual SG&A
1.2Effect of
structural reform
1.1Increase in overseas labor
cost-1.3
Improvement in
manufacturing cost1.2Decrease in
actual sales and production
-2.0
(Billions of yen)
Versus previous projectionsVersus previous projections
Versus same period of the previous yearVersus same period of the previous year
Impact of exchange
rates
6.7
Impact of exchange
rates
0.5

6
74.0 87.686.5
41.039.340.0
9.67.5
4.7
Musical Instruments 1H
115.0 126.5 126.9
Net SalesNet Sales
Operating IncomeOperating Income
(Billions of yen)
(previous projections)
FY2014.3 1HFY2014.3 1HFY2013.3* 1H
(previous projections)
FY2014.3 1HFY2014.3 1HFY2013.3* 1H
Music schools,
etc.
Yamaha musical
instruments
1H Overview
•Sales increased year-on-year and exceeded previous projections
•Discounting the impact of exchange rates (+¥15.4 billion), actual sales were lower than the same period of the previous year
•Actual sales in the Chinese market rebounded to increase year-on-year
•Actual sales of digital pianos, guitars, and drums increased, but those of other products declined

7
26.225.421.5
16.719.5 18.9
3.63.3
3.5
2.3 3.0 2.6
Audio Equipment 1H
41.548.5 48.7
Net SalesNet Sales
Operating IncomeOperating Income
(Billions of yen)
(previous projections)
FY2014.3 1HFY2014.3 1HFY2013.3* 1H
(previous projections)
FY2014.3 1HFY2014.3 1HFY2013.3* 1H
ICT devices
PA equipment
AV products,
karaoke
1H Overview
•Sales were up year-on-year and against previous projections
•Discounting the impact of exchange rates (+¥7.5 billion), actual sales decreased from the same period of the previous year
•Professional audio equipment sales faced headwinds
•Despite the positive impact of exchange rates (+¥1.7 billion), actual operating income declined year on year, due to increased SG&A expenses

8
10.19.57.9
-0.9
1.20.5
Electronic Devices 1H
Net SalesNet Sales
Operating Income (Loss)Operating Income (Loss)
(Billions of yen)
(previous projections)
FY2014.3 1HFY2014.3 1HFY2013.3* 1H
(previous projections)
FY2014.3 1HFY2014.3 1HFY2013.3* 1H
1H Overview
•Sales were higher than the same period of the previous year and surpassed previous projections
•Geomagnetic sensor and codec product sales were robust
•Lower fixed costs achieved through business structural reform carried out in the previous year and increased sales resulted in continuing profitability in the second quarter

9
3.63.64.1
2.4 2.2 2.32.82.92.83.43.33.1
0.50.70.3
Others 1H
11.912.012.4
Net SalesNet Sales
Operating IncomeOperating Income
(Billions of yen)
(previous projections)
FY2014.3 1HFY2014.3 1HFY2013.3* 1H
(previous projections)
FY2014.3 1HFY2014.3 1HFY2013.3* 1H
FA equipment, etc.
ResortGolf products
Automobile interior wood
component
1H Overview
•Sales and income declined year-on-year•Sales of automobile interior wood components and factory automation equipment were lower than the same period of the previous year
•Golf product sales grew in overseas markets, but remained sluggish in Japan, resulting in overall golf sales to decrease from the same period of the previous year

10
The estimated 2H exchange rate for the euro has been revised to EUR=¥130 Full year projections have been revised to ¥408 billion for net sales and ¥22
billion for operating income Expenses related to structural reform of musical instrument retail sales
companies in Japan will incur an extraordinary loss of ¥750 million
Musical instrument sales lacks strength, but on the recovery trend against the same period of the previous year
The North American and European markets are gradually rebounding, and Chinese and other region markets are also forecast to recover
Despite strong sales in the first half, prospects for electronic devices are uncertain in the second half
The Indonesian guitar factory strike will have an impact on results
Outlook for Second Half and Full Year
Outlook for 2HOutlook for 2H
Full Year OutlookFull Year Outlook

11
Forecast for Performance in FY2014.3 Forecast for Performance in FY2014.3 (Full Year)(Full Year)
Full Year
2H new
projections
1H results
Full Year2H1H
103
82
107
83
4.1(1.1%)
8.6(2.3%)
9.2(2.5%)
366.9
125
98
130
99
12.5(6.3%)
13.5(6.8%)
13.7 (6.9%)
197.7
101
85
113
87
0.8(0.4%)
2.5(1.3%)
2.4 (1.3%)
190.1
130
95
130
95
5.5(2.6%)
7.0(3.3%)
8.3(4.0%)
210.3
124127105EUR
969780US$
126130101EUR
969779US$
+9.1%16.5(4.0%)
+336.6%18.0(4.4%)
3.3(1.9%)
Net Income(Net Income Ratio)
+10.8%18.5 (4.5%)
+138.9%20.5 (5.0%)
6.1(3.5%)
Ordinary Income(Ordinary Income Ratio)
+10.0%20.0(4.9%)
+138.7%22.0(5.4%)
6.8 (3.9%)
Operating Income(Operating Income Ratio)
―408.0+11.2%408.0176.8Net Sales
Changes from the previous
projections
FY2014.3 Previous
projections
Changes from the previous
year
FY2014.3FY2013.3(Billions of yen)
Exchange Rate (yen)Exchange Rate (yen)
Net SalesNet Sales
Operating Income
Operating Income

12
235.5 258.0 258.5
106.0 105.092.6
15.019.0 20.023.8
24.525.0
6.4
16.014.0
5.55.0
4.6
-2.0
00.5
0.3
0.50.5
9.2
FY2014.3 Full Year Forecast for Performance by Business Segment
366.9408.0 408.0
20.022.0
Year-on-year change
(+9.8%)
(+13.4%)
(+33.3%)(+2.9%)
(+11.2%)
Change from the previous projections
(+0.2%)
(-0.9%)
(+5.3%)(-2.0%)
(―)
*
*
*
*
Musical Instruments
Electronic Devices
Audio Equipment
Others
Musical Instruments
Electronic DevicesAudio Equipment
Others
Electronic Devices
(previous projections)
FY2014.3FY2014.3FY2013.3*(previous
projections)
FY2014.3FY2014.3FY2013.3*
(musical instruments +¥2.6 billion, audio equipment +¥1.2 billion, electronic devices +¥0.1 billion)
+¥3.9 billionVersus previous projections
(musical instruments +¥23.9 billion, audio equipment +¥12.5 billion, electronic devices +¥0.9 billion)
+¥37.2 billionYear-on-Year
Impact of Exchange Rates
(musical instruments +¥0.7 billion, audio equipment +¥0.1 billion, electronic devices +¥0.1 billion)
+¥0.8 billion
(musical instruments +¥8.5 billion, audio equipment +¥3.1 billion, electronic devices +¥0.6 billion)
+¥12.2 billion
Net SalesNet Sales Operating IncomeOperating Income(Billions of yen)

13
20.0
Decrease in actual SG&A
1.4Impact of guitar
production-1.0
22.0
FY2014.3 Full Year Operating Income Analysis
Improvement in manufacturing
cost2.7
Increase in actual SG&A-0.7
Impact of guitar
production-1.0
Effects of structural
reform2.5
Increase in overseas labor
cost
-2.7
9.2
22.0
FY2013.3 FY2014.3 (projections)
FY2014.3 (previous projections)
FY2014.3 (projections)
Versus previous projectionsVersus previous projections
Versus same period of the previous yearVersus same period of the previous year(Billions of yen)
Impact of exchange
rate12.2
Impact of exchange
rate0.8
Decrease in actual
production-0.2
Improvement in gross margin
0.8

14
153.6 177.7176.3
81.980.881.7
14.06.4
16.0
Musical Instruments Full Year Projections
235.5258.0 258.5Full Year Projections
• Sales and income are projected to increase year-on-year and exceed previous projections, due to factors including exchange rate revisions
• The Chinese market is rallying and growth is anticipated
• The strike at the guitar manufacturing factory in Indonesia has been taken into account for the full year forecast
Net SalesNet Sales
Operating IncomeOperating Income
(projections)(previous projections)
FY2014.3 FY2014.3FY2013.3*
(Billions of yen)
(projections)(previous projections)
FY2014.3 FY2014.3FY2013.3*
Music schools,
etc.
Yamaha musical
instruments

15
33.533.6 38.332.925.019.342.135.438.732.4
18.419.619.017.7 15.416.014.918.09.7 12.9
Musical Instruments Sales by Region(-5%)
(+3%)(+7%)
(+2%)
(-6%)(+2%)
(-2%)
(-3%)108.0 105.0
33.4 40.1 36.7 43.8
19.825.7
37.6 43.9
(+2%)
(-2%)
FY14.3Full Year
ChinaFY14.3 1H
FY13.3*
Full Year
FY13.3* 1H
FY13.3*
Full Year
FY13.3* 1H
FY14.3Full Year
FY14.3 1H
FY13.3*
Full Year
North AmericaFY13.3* 1H
FY13.3*
Full Year
FY13.3* 1H
FY14.3 Full Year
FY13.3*
Full YearFY14.3
Full YearFY14.3
Full Year
Other RegionsEuropeJapanFY14.3 1HFY13.3* 1HFY14.3 1HFY14.3 1H
55.4 52.8
15.419.5 16.6 20.3
10.0 13.217.6 21.1
1H1H
Full Year ProjectionsFull Year Projections
(Billions of yen)Figures in parentheses show actual year-on-year changes, discounting the impact of exchange ratesMusic
schools, etc.
Yamaha musical
instruments
Music schools, etc.
Yamaha musical
instruments

16
49.1 55.4 55.6
37.042.143.4
6.57.1 7.3
5.05.54.6
Audio Equipment Full Year Projections
92.6106.0 105.0Full Year Projections
• Sales and income are expected to be lower than previous projections
• Focus on rebound in professional audio equipment market
• Router sales are projected to increase year-on-year, while karaoke equipment sales will decline
• Operating income is expected to be lower than previous projections due to reduced sales and higher SG&A expenses
Net SalesNet Sales
Operating IncomeOperating Income
(projections)(previous projections)
FY2014.3 FY2014.3FY2013.3*
(Billions of yen)
(projections)(previous projections)
FY2014.3 FY2014.3FY2013.3*
ICT devices
PA equipment
AV products,
karaoke

17
23.424.621.117.4
6.96.0
28.723.324.921.3
10.113.011.311.0
8.29.79.111.7
2.8 3.2
Audio Equipment Sales by Region
(-6%)
(±0%)(+7%)
(+2%)
(-8%)
(+3%)
(-5%)
(+1%)
(±0%)
(-3%)
FY14.3Full Year
ChinaFY14.3 1H
FY13.3*
Full Year
FY13.3* 1H
FY13.3*
Full Year
FY13.3* 1H
FY14.3Full Year
FY14.3 1H
FY13.3*
Full Year
North AmericaFY13.3* 1H
FY13.3*
Full Year
FY13.3* 1H
FY14.3Full Year
FY13.3*
Full YearFY14.3
Full YearFY14.3
Full Year
Other RegionsEuropeJapanFY14.3 1HFY13.3* 1HFY14.3 1HFY14.3 1H
1H1H
Full Year ProjectionsFull Year Projections
(Billions of yen)Figures in parentheses show actual year-on-year changes, discounting the impact of exchange rates

18
20.1 23.0
24.320.8
34.228.4
34.140.2
9.3 11.6
10.210.7
18.816.2
14.015.4
40.947.3 (+1%)
(-5%)
(+7%)
1H
2H
Piano Digital Musical Instruments
Wind Instruments String and Percussion Instruments
62.574.4
(+7%)
(-1%)
(+3%)
30.234.3
(+2%)
(-1%)
(+1%)20.0
21.7
(-13%)
(+3%)
(-5%)
22.318.2
27.624.2
16.7 18.9
23.320.3
AV Products
PA Equipment
42.449.9
37.042.1
(+1%)
(±0%)
(+2%)
(+5%)
(-7%)
(±0%)
Musical Instruments/Audio Equipment: Sales by Major Product Category
(Billions of yen)Figures in parentheses show actual year-on-year changes, discounting the impact of exchange rates
FY2014.3 projections
FY2013.3 FY2014.3 projections
FY2013.3 FY2014.3 projections
FY2013.3
FY2014.3 projections
FY2013.3 FY2014.3 projections
FY2013.3 FY2014.3 projections
FY2013.3

19
15.0 19.0 20.0
0.50-2.0
Electronic Devices Full Year Projections
Full Year Projections
• Sales are expected to increase year-on-year, and a return to profit is targeted
• Higher sales of geomagnetic sensors and codec products are anticipated, driven by demand from smartphone manufacturers
• Profitability is likely to decline in the second half, due to the impact of deferred R&D expenses
Net SalesNet Sales
(projections)(previous projections)
FY2014.3 FY2014.3FY2013.3*
(Billions of yen)
(projections)(previous projections)
FY2014.3 FY2014.3FY2013.3*
Operating Income (Loss)Operating Income (Loss)

20
7.38.0 7.4
5.65.2 5.6
5.55.75.2
6.26.35.4
0.50.3 0.5
Others Full Year Projections
25.023.8 24.5Full Year Projections
• Sales are expected to be slightly below previous projections
• Sales of automobile interior wood components and factory automation equipment are likely to be lower than previous projections
• Focus on new golf products launch
Net SalesNet Sales
Operating IncomeOperating Income
(projections)(previous projections)
FY2014.3 FY2014.3FY2013.3*
(Billions of yen)
(projections)(previous projections)
FY2014.3 FY2014.3FY2013.3*
FA equipment, etc.
ResortGolf products
Automobile interior wood
component

21
OthersElectronic DevicesAudio EquipmentMusical Instruments
3.23.8
1.21.3 0.10.2 0.50.5
3.93.8
4.7 4.8
1.7 1.30.8 0.7
8.1 8.5 83
9.2 10.7 10.3
3.43.4 3.11.51.4 1.3
4.9
8.9 9.0 7.4
2.5 3.53.0
1.4 1.0
0.4
1.11.3
1.2(5.4)5.8
13.8 (13.7) 12.0 (13.1)
11.0
(6.0)
22.1 23.010.7
14.8
(11.6)
24.0
Capital Expenditure/Depreciation/R&D Expenses
Capital Expenditure (Depreciation)Capital Expenditure (Depreciation)
R&D ExpensesR&D Expenses
FY2013.3* 1H FY2014.3 1H(projections)(previous projections)
FY2014.3 full yearFY2014.3FY2013.3*
FY2013.3* 1H FY2014.3 1H(projections)(previous projections)
FY2014.3 full yearFY2014.3FY2013.3*
(Billions of yen)

22
36.736.8 36.2
14.916.1 14.6
2.2 3.63.3
27.0 24.7 25.6
Inventories at the end of September were ¥6.9 billion higher than the same period of the previous year (discounting the +¥14.2 billion impact of exchange rates, actual inventories were down by ¥7.4 billion)Projections at the end of March 2014 is ¥80.3 billion (impact of exchange rate is ¥1.3 billion versus the previous year and ¥0.3 billion versus the previous projections)
39.640.338.2
21.916.4 19.42.1
3.53.427.0
25.626.2
Inventories
83.7 89.2 90.582.0 80.379.4
End of 1HEnd of 1H End of Fiscal YearEnd of Fiscal Year(Billions of yen)
(projections)(previous projections)FY2014.3FY2014.3FY2013.3*
(previous projections)FY2014.3FY2014.3FY2013.3*
Goods in process/ materials
Audio Equipment
Musical Instruments
Other products

23
Balance Sheet Summary
Total liabilities and net assets
Total net assets
Other liabilities
Resort membership deposits
Short- and long-term loans
Notes and accounts payable
Total assets
Fixed assets
Other current assets
Inventories
Notes and accounts receivable
Cash and deposits
75.5424.3348.858.6248.6190.014.5118.0103.5
015.415.4
1.920.118.2
0.522.121.775.5424.3348.844.7201.4156.73.513.19.66.990.583.77.856.648.8
12.762.750.0
ChangeAs of Sept. 30, 2013
As of Sept. 30, 2012
1H
22.5413.1390.623.7253.3229.6
2.4117.6115.3
015.415.4
-4.25.810.00.721.020.3
22.5413.1390.67.1199.8192.7
-0.912.613.5-1.780.382.05.356.351.0
12.764.151.4
ChangeAs of Mar. 31, 2014
As of Mar. 31, 2013
As of fiscal year end(Billions of yen)
*Unrecognized pension liabilities have been recorded on the balance sheet as of end of the first quarter of FY2014.3

Appendix

25
125129103EUR
959879US$
12513198EUR959979US$
+59.2%4.2(4.2%)
+831.5%6.7(6.6%)
0.7(0.8%)
Net Income(Net Income Ratio)
+52.9%4.7(4.7%)
+210.3%7.2(7.1%)
2.3(2.7%)
Ordinary Income(Ordinary Income Ratio)
+41.7%5.3 (5.3%)
+193.4%7.5(7.5%)
2.6(2.9%)
Operating Income(Operating Income Ratio)
+1.2%99.5+16.0%100.786.8Net Sales
Changes from previous projection
FY2014.3 2Q
previous projections
Changes from same period of
the previous year
FY2014.3 2Q
results
FY2013.3 2Q
results
Performance in the Second Quarter of Performance in the Second Quarter of FY2014.3 (Three Months)FY2014.3 (Three Months)
(Billions of yen)
Exchange Rate (yen)Exchange Rate (yen)
Net SalesNet Sales
Operating Income
Operating Income

26
3.11.5
5.11.3
1.8
2.1
0.8
0.1
-0.4
0.1
-0.1
0
64.363.956.2
21.025.0 25.34.0
4.9 5.55.65.7
5.686.8
99.5 100.7
2.6
7.5
5.3
Year-on-year change
(+14.5%)
(+20.1%)
(+36.2%)
(+0.3%)
(+16.0%)
Change from the previous projections
(+0.7%)
(+1.0%)
(+12.2%)(-2.2%)
(+1.2%)
*
*
*
*Others
Performance by Business Segment in the Second Quarter of FY2014.3 (Three Months)
Net SalesNet Sales Operating IncomeOperating Income(Billions of yen)
(musical instruments +¥1.4 billion, audio equipment +¥0.6 billion, electronic devices +¥0.1 billion)
+¥2.0 billionVersus previous projections
(musical instruments +¥8.8 billion, audio equipment +¥4.0 billion, electronic devices +¥0.3 billion)
+¥13.1 billionYear-on-Year
Impact of Exchange Rates
(musical instruments +¥0.4 billion, electronic devices +¥0.1 billion)
+¥0.5 billion
(musical instruments +¥2.7 billion, audio equipment +¥1.2 billion, electronic devices +¥0.3 billion)
+¥4.1 billion
Electronic Devices
(previous projections)
FY2014.3 2QFY2014.3 2QFY2013.3* 2Q(previous projections)
FY2014.3 2QFY2014.3 2QFY2013.3* 2Q
Musical Instruments
Electronic Devices
Audio Equipment
Others
Musical Instruments
Electronic Devices
Audio Equipment
Others

27
0.91.0-0.7Total
1.92.02.1Total
0.200.2Minority interests in income
-1.7-1.3-0.2Income taxes -deferred
3.43.32.1Income taxes -current
0.91.1-1.0Others
0-0.10.3Income from (loss on) disposal of fixed assets
-0.2-0.5-0.7Total-1.1-1.2-1.2Other0.90.70.5Net financial income
FY2014.3 1HFY2014.3 1Hprevious projections
FY2013.3 1H
First Half Non-Operating Income/Loss & Extraordinary Income/Loss
Gain on sales of investment securities 1.0
Non-Operating Income/LossNon-Operating Income/Loss
Extraordinary Income/LossExtraordinary Income/Loss
Income Taxes and Other ExpensesIncome Taxes and Other Expenses
(Billions of yen)

28
0.51.0-0.8Total
3.03.03.7Total
0.200.2Minority interests in income
-1.5-1.1-0.2Income taxes -deferred
4.34.13.7Income taxes -current
0.21.3-2.4Others
0.3-0.31.6Income from (loss on) disposal of fixed assets
-1.5-1.5-0.6Total-2.9-2.6-1.7Other
1.41.11.1Net financial income
FY2014.3 new projections
FY2014.3 previous projections
FY2013.3
-Gain on sales of investment securities 1.0-Structural Reform Expenses -0.8
Structural Reform Expenses -3.1
Full Year Non-Operating Income/Loss & Extraordinary Income/Loss
(Billions of yen)
Non-Operating Income/LossNon-Operating Income/Loss
Extraordinary Income/LossExtraordinary Income/Loss
Income Taxes and Other ExpensesIncome Taxes and Other Expenses

29
Sales by Region Note: Year-on-year comparisons discount the impact of exchange rates
Japan
Market conditions began to appear slightly more positive from the summer, and overall sales were stteady in the second quarter. Although pianos and Electones still struggled from the first quarter, sales of high-end upright pianos started to pick up. There was a backlog in filling orders for hybrid pianos as sales of the NU1 model remained robust. Digital piano sales recorded double-digit year-on-year growth, and wind instruments also rebounded from the previous year as a raft of new products was launched. Guitar sales were healthy, especially for acoustic models. However, first half sales of musical instruments were still lower than in the same period of the previous year.Professional audio equipment faced a tough environment with low shipments in the first half. For audio products, demand for TV peripherals declined, and sound bars struggled despite a large market share as competitors entered the sector. High-end audio products and AV receivers sold well, but overall 1H results were down year-on-year.
North America
Gradual recovery continued throughout the North American market, with 1H sales up year-on-year in both the US and Canada. Piano sales exceeded the previous year’s results amid strong performance by grand pianos and Disklaviermodels. Although sales of digital pianos were up year-on-year, those of portable keyboards were down. Wind instruments sold briskly, partly due to demand for mid-range products and large orders. Double-digit growth in guitar sales was driven by moderately-priced acoustic models sold by major musical instrument chain stores. However, electronic drums faced tough conditions. Sales of music production equipment increased year-on-year. Despite active sales promotion efforts for professional audio equipment, orders were low and results declined from the same period of the previous year. In the AV product segment, the sound bar market was tight due to the entry of competitors, but strong sales of AV receiver kept its results on a par with the previous year.
Europe
Musical instrument sales were lower than in the same period of the previous year. Digital piano sales remained robust and increased year-on-year as low-priced models sold steadily through retail channels, but portable keyboards continued to struggle and sales declined amid difficult market conditions. Sales of wind instruments, percussion and guitars were also down from the first half of the previous year. Active promotional efforts and new product launches drove overall sales of AV products, and audio equipment also sold well, leading to improved year-on-year results for the audio equipment segment as a whole. Germany and other mature markets were on a par with the previous year, but growth markets sales declined as the demand recoiled after a last-minute rush in Turkey last year.
China
The entire market picked up from the beginning of the first half, with 7% year-on-year growth in 2Q driving improved 1H results. Although conditions remain challenging in the major cities, sales were boosted by strong local economies in second-tier inland cities. Piano sales rebounded to the previous year’s levels, and demand for digital keyboard instruments was healthy, especially in inland cities. Guitar sales were still robust, but wind instrument shipments were sluggish as store inventories remained high. The professional audio equipment market remains subdued. Retail sales of AV products continued to face headwinds, and overall audio equipment sales were below the same period of the previous year.
Other Regions
Overall 1H musical instrument sales were down from the previous year, but a year-on-year increase in 2Q sales indicated a turnaround. Digital piano sales remained strong. The Middle East/Africa market is rallying from the previous year’s downturn, and sales are steadily increasing in Russia. In Latin America, solid sales led to a year-on-year improvement in Argentina despite import restrictions, but overall results were down as other major countries struggled. The Oceania market is settling down and showing signs of recovery after musical instrument store restructuring. The standout performer in Southeast Asia was Indonesia, where a fast-expanding middle class helped to maintain double-digit growth.
Musical Instruments/Audio Equipment: Sales by Region

30
98.0100.797.093.097.186.890.0
112.3
7.53.62.6
4.36.2
1.0-1.2
7.3
Quarterly Sales and IncomeQuarterly Sales and Income
FY2014.3 projectionsFY2013.34Q 3Q2Q1Q4Q 3Q2Q1Q
(Billions of yen)
Operating Income

31
6.56.15.66.35.75.75.66.84.55.45.54.63.73.54.03.9
24.032.2
25.323.524.127.021.020.5
63.068.664.362.659.561.056.258.8
0.50.6 -0.30.1 0.4-0.1 -0.4
-0.1-0.40.6 -0.7 -0.4 -0.20.4 0.8
-0.5
0.51.91.80.92.21.31.0 00.55.95.1
1.53.2 4.42.2-0.5
FY2014.3 projectionsFY2013.3*
4Q 3Q2Q1Q4Q 3Q2Q1Q
FY2014.3 projectionsFY2013.3*
4Q 3Q2Q1Q4Q 3Q2Q1Q
FY2014.3 projectionsFY2013.3
4Q 3Q2Q1Q4Q 3Q2Q1Q
FY2014.3 projectionsFY2013.3
4Q 3Q2Q1Q4Q 3Q2Q1Q
Quarterly Sales and Income by SegmentQuarterly Sales and Income by Segment(Billions of yen)
Musical Instruments Audio Equipment
OthersElectronic Devices

Important Notice
In this report, the figures forecast for the Company’s future performance have been calculated on the basis of information currently available to Yamaha and the Yamaha Group. Forecasts are, therefore, subject to risks and uncertainties.
Accordingly, actual performance may differ greatly from our predictions depending on changes in the economic conditions surrounding our business, demand trends, and the value of key currencies, such as the U.S. dollar and the euro.