Yale · Yale University Consolidated Statement of Activities ... Yale’s Investment Office has...
42
financial report 2014–2015 Yale
-
Upload
nguyenkhanh -
Category
Documents
-
view
215 -
download
1
Transcript of Yale · Yale University Consolidated Statement of Activities ... Yale’s Investment Office has...

financial report2014–2015
Yale

table of contentsHighlights . . . . . . . . . . . . . . . . . . . . . . . . . . . . . . . . . . . . . . . . . . . . . . . . . . . . . . . 1
Message from the Vice President
for Finance and Chief Financial Officer . . . . . . . . . . . . . . . . . . . . . . . . . . . . . . . 2
Financial Results . . . . . . . . . . . . . . . . . . . . . . . . . . . . . . . . . . . . . . . . . . . . . . . . . . 4
Overview . . . . . . . . . . . . . . . . . . . . . . . . . . . . . . . . . . . . . . . . . . . . . . . . . . . . . . . . 4
Operating Revenue . . . . . . . . . . . . . . . . . . . . . . . . . . . . . . . . . . . . . . . . . . . . . . . . 6
Operating Expenses . . . . . . . . . . . . . . . . . . . . . . . . . . . . . . . . . . . . . . . . . . . . . . . 9
Physical Capital . . . . . . . . . . . . . . . . . . . . . . . . . . . . . . . . . . . . . . . . . . . . . . . . . . . 9
Endowment . . . . . . . . . . . . . . . . . . . . . . . . . . . . . . . . . . . . . . . . . . . . . . . . . . . . . 11
Independent Auditor’s Report . . . . . . . . . . . . . . . . . . . . . . . . . . . . . . . . . . . . . . 14
Yale University Consolidated Statement of Financial Position . . . . . . . . . . . . . .15
Yale University Consolidated Statement of Activities . . . . . . . . . . . . . . . . . . . . 16
Yale University Consolidated Statement of Cash Flows . . . . . . . . . . . . . . . . . . 17
Yale University Notes to Consolidated Financial Statements . . . . . . . . . . . . . . 18
The President and Fellows of Yale University . . . . . . . . . . . . . . . . . . . . . . . . . . 36
The O∞cers of Yale University . . . . . . . . . . . . . . . . . . . . . . . . . . . . . . . . . . . . . . 36
front cover: The historic Yale Bowl, with its Class of 1954 Field, is one of the true treasures in American sports and celebrated its 100th birthday on November 21, 2014 . It was the largest athletic stadium in the world and the first football venue with seating completely surrounding the field when it opened on Nov . 21, 1914, for a game against Harvard . The famous Bowl has been a college football landmark ever since, while also hosting National Football League games, international soccer, lacrosse, tennis, concerts, television advertisements, movies and the 1995 Special Olympic World Games . The Bowl is 930 feet long and 750 feet wide and covers 12 .5 acres . Its current seating capacity is 61,446 (it was 70,869 before alterations in 1994 and 2006), and every seat has an unobstructed view of the playing field . There have been crowds of over 70,000 on 20 occasions, the most recent on Nov . 19, 1983, for the 100th playing of The Game . The largest crowd to attend a Yale game at the Bowl was 80,000 for Army on November 3, 1923 . The NFL’s New York Giants and Detroit Lions brought profes-sional football to the Bowl for the first time in the summer of 1960 . The Giants, who played the New York Jets in a number of memorable exhibition contests during the 1970s, used the Bowl as their home field in 1973 and 1974 while Yankee Stadium was renovated .
The design for the Yale Bowl was proposed by Charles A . Ferry, Class of 1871, as a replacement for Yale Field, the 33,000-seat home of the football team from 1884 to 1914 . The cost of the final product was $750,000 . Two additions to the legendary Bowl were dedicated during the 2009 season . The Kenney Center, named after four members of the Kenney family – former Yale football players Jerry P . ’63, Brian R . ’60, Robert D . ’67, Richard L . ’71 and Jeffrey S . ’93 – is a three-story building attached to the Bowl that houses team rooms and a reception area that opens up to the inside of the Bowl . Jensen Plaza, named after Irving ’54, Colin ’57, Erik ’63 and Mark Jensen ’67, includes the names of every Yale football player since 1872 and serves as the grand entrance . The Sporting News selected the Bowl as one of the 40 best college football stadiums in its book, “Saturday Shrines .” ESPN .com’s list of America’s 100 most important sports venues also included the home of Yale Football . The playing field, which honors the gifts from the Class of 1954, hosted its 600th collegiate football game on November 23, 2014, when the Elis played Harvard .
The original “Bowl” has never lost its allure or mythical status .
Photography by Michael Marsland, University Photographer

1
Highlights
Fiscal YearsFive-Year Financial Overview ($ in millions) 2015 2014 2013 2012 2011 Net Operating Results - Management View $ 17.3 $ 13.1 $ 15.7 $ 67.3 $ 109.7 Financial Position Highlights: Total assets $ 36,986.3 $ 34,536.0 $ 31,265.2 $ 31,322.4 $ 31,044.3 Total liabilities 9,601.1 8,735.2 8,808.3 10,830.7 10,045.8 Total net assets $ 27,385.2 $ 25,800.8 $ 22,456.9 $ 20,491.7 $ 20,998.5 Endowment: Net investments, at fair value $ 25,543.0 $ 23,858.6 $ 20,708.8 $ 19,264.3 $ 19,174.4 Total return on investments 11.5% 20.2% 12.5% 4.7% 21.9% Spending from endowment 4.5% 5.0% 5.3% 5.1% 5.9% Facilities: Land, buildings and equipment, net of accumulated depreciation $ 4,510.3 $ 4,412.8 $ 4,347.3 $ 4,254.7 $ 4,109.8 Disbursements for building projects $ 302.0 $ 270.5 $ 277.0 $ 284.5 $ 280.7 Debt $ 3,572.4 $ 3,332.8 $ 3,594.4 $ 4,108.0 $ 4,041.5 Statement of Activities Highlights: Operating revenues $ 3,381.9 $ 3,109.9 $ 2,936.9 $ 2,818.6 $ 2,787.7 Operating expenses 3,187.6 3,058.9 2,976.1 2,812.8 2,684.0 Increase (decrease) in net assets from operating activities $ 194.3 $ 51.0 $ (39.2) $ 5.8 $ 103.7 Five-Year Enrollment Statistics 2015 2014 2013 2012 2011 Freshman Enrollment Class of: ’18 ’17 ’16 ’15 ’14 Freshman applications 30,932 29,610 28,977 27,283 25,869 Freshmen admitted 1,950 2,031 2,043 2,109 2,039 Admissions rate 6.3% 6.9% 7.1% 7.7% 7.9% Freshman enrollment 1,360 1,359 1,356 1,351 1,344 Yield 71.5% 68.2% 68.4% 65.2% 67.0%
Total Enrollment: Yale College 5,477 5,427 5,399 5,345 5,296 Graduate and professional schools 6,859 6,591 6,424 6,440 6,321 Total 12,336 12,018 11,823 11,785 11,617 Yale College Term Bill and Financial Aid: Yale College term bill $ 59,800 $ 57,500 $ 55,300 $ 52,700 $ 49,800 Average grant award for students receiving aid $ 46,445 $ 44,785 $ 42,100 $ 39,840 $ 37,955 Average net cost of attendance for students receiving aid $ 17,328 $ 17,174 $ 16,339 $ 15,717 $ 14,836

2 Yale University Financial Report 2014-2015
Message from the Vice President for Finance and Chief Financial Officer
Yale University finished the year ending June 30, 2015 with strong financial results.
Strong Financial ResultsFor the year ending June 30, 2015, in large part due to the recognition of revenue for the extraordinary pledge from Charles Johnson ’54 for the construction of two new residential colleges, Yale generated a surplus on a GAAP basis of $194 million from operations. On a Management View basis – the way Yale looks at financial information for internal discussion and decision-making purposes – Yale generated a surplus of $17 million from operations. Without the extraordinary item related to the residential colleges, the 2014-15 operating surplus on both a GAAP and a Management View basis was in line with last year’s results. Yale’s operations remain strong thanks to prudent financial management practices and the generous support from alumni and friends that have allowed Yale to carry out its mission of teaching and research with excellence for over three centuries. Net assets finished the year at $27.4 billion, an increase of $1.6 billion or 6.1% over the prior year primarily due to the 11.5% investment return generated from the Yale Endowment, managed expertly for over thirty years by Chief Investment Officer, David Swensen. Yale’s balance sheet remains strong, providing a stable platform from which to carry out the varied and important mission it supports.
An Accessible and Affordable EducationFor over fifty years Yale College has accepted students without regard to their financial need and has met the full demonstrated need of every admitted student. Yale College families whose gross income is less than $65,000 (with typical assets) are not expected to make a contribution towards the cost of their child’s Yale education. The average cost of attendance for a Yale College student on financial aid was $17,328 per year in 2014-15 or approximately 27% of the “sticker price” – an amount lower in inflation-adjusted terms than a decade ago. Only 17% percent of Yale College students chose to take out a loan during their undergraduate careers, and the average loan amount upon graduation was less than $16,000. This policy of need-blind admissions has been extraordinarily successful as demonstrated by Yale’s diverse and talented students and alumni. This has made Yale accessible and affordable even though in financial terms it means only a small portion of Yale’s annual revenue comes from tuition, room, and board net of financial aid. If a relatively small proportion of revenue comes from tuition, how does Yale finance the cost of education – while keeping net tuition and student debt at comparatively low levels? The answer is generous gifts from donors to support financial aid – and the Yale Endowment.
Funding Teaching and Research for Current and Future GenerationsThe Yale Endowment provides over $1 billion in revenue each year (32% of total revenue in 2014-15), the single largest source of funding for Yale University. The Yale Endowment provides important funding to every school and department on campus, supporting the widest array of activities: financial aid, faculty salaries, residential colleges, classrooms, laboratories, lab supplies, journals, artwork, health care and retirement benefits, utilities, administrative support, and many other costs of teaching and research. Yale’s policy for spending from the endowment balances the needs of current and future students and scholars. It provides a stable flow of income to the current operating budget; and it protects the real value of the endowment over time so that future generations of scholars can benefit from a similar stable flow of income. The $1.1 billion Yale is spending today is nearly double what it was a decade ago and more than five times what it was in 1997, the year many of the students in this year’s freshman class were born. Yale is committed to being a responsible steward of this important asset, and that means neither over- nor under-spending. In order to provide that support the endowment must generate sufficient investment returns to replace both the $1+ billion spent each year and also enough to keep pace with inflation. That requires an investment return of roughly 8-9% on average at current inflation rates just to fund the same level of financial aid, teaching, and research as during the preceding year. That type of return would

be the envy of most investors. Fortunately, Yale’s Investment Office has been able to meet and even exceed that level over long periods of time. That is why Yale was able to spend such a large amount from the endowment to pay for teaching and research in 2014-15. Yale is fortunate to have such a successful and sizeable endowment, and we are grateful to our generous alumni and other supporters who entrust us with these precious resources. They allow Yale to spend a generous amount each year while requiring prudent management to assure it is available to fund teaching and research conducted by future generations as well.
LeadershipDuring 2015, several of the University’s top leaders stepped down after long and distinguished careers. Vice president and general counsel Dorothy Robinson retired from Yale after more than 36 years of outstanding service to the University, vice president for global and strategic initiatives Linda Lorimer announced her retirement after nearly 30 years of dedicated service, and vice president for finance and business operations Shauna King stepped down on August 31, 2015 after effectively leading Yale through the 2009 financial crisis. All three leave the University a better place than when they came, and for generations to come the University will benefit from their dedicated service. In March, the leadership team welcomed Alexander Dreier, an accomplished attorney with an international practice in higher education, as Yale’s next vice president and general counsel. On September 1 I assumed my new role as vice president for finance and chief financial officer, and a search is underway for a senior vice president of operations. President Salovey also announced that in 2016 Ann Kurth, an expert on global health currently at New York University, will join Yale as the new dean of the school of nursing, and Deborah Berke, architect and founder of the New York-based design firm Deborah Berke Partners, will become the new dean of the school of architecture. The leadership team is well positioned to carry out Yale’s important mission in the coming years.
Looking AheadYale had a successful year academically and financially thanks to the excellence that surrounds us – our faculty, students, staff, alumni, donors, the City of New Haven, and other members of the Yale community. For highlights from the year, please visit Yale News (news.yale.edu). Looking ahead, the external financial environment poses substantial challenges that Yale will need to manage. The funding for health care and research in the United States remains under pressure, and Yale will need to adapt since these are the two largest revenue sources after the endowment. Even so, as President Salovey stated, “We need to open up the financial space necessary to do the things we want to do — space so that we can pursue the new initiatives that will propel Yale forward.” Some of these new initiatives are already visible around campus. When visiting New Haven, you can see the two new residential colleges rising up on Prospect Street. The new colleges are scheduled to open in the fall of 2017 and will be the first expansion of the residential college system since 1961. Work is also underway on the new Center for Teaching and Learning, the renovation of the Hall of Graduate Studies, a new science building, as well as the new Schwarzman Center, a gathering place for both undergraduate and graduate students made possible by the generous $150 million gift from Stephen A. Schwarzman ’69. Each of these presents an opportunity to create spaces and programs that inspire and reimagine teaching and research for the 21st century. As always Yale is a place with ideas and opportunities in abundance, and that will require difficult choices about which to pursue. Our focus will remain on investing in Yale’s core mission of teaching and research. I look forward to updating you on Yale’s progress in the years to come.
Stephen C. MurphyVice President for Finance and Chief Financial Officer
3

4 Yale University Financial Report 2014-2015
Financial Results
Overview
The University manages its operations to achieve long-term
financial equilibrium. It is committed to sustaining both the
programs and the capital assets (Endowment and facilities)
supporting those programs over multiple generations. Endowment
income, Yale’s largest source of revenue, is allocated to the
Operating Budget based on a spending policy that preserves the
Endowment asset values for future generations, while providing
a robust revenue stream for current programs. Similarly, the
Operating Budget provides the major portion of the funds needed,
through the Capital Replacement Charge (CRC), to replenish the
capital base necessary to ensure that buildings are maintained to
support current programs.
The Consolidated Statement of Activities in the audited
financial statements is presented in accordance with U.S. generally
accepted accounting principles (GAAP). GAAP recognizes revenue
when earned and expenses when incurred. The Management
View is focused more on resources available and used in the fiscal
period presented. The Management View does not include certain
expenses that are paid out over the long term, such as unfunded
defined benefit costs, and certain revenue that will not be received
within the next fiscal year, such as pledged contribution revenue.
Another significant difference is that the Management View treats
the CRC as an expense rather than the historical cost depreciation
expensed in the Consolidated Statement of Activities. The
GAAP financial statements do not present fund balance transfers
between the operating, physical, and financial categories, as the
Management View does.
A summary of the differences between the Management View
presentation and GAAP presentations of the University’s net
operating results is as follows ($ in thousands):
2015 2014
Total net operating results $ 17,315 $ 13,096
Operating pledge activity 107,273 (9,925)
Expenses related to long-term liabilities (55,783) (30,359)
Capital funding in excess of depreciation/
(depreciation in excess of capital funding) 9,622 (27,026)
Interest rate and energy hedge realized loss 53,573 54,813
Deferred investment income 3,773 26,900
Funding transfers 58,574 23,536
Increase in net assets from operations
per the Consolidated Statement
of Activities $ 194,347 $ 51,035
Fiscal Year 2015 Management View Results
The University ended the year with an increase to its operating
fund balances of $17 million. Actual operating revenues increased
5.8% and actual operating expenses, excluding transfers, increased
4.6% compared to 2014. Medical services income and faculty
salaries were significantly higher than the prior year, as the
School of Medicine’s clinical practice continued to grow at a rapid
pace. All other revenue lines – tuition, room and board, grants
and contracts income, contributions, endowment income and
investment and other income contributed to growth.

5
Yale University Operating Results – Management Viewfor the year ended June 30, 2015 ($ in thousands)
Actual Actual June 30, 2015 June 30, 2014 $ Change % ChangeRevenues: Tuition, room and board - gross $ 577,724 $ 541,348 $ 36,376 6.7% Tuition discount (259,472) (250,687) (8,785) 3.5% Tuition, room and board - net 318,252 290,661 27,591 9.5% Grants and contract income 673,739 670,992 2,747 0.4% Medical services income 786,541 699,527 87,014 12.4% Contributions 155,701 148,170 7,531 5.1% Endowment income 1,082,480 1,041,500 40,980 3.9% Investment and other income 280,964 265,249 15,715 5.9% Total external income 3,297,677 3,116,099 181,578 5.8% Expenses: Faculty salaries 776,291 729,804 46,487 6.4% All other salaries 751,119 729,402 21,717 3.0% Employee benefits 473,724 457,803 15,921 3.5% Total salaries and benefits 2,001,134 1,917,009 84,125 4.4% Fellowships 91,328 90,418 910 1.0% Non-salary expenses 757,915 745,456 12,459 1.7% Interest, CRC and other amortization 371,411 326,584 44,827 13.7% Total expenses 3,221,788 3,079,467 142,321 4.6%
Transfers (58,574) (23,536) (35,038) 148.9% Total net operating results $ 17,315 $ 13,096 $ 4,219 32.2%

6 Yale University Financial Report 2014-2015
Fiscal Year 2015 GAAP Results
Operating Revenue
As shown in the chart below, the University derives its operating
revenue from seven main sources: tuition, room and board (net
of certain scholarships and fellowships), grants and contracts,
medical services, endowment income, other income and
investment income, contributions, and publication income.
Net Tuition, Room and Board
Net tuition, room and board increased 10.0% from $287.1 million
in 2014 to $315.8 million in 2015. Tuition, room and board totaled
$577.7 million in 2015, an increase of 6.7% from 2014. Of this
amount, $500.0 million represents tuition, a 7.3% increase over
2014 due primarily to the growth in the School of Management
and $77.7 million represents revenue from room and board which
increased 3.1% from 2014. In accordance with generally accepted
accounting principles, student income is presented net of certain
scholarships and fellowships, which totaled $262.0 million and
$254.3 million for 2015 and 2014, respectively. Net tuition, room
and board represented 9.3% and 9.2% of the University’s operating
revenues in 2015 and 2014, respectively.
During the 2014-2015 academic year, 12,336 students were
enrolled at the University; 5,477 were undergraduate students
Endowment income32%
Publications income1%
Other income and other investment income7%
Net tuition, room and board9%
Grant and contract income20%
Contributions8%
Medical services income23%
Operating Revenue
attending programs at Yale College, and 6,859 were pursuing their
studies at the Graduate School of Arts and Sciences and the twelve
professional schools. (Figures are based on full-time equivalents.)
Tuition for students enrolled in Yale College was $45,800 and
room and board was $14,000, bringing the total term bill to $59,800
for the 2014-2015 academic year. The increase in the Yale College
term bill was 4.0% over the 2013-2014 academic year. Tuition for
students enrolled in the Graduate School of Arts and Sciences was
$37,600, a 3.0% increase over the 2013-2014 academic year.
The University maintains a policy of offering Yale College
admission to qualified applicants without regard to family financial
circumstances. This “need-blind” admission policy is supported
with a commitment to meet in full the demonstrated financial need
of all students throughout their undergraduate years.
During the 2014-15 academic year, 2,787 undergraduates,
representing 50.2% of eligible Yale College enrollment, received
financial aid. In the Graduate School of Arts and Sciences, 2,818
students, or 99.8% of those eligible, received financial aid. In the
professional schools, 3,216 students, or 80.4% of those eligible,
received financial aid. In all, 8,821 University students, or 71.3%
of total University eligible enrollment, received some form of
University-administered student aid in the form of loans, gifts, or
a combination of both loans and gifts.
Grant and Contract Income
Grant and contract income experienced a 0.4% increase from
$671.0 million in 2014 to $673.7 million in 2015. The Yale School
of Medicine, which received 78% of the University’s grant and
contract income in fiscal year 2015, reported a decrease of 0.02%
for 2015, while the remaining University units increased by 2.0%.
The federal government funded $507.1 million, or 75.3%
of 2015 grant and contract income, in support of Yale’s research
and training programs. Included in the $507.1 million is the
Department of Health and Human Services (DHHS) funding
of $355.3 million, a decrease of 3.6% compared to the prior year.
The University also receives significant research funding from
the National Science Foundation, the Department of Energy,
the Department of Defense, and student aid awards from the
Department of Education. Non-federal sources, which include
foundations, voluntary health agencies, corporations, and the State

7
of Connecticut, provided an additional $166.6 million in funding
for research, training, clinical, and other sponsored agreements
during 2015.
In addition to the reimbursement of direct costs charged to
sponsored awards, sponsoring agencies reimburse the University
for a portion of its facilities and administrative costs (referred to as
indirect costs), which include costs related to research laboratory
space, facilities, and utilities, as well as administrative and support
costs incurred for sponsored activities. These reimbursements for
facility and administrative costs amounted to $165.9 million in
2015. Recovery of facility and administrative costs associated with
federally sponsored awards is recorded at rates negotiated with
the University’s cognizant agency, the Department of Health and
Human Services.
Medical Services Income
Medical services income totaled $786.5 million in fiscal year 2015,
an increase of 12.4% from 2014, and represented 23.3% of the
University’s operating revenue. The largest portion of this revenue
stream, $737.6 million, is derived from medical services provided
by the School of Medicine’s Yale Medical Group (YMG), one of the
largest academic multi-specialty practices in the country and the
largest in Connecticut.
Most of the School of Medicine departments saw double-
digit increases in medical services revenues during fiscal year 2015.
Much of the revenue growth stems from practice acquisitions and
new physicians, totaling approximately 150, who joined YMG in
fiscal year 2014 and had a full year of revenues in fiscal year 2015
versus a partial year in 2014. Clinical volumes also increased as
a result of 72 new faculty hired in fiscal year 2015, comprised of
13 hires from community practice acquisitions, 19 transitioning
physicians who practiced at the Hospital of St. Raphael’s, and 40
academic physician hires.
The strong partnership with Yale New Haven Health System
(System) continued in fiscal year 2015 with System support for
physician recruitment and program development increasing by
12%, to a total of $218.0 million.
Federal-DHHS Federal-Other Non-Federal
Grant and Contract Income Ten-year trend analysis ($ in millions)
FY06 FY07 FY08 FY09 FY10 FY11 FY12 FY13 FY14 FY15
$700
$600
$500
$400
$300
$200
$100
$ 0
Medical Services Income Eight-year trend analysis ($ in millions)
FY08 FY09 FY10 FY11 FY12 FY13 FY14 FY15
$900
$800
$700
$600
$500
$400
$300
$200
$100
$ 0
Total YaleUniversity
YSM PatientCare Fees
YNHH Incometo YSM
Yale HealthMedical Services

8 Yale University Financial Report 2014-2015
Allocation of Endowment Spending
Each year a portion of accumulated Endowment investment
returns is allocated to support operational activity. This important
source of revenue represents 32.0% of total operating revenue this
year, and it remains the largest source of operating revenue for
the University. The level of spending is computed in accordance
with an Endowment spending policy that has the effect of
smoothing year-to-year market swings. Endowment investment
returns allocated to operating activities increased by 3.9% in 2015
to $1,082.5 million. Additional information on the Endowment
spending policy is provided in the Endowment section of
this report and in the footnotes to the consolidated financial
statements.
Contributions
Donations from individuals, corporations and foundations
represent a vitally important source of revenue for the University.
Gifts to the University provide necessary funding for current
operations, for long-term investments in the University’s physical
infrastructure and, in the case of gifts to the Endowment, provide
permanent resources for core activities for future generations.
Gifts of $263.0 million in 2015 and $138.2 million in 2014, made by
donors to support the operations of the University, are reflected as
contribution revenue in the operating section of the Consolidated
Statement of Activities whereas gifts to the University’s
Endowment and for building construction and renovation are
reflected as contribution revenue in the non-operating section. In
aggregate, contributions included in the University consolidated
financial statements total $401.5 million in 2015 compared to
$346.4 million in 2014.
Certain gifts commonly reported in fund-raising results are
not recognized as contributions in the University consolidated
financial statements. For example, “in-kind” gifts such as works
of art and books are not recognized as financial transactions in the
University consolidated financial statements. Grants from private,
non-governmental sources (i.e., corporations and foundations)
reported as gifts for fund-raising purposes are included in the
Consolidated Statement of Activities as grant and contract income.
Investment and Other Income
Investment and other income includes $77.2 million of interest,
dividends, and gains on non-Endowment investments and $151.6
million of royalty income, admissions revenue relating to athletic
events and drama productions, parking revenue, special event and
seminar fees, application and enrollment fees and a variety of other
sources.
Publications Income
Publications income is primarily generated through Yale University
Press (Press), a separately endowed department of the University.
Publishing-related revenue for the Press totaled $31.6 million for
2015. The Press published over 400 titles in 2015. Many of the
authors are academic and other professionals from around the
world. The Press published Suspended Sentences, a book by best-
selling novelist and author Patrick Modiano who was awarded
the 2014 Nobel Prize in Literature, which became the number one
selling book for the year.
Allocation of Endowment ($ in millions)
% of Total Revenues
$1,400
$1,200
$1,000
$800
$600
$400
$200
$0
50%
45%
40%
35%
30%
25%
20%
15%
10%
5%
0% FY06 FY07 FY08 FY09 FY10 FY11 FY12 FY13 FY14 FY15
Allocation of Endowment Spending as a percentage of total revenues, ten-year trend analysis

9
Operating Expenses
Operating expenses totaled $3.2 billion for 2015, representing a
4.2% increase for the year. With 4,410 faculty, 1,116 postdoctoral
associates, 4,185 managerial and professional staff, and 5,172
unionized clerical, technical, service, and maintenance personnel,
personnel costs are the single largest component (63%) of the
University’s total operating expenses. (Counts represent full-time
equivalents as of fall 2014.)
Personnel costs were $2,017.4 million in 2015, a 4.3% increase
over 2014. Faculty salary expenses increased 6.4% which includes
growth in clinical activities. Staff compensation increased 2.3%
from 2014 to 2015.
The cost of providing employee benefits, including various
pension, post-retirement health, and insurance plans in addition to
Social Security and other statutory benefits, totaled $510.3 million
for 2015, an increase of 4.0% from 2014.
Depreciation and interest expenses increased 4.0%, and the
remaining expenses, including services, materials and supplies,
and other expenses increased 4.2% from 2014.
In accordance with generally accepted accounting principles,
Yale reports its operating expenses by functional classification in
the Consolidated Statement of Activities. The University spends
49.4% of its operating resources on academic activities including
instruction and departmental research, libraries and other
academic support and student aid and services. Organized research
represents 15.5% and patient care 23.4% of spending. Organized
research and patient care activities are integral to the academic and
learning experiences at the University.
Physical Capital
Capital spending on facilities in fiscal year 2015 totaled $302.0
million. This represents an increase in spending level of 11.6%
compared to 2014.
The largest share of the University’s capital spending, 26%,
was used to fund projects related to undergraduate residences. The
expansion of Yale College, through the construction of two new
Residential Colleges, will be the first additions to the residential
college system since 1961. The facilities will occupy a triangle of
land just south of Ingalls Rink, and will model the twelve existing
residential colleges, with a master, dean, fellows, and students
forming a close-knit family, supported by the highest caliber public
and private spaces for living and study. Construction began in 2015
and will continue into 2017.
Operating Expenses by Natural Classification
Other operating expenditures21%
Interest onindebtedness3%
Depreciation and amortization8%
Utilities2%
Salaries and wages47%
Student stipends3%
Employee benefits16%
Operating Expenses by Functional Classification
Libraries and other academic support9%
Public service4%
Administration and other institutional support7%
Student aid and services13%
Instruction and departmental research28%
Patient care and other related services23%
Organized research16%

FY91 FY95 FY99 FY03 FY07 FY11 FY15
$700
$600
$500
$400
$300
$200
$100
$0
Acquisitions and new constructionRenovations
Capital Spending by Year (in 2015 dollars, in millions)
Capital Spending by Campus Area
School of Management2%
Utilities10%
Residential26%
All other8%
Administration and other8%
School ofMedicine5%
Biological and physical sciences17%
Athletics3%
British Art Center3%
Libraries8%
West Campus10%
10 Yale University Financial Report 2014-2015
An important component of funding for the capital program
is debt provided through the Connecticut Health and Educational
Facilities Authority (CHEFA) which allows the University to
borrow at tax exempt rates. This funding source is critical to
keeping the cost of funding at lower levels which allows the
University to maximize the use of its resources in the fulfillment of
its mission of teaching and research. The University continues to
draw bond proceeds from the $250 million (Series 2014A) issued in
fiscal year 2015 through CHEFA to finance planned renovation and
capital additions. The University continues to receive the highest
bond ratings available: AAA from Standard and Poor’s and Aaa
from Moody’s.
The University made a significant investment in the biological
and physical sciences with the renovation of the Sterling Chemistry
Laboratory to improve teaching and research space, accessibility,
and safety. The renovation includes a new, two-level structure
accommodating ten chemistry and ten biology teaching labs and
support, with a new mechanical penthouse and partial basement.
It also includes a new roof at the south end of the building, and
extends the new mechanical, electrical, and plumbing systems
to the entire building. The total investment equaled 17% of the
University’s capital spending for the year.
The University’s ambitious renovation and building plans
were funded by a combination of gifts, debt, and increasingly,
funds from the operating budget. The University continues to rely
heavily on the extraordinary generosity of its alumni and friends.
During fiscal year 2015, the University utilized $86 million of
gifts on hand to fund capital projects. The University has been
the beneficiary of an outstanding response from donors. The
construction of the new residential colleges 13/14, renovation of
the Adams Center (Hendrie Hall), completion of the Sterling
Memorial Library Nave Restoration and Exterior Renovation
and completion of the President’s House have been funded
substantially through gifts.

11
Endowment
The Endowment provides the largest source of support for the
academic programs of the University. To balance current and
future needs, Yale employs investment and spending policies
designed to preserve Endowment asset values while providing a
substantial flow of income to the Operating Budget. At June 30,
2015, net assets in the Endowment totaled approximately $25.6
billion, after the allocation of Endowment spending of $1.1 billion
to the Operating Budget during the year.
Investment Performance
For the fiscal year ending June 30, 2015, the Endowment
earned an 11.5% investment return. During the past decade, the
Endowment earned an annualized 10.0% return, which added
$7.1 billion of value relative to a composite passive benchmark
and $8.5 billion relative to the mean return of a broad universe of
colleges and universities.
Growth of $1,000 Invested in the Yale Endowment 2005 – 2015
’05 ’06 ’07 ’08 ’09 ’10 ’11 ’12 ’13 ’14 ’15
EndowmentMean of Broad Universe of Colleges and UniversitiesInflation
$3,000
$2,500
$2,000
$1,500
$1,000
$500
$0
Unrestricted25%
Professorships24%
Maintenance4%
Books3%
Miscellaneousspecific purposes27%
Scholarships17%
Endowment Spending Allocation, Fiscal Year 2015
Endowment Spending
The Endowment spending policy, which allocates Endowment
earnings to operations, balances the competing objectives of
providing a stable flow of income to the Operating Budget
and protecting the real value of the Endowment over time.
The spending policy manages the trade-off between these two
objectives by using a long-term target spending rate combined
with a smoothing rule, which adjusts spending in any given year
gradually in response to changes in Endowment market value.
The target spending rate approved by the Yale Corporation
currently stands at 5.25%. According to the smoothing rule,
Endowment spending in a given year sums to 80% of the
previous year’s spending and 20% of the targeted long-term
spending rate applied to the market value two years prior. The
spending amount determined by the formula is adjusted for
inflation and constrained so that the calculated rate is at least
4.5% and not more than 6.0% of the Endowment’s market value.
The smoothing rule and the diversified nature of the Endowment
mitigate the impact of short-term market volatility on the flow of
funds to support Yale’s operations.

12 Yale University Financial Report 2014-2015
Asset Allocation
Asset allocation proves critical to successful Endowment
performance. Yale’s asset allocation policy combines tested theory
and informed market judgment to balance investment risks with
the desire for high returns.
Both the need to provide resources for current operations
and the desire to preserve the purchasing power of assets
dictate investing for high returns, which leads the Endowment
to be weighted toward equity. In addition, the Endowment’s
vulnerability to inflation directs the University away from fixed
income and toward equity instruments. Hence, over 90% of the
Endowment is invested in assets expected to produce equity-
like returns, through domestic and international securities, real
assets, and private equity.
Over the past twenty-five years, Yale significantly reduced
the Endowment’s exposure to traditional domestic marketable
securities, reallocating assets to nontraditional asset classes. In
1990, approximately seventy percent of the Endowment was
committed to US stocks, bonds, and cash. Today, domestic
marketable securities account for approximately one-eighth of
the portfolio, and foreign equity, private equity, absolute return
strategies, and real assets represent around seven-eighths of the
Endowment.
The heavy allocation to nontraditional asset classes stems from
the diversifying power they provide to the portfolio as a whole.
Alternative assets, by their nature, tend to be less efficiently priced
than traditional marketable securities, providing an opportunity to
exploit market inefficiencies through active management. Today’s
portfolio has significantly higher expected returns and lower
volatility than the 1990 portfolio.
Asset Class June 30, 2015 Current TargetAbsolute Return 20.5% 21.5%Domestic Equity 3.9% 4.0%Fixed Income 4.9% 8.5%Foreign Equity 14.7% 14.5%Leveraged Buyouts 16.2% 16.0%Venture Capital 16.3% 14.0%Real Estate 14.0% 13.0%Natural Resources 6.7% 8.5%Cash 2.8% 0.0%Total 100.0% 100.0%

13
20%
15%
10%
5%
0%
Yale Return Active Benchmark Passive Benchmark
Yale Endowment Annualized Returns vs. Benchmarks by Asset Class Net of Fees, Ten Years Ended June 30, 2015
Absolute Return Domestic Equity Fixed Income Foreign Equity Venture Capital* Real Estate* Natural Resources*
*Yale’s returns are money-weighted.
Endowment Summary
Yale continues to rely on the principles of equity orientation and diversification. These principles continue to guide Yale’s investment
strategy, as equity orientation makes sense for investors with long time horizons and diversification allows the construction of
portfolios with superior risk and return characteristics. The University’s equity-oriented, well-diversified portfolio positions the
Endowment for long-term investment success.
Active BenchmarksAbsolute Return: Credit Suisse CompositeDomestic Equity: Frank Russell Median Manager, US EquityFixed Income: Frank Russell Median Manager, Fixed IncomeForeign Equity: Frank Russell Median Manager Composite, Foreign EquityLeveraged Buyouts: Cambridge Associates Leveraged Buyouts CompositeVenture Capital: Cambridge Associates Global Venture CapitalReal Estate: Cambridge Associates Real EstateNatural Resources: Cambridge Associates Natural Resources
Passive BenchmarksAbsolute Return: Barclays 9-12 Mo TreasuryDomestic Equity: Wilshire 5000Fixed Income: LB Treasury Index through June 2008, Barclays 1-5 Year Treasury from July 2008 to September 2014, Barclays 1-3 Year Treasury after
September 2014Foreign Equity: MSCI EAFE Investable Market Index / MSCI Emerging Markets Investable Market Index + MSCI China A-Share Investable Market Index,
weighted according to target developed and emerging equity allocationsLeveraged Buyouts: Russell 2000 (75%) / MSCI ACWI ex-US Small-Cap Index (25%)Venture Capital: Russell 2000 Technology (100%) through June 2010. Russell 2000 Technology (75%) / MSCI China Small Cap (17%) / MSCI India
Small Cap (8%) thereafterReal Estate: MSCI US REIT IndexNatural Resources: Custom Timber REIT basket / S&P OG Exploration & Production Index / Euromoney Global Mining Index, weighted according to
target timber, oil and gas, and mining allocations, respectively
LeveragedBuyouts*

PricewaterhouseCoopers LLP, 185 Asylum Street, Suite 2400, Hartford, CT 06103T: (860) 241 7000, F: (860) 241 7590, www.pwc.com/us
Independent Auditor’s Report
To the President and Fellows of Yale University:
We have audited the accompanying consolidated financial statements of Yale University (the “University”), which comprise the consolidated statement of financial position as of June 30, 2014, and the related consolidated statements of activities and of cash flows for the year then ended.
Management’s Responsibility for the Consolidated Financial Statements
Management is responsible for the preparation and fair presentation of the consolidated financial statements in accordance with accounting principles generally accepted in the United States of America; this includes the design, implementation, and maintenance of internal control relevant to the preparation and fair presentation of consolidatedfinancial statements that are free from material misstatement, whether due to fraud or error.
Auditor’s Responsibility
Our responsibility is to express an opinion on the consolidated financial statements based on our audit. We conducted our audit in accordance with auditing standards generally accepted in the United States of America. Those standards require that we plan and perform the audit to obtain reasonable assurance about whether the consolidated financial statements are free from material misstatement. An audit involves performing procedures to obtain audit evidence about the amounts and disclosures in the consolidated financial statements. The procedures selected depend on our judgment, including the assessment of the risks of material misstatement of the consolidated financial statements,whether due to fraud or error. In making those risk assessments, we consider internal control relevant to the University’s preparation and fair presentation of the consolidated financial statements in order to design audit procedures that are appropriate in the circumstances, but not for the purpose of expressing an opinion on theeffectiveness of the University’s internal control. Accordingly, we express no such opinion. An audit also includesevaluating the appropriateness of accounting policies used and the reasonableness of significant accounting estimates made by management, as well as evaluating the overall presentation of the consolidated financial statements. We believe that the audit evidence we have obtained is sufficient and appropriate to provide a basis for our audit opinion.
Opinion
In our opinion, the consolidated financial statements referred to above present fairly, in all material respects, the consolidated financial position of the University at June 30, 2014, and the changes in its net assets and its cash flows for the year then ended in accordance with accounting principles generally accepted in the United States of America.
Other Matters
We have previously audited the University’s 2013 financial statements, and we expressed an unmodified audit opinion on those audited financial statements in our report dated October 24, 2013. In our opinion, the summarized comparative information presented herein as of and for the year ended June 30, 2013 is consistent, in all material respects, with the audited financial statements from which it has been derived.As discussed in Note 1q to the accompanying financial statements, in 2014, the University adopted Accounting Standard Update 2012-05, Statement of Cash Flows.
October 22, 2014
Report of Independent Auditors
To the President and Fellows ofYale University:
In our opinion, the accompanying consolidated statement of financial position and the relatedconsolidated statements of activities and of cash flows present fairly, in all material respects, thefinancial position of Yale University (the "University") as of June 30, 2012, and the changes in its netassets and its cash flows for the year then ended, in conformity with accounting principles generallyaccepted in the United States of America. These financial statements are the responsibility of theUniversity’s management. Our responsibility is to express an opinion on these financial statementsbased on our audit. The prior year summarized comparative information has been derived from theUniversity's 2011 financial statements and in our report dated October 21, 2011, we expressed anunqualified opinion on those financial statements. We conducted our audit of these statements inaccordance with auditing standards generally accepted in the United States of America and thestandards applicable to financial audits contained in Government Auditing Standards, issued by theComptroller General of the United States. Those standards require that we plan and perform theaudit to obtain reasonable assurance about whether the financial statements are free of materialmisstatement. An audit includes examining, on a test basis, evidence supporting the amounts anddisclosures in the financial statements, assessing the accounting principles used and significantestimates made by management, and evaluating the overall financial statement presentation. Webelieve that our audit provides a reasonable basis for our opinion.
October 23, 2012
PricewaterhouseCoopers LLP, 185 Asylum Street, Suite 2400, Hartford, CT 06103T: (860) 241 7000, F: (860) 241 7590, www.pwc.com/us
Independent Auditor’s Report
To the President and Fellows of Yale University:
We have audited the accompanying consolidated financial statements of Yale University (the “University”), which comprise the consolidated statement of financial position as of June 30, 2015, and the related consolidated statements of activities and of cash flows for the year then ended.
Management’s Responsibility for the Consolidated Financial StatementsManagement is responsible for the preparation and fair presentation of the consolidated financial statements in accordance with accounting principles generally accepted in the United States of America; this includes the design, implementation, and maintenance of internal control relevant to the preparation and fair presentation of consolidated financial statements that are free from material misstatement, whether due to fraud or error.
Auditor’s ResponsibilityOur responsibility is to express an opinion on the consolidated financial statements based on our audit. We conducted our audit in accordance with auditing standards generally accepted in the United States of America. Those standards require that we plan and perform the audit to obtain reasonable assurance about whether the consolidated financial statements are free from material misstatement.
An audit involves performing procedures to obtain audit evidence about the amounts and disclosures in the consolidated financial statements. The procedures selected depend on our judgment, including the assessment of the risks of material misstatement of the consolidated financial statements, whether due to fraud or error. In making those risk assessments, we consider internal control relevant to the University’s preparation and fair presentation of the consolidated financial statements in order to design audit procedures that are appropriate in the circumstances, but not for the purpose of expressing an opinion on the effectiveness of the University’s internal control. Accordingly, we express no such opinion. An audit also includes evaluating the appropriateness of accounting policies used and the reasonableness of significant accounting estimates made by management, as well as evaluating the overall presentation of the consolidated financial statements. We believe that the audit evidence we have obtained is sufficient and appropriate to provide a basis for our audit opinion.
OpinionIn our opinion, the consolidated financial statements referred to above present fairly, in all material respects, the consolidated financial position of the University as of June 30, 2015, and the changes in its net assets and its cash flows for the year then ended in accordance with accounting principles generally accepted in the United States of America.
Other MattersWe have previously audited the University’s 2014 financial statements, and we expressed an unmodified audit opinion on those audited financial statements in our report dated October 22, 2014. In our opinion, the summarized comparative information presented herein as of and for the year ended June 30, 2014 is consistent, in all material respects, with the audited financial statements from which it has been derived.
October 21, 2015
14 Yale University Financial Report 2014-2015

15
Yale University Consolidated Statement of Financial PositionJune 30, 2015 with comparative totals for June 30, 2014 ($ in thousands)
The accompanying notes are an integral part of these consolidated financial statements.
2015 2014Assets:Cash and cash equivalents $ 288,077 $ 234,915 Accounts receivable, net 199,382 173,659 Contributions receivable, net 508,615 434,340 Notes receivable 131,413 129,569 Investments, at fair value 31,192,504 28,988,699 Other assets 156,027 162,104 Land, buildings and equipment, net of accumulated depreciation 4,510,303 4,412,751 Total assets $ 36,986,321 $ 34,536,037
Liabilities: Accounts payable and accrued liabilities $ 359,901 $ 348,853 Advances under grants and contracts and other deposits 101,932 92,888 Other liabilities 1,160,876 955,704 Liabilities under split-interest agreements 114,606 119,180 Bonds and notes payable 3,572,441 3,332,845 Liabilities associated with investments 4,259,954 3,853,822 Advances from Federal government for student loans 31,438 31,912 Total liabilities 9,601,148 8,735,204 Net assets: non-controlling interests 287,574 289,300 Net assets: Yale University 27,097,599 25,511,533 Total net assets 27,385,173 25,800,833 Total liabilities and net assets $ 36,986,321 $ 34,536,037
Temporarily Permanently Unrestricted Restricted Restricted 2015 2014 Detail of net assets: Endowment and funds functioning as endowment $ 3,864,823 $ 18,261,904 $ 3,444,863 $ 25,571,590 $ 23,894,719 Student loans 3,821 - 41,295 45,116 42,573 Gifts for building construction - 370,258 - 370,258 411,089 General operating 647,816 462,819 - 1,110,635 1,163,152Net assets: Yale University 4,516,460 19,094,981 3,486,158 27,097,599 25,511,533 Net assets: Non-controlling interest 287,574 - - 287,574 289,300 Total net assets $ 4,804,034 $ 19,094,981 $ 3,486,158 $ 27,385,173 $ 25,800,833

16 Yale University Financial Report 2014-2015
Yale University Consolidated Statement of ActivitiesJune 30, 2015 with comparative totals for the year ended June 30, 2014 ($ in thousands)
The accompanying notes are an integral part of these consolidated financial statements.
Temporarily Permanently Unrestricted Restricted Restricted 2015 2014 Operating Revenues and reclassifications: Net tuition, room and board $ 315,772 $ - $ - $ 315,772 $ 287,088 Grant and contract income, primarily for research and training 673,731 - - 673,731 670,981 Medical services income 786,541 - - 786,541 699,527 Contributions 24,508 238,511 - 263,019 138,245 Allocation of endowment spending from financial capital 326,837 755,639 - 1,082,476 1,041,456 Other investment income 69,205 8,014 - 77,219 99,655 Publications income 31,574 - - 31,574 31,926 Other income 151,623 - - 151,623 141,077 Total revenues 2,379,791 1,002,164 - 3,381,955 3,109,955 Net assets released from restrictions 855,195 (855,195) - - - Total revenues and reclassifications 3,234,986 146,969 - 3,381,955 3,109,955
Expenses: Instruction and departmental research 885,492 - - 885,492 869,591 Organized research 494,588 - - 494,588 481,848 Patient care and other related services 745,919 - - 745,919 664,821 Libraries and other academic support 287,805 - - 287,805 297,321 Student aid and services 400,530 - - 400,530 396,721 Public service 142,936 - - 142,936 132,579 Administration and other institutional support 230,338 - - 230,338 216,039 Total expenses 3,187,608 - - 3,187,608 3,058,920 Increase in net assets from operating activities 47,378 146,969 - 194,347 51,035 Non-operating Contributions 1,304 34,486 102,731 138,521 208,151 Total endowment return 427,404 2,144,835 7,176 2,579,415 4,037,639 Allocation of endowment spending to operations (175,929) (907,759) 1,212 (1,082,476) (1,041,456) Other investment gain (loss) (132,577) 12,818 - (119,759) (26,582) Change in funding status of defined benefit plans (119,262) - - (119,262) 53,007 Other (decreases) increases (34,347) 4,970 24,657 (4,720) (44,451) Net assets released from restrictions 35,602 (35,602) - - - Increase in non-operating activities 2,195 1,253,748 135,776 1,391,719 3,186,308 Total increase in net assets - Yale University 49,573 1,400,717 135,776 1,586,066 3,237,343 Change in non-controlling interests (1,726) - - (1,726) 106,607 Total increase in net assets 47,847 1,400,717 135,776 1,584,340 3,343,950 Net assets, beginning of year 4,756,187 17,694,264 3,350,382 25,800,833 22,456,883 Net assets, end of year $ 4,804,034 $ 19,094,981 $ 3,486,158 $ 27,385,173 $ 25,800,833

17
Yale University Consolidated Statement of Cash Flows June 30, 2015 with comparative totals for the year ended June 30, 2014 ($ in thousands)
2015 2014Operating activities: Change in net assets $ 1,584,340 $ 3,343,950 Adjustments to reconcile change in net assets to net cash used in operating activities: Depreciation and amortization 263,590 253,948 Unrealized loss (gain) on other investments 74,129 (23,452) Net endowment investment gain (2,256,615) (3,448,766) Change in non-controlling interests 1,726 (106,607) Restricted contributions (138,521) (192,551) Contributed securities (54,112) (58,883) Proceeds from sale of donated securities 11,255 37,180 Other adjustments (2,891) 28,649 Changes in assets and liabilities that provide (use) cash: Accounts receivable (25,723) 8,717 Contributions receivable (108,092) (9,000) Other operating assets 5,340 (11,079) Accounts payable and accrued expenses 1,288 (6,501) Advances under grants and contracts and other deposits 9,044 3,546 Other liabilities 205,172 3,163 Net cash used in operating activities (430,070) (177,686)
Investing activities: Student loans repaid 15,549 12,741 Student loans granted (16,467) (12,972) Purchases related to capitalized software costs and other assets (24,576) (19,878) Proceeds from sales and maturities of investments 11,838,554 7,233,751 Purchases of investments (11,455,465) (6,720,940) Purchases of land, buildings and equipment (331,172) (316,487) Net cash provided by investing activities 26,423 176,215
Financing activities: Proceeds from restricted contributions 172,337 186,667 Proceeds from sale of contributed securities restricted for endowment 42,857 21,703 Contributions received for split-interest agreements 10,373 6,515 Payments made under split-interest agreements (13,126) (12,303) Proceeds from long-term debt 250,000 250,000 Repayments of long-term debt (6,325) (506,031) Interest earned and advances from Federal government for student loans 693 733 Net cash provided by (used in) financing activities 456,809 (52,716)
Net increase (decrease) in cash and cash equivalents 53,162 (54,187)Cash and cash equivalents, beginning of year 234,915 289,102Cash and cash equivalents, end of year $ 288,077 $ 234,915
The accompanying notes are an integral part of these consolidated financial statements.

18 Yale University Financial Report 2014-2015
1. Significant Accounting Policies
a. GeneralYale University (“the University”) is a private, not-for-profit institution of higher education located in New Haven, Connecticut. The University is governed by the Yale Corporation (the “Corporation”), a body of nineteen Trustees consisting of the President, ten Successor Trustees who are Successors to the original Trustees, six Alumni Fellows, and the Governor and Lieutenant Governor of Connecticut, ex officio. The University provides educational services primarily to students and trainees at the undergraduate, graduate and postdoctoral levels, and performs research, training and other services under grants, contracts and other similar agreements with agencies of the Federal government and other sponsoring organizations. The University’s academic organization includes Yale College, the Graduate School of Arts and Sciences, twelve professional schools and a variety of research institutions and museums. The largest professional school is the Yale School of Medicine, which conducts medical services in support of its teaching and research missions. The University has been granted tax exempt status under section 501(c)(3) of the Internal Revenue Code.
b. Basis of PresentationThe consolidated financial statements of the University include the accounts of all academic and administrative departments of the University, and affiliated organizations that are controlled by the University. Financial statements of private, not-for-profit organizations measure aggregate net assets and net asset activity based on the absence or existence of donor-imposed restrictions. Net assets are reported as unrestricted, temporarily restricted and permanently restricted and serve as the foundation of the accompanying consolidated financial statements. Brief definitions of the three net asset classes are presented below:
Unrestricted Net Assets ‑ Net assets derived from tuition and other institutional resources that are not subject to explicit donor-imposed restrictions. Unrestricted net assets also include gains on board designated funds functioning as endowment.
Temporarily Restricted Net Assets ‑ Net assets subject to explicit donor-imposed restrictions on the expenditure of contributions or income and gains on contributed assets and net assets from endowments not yet appropriated for spending by the governing board. When temporary restrictions expire due to the passage of time or the incurrence of expenditures that fulfill the donor-imposed restrictions, temporarily restricted net assets are reclassified to unrestricted net assets. Temporarily restricted net assets are established with restricted contributions from donors and restricted income generated from endowments. In addition, temporarily restricted net assets include restricted contributions from donors
classified as funds functioning as endowment. Restrictions include support of specific schools or departments of the University, for professorships, research, faculty support, scholarships and fellowships, library and art museums, building construction and other purposes.
Permanently Restricted Net Assets – Permanently restricted net assets include donor restricted endowments and student loan funds.
The University records as permanently restricted net assets the original amount of gifts which donors have given to be maintained in perpetuity (“donor restricted endowment funds”). For financial reporting purposes, all subsequent accumulated gains on such donor restricted endowment funds that are not classified as permanently restricted net assets are recorded as temporarily restricted net assets until appropriated for expenditure by the Corporation through the application of the endowment spending policy. The Corporation understands its policies on retaining and spending from endowment to be consistent with the requirements of Connecticut law.
Measure of Operations – The University’s measure of operations as presented in the consolidated statement of activities includes revenue from tuition (net of certain scholarships and fellowships) and fees, grants and contracts, medical services, contributions for operating programs, the allocation of endowment spending for operations and other revenues. Operating expenses are reported on the consolidated statement of activities by functional categories, after allocating costs for operation and maintenance of plant, interest on indebtedness and depreciation expense. The University’s non-operating activity within the consolidated statement of activities includes contributions, investment returns and other activities related to endowment, long term benefit plan funding, student loan net assets utilized for long-term investment purposes and other activities related to land, buildings and equipment that are not part of the University’s measure of operations.
Capital Replacement Equilibrium – Recognizing the critical importance of maintaining its physical capital over many generations, the University allocates funds directly from the operating budget to a capital maintenance account. The annual equilibrium funding target for internal purposes is an estimate that is reserved from annual operating funding sources to maintain Yale’s facilities in good condition on a consistent basis, thus avoiding deferred maintenance. While not an exact science, an estimate of the full capital replacement equilibrium level for 2015 is $184.2 million (unaudited). In 2015, the large majority of this amount was funded with operating funds and capital gifts, with the remainder, $14.6 million (unaudited) funded through an internal bank. Total renovations for the year were $210.8 million.
c. Cash and Cash EquivalentsCash and cash equivalents are recorded at cost which approximates fair value and include institutional money market funds and similar temporary investments with maturities of three months or less at the time of purchase. Cash and cash equivalents awaiting investment in the long term investment pool are reported as investments and
Yale University Notes to Consolidated Financial Statements

19
totaled $412.8 million and $169.8 million at June 30, 2015 and 2014, respectively. Cash and cash equivalents do not include cash balances held as collateral. Supplemental disclosures of cash flow information include the following, in thousands of dollars:
2015 2014Cash paid during the year for: Interest $ 143,313 $ 158,790Noncash investing activities: Land, buildings and equipment purchases payable to vendor $ 9,760 $ (11,988)
d. InvestmentsFair Value – The University’s investments are recorded in the consolidated financial statements at fair value.
Fair value is a market-based measurement based on assumptions that market participants would use in pricing an asset or liability. As a basis for considering assumptions, a three-tier fair value hierarchy has been established which prioritizes the inputs used in measuring fair value. The hierarchy of inputs used to measure fair value and the primary methodologies used by the University to measure fair value include:
• Level 1 – Quoted prices for identical assets and liabilities in active markets. Market price data is generally obtained from relevant exchange or dealer markets.
• Level 2 – Inputs, other than the quoted prices in active markets, that are observable either directly or indirectly, such as quoted prices for similar assets or liabilities, quoted prices in markets that are not active, or other inputs that are observable.
• Level 3 – Unobservable inputs in which there is little or no market data, requiring the University to develop its own assumptions.
Assets and liabilities measured at fair value are determined based on the following valuation techniques:
• Market approach – Prices and other relevant information generated by market transactions involving identical or comparable assets or liabilities; and
• Income approach – Techniques to convert future amounts to a single present amount based on market expectations (including present value techniques and option-pricing models).
The fair value of publicly traded fixed income and equity securities is based upon quoted market prices and exchange rates, if applicable. The fair value of direct real estate investments is determined from periodic valuations prepared by independent appraisers. Investments are exposed to various risks, such as interest rate, market and credit risks. Due to the level of risk associated with certain investments, it is at least reasonably possible that changes in the values of investments will occur in the near term and that such changes could materially affect the amounts reported in the University’s financial statements.
Derivatives – Derivative financial instruments in the investment portfolio include interest rate swaps, equity swaps, credit default swaps, commodity swap contracts and currency forward contracts which are recorded at fair value with the resulting gain or loss recognized in the consolidated statement of activities.
Resell and Repurchase Agreements – Cash paid in connection with resell agreements are generally collateralized by federal agency and foreign debt securities. The University takes possession of the underlying collateral and monitors the value of the underlying collateral to the amount due under the agreement. Cash received under repurchase agreements are collateralized by investments in asset backed, corporate debt, federal agency and foreign debt securities. Collateral market value is monitored to the amounts due under the agreements.
Management Fees – The University records the cost of managing its endowment portfolio as a decrease in non-operating activity within the applicable net asset class in the consolidated statement of activities. Management fees consist of the internal costs of the Investments Office, outside custodian fees and fees for external investment managers and general partners.
Total Return – The University invests its endowment portfolio and allocates the related earnings for expenditure in accordance with the total return concept. A distribution of endowment return that is independent of the cash yield and appreciation of investments earned during the year is provided for program support. The University has adopted an endowment spending policy designed specifically to stabilize annual spending levels and to preserve the real value of the endowment portfolio over time. The spending policy attempts to achieve these two objectives by using a long-term targeted spending rate combined with a smoothing rule, which adjusts spending gradually to changes in the endowment market value. An administrative charge is assessed against the funds when distributed. The University uses a long-term targeted spending rate of 5.25%. The spending amount is calculated using 80% of the previous year’s spending and 20% of the targeted long-term spending rate applied to the market value two years prior. The actual rate of spending for 2015 and 2014, when measured against the previous year’s June 30th endowment market value, was 4.5% and 5.0%, respectively. The University determines the expected return on endowment investments with the objective of producing a return exceeding the sum of inflation and the target spending rate. Asset allocation is the key factor driving expected return. Yale’s asset allocation policy combines tested theory and informed market judgment to balance investment risks with the need for high returns. Both the need to provide resources for current operations and the desire to preserve the purchasing power of assets leads the endowment to be weighted toward equity. The University manages the majority of its endowment in the University Long Term Investment Pool (“the Pool”). The Pool is unitized and allows for efficient investment among a diverse group

20 Yale University Financial Report 2014-2015
Foreign students account for approximately 10% (unaudited) of the undergraduate population. Net tuition revenue from undergraduate enrollment represents approximately 63.6% of total net tuition revenue in 2015. The University maintains a policy of offering qualified applicants admission to Yale College without regard to financial circumstance, as well as meeting in full the demonstrated financial need of those admitted. Student need in all programs throughout the University is generally fulfilled through a combination of scholarships and fellowships, loans and employment during the academic year. Tuition, room and board revenue has been reduced by certain scholarships and fellowships in the amounts of $262.0 million and $254.3 million in 2015 and 2014, respectively.
k. ContributionsUnconditional promises to give that are expected to be collected within one year are recorded at their net realizable value. Amounts expected to be collected in future years are recorded at the present value of estimated future cash flows, which includes estimates for potential uncollectible receivables. The discount on those contributions is computed using an interest rate that reflects fair value applicable to the year in which the promise is received. Amortization of the discount is included in contribution revenue. Conditional promises to give are not recorded as support until such time as the conditions are substantially met. A facilities and administrative charge is assessed against current use gifts when received.
l. Grant and Contract IncomeThe University receives grant and contract income from governmental and private sources. In 2015 and 2014, grant and contract income received from the Federal government totaled $507.1 million and $512.6 million, respectively. The University recognizes revenue associated with the direct costs of sponsored programs as the related qualified costs are incurred. Recovery of facilities and administrative costs of Federally sponsored programs is at rates negotiated with the University’s cognizant agency, the Department of Health and Human Services.
m. Medical Services IncomeThe University has agreements with third-party payers, including health maintenance organizations that provide payment for medical services at amounts different from standard rates established by the University. Medical services income is reported net of contractual allowances from third-party payers and others for services rendered, and further adjusted for estimates of uncollectible amounts.
n. Net Assets Released from RestrictionsReclassification of net assets is based upon the satisfaction of the purpose for which the net assets were restricted or the completion of a time stipulation. Restricted operating activity including contributions and net investment return earned, which are restricted, are reported as temporarily restricted support and reclassified to unrestricted when any donor- imposed restrictions are satisfied. Non-operating restricted net assets associated with building costs are reclassified to unrestricted net assets when the capital asset is placed in service.
of funds with varying restricted purposes. In addition to University funds, the Pool includes assets of affiliated entities where the University has established investment management agreements.
e. Land, Buildings and EquipmentLand, buildings and equipment are generally stated at cost. Buildings leased under capital leases are recorded at the lower of the net present value of the minimum lease payments or the fair value of the leased asset at the inception of the lease. Annual depreciation is calculated on a straight-line basis over useful lives, or over the lease term for capital leases, ranging from 15 to 50 years for buildings and improvements and 4 to 15 years for furnishings and equipment.
f. Other AssetsCapitalized software and bond issuance costs are included in other assets in the consolidated statement of financial position. Capitalized software costs are amortized on a straight line basis over the estimated useful lives of the software, ranging from 5 to 10 years. Bond issue costs are amortized over the term of the related debt.
g. CollectionsCollections at Yale include works of art, literary works, historical treasures and artifacts that are maintained in the University’s museums and libraries. These collections are protected and preserved for public exhibition, education, research and the furtherance of public service. Collections are not capitalized; purchases of collection items are recorded as operating expenses in the University’s consolidated financial statements in the period in which the items are acquired.
h. Split-Interest AgreementsThe University’s split-interest agreements with donors consist primarily of charitable gift annuities, pooled income funds and irrevocable charitable remainder trusts for which the University serves as trustee. Assets are invested and payments are made to donors and/or other beneficiaries in accordance with the respective agreements. Contribution revenues for charitable gift annuities and charitable remainder trusts are recognized at the date the agreements are established. In addition, the fair value of the estimated future payments to be made to the beneficiaries under these agreements is recorded as a liability. For pooled income funds, contribution revenue is recognized upon establishment of the agreement at the fair value of the estimated future receipts, discounted for the estimated time period until culmination of the agreement.
i. Beneficial Interest in Trust AssetsThe University is the beneficiary of certain perpetual trusts and charitable remainder trusts held and administered by others. The estimated fair values of trust assets are recognized as assets and as gift revenue when reported to the University.
j. Net Tuition, Room and BoardTuition, room and board revenue is generated from an enrolled student population of approximately 12,300. The undergraduate population of approximately 5,500 is a diverse group attracted from across the United States and from many foreign countries.
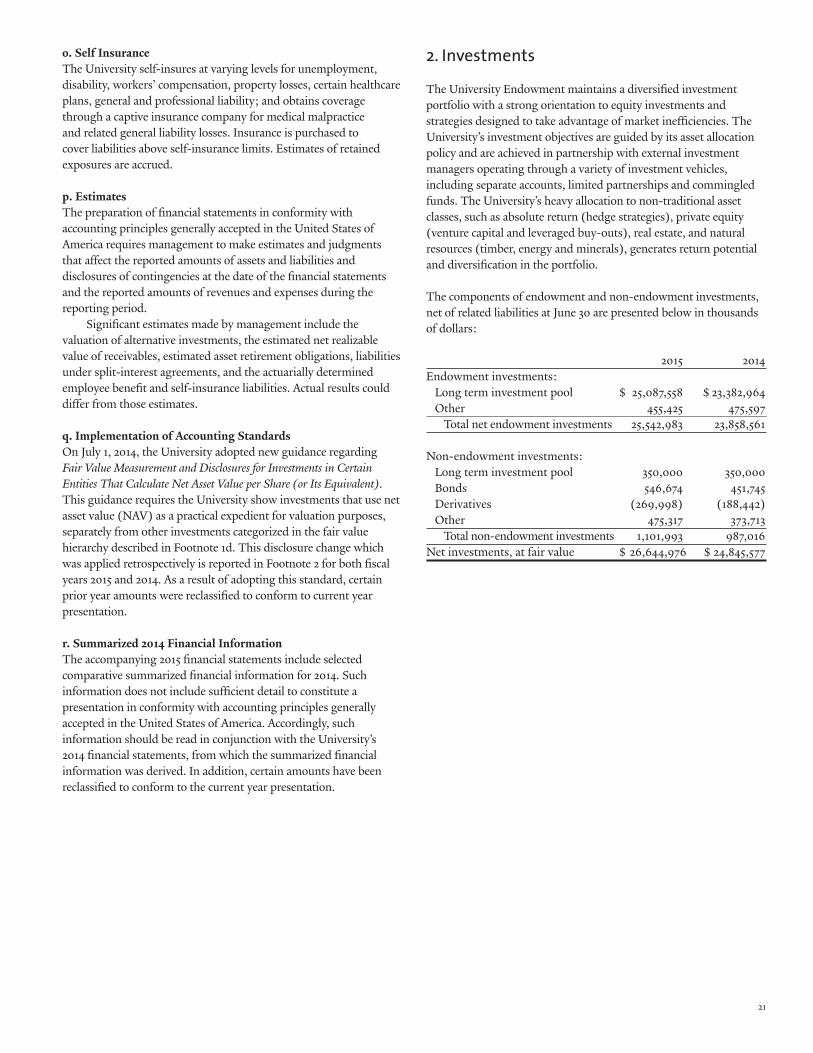
21
o. Self InsuranceThe University self-insures at varying levels for unemployment, disability, workers’ compensation, property losses, certain healthcare plans, general and professional liability; and obtains coverage through a captive insurance company for medical malpractice and related general liability losses. Insurance is purchased to cover liabilities above self-insurance limits. Estimates of retained exposures are accrued.
p. EstimatesThe preparation of financial statements in conformity with accounting principles generally accepted in the United States of America requires management to make estimates and judgments that affect the reported amounts of assets and liabilities and disclosures of contingencies at the date of the financial statements and the reported amounts of revenues and expenses during the reporting period. Significant estimates made by management include the valuation of alternative investments, the estimated net realizable value of receivables, estimated asset retirement obligations, liabilities under split-interest agreements, and the actuarially determined employee benefit and self-insurance liabilities. Actual results could differ from those estimates.
q. Implementation of Accounting StandardsOn July 1, 2014, the University adopted new guidance regarding Fair Value Measurement and Disclosures for Investments in Certain Entities That Calculate Net Asset Value per Share (or Its Equivalent). This guidance requires the University show investments that use net asset value (NAV) as a practical expedient for valuation purposes, separately from other investments categorized in the fair value hierarchy described in Footnote 1d. This disclosure change which was applied retrospectively is reported in Footnote 2 for both fiscal years 2015 and 2014. As a result of adopting this standard, certain prior year amounts were reclassified to conform to current year presentation.
r. Summarized 2014 Financial InformationThe accompanying 2015 financial statements include selected comparative summarized financial information for 2014. Such information does not include sufficient detail to constitute a presentation in conformity with accounting principles generally accepted in the United States of America. Accordingly, such information should be read in conjunction with the University’s 2014 financial statements, from which the summarized financial information was derived. In addition, certain amounts have been reclassified to conform to the current year presentation.
2. Investments
The University Endowment maintains a diversified investment portfolio with a strong orientation to equity investments and strategies designed to take advantage of market inefficiencies. The University’s investment objectives are guided by its asset allocation policy and are achieved in partnership with external investment managers operating through a variety of investment vehicles, including separate accounts, limited partnerships and commingled funds. The University’s heavy allocation to non-traditional asset classes, such as absolute return (hedge strategies), private equity (venture capital and leveraged buy-outs), real estate, and natural resources (timber, energy and minerals), generates return potential and diversification in the portfolio. The components of endowment and non-endowment investments, net of related liabilities at June 30 are presented below in thousands of dollars:
2015 2014Endowment investments: Long term investment pool $ 25,087,558 $ 23,382,964 Other 455,425 475,597 Total net endowment investments 25,542,983 23,858,561 Non-endowment investments: Long term investment pool 350,000 350,000 Bonds 546,674 451,745 Derivatives (269,998) (188,442) Other 475,317 373,713 Total non-endowment investments 1,101,993 987,016Net investments, at fair value $ 26,644,976 $ 24,845,577

22 Yale University Financial Report 2014-2015
As described in Note 1d, investments are recorded at fair value. The following table summarizes the fair values of the University’s investments by major type and related liabilities as of June 30, in thousands of dollars:
Level 1 Level 2 Level 3 2015 2014Investments, at fair value: Cash and cash equivalents $ 1,230,720 $ 108,523 $ - $ 1,339,243 $ 590,476 Fixed income: US government securities 2,144,606 83,733 70 2,228,409 1,984,623 Foreign government securities 74,773 93,209 - 167,982 101,992 Corporate and other securities 78,383 2,285,100 281,545 2,645,028 2,079,498 Total fixed income 2,297,762 2,462,042 281,615 5,041,419 4,166,113 Common stock: Domestic 1,308,977 79,940 61,235 1,450,152 1,083,332 Foreign 1,709,084 108,130 146,772 1,963,986 1,864,936 Total common stock 3,018,061 188,070 208,007 3,414,138 2,948,268 Other equity investments: Foreign equity - - 352,190 352,190 296,226 Venture capital - - 83,592 83,592 126,246 Natural resources - 277,060 419,199 696,259 1,424,877 Total other equity investments - 277,060 854,981 1,132,041 1,847,349 Other investments 414,058 732,887 295,454 1,442,399 1,427,535 Total leveled investments $ 6,960,601 $ 3,768,582 $ 1,640,057 12,369,240 10,979,741 Investments at NAV 18,823,264 18,008,958 Total investments, at fair value 31,192,504 28,988,699 Liabilities associated with investments: Securities sold, not yet purchased $ 421,366 $ 192,972 $ - 614,338 717,679 Repurchase agreements - 1,400,819 - 1,400,819 1,234,722 Other liabilities 507,606 576,508 1,160,683 2,244,797 1,901,421 Total liabilities associated with investments $ 928,972 $ 2,170,299 $ 1,160,683 4,259,954 3,853,822Non-controlling interests 287,574 289,300 Net investments, at fair value $ 26,644,976 $ 24,845,577
While not part of a leveling category, fair values for certain investments held are based on the net asset value (NAV) of such investments as determined by the respective external investment managers, including general partners, if market values are not readily ascertainable. These valuations necessarily involve assumptions and methods that are reviewed by the University’s Investments Office. Investments at NAV as of June 30, in thousands include:
2015 2014Absolute return $ 4,002,409 $ 3,050,087 Domestic 589,988 578,367 Foreign 963,756 942,471 Leveraged buyout 4,275,111 4,720,094 Natural resources 921,888 839,177 Real estate 3,764,516 4,381,236 Venture capital 4,305,596 3,497,526 Total investments, at NAV $ 18,823,264 $ 18,008,958
Assets and liabilities of investment companies that are controlled by the University are consolidated for reporting purposes. Certain consolidated subsidiaries are controlled but not wholly owned by the University. The portion of a consolidated entity net assets that is not owned by the University is reported as a non-controlling interest.
The fair value of consolidated investment company assets and liabilities included in the University financial statements, in thousands of dollars, include:
2015 2014Consolidated Investment Company Assets $ 4,951,329 $ 4,358,079Consolidated Investment Company Liabilities 2,494,975 2,139,386 $ 2,456,354 $ 2,218,693

23
Level 3 investments are valued by the University or by investment managers of investment companies using valuation techniques standard in the industry in which they operate. The Yale Investments Office reviews these valuation methods and evaluates the appropriateness of these valuations each year. In certain circumstances, when the general partner does not provide a valuation or the valuation provided is not considered appropriate, the Investments Office will determine those values. The following table summarizes quantitative inputs and assumptions used for Level 3 investments at June 30, 2015 for which fair value is based on unobservable inputs that are not developed by the external managers. Significant increases or decreases in these unobservable inputs may result in significantly higher or lower valuation results.
The valuation process for investments at NAV and those categorized in Level 3 of the fair value hierarchy includes evaluating the operations and valuation procedures of the managers of the Investment Companies and the transparency of those processes through background and reference checks, attendance at investor meetings and periodic site visits. In determining the fair value of investments, Investments Office staff reviews periodic investor reports, interim and annual audited financial statements received from the Investment Companies, material quarter over quarter changes in valuation and assesses the impact of macro market
Fair Value Valuation Significant WeightedAsset Class (in 000’s) Technique Unobservable Input Range Average
Equity Securities $ 643,789 Market comparables Multiple of EBITDA 8.2 - 11.7 9.5 Enterprise value to revenue 1.9 1.9 Discount rate 12.0% 12.0% Recent transaction NA NA Discount for potential tax liability 0.0% - 15.0% 10.0% Dealer pricing Indicative quotes 0.0 - 17.02 1.1 Fixed Income Securities $ 281,615 Market comparables Enterprise value/EBITDA 6.0x - 11.7x 9.6x Illiquidity discount 3.0% 3.0% Discount rate 25.0% 25.0% Liquidation model Recovery rate-accounts receivable 80.0% 80.0% Recovery rate-equipment 10.0% - 50.0% 31.0% Recovery rate-land 100.0% 100.0% Recovery rate-litigation 0.0% - 25.0% 13.0% Recovery rate-other non-current assets 50.0% - 100.0% 59.0% Discounted cash flow Discount rate 23.0% - 28.0% 26.0% Counterparty default risk 12.0% 12.0% Multiparty independent pricing Indicative quotes 21.1 - 444.6 106.0 Dealer pricing Indicative quotes 0.0 - 111.4 93.0 Natural Resources $ 419,199 Discounted cash flow Discount rate 8.0% - 10.0% 8.0% Market comparable sale Discount on public security 0.0% - 25.0% 4.5% Dividend yield 6.2% - 6.7% 6.4% Discount for litigation risk 0.0% - 50.0% 25.0% Trusts $ 193,652 Net present value Discount rate 3.3% 3.3% Other Investments $ 101,802 Various methods Liabilities $ (1,160,683) Various methods University pooled unit market value $ 3,278.9 $ 3,278.9
factors on the performance. The Investments Office meets with the Investment Committee quarterly to review investment transactions and monitor performance of the managers of these Investment Companies.
Realized gains and losses are reported in total endowment return, net of fees. Included in net realized and unrealized gain in Level 3 reported below were unrealized (losses) gains that relate to assets held at June 30, 2015 and 2014 of ($291.6) million and $458.6 million, respectively.

24 Yale University Financial Report 2014-2015
The transfers out of Level 3 consist primarily of investments reclassified from Level 3 to Investments at NAV due to the use of the practical expedient for certain limited partnerships.
Agreements with investment companies include certain redemption terms and restrictions as noted in the following table:
Unfunded Fair Value CommitmentAsset Class (in 000’s) Remaining Life (in 000’s) Redemption Terms Redemption Restrictions
Absolute Return $ 4,002,409 No Limit $ 7,953 Redemption terms range Lock-up provisions range from monthly with 30 from none to 5 years. days notice to annually with 90 days notice.
Domestic Equity 589,988 No Limit - Redemption terms range Lock-up provisions range from monthly with 3 days from none to 7 years. notice to annually with 90 days notice.
Foreign Equity 1,315,946 No Limit 16,500 Redemption terms range Lock-up provisions range from monthly with 15 from none to 7 years. days notice to closed end structures not available for redemption.
Leveraged Buyout 4,275,111 1-10 years 2,050,086 Closed end funds not Not redeemable. eligible for redemption.
Venture Capital 4,389,188 1-10 years 1,031,249 Closed end funds not Not redeemable. eligible for redemption.
Real Estate 3,764,516 1-10 years 1,312,853 Closed end funds not Not redeemable. eligible for redemption.
Natural Resources 1,618,147 1-35 years 405,908 Closed end funds not Not redeemable. eligible for redemption.Total $ 19,955,305 $ 4,824,549
The table below presents the change in fair value measurements for the University’s Level 3 investments during the year ended June 30, in millions of dollars:
Foreign Venture Natural Equity Capital Resources Other Liabilities 2015 2014
Beginning balance $296 $126 $1,425 $886 $(1,018) $1,715 $1,273 Realized and unrealized gain, net 54 16 (150) 44 - (36) 735 Purchases 2 5 - 654 (146) 515 234 Sales - (1) (143) (742) 2 (884) (484) Transfers in - - - 34 (1) 33 65 Transfers out - (62) (713) (91) 2 (864) (108)
Ending balance $352 $84 $419 $785 $(1,161) $479 $1,715

25
The University has various sources of internal liquidity at its disposal, including cash, cash equivalents and marketable debt and equity securities. If called upon at June 30, 2015, management estimates that it could have liquidated approximately $4.1 billion of investments within 90 days (unaudited) to meet short-term needs. The University enters into resell agreements (where securities are purchased under agreements to resell) and into repurchase agreements (where securities are sold under an agreement to repurchase). All resell agreements and repurchase agreements are carried at their contractual value which approximates fair value. Resell and repurchase agreements are presented gross in the University statement of financial position as investment assets and liabilities associated with investments. The table below illustrates the net exposure for these financial instruments at June 30, 2015, in thousands of dollars, where enforceable netting agreements are in place:
Assets LiabilitiesResell and repurchase agreements $ 353,217 $ 1,400,819 Amounts contractually eligible for offset (326,042) (326,042)Collateral (22,072) (1,074,777)Net exposure for resell and repurchase agreements $ 5,103 $ -
Fixed income securities of $774.4 million were provided at June 30, 2015 to collateralize securities sold, not yet purchased.
The University may employ derivatives and other strategies to (1) manage against market risks, (2) arbitrage mispricings of related securities and (3) replicate long or short positions more cost effectively. The University does not invest in derivatives for speculation. The fair value of derivative positions held at June 30, 2015 and related gain (loss) for the year, in thousands of dollars, were as follows: Assets Liabilities Gain (Loss)Endowment: Credit default swaps $ 120,791 $ (65,114) $ (1,793) Interest rate swaps 13,812 (96,263) (15,430) Other 97,864 (31,120) 203,905 232,467 (192,497) 186,682Other: Interest rate swaps - (261,578) (113,977) Energy swaps - (8,420) (12,147) - (269,998) (126,124)Gross value of derivatives 232,467 (462,495) $ 60,558Other-counterparty netting (136,527) 136,527 Net collateral (received)/posted (46,157) 295,864 Total net exposure for derivatives $ 49,783 $ (30,104)
Derivatives are reported as other assets and other liabilities for fair value leveling purposes. The University initiates derivatives under legally enforceable master netting agreements. The net exposure for derivatives is presented above net of these master netting agreements and required collateral.
Credit default swapsCredit default swaps are used to simulate long or short positions that are unavailable in the market or to reduce credit risk where exposure exists. The buyer of a credit default swap is obligated to pay to the seller a periodic stream of payments over the term of the contract in return for a contingent payment upon occurrence of a contracted credit event. As of June 30, 2015, the total notional amount of credit default swap contracts for buy protection amounts to $1.9 billion and the notional amount related to sell protection is $1.4 billion.
Interest rate swapsInterest rate swaps are used to manage exposure to interest rate fluctuations. The notional amount of contracts that pay based on fixed rates and receive based on variable rates at June 30, 2015 were $2,085.0 million. The notional amount of contracts that pay based on variable rates and receive based on fixed rates were $995.3 million at June 30, 2015.
Energy swapsEnergy swaps are used in connection with settling planned purchases of energy consumption and adjusting market exposures. Derivative assets are reported as investments in the consolidated statement of financial position and derivative liabilities are reported as liabilities associated with investments. Gains and losses on derivatives used for investing are reported as part of total endowment return and gains and losses related to University debt management and energy consumption are reported as other investment loss in the consolidated statement of activities as non-operating activity. Derivatives held by limited partnerships and commingled investment trusts in which Yale invests pose no off-balance sheet risk to the University due to the limited liability structure of the investments.

26 Yale University Financial Report 2014-2015
Certain investment transactions, including derivative financial instruments, necessarily involve counterparty credit exposure. Such exposure is monitored regularly by the University’s Investments Office in accordance with established credit policies and other relevant criteria. Collateral provided by Yale and its consolidated investment companies related to derivative transactions amounted to $367.6 million at June 30, 2015. Endowment investments include beneficial interests in outside trusts of $148.5 million and $156.0 million at June 30, 2015 and 2014, respectively. Non-endowment investments include CHEFA proceeds available for approved construction and campus renovation projects of $107.5 million at June 30, 2015. The following investments held under split-interest agreements are included in the endowment investment portfolio, in thousands of dollars: 2015 2014Charitable gift annuities $ 165,678 $ 153,930Charitable remainder trusts 115,870 117,164Pooled income funds 11,945 12,555 $ 293,493 $ 283,649
Split interest liabilities reported in the consolidated statement of financial position total $114.6 million and are recorded at fair value using Level 2 measurements.
A summary of the University’s total investment return as reported in the consolidated statement of activities is presented below, in thousands of dollars: 2015 2014Investment income $ 322,800 $ 588,873Realized and unrealized gain, net of investment management fees 2,256,615 3,448,766Total endowment return 2,579,415 4,037,639Other investment income (42,540) 73,073 $ 2,536,875 $ 4,110,712
Endowment investment returns totaling $1,082.5 million and $1,041.5 million were allocated to operating activities in 2015 and 2014, respectively, using the spending policy described in Note 1d.
3. Accounts Receivable
Accounts receivable from the following sources were outstanding at June 30, in thousands of dollars: 2015 2014Medical services, net $ 85,904 $ 67,669Grants and contracts 61,323 57,458Affiliated organizations 43,647 39,389 Publications 5,684 6,541Other 18,391 17,909 214,949 188,966Less: Allowance for doubtful accounts (15,567) (15,307) $ 199,382 $ 173,659
Medical services receivables are net of an allowance for contractual adjustments of $123.1 million and $114.3 million at June 30, 2015 and 2014, respectively. Collections for patient care services are primarily based on negotiated contracts from managed care companies (63%), Medicare (16%), and Medicaid (10%). In addition, payments are received directly from patients (6%) and commercial insurance and others (5%). The University assesses credit losses on all accounts receivable on a regular basis to determine the allowance for doubtful accounts. The University and Yale-New Haven Hospital (the “Hospital”) are parties to an affiliation agreement that establishes guidelines for the operation of activities between these two separate organizations. These guidelines set forth each organization’s responsibility under the common goal of delivering comprehensive patient care services. The University provides professional services from faculty of the Yale School of Medicine and a variety of other administrative and clinical services. The net receivable from the Hospital amounted to $33.0 million and $27.6 million at June 30, 2015 and 2014, respectively. Balances are settled in the ordinary course of business. The University recognized $217.9 million in revenue and incurred $73.7 million in expenses related to activities with the Hospital during the period ended June 30, 2015. In addition, the Hospital has invested $699.4 million in the University Long Term Investment Pool with a fair value at June 30, 2015 of $887.0 million. This balance is recorded as a liability associated with investments.
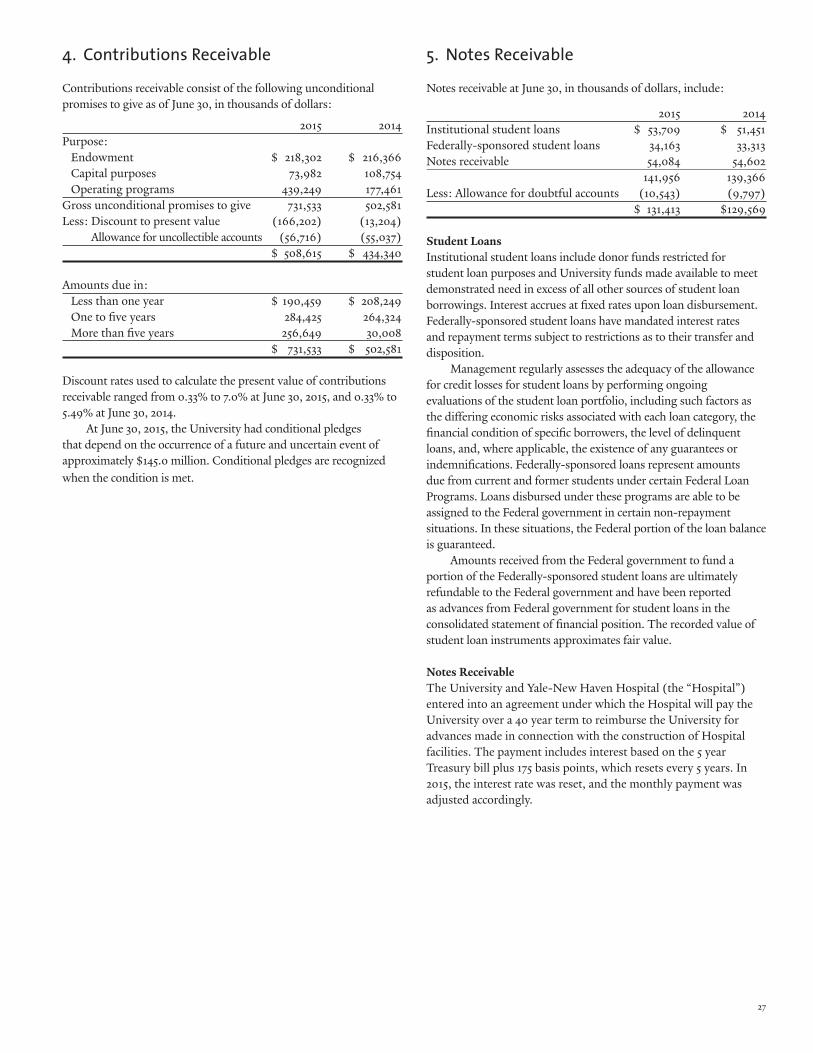
27
4. Contributions Receivable
Contributions receivable consist of the following unconditional promises to give as of June 30, in thousands of dollars:
2015 2014Purpose: Endowment $ 218,302 $ 216,366 Capital purposes 73,982 108,754 Operating programs 439,249 177,461Gross unconditional promises to give 731,533 502,581Less: Discount to present value (166,202) (13,204)
Allowance for uncollectible accounts (56,716) (55,037) $ 508,615 $ 434,340
Amounts due in: Less than one year $ 190,459 $ 208,249 One to five years 284,425 264,324 More than five years 256,649 30,008 $ 731,533 $ 502,581
Discount rates used to calculate the present value of contributions receivable ranged from 0.33% to 7.0% at June 30, 2015, and 0.33% to 5.49% at June 30, 2014. At June 30, 2015, the University had conditional pledges that depend on the occurrence of a future and uncertain event of approximately $145.0 million. Conditional pledges are recognized when the condition is met.
5. Notes Receivable
Notes receivable at June 30, in thousands of dollars, include:
2015 2014Institutional student loans $ 53,709 $ 51,451Federally-sponsored student loans 34,163 33,313 Notes receivable 54,084 54,602 141,956 139,366 Less: Allowance for doubtful accounts (10,543) (9,797) $ 131,413 $ 129,569
Student LoansInstitutional student loans include donor funds restricted for student loan purposes and University funds made available to meet demonstrated need in excess of all other sources of student loan borrowings. Interest accrues at fixed rates upon loan disbursement. Federally-sponsored student loans have mandated interest rates and repayment terms subject to restrictions as to their transfer and disposition. Management regularly assesses the adequacy of the allowance for credit losses for student loans by performing ongoing evaluations of the student loan portfolio, including such factors as the differing economic risks associated with each loan category, the financial condition of specific borrowers, the level of delinquent loans, and, where applicable, the existence of any guarantees or indemnifications. Federally-sponsored loans represent amounts due from current and former students under certain Federal Loan Programs. Loans disbursed under these programs are able to be assigned to the Federal government in certain non-repayment situations. In these situations, the Federal portion of the loan balance is guaranteed. Amounts received from the Federal government to fund a portion of the Federally-sponsored student loans are ultimately refundable to the Federal government and have been reported as advances from Federal government for student loans in the consolidated statement of financial position. The recorded value of student loan instruments approximates fair value.
Notes ReceivableThe University and Yale-New Haven Hospital (the “Hospital”) entered into an agreement under which the Hospital will pay the University over a 40 year term to reimburse the University for advances made in connection with the construction of Hospital facilities. The payment includes interest based on the 5 year Treasury bill plus 175 basis points, which resets every 5 years. In 2015, the interest rate was reset, and the monthly payment was adjusted accordingly.

28 Yale University Financial Report 2014-2015
8. Other Liabilities
Other liabilities consist of obligations of the University that will be paid over extended periods and consist of the following, in thousands of dollars:
2015 2014Employee benefit obligations $ 955,440 $ 763,309Compensated absences 64,097 65,173Asset retirement obligations 36,800 35,600Financial aid grant obligations 50,703 48,223Other 53,836 43,399 $ 1,160,876 $ 955,704
Included in employee benefit obligations are defined benefit plan liabilities in excess of plan assets. These liabilities amounted to $852.4 million at June 30, 2015 and $675.5 million at June 30, 2014. (See Note 11)
6. Other Assets
Other assets at June 30, in thousands of dollars, include:
2015 2014Software costs, net of accumulated amortization $ 66,514 $ 71,288Deferred expenses 37,364 34,169Insurance receivable 22,609 26,071Inventories 14,921 17,603Bond issue costs, net of accumulated amortization 14,619 12,973 $ 156,027 $ 162,104
Amortization expense included in operating expenses amounted to $24.2 million and $24.8 million in 2015 and 2014, respectively.
7. Land, Buildings and Equipment
Land, buildings and equipment at June 30, less accumulated depreciation, in thousands of dollars, are as follows:
2015 2014Land and real estate improvements $ 134,327 $ 131,892 Buildings 5,756,767 5,562,017Buildings under capital leases 61,665 61,665Equipment 665,964 638,752 6,618,723 6,394,326Less: Accumulated depreciation and amortization (2,400,179) (2,225,360) 4,218,544 4,168,966Construction in progress 291,759 243,785 $ 4,510,303 $ 4,412,751
Depreciation expense included in operating expenses amounted to $237.2 million and $226.9 million in 2015 and 2014, respectively. Amortization expense on capital lease assets amounted to $2.2 million in both 2015 and 2014.
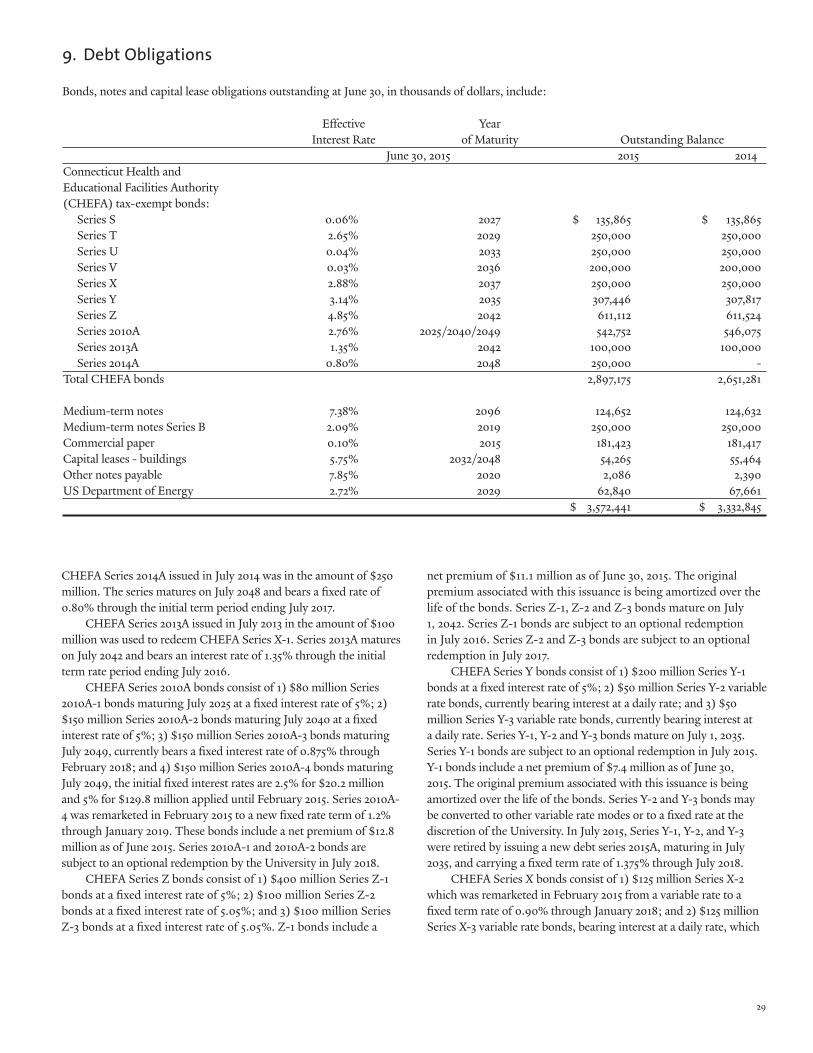
29
Effective Year Interest Rate of Maturity Outstanding Balance June 30, 2015 2015 2014Connecticut Health and Educational Facilities Authority (CHEFA) tax-exempt bonds: Series S 0.06% 2027 $ 135,865 $ 135,865 Series T 2.65% 2029 250,000 250,000 Series U 0.04% 2033 250,000 250,000 Series V 0.03% 2036 200,000 200,000 Series X 2.88% 2037 250,000 250,000 Series Y 3.14% 2035 307,446 307,817 Series Z 4.85% 2042 611,112 611,524 Series 2010A 2.76% 2025/2040/2049 542,752 546,075 Series 2013A 1.35% 2042 100,000 100,000 Series 2014A 0.80% 2048 250,000 - Total CHEFA bonds 2,897,175 2,651,281
Medium-term notes 7.38% 2096 124,652 124,632 Medium-term notes Series B 2.09% 2019 250,000 250,000 Commercial paper 0.10% 2015 181,423 181,417 Capital leases - buildings 5.75% 2032/2048 54,265 55,464 Other notes payable 7.85% 2020 2,086 2,390 US Department of Energy 2.72% 2029 62,840 67,661 $ 3,572,441 $ 3,332,845
9. Debt Obligations
Bonds, notes and capital lease obligations outstanding at June 30, in thousands of dollars, include:
CHEFA Series 2014A issued in July 2014 was in the amount of $250 million. The series matures on July 2048 and bears a fixed rate of 0.80% through the initial term period ending July 2017. CHEFA Series 2013A issued in July 2013 in the amount of $100 million was used to redeem CHEFA Series X-1. Series 2013A matures on July 2042 and bears an interest rate of 1.35% through the initial term rate period ending July 2016. CHEFA Series 2010A bonds consist of 1) $80 million Series 2010A-1 bonds maturing July 2025 at a fixed interest rate of 5%; 2) $150 million Series 2010A-2 bonds maturing July 2040 at a fixed interest rate of 5%; 3) $150 million Series 2010A-3 bonds maturingJuly 2049, currently bears a fixed interest rate of 0.875% through February 2018; and 4) $150 million Series 2010A-4 bonds maturing July 2049, the initial fixed interest rates are 2.5% for $20.2 million and 5% for $129.8 million applied until February 2015. Series 2010A-4 was remarketed in February 2015 to a new fixed rate term of 1.2% through January 2019. These bonds include a net premium of $12.8 million as of June 2015. Series 2010A-1 and 2010A-2 bonds are subject to an optional redemption by the University in July 2018. CHEFA Series Z bonds consist of 1) $400 million Series Z-1 bonds at a fixed interest rate of 5%; 2) $100 million Series Z-2 bonds at a fixed interest rate of 5.05%; and 3) $100 million Series Z-3 bonds at a fixed interest rate of 5.05%. Z-1 bonds include a
net premium of $11.1 million as of June 30, 2015. The original premium associated with this issuance is being amortized over the life of the bonds. Series Z-1, Z-2 and Z-3 bonds mature on July 1, 2042. Series Z-1 bonds are subject to an optional redemption in July 2016. Series Z-2 and Z-3 bonds are subject to an optional redemption in July 2017. CHEFA Series Y bonds consist of 1) $200 million Series Y-1 bonds at a fixed interest rate of 5%; 2) $50 million Series Y-2 variable rate bonds, currently bearing interest at a daily rate; and 3) $50 million Series Y-3 variable rate bonds, currently bearing interest at a daily rate. Series Y-1, Y-2 and Y-3 bonds mature on July 1, 2035. Series Y-1 bonds are subject to an optional redemption in July 2015. Y-1 bonds include a net premium of $7.4 million as of June 30, 2015. The original premium associated with this issuance is being amortized over the life of the bonds. Series Y-2 and Y-3 bonds may be converted to other variable rate modes or to a fixed rate at the discretion of the University. In July 2015, Series Y-1, Y-2, and Y-3 were retired by issuing a new debt series 2015A, maturing in July 2035, and carrying a fixed term rate of 1.375% through July 2018. CHEFA Series X bonds consist of 1) $125 million Series X-2 which was remarketed in February 2015 from a variable rate to a fixed term rate of 0.90% through January 2018; and 2) $125 million Series X-3 variable rate bonds, bearing interest at a daily rate, which
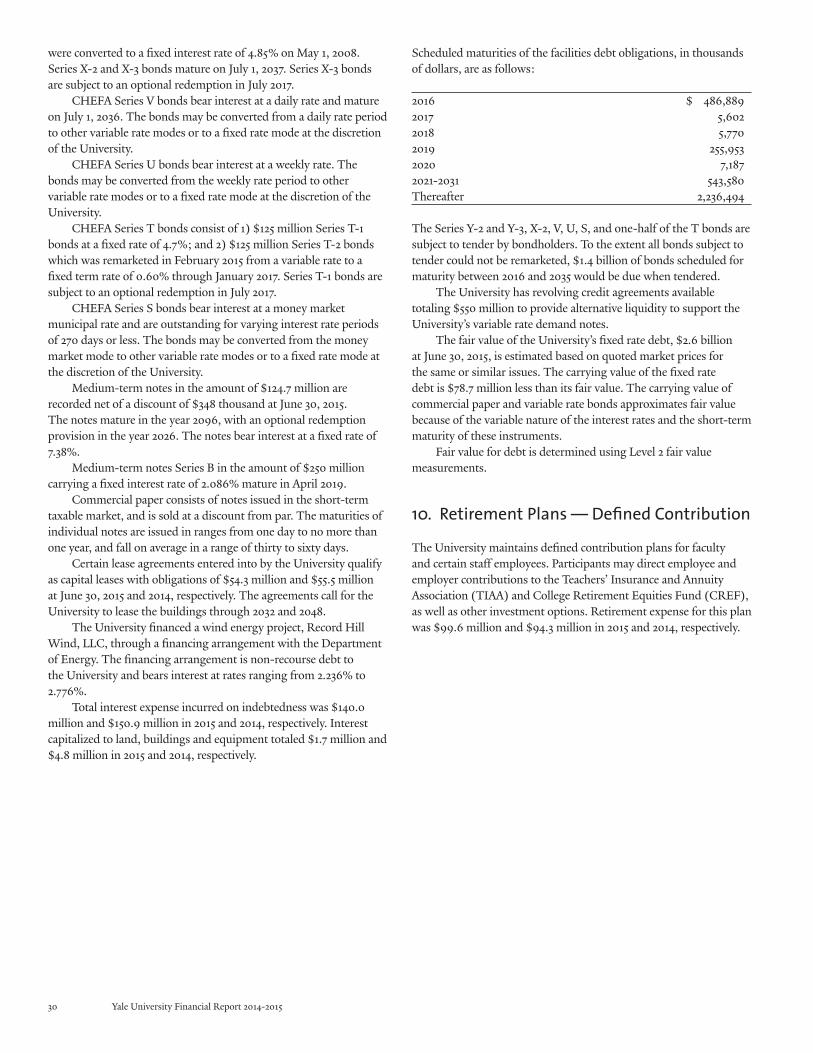
30 Yale University Financial Report 2014-2015
were converted to a fixed interest rate of 4.85% on May 1, 2008. Series X-2 and X-3 bonds mature on July 1, 2037. Series X-3 bonds are subject to an optional redemption in July 2017. CHEFA Series V bonds bear interest at a daily rate and mature on July 1, 2036. The bonds may be converted from a daily rate period to other variable rate modes or to a fixed rate mode at the discretion of the University. CHEFA Series U bonds bear interest at a weekly rate. The bonds may be converted from the weekly rate period to other variable rate modes or to a fixed rate mode at the discretion of the University. CHEFA Series T bonds consist of 1) $125 million Series T-1 bonds at a fixed rate of 4.7%; and 2) $125 million Series T-2 bonds which was remarketed in February 2015 from a variable rate to a fixed term rate of 0.60% through January 2017. Series T-1 bonds are subject to an optional redemption in July 2017. CHEFA Series S bonds bear interest at a money market municipal rate and are outstanding for varying interest rate periods of 270 days or less. The bonds may be converted from the money market mode to other variable rate modes or to a fixed rate mode at the discretion of the University. Medium-term notes in the amount of $124.7 million are recorded net of a discount of $348 thousand at June 30, 2015. The notes mature in the year 2096, with an optional redemption provision in the year 2026. The notes bear interest at a fixed rate of 7.38%. Medium-term notes Series B in the amount of $250 million carrying a fixed interest rate of 2.086% mature in April 2019. Commercial paper consists of notes issued in the short-term taxable market, and is sold at a discount from par. The maturities of individual notes are issued in ranges from one day to no more than one year, and fall on average in a range of thirty to sixty days. Certain lease agreements entered into by the University qualify as capital leases with obligations of $54.3 million and $55.5 million at June 30, 2015 and 2014, respectively. The agreements call for the University to lease the buildings through 2032 and 2048. The University financed a wind energy project, Record Hill Wind, LLC, through a financing arrangement with the Department of Energy. The financing arrangement is non-recourse debt to the University and bears interest at rates ranging from 2.236% to 2.776%. Total interest expense incurred on indebtedness was $140.0 million and $150.9 million in 2015 and 2014, respectively. Interest capitalized to land, buildings and equipment totaled $1.7 million and $4.8 million in 2015 and 2014, respectively.
Scheduled maturities of the facilities debt obligations, in thousands of dollars, are as follows:
2016 $ 486,889 2017 5,602 2018 5,770 2019 255,953 2020 7,187 2021-2031 543,580 Thereafter 2,236,494 The Series Y-2 and Y-3, X-2, V, U, S, and one-half of the T bonds are subject to tender by bondholders. To the extent all bonds subject to tender could not be remarketed, $1.4 billion of bonds scheduled for maturity between 2016 and 2035 would be due when tendered. The University has revolving credit agreements available totaling $550 million to provide alternative liquidity to support the University’s variable rate demand notes. The fair value of the University’s fixed rate debt, $2.6 billion at June 30, 2015, is estimated based on quoted market prices for the same or similar issues. The carrying value of the fixed rate debt is $78.7 million less than its fair value. The carrying value of commercial paper and variable rate bonds approximates fair value because of the variable nature of the interest rates and the short -term maturity of these instruments. Fair value for debt is determined using Level 2 fair value measurements.
10. Retirement Plans — Defined Contribution
The University maintains defined contribution plans for faculty and certain staff employees. Participants may direct employee and employer contributions to the Teachers’ Insurance and Annuity Association (TIAA) and College Retirement Equities Fund (CREF), as well as other investment options. Retirement expense for this plan was $99.6 million and $94.3 million in 2015 and 2014, respectively.

31
Pension Postretirement 2015 2014 2015 2014Change in benefit obligation:Benefit obligation, beginning of year $ 1,265,717 $ 1,148,031 $ 901,886 $ 851,451 Service cost, excluding assumed administration expenses 48,622 44,198 39,352 36,449 Interest cost 57,420 56,797 40,049 41,147 Benefit payments (38,143) (37,383) (26,598) (25,999) Assumption changes 37,341 55,460 104,439 12,528 Amendments - (9,552) - - Actuarial loss (gain) (351) 8,166 (18,405) (13,690)Benefit obligation, end of year $ 1,370,606 $ 1,265,717 $ 1,040,723 $ 901,886 Change in plan assets: Fair value, beginning of year $ 1,055,993 $ 903,164 $ 436,082 $ 392,123 Actual return on plan assets 58,672 133,219 29,761 63,160 University contributions 35,701 58,996 10,686 7,737 Benefits and expenses paid (40,366) (39,386) (27,623) (26,938)Fair value, end of year $ 1,110,000 $ 1,055,993 $ 448,906 $ 436,082 Funded Status $ (260,606) $ (209,724) $ (591,817) $ (465,804)
The following table sets forth the pension and postretirement plans’ funded status that is reported in the consolidated statement of financial position at June 30, in thousands of dollars:
11. Pension and Postretirement Plans — Defined Benefit
The University has a noncontributory, defined benefit pension plan for staff. The staff pension plan provides payments based on years of participation and the employee’s highest annual rate of earnings during the last five years of employment. In addition, the University provides postretirement benefits including health benefits based on years of service, life insurance and a pay-out of unused sick time. While the University’s subsidy of the cost of comprehensive health care benefits differs among retiree groups, substantially all employees who meet minimum age and service requirements and retire from the University are eligible for these benefits. Non faculty employees are paid 50% of unused sick time and receive life insurance benefits upon retirement from active status. The University uses a June 30th measurement date for its defined benefit plans.
Funded StatusThe funded status consists of the unfunded net periodic benefit costs recognized in operating activity and the change in funded status reported as non-operating activity. The components of the adjustment to non-operating results for the year ended June 30, 2015, in thousands of dollars, include:
Pension Postretirement TotalUnrecognized net actuarial loss $ 51,882 $ 85,591 $ 137,473Amortization of unrecognized obligation (10,535) (7,676) (18,211) $ 41,347 $ 77,915 $ 119,262
The cumulative amounts of these adjustments reported as deductions to net assets in the consolidated statement of financial position at June 30, 2015, in thousands of dollars, include:
Pension Postretirement TotalUnrecognized net actuarial loss $ 100,608 $ 239,747 $ 340,355Unrecognized prior service cost 34,503 1,312 35,815 $ 135,111 $ 241,059 $ 376,170
Amounts recorded as an adjustment at June 30, 2015 that are expected to be amortized into operating activity during fiscal year 2016, in thousands of dollars, include:
Pension Postretirement TotalPrior service cost $ 10,201 $ 1,191 $ 11,392Net actuarial loss 29 11,147 11,176 $ 10,230 $ 12,338 $ 22,568
Actuarial gains or losses and prior service costs resulting from plan amendments are amortized over the average remaining years of service of active participants.
Benefit ObligationThe benefit obligation represents the actuarial present value of future payments to plan participants for services rendered prior to that date, based on the pension benefit formula. In calculating the value, the participants’ compensation levels are projected to retirement. The accumulated benefit obligation differs from the benefit obligation above in that it does not consider assumptions about future compensation levels. It represents the actuarial present

32 Yale University Financial Report 2014-2015
Net periodic benefit costs are included as a part of operating expense.
Assumptions used in determining the net periodic benefit cost of the pension and postretirement plans are:
2015 2014Weighted-average discount rate 4.60% 5.00%Expected long-term rate of return 7.50% 7.50%Compensation increase 3.94% 4.52%Health care cost increase (pre-65/post-65) 7.25%/6.75% 7.50%/7.00%Ultimate trend rate (pre-65/post-65) 5.00%/5.00% 5.00%/5.00%Year ultimate trend rate is achieved 2020 2020Mortality RP2000CH, RP2000CH, Generational Generational Projection Projection
The health care cost trend rate assumption has a significant effect on the amounts reported. For the fiscal year ended June 30, 2015, a one percent change in the health care cost trend rate would cause the postretirement benefit obligation at June 30, 2015, to change by approximately 20.2% and would also cause the sum of the service cost and interest cost components of postretirement expense to change by approximately 19.3%.
value of future payments to plan participants using current and past compensation levels. The accumulated benefit obligation for the pension plan was $1,131.3 million at June 30, 2015 and $1,033.5 million at June 30, 2014. There were no significant plan amendments during the fiscal year ended June 30, 2015.
Assumptions used in determining the year end obligation of the pension and postretirement plans are:
2015 2014Weighted-average discount rate 4.75% 4.60%Increase in future compensation levels 3.77% 3.94%Projected health care cost trend rate (pre-65/post-65) 7.00%/5.40% 7.25%/6.75%Ultimate trend rate (pre-65/post-65) 5.00%/5.00% 5.00%/5.00%Year ultimate trend rate is achieved 2024 2020Mortality RP2014 RP2000CH, Aggregate, Generational Scale MP2014 Projection
Changes in assumptions during the year resulted in an increase to the pension benefit obligation and an increase to the postretirement benefit obligation at June 30, 2015, as follows, in thousands of dollars:
Pension Postretirement TotalMortality $ 83,234 $ 110,449 $ 193,683 Discount rate (34,072) (30,127) (64,199)Inflation (11,491) 48,776 37,285 Other demographic changes (330) (24,659) (24,989) $ 37,341 $ 104,439 $ 141,780
Inflation adjustments include salary trends and medical trend rates. Other demographic changes include retirement and termination rates and an update to spousal coverage.
Net Periodic Benefit CostNet periodic benefit cost for the plans includes the following components, in thousands of dollars:
Pension Postretirement 2015 2014 2015 2014Service cost $ 48,622 $ 44,198 $ 39,352 $ 36,449 Administrative expenses 2,000 1,900 900 700 Interest cost 57,420 56,797 40,049 41,147 Expected return on plan assets (72,880) (68,310) (29,656) (27,545)Net amortization: Prior service cost 10,535 9,971 1,283 1,434 Net loss - 460 6,393 7,986 Net periodic benefit cost $ 45,697 $ 45,016 $ 58,321 $ 60,171

33
Plan AssetsThe defined benefit plan assets are valued utilizing the same fair value hierarchy as the University’s investments as described in Note 1d.
The following table summarizes the fair values of investments by major type held by the staff pension plan at June 30, in thousands of dollars:
Level 1 Level 2 Level 3 2015 2014Investments, at fair value: Cash and cash equivalents $ 38,111 $ - $ - $ 38,111 $ 20,466 US government securities 98,567 - - 98,567 92,447 Equity investments: Domestic 63,202 - - 63,202 78,878 Foreign 8,629 84,656 - 93,285 113,000 Total equity investments 71,831 84,656 - 156,487 191,878 Limited partnerships: Natural resources - - 20,828 20,828 49,432 Total limited partnerships - - 20,828 20,828 49,432 Total leveled investments $ 208,509 $ 84,656 $ 20,828 313,993 354,223Investments at NAV 805,072 702,336 Total investments, at fair value 1,119,065 1,056,559Liabilities associated with investments $ 9,065 $ - $ - 9,065 12 Net investments, at fair value $ 1,110,000 $ 1,056,547
Level 1 Level 2 Level 3 2015 2014Investments, at fair value: Cash and cash equivalents $ 26,809 $ - $ - $ 26,809 $ 8,534 US government securities 12,834 - - 12,834 12,015 Equity investments: Domestic 14,375 - - 14,375 20,266 Foreign 4,154 32,817 - 36,971 49,393 Total equity investments 18,529 32,817 - 51,346 69,659 Limited partnerships: Natural resources - - 10,976 10,976 22,815 Total limited partnerships - - 10,976 10,976 22,815 Total leveled investments $ 58,172 $ 32,817 $ 10,976 101,965 113,023Investments at NAV 354,047 325,963 Total investments, at fair value 456,012 438,986 Liabilities associated with investments $ 5,012 $ - $ - 5,012 - Net investments, at fair value $ 451,000 $ 438,986
The following table summarizes the fair values of investments by major type held by the retiree health plan at June 30, in thousands of dollars:
The table below represents the change in fair value measurements for Level 3 investments held by the staff pension plan and the retiree health plan for the plans’ year ended June 30, 2015, in thousands of dollars:
Pension Retiree HealthBeginning balance $ 36,433 $ 19,742 Realized and unrealized loss, net (8,140) (4,156) Sales (7,465) (4,610)Ending balance $ 20,828 $ 10,976
The unrealized portion of the loss in Level 3 reported above that relates to assets held at June 30, 2015 by the staff pension plan and the retiree health plan, represents a net loss of $15.4 million and a net loss of $8.6 million, respectively. The investment objective for the pension and retiree health plans seeks a positive long-term total return after inflation to meet the University’s current and future plan obligations.
Asset allocations for both plans combine tested theory and informed market judgment to balance investment risks with the need for high returns.
Plan asset allocations by category at June 30 are as follows:
Pension Retiree Health 2015 2014 2015 2014Absolute return 24.7% 21.5% 23.7% 22.6%Domestic equity 9.8% 13.6% 9.7% 13.4%Fixed income 8.9% 8.7% 2.8% 2.7%Foreign equity 20.9% 21.3% 19.9% 19.6%Leveraged buyouts 8.6% 9.5% 9.1% 10.2%Venture capital 7.2% 4.3% 8.0% 3.9%Real estate 9.2% 11.3% 13.6% 16.2%Natural resources 7.9% 8.5% 7.9% 10.0%Cash 2.8% 1.3% 5.3% 1.4%
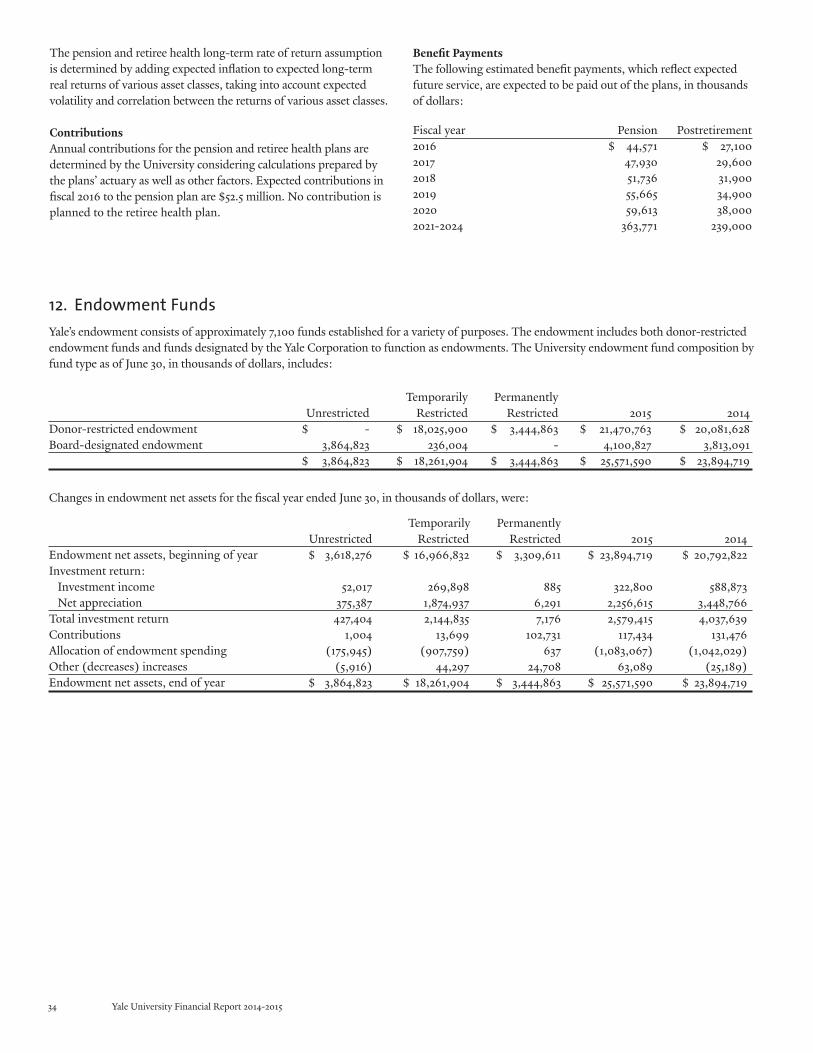
34 Yale University Financial Report 2014-2015
Temporarily Permanently Unrestricted Restricted Restricted 2015 2014Donor-restricted endowment $ - $ 18,025,900 $ 3,444,863 $ 21,470,763 $ 20,081,628 Board-designated endowment 3,864,823 236,004 - 4,100,827 3,813,091 $ 3,864,823 $ 18,261,904 $ 3,444,863 $ 25,571,590 $ 23,894,719
12. Endowment FundsYale’s endowment consists of approximately 7,100 funds established for a variety of purposes. The endowment includes both donor-restricted endowment funds and funds designated by the Yale Corporation to function as endowments. The University endowment fund composition by fund type as of June 30, in thousands of dollars, includes:
Temporarily Permanently Unrestricted Restricted Restricted 2015 2014Endowment net assets, beginning of year $ 3,618,276 $ 16,966,832 $ 3,309,611 $ 23,894,719 $ 20,792,822 Investment return: Investment income 52,017 269,898 885 322,800 588,873 Net appreciation 375,387 1,874,937 6,291 2,256,615 3,448,766 Total investment return 427,404 2,144,835 7,176 2,579,415 4,037,639 Contributions 1,004 13,699 102,731 117,434 131,476 Allocation of endowment spending (175,945) (907,759) 637 (1,083,067) (1,042,029)Other (decreases) increases (5,916) 44,297 24,708 63,089 (25,189)Endowment net assets, end of year $ 3,864,823 $ 18,261,904 $ 3,444,863 $ 25,571,590 $ 23,894,719
Changes in endowment net assets for the fiscal year ended June 30, in thousands of dollars, were:
The pension and retiree health long-term rate of return assumption is determined by adding expected inflation to expected long-term real returns of various asset classes, taking into account expected volatility and correlation between the returns of various asset classes.
Contributions Annual contributions for the pension and retiree health plans are determined by the University considering calculations prepared by the plans’ actuary as well as other factors. Expected contributions in fiscal 2016 to the pension plan are $52.5 million. No contribution is planned to the retiree health plan.
Benefit PaymentsThe following estimated benefit payments, which reflect expected future service, are expected to be paid out of the plans, in thousands of dollars:
Fiscal year Pension Postretirement2016 $ 44,571 $ 27,100 2017 47,930 29,600 2018 51,736 31,900 2019 55,665 34,900 2020 59,613 38,000 2021-2024 363,771 239,000

35
13. Commitments and Contingencies
The University is involved in various legal actions arising in the normal course of activities and is also subject to periodic audits and inquiries by various regulatory agencies. Although the ultimate outcome is not determinable at this time, management, after taking into consideration advice of legal counsel, believes that the resolution of these pending matters should not have a material adverse effect upon the University’s financial position.
Minimum lease commitments at June 30, 2015, under agreements to lease space, in thousands of dollars, are as follows:
Operating Lease Capital Lease Payments Payments2016 $ 9,256 $ 9,919 2017 7,580 9,756 2018 5,739 9,812 2019 5,602 9,870 2020 5,350 9,848 Thereafter 41,649 129,812 75,176 179,017 Executory costs - (83,934)Interest on capital leases - (40,818) $ 75,176 $ 54,265
The University has outstanding commitments on contracts to construct campus facilities in the amount of $616.1 million at June 30, 2015. Funding for these projects is expected to come from capital replacement reserves, gifts and future borrowing.
14. Subsequent Events
Management has evaluated subsequent events for the period after June 30, 2015, through October 21, 2015, the date the consolidated financial statements were available to be issued.
36 Yale University Financial Report 2014-2015
The President and Fellows of Yale University
The O∞cers of Yale University
PresidentPeter Salovey, A.B., M.A., PH.D.
FellowsHis Excellency the Governorof Connecticut, ex officio
Her Honor the Lieutenant Governorof Connecticut, ex officio
Joshua Bekenstein, B.A., M.B.A.Wayland, Massachusetts
Jeffrey Lawrence Bewkes, B.A., M.B.A.Old Greenwich, Connecticut
Maureen Cathy Chiquet, B.A.Purchase, New York
Francisco G. Cigarroa, B.S., M.D.San Antonio, Texas
Peter Brendan Dervan, B.S., PH.D.San Marino, California
Donna Lee Dubinsky, B.A., M.B.A.Portola Valley, California
Charles Waterhouse Goodyear IV, B.S., M.B.A.New Orleans, Louisiana
Catharine Bond Hill, B.A., M.A., PH.D.Poughkeepsie, New York
Paul Lewis Joskow, B.A., M.PHIL., PH.D.New York, New York
William Earl Kennard, B.A., J.D.Washington, D.C.
Margaret Hilary Marshall, B.A., M.A., J.D.Cambridge, Massachusetts
Gina Marie Raimondo, A.B., D.PHIL., J.D.Providence, Rhode Island
Emmett John Rice Jr., B.A., M.B.A.Bethesda, Maryland
Eve Hart Rice, B.S., M.D.Bedford, New York
Kevin Patrick Ryan, B.A., M.B.A.New York, New York
Douglas Alexander Warner III, B.A.Hobe Sound, Florida
PresidentPeter Salovey, A.B., M.A., PH.D.
ProvostBenjamin Polak, B.A., M.A., PH.D.
Secretary and Vice President for Student LifeKimberly M. Goff-Crews, B.A., J.D.
Vice President and General CounselAlexander E. Dreier, A.B., M.A., J.D.
Vice President for New Haven and State Affairs and Campus DevelopmentBruce Donald Alexander, B.A., J.D.
Vice President for Human Resources and AdministrationMichael Allan Peel, B.S., M.B.A.
Vice President for Alumni Affairs & DevelopmentJoan Elizabeth O’Neill, B.A.
Vice President for West Campus Planning & Program DevelopmentScott A. Strobel, B.S., M.B.A.
Vice President for Finance and Chief Financial OfficerStephen C. Murphy, B.A.

37
Sterling Memorial Library (SML) was built with funds from the bequest of John W. Sterling B.A. 1864, and designed by architect James Gamble Rogers B.A. 1889. SML opened in 1930. In designing the building, Rogers wanted the library to be centrally located on the Yale campus. He chose to incorporate the Collegiate Gothic style that was prevalent on campuses throughout the United States. The architec-tural elements in the entrance nave are reminiscent of gothic cathedral architecture. The windows of the nave, among the approximately 3,000 windows which were designed by G. Owen Bonawit, illustrate important events from the history of Yale and of New Haven.
The magnificent entrance nave in SML reopened to the public in August 2014, marking the completion of a major restoration project that has returned the nave to its original splendor and brought about improvements that will better serve the needs of library users in the twenty-first century. The restoration was made possible thanks to a generous gift from Richard Gilder ’54 and Lois Chiles, who made their gift in honor of President Emeritus Richard C. Levin ’74 PH.D. and Jane A. Levin ’75 PH.D.
“We all know that the library is the heart of the university,” said Yale University President Peter Salovey. “I am delighted that this beauti-ful and inspiring campus space has been renovated to provide better access to Yale’s world class collections, and to give students and scholars modern space to study and reflect under the watchful eye of the brilliantly restored painting, Alma Mater. I am doubly-pleased that the space was renovated in honor of Jane and Rick Levin.”
Photography by Michael Marsland, University Photographer

©2015 Yale University Design and Printing: Yale Printing & Publishing Services
Printed on recycled paper

Yale Bowl from one to 100 by Molly Lovett Simpson
designed by Yale alumnus Charles A. Ferry, Class of 1871.
ground broken in june of 1913 in a location 1.5 miles from Yale’s main campus in New Haven.
construction took 16 months with a crew of about 145 men.
the bowl was positioned so that the minor axis points to the sun at 3:00 pm on November 15.
This meant that no football player in the Bowl would ever have to look into the sun when Yale plays its big
games against Princeton and Harvard.
There are 30 portals (entrance ways) to the Bowl . Each portal is 7 feet wide by 8 feet high . Half
the structure and the playing field are below street level .
the bowl is 11 feet lower on the easterly side . Each of the portals was built on a
grade. The easterly portals slope up and the westerly portals slope down into the Bowl.
The Bowl project cost $750,000 . completed in november 1914, it was the largest
amphitheater to be constructed since the Roman Colosseum.
largest stadium in the world when built and the first football stadium in America to
completely surround the playing field. first game played in the Bowl was November 21, 1914; Yale vs.
Harvard (Harvard 36-0). Approximately 70,000 fans watched the first game played in the Bowl. The
largest crowd to attend a game at the Bowl was 80,000 for the yale-army game in 1923. Yale won
31-10 en route to an 8-0 season, 7-0 at the Bowl. The seating capacity of the Bowl is currently 61,466.
first televised game was November 19, 1949. Gray bleachers painted blue in 1959.
press box was built in 1987 after the wooden press box burned the morning after a game with
Dartmouth in November 1986.
The Bowl was designated a national historic landmark in 1987 . bowl restora-tion Phase I was completed in 2007; Phase II completed in 2009 with a dedication of the Kenney Center
and Jensen Plaza.

www .yale .edu/fr14-15