Y376 International Political Economy March 8, 2011.
27
Y376 International Political Economy March 8, 2011
-
Upload
todd-shelton -
Category
Documents
-
view
218 -
download
3
Transcript of Y376 International Political Economy March 8, 2011.

Y376 International Political Economy
March 8, 2011


Comparative Economic Sizes, in Current Billions of Dollars, 1995
$0 $200 $400 $600 $800 $1,000
Russia
Poland
Czech Rep.
Hungary
Bulgaria
Slovakia
Slovenia
Albania

Key Issues
• Why did the Cold War end?
• What were the different political and economic strategies being pursued by the transition economies?
• How successful were these strategies?
• What general lessons can be learned from the above?

The End of the Cold War
• The desire to end Stalinist oppression
• Inability to keep up with the United States and Western Europe economically and technologically
• Errors of judgment on the part of Soviet leaders, e.g.,– Chernobyl– Afghanistan

Dissidents
• Andrei Sakharov
• Nuclear Physicist
• Father of Soviet hydrogen bomb
• Human Rights advocate
Main Problems of Centrally Planned Economies in the 1980s
• Low growth rates
• Low productivity growth rates
• Slow diffusion of new technologies
• Consumer shortages
• Foreign currency shortages
• Declining purchasing power of exports

Figure 10-2. Average Annual Growth in Real GNP in the Soviet Union and Eastern Europe, 1961-1985
0
1
2
3
4
5
6
1966-70 1971-75 1976-80 1980-85
Source: Central Intelligence Agency, Handbook of Economic Statistics 1988 (Washington, D.C.: U.S. Government Printing Office, 1988), p. 33.

Slow Technology Diffusion
Stalin with a Zil Automobile

The New Russia
This is Saint Basil’sCathedral in Red Square in Moscow, symbolicof the centralizedpower of the RussianState. The building onnew churches in Moscowis symbolic of the endof Communism.

Figure 10-3. Annual Growth in GDP in the Russian Federation, 1981-2006, in Percentages
Source: World Bank, World Data '95 CD-ROM (Washington, D.C.: World Bank, 1995); World Bank, World Development Indicators 2008.

Russia Real GDP Growth, 2003-2010

Figure 10-5. Budget Deficit/GDP and Growth in Consumer Prices in the Former Soviet Union and Russia, 1985-2006, in
Percentages
Sources: Stanley Fischer, “Russia and the Soviet Union Then and Now,” in Oliver J. Blanchard, Kenneth A. Froot, and Jeffrey D. Sachs, eds., The Transition in Europe: Country Studies (Volume 1) (Chicago: University of Chicago Press, 1994), p. 234; and Keith Bush, The Russian Economy in March 2002 (Washington: Center for Strategic and International Studies, 2002).


Russian GDP Growth and Crude Oil Prices, 1999-2007

Figure 10-4. Annual Growth in GNP in Eastern Europe, 1986-2006, in Percentages
Source: World Bank, World Development Indicators 2008.

Figure 10-7. FDI Inflows in Billions of Current Dollars, 1990-2006
Source: World Bank, World Development Indicators 2008.

Figure 10-6. Long-Term Debt Outstanding in Russia and Three Countries in Eastern Europe in Billions of Current
Dollars, 1981-2006
Source: World Bank, World Development Indicators 2008.

Lessons Learned
• A fast economic transition (shock therapy) may be better than a slow one.
• In Russia, the transition was slow.
• In Poland, Hungary, and Czechoslovakia the transition was relatively more rapid.
• In Eastern Europe, the prospect of entry into the EU played a major role in both transition strategies and political reform.

Deng Xiaping’s 1978 Economic Reforms
• Household responsibility system
• Land use rights
• Township and Village Enterprises (TVEs)
• Special Economic Zones (SEZs)
Lester Thurow video

Example: Shenzhen SEZ

Real GDP Growth in China, 1961-2008
Source: World Bank, World Development Indicators 2008.
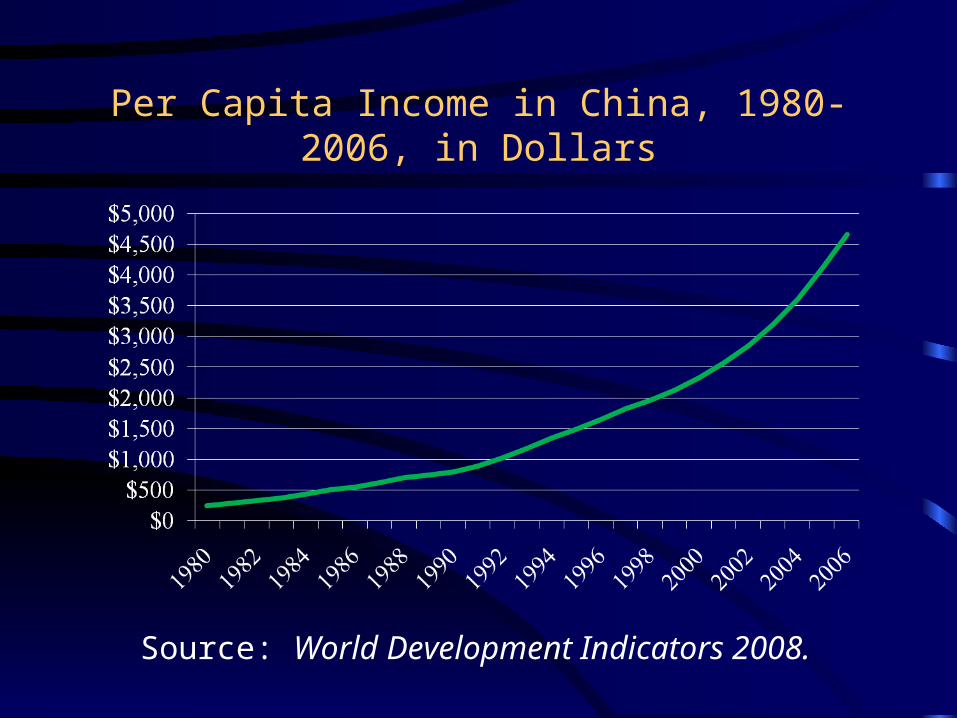
Per Capita Income in China, 1980-2006, in Dollars
Source: World Development Indicators 2008.
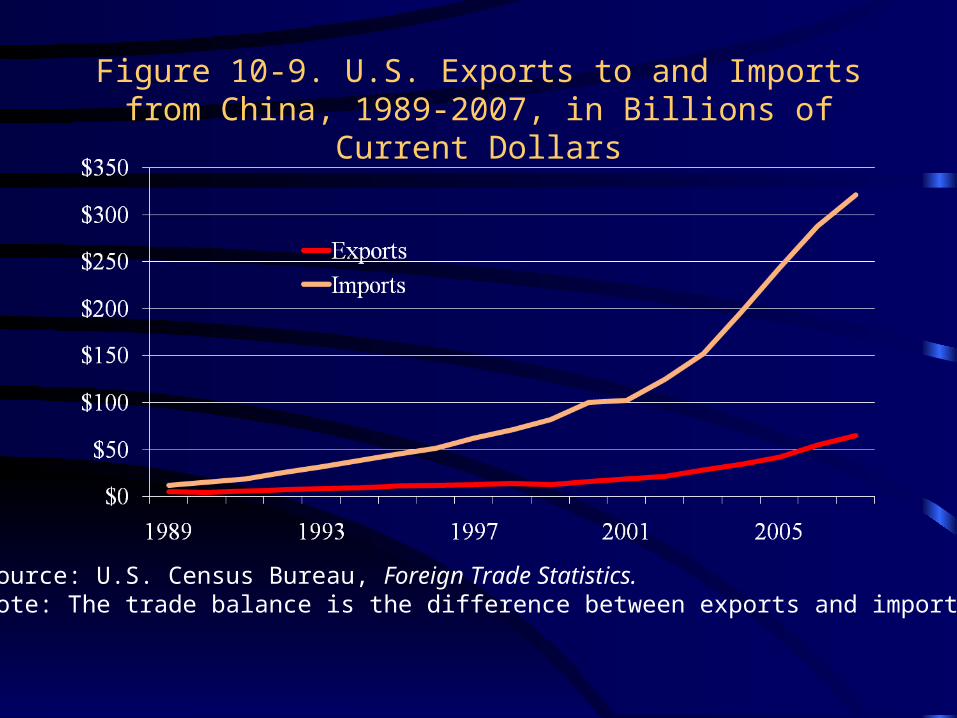
Figure 10-9. U.S. Exports to and Imports from China, 1989-2007, in Billions of Current Dollars
Source: U.S. Census Bureau, Foreign Trade Statistics.Note: The trade balance is the difference between exports and imports.

Figure 10-11. Inflows and Outflows of Foreign Direct Investment into and from China, 1982-2006, in Billions of
Current Dollars
Source: World Bank, World Development Indicators 2008.
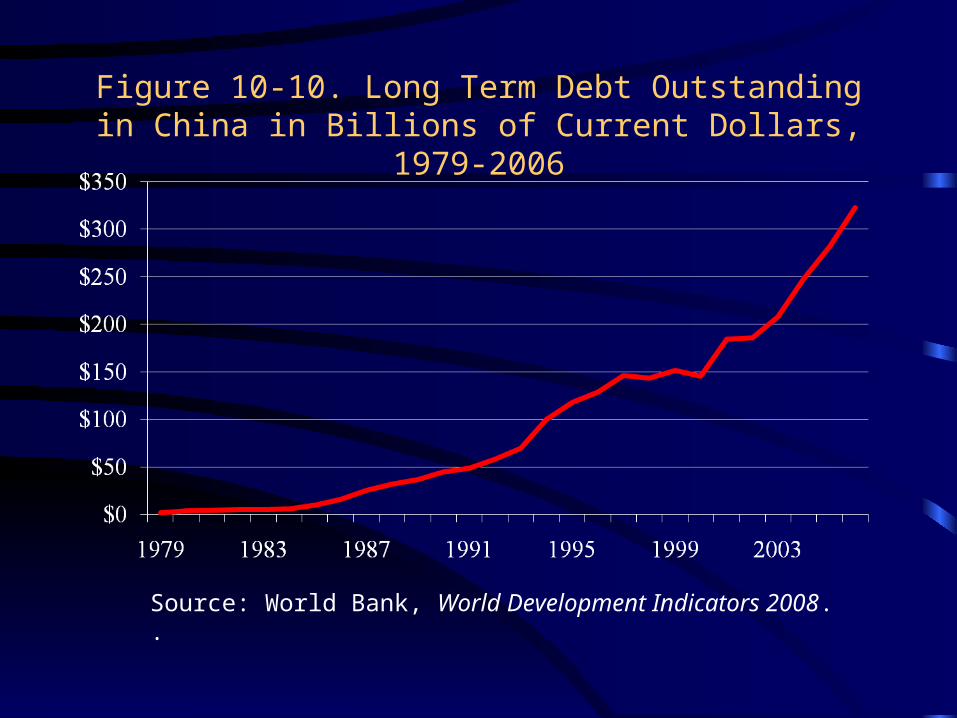
Figure 10-10. Long Term Debt Outstanding in China in Billions of Current Dollars, 1979-2006
Source: World Bank, World Development Indicators 2008..

Summary
• Russia elected to pursue a state-controlled energy-based growth strategy
• China elected to pursue its own form of the Asian developmental state approach, following the examples of Japan, Korea and Taiwan
• China’s strategy has been more successful but both are growing rapidly now