unstats.un.org€¦ · XLS file · Web viewcomments that this indicator does not address the...
247
List of indicator proposals (11 August 2015) ummary of comments (corrected version - 19 Octobe 2015) The Summary of comments provided on 25 September 2015 has been upd corrections received as of 19 October 2015 from Australia, Brazil, Office of SRSG on Violence against Children, UNAIDS, UNCDF, UNCEEA, UNEP, UNESCO, UNICEF, UNISDR, UN Statistical Systems Organisations These corrections are highlighted in blue.
-
Upload
phungxuyen -
Category
Documents
-
view
226 -
download
2
Transcript of unstats.un.org€¦ · XLS file · Web viewcomments that this indicator does not address the...
List of indicator proposals (11 August 2015)
Summary of comments (corrected version - 19 October 2015)
Note: The Summary of comments provided on 25 September 2015 has been updated with corrections received as of 19 October 2015 from Australia, Brazil, FAO, IMF, Office of SRSG on Violence against Children, UNAIDS, UNCDF, UNCEEA, UNDP, UNEP, UNESCO, UNICEF, UNISDR, UN Statistical Systems Organisations and WHO. These corrections are highlighted in blue.
Read_Me_First List of Proposals - 2
Read me first
List of Proposals (see sheet ("List of Indicator Proposals")
Version 3 – List of Indicator Proposals - made available 11 August 2015
Version 2 – made available on 7 July 2015
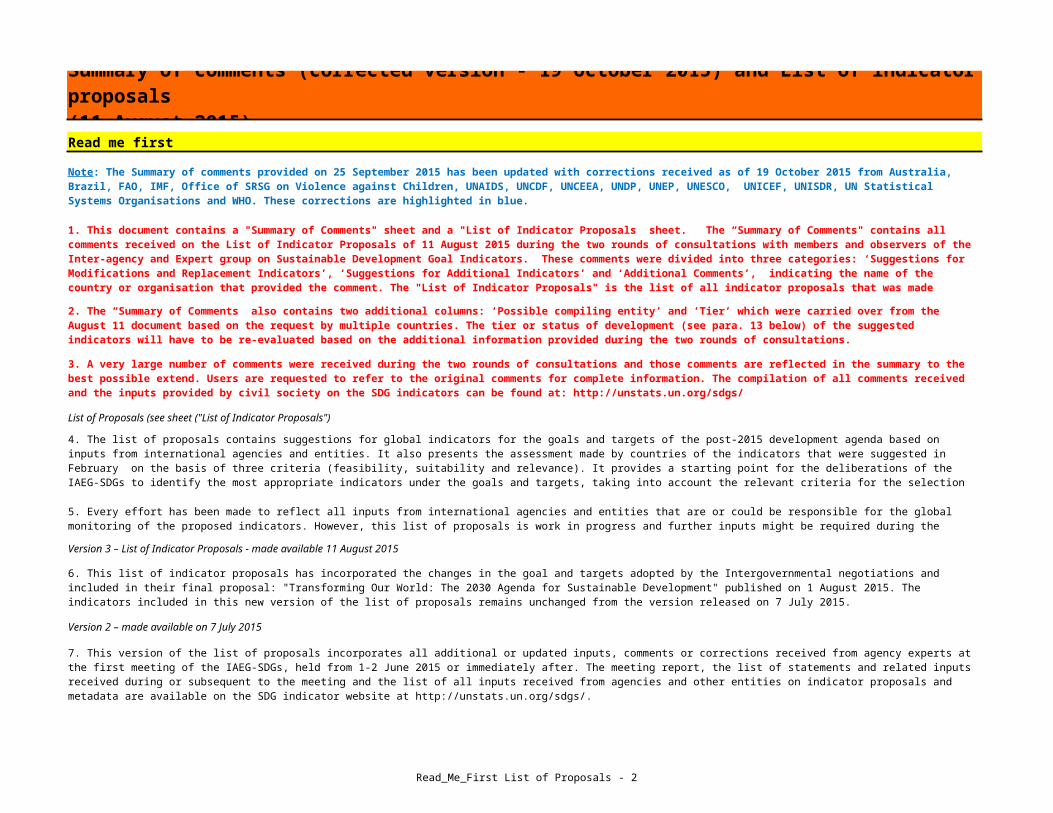
Summary of comments (corrected version - 19 October 2015) and List of indicator proposals (11 August 2015)
Note: The Summary of comments provided on 25 September 2015 has been updated with corrections received as of 19 October 2015 from Australia, Brazil, FAO, IMF, Office of SRSG on Violence against Children, UNAIDS, UNCDF, UNCEEA, UNDP, UNEP, UNESCO, UNICEF, UNISDR, UN Statistical Systems Organisations and WHO. These corrections are highlighted in blue.
1. This document contains a "Summary of Comments" sheet and a "List of Indicator Proposals” sheet. The “Summary of Comments" contains all comments received on the List of Indicator Proposals of 11 August 2015 during the two rounds of consultations with members and observers of the Inter-agency and Expert group on Sustainable Development Goal Indicators. These comments were divided into three categories: ‘Suggestions for Modifications and Replacement Indicators’, ‘Suggestions for Additional Indicators’ and ‘Additional Comments’, indicating the name of the country or organisation that provided the comment. The "List of Indicator Proposals" is the list of all indicator proposals that was made available in the August 11 document. There were no changes made to the list of indicator proposals in this new document.
2. The “Summary of Comments” also contains two additional columns: ‘Possible compiling entity’ and ‘Tier’ which were carried over from the August 11 document based on the request by multiple countries. The tier or status of development (see para. 13 below) of the suggested indicators will have to be re-evaluated based on the additional information provided during the two rounds of consultations.
3. A very large number of comments were received during the two rounds of consultations and those comments are reflected in the summary to the best possible extend. Users are requested to refer to the original comments for complete information. The compilation of all comments received and the inputs provided by civil society on the SDG indicators can be found at: http://unstats.un.org/sdgs/
4. The list of proposals contains suggestions for global indicators for the goals and targets of the post-2015 development agenda based on inputs from international agencies and entities. It also presents the assessment made by countries of the indicators that were suggested in February on the basis of three criteria (feasibility, suitability and relevance). It provides a starting point for the deliberations of the IAEG-SDGs to identify the most appropriate indicators under the goals and targets, taking into account the relevant criteria for the selection of indicators, as well as the need for the coherent and comprehensive measurement of all goals and targets and the need to limit the number of global indicators.
5. Every effort has been made to reflect all inputs from international agencies and entities that are or could be responsible for the global monitoring of the proposed indicators. However, this list of proposals is work in progress and further inputs might be required during the discussions of the IAEG-SDGs
6. This list of indicator proposals has incorporated the changes in the goal and targets adopted by the Intergovernmental negotiations and included in their final proposal: "Transforming Our World: The 2030 Agenda for Sustainable Development" published on 1 August 2015. The indicators included in this new version of the list of proposals remains unchanged from the version released on 7 July 2015.
Read_Me_First List of Proposals - 3
Read me first
Summary of comments (corrected version - 19 October 2015) and List of indicator proposals (11 August 2015)
9. All indicators should be disaggregated by sex, age, residence (U/R) and other characteristics, as relevant and possible.
Version 1 – made available on 29 May 2015
7. This version of the list of proposals incorporates all additional or updated inputs, comments or corrections received from agency experts at the first meeting of the IAEG-SDGs, held from 1-2 June 2015 or immediately after. The meeting report, the list of statements and related inputs received during or subsequent to the meeting and the list of all inputs received from agencies and other entities on indicator proposals and metadata are available on the SDG indicator website at http://unstats.un.org/sdgs/.
8. The list contains suggested indicators (highlighted in blue), as well as additional proposals or inputs provided by agencies and entities. Initially suggested indicators that were assessed by countries are highlighted in light blue (see below for further information). The letters in parenthesis after these indicators indicate the rating based on the three criteria as indicated above. The suggested indicators under each target are based on the inputs and comments received. The presentation does not imply any judgment by the Secretariat on which indicators should eventually be selected. For the suggested indicators, the Secretariat indicates their state of statistical development according to a three tier system (see for further information in paragraph 13 below) based on the information available, which will need to be revisited as more complete information becomes available.
10. In preparation of the first meeting of the IAEG-SDGs, the Secretariat compiled a first list of indicator proposals and associated metadata (‘List of proposals’ – version 1) with the help of agencies and entities and based on the initial assessment of proposed provisional indicators included in the Technical report of the Bureau of the Statistical Commission presented to the March 2015 session of the intergovernmental negotiations. The initial assessment of proposed provisional indicators in which 70 Member States participated is entirely reflected in this list of indicator proposals and associated metadata. The assessed indicators are highlighted in light blue and are recognizable by the assessment results shown behind them in brackets. For example an indicator rated “AAA” has been found to be easily feasible, suitable and very relevant to measure the respective target for which it was proposed by a majority of national statistical offices (60 per cent or more). Please see the technical report for full details.
11. When conducting the assessment of proposed provisional indicators in February and March 2015, many national statistical offices expressed their wish for detailed metadata and an improved description of the proposed indicators. Therefore, the Secretariat requested agencies and entities to provide this additional information, which was then presented along with the assessment in the list of indicator proposals and associated metadata that was provided as an input to the first meeting of the IAEG-SDGs.

Read_Me_First List of Proposals - 4
Read me first
Summary of comments (corrected version - 19 October 2015) and List of indicator proposals (11 August 2015)
12. Within the list of proposed indicators and associated metadata, one or more indicators were identified as the suggested priority indicators based on the inputs from agencies and entities that were requested to identify their priority indicator for the targets in their area of work and expertise. In cases where multiple priority indicators were proposed under one target, precedence was in general given to the proposals by agencies with a mandate in the specific area and/or already responsible for global monitoring of the specific indicator. The suggestion of one priority indicator under each target was meant to illustrate a possible framework consisting of a limited number of indicators, as requested by the inter-governmental negotiations on SDGs, and did not imply any judgment by the Secretariat on which indicators should eventually be selected.
13. In addition, for each suggested indicator the Secretariat evaluated its stage of development according to a three tier system based on the information provided by the relevant entities: a first tier for which an established methodology exists and data are already widely available; a second tier for which a methodology has been established but for which data are not easily available; and a third for which an internationally agreed methodology has not yet been developed. It should be noted that the coverage and level of detail of the metadata provided by the relevant agencies vary across indicators and that this initial evaluation may need to be revisited as more complete information becomes available.

Summary of Comments - p. 5 of 265
Summary of Comments* Note on Disaggregation: All indicators should be disaggregated by sex, age, residence (U/R) and other characteristics, as relevant and possible.Goal 1 End poverty in all its forms everywhereTarget 1.1 By 2030, eradicate extreme poverty for all people everywhere, currently measured as people living on less than $1.25 a day.
Suggestions for Modifications and Replacement Indicators Suggestions for Additional Indicators Additional Comments Tier
1.1.1 Tier I
Target 1.2 By 2030, reduce at least by half the proportion of men, women and children of all ages living in poverty in all its dimensions according to national definitions. Suggestions for Modifications and Replacement Indicators Suggestions for Additional Indicators Additional Comments Tier
1.2.1 Tier I
Indicator Line
Number
Suggested Indicators as of August 11
Possible Compiling Entity
Proportion of population below $1.25 (PPP) per day disaggregated by sex and age group and employment status (or Proportion of employed people living on less that $1.25 PPP) a day)
Germany: Proportion of population below $1.25 (PPP) per day. UN Statistical System Organisations, and ILO propose a slight modification "Proportion of population below $1.25 (PPP) per day, with disaggregation by sex and age group, and by employment status (or Proportion of employed people living on less that $1.25 PPP a day - "working poor").
Philippines: Poverty GapAfrica: Multi-Dimensional Poverty Indicator UN Women: Ratio of women to men (aged 25-59) in households living under $1.25 per capita (PPP); UN Women: For both target 1.1 and 1.2: Percentage of working age adults who earn their own income, by sex and location International Finance Corporation (IFC): new loans for SMEs (# and $)
Australia: Not relevant in an Australian context. Canada, Denmark, Philippines and UK support this indicatorArgentina, Germany: the $1.25 indicator is not an official measurement, it an estimation developed by the World Bank. Australia: being less relevant for Australia.Ecuador requests an explanation of whether the measurement should be done for consumption or income expenditure.UK: Disaggregated by urban/rural, region and social group. Canada, Germany, Estonia, US, Cabo Verde view disaggregation difficult/possible because of survey methodology used. US suggests potentially informative, to disaggregate by the sex of the person identified as the household head, or to identify what share of women and what share of those within particular age groups live in poor households .Africa IAEG members: data disaggregated employment status maybe difficult to collect for national statistical systems.DESA: Disaggregated by disabilityEurostat: define 'employed' - whether formal or also informal employment is taken into account. Add disaggregation by disability and ethnic group.
World Bank and ILO
Suggested Indicators as of August 11
Possible Compiling Entity
Proportion of population living below national poverty line, disaggregated by sex and age group
Denmark, Mexico, Colombia, and Turkey, WB : " Proportion of men, women and children of all ages living in poverty in all its dimensions according to national definitions" Germany suggests to use National poverty indicator.UN Statistical System Organisations suggest a slightly modification "Proportion of population living below national poverty line (defined nationally as monetary or multidimensional), disaggregated by sex and age group, and by employment status (Eurostat: employed, unemployed, outside the labour force)"
Philippines: Proportion of population living below national food poverty line, disaggregated by sex and age groupCabo Verde, Colombia, Cuba, Philippines, UNICEF, UNDP, UN Statistical System Organisations :"Multidimensional Poverty Index (MPI) disaggregated by sex and age group". UN-WOMEN and UN Statistical System Organisations: "Proportion of people who have an independent source of income by sex, age and source of income."UNDP: • Poverty incidence ratio; • Poverty gap ratio; • Share of poorest quintile in national incomeInternational Finance Corporation: Percentage of population using banking services, disaggregated by sex
Australia: Australia does not have an official poverty line. Care should be taken in interpreting a global indicator based on national poverty lines, as there are varying ways in which they are constructed or calculated. Poverty lines based on income do not capture ‘poverty’ in all dimensions. Consideration should also be given to measuring the concept of wealth and other aspects of poverty. Canada, Estonia, Peru, Philippines, Turkey, UK support this indicator. Canada: Disaggregated by disability if possible. Would suggest using LIM as the national poverty lineArgentina, Singapore comment that they do not calculate national poverty Line. Ecuador requests an explanation of whether the measurement should be done for consumption or income expenditure.US does not favour disaggregation for this indicator because of the survey methods used.Portugal: the indicator is not suitable to measure the reduction of poverty in all its dimensionAfrica IAEG members: Data disaggregated by age and employment status difficult to collect by national statistical agencies. Portugal, FAO express concerns on the MPI because it is difficult to interpret and a quantitative target cannot be set, and these dimensions are already fully covered by other targets
World Bank

Summary of Comments - p. 6 of 265
Target 1.3 Implement nationally appropriate social protection systems and measures for all, including floors, and by 2030 achieve substantial coverage of the poor and the vulnerable. Suggestions for Modifications and Replacement Indicators Suggestions for Additional Indicators Additional Comments Tier
1.3.1 ILO, OECD Tier II
Suggested Indicators as of August 11
Possible Compiling Entity
Percentage of population covered by social protection floors/systems, disaggregated by sex, composed of the following: a) Percentage of older persons receiving a pension; b) Percentage of households with children receiving child support; c) Percentage of working-age persons without jobs receiving support; d)Percentage of persons with disabilities receiving benefits; e) Percentage of women receiving maternity benefits at childbirth; f) Percentage of workers covered against occupational injury; and g) Percentage of poor and vulnerable people receiving benefits.
Brazil proposes this replacement indicator: "Percentage of the population covered by a minimum social protection floor including: a) percentage of elderly persons earning retirement pensions; b) percentage of household units with children who receive assistance benefits; c) percentage of workers or economically-active persons receiving benefits (unemployment insurance; sickness benefit; maternity allowance, etc); d) percentage of the poor and vulnerable receiving assistance benefits; e) the percentage of women with access to prenatal care."Norway: regarding e) should not just be "women" but "percentage of parents" receiving maternity benefits at childbirth - to include fathers and non-traditional family structures and exclude including women that do not have childrenGermany: suggest replace with • “Average social protection transfers as % of income / or poverty line” (previously 1.3.2); • “Percentage of population covered by social protection floors/systems” (previously 1.3.1) and • “Reduction of the poverty gap by social transfers” Japan: the following wording should be added to the indices. “The definition of ‘subject should be covered by social protection’ should be based on each country’s laws and regulations.”Mexico, WB: Percentage of poor and vulnerable population with social protection or that are beneficiaries of one or more social programs.ILO: Percentage of the population covered by social protection floors/systems disaggregated by sex, and distinguishing children, unemployed, old age, people with disabilities, pregnant women/new-borns, work injury victims, poor and vulnerableIMF suggests that For each of the categories considered (pensions, unemployment benefits, disabilities benefits, etc.), indicators for coverage (the share of the relevant population that receives the benefit) and the generosity of the program (average benefit/average income) should be calculated.
US: should include a food/nutrition safety net included; such as percentage of eligible people participating in school meal programs or national food assistance.IMF suggests to add "generosity of the program (average benefit/average income)"Eurostat: Percentage of poor persons belonging to ethnic minoritiesUNFPA: Percentage of older persons covered by pension systems
Australia: The components of this indicator are biased against means-tested social protection systems such as Australia's, since they measure the percentage of all people in certain demographic group receiving a benefit. The indicator does not address the adequacy of the benefits. Brazil: A number of countries do not have comprehensive social protection systems (as required by this indicator). Therefore, it might be difficult to calculate some of these indicators. Besides, the concept of Social Protection Floors originally proposed by the ILO encompasses some health indicators, especially those on maternal health.Argentina supports a)- c) and does not support d)-g), and requests the definition of "child support" (Singapore also requests this), and terms used in g). Cabo Verde and Africa IAEG members request to define more precisely who are the vulnerable and suggests to delete g). Estonia supports a)-d), for e), denominator seems to be missing; f) data not available; g) Definition needs clarification. Italy: maintain this indicator including a number of different measures which cannot be aggregated into a unique index. The categories of people should be clarified. Mexico: The proposal does not adequately measure the associated goal because not all seniors and households with children or people with disabilities, etc., are vulnerable and/or poor. This may encourage indiscriminate use of resources to meet the goal. China, Cabo Verde Germany: Not one but seven different indicators. Germany proposes it be replaced with maximal 3 indicators. Paraguay does not support the indicator. Portugal: more detail is needed Philippines, UK, UN Statistical System Organisations support this indicator. UK, UN Women: Must be disaggregated by sex. UN DESA: Disaggregated by disabilityILO thinks the additional 2 indicators proposed by Germany not sufficient capture the main policy direction given by member states in the intergovernmental negotiations, and provides clarification on the definitions of social protection system/floors and data availability at global level.

Summary of Comments - p. 7 of 265
Suggestions for Modifications and Replacement Indicators Suggestions for Additional Indicators Additional Comments Tier
1.4.1 Tier II
1.4.2
Target 1.4 By 2030, ensure that all men and women, in particular the poor and the vulnerable, have equal rights to economic resources, as well as access to basic services, ownership and control over land and other forms of property, inheritance, natural resources, appropriate new technology and financial services, including microfinance.
Suggested Indicators as of August 11
Possible Compiling Entity
Proportion of the population living in households with access to basic services.
UK: Alternative: i) Percentage of adult population with account at a formal financial institution (measurable through FINDEX financial inclusion index produced by World Bank) and ii) Existence and implementation of a national law to guarantee equal inheritance rights for daughters and sons, widows and widowers (measurable through the Social Institutions and Gender Index (SIGI) produced by OECD DAC), Disaggregated by urban/rural, region, social group. If an individual level indicator is chosen, Portugal, UN Statistical System Organisations and World Bank: Proportion of the population living in households with access to basic services: (1) access to the internet, ownership of a mobile phone, and households with broadband internet access. (2) For access to financial services : "% adults with a formal account or personally using a mobile money service in the past 12 months". UNCTAD proposes some alternate indicators that incorporate the gender perspective: a. Female share of landholding and immovable property. b. Female share of bank/ savings accounts.c. Female participation rate in technical and vocational training programmes. d. Female participation rate in government support programmes (extension services, inputs, credit). e. Proportion of micro-enterprises and SMEs owned by women that have access to mobile phones and the internet.
UNCDF: proposes the following indicator to monitor the financial inclusion aspect of the target: "% adults with a formal account or personally using a mobile money service in the past 12 months, breakdown by income, gender, rural, and age" Partnership on Measuring ICT: 1) individuals using the Internet; 2) Individual C32owning a mobile phone; 3) Population covered by a mobile broadband network, broken down by technology; 4) Households with broadband Internet access
Australia: ‘Basic services’ must be clearly defined. Without including internet, telecommunication, etc in the definition, there are restricted measurement opportunities to capture key forms of economic disadvantage. Quality of accessible services should be acknowledged. Denmark, Estonia and Turkey accept this indicator.Mexico, UK considers this indicator as problematic.US: target 1.4 mixes multiple sectors-finance, basic services and land. As such it is unclear how an overall target will be set or well measured. In addition, the term "ownership" for land is too limiting and lack's applicability to all member states. Better terminology is "secure land tenure". Austrilia: Some proposed indicators are of limited utility without building in some measure of qualityAlgeria, Argentina, Canada, Cabo Verde, China, Ecuador, Germany, Italy, Japan, Mexico, Peru, Portugal, UK, US, Africa, World Bank and Eurostat think "basic services" is not clearly defined UK, UN Women: must be disaggregated by sex.UN Statistical System Organisations: a. Basic services to be defined but should include: antenatal care (access to health professionals at birth), basic vaccines, access to primary and secondary education, improved water source, improved sanitation, electricity and social security. b. Proportion of population/households with access to regulated basic services (possibly by sex, age group, and geographical area (urban/rural)), including, among the list of regulated basic services, national and international postal services
World Bank, UNDP, UNICEF
Share of women among agricultural land owners by age and location (U/R)
US: Proportion of adult human population with tenure that is legally recognized and documented or perceived as secure, by sex and age groupTurkey: "Ratio of entrepreneur women-employer and self employed UK: A more appropriate global indicator would be percentage of population in rural areas with secure rights to land, measured by (i) percentage with documented or recognized evidence of tenure, and (ii) percentage who perceive their rights to land are recognized and protected. Disaggregated by urban/rural, region, social group. If an individual level indicator is chosen, must be disaggregated by sex.UN Statistical System Organisations: a) Percentage of people with ownership or secure rights over agricultural land (out of total agricultural population), by sex; and (b) Share of women among owners or rights-bearers of agricultural land”, by type of tenure
UN Statistical System Organisations, UN Women, UNEP: Proportion of adult women/men agricultural holders, out of total agricultural holders
Australia: Does not adequately measure components of target. Does not address women’s access, ownership and control over forms of property other than agricultural land. Need to consider measuring access to financial services, inheritance, natural resources and new technology. The current limited scope could result in global misrepresentation of progress towards target.Germany: Agriculture takes place to a considerable extent on rented land, so far no significanceColombia asks to include other areas and population of interest in order to cover the targetUK considers this indicator as problematic. Brazil, China and Japan suggest to remove this indicator. Cabo Verde, Africa: that it is difficult to collect data by age. Africa: There is a need to define landowners (UN WOMEN proposal is worth considering)Portugal: The concepts of holding and farmer should be the same used by European Statistical SystemFrance: this is not an indicator of securing land rights of local populations. Furthermore, no details are given on the formalized or not the recognized property right nor on the reality of security for these people. Canada: This indicator does not measure whether discriminatory legislative frameworks may limit women's access to economic resources.Denmark, Peru, Eurostat support this indicator. Peru collects the data through agriculture surveys every 10 years
FAO and UNSD (EDGE)
Tier III soon Tier II

Summary of Comments - p. 8 of 265
Target 1.5 By 2030, build the resilience of the poor and those in vulnerable situations and reduce their exposure and vulnerability to climate-related extreme events and other economic, social and environmental shocks and disasters.
Suggestions for Modifications and Replacement Indicators Suggestions for Additional Indicators Additional Comments Tier
1.5.1 UNISDR Tier II
Suggested Indicators as of August 11
Possible Compiling Entity
Number of deaths, missing people, injured, relocated or evacuated due to disasters per 100,000 people.
Australia suggested recasting the specification to: "Number of people exposed to disasters and the number of deaths, missing people, injured relocated or evacuated due to disasters per 100,000 people". Also commented that such an indicator would then warrant a rating of 'Direct'. Germany: replace with "Number of deaths due to disasters per 100,000 people"Canada: Indicator on the existence and application of early warning policy or programs.UNDP: It is suggested to embed in the indicator a reference to the socio-economic impacts of disasters.The United Nations Mine Action Service: the number of deaths due to landmines and other explosive remnants of war should be one of the causes of deaths and injuries that are disaggregated in the indicator.UN Statistical System Organization proposes to modify: "Number of deaths, missing and affected people due to hazarouds events per 100,000".
Algeria: along with the number of deaths and injuries of the evacuated population, add "% of the injured population affected by disasters that have benefited from health care, financial support, or evacuation and relocation."Ecuador proposes to add: percentage of territory that has evacuation plans in response to extreme environmental events and the number of contingency plans. Colombia: Population located in high-risk zones, population located in places with risk of flooding and landslides.Japan, UK, UN Statistical System Organisations and UNISDR: "Direct economic loss due to hazardous events in relation to global gross domestic product."UNEP: Percentage of population exposed to climate-related extreme events and other environmental shocks and disasters.UN Statistical System Organisations: a. Proportion of population resilient/robust to hazards and climate - related events by sex; b. Proportion of health and educational facilities affected by hazardous events. (The indicator will be collected under the SFDRR (Sendai Framework), also supported by Eurostat) c. Percentage of persons forcibly displaced by disasters, crises and other shocks who have found a durable solution to their displacementUN DESA: percentage of deaths from persons with disabilities among all deaths due to disasters; Percentage of injured persons with disabilities among all injured due to disasters
Australia concerns regarding multi-measure nature of the suggested indicator and ‘indirect’ approach to measurement, and comments that not utilising new technologies, which can increase the feasibility of measuring and monitoring direct ‘exposure’, may reduce opportunities for implementing cheaper and more accurate data collection methods. Also recommends allowing for the alignment of indicators with Sendai Framework for Disaster Rish Reduction.Algeria, Ecuador comment that the proposed indicator does not measure the capacity of building resilience in impoverished individuals. Canada: the suggested indicator does not refer to that target population. Paraguay does not support the indicator Portugal: concepts are yet to be defined; detail by age and disability depends on the availability of sufficient sample size sources, the proposal is not objective concerning disadvantaged people.Denmark: The merging of “death” and “evacuation” number seams inappropriate and will give a wrong impression on the disaster impact, e.g. 1.500. per. 100.000 could cover 1.500 deaths in Bangladesh and 1.500 temporarily evacuated in Denmark.Korea: Need to be more specific about definition of disasterMexico: The verification of the behaviour of these indicators will be carried out through an analysis of information for a period of 15 years, as established in The Sendai (Japan) Framework for Action to Reduce Disaster Risk.Switzerland: Disaggregated by genderAfrica IAEG members: Need to define 'disasters' more precisely - is it only natural or does it also include industrial accidents, etc. Africa IAEG members, UK, UN Women and EC: need to disaggregate by age and sex, (UK) by disability.Brazil, Estonia, Japan, UK, UN Statistical System Organisations support this indicator. However, UK comments that its limited nature of the proposed source is problematic. Eurostat: No measure the impact of financial and economic crisis on poverty and inequalities. Indicator captures exposure to disasters, but not necessarily vulnerability of poor and vulnerable people. This could also include economic loss due to fire damage, e.g. "Total wildfire burnt area per country".OECD: Target 1.5 should draw on three sets of indicators across the SDGs: (1) those in the climate change goal of relevance to dealing with climate shocks; (2) other targets referring to resilience; and (3) additional targets related to reducing the vulnerability of the poor through social protection, improved productivity and diversification (allowing people to smooth consumption when a shock occurs) and access to resources, markets and financial services.

Summary of Comments - p. 9 of 265
Suggestions for Modifications and Replacement Indicators Suggestions for Additional Indicators Additional Comments Tier
1.a.1 World Bank Tier III
Target 1.b Create sound policy frameworks at the national, regional and international levels, based on pro-poor and gender sensitive development strategies, to support accelerated investment in poverty eradication actions.
Suggestions for Modifications and Replacement Indicators Suggestions for Additional Indicators Additional Comments Tier
1.b.1 INFORMEA Tier I
Target 1.a Ensure significant mobilization of resources from a variety of sources, including through enhanced development cooperation, in order to provide adequate and predictable means for developing countries, in particular least developed countries, to implement programmes and policies to end poverty in all its dimensions.
Suggested Indicators as of August 11
Possible Compiling Entity
Share of total overall government spending (incl. subnational) on programs directed to bottom 40% of population of country (%).
Ecuador proposes an indicator relating " the total amount of target specific programs over total budget assignments."Cabo Verde, Africa: Alternative indicator: "Percentage of resources allocated by the government directly to poverty reduction programmes"Brazil: Expenditure on health and education as a % of the GDPUN Statistical System Organisations propose two priority indicators: a. Spending on essential services (education and health and social protection) as % of total government spending (% of total government spending), this is supported by Portugal; b. Sum of Total Grants and FDI and non-debt creating inflows - $$$ equivalent
UN Women: Share of government recurrent and capital spending going to sectors that disproportionately benefit women, poor and vulnerable groups
Brazil, Africa, Ecuador requests the definition of a methodology to discriminate expenditure aimed at the poorest 40% of the population. there will be many errors of exclusion and inclusionColombia: the suggested indicator doesn't completely cover the target. It is necessary to include information about international cooperation. Also, suggests defining the indicator in relative terms according to the magnitude of the poverty. US: Weak indicator all around - conceptually unclear, irrelevant to the main sources of actual progress out of poverty. suggests it be dropped. Australia: the proposed indicators do not adequately cover all sources of finance. The addition of absolute measures as well as proportional change measures, would allow additional insights. Turkey thinks it is relevant. Italy: high relevance with respect to reduction of poverty less with respect to international cooperation Cabo Verde Portugal, and UN Statistical System Organisations state that this indicator is not yet fully developed. IMF states that the suggested indicator is related to public expenditure and hence does not directly measure resource mobilization. Indicators for this target should be linked to those for Target 17.1.
Suggested Indicators as of August 11
Possible Compiling Entity
Number of national action plans related to multi-lateral environmental agreements that support accelerated investment in actions that eradicate poverty and sustainably use natural resources.
Australia supports World Bank suggestion to consider "Sum of Total Grants and FDI and non-debt creating inflows - $$$ equivalent." as possible alternative.US: World Bank creates the Country Policy and Institutional Assessment Index for all eligible borrowers/grantees. Developed countries' policies are assessed by OECD. A combination of these would assess policy frameworks more directly, though not necessarily at regional and global levelsBrazil: Number of programs that direct cash transfer to womenAfrica IAEG members: Disagree with the proposed indicator, alternative "Investment acceleration ratio"UNCTAD proposes some alternate indicators that incorporate the gender perspective: a. Domestic revenues targeting specifically women as per cent of GNI, by sector; b. Official development assistance and net private grants targeting specifically women as percent of GNI.
UN Women: "Share of ODA in support of gender equality and women’s empowerment, disaggregated by principal and significant."Share of government recurrent and capital spending going to sectors that disproportionately benefit women, poor and vulnerable groups."World Bank, UN Statistical System Organisations: Share of government recurrent and capital spending going to sectors that disproportionately benefit women, poor and vulnerable groups (%)
Australia: limited relevance to target. Indicator measures the breakdown of domenstic spending while target deals with financial flows from a variety of sources, including development cooperation. Also recommends allowing for the alignment of indicators with Sendai Framework for Disaster Rish Reduction.US, Germany, Singapore think that only counting the number of national action plans does not provide any information on fulfilment of target 1b. Brazil, Ecuador, Africa IAEG members do not support this indicatorColombia: The suggested indicator doesn't completely cover the target, excludes gender-sensitive development strategies. Also, we suggest defining the indicator in terms of compliance percentage of the action plans.Portugal: strategy and concepts still to be defined

Summary of Comments - p. 10 of 265
Goal 2 End hunger, achieve food security and improved nutrition and promote sustainable agriculture Target 2.1 By 2030, end hunger and ensure access by all people, in particular the poor and people in vulnerable situations, including infants, to safe, nutritious and sufficient food all year round.
Suggestions for Modifications and Replacement Indicators Suggestions for Additional Indicators Additional Comments Tier
2.1.1 FAO Tier I
2.1.2 FAO Tier II
Suggestions for Modifications and Replacement Indicators Suggestions for Additional Indicators Additional Comments Tier
2.2.1 Tier I
Suggested Indicators as of August 11
Possible Compiling Entity
Prevalence of undernourishment
Brazil strongly believe the proposed indicator (indirect method) has to be improved and recommends to adopt a direct method to measure the amount of energy intake, per capita day, for a population. Proposes this replacement indicator "Prevalence of undernourishment based on a direct method to measure the amount of energy (Kcal) intake, per capita day, for a population. This indicator must be produced considering groups of age and separated by gender. (Tier II)"Cabo Verde suggests to change to "Proportion of population below minimum level of dietary energy consumption"Switzerland: must be disaggregated by gender.Africa IAEG members, UK: Data for this indicator should be disaggregated by geographical region, population group, socioeconomic group, sex or age, where possibleUNDP suggests the following indicators for Hunger: • Proportion of the population below minimum dietary energy consumption; • Prevalence of underweight children under five years of age; • Global Hunger Index
UN Statistical System Organisations proposes an additional indicator, “Food Consumption Score”. Sudan, Philippines, UK support this indicator.Estonia views the indicator is relevant for the target, but no dataItaly: not clear definitionUS comments that suggested indicator is of availability more than access. Through disaggregated by income groupings (e.g. income deciles), it can also be an indicator of access as in ERS international food security model (IFSM).Eurostat comments that both suggested indicators for target 2.1 fail to cover the second aspect of the target, i.e. the access to safe, nutritious and sufficient food. Disaggregation on sub-national level would be desirable.
Prevalence of population with moderate or severe food insecurity, based on the Food Insecurity Experience Scale (FIES)
Brazil proposes this replacement indicator: "revalence of population with moderate or severe food insecurity, based on Individual Food Insecurity Experience. (Tier III)"Cabo Verde: Alternative indicator: "Prevalence of children under age five moderately and severely stunted". Cuba suggests to replace it by: National Food BalanceSwitzerland and UN Women: must be disaggregated by sex.
UK: percentage of women 15 49 years of age who consume at least 5 out of 10 defined food groups'.‐ Ecuador is not familiar with the proposed Food Insecurity Experience Scale (FIES) Paraguay does not support the indicator.Brazil: The results using this indicator are assigned only to the household level and do not allow inferences about individual householders experience concerning food insecurity. Moreover, there are differences between scales adopted by countries, which require harmonization efforts.US, UK, UN Women support this indicator.FAO provides additional information on FIES upon the requests from many countries, clarifies its survey methods and data sources, justifies the value of statistical modelling used.
Target 2.2 By 2030, end all forms of malnutrition, including achieving, by 2025, the internationally agreed targets on stunting and wasting in children under 5 years of age, and address the nutritional needs of adolescent girls, pregnant and lactating women and older persons.
Suggested Indicators as of August 11
Possible Compiling Entity
Prevalence of stunting (height for age <-2 SD from the median of the WHO Child Growth Standards) among children under five years of age
Germany suggests: "Percentage of population showing effects of malnutrition" Colombia proposes "Global malnutrition (low weight-for-age) among children under five years of age"UNDP suggests the following indicators for Food and nutrition security: • Dietary diversity score; • Resilience score; • Share of food expenditure
Colombia suggests to add other indicators to cover the target: Body-mass index for adolescents, pregnant and lactating women and older persons. US, UK recommend to add "Prevalence of wasting (weight for height <-2 SD from the median of the WHO Child Growth Standards) among children under five years of age" disaggregated by age and sexDenmark, Germany, Philippines, UK, UN Statistical System Organisations, Eurostat suggest that “Prevalence of overweight and obesity” should also be included as a priority indicator.Switzerland recommends an indicator measuring dietary diversity, disaggregated by gender and age, such as MDD-W. It would measure at the same time two dimensions of food security: Nutrition and access to food.UNICEF, UN Statistical System Organisations proposes 3 additional indicators that are internationally agreed World Health Assembly indicators: a. Prevalence of wasting (weight for height <-2 SD from the median of the WHO Child Growth Standards) among children under five years of age; b. Exclusive breastfeeding among 0-5 month olds; c. Prevalence of anaemia (Hb ≤ g/dl) among women or reproductive age disaggregated by age, location and income (c is also supported by SG-Envoy on Youth, UN Women and India).UN statistical system organizations identified as an additional indicator also the “Women’s Dietary Diversity Score”.
Ecuador, Philippines, UK, UN Women support this indicatorEstonia: Indicator is relevant for measuring the target in developing countries, but probably not relevant for Europe.Turkey: Indicator is only related to age <5. it should be more comprehensive.Eurostat suggests to maintain both indicators (stunting and overweight indicators) to cover malnutrition. They also comment that an indicator on dietary diversity might be a good proxy.
UNICEF, WHO, World Bank
Summary of Comments - p. 11 of 265
Suggestions for Modifications and Replacement Indicators Suggestions for Additional Indicators Additional Comments Tier
2.3.1 Tier II
Suggestions for Modifications and Replacement Indicators Suggestions for Additional Indicators Additional Comments Tier
2.4.1 FAO Tier II
Target 2.3 By 2030, double the agricultural productivity and incomes of small-scale food producers, in particular women, indigenous peoples, family farmers, pastoralists and fishers, including through secure and equal access to land, other productive resources and inputs, knowledge, financial services, markets and opportunities for value addition and non-farm employment.
Suggested Indicators as of August 11
Possible Compiling Entity
Value of production per labour unit (measured in constant USD), by classes of farming/pastoral/forestry enterprise size
Australia suggests to modify as “Crop area and yield, and value of production per labour unit (measured in constant USD), by classes of farming/pastoral/forestry enterprise size”. Malaysia, Philippines: Value of agricultural production per hectare of agriculture land (measured in constant USD/hectare, disaggregated for the two lowest quintiles of countries’ farm size distribution, as well as for female headed smallholder producer households) Russia: The value of agricultural production per hectare of agricultural land " (PPP / ha ") US recommends that " Total factor productivity" as an alternate for 2.3 and 2.4Cabo Verde: Alternative Indicator: “Volume of production per unit labour (in tonnes)" disaggregated by classes of farming/pastoral/forestry/fisheries/ enterprise size.Brazil: Value of production divided by the total intermediate consumption, for the area considered (Tier I)Africa: Alternative Indicator: " Volume of production per unit labour (in tonnes)" disaggregated by classes of farming/pastoral/forestry/enterprise sizeUNCTAD would like to propose some alternate indicators that incorporate the gender perspective: a. Female share of landholding. b. Female participation rate in technical and vocational training programmes. c. Female participation rate in government support programmes (extension services, inputs, credit). d. Female use rate of storage, drying and processing facilities. e. Female rural employment in non-farm activities.
US: labour productivity is not a good measure of farm income. Total factor productivity should be considered as an alternate for 2.3 and 2.4. )UNCDF: proposes the following indicator to monitor the financial inclusion aspect of the target: % adults with a formal account or personally using a mobile money service in the past 12 months" breakdown by income, gender, rural, and agePartnership on Measuring ICT: Rural population covered by a mobile broadband network, broken down by technologyUNEP: Percentage of female/male agricultural landowners out of total agricultural landowners, disaggregated by age groups, ethnicity, location and income levels (Indicator 1.4.2 - a multipurpose indicator for Targets 1.4, 2.3 and 5a)(Additional comments: FAO: 1. classifying farming/pastoral/forestry enterprises by size is essential to measure what the target requests; 2. In the revised FAO proposal, it is suggested that the grouping of farms by size is performed not by dividing the distribution by quintile but rather by adopting an international definition of smallholders, which is not available at the moment; 3. The index of production does not need an evaluation of the cost of production, because it is not an index of value added, but of total production. 4. FAO has indeed developed new guidelines for a multiyear programme of integrated agricultural surveys (AGRIS) and together with the World Bank and USDA.Eurostat: The suggested indicator is rather limited in scope, as it does not reflect access to land and may furthermore not be very meaningful in an international comparison. Disaggregation by farm size and gender seems indeed important. Indicator framework needs to allow for 2.3 and 2.4 to be considered alongside each other (both relate to production), to ensure increased production is coming from more sustainable practices.
Australia: Identifying employment / labour by these classes may not be feasible. Consider the potential for Earth observations to produce consistent global maps of agricultural productivity (crop area, crop type, yield) over time. Colombia suggest to measure in constant PPP USD and also, complement with other indicators and disaggregation.Estonia: Value of agricultural production is available from EU regulated Economic Accounts for Agriculture but it cannot be divided by classes of farming/pastoral/forestry enterprise size and therefore cannot be used as relevant indicator for this goal.Brazil: The labour unit is one of the factors involved in efficient agricultural production. The indicator must consider that there are different technological patterns for different farmers.UK supports this indicator, Disaggregation by gender and social economic status, spatially.Russia: 1. Grouping of farms by size is not appropriate; 2. Depending on the group size of farms, based on quintile evaluation will take place and the formation of the index of production in terms of value, which is also incorrect. 3. The introduction of groups by gender and size of farms will require a revision of statistical reporting forms and the organization of federal statistical observation that would significantly increase the cost of their development.IPBES: This is currently an effective indicator for particular countries within Africa only and only 9 country having data on WB website. should be Tier III. Agree with IFAD that there should be one definition of “small scale producer” that allows for cross country comparison and the issues of scaling and extrapolation to occur.UNCEEA: Indicator could be aligned with SEEA methodology - work needed (More comments in the addtional indicators box)
FAO and the World bank.
Target 2.4 By 2030, ensure sustainable food production systems and implement resilient agricultural practices that increase productivity and production, that help maintain ecosystems, that strengthen capacity for adaptation to climate change, extreme weather, drought, flooding and other disasters and that progressively improve land and soil quality.
Suggested Indicators as of August 11
Possible Compiling Entity
Percentage of agricultural area under sustainable agricultural practices.
US recommends that " Total factor productivity" as an alternate for 2.3 and 2.4Brazil: Organic agricultural area divided by cultivated area (Tier I)Germany asks for a nutrient balance indicator (until something more reasonable becomes available). UK: "prevalence of population with moderate or severe food insecurity, based on the Food Insecurity Experience Scale (FIES)". This indicator is a direct implementation of the concept of “access to food” and based on the FIES, which is an example of experience based food insecurity ‐scales, directly measuring the effective ability to access food at the individual or household level.Africa IAEG members: Alternative Indicators: " % of agricultural households using irrigation systems compared to all agricultural households", and % of agricultural households using eco-friendly fertilizers compared to all agricultural households using fertilizers"
UNISDR and UN Statistical System Organisations propose additional priority indicator: Agriculture damage and loss to hazardous eventsIUCN: Red List Index (species used for food and medicine)
Australia concerns regarding the lack of definition of 'sustainable agricultural practices', and as alternative approaches, also measure value of production, or consider the potential for satellite data to monitor land management practices (e.g. tillage practice), wind and water erosion, drought, flood, riparian zone management, water storages and ecosystem services can be globally and consistently tracked using satellite data. Canada: The indicator includes so many dimensions that it would be extremely difficult to implement. Brazil, Denmark, Germany Japan and US comment that the indicator does not have clear definition and recommend to replace it. Germany suggests replacing the indicator by a nutrient balance indicator. France, Portugal welcome the new proposed indicator, well adapted to the targetSwitzerland comments that the indicator would bev ery difficult to use and further discussion is needed as there is no national programme / recording through which "sustainable agriculture" could be identified and clearly delimited.Ecuador, Estonia, Italy, Turkey and IPBES require a methodological definition of sustainable agricultural practices and think it is a Tier III indicator. FAO acknowledge that an internationally agreed definition of sustainable farming practices is needed and provides detailed information on the proposed definition and methodology for the indicators UNCEEA: Indicator could be aligned with SEEA methodology - work neededEurostat: A surface indicator on sustainable practices (under elaboration) can be useful. sustainable agriculture is an area where interlinkage indicators are crucial and can make the concept meaningful, link with 6.3, 14.1 15.3

Summary of Comments - p. 12 of 265
Suggestions for Modifications and Replacement Indicators Suggestions for Additional Indicators Additional Comments Tier
2.5.1 FAO Tier I
Suggestions for Modifications and Replacement Indicators Suggestions for Additional Indicators Additional Comments Tier
2.a.1 FAO Tier I
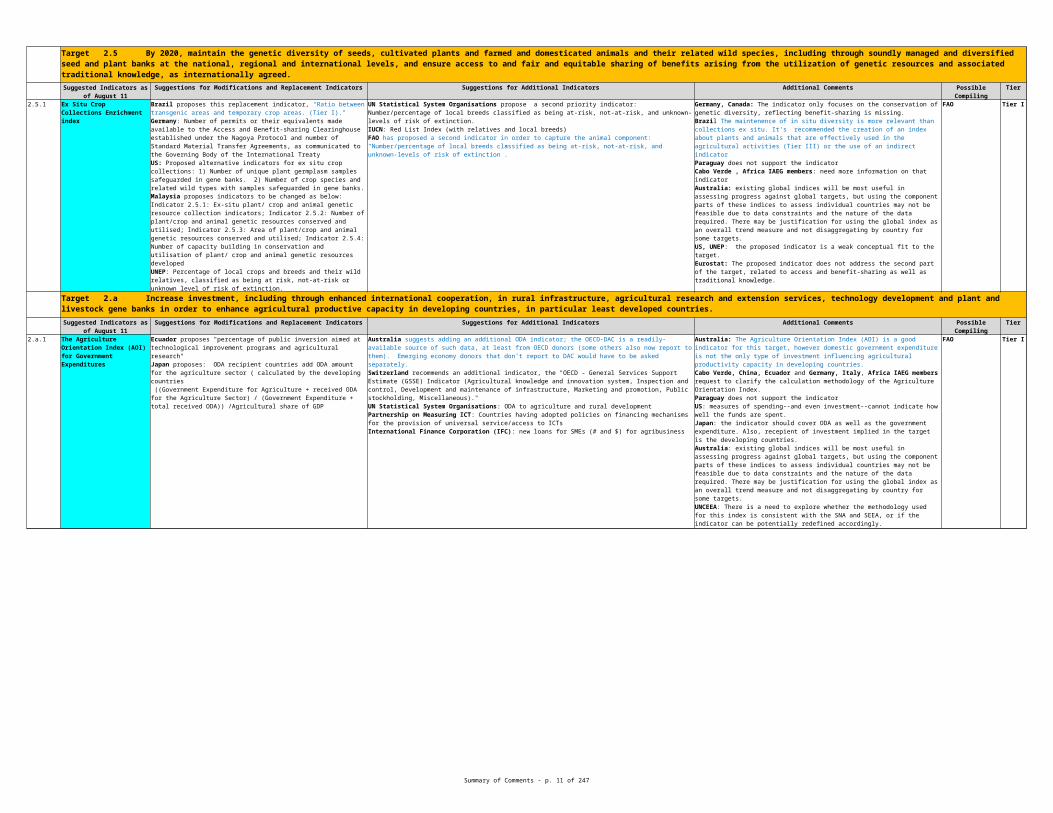
Target 2.5 By 2020, maintain the genetic diversity of seeds, cultivated plants and farmed and domesticated animals and their related wild species, including through soundly managed and diversified seed and plant banks at the national, regional and international levels, and ensure access to and fair and equitable sharing of benefits arising from the utilization of genetic resources and associated traditional knowledge, as internationally agreed.
Suggested Indicators as of August 11
Possible Compiling Entity
Ex Situ Crop Collections Enrichment index
Brazil proposes this replacement indicator, "Ratio between transgenic areas and temporary crop areas. (Tier I)."Germany: Number of permits or their equivalents made available to the Access and Benefit-sharing Clearinghouse established under the Nagoya Protocol and number of Standard Material Transfer Agreements, as communicated to the Governing Body of the International TreatyUS: Proposed alternative indicators for ex situ crop collections: 1) Number of unique plant germplasm samples safeguarded in gene banks. 2) Number of crop species and related wild types with samples safeguarded in gene banks.Malaysia proposes indicators to be changed as below:Indicator 2.5.1: Ex-situ plant/ crop and animal genetic resource collection indicators; Indicator 2.5.2: Number of plant/crop and animal genetic resources conserved and utilised; Indicator 2.5.3: Area of plant/crop and animal genetic resources conserved and utilised; Indicator 2.5.4: Number of capacity building in conservation and utilisation of plant/ crop and animal genetic resources developedUNEP: Percentage of local crops and breeds and their wild relatives, classified as being at risk, not-at-risk or unknown level of risk of extinction.
UN Statistical System Organisations propose a second priority indicator: Number/percentage of local breeds classified as being at-risk, not-at-risk, and unknown-levels of risk of extinction.IUCN: Red List Index (with relatives and local breeds)FAO has proposed a second indicator in order to capture the animal component: “Number/percentage of local breeds classified as being at-risk, not-at-risk, and unknown-levels of risk of extinction”.
Germany, Canada: The indicator only focuses on the conservation of genetic diversity, reflecting benefit-sharing is missing. Brazil The maintenence of in situ diversity is more relevant than collections ex situ. It's recommended the creation of an index about plants and animals that are effectively used in the agricultural activities (Tier III) or the use of an indirect indicatorParaguay does not support the indicatorCabo Verde , Africa IAEG members: need more information on that indicatorAustralia: existing global indices will be most useful in assessing progress against global targets, but using the component parts of these indices to assess individual countries may not be feasible due to data constraints and the nature of the data required. There may be justification for using the global index as an overall trend measure and not disaggregating by country for some targets.US, UNEP: the proposed indicator is a weak conceptual fit to the target.Eurostat: The proposed indicator does not address the second part of the target, related to access and benefit-sharing as well as traditional knowledge.
Target 2.a Increase investment, including through enhanced international cooperation, in rural infrastructure, agricultural research and extension services, technology development and plant and livestock gene banks in order to enhance agricultural productive capacity in developing countries, in particular least developed countries.
Suggested Indicators as of August 11
Possible Compiling Entity
The Agriculture Orientation Index (AOI) for Government Expenditures
Ecuador proposes "percentage of public inversion aimed at technological improvement programs and agricultural research" Japan proposes: ODA recipient countries add ODA amount for the agriculture sector ( calculated by the developing countries ((Government Expenditure for Agriculture + received ODA for the Agriculture Sector) / (Government Expenditure + total received ODA)) /Agricultural share of GDP
Australia suggests adding an additional ODA indicator; the OECD-DAC is a readily-available source of such data, at least from OECD donors (some others also now report to them). Emerging economy donors that don’t report to DAC would have to be asked separately.Switzerland recommends an additional indicator, the "OECD - General Services Support Estimate (GSSE) Indicator (Agricultural knowledge and innovation system, Inspection and control, Development and maintenance of infrastructure, Marketing and promotion, Public stockholding, Miscellaneous)."UN Statistical System Organisations: ODA to agriculture and rural developmentPartnership on Measuring ICT: Countries having adopted policies on financing mechanisms for the provision of universal service/access to ICTsInternational Finance Corporation (IFC): new loans for SMEs (# and $) for agribusiness
Australia: The Agriculture Orientation Index (AOI) is a good indicator for this target, however domestic government expenditure is not the only type of investment influencing agricultural productivity capacity in developing countries. Cabo Verde, China, Ecuador and Germany, Italy, Africa IAEG members request to clarify the calculation methodology of the Agriculture Orientation Index. Paraguay does not support the indicatorUS: measures of spending--and even investment--cannot indicate how well the funds are spent. Japan: the indicator should cover ODA as well as the government expenditure. Also, recepient of investment implied in the target is the developing countries.Australia: existing global indices will be most useful in assessing progress against global targets, but using the component parts of these indices to assess individual countries may not be feasible due to data constraints and the nature of the data required. There may be justification for using the global index as an overall trend measure and not disaggregating by country for some targets.UNCEEA: There is a need to explore whether the methodology used for this index is consistent with the SNA and SEEA, or if the indicator can be potentially redefined accordingly.

Summary of Comments - p. 13 of 265
Suggestions for Modifications and Replacement Indicators Suggestions for Additional Indicators Additional Comments Tier
2.b.1 WTO Tier I
2.b.2 Agricultural Export Subsidies OECD Tier I
Target 2.c Adopt measures to ensure the proper functioning of food commodity markets and their derivatives and facilitate timely access to market information, including on food reserves, in order to help limit extreme food price volatility.
Suggestions for Modifications and Replacement Indicators Suggestions for Additional Indicators Additional Comments Tier
2.c.1 FAO Tier II
Target 2.b Correct and prevent trade restrictions and distortions in world agricultural markets, including through the parallel elimination of all forms of agricultural export subsidies and all export measures with equivalent effect, in accordance with the mandate of the Doha Development Round.
Suggested Indicators as of August 11
Possible Compiling Entity
Percent change in Import and Export tariffs on agricultural products
US: World Tariff Profiles, compiled by the WTO, UNCTAD, and the ITC for the past 6 years (2006-2010), provide a better profile of a country’s tariff regime.Germany suggests to replace the indicators for 2.a with: 1) Evolution of amount of export subsidies and measures of equivalent effect notified; 2) Distortion to agricultural incentives Canada: The Producer Support Estimate (PSE) calculated by the OECD is a more robust indicator, as it includes import quotas and other forms of support.
Australia suggests adding "percent change in trade-distorting domestic farm subsidies". Australia is in a position to report on this through OECD reporting. Comments that domestic farm subsidies is another key pillar of the WTO Doha round.
Australia: Suggested indicators for target 2b are appropriate. Germany requests to replace both proposed indicators.Japan comments that the level of import tariffs is not a suitable indicator for this target and should be deleted. But exporters can impose export tariffs or export subsidies at their discretion taking into account the situation of world agricultural market and those measures are highly trade distortive and it is worth setting them as indicators and watching the tendency.Cabo Verde, Africa: need more information on that indicator
Switzerland proposes an alternative indicator, "Agricultural subsidies as percentage of gross value added in agriculture or gross agricultural output." UN Statistical System Organisations and WTO propose: Agricultural Export Subsidies / OECD PRODUCER SUPPORT ESTIMATE (PSE)
Colombia: It is necessary to define a denominator for this indicator in order to have a reference of magnitude. Switzerland comments that export subsidies are only one aspect and only 3 WTO-Members use it (NOR, CH, CAN). US does not intend to implement any perceived commitments on agricultural subsidies made through the UN, only through the WTO. Cabo Verde, Africa IAEG members: need more clarification on that indicator WTO comments that the proposed indicator on agricultural subsidies, if implemented indiscriminately, might provide perverse incentives to increase production at the expense of environment or neighbouring countries farmers' welfare.
Suggested Indicators as of August 11
Possible Compiling Entity
Indicator of (food) Price Anomalies (IPA) ( CBB )
Australia: Concerns about the definition of 'food price anamaly'. And proposed alternative approach of monitoring crop area, crop condition and production using Earth observations.Brazil proposes: Food price variation/Consumer price variation (Tier I)Philippines: Prices of basic food commodities
Partnership on Measuring ICT: 1) Rural population covered by mobile broadband network, broken down by technology; 2) Individual in rural areas using the Internet; 3) Individuals owning a mobile phone
Cabo Verde, Ecuador and Japan require to define and standardize the methodology of calculation of the indicator.Colombia: This indicator should be complemented with one about timely access to market information.US: while it does not show price volatility explicitly, it has the potential to be more timely than other measures plus it is country and market specific so could be used to link economic information to measure of diet and dietary diversity. Cuba: suggest to modify the indicator since methodology not clearFAO clarify about Brazil's proposal and explains why the IPA can and should be applied to any relevant series of food prices, including to series of relative prices of food , to reveal conditions of market instability.
Summary of Comments - p. 14 of 265
Goal 3 Ensure healthy lives and promote well-being for all at all ages Target 3.1 By 2030, reduce the global maternal mortality ratio to less than 70 per 100,000 live births.
Suggestions for Modifications and Replacement Indicators Suggestions for Additional Indicators Additional Comments Tier
3.1.1 Tier I
3.1.2 UNICEF and WHO Tier I
Suggestions for Modifications and Replacement Indicators Suggestions for Additional Indicators Additional Comments Tier
3.2.1 Tier I
Suggested Indicators as of August 11
Possible Compiling Entity
Maternal deaths per 100,000 live births
US: 1) Number of new health technologies registered by the National Medicines Regulatory Authority and/or recommended by national guidelines;2) National Medicines Regulatory Authorities participating in harmonized registration initiatives based on internationally recognized policies and standards; and sharing regulatory policies, legislation, guidelines and information on registered products
Brazil: Relevant indicator, with developed methodology and data sources/However, the correction factor (50%) calculation used for underreport by the WHO should be revised in order to improve coverage of maternal deaths (Brazil investigates more than 85% of the maternal deaths)./Suggests using official national data/Denmark: Disaggregation by age is relevant to identify very young (10-14 yrs.). Switzerland comments that in LICs, a bi-annual report seems optimistic, because population based maternal mortality rate cannot be measured that often.UK: for both indicators under 3.1, Disaggregate by age group, rural/urban; level of education (none; primary 0 4; primary 4 8; secondary, higher) and in high ‐ ‐prevalence countries by socioeconomic status (wealth or income group). In many countries disaggregation of the ratio will be challenging due to relatively low numbers. Suggest limiting age disaggregation of ratio to under 18/over 18.Canada, Ecuador, Estonia, Japan, Philippines, Sudan, Turkey, UK, Africa IAEG members, EU, UN Women, UNFPA support this indicatorEU: Agreement on ICD codes to include required.UNFPA: disaggregated by cause of death, and by age
WHO with UNICEF, UNFPA, World Bank, UNDESA;
Proportion of births attended by skilled health personnel
US: Percept of pregnant woman with four antenatal care visitsBrazil: Proportion of Caesarean births among total births, in the resident population of a given geographic area, in the year considered.
UNFPA: • Post-natal care coverage for mother and baby either at home or in a facility and within two days of delivery (1+ visit)
Australia: ABS does not collect information for this indicator in Australia.Paraguay expresses partial agreement. Canada: Not relevant for Canada, Japan: support but the definition of skilled health personnel needs to be clarified.US: Not highly recommended -- not a priority indicator.Brazil: In the lack of consensus about this indicator, we suggest considering only the first indicator of this target.Sudan, UK, Africa IAEG members, UN Women, UNFPA supports this indicator. EU: Disaggregation by income quintile and sub-national geographical units would be desirable.
Target 3.2 By 2030, end preventable deaths of newborns and children under 5 years of age, with all countries aiming to reduce neonatal mortality to at least as low as 12 per 1,000 live births and under-5 mortality to at least as low as 25 per 1,000 live births.
Suggested Indicators as of August 11
Possible Compiling Entity
Under-five mortality rate (deaths per 1,000 live births)
Denmark, UK: suggest an indicator on stillbirth rates, which we consider as a major issue in developing countries. (UK: Stillbirths should be disaggregated as macerated or fresh stillbirths)US: Reach and sustain 90% national coverage and 80% in every district with all vaccines in national programs.
Australia suggest excluding (or separate) neo-natal data from this indicator. Causes of death for children aged over 1 are different to infant and neonatal deaths.Canada, Denmark, Estonia, Japan, Philippines, Sudan, Turkey, UK, US, Africa IAEG members support this indicatorEcuador think it is necessary to identify the principal causes of death in children under the age of five and newborns, in order to define what types of deaths are preventable. On the other hand, is important improve the quality of administrative records, as the source of information for calculation of this type indicators. Switzerland comments that population based indicators will depend on progress on vital statistic registration. UK: Disaggregate by age of child, age group of mother, rural/urban, level of education (none; primary 0 4; primary 4 8; secondary; higher); and socioeconomic ‐ ‐status (wealth or income group).EU: Disaggregation by income quintile and sub-national geographical units would be desirable.UN Women: must be disaggregated by sex.UN DESA: Disaggregated by disability
UNICEF and WHO, with UNDESA and World Bank;

Summary of Comments - p. 15 of 265
3.2.2 Tier INeonatal mortality rate (deaths per 1,000 live births)
UK: suggest also including an indicator for 'exclusive breastfeeding rate 0 5 months of age'.‐ Canada, Denmark, Estonia, Turkey, Japan, Sudan, UK, Africa IAEG members support this indicatorUS: Not highly recommended; an important indicator, but has measurement issues.Ecuador think it is necessary to identify the principal causes of death in children under the age of five and newborns, in order to define what types of deaths are preventable. On the other hand, is important improve the quality of administrative records, as the source of information for calculation of this type indicators. UK: Disaggregate by age of child, age group of mother, rural/urban, level of education (none; primary 0 4; primary 4 8; secondary; higher); and socioeconomic ‐ ‐status (wealth or income group).EU: Disaggregation by income quintile and sub-national geographical units would be desirable.UN Women: disaggregated by sex.
UNICEF, WHO, UN Population Division, World Bank

Summary of Comments - p. 16 of 265
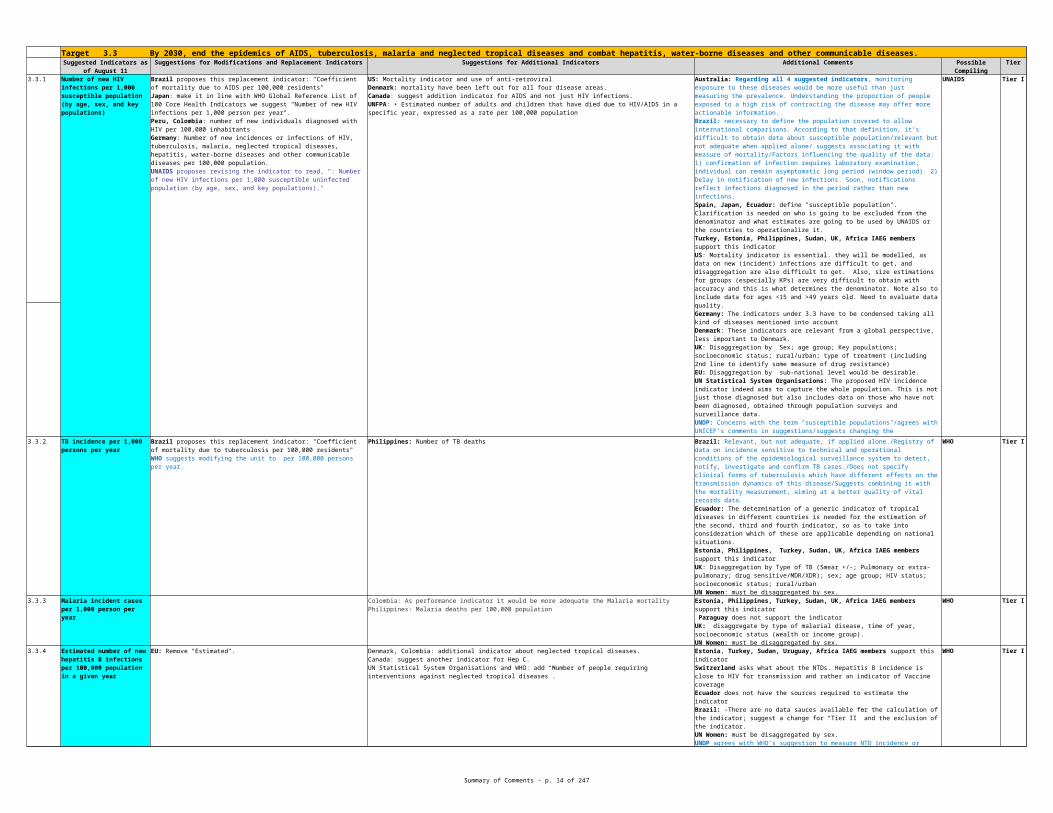
Target 3.3 By 2030, end the epidemics of AIDS, tuberculosis, malaria and neglected tropical diseases and combat hepatitis, water-borne diseases and other communicable diseases. Suggestions for Modifications and Replacement Indicators Suggestions for Additional Indicators Additional Comments Tier
3.3.1 Tier I
3.3.2 WHO Tier I
3.3.3 WHO Tier I
Suggested Indicators as of August 11
Possible Compiling Entity
Number of new HIV infections per 1,000 susceptible population (by age, sex, and key populations)
Brazil proposes this replacement indicator: "Coefficient of mortality due to AIDS per 100,000 residents"Japan: make it in line with WHO Global Reference List of 100 Core Health Indicators we suggest "Number of new HIV infections per 1,000 person per year".Peru, Colombia: number of new individuals diagnosed with HIV per 100,000 inhabitantsGermany: Number of new incidences or infections of HIV, tuberculosis, malaria, neglected tropical diseases, hepatitis, water-borne diseases and other communicable diseases per 100,000 population.UNAIDS proposes revising the indicator to read, ": Number of new HIV infections per 1,000 susceptible uninfected population (by age, sex, and key populations)."
US: Mortality indicator and use of anti-retroviralDenmark: mortality have been left out for all four disease areas.Canada: suggest addition indicator for AIDS and not just HIV infections. UNFPA: • Estimated number of adults and children that have died due to HIV/AIDS in a specific year, expressed as a rate per 100,000 population
Australia: Regarding all 4 suggested indicators, monitoring exposure to these diseases would be more useful than just measuring the prevalence. Understanding the proportion of people exposed to a high risk of contracting the disease may offer more actionable information. Brazil: necessary to define the population covered to allow international comparisons. According to that definition, it’s difficult to obtain data about susceptible population/relevant but not adequate when applied alone/ suggests associating it with measure of mortality/Factors influencing the quality of the data: 1) confirmation of infection requires laboratory examination; individual can remain asymptomatic long period (window period). 2) Delay in notification of new infections. Soon, notifications reflect infections diagnosed in the period rather than new infections.Spain, Japan, Ecuador: define "susceptible population". Clarification is needed on who is going to be excluded from the denominator and what estimates are going to be used by UNAIDS or the countries to operationalize it.Turkey, Estonia, Philippines, Sudan, UK, Africa IAEG members support this indicatorUS: Mortality indicator is essential. they will be modelled, as data on new (incident) infections are difficult to get, and disaggregation are also difficult to get. Also, size estimations for groups (especially KPs) are very difficult to obtain with accuracy and this is what determines the denominator. Note also to include data for ages <15 and >49 years old. Need to evaluate data quality.Germany: The indicators under 3.3 have to be condensed taking all kind of diseases mentioned into accountDenmark: These indicators are relevant from a global perspective, less important to Denmark. UK: Disaggregation by Sex; age group; Key populations; socioeconomic status; rural/urban; type of treatment (including 2nd line to identify some measure of drug resistance)EU: Disaggregation by sub-national level would be desirable.UN Statistical System Organisations: The proposed HIV incidence indicator indeed aims to capture the whole population. This is not just those diagnosed but also includes data on those who have not been diagnosed, obtained through population surveys and surveillance data.UNDP: Concerns with the term "susceptible populations"/agrees with UNICEF's comments in suggestions/suggests changing the “susceptible populations” to “HIV key populations and populations at higher-risk for tuberculosis and for malaria”/Supports UN-Women's suggestion to disaggregate by sex/
UNAIDS
TB incidence per 1,000 persons per year
Brazil proposes this replacement indicator: "Coefficient of mortality due to tuberculosis per 100,000 residents"WHO suggests modifying the unit to per 100,000 persons per year.
Philippines: Number of TB deaths Brazil: Relevant, but not adequate, if applied alone./Registry of data on incidence sensitive to technical and operational conditions of the epidemiological surveillance system to detect, notify, investigate and confirm TB cases./Does not specify clinical forms of tuberculosis which have different effects on the transmission dynamics of this disease/Suggests combining it with the mortality measurement, aiming at a better quality of vital records data.Ecuador: The determination of a generic indicator of tropical diseases in different countries is needed for the estimation of the second, third and fourth indicator, so as to take into consideration which of these are applicable depending on national situations.Estonia, Philippines, Turkey, Sudan, UK, Africa IAEG members support this indicatorUK: Disaggregation by Type of TB (Smear +/ ; Pulmonary or extra pulmonary; drug ‐ ‐sensitive/MDR/XDR); sex; age group; HIV status; socioeconomic status; rural/urbanUN Women: must be disaggregated by sex.UNDP agrees with UNICEF’s comments and suggestion, and with UN Women’s suggestion to disaggregate by sex.
Malaria incident cases per 1,000 person per year
Colombia: As performance indicator it would be more adequate the Malaria mortalityPhilippines: Malaria deaths per 100,000 population
Estonia, Philippines, Turkey, Sudan, UK, Africa IAEG members support this indicator Paraguay does not support the indicatorUK: disaggregate by type of malarial disease, time of year, socioeconomic status (wealth or income group).UN Women: must be disaggregated by sex.
Summary of Comments - p. 17 of 265
3.3.4 WHO Tier IEstimated number of new hepatitis B infections per 100,000 population in a given year
EU: Remove "Estimated". Denmark, Colombia: additional indicator about neglected tropical diseases.Canada: suggest another indicator for Hep C. UN Statistical System Organisations and WHO: add “Number of people requiring interventions against neglected tropical diseases”.
Estonia, Turkey, Sudan, Uruguay, Africa IAEG members support this indicatorSwitzerland asks what about the NTDs. Hepatitis B incidence is close to HIV for transmission and rather an indicator of Vaccine coverageEcuador does not have the sources required to estimate the indicator Brazil: -There are no data sauces available for the calculation of the indicator; suggest a change for “Tier II” and the exclusion of the indicator.UN Women: must be disaggregated by sex.UNDP agrees with WHO’s suggestion to measure NTD incidence or prevalence through proxy at the very least, i.e. Number of people requiring interventions against neglected tropical diseases

Summary of Comments - p. 18 of 265
Target 3.4 By 2030, reduce by one third premature mortality from non-communicable diseases through prevention and treatment and promote mental health and well being. Suggestions for Modifications and Replacement Indicators Suggestions for Additional Indicators Additional Comments Tier
3.4.1 WHO Tier II
Target 3.5 Strengthen the prevention and treatment of substance abuse, including narcotic drug abuse and harmful use of alcohol.Suggestions for Modifications and Replacement Indicators Suggestions for Additional Indicators Additional Comments Tier
3.5.1 WHO, UNODC Tier II
Target 3.6 By 2020, halve the number of global deaths and injuries from road traffic accidents.Suggestions for Modifications and Replacement Indicators Suggestions for Additional Indicators Additional Comments Tier
3.6.1 Tier I
Suggested Indicators as of August 11
Possible Compiling Entity
Probability of dying of cardiovascular disease, cancer, diabetes, or chronic respiratory disease between ages 30 and 70
Cabo Verde: Difficult to measure. Alternative: Proportion of death caused by cardiovascular disease, cancer, diabetes, or chronic respiratory disease between ages 30 and 70Colombia: The indicator shouldn't be restricted to ages 30-70. We suggest including children with cancer. Mexico: the indicator discriminates against older people, i.e. deaths occurring after 70, UK: in line with WHO and World Bank agreed indicators. Should be: “Mortality between 30 and 70 years of age from cardiovascular diseases, cancer, diabetes or chronic respiratory diseases” Canada: suggested modification to indicator: Unconditional probability of dying between ages 30 and 70 years from cardiovascular diseases, cancer, diabetes, or chronic respiratory diseases.
Colombia: it's necessary to include some indicator about promotion of mental health and well-being.EU: An indicator concerning mental health to be considered either here (prevalence of severe mental disorders ) or under target 3.8 if indicator related to treatment coverage/ compliance is selected.UN Statistical System Organisations and WHO: An indicator on mental health was added as priority indicator: suicide mortality rate. (Agreed in World Health Assembly)UNFPA: • Healthy life expectancy at 60 by sex
Ecuador: we require a justification for the age range chosen to calculate this indicator. Ecuador does not have the sources required to estimate the indicator Switzerland comments that for LICs this must be a very rough estimate.Estonia, US, Sudan, UK, Africa IAEG members: support this indicator -Japan: Definition of proposed indicator is not clear and need the clarification. We also would like to know why it needs to be age binded.UN Statistical System Organisations: The age range for the NCD mortality indicator was kept at 30-70 years because this is what was agreed upon by the member states in the World Health Assembly as a follow up to the UN General Assembly resolution on NCDs.UN Women: must be disaggregated by sex.UNDP: UNDP agrees with UNWomen’s suggestion to disaggregate by sex and income.
Suggested Indicators as of August 11
Possible Compiling Entity
Coverage of treatment interventions (pharmacological, psychosocial and rehabilitation and aftercare services) for substance use disorders
Ecuador: percentage of people with treatment over the total population that report alcohol or other substance abuse.Brazil: Prevalence rate of alcohol abuseCanada: Coverage of prevention (e.g. education, community programs, media campaigns) and treatment interventions (e.g. pharmalogical, psychosocial, rehabilitation, aftercare services) for substance abuse disorders. Russia: "A share of the patients who successfully completed the rehabilitation program in the total number of patients with drug addiction who participated in the out-patient rehabilitation program during the reporting year".UN Statistical System Organisations: Percentage of people who suffer from substance abuse disorders receiving treatment and care (by substance and type of treatment/care)
Africa IAEG members: Additional indicator: "Coverage of interventions for the prevention of substance abuse"UN Statistical System Organisations and WHO: Harmful use of alcohol defined according to the national context as alcohol per capita (15+ years old) consumption within a calendar year in litres of pure alcohol, age-standardized prevalence of heavy episodic drinking or alcohol-related morbidity and mortality
Ecuador: it is necessary to specify if the indicator proposed is focused on people, number of plans or sums. Ecuador does not have the sources required to estimate the indicator Cabo Verde: need more information on that indicator. Italy views it is relevant , but it would be better to have data on type of services and number of people served Switzerland comments that in order to get a coverage figure, it will require an estimate of the affected population. Not that easy in LICs. Japan: Definition of proposed indicator is not clear.In each system of each country, the subject to be protected varies. Therefore, the following wording should be added to the indices. "Coverage of treatment interventions for substance use disorders’ should be based on each country’s conditions.”US, UK: Concept okay but major definitional and measurement issues.Brazil: There are no relevant data on the coverage and effectiveness of these interventions. - There is no consensus about treatment strategies. - We suggest an indicator that results from prevention and treatment.EU: Definition is superficial, needs to be improved.
Suggested Indicators as of August 11
Possible Compiling Entity
Number of road traffic fatal injury deaths per 100 000 population (age-standardized)
UNECE: road traffic fatal injury deaths per 100 000 passenger cars (Countries with very low motorization rates in 2015 are less likely to see decreases in road traffic fatal injury deaths per 100 000 population if they achieve substantial economic growth (and an associated increase in motorization rate). ). indicators have confidence intervals
Canada, Estonia, Turkey, Japan, US, Sudan, UK, Africa IAEG members support this indicatorSwitzerland asks what is meant by "age-standardized.UK, Montenegro: However, the full definition needs to include "within 30 days" (i.e. the death needs to occur within 30 days of the accident) as that is the standard definition used in the majority of countries)
WHO and UN Road Safety Collaboration

Summary of Comments - p. 19 of 265
Target 3.7 By 2030, ensure universal access to sexual and reproductive health-care services, including for family planning, information and education, and the integration of reproductive health into national strategies and programmes.
Suggestions for Modifications and Replacement Indicators Suggestions for Additional Indicators Additional Comments Tier
3.7.1 UNDESA, UNFPA Tier I
3.7.2 UNDESA, UNFPA Tier I
Suggested Indicators as of August 11
Possible Compiling Entity
Percentage of women of reproductive age (15-49 years) who have their need for family planning satisfied with modern methods.
UK: the wording should be changed to “Demand for family planning satisfied with modern methods”. Disaggregated by Age, income quintile, marital status, urban/rural, ethnicityUS: preferable language is "percent demand for family planning satisfied with modern contraceptive methods", If there is strong rationale to keep the existing language, then it should be modified to read "percentage of women of reproductive age (15-49) who want to avoid pregnancy who have their need for family planning satisfied with modern contraceptive methods" Canada: Percentage of women who have access to family planningUNFPA: Priority One: Percentage of primary health care facilities that offer essential SRH services (UNFPA is currently convening and leading on the development of methodology and baselines for this indicator); Priority Two: Proportion of young people 10-24 who demonstrate desired levels of knowledge and reject major misconceptions about the fertile period, methods of contraception, and HIV/AIDS (DHS/AIS); Priority Three: Percentage of women of reproductive age (15-49 years) who have their need for family planning satisfied with modern methods; Priority Four: Adolescent birth rate (births under age 16)
US: Percentage of demand met for family planning met with modern contraceptives (benchmark: 75%), disaggregated by age, geographic location, ethnicity, race, disability, health status and educational levelDenmark: comprehensive sexuality education curriculum developed and employed for primary and secondary school education as well as for out of school youthUNFPA: • Proportion of young people 10-24 who demonstrate desired levels of knowledge and reject major misconceptions about the fertile period, methods of contraception, and HIV/AIDS (DHS/AIS) • Percentage of primary health care facilities that offer an essential of SRH services, including: maternity with referral to EmONC; at least 3 methods of modern contraception; safe abortion to the extent of the law; HIV screening and referral for Tx; screening and treatment for prevalent STIs, depending on local epidemiology; Percentage of primary health care facilities that offer essential SRH services
Australia does not report on the fertility rate for women aged 10-14 years. 15-19 years is the fertility rate published (with under 15 years included). So for the purposes of international comparison this would be equivalent to an under 20 fertility rate. There are small cell (confidentiality) issues with releasing birth information for women aged under 15. Brazil: In order to guarantee sexual and reproductive health, including family planning, it would also be necessary to include men.Estonia, Turkey, Sudan, UK, Africa IAEG members , UN Women, UNFPA support this indicatorUS: This indicator would be strengthened with inclusion of its benchmark-- "at least 75%." Definitional and measurement issues; indicator intent okay but work needed.Portugal: concepts still to be defined
Adolescent birth rate (10-14; 15-19) per 1,000 women in that age group
UK: suggest indicator wording should be adolescent fertility rate rather than birth rate, defined by the number of births per 1000 girls.Denmark, US: Recommend expanding on this indicator to say: Adolescent birth rate (10-14 years, 15-17 years, 18-19 years)
Estonia, Philippines, Turkey, Japan, Sudan, UK, Africa IAEG members, UN Women, UNFPA support this indicator

Summary of Comments - p. 20 of 265
Target 3.8 Achieve universal health coverage, including financial risk protection, access to quality essential health-care services and access to safe, effective, quality and affordable essential medicines and vaccines for all.
Suggestions for Modifications and Replacement Indicators Suggestions for Additional Indicators Additional Comments Tier
3.8.1 Tier II
3.8.2 Tier II
Suggested Indicators as of August 11
Possible Compiling Entity
Coverage of tracer interventions (e.g. child full immunization, ARV therapy, TB treatment, hypertension treatment, skilled attendant at birth, etc.)
US: Other options:% of population covered by a package of essential health services% of bottom two quintiles covered by such a package% of out of pocket spending on health in the countryCanada: 1, Out-of-pocket and private/voluntary health insurance (as percentage of total health expenditure)2. Average of all consultations (preventative and curative) with a licensed provider in a health facility or the community, per person, per yearUNFPA, UNICEF: Coverage of tracer interventions may include: skilled attendance at birth, antenatal care, NTD preventive chemotherapy, ARV therapy, TB treatment, ITN use, also pneumonia care seeking and diarrhoea treatment with ORS+zinc in children; treatment severe mental illness; coverage emergency obstetric care, etc. UNICEF: The definition of "child full immunisation “should also be specified as recommended by WUENIC.
UK: suggest including an indicator for both Health worker density and distribution; and also immunization coverage rate by vaccine for each vaccine in the national schedule.
Brazil: The indicator requires a better definition, being more appropriate to measure health-care services coverage.Cabo Verde, Ecuador: It´s not one single indicator but a large set of indicator. Methodology is not clear as an composite indicator. Ecuador does not have the sources required to estimate the indicator Japan: The definition of this proposed indicator is not clear. It is necessary to clarify the coverage of tracer intervention. (No necessary to mention"etc.")US: Needs precision; too much included in one indicator. Africa IAEG members: Disagree. This indicator is taken care of in the above indicatorsCanada: Not sure that the proposed indicator captures the target. For example, it does not measure the financial risks that they refer to in the target, nor is it clear on what all the "tracer interventions" are included.EU: List of interventions to include to assume UHC needs to be defined.WHO and WB: inclusion of both service coverage and financial protection indicatorsUN DESA: Disaggregated by disability
WHO and World Bank
Fraction of the population protected against catastrophic/impoverishing out-of-pocket health expenditure
Cabo Verde, Africa IAEG members: Alternative indicator: "Number of the people covered by health insurance per 1000 population"Brazil: Number of countries and territories that have implemented actions in at least four of the following: - Moving towards designing comprehensive, quality, universal and progressively expanded health services. - Advancing towards the elimination of direct payment that constitutes a barrier to access at the point of service. - Increasing investment in the first level of care, as appropriate, in order to improve its response capacity. - Strengthening leadership capacity of the health authority for social participation and dialogue within the sector and with other relevant sectors of the government. - Strengthening links between health and community to address the social determinants of health.EU: replaced by "% of people covered by a basic health insurance that provides access to basic health care and services."WHO and WB: an indicator to monitor financial protection with the following two components to adequately measure UHC and assess progress toward achieving target 3.8: (i) the “fraction of population protected from experiencing catastrophic health expenditures” and (ii) the “fraction of population protected from experiencing impoverishing health expenditures”.
US: Percent of population with access to a health coverage scheme (public or private)Philippines: Share of out of pocket health expenditures in the total health expenditures, by income decile
US: The suggested indicator relates closely to the ability of people to withstand unexpected shocks by relying on financial services, whether to obtain funds quickly from family, to obtain a loan, to access insurance, or other. For this reason, we first recommend adoption of a financial inclusion indicator measuring access to financial services, These indicators are already tracked across 142 countries via World Bank Global Findex survey and closely watched/relied on by policymakers and private actors. Indicators are already disaggregated by sex, age, income, and location (urban/rural). Primary indicator could be similar to "% adults with a formal account or personally using a mobile money service in the past 12 months". However, we also support UNCDF's proposal of relying on the Findex to track access to insurance pro related risk-mitigation services, such as an indicator like "% of adults who have personally paid for insurance in last 12 months." Brazil: - Unexpected expenditure on health is hard to measure. - The indicator does not apply to countries with unified health systems. - This indicator could improperly show universal health system countries as facing difficulties in achieving the target.Japan, UK, UNFPA support this indicatorUN Women: disaggregated by sex.UN DESA: Disaggregated by disability
WHO and World Bank

Summary of Comments - p. 21 of 265
Target 3.9 By 2030, substantially reduce the number of deaths and illnesses from hazardous chemicals and air, water and soil pollution and contamination. Suggestions for Modifications and Replacement Indicators Suggestions for Additional Indicators Additional Comments Tier
3.9.1 WHO and OECD Tier I
Target 3.a Strengthen the implementation of the World Health Organization Framework Convention on Tobacco Control in all countries, as appropriate. Suggestions for Modifications and Replacement Indicators Suggestions for Additional Indicators Additional Comments Tier
3.a.1 WHO Tier I
Suggested Indicators as of August 11
Possible Compiling Entity
Population in urban areas exposed to outdoor air pollution levels above WHO guideline values
Germany: Death and disability from indoor and outdoor air quality, water/sanitation, and contaminated sites France: the indicator should better cover the entire target. It could for instance also include the number of technological disasters.Ecuador: an indicator that measures the rate of exposure to chemical products, air, water, and soil contamination.Denmark, UNECE support: an alternative indicator: UNEP has suggested an composite indicator based on Global Burden of Disease methodology, showing death and disability from indoor and outdoor air quality, water/sanitation and contaminated sites.WHO, UNEP: Mean levels of exposure to ambient air pollution (population weighted)WHO recommends to update the indicator as "Annual mean levels of exposure to fine particulate matter ambient air pollution (population weighted"
Turkey: Causes of death statistics should also be considered under this target.Colombia: include indicators about deaths and illnesses from water and soil contamination. We suggest identifying contaminant agents and related illnesses.Canada: Percentage of population with blood levels of lead and mercury above WHO guideline values. Germany: we vote for putting the hazard (death and illness), as referred to in the target, at the core of the indicator, not only the risk (exposure).Denmark: Deaths and illnesses from pesticide and biocide exposure/intake, exposure from contaminated sites and work place related exposure are issues that are very relevant and can be substantial in developing countries. EU: Should also take into account exposure to land, soil and water contamination. UN Women: Prevalence of lower respiratory infections by sex and age. UN Statistical System Organisations: add “Number of deaths from air, water and soil pollution and contamination”. UNEP: Percentage of population in urban and rural environments exposed to pollution levels above WHO guidelines.
Canada, Colombia, Denmark, Ecuador, Germany, France, Korea, Mexico, Turkey and Singapore, EU: Proposed indicator does not address the target description as it only considers air pollution. Equally important, the indicator only covers outdoor air pollution, while the target also covers indoor air pollution, hazardous chemicals, water and soil pollution. Ecuador does not have the sources required to estimate the indicator Sudan, UK, Africa IAEG members supports this indicator. UK recommend use of population weighted measures. ‐Brazil: In the country, only nine metropolis measure air pollution levels Although international agencies classify the indicator under “Tier I”, we suggest a change for “Tier II” due to the absence of availabledata sources. We suggest sharing the indicator with SDG 11.Paraguay does not support the indicatorUN Women: must be disaggregated by sex.
Suggested Indicators as of August 11
Possible Compiling Entity
Tobacco use among persons 18 years and older
Age-standardized prevalence of current tobacco use among persons aged 18 years and older
Brazil proposes this replacement indicator: "Prevalence of tobacco use among teenagers attending school"Colombia: The indicator should include all ages. However, information from household surveys could be not very accurate. We suggest an indicator about the progress in the implementation of the agreements. Denmark: We support the use of the previously suggested indicator under target 3.4 to set the age cut off at 15 rather than 18 years of age, taking into account the actual age adolescents begin to smoke.
Brazil: Because the use of tobacco is an important risk factor for chronic diseases and the adolescence is a strategic period for actions aimed at the prevention of the development of risky behavior, we suggest the replacement for an indicator which can include adolescentpeople. Japan, Turkey, Africa IAEG members support this indicatorJapan use the indicator of Tobacco use among persons 20 years and older because people under 20 years of age are prohibited to smoke.EU: Definition is superficial.UK: disaggregation By sex; age group; rural/urban; socioeconomic status (wealth or income group)UN Women: must be disaggregated by sex.

Summary of Comments - p. 22 of 265
Suggestions for Modifications and Replacement Indicators Suggestions for Additional Indicators Additional Comments Tier
3.b.1 WHO Tier I
Target 3.c Substantially increase health financing and the recruitment, development, training and retention of the health workforce in developing countries, especially in least developed countries and small island developing States.
Suggestions for Modifications and Replacement Indicators Suggestions for Additional Indicators Additional Comments Tier
3.c.1 WHO Tier I
Target 3.b Support the research and development of vaccines and medicines for the communicable and non-communicable diseases that primarily affect developing countries, provide access to affordable essential medicines and vaccines, in accordance with the Doha Declaration on the TRIPS Agreement and Public Health, which affirms the right of developing countries to use to the full the provisions in the Agreement on Trade-Related Aspects of Intellectual Property Rights regarding flexibilities to protect public health, and, in particular, provide access to medicines for all.
Suggested Indicators as of August 11
Possible Compiling Entity
Proportion of population with access to affordable essential medicines on a sustainable basis
Cabo Verde: Proportion of population with access to affordable essential drugs on a sustainable basisAfrica IAEG members: should also Include qualityWHO: “Proportion of population with access to affordable essential medicines and vaccines on a sustainable basis”UN Statistical System Organisations: Proportion of population with access to affordable essential medicines, vaccines and technologies
Colombia: It should include a measurement about support for research and development of vaccines and medicines.US: select one of the following: Public, private and non-profit investment in R&D for the health needs of developing countries; Number of new registered health technologies targeting the health needs of developing countries (compared to 2015); Gross domestic expenditure on R&D (GERD); Number of new health technologies registered by the National Medicines Regulatory Authority and/or recommended by national guidelines (compared to 2015) ; National Medicines Regulatory Authorities participating in harmonized registration initiatives based on internationally recognized policies and standards; and sharing regulatory policies, legislation, guidelines and information on registered products ; Number of formal coordination and collaboration initiatives aimed at increasing and facilitating transfer of health-related technology, including between public and private entitiesUN Statistical System Organisations: add "•Total net official development assistance to the medical research and basic health sectors" to address Colombia's comment
Brazil: The term “essential medicines” restricts the access. We suggest replacing it for “safe, high-quality and free medicines”.Colombia: We consider that this indicator is not adequate for covering the targetEcuador: we require further explanation on whether the population with access to essential drugs refers to existence or rather payment capacity. It is also necessary to determine what drugs are considered essential. Ecuador does not have the sources required to estimate the indicator Turkey thinks It is relevant indicatorSwitzerland comments that LICs have difficulty in monitoring drug stocks, especially in deprived areas.Japan: The definition of this proposed indicator is not clear.Canada: We support the inclusion of a commonly accepted understanding/definition of essential medicines, such as the that used in the WHO Model List of Essential Medicines. Need to define affordable. Also note that the target refers to 'developing countries'.US: Should reference "quality, safe, effective" as well as "affordable." Retention of "essential" important. 1) the target conflates the need for global health R&D with the need for fair pricing of essential medicines, or access. 2) excludes many important R&D areas, including diagnostics, vector control products, microbicides and other health technologies, as well as behavioural or policy-related interventions. 3) Target 3.b was inserted in the final session of the year-long Open Working Group discussion with the status of a 'means of implementation' indicator. As a result, Target 3.b is subsidiary to the nine 'core' health targets and not a focus of indicator development efforts.
Suggested Indicators as of August 11
Possible Compiling Entity
Health worker density and distribution
Denmark: Health worker density and distribution [ADD] by categories, geographic distribution, place of employment etc.Canada: 1) % of healthcare budget used for human capital; 2) minimum data set of top professions (e.g., #of seats in schools, #of graduates, 3) current proposed indicator by profession.
US: percentage of total health workers routinely tracked with key workforce indicators (including recruitment, development, training, and retention) by national health workforce information system or registry. Germany: One indicator seems insufficient in measuring both aspects (staff and financing). An additional indicator covering the financial aspect seems indicated.UN Statistical System Organisations: total official net development assistance for health.
Brazil: Generic indicator which does not include monitoring of the proposed target. Suggest a separate calculation for the following professional categories: doctors, nurses and dentists.Japan, Portugal Sudan, UK, Africa IAEG members support this indicatorColombia: It is necessary to clarify if the distribution is geographical.Estonia: Data available from LFS. May not be reliable on subnational levels (counties).Canada: There are two things that need to be measured here: 1) Increases in health financing; and 2) health workforce recruitment, development, training and retention. Overall, this indicator is too vague in that it does not distinguish between different professions that may be needed (i.e. not only reporting on doctors and nurses but also pharmacists, paramedics, social workers, personal support workers, and their distribution based on need).

Summary of Comments - p. 23 of 265
Target 3.d Strengthen the capacity of all countries, in particular developing countries, for early warning, risk reduction and management of national and global health risks. Suggestions for Modifications and Replacement Indicators Suggestions for Additional Indicators Additional Comments Tier
3.d.1 WHO Tier II
General Comments
Suggested Indicators as of August 11
Possible Compiling Entity
Percentage of attributes of 13 core capacities that have been attained at a specific point in time.
Denmark: Need a specific reference to the WHO IHR core capacities. Canada: Explicitly include Multi Hazard Early Warning System to the list of core capacities
Sudan, Africa IAEG members support this indicatorEcuador, Estonia: Indicator is not clearly defined to measure. Ecuador does not have the sources required to estimate the indicator Italy, Paraguay: not measurable and not fit with the targetCanada: proposed indicator does not fully provide adequate measure of the target.India comments that the indicator does not reflect International Cooperation.UN Statistical System Organisations: The implementation of the IHR has not become an international affair with all countries needing to work together to ensure that all countries implement the IHR. Therefore, the IHR full implementation rate could be considered an indicator of not only the performance of single countries, but of the global community as a whole.
Australia: The indicators proposed for Goal 3 appear to be based on health indicators currently used by the WHO and OECD. This will limit any additional reporting burden.

Summary of Comments - p. 24 of 265
Goal 4 Ensure inclusive and equitable quality education and promote lifelong learning opportunities for all Target 4.1 By 2030, ensure that all girls and boys complete free, equitable and quality primary and secondary education leading to relevant and effective learning outcomes.
Suggestions for Modifications and Replacement Indicators Suggestions for Additional Indicators Additional Comments Tier
4.1.1 UNESCO-UIS Tier III
Target 4.2 By 2030, ensure that all girls and boys have access to quality early childhood development, care and pre-primary education so that they are ready for primary education. Suggestions for Modifications and Replacement Indicators Suggestions for Additional Indicators Additional Comments Tier
4.1.2 UNESCO-UIS Tier III
Suggested Indicators as of August 11
Possible Compiling Entity
Percentage of children/young people at the end of each level of education achieving at least a minimum proficiency level in (a) reading and (b) mathematics. Disaggregations: sex, location, wealth (and others where data are available)
Cabo Verde , Africa IAEG-SDG Members and USA: should be specific to primary & secondary levels.Germany: Replace ind. by: Percentage of children/young people at the end of each level of education achieving at least a minimum proficiency level in reading and mathematics.Canada: Address def. of "minimum proficiency" &"free" not capturedDenmark: only focus on primary education/"free" not capturedUN Statistical System: Modify slightly - (Percentage of children/young people (i) in Grade 2/3, (ii) at the end of primary and (iii) at the end of lower secondary achieving at least a minimum proficiency level in (a) reading and (b) mathematics)European Commission: Expand to (a) proficiency in a foreign language and/or (b) personal and social skills.UNESCO/TAG: Percentage of children who achieve minimum proficiency standards in reading/mathematics at end of: (i) primary and (ii) lower secondary school; Consider other levels (e.g. Grade 2) alsoEuropean Commission: Expand to (a) proficiency in a foreign language and/or (b) personal and social skills.
Philippines: critical to include- Completion rate (primary, lower secondary, upper secondary) / add Functional literacy rate, by sex and age groupUK: supports ind., but prefer "Percentage of children who achieve minimum proficiency standards in reading and mathematics at the end of: [(a) grade 2] (b) primary school (c) lower secondary school." Need work on def. of 'minimum proficiency' according to each assessment, at each of the levels (ages) currently assessed using PISA, TIMSS and PIRLS.SG-Envoy on Youth: "Enrolment (particularly for secondary education)" & "Completion rate (primary, lower secondary and upper secondary, by age, sex, residence and other characteristics)”UNESCO/ICT Partnership: Enrolment in primary and secondary educ. programmes w/ computers for pedagogical purposes, by sex (ISCED 1-3), existing/collected by UIS
[Continued comments from 'Additional Comments' section]Japan and Portugal: Definition of proposed ind. not clear and needs clarification.Philippines and Estonia: Indicator is relevant. Data avail.- OECD PISA or PIAAC surveyUNESCO/TAG: Ind. needs global metric for each subject as a reference point to which different assessments (national, regional and international) can be anchored. European Commission: Add disaggreg. by disability (sub-national level also desirable, where available).UN-Women: disaggregate by sex 4.1, 4.2, 4.3, 4.4 and 4.6SG-Envoy on Youth: support, but ind. is insufficient for globally measuring the target.
Australia: Acceptable, but limited depending upon jurisdictional agreement to the word ‘free’. School completion does not necessarily equate to free, equitable, quality education. Differences in testing procedures and standards between countries are likely to impact comparability between countries/internationally. Potential for progress against this measure to be misrepresented as a result of data comparability issues. Participated in a number of international assessments but they do not align with the end of primary and secondary schooling in Australia. Data are available from national testing, but are not internationally comparable. Ecuador: academic performance evals. are adequate, but need int'l comparability and calculate only for sig. yrs, like 3rd, 6th of primary & 9th.France: welcomes ten main indicators proposedGermany: Agree with ind., but skeptical of “universal learning scale” or a “global metric”. Ind. based on nationally defined standards might be sufficient & disadvantages of universal scale outweigh advantages of int'l comparability. Regional level as alternative approach. One figure is sufficient (no disagg.).Malaysia (4.1.1- % of children who achieve min. proficiency standards in reading & mathematics at end of: (i) primary (ii) lower seconary): (primary) At present, result from LINUS & LINUS 2.0 could be used for this purpose. Malaysia didn't participate in EGRA or PIRLS. (lower secondary) Available PISA/TIMSSSpain: Difficult to calculate ind. from household surveys for 4.1.2 (Percentage of children/young people aged 3-5 years above the official age for the last grade of each level of education who have completed that level)// Use UOE questionn.; UNESCO-UIS Italy: OECD countries- only PISA survey collects data on proficiency in (a) reading and (b) mathematics (15 years old)/ Proposed ind. only est. through INVALSI eval. survey (sex/geographical area)Cabo Verde: Need more information on this ind.China: Not available/No disaggregated data Canada: Maps to OECD-EAG/ caution w/ comparing assess. developed independently/ Keep headline on enrolment/ completion (like 4.1.2) [continued]
Suggested Indicators as of August 11
Possible Compiling Entity
Percentage of children under 5 years of age who are developmentally on track in health, learning and psychosocial well-being
Disaggregations: sex, location, wealth (and others where data are available)
Australia: : Indicator measures outcome not access. Suggests amending to ‘Number. of children in early childhood schooling’.Brazil: due to lack of avail. data (ECDI/MICS) suggest "Participation rate in organized learning (one year before the official primary entry age)" as a replacement indicator.Ecuador: proposed ind. should be defined clearly, specify whether it aims to measure "child development" or "service access". Germany: Target does not ask for disaggregation. Modify to: "Percentage of children under 5 years of age who are developmentally on track in health, learning and psychosocial well-being."Spain: Participation rate in organized learning (one year before the official primary entry age): consider participation rate of specific "age" for all countries (ie. 4 or 5 yrs)/ Use UOE questionnaire- UNESCO-UISCanada: in part agreement/details of measurement critical (what is "on track" for each component)/suggest gender/disability disagg.
Ecuador: suggests "Percentage of children with access to child care services". The specification of what test will be used to measure is essential for the estimation of the proposed indicator.Africa IAEG-SDG Members: Partially agree (w/ ind.)/Include ind. on participation rate in organised learning two years before the official primary entry agePhilippines: critical to include Early Childhood Development Index / add Total education expenditure by sources and uses of funds, by level of educationUN-Women: "Proportion of pre-school children who are in Early Childhood Care and Education (ECCE) programmes"; relevance to 5.4, Tier III, UNESCO
Australia: Australian Early Development Census typically collects only on 4-6 years old, and wealth disaggregation is currently unavailable.Denmark: Indicator not equally relevant to all MS. Suggest to open to include nat'l circumstances./Add'l interlinkages to 4.1, 4.6 & 4.a/Previously commented on wording of 4.2 – on alignment of terminology on ECEC area & importance of daycare. Consider letting goals follow each other chronologically and move the target on ECEC from 4.2 to 4.1.Malaysia: Early Childhood Development Index (ECDI). Can only provide enrolment in registered preschool and private preschool, but not ECDI.Italy: Proposed ind. too generic and not appropriate for target.Mexico: methodological def. required for calculation & variables-- to determine poss.to measure/periodicity.China: Not available/No relevant surveys or data sources in ChinaCabo Verde: Need more information on this indicator.Philippines: Early Childhood Deevlopment Index (feasible w/ strong support; need to discuss-consider other ind./very relevant)Portugal: concepts still to be defined;complete data for under 3 yrs. may not existUK: agrees w/ outcome focussed, but don't have any such study (includ. ECDI)/ ‐Index needs refinement & revision to be fit for this purpose.US: difficult/sensitive to measure, results very sensitive to constructs. Multiple existing measures in health sector that could be applied to track this.UN Statistical System: Retain suggested priority indicator UNICEF: supports proposed ind. Early Childhood Development & requests to be lead agencyUNESCO/TAG: Ind. tracked via Early Childhood Development Index, available from MICS but work is needed over next 3-5 years to examine other alternatives, reach consensus and develop a set of questions for use across surveys.European Commission: Add disagg. by disability. Reliance on household surveys risks skewing results (poorest/most disadvant. often not reflected)/source for the Early Childhood Dev't Index?

Summary of Comments - p. 25 of 265
UNESCO-UIS Tier IIIPercentage of children under 5 years of age who are developmentally on track in health, learning and psychosocial well-being
Disaggregations: sex, location, wealth (and others where data are available)
Australia: : Indicator measures outcome not access. Suggests amending to ‘Number. of children in early childhood schooling’.Brazil: due to lack of avail. data (ECDI/MICS) suggest "Participation rate in organized learning (one year before the official primary entry age)" as a replacement indicator.Ecuador: proposed ind. should be defined clearly, specify whether it aims to measure "child development" or "service access". Germany: Target does not ask for disaggregation. Modify to: "Percentage of children under 5 years of age who are developmentally on track in health, learning and psychosocial well-being."Spain: Participation rate in organized learning (one year before the official primary entry age): consider participation rate of specific "age" for all countries (ie. 4 or 5 yrs)/ Use UOE questionnaire- UNESCO-UISCanada: in part agreement/details of measurement critical (what is "on track" for each component)/suggest gender/disability disagg.
Ecuador: suggests "Percentage of children with access to child care services". The specification of what test will be used to measure is essential for the estimation of the proposed indicator.Africa IAEG-SDG Members: Partially agree (w/ ind.)/Include ind. on participation rate in organised learning two years before the official primary entry agePhilippines: critical to include Early Childhood Development Index / add Total education expenditure by sources and uses of funds, by level of educationUN-Women: "Proportion of pre-school children who are in Early Childhood Care and Education (ECCE) programmes"; relevance to 5.4, Tier III, UNESCO
Australia: Australian Early Development Census typically collects only on 4-6 years old, and wealth disaggregation is currently unavailable.Denmark: Indicator not equally relevant to all MS. Suggest to open to include nat'l circumstances./Add'l interlinkages to 4.1, 4.6 & 4.a/Previously commented on wording of 4.2 – on alignment of terminology on ECEC area & importance of daycare. Consider letting goals follow each other chronologically and move the target on ECEC from 4.2 to 4.1.Malaysia: Early Childhood Development Index (ECDI). Can only provide enrolment in registered preschool and private preschool, but not ECDI.Italy: Proposed ind. too generic and not appropriate for target.Mexico: methodological def. required for calculation & variables-- to determine poss.to measure/periodicity.China: Not available/No relevant surveys or data sources in ChinaCabo Verde: Need more information on this indicator.Philippines: Early Childhood Deevlopment Index (feasible w/ strong support; need to discuss-consider other ind./very relevant)Portugal: concepts still to be defined;complete data for under 3 yrs. may not existUK: agrees w/ outcome focussed, but don't have any such study (includ. ECDI)/ ‐Index needs refinement & revision to be fit for this purpose.US: difficult/sensitive to measure, results very sensitive to constructs. Multiple existing measures in health sector that could be applied to track this.UN Statistical System: Retain suggested priority indicator UNICEF: supports proposed ind. Early Childhood Development & requests to be lead agencyUNESCO/TAG: Ind. tracked via Early Childhood Development Index, available from MICS but work is needed over next 3-5 years to examine other alternatives, reach consensus and develop a set of questions for use across surveys.European Commission: Add disagg. by disability. Reliance on household surveys risks skewing results (poorest/most disadvant. often not reflected)/source for the Early Childhood Dev't Index?

Summary of Comments - p. 26 of 265
Target 4.3 By 2030, ensure equal access for all women and men to affordable and quality technical, vocational and tertiary education, including university.Suggestions for Modifications and Replacement Indicators Suggestions for Additional Indicators Additional Comments Tier
4.3.1 UNESCO-UIS Tier II
Target 4.4 By 2030, substantially increase the number of youth and adults who have relevant skills, including technical and vocational skills, for employment, decent jobs and entrepreneurship.Suggestions for Modifications and Replacement Indicators Suggestions for Additional Indicators Additional Comments Tier
4.4.1 ITU Tier I
Suggested Indicators as of August 11
Possible Compiling Entity
Participation rate of adults in formal and non-formal education and training in the last 12 months
Brazil: Suggest "Participation rate in tertiary education (5-year age-group immediately following the end of upper secondary education)" as replacement indicator.Ecuador: need to determine objective pop. in order to measureDenmark: Suggest insert reference of def. of "adults" that will be applied – UN definition (pop. aged 15 years and above)/proposed indicator does not measure “affordable”Cabo Verde: Include an indicator on gross enrolment ratios for technical, vocational and tertiary education and disaggregated by sexSwitzerland comments that the indicator should be disaggregated by gender.Japan: instead of adults change to "all women and men"Spain: Level and type of education- limit to formal education-- UNESCO-UIS (UOE)UK: disagg. by level of education & training adults are participating in. No int'l def of 'technical' education (needs further work)/Need target age.US: participation rate of adults may not get at "equal access"/disagg. should be by sex, ethnicity, race, disability, socio-economic status. Should measure technical, vocational, tertiary adn higher ed rather than "formal and non-formal"UN Statistical System: Modify slightly suggested priority ind. (Percentage of people in a given age-range participating in education or training in the 12 months prior to being interviewed) to cover both youth and adults.
Africa IAEG-SDG Members: Partially agree (w/ ind.)/Include ind.on gross enrolment ratios for technical, vocational and tertiary education and disaggregated by sexGermany: "Share of annual household expenditure on education per child in higher education"UN-Women: Suggest "distribution of tertiary graduates by field of study and sex" (Tier I, produced by UNESCO, relevant to 4.5)UN Statistical System: "Distribution of tertiary graduates by field of study and sex" - one of the Minimum Set of Gender IndicatorsSG-Envoy on Youth: supports UNICEF/UNESCO proposed indicators- “Enrolment ratios by level and type of education: (a) participation rate of 15-24 year olds in TVET and (b) gross enrolment ratio in tertiary education (a) the percentage of young people aged 15-24 years participating in technical and vocational education or training (in a given time period eg last 12 months) (b) total enrolments of any age in tertiary education expressed as a percentage of the 5-year age-group immediately following the end of upper secondary education”UNESCO/ICT Partnership: Individuals w/ ICT skills, by type of skill, by sex (existing, collected by ITU)
Malaysia: Enrolment ratios by level and type of education (TVET and tertiary). Can only provide TVET enrolment ratio for Vocational Colleges.Australia: limited utility w/o building in some measure of quality. Indicator does not address all aspects of the target. While participation rates can be used as a proxy for affordability, this does not measure quality. Brazil: Considerable work is required to develop a set of questions to be applied in labour force or other surveys globally since there is no shared methodology and definition about non-formal education and training./there is no data available at national level about vocational, technical qualification or training in the 12 months prior to the interview. Therefore, the indicator should be classified in “Tier III”. Gender inequality in education could be measured in a more straightforward way by the participation rate in tertiary education of men and women (5-year agegroup immediately following the end of upper secondary education).China: indicator available.Portugal: data avail. every 5 yrs. through Adult Ed. surveyPhilippines: critical to include Enrolment ratios by level and type of education (TVET and tertiary)Germany: Element of affordability of targets not covered by proposed inds. Philippines: easily feasible (method. exists/data avail.)/support the ind./very relevant/additinal disagg. feasible w/ strong effort)Malaysia: Doesn't specify age group of women/men whom will be the main target group.Canada: in part agree, provides full/adequate measure of target/disagg. by gender/disabilityBrazil: Ind. should be classified as Tier III (due to considerable work needed to develop questions in labor force or other survey)/European Commission (4.3.1): [Consider?] Students by ISCED level, study intensity (full-time, part-time) and sex.UNESCO/TAG: Currently data are only available on adult education in European Union countries. Considerable work is required to develop a set of questions to be applied in labour force or other surveys globally.European Commission & Eurostat: Overlaps with 4.4./ Inds. 4.3 & 4.4 are virtually identical.
Suggested Indicators as of August 11
Possible Compiling Entity
Percentage of youth/adults with ICT skills by type of skill
Brazil: Reclassify as Tier III (due to no easily collected data for construction of ind/no methodology/shared concepts globally). Suggest this indicator as replacement indicator "Upper secondary attainment rate (25- to 64- year-olds)"Denmark: Include all ICT platforms – also mobile phones and mobile access to the internet/too narrow interpretation of target and does not capture “decent jobs” nor “entrepreneurship”/ Explicate age range for “youth/adults”.Germany: Too focused on ICT skills. Suggest more global indicator to cover a branch of relevant skills. Replace indicator with “illiteracy rate” in short & “Percentage of population having a specific educational level (such as upper secondary or third)” in long run// See difficulties for clear def. of "relevant skills" Colombia: Necessary to define "relevant skills" & include more ind. to cover target.Cabo Verde: Reformulate to: percentage of 15-34 with basic skills in ICTUS: very broad, more realistic to measure participation than to try to define what "youth/adults with ITC skills" means.Ecuador: request specification of when an individual is considered to have “ICT abilities”, under what parameters is this indicator calculated.
UNESCO/ICT Partnership: 1) Enrolment in basic computer skills and/or computing courses in secondary education, by sex (ISCED 2-3) (Existing, collected by UIS)// 2) Proportion of graduates in ICT-related fields at post-secondary levels (ISCED 4-8) (sex disaggregated) (Existing, collected by UIS)// 3) Individuals w/ ICT skills, by type of skill, by age (existing, collected by ITU)UN Statistical System & SG-Envoy on Youth: Skills mismatch index
Australia: Need to clearly define the concepts in the target and indicator. need to measure technical/vocational/entrepreneurship skills from primary and high school through to vocational and/or tertiary education and job outcomes. Consider the related concept on ‘safe and secure ICT skills’. To do otherwise would appear to leave people acquiring ICT skills exposed to malicious cyber activity. Ecuador doesn't have sources for estimation of inds. needed Colombia: Proposed ind. is relevant, but not currently feasible Malaysia: Has public and private educational institutions, and others for 25-64 years. [Participation rate in formal & non-formal education and training in the last 12 months among 25-64]China: some int'l organizations have data for this, but we do not. Need clarification on whether the data is provided by related int'l orgs or nat'l agencies when collecting data for global monitoring.Slovenia: LFS appears as a possible source (with other household surveys) for 4.4.2--think that the LFS (in the current form) cannot be a source in these cases.Portugal: same source as 5.bCanada: agree ind. provides full/adequate measure of target/disagg. by gender/disabilityUK: Difficult to implement domestically/ ICT skills as headline ind. is only one component, also need def. of ‘ICT skills’ (which wouldn't remain relevant and comparable over time)/ Target should (1) be measured nationally or (2) look at employer satisfaction w/ employee skills/skills gaps, as per ILO skills mismatch suggestion or (3) measure through % of graduates/ school leaversAfrica IAEG-SDG Members & SG-Envoy on Youth: supports/agrees w/ ind.UN Statistical System: Retain suggested priority indicator UNESCO/TAG: Few surveys (e.g. ICILS) attempt to measure such skills. Major efforts required to develop global data collection.European Commission: Overlaps with 4.3

Summary of Comments - p. 27 of 265
ITU Tier IPercentage of youth/adults with ICT skills by type of skill
Brazil: Reclassify as Tier III (due to no easily collected data for construction of ind/no methodology/shared concepts globally). Suggest this indicator as replacement indicator "Upper secondary attainment rate (25- to 64- year-olds)"Denmark: Include all ICT platforms – also mobile phones and mobile access to the internet/too narrow interpretation of target and does not capture “decent jobs” nor “entrepreneurship”/ Explicate age range for “youth/adults”.Germany: Too focused on ICT skills. Suggest more global indicator to cover a branch of relevant skills. Replace indicator with “illiteracy rate” in short & “Percentage of population having a specific educational level (such as upper secondary or third)” in long run// See difficulties for clear def. of "relevant skills" Colombia: Necessary to define "relevant skills" & include more ind. to cover target.Cabo Verde: Reformulate to: percentage of 15-34 with basic skills in ICTUS: very broad, more realistic to measure participation than to try to define what "youth/adults with ITC skills" means.Ecuador: request specification of when an individual is considered to have “ICT abilities”, under what parameters is this indicator calculated.
UNESCO/ICT Partnership: 1) Enrolment in basic computer skills and/or computing courses in secondary education, by sex (ISCED 2-3) (Existing, collected by UIS)// 2) Proportion of graduates in ICT-related fields at post-secondary levels (ISCED 4-8) (sex disaggregated) (Existing, collected by UIS)// 3) Individuals w/ ICT skills, by type of skill, by age (existing, collected by ITU)UN Statistical System & SG-Envoy on Youth: Skills mismatch index
Australia: Need to clearly define the concepts in the target and indicator. need to measure technical/vocational/entrepreneurship skills from primary and high school through to vocational and/or tertiary education and job outcomes. Consider the related concept on ‘safe and secure ICT skills’. To do otherwise would appear to leave people acquiring ICT skills exposed to malicious cyber activity. Ecuador doesn't have sources for estimation of inds. needed Colombia: Proposed ind. is relevant, but not currently feasible Malaysia: Has public and private educational institutions, and others for 25-64 years. [Participation rate in formal & non-formal education and training in the last 12 months among 25-64]China: some int'l organizations have data for this, but we do not. Need clarification on whether the data is provided by related int'l orgs or nat'l agencies when collecting data for global monitoring.Slovenia: LFS appears as a possible source (with other household surveys) for 4.4.2--think that the LFS (in the current form) cannot be a source in these cases.Portugal: same source as 5.bCanada: agree ind. provides full/adequate measure of target/disagg. by gender/disabilityUK: Difficult to implement domestically/ ICT skills as headline ind. is only one component, also need def. of ‘ICT skills’ (which wouldn't remain relevant and comparable over time)/ Target should (1) be measured nationally or (2) look at employer satisfaction w/ employee skills/skills gaps, as per ILO skills mismatch suggestion or (3) measure through % of graduates/ school leaversAfrica IAEG-SDG Members & SG-Envoy on Youth: supports/agrees w/ ind.UN Statistical System: Retain suggested priority indicator UNESCO/TAG: Few surveys (e.g. ICILS) attempt to measure such skills. Major efforts required to develop global data collection.European Commission: Overlaps with 4.3

Summary of Comments - p. 28 of 265
Suggestions for Modifications and Replacement Indicators Suggestions for Additional Indicators Additional Comments Tier
4.5.1 UIS Tier I
Target 4.6 By 2030, ensure that all youth and a substantial proportion of adults, both men and women, achieve literacy and numeracy. Suggestions for Modifications and Replacement Indicators Suggestions for Additional Indicators Additional Comments Tier
4.6.1 Tier III
Target 4.5 By 2030, eliminate gender disparities in education and ensure equal access to all levels of education and vocational training for the vulnerable, including persons with disabilities, indigenous peoples and children in vulnerable situations.
Suggested Indicators as of August 11
Possible Compiling Entity
Parity indices (female/male, urban/rural, bottom/top wealth quintile] for all indicators on this list that can be disaggregated
Denmark: Doesn't capture whether equal access has been achieved for persons with disabilities nor for indigenous peoples.Germany: Include “people with disabilities” (gradually) in parity indices. Clear definition of “people with disabilities” is needed.US: availability varies widely across ind./Defs. of urban/rural vary across countries; bottom/top wealth quintile avail. in almost no survey across globe (should be abandoned). Bottom/top earnings data avail. for some measures/countries.UN Statistical System: Modify to ... wealth quintile "and others such as disability status and conflict-affected as data become available" for all indicators...
UN Statistical System: "Percentage of teachers in service who have received in-service training in the last 12 months to teach students with special educational needs" & "Percentage of children and youth in vulnerable situations who have non-discriminatory" UN-Women: Gender Parity Index for targets 4.1, 4.2, 4.3, 4.4 and 4.6 (Tier I, UNESCO)
Australia: Persons with disabilities, Indigenous peoples and children in vulnerable situations are not covered by this indicator. In Australia access to education is available by a number of disaggregations, but not by wealth quintiles.Ecuador doesn't have sources for estimation of inds. needed Colombia: Indicators are relevant; however, there isn't a common definition about wealth for obtaining this indicator for quintile.Portugal: depending on concepts, detailed disagg. may not be feasibleChina: not available/ No relevant surveys or data sources Philippines: feasible w/ strong effort/discuss or consider other ind./very relevant/disagg. feasible w/ strong effortUK: support/ monitor through disagg. of all other measures. Agree w/ World Bank comments-- way in which different groups are compared might be given further consideration.Japan: Definition of proposed ind. not clear & needs clarification.Africa IAEG-SDG Members & SG-Envoy on Youth: supports/agrees w/ proposed indicator.European Commission: Add disagg. by disability & ethnic group.DESA/disability: disagg. ind. for persons with/without disabilities (e.g. Primary school net attendance ratio for children with disabilities; Secondary school net attendance ratio for children with disabilities) & ‘percentage of teachers receiving in-service training each year on inclusive education/on teaching students with special educational needs’ (links to 4.c and 10.2)UNESCO/TAG: Recommend parity index, but alt. ideas include: (i) odds ratio; (ii) concentration index; or (iii) least advantaged group (e.g. poorest rural girls) relative to the mean. Also, educational inds. for people w/ disabilities will be monitored in line w/ efforts to improve coverage.
Suggested Indicators as of August 11
Possible Compiling Entity
Percentage of the population in a given age group achieving at least a fixed level of proficiency in functional (a) literacy and (b) numeracy skills.
Disaggregations: sex, location, wealth (and others where data are available)
Brazil: suggest this replacement indicator "Youth/adult literacy rate" (b/c most countries don't have survey to assess proficiency/skills of youth-adults like PIAAC)Ecuador suggests a change to "Percentage of population 15 to 24 that is illiterate" and "Percentage of the population 15 to 24 that is a functioning illiterate". Ecuador does not have an indicator to measure arithmetic abilities.
SG-Envoy on Youth: welcomes inclusion of ind. "Youth/adult literacy rate" Australia: Need to clearly define the concepts in the target and indicator (e.g., youth). Cabo Verde: Need more information on this indicator.Canada: Potentially agree--Determining the level of proficiency to use would be difficult. PIAAC was not designed to be used in this way, unlike IALSS. It would be better to look at skills across proficiency levels, rather than focusing on one benchmark.Colombia: Necessary to clarify the definition of the “levels of proficiency”. UK: supports/need to define int'l 'literacy' and 'numeracy' and best way to test / Priority should be a reasonably robust literacy/ numeracy module included and standardised in regular surveys.Spain: Hard to get illiteracy rate when country at 100%/consider 5% ranges (use household surveys/UNESCO-UIS has data)China: not available/consists of several sub-ind.,not able to provide allPhilippines: easily feasible (method. exists/data avail.)/support the ind./very relevantPortugal: data not avail.Africa IAEG-SDG Members, UN Statistical System & SG-Envoy on Youth: Retain/Agree w/ suggested priority indicator UNESCO/TAG: A number of middle-income (STEP) and high-income (PIAAC) countries have assessed literacy & numeracy skills of adults, a cost-effective tool needs to be inserted in other surveys for use across countries.
UNESCO-UIS, World Bank, OECD

Summary of Comments - p. 29 of 265
Suggestions for Modifications and Replacement Indicators Suggestions for Additional Indicators Additional Comments Tier
4.7.1 Tier III
Target 4.a Build and upgrade education facilities that are child, disability and gender sensitive and provide safe, non-violent, inclusive and effective learning environments for all.Suggestions for Modifications and Replacement Indicators Suggestions for Additional Indicators Additional Comments Tier
4.a.1 Tier II
Target 4.7 By 2030, ensure that all learners acquire the knowledge and skills needed to promote sustainable development, including, among others, through education for sustainable development and sustainable lifestyles, human rights, gender equality, promotion of a culture of peace and non-violence, global citizenship and appreciation of cultural diversity and of culture's contribution to sustainable development.
Suggested Indicators as of August 11
Possible Compiling Entity
Percentage of 15-year old students enrolled in secondary school demonstrating at least a fixed level of knowledge across a selection of topics in environmental science and geoscience. The exact choice/range of topics will depend on the survey or assessment in which the indicator is collected.
Disaggregations: sex and location (and others where data are available)
Brazil: Suggest this replacement indicator "Countries implementing the framework on sustainable development/global citizenship education" b/c ind. only has one survey to collect this info.Ecuador: suggest change to determination of whether a country has/doesn't have curriculum that includes subjects related to natural & earth sciencesDenmark: Support UNFPAs proposal: insert language re: life skills-based HIV and sexuality education.Cabo Verde & Africa IAEG-SDG Members: Disagree (w/ ind.) Ind. needs to be on schools and availability of materials; training curricula and trained teachers (and not on learners)European Commission: Amend to also require fixed level of knowledge concerning human rights &fundamental freedoms. Disagg. by income level
UN Statistical System: "Percentage of schools that provide life skills-based HIV and sexuality education"UNFPA: "Percentage of schools that provided life skills-based HIV and sexual and reproductive health education including an emphasis on gender and power" Ind. in testing phase w/infrastructure in place. Consistent w/ ind. 28 of the Framework for Action of the Post 2015 Education agenda, Annex I (Technical Advisory Group/TAG proposed indicators).] Data source: EMIS School Census; UNESCO [4.7.1] More in line with peer reviewed research findings on components of this kind of education that correlates with positive outcomes.UNFPA: "Whether or not countries implementing the framework on the World Programme on Human Rights Education"- Proposal consistent w/ ind.29 of Framework for Action of the Post 2015 Education agenda, Annex I (Technical Advisory Group/TAG proposed indicators).] Data source: OHCHR [4.7.2] SG-Envoy on Youth: Include inds. w/ elements on: global citizenship, human rights, gender equality and comprehensive education on human sexuality. Supports UN Statsitcal system additional ind. (above) &“Percentage of 13-year old students enrolled in school supporting a range of values and attitudes promoting equality, trust and participation in governance”UN-Women: "Whether or not gender studies exist and are mandatory at each level of education"-can be collected as part of UNESCO’s surveys of national education systems.
Denmark: Topics proposed don’t capture overall sense & objective of target. Recommend search continue to find alt.ind.Japan: reconsider ind. since sus't dev't (knowledge/ skills) cannot be fully measured only by topics. enviro./geo- scienceChina: not available/ No relevant surveys or data sourcesPhilippines: difficult feasibility/consider other ind./very relevant Malaysia: Can be gauged from TIMSS or measured by students’ performance in relevant subjects like science and geography.Spain: Clearly differentiate if data from different sources are usedCanada: agree ind. provides full/adequate measure of targetPortugal: methodology still to be definedUK: difficult domestically/more practical to focus on curriculum content/suggest range of variables indicating whether or not certain subjects promoted in countries' school curricula.US: difficult to measure w/ reliability & validity. Not priority for global tracking. Target & ind. are disconnected/ Suggestion of 15 yrs. old& PISA as srouce, but specificity not flexible like other ind.Denmark, SG-Envoy on Youth & UN-Women: Proposed ind. is too narrowly focused to cover target.UN Statistical System: Retain suggested priority indicator UNESCO/TAG: Only one survey (PISA 2006) attempts to measure such knowledge. Major efforts required to be global measurement tool.UN-Women: as avail., include knowledge of other topics, including human rights & gender equality, to better fit targetEurostat/European Commission: Proposed indicators do not cover human rights aspect.
UNESCO-UIS, IEA, OECD
Suggested Indicators as of August 11
Possible Compiling Entity
Percentage of schools with access to (i) electricity; (ii) Internet for pedagogical purposes (iii) basic drinking water and (iv) basic sanitation facilities; and (v) basic handwashing facilities (as per the WASH indicator definitions)
Australia proposes amending this indicator to: ‘Percentage of schools with access to (i) electricity; (ii) Internet for pedagogical purposes (iii) basic drinking water and (iv) single-sex basic sanitation facilities; and (v) basic handwashing facilities (as per the WASH indicator definitions)’. Denmark & UNFPA: Insert “single sex” in front of “basic sanitation facilities" as per the WASH indicator definitionsUN Statistical System: To modify slightly ro ...(ii) Internet for pedagogical purposes "(iii) computers for pedagogical purposes (iv) adapted infrastructure and materials for students with disabilities"...
UN Statistical System/SG-Envoy on Youth/SRSG on Violence against Children & UNFPA: "Percentage of students experiencing bullying, corporal punishment, harassment, violence, sexual discrimination and abuse"UN Statistical System: "Percentage of educational facilities that are safe with respect to a) policy planning and advocacy, b) disaster resilient learning facilities, c) school disaster management and d) risk reduction and resilience education (as defined by the World Initiative for Safe Schools)"UN-Women: Percentage of schools with separate toilets for females and males-can also be used to monitor Target 6.2 (UNESCO)DESA/disability: Percentage of schools (primary, lower and upper secondary) meeting (i) the ISO 21542:2011 standards on accessibility and usability of the built environment and (ii) other national standards for accessibility by children/persons with disabilitiesUNESCO/ITU Partnership: 1) Pupil (learner) to computer ratio, by eduational level (ISCED 1-3)// 2) Proportion of educational institutions w/ computers for pedagogical pruposes (ISCED 1-3)// 3) Proportion of educational institutions w/ Internet for pedagogoical purposes (ISCED 1-3) (all existing, collected by UIS)
Australia: Unclear how progress would be measured. Does not address disability, gender sensitivity, and safety and non-violent environments. May not be applicable to all countries due to limitations associated with the WASH definitions. Applying the WASH definitions fully and extending coverage to more countries than is currently available would require considerable efforts and time.Brazil: the indicators encompass the most critical characteristics of school infrastructure, except by the aspect (ii),which was considered problematic for its limitations (real access of students to these computers, among others). On the other hand, it was considered impossible to establish an indicator capable of monitoring such a complex target without the risk of reductionism. Denmark: Proposed indicator doesn't capture 4.a. Incorporate proposal from UNFPA on “Percentage of students experiencing bullying, corporal punishment, harassment, violence, sexual discrimination and abuse.”Ecuador doesn't have sources for estimation of inds. needed Turkey: Suggested indicator is relevant. China: availableMalaysia: Data available for registered school.Cabo Verde & Africa IAEG-SDG Members: Partially agree/ Ind. should include schools w/ adapted infrastructure and materials for learners with disabilities. Not one single ind. but set of inds.Canada: not fully representative of target/Doesn't address disabilities, gender issues, bullying, or learning environmentPhilippines: difficult feasibility/support the ind./very relevantUK: support indicator and have data/Need a clear definition, which is flexible across countries at different stages of development, for the indicator to be meaningful.US: not relevant to developed countries; suggest to track presence of safety, gender sensitivy & inclusive ed. practices in classrooms & teacher training curriculum (by survey).UN Mine Action Service reiterates UNESCO's input-include need for accessibility for children &teachers w/ disabilities, including victims of landmines and other explosive remnants of war.UNESCO/TAG: Considerable work is required to extend the coverage of current data collection efforts to all countries. (for basic drinking water, adequate sanitation & hygeine)
UNESCO-UIS, UNICEF

Summary of Comments - p. 30 of 265
Tier IIPercentage of schools with access to (i) electricity; (ii) Internet for pedagogical purposes (iii) basic drinking water and (iv) basic sanitation facilities; and (v) basic handwashing facilities (as per the WASH indicator definitions)
Australia proposes amending this indicator to: ‘Percentage of schools with access to (i) electricity; (ii) Internet for pedagogical purposes (iii) basic drinking water and (iv) single-sex basic sanitation facilities; and (v) basic handwashing facilities (as per the WASH indicator definitions)’. Denmark & UNFPA: Insert “single sex” in front of “basic sanitation facilities" as per the WASH indicator definitionsUN Statistical System: To modify slightly ro ...(ii) Internet for pedagogical purposes "(iii) computers for pedagogical purposes (iv) adapted infrastructure and materials for students with disabilities"...
UN Statistical System/SG-Envoy on Youth/SRSG on Violence against Children & UNFPA: "Percentage of students experiencing bullying, corporal punishment, harassment, violence, sexual discrimination and abuse"UN Statistical System: "Percentage of educational facilities that are safe with respect to a) policy planning and advocacy, b) disaster resilient learning facilities, c) school disaster management and d) risk reduction and resilience education (as defined by the World Initiative for Safe Schools)"UN-Women: Percentage of schools with separate toilets for females and males-can also be used to monitor Target 6.2 (UNESCO)DESA/disability: Percentage of schools (primary, lower and upper secondary) meeting (i) the ISO 21542:2011 standards on accessibility and usability of the built environment and (ii) other national standards for accessibility by children/persons with disabilitiesUNESCO/ITU Partnership: 1) Pupil (learner) to computer ratio, by eduational level (ISCED 1-3)// 2) Proportion of educational institutions w/ computers for pedagogical pruposes (ISCED 1-3)// 3) Proportion of educational institutions w/ Internet for pedagogoical purposes (ISCED 1-3) (all existing, collected by UIS)
Australia: Unclear how progress would be measured. Does not address disability, gender sensitivity, and safety and non-violent environments. May not be applicable to all countries due to limitations associated with the WASH definitions. Applying the WASH definitions fully and extending coverage to more countries than is currently available would require considerable efforts and time.Brazil: the indicators encompass the most critical characteristics of school infrastructure, except by the aspect (ii),which was considered problematic for its limitations (real access of students to these computers, among others). On the other hand, it was considered impossible to establish an indicator capable of monitoring such a complex target without the risk of reductionism. Denmark: Proposed indicator doesn't capture 4.a. Incorporate proposal from UNFPA on “Percentage of students experiencing bullying, corporal punishment, harassment, violence, sexual discrimination and abuse.”Ecuador doesn't have sources for estimation of inds. needed Turkey: Suggested indicator is relevant. China: availableMalaysia: Data available for registered school.Cabo Verde & Africa IAEG-SDG Members: Partially agree/ Ind. should include schools w/ adapted infrastructure and materials for learners with disabilities. Not one single ind. but set of inds.Canada: not fully representative of target/Doesn't address disabilities, gender issues, bullying, or learning environmentPhilippines: difficult feasibility/support the ind./very relevantUK: support indicator and have data/Need a clear definition, which is flexible across countries at different stages of development, for the indicator to be meaningful.US: not relevant to developed countries; suggest to track presence of safety, gender sensitivy & inclusive ed. practices in classrooms & teacher training curriculum (by survey).UN Mine Action Service reiterates UNESCO's input-include need for accessibility for children &teachers w/ disabilities, including victims of landmines and other explosive remnants of war.UNESCO/TAG: Considerable work is required to extend the coverage of current data collection efforts to all countries. (for basic drinking water, adequate sanitation & hygeine)
UNESCO-UIS, UNICEF

Summary of Comments - p. 31 of 265
Suggestions for Modifications and Replacement Indicators Suggestions for Additional Indicators Additional Comments Tier
4.b.1 OECD-DAC Tier I
Target 4.c By 2030, substantially increase the supply of qualified teachers, including through international cooperation for teacher training in developing countries, especially least developed countries and small island developing States.
Suggestions for Modifications and Replacement Indicators Suggestions for Additional Indicators Additional Comments Tier
4.c.1 UNESCO-UIS Tier I/III
Target 4.b By 2020, substantially expand globally the number of scholarships available to developing countries, in particular least developed countries, small island developing States and African countries, for enrolment in higher education, including vocational training and information and communications technology, technical, engineering and scientific programmes, in developed countries and other developing countries.
Suggested Indicators as of August 11
Possible Compiling Entity
Volume of ODA flows for scholarships by sector and type of study;Total net official development assistance (ODA) for scholarships and student costs in donor countries (types of aid E01 and E02). Data expressed in US dollars at the average annual exchange rate.
Japan: suggests Volume of ODA flows for financial aid by sector and type of study; Total net official development assistance (ODA) for financial aid and student costs in donor countries (types of aid E01 and E02). Data expressed in US dollars at the average annual exchange rate.
Ecuador: proposed indicator not relevant for Ecuador. Proposes the calculation of "Number of scholarships provided by the Government for primary and secondary education".
Japan: Other forms of cooperation, including from private sector, should be monitored. Therefore, proposed ind. is "somewhat relative".Philippines: feasible w/ strong effort/support ind./very relevant/disagg. feasible w/ strong effortUK: Can report on the funding flows, not currently on the # of higher education scholarships awardedFrance: ODA (and various sub-aggregates) serve 4.a, 6.a, 10.b, 15.a, 17.2China: available US: not all scholarships funded through ODA/ raises equity concerns and doesn't promote higher ed. leadership or institution building. If stays, at minimum disagg. participation by race, gender, ethnicity, socioeconomic status, disability.Africa IAEG-SDG Members & SG-Envoy on Youth: supports/agrees w/ ind.Denmark & UNESCO/TAG: This indicator only measures some sources of scholarshipsUN Statistical System: Retain suggested priority indicator
Suggested Indicators as of August 11
Possible Compiling Entity
Percentage of teachers in (i) pre-primary (ii) primary, (iii) lower secondary and (iv) upper secondary education who have received at least the minimum organized teacher (i.e. pedagogical training) pre-service or in-service required for teaching at the relevant level in a given country. Disaggregations: sex (and others where data are available)
Japan: Suggest adding "full time" before teachers and formulate the following as: "the minimum organized pre-service or in-service teacher training (i.e. pedagogical training)"UN Statistical System: To modify slightly to ...minimum organized "and recognised" teacher..
UNESCO/ITU Partnership: Proportion of primary & secondary-school teachers trained to teach subject(s) using ICT facilities (for ISCED levels 1-3) (existing, collected by UIS)
Malaysia: Data available for registered school.Canada: agree ind. provides full/adequate measure of targetChina: available/definition-coverage-calculation method not clearly definedPhilippines: feasible w/ strong effort/support ind./very relevant/disagg. feasible w/ strong effortUK: support as long as common standard for teacher training is not applied/ Need both a measure of quantity and quality of teachers and further clarification of 'upper secondary' teacher/ Measure of teacher shortage might also be defined and included/Keep phrase 'qualified teacher' out of this measure.Turkey: Minimum organized level should be made clearAfrica IAEG-SDG Members & SG-Envoy on Youth: supports/agrees w/ ind.UNESCO/TAG: Percentage of teachers qualified according to national standards (by level)-- Following preparatory work, countries will begin reporting on this indicator for the first time from the academic year 2014 onwards.UNESCO/TAG: Percentage of teachers receiving in-service training-- Major efforts will be required to develop a tool that assesses the incidence, duration and content of training.
OTHER COMMENTS:
Germany: Recommend one headline indicator for Goal 4-- illiteracy rate Ecuador: Inds. proposed measure only education quality, also need ind. to measure access to education-- "Percentage of individuals ages 18 to 24 with complete secondary education".Int'l Finance Corporation (IFC): Propose ind. like--new loans for SMEs (# and $) for education sector/ number of students enrolled and graduated in private sector institutions/ Private sector investment in education
Denmark: support disagg. by sex, age, residence, etc for Goal 4. Should allow for method. and improvements in data over time & establish proper baselines.
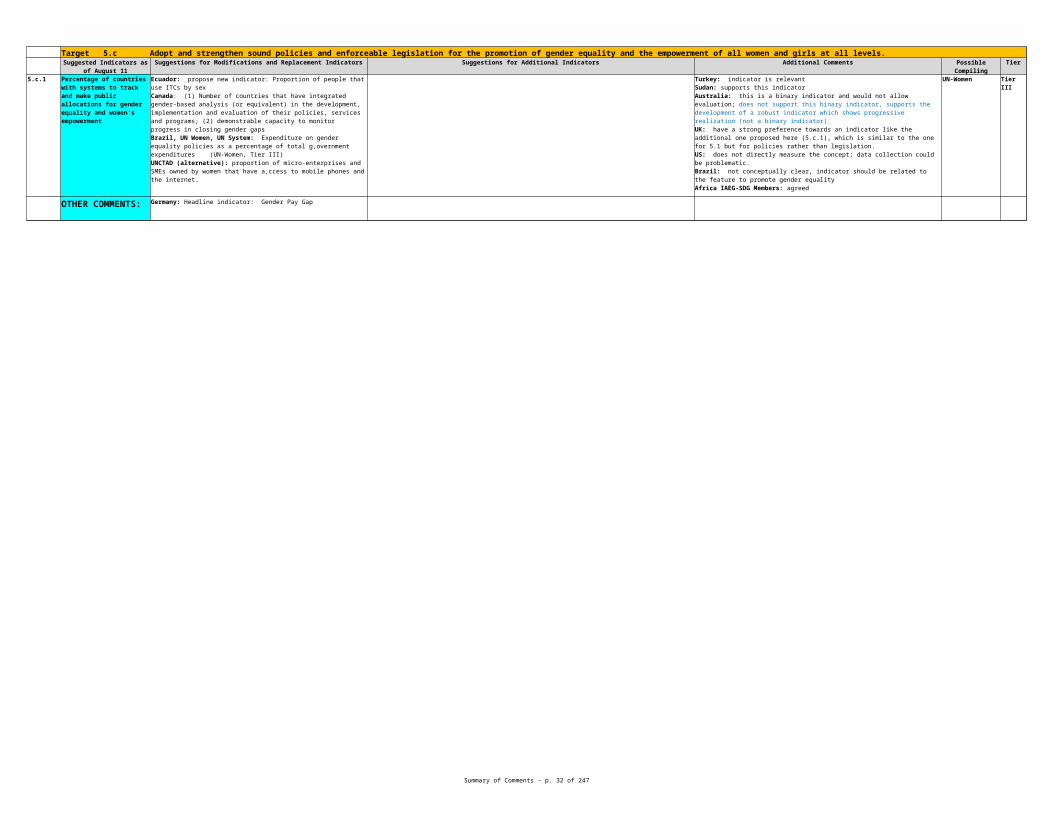
Summary of Comments - p. 32 of 265
Goal 5 Achieve gender equality and empower all women and girlsTarget 5.1 End all forms of discrimination against all women and girls everywhere.
Suggestions for Modifications and Replacement Indicators Suggestions for Additional Indicators Additional Comments Tier
5.1.1 Tier III
Suggested Indicators as of August 11
Possible Compiling Entity
Whether or not legal frameworks are in place to promote equality and non-discrimination on the basis of sex
Denmark: "Whether or not legal frameworks are in place to promote, enforce and monitor equality and non-discrimination on the basis of sex" Canada: "Whether or not legal frameworks are in place to promote equality and non-discrimination on (as defined in international law) the basis of sex"UN-Women: suggest the following new formulation: “Percentage of countries with legal frameworks that promote gender equality and non-discrimination against all women and girls” UNCTAD: (alternative) "Ratio of female wages to male wages for similar work, by sector/ industry."
USA: "States granting equal treatment to women & men w/r/t nationality rights" Colombia, Germany: indicator measures means, not results. Legal framework do not necessarily guarantee that the target is met. Should measure actual results about discrimination. Canada: legal framework does not precent discrimination; need to define "non-discrimination" with reference to international law. Australia: this is a binary indicator and would not allow evaluation; does not support. Argentina: no sourceCabo Verde: this is not an indicator; current formulation is only measureable if its a national indicator. USA: lot of work to operationalize; some language not supported by the US; concerns abou tthe use of binary scoring system Japan: accepts this indicator, despite no data, but legal framework is in place. Brazil: indicator has problems in 3 criteria: methodology, suitability and feasibility. No consensus on 8 forms of discrimination listed by UN-Women. having a law does not guarantee to end all forms of discriminationCuba, United Kingdom, Sudan, SG-Envoy on Youth: support proposed indicator Africa IAEG-SDG Members: agreed
OHCHR, UN-Women

Summary of Comments - p. 33 of 265
Target 5.2 Eliminate all forms of violence against all women and girls in the public and private spheres, including trafficking and sexual and other types of exploitation. Suggestions for Modifications and Replacement Indicators Suggestions for Additional Indicators Additional Comments Tier
5.2.1 Tier II
2.2.2 Tier II
Suggested Indicators as of August 11
Possible Compiling Entity
Proportion of ever-partnered women and girls (aged 15-49) subjected to physical and/or sexual violence by a current or former intimate partner, in the last 12 months
Canada, Colombia, Ecuador, Germany, USA, Italy, France, Australia, UN Women, UN System, Eurostat/EC: suggest to have no age maximum (ie, using 15 plus instead of 15-49) Denmark: suggest to revise to be 10-49 Philippines: proposed amendment: by type of perpetrator instead of focusing on just the current or former intimate partnerUN-Women, UN System: suggest new formulations - “Proportion of ever-partnered women and girls aged 15+ subjected to physical, sexual and psychological violence by a current or former intimate partner, in the last 12 months, by form of violence and by age” DESA/DSPD: "Percentage of women and girls with disabilities subjected to physical and/or sexual violence"
Canada: "Percentage of women and girls subjected to physical or sexual violence, trafficking and sexual and other types of exploitation by a current or former partner within the last 12 months."United Kingdom: "proportion of women aged 15 49 yrs (and/or men if available) who think that a man is ‐justified in beating his wife/partner in at least one circumstance" USA, IOM, "Number of victims of human trafficking per 100,000 persons"UN System: "Number of detected and non-detected victims of human trafficking per 100,000; by sex, age and form of exploitation (also suggested for 16.2) (UNODC, Tier 2)"UN Women, UN System: "Proportion of women (aged 15-19 and 20-24) who were subjected to sexual violence before age 15, by any persons (UN Women, UNSD, UNICEF, Tier 2)"UN System: "Number of female victims of intentional homicide killed by intimate partner or family members per 100,000 women, per year (UNODC, UNECE, Tier 2)"
Canada: does not take into consideration human trafficking component of the target; term "ever-partnered" seems redundant, confusing Brazil: if change to 15+, note that most surveys use 15-49Canada, Colombia, Ecuador, Palestine: other types of violence should be included, include psychological violence Argentina: no sourceTurkey: indicator is relevant Philippiines: as it, indicator is critical, suggest to expand coverage to men (for gender equality) Mexico: does not specify the moment of the event Africa IAEG-SDG Members: partially agreed (specify age and link to 16.1)Canada, SG-Envoy on Youth, SRSG on Violence against children: supports the indicator Australia: Justification is needed for the age range 15-49 years
UNICEF, UN-Women, UNSD
Proportion of women and girls (aged 15-49) subjected to sexual violence by persons other than an intimate partner, since age 15
Canada, USA, Australia, Italy, Colombia, Brazil: suggest to have no age maximum (ie, using 15 plus instead of 15-49)Canada, Peru, Brazil: adding "in the last 12 months" to be consistent be 5.2.1 Denmark: suggest to revise to be 10-49 Africa IAEG-SDG Members: needs to include under 15 and older personsSRSG on violence against children: modify the indicator to be proportion of women, girls and boys (aged 15-49) subjected to sexual violence by persons other than an intimate partner, since age 15. UN Women, UN System : “Proportion of women and girls aged 15+ subjected to sexual violence by persons other than an intimate partner, since age 15, by age and place of occurrence”Eurostat/EC: Where relevant in the national context, data for the age group 0-14 should also be collected in order to monitor the actual impacts of preventive interventions. Also expand over 49.
Canada: does not take into consideration human trafficking component of the target ; suggests to also capture girls' and women's experience with violence to include witnessing abuse, and neglect in the family home. Turkey: indicator is relevant Brazil: if change to 15+, note that most surveys use 15-49Argentina: no sourceUSA: current formulation does not allow for tracking the "elimination" of violence since changes in violence levels would not be easily tracked by asking if women have experienced violence "since age 15". Incidence would be better captured, for example, by an indicator that measures the experience of violence over a specified period of time (e.g., the past 12 months). Mexico: need to review cross national data to ensure standardized information, does not specify the moment of event SG-Envoy on Youth: support proposed indicator SRSG on violence against children: should be noted that both girls and boys are subjected to violence and exploitation, all indicators should attempt to measure this phenomenon and be disaggregated by gender.
UNICEF, UN Women, UNSD, UNFPA, and WHO

Summary of Comments - p. 34 of 265
Target 5.3 Eliminate all harmful practices, such as child, early and forced marriage and female genital mutilation. Suggestions for Modifications and Replacement Indicators Suggestions for Additional Indicators Additional Comments Tier
5.3.1 UNICEF, UNFPA Tier I
5.3.2 UNICEF, UNFPA Tier I
Suggested Indicators as of August 11
Possible Compiling Entity
Percentage of women aged 20-24 who were married or in a union before age 18 (i.e. child marriage)
Denmark: add "and the number of" Germany: suggest to rephrase "percentage of women who were married or in a union before age 18 (i.e., child marriage)"UK: recommend adapting the indicator as it is important to capture under 15s as well as they are among the most vulnerable. Additionally, people can get married at the age of 16 in the UK (though with parental consent in England, Wales, NI).UN System: "percentage of women aged 20-24 who were married or in a union before age 15 and age 18 (i.e. child marriage)"Australia suggests removing the age range 20-24 years from the specification.
Australia: Forced marriage. Relevance concerns that the suggested indicator does not reflect that women can be forced to marry at any age, including in adulthood. Canada: age at marriage may not be widely available (not available at the Canada level); does not capture forced unions; qualitiative data suggests early and forced marriage can also be performed on young men/boys; age range fails to capture very recent early marriages - <2 yearsAustralia: questions the age range Ecuador: recommend that the countries of Latin America and the Caribbean focus their efforts on the strengthening of administrative records regarding civil unions, so as to have the necessary information to calculate this indicator. Brazil: notes that there are other forms of harmful practicesUSA: Civil society groups have proposed a slightly modified version of this indicator that would measure the percentage of women who were married before age 18 AND the number who were married before age 15. The Gender WG agrees that there is interest in breaking out the data this way. However, there are some concerns that when combined with other possible disaggregates, the resulting cell sizes would be too small for meaningful analysis. If there is a strong press for breaking out the under-15 numbers, we should consider it further. Montenegro: Minisitry monitor the situation but are not obilged to establish data on this issue. Sudan, Turkey, UK Palestine, SG-Envoy on Youth, SRSG on violence against women: supports, agrees important, relevant Africa IAEG-SDG Members: agreed
Percentage of girls and women aged 15-49 years who have undergone FGM/C, by age group (for relevant countries only)
Colombia, Africa IAEG-SDG Members: should not be restricted by age range Australia: questions the age range
Colombia: what can be measured in communities that declare the abdondonment of the practice, and an estimation of the population covered.
Australia: Justification is needed for the age range 15-49 years.Ecuador, Turkey: not a relevant indicator in their country Africa IAEG-SDG Members: partially agreed - expand age to include girls under 15, but will be a challenge getting data for under 15; may need to consider adminstrative records or new ways of collecting dataUK, SG-Envoy on Youth, SRSG on violence against women: support proposed indicator UNICEF: strongly suggest that both indicators be retained. Eurostat/EC, USA: Incidence of FGM/C is not necessarily limited to certain countries. All incidences of FGM/C should be monitored.

Summary of Comments - p. 35 of 265
Suggestions for Modifications and Replacement Indicators Suggestions for Additional Indicators Additional Comments Tier
5.4.1 Tier II
Target 5.5 Ensure women's full and effective participation and equal opportunities for leadership at all levels of decision-making in political, economic and public life. Suggestions for Modifications and Replacement Indicators Suggestions for Additional Indicators Additional Comments Tier
5.5.1 IPU Tier I
5.5.2 UN-Women UCLG Tier I
Target 5.4 Recognize and value unpaid care and domestic work through the provision of public services, infrastructure and social protection policies and the promotion of shared responsibility within the household and the family as nationally appropriate.
Suggested Indicators as of August 11
Possible Compiling Entity
Average daily (24 hours) spent on unpaid domestic and care work, by sex, age and location (for individuals five years and above)
Brazil proposes this replacement indicator "Average weekly hours spent on unpaid domestic and care work", b/c some countries don't have Time Use Survey, info comes from Household survey module which is collected in the week of reference.Colombia, Palestine, Philippines, Mexico: suggest weekly reference not dailyGermany: replace indicator with "average daily (24 hours) spent on unpaid domestic and child care" UNCTAD: (alternative) : "Average hours spent on paid and unpaid work, by sex"
UK: recommended alternative is "The existence of policies that recognise and value unpaid care and domestic work and promote the shared responsibility within the household and the family as nationallyappropriate".UN Women, UN System: Participation rate of pre-school children in Early Childhood Care and Education (ECCE) programmes, by age of the child, location and family income (UNICEF, Tier 2) UN System: Average weekly time spent in water collection (including waiting time at public supply points), by sex, age and location (UN Women, UNICEF, Tier 3)Eurostat/EC: needs to be clean/safe water source.
Australia: Differences in activities included within the scope of unpaid work may lead to considerable differences in results across countries. Indicator does not consider the provision of services, infrastructure and social protection policies. Canada: seeks clarification on location required (regional, urban/rural) ; does not adequately measure the target as provides a measure of of time spent on unpaid activities not on the value of unpaid work through the provision of public services and infrastructure etc as per target.Colombia: Time Use Surveys in Latin America usually ask about weekly instead of daily time spent. Ecuador: lack of impact and contribution measures of housework; measurement can be done with satellite accounts of unpaid work Mexico: concerns that serious difficulties to obtain data for individuals 5 - 11 years of age; don't use daily 24-hour time Paraguay: presents objectionsPalestine: suggest to change the target age group to be 10+ instead of 5+ and the refernce period to be weekly inestead of daily Denmark: should not exlcude women and girls who receive "board and lodging" as paymentGermany: does not include disaggreagtion Philippines: considered critial USA: concerned that not all surveys disaggregate by location UK, Turkey, SG-Envoy on Youth: support proposed indicator, relevantAfrica IAEG-SDG Members: disagreed - target not about measuring child labour and should not include 5 year olds, but should have the appropriate ages whose unpaid work should be recognised and valued.
UN-Women, UNSD
Suggested Indicators as of August 11
Possible Compiling Entity
Proportion of seats held by women in national parliaments
UK: should also include percentage of those seats held at senior decision making, ministerial or cabinet level.‐Brazil: "proportion of women 25+ in direciton and managerial positions"UN Women, UN System: "Proportion of women in leadership positions in political, economic and public life, by level and by type (IPU, UN-Women, UCLG, UNODC, ILO, Tier 1 -except local gov Tier 3)"UNCTAD: (alternative) a. Index of Dissimilarity for occupations and sectors (among others), b. Female share of managerial job, c. Female share of professional jobs (incl. and excl. teaching; incl. and excl. health workers), d. Female share of clerical jobs, e. Female share of informal employment, f. Female share of permanent jobs
Australia supports an additional indicator on women in leadership positions other than seats held by women in government. UN Women, UN system: Share of female researchers, by seniority level (percentage of researchers who are female) (UNESCO, Tier 1)Eurostat/EC: Add the measure on number of women recruited and trained in the Electoral Management Bodies.African IAEG-SDG Members: Proportion of women in managerial positions by sector
Canada: proposed indicators only measure only the political portion of the target (not the economic or public portion)Colombia: suggest including women in leadership positions, not only in government. Switzerland supports the indicator but also proposes additional indicators listed under the 2nd indicator for this target.Peru: suggest to extend the indicator to other areas of political power Turkey, USA, Japan, UK, SG-Envoy on Youth: : supports or accepts indicator as relevant Africa IAEG-SDG Members: partially agreed
Proportion of seats held by women in local governments
Africa IAEG-SDG Members: replace local with national government Switzerland proposes the following additional indicators: "share of women in higher position" or "share of women in directors board"
Canada: proposed indicators only measure only the political portion of the target (not the economic or public portion) USA: methodological work needed Colombia: suggest including women in leadership positions, not only in government. UK and Switzerland: support the indicatorTurkey: indicator is relevant Philippines: considered critial Paraguay: expresses partial agreementAfrica IAEG-SDG Members: partially agreed

Summary of Comments - p. 36 of 265
Suggestions for Modifications and Replacement Indicators Suggestions for Additional Indicators Additional Comments Tier
5.6.1 UNFPA Tier II
5.6.2 UNFPA Tier II
Target 5.6 Ensure universal access to sexual and reproductive health and reproductive rights as agreed in accordance with the Programme of Action of the International Conference on Population and Development and the Beijing Platform for Action and the outcome documents of their review conferences.
Suggested Indicators as of August 11
Possible Compiling Entity
Proportion of women (aged 15-49) who make their own sexual and reproductive decisions.
Colombia, USA: should not be restricted by age range Palestine: suggest to expand the target group to include all women aged 15-54 years regardless of marital status Denmark: suggest to revise to be 10-49 Sudan: suggests revision "proportion of women (aged 15-49) who make their own resproductive decisions" DESA: Percentage of women and girls who make decisions about their own sexual and reproductive health and reproductive rights, disaggregated for persons with/without disabilitiesUNFPA: The indicator is based on three central elements measuring the empowerment of women (married, in union and ever sexually active women) aged 15-49 to make the following decisions, : (a) whether they are able to reject unwanted sexual relations; (b) using or not using contraception; and (c) whether they can access sexual and reproductive health care for herself.
Canada: could be proportion of women who access pre-natal screening Canada: may be difficult to measure - many surveys ask about behaviours not decisions; target mentions universal access but indicator measures decision makingEcuador, Mexico: an adequate definition of what is known as "personal decisions on sexual and reproducgtive issues" is needed. Brazil: cannot classify as a global indicator bc not all modules are applied in all countries; concerns with problematic questionsParaguay: presents objectionsUSA, Mexico, UN-Women: agree with UNFPA proposal UK: indicator should also include met demand for FP. already measured in goal 3. Africa IAEG-SDG Members: agreedSG-Envoy on Youth: support proposed indicator and recommends disaggregation by age and marital status, as well as other characteristicsUN Women: cautions against 3.7 and 5.6 being seen as duplicative or overlapping
[Proportion (%) of countries with laws and regulations that guarantee all women and adolescents access to sexual and reproductive health services, information and education (official records)
Brazil: proposes 2 alternative solutions: Percentage of health budget dedicated to initiatives in SHRNumber of national campaigns promoting SHR in the last 12 months. UNFPA: "proportion of countries with laws and regulations that guarantee women and adolescents access to sexual and reproductive health services, information and education irrespective of age, marital status and without third party authorization"
Colombia, Palestine: indicator measures means, not results Palestine: indicator could not be applicable for many countries who have no well established official records Italy, France: relevant, but need to know real access and type of services. Mexico, Brazil: does not adequately measure the goal; laws do not guarantee that the right is exercised effectively. Paraguay: expresses agreementDenmark: focus should be on conditions in each country; if speak of countries as a whole, will be difficult to identify individual countries that do or do not live up to their obligations. Turkey: indicator is relevant USA: methodological development neededAfrica IAEG-SDG Members: agreedSG-Envoy on Youth: recommends disaggregation by age and marital status, as well as other characteristics

Summary of Comments - p. 37 of 265
Suggestions for Modifications and Replacement Indicators Suggestions for Additional Indicators Additional Comments Tier
5.a.1
5.a.2 FAO Tier II
Target 5.b Enhance the use of enabling technology, in particular information and communications technology, to promote the empowerment of women. Suggestions for Modifications and Replacement Indicators Suggestions for Additional Indicators Additional Comments Tier
5.b.1 ITU Tier II
Target 5.a Undertake reforms to give women equal rights to economic resources, as well as access to ownership and control over land and other forms of property, financial services, inheritance and natural resources, in accordance with national laws.
Suggested Indicators as of August 11
Possible Compiling Entity
Share of women among agricultural land owners by age and location (U/R)
Palestine: suggest to change to "Share of women among agrictultural land possession" UN Women, UN Statistical system: suggests new formulation a) Percentage of people with ownership or secure rights over agricultural land (out of total agricultural population), by sex; andb) Share of women among owners or rights-bearers of agricultural land”, by type of tenure (FAo, Tier II)UNCTAD: (Alternative) a. Female share of landholding and immovable property, b. Female share of bank/ savings accounts., c. Female participation rate in technical and vocational training programmes, d. Female participation rate in government support programmes (extension services, inputs, credit)
Palestine: suggestion new indicator "% of women/girls who have bank account" Denmark: suggest to use earlier proposal "proportion of population owning land, by sex, age and location Turkey: "ratio of entrepreneur women"UNCDF, UN Women: suggests new indicator -" % adults with a formal account or personally using a mobile money service in the past 12 months, breakdown by income, gender, rural, and age"
Canada: measure only ownership of land component of target Germany: indicator does not cover economic resources, financial services, inheritance and natural resource as required by the target. Turkey: "economic resources" not only related to agriculture. Australia: less relevant to their country; equal rights to economic resources. Indicators do not directly address access to ownership and control over forms of property other than land.US: Similar to suggested new indicators for 1.4.2, this indicator suggestion only focuses on rural areas and ownership. Brazil: has concerns with the indicator - lack of informaton, unclear conceptsParaguay: presents objectionsAfrica IAEG-SDG Members: partially agreed - add other elements such as inheritanceUNCDF: possible to have a break down by income, e.g. bottom 40% of income shareUN System: Suggest to delete indicaotrs: Share of women among agricultural land owners by age and location (U/R); and Proportion of adult population owning land, by sex, age and location ( BBB )
FAO, UN-Women, UNSD
Tier II/III
The legal framework includes special measures to guarantee women's equal rights to land ownership and control.
UN System: "Percentage of countries where the legal framework includes special measures to guarantee women's equal rights to land ownership and control."
Canada: measure only ownership of land component of targetColombia: suggest defining the indicator in terms of degree of implementation of the reforms. Colombia, Ecuador, Germany: does not measure access to economic resources, financial services, inheritance, natural resources, as is mentioned in this target Palestine: concerned that this could not be applicable espeically in countries that do not have well established official records Cabo Verde: should be removed. the subject measured is an enabler of the precedent indicator. Japan: accepts indicatorBrazil: suggest exclusion of this indicatorParaguay: expresses partial agreementAfrica IAEG-SDG Members: partially agreed - should be reformulated
Suggested Indicators as of August 11
Possible Compiling Entity
Proportion of individuals who own a mobile telephone, by sex
Germany, Mexico: "The proportion of individuals who USE a mobile phone" (not "who OWN …")Cuba: "Proportion of individuals who have a mobile telephone, by sex"UN System: "Proportion of individuals owning a mobile phone, by sex"
Peru: suggest to add another indictor of women's access to other technologies such as the internet that promotes empowermentCanada: internet access and usage by sex (disaggregated by disability where possible)US: favor the adoption of a financial inclusion indicator measuring access to financial services among women, which is already tracked across 142 countries via World Bank Global Findex survey and closely watched/relied on by policymakers and private actors. Indicators are already disaggregated by sex, age, income, and location (urban/rural). Primary indicator would be similar to "% of women with a formal account or personally using a mobile money service in the past 12 months". Cuba, UK, UN System: proportion of individuals with ICT skills, by type of skill, by sex (ITU, Tier II)UNCDF, US: proposal of adopting a multi-purpose indicator that could be used across multiple targets: "% of women owning an account either through a financial institution or mobile money provider," with disaggregation by income level, geography location gender, age and education.
Australia questions relevance of mobile phone ownership to use of enabling technology. Access is only one part of empowerment. Further, mobile phones are only one part of ICT. Colombia, Palestine: The owning of a mobile telephone not necessarily promote the empowerment, it depends on the services provided. Canada: ownership does not in and of itself measure the targetUS: unclear how the indicator as proposed would count joint ownership. A measure of cell phone use, rather than ownership, would better capture the target, but gathering these data would be a heavy liftPalestine: think that target should be revised, as the basic concept behind this target is not clear. Sudan: supports this indicator Africa IAEG-SDG Members: agreedPortugal/Southern Europe: New methodology has been defined by Eurostat for assessing individuals ICT skill levels, starting 2015. Montenegro: For ICT Skills, 2015 onwards new questions in line with the Eurostat model.

Summary of Comments - p. 38 of 265
Target 5.c Adopt and strengthen sound policies and enforceable legislation for the promotion of gender equality and the empowerment of all women and girls at all levels. Suggestions for Modifications and Replacement Indicators Suggestions for Additional Indicators Additional Comments Tier
5.c.1 UN-Women Tier III
Suggested Indicators as of August 11
Possible Compiling Entity
Percentage of countries with systems to track and make public allocations for gender equality and women’s empowerment
Ecuador: propose new indicator: Proportion of people that use ITCs by sex Canada: (1) Number of countries that have integrated gender-based analysis (or equivalent) in the development, implementation and evaluation of their policies, services and programs; (2) demonstrable capacity to monitor progress in closing gender gapsBrazil, UN Women, UN System: Expenditure on gender equality policies as a percentage of total g,overnment expenditures (UN-Women, Tier III) UNCTAD (alternative): proportion of micro-enterprises and SMEs owned by women that have a,ccess to mobile phones and the internet.
Turkey: indicator is relevant Sudan: supports this indicator Australia: this is a binary indicator and would not allow evaluation; does not support this binary indicator, supports the development of a robust indicator which shows progressive realization (not a binary indicator). UK: have a strong preference towards an indicator like the additional one proposed here (5.c.1), which is similar to the one for 5.1 but for policies rather than legislation.US: does not directly measure the concept; data collection could be problematic. Brazil: not conceptually clear, indicator should be related to the feature to promote gender equalityAfrica IAEG-SDG Members: agreed
OTHER COMMENTS:
Germany: Headline indicator: Gender Pay Gap

Summary of Comments - p. 39 of 265
Goal 6 Ensure availability and sustainable management of water and sanitation for all Target 6.1 By 2030, achieve universal and equitable access to safe and affordable drinking water for all.
Suggestions for Modifications and Replacement Indicators Suggestions for Additional Indicators Additional Comments Tier
6.1.1 WHO/UNICEF JMP Tier I
6.1.2 WHO/UNICEF JMP Tier I
Suggested Indicators as of August 11
Possible Compiling Entity
Percentage of population using safely managed drinking water services
Denmark: suggest to use “safe” instead of “safely managed”;UNDESA/DSPD/Secretariat for the Convention on the Rights of Persons with Disabilities: suggests "Percentage of population using safely managed drinking water services, disaggregated for persons with/without disabilities"
Canada: does not provide full measure of target, consider adding an indicator on affordability/ equitable access of drinking water
Ecuador: suggested modification to consider drinking water available in the house Peru, Cabo Verde, Canada: Define and provide more metadata on "safely managed"; Switzerland, USA, Estonia: Strong conceptual fit/ relevant; clear definition for “safely managed needed”Colombia: need to define the variables that allow to qualify the management of drinking water services as safeJapan: definition of "Safely managed drinking water" as "a drinking water source located on premises", seems to ambitious as in rural settings of developing countries handpumps are dominant. Suggests to revise definition in order to make the target achievable. African IAEG-SDG members: Agree with suggested indicatorUK: supports suggested indicatorUN System Submission, incl. UN Water and WHO/UNICEF JMP, UN Secretary-General's Advisory Board on Water and Sanitation (UNSGAB): support suggested indicator; UN System Submission, incl. UN Water and WHO/UNICEF JMP: provides definition of "safely managed" UNCEEA: Household surveys would be required to assess household access, but the SEEA-Accounts can provide much contextual information on the magnitude of water consumption by households relative to other sectors, as well as information on government and private spending on water supply services and associate infrastructure.
Average weekly time spent in water collection (including waiting time at public supply points), by sex, age, location and income.
African IAEG-SDG members: Disagree with suggested indicator; instead suggest to use 'distance' in the indicataor instead of timeItaly: for developed countries it would be better to know the % of families without freshwater at home
Brazil, China: There is no information available for the indicator calculation (Tier II). We suggest the exclusion of this indicator.USA: Moderate conceptual fit; affordability not covered, clear definitions and methodology neededEcuador, Turkey, Estonia, Germany: not relevant for Ecuador / all countries; Switzerland comments that they do not think that this indicator is relevant as the definition of safely managed drinking water services requires universal access to safely-managed water services ‘on the premises’.Germany: The target does not ask for disaggregation. The element of affordability is not covered by proposed indicatorJapan: Why is disaggregation specifically mentioned for this indicator - all should be disaggregated as relevant and possibleUK: supports suggested indicator, but could better integrated with first indicatorFrance: This newly proposed indicator does not seem relevant as it is implicitly included in indicator 6.1.1UNWomen: supports this indicatorUNCEEA: Household surveys would be required to assess household access, but the SEEA-Accounts can provide much contextual information on the magnitude of water consumption by households relative to other sectors, as well as information on government and private spending on water supply services and associate infrastructure.

Summary of Comments - p. 40 of 265
Target 6.2 By 2030, achieve access to adequate and equitable sanitation and hygiene for all and end open defecation, paying special attention to the needs of women and girls and those in vulnerable situations.
Suggestions for Modifications and Replacement Indicators Suggestions for Additional Indicators Additional Comments Tier
6.2.1 WHO/UNICEF JMP Tier II
Suggested Indicators as of August 11
Possible Compiling Entity
Percentage of population using safely managed sanitation services
Canada: does not provide full measure of target; Suggest alternate wording: "Percentage of population having access to and using safely managed sanitation services"Cuba: suggests to have indicator "Population that has running water at home"UNFPA: suggests alternative indicator “Percentage of primary and secondary schools providing basic drinking water, adequate sanitation and adequate hygiene services.”
UN System Submission, incl. UN Water and WHO/UNICEF JMP; UN Secretary-General's Advisory Board on Water and Sanitation -UNSGAB, France: supports first, and requests second priority indicator on “Percentage of population with a hand washing facility with soap and water in the household”Office of the UN Secretary-General's Envoy on Youth, UNFPA+A2: recommends also the inclusion of WASH indicators: "Percentage of pupils enrolled in primary and secondary schools providing basic drinking water, adequate sanitation and adequate hygiene services." and "Percentage of primary and secondary schools with gender-separated sanitation facilities on or near premises, with at least one toilet for every 25 girls, at least one toilet for female school staff, a minimum of one toilet and one urinal for every 50 boys and at least one toilet for male staff"
Germany: Hygiene has been dropped out (hand-washing), which is a major setback when it comes to safe sanitation and health. Argentina, Colombia, Ecuador, USA, Canada: requested clear definition of “safely managed” and "sanitation services"USA: Strong conceptual fit; this indicator should be sure to incorporate the GEMI activities developing effective and innovative measuresJapan: supports this indicatorAfrican IAEG-SDG members: Assuming that hand washing and hygiene are included in safely managed sanitation services UK: The UK support this indicator.Other indicators such as "Population with a hand washing facility with soap and water in the household" and ""Percentage of population whose faecal waste is safely managed" would be acceptable but appear to be less readily available.Estonia: indicator is suitableUNDESA/DSPD/Secretariat for the Convention on the Rights of Persons with Disabilities: suggests to disagregate for persons with/without disabilities"UNCEEA: Household surveys would be required to assess household access, but the SEEA-Accounts can provide much contextual information on government and private spending on sanitation services and associate infrastructure.

Summary of Comments - p. 41 of 265
Suggestions for Modifications and Replacement Indicators Suggestions for Additional Indicators Additional Comments Tier
6.3.1 Tier II
6.3.2 Tier II
Target 6.3 By 2030, improve water quality by reducing pollution, eliminating dumping and minimizing release of hazardous chemicals and materials, halving the proportion of untreated wastewater and substantially increasing recycling and safe reuse globally.
Suggested Indicators as of August 11
Possible Compiling Entity
Percentage of wastewater safely treated , disaggregated by economic activity
Brazil proposes this replacement indicator: "Percentage of safely-treated wastewater"Canada: Indicator does not capture increasing recycling and safe water reuse. Suggest replacing 'wastewater' by 'effluent' which captures the releases from industry and wastewater (sewage).UN System Submission, incl. UN Water and WHO/UNICEF JMP: Suggested to change the wording of the suggested indicators into “Percentage of wastewater safely treated”
Brazil: There is no information disaggregated by economic activity available for the calculation of the indicator. Tier IIAustralia: The availability of data in time and space poses a challenge to all approaches describing the changing conditions of water resources. Alternative measures based on earth observation (satellite imagery) may be more suited to the indicator. Germany: The target does not ask for disaggregation by economic activity but minimizing release of hazardous chemicals and materials which is not reflected USA: Strong conceptual fit; clear definitions and disaggregation categories will be required, Earth observations (remote sensing) may be able to be used for this. Denmark, Estonia: requested clear definition of “safely treated”; Japan: The definition for "water quality not presenting risk to the environment or human health" needs to be clarified and also teh calculation methodCabo Verde: We agree with the indicator but removing the disaggregation suggested.African IAEG-SDG members: agree partially, issue important to address, but the methodology of measurement is complex UK: support indicator but disaggregation is unlikely to be robustTanzania: doubts data availability by economic activity and suggests to remove disaggregationTurkey: The definition says "composite indicator based on treatment ladders for domestic and industrial wastewater", but the indicator itself is mentioned as "by economic activity". In order to overcome this conflict and misunderstanding, it would be better to seperate non-point sources such as runoff from agricultural activities, and only emphasize point sources such as domestic and industrial.UNCEEA: This indicator can be fully aligned with the SEEA-Water which captures wastwater generation and treatment by economic activity (and based on ISIC classifications) and according to treatment ladders as defined in the International Recommendations on Water Statistics.
WHO and UN-HABITAT on behalf of UN-Water
Percentage of receiving water bodies with ambient water quality not presenting risk to the environment or human health
UN Secretary-General's Advisory Board on Water and Sanitation -UNSGAB: Requests second priority indicator on recycling and save use to maintain political ambition of target UN System Submission, incl. UN Water and WHO/UNICEF JMP: Suggested to change the wording of the suggested indicators into “Percentage of water bodies with good ambient water quality”
France: proposes an additional indicator on the “safe reuse [of treated wastewater]” even though it acknowledges no suitable indicator is currently availableSwitzerland proposes an additional indicator for this target, "the levels of pollutants (chemicals) released into the water bodies." The data is reported under MEAs, PRTRs and UNEP Global Mercury, lead and cadmium Program
Brazil: There is no information available for the indicator calculation (Tier II). We suggest the exclusion of this indicator.USA: Strong conceptual fit; clear definitions and disaggregation categories will be required. GEMI enhancements are important. Earth observations (remote sensing) may be able to be used for thisKorea: Need more specific definition for 'non-threatening surrounding water Denmark: The terms “safely treated” and “not presenting risks” may need to be further defined Cabo Verde: measurement is complex. We need further information on the measuring methodology before commenting.African IAEG-SDG members: agree but the measurement is complex UK: supports this indicator over other proposals.France: The objective “increasing and safe reuse [of treated wastewater]” shall be supported by a specific indicator ; while no operational candidate is already available, this should be kept for the 2030 AgendaEstonia: suitable for measuring targetEurostat: limit the coverage to a narrow selection of parameters, including microbiological contamination. The priority should not be to be comprehensive but to address substances that give a useful proxy of the overall status of water bodies.UNCEEA: Measuring water quality is very difficult. The SEEA-Water Emissions Accounts should be used as the standard for measuring water pollution.
UNEP on behalf of UN-Water

Summary of Comments - p. 42 of 265
Suggestions for Modifications and Replacement Indicators Suggestions for Additional Indicators Additional Comments Tier
6.4.1 Tier I
6.4.2 Tier I
Target 6.4 By 2030, substantially increase water-use efficiency across all sectors and ensure sustainable withdrawals and supply of freshwater to address water scarcity and substantially reduce the number of people suffering from water scarcity.
Suggested Indicators as of August 11
Possible Compiling Entity
Percentage change in water use efficiency over time.
Brazil: Replace with "Percentage of population facing water shortage" as there is not data for suggested indicatorCanada: Suggest replacing "environment" by "ecosystems" .Japan: Indicators should be simple and undestandable. We propose a new indicator. "The number of days or affected people suffered by droughts."UN System Submission, incl. UN Water and WHO/UNICEF JMP: would prefer slightly different wordings: “Percentage of change in water use efficiency over time
Denmark: an additional indicator on water “withdrawals” is needed to cover the agreed target scope; alternatively some kind of proxy-indicator e.g. “Percent change of people living in areas with water stress” would globally address developed and developing countries.Mexico: It is suggested to include an indicator of water treatment.Canada: Consider supplementing with a measure of water scarcity. Consider including water withdrawl by sector.France proposes Water productivity (GDP / water withdrawals) as a proposed indicator but water intensive activities may be moved abroadSwitzerland supports France's proposals on water withdrawals.
Colombia: : It is necessary to define the variables of the indicator and disaggregate by sectorEurostat: Some sectors may need specific attention. The former proposed indicator on water productivity has been lost, but it is very important to track water use or abstractions in key sectorsUSA: Strong conceptual fit; internationally comparable measures of water efficiency, particularly for agriculture, do not exist and only a relatively small set of countries around the world have reliable data on water withdrawals by sector Indicators need further specification with respect to measurement across sectors. Disaggregation by sector is suggested.Singapore: Is “water use efficiency" the same as "water productivity”?Cabo Verde: Difficult to measure / Need further informationAfrican IAEG-SDG members: partially agree, difficult to measure, need for metadata UK: will be problematic due to risk of perverse incentives e.g. against relocating low Value added, water intensive industries to water rich sub national areas, or ‐ ‐towards increasing offshore production. Gives important insights into more effective ways of using scarce resources, but needs to be used with caution.Estonia: Clear definition neeeded; in general indicator is suitable for measuring the target.France: does this indicator take into account all the withdrawals (blue and green water) and all the resources (rainwater + input-output balance of the border rivers) ?. Clarify the definition. Italy: indicator does not cover complete target Australia: Request clarification in the specification. Disaggregation by bio-region and related characteristics should be noted. Cross-border reporting will be an issue for this indicator. Potential for use of GIS data should be exploited. UNCEEA: The SEEA Water provides the standard for measuring total water use, which can also be disaggregated by economic activity based on ISIC. Using the SEEA means this information can easily be combined with value-added information from the SNA (which uses the same classifications) to calculate water use efficiency for the economy as a whole and disaggregated by economic activity.
FAO on behalf of UN-Water
Percentage of total available water resources used, taking environmental water requirements into account (Level of Water Stress)
Ecuador: suggests an indicator that allows us to highlight the volume of wasted waterCuba: Suggests "Percentage of water extraction, including all sectors and sources"UN System Submission, incl. UN Water and WHO/UNICEF JMP: Suggested to change the wording of the suggested indicators to “Level of water stress: freshwater withdrawal in percentage of available freshwater resources”;Eurostat: water stress is measured at river basin level (not country), which raises questions about the added value of aggregation at national and global level. suggests alternative indicators "proportion of land (or population) that is, in annual average, more than one month in water stress"
UN Secretary-General's Advisory Board on Water and Sanitation -UNSGAB: Requests third indicator on sustainable withdrawals to measure progress towards the political ambition
Colombia, Cabo Verde: clarify the indicator/ definition of Water Stress; USA: Strong conceptual fit; this should be "total available rewewable water resources"; Earth observations (remote sensing) may be able to be used for this. African IAEG-SDG members: partially agree, needs more clarityUK: supports suggested indicatorEstonia: suitable but difficultBrazil: Difficulties to reach conceptual precision and have adequate information for the calculation of the indicator (Tier II). We suggest the exclusion of this indicator.Eurostat: propose to differentiate the data by a) water use for cooling b) water use for hydropower, and c) water use for other purposesUNCEEA: Total Water Abstraction can be calculated based on SEEA-Water methodology and is captured in the PSUT for water. Total Available Water Resources can be calculated from the SEEA-Water asset accounts.
FAO on behalf of UN-Water

Summary of Comments - p. 43 of 265
Target 6.5 By 2030, implement integrated water resources management at all levels, including through transboundary cooperation as appropriate.Suggestions for Modifications and Replacement Indicators Suggestions for Additional Indicators Additional Comments Tier
6.5.1 Tier I
Target 6.6 By 2020, protect and restore water-related ecosystems, including mountains, forests, wetlands, rivers, aquifers and lakes. Suggestions for Modifications and Replacement Indicators Suggestions for Additional Indicators Additional Comments Tier
6.6.1 Tier II
Suggested Indicators as of August 11
Possible Compiling Entity
Degree of integrated water resources management (IWRM) implementation (0-100)
Brazil: Difficulty in relation to the subjectivity of the indicator proposed. Tier II. And proposes this replacement indicator, "Existence of an implemented National Water Policy"Switzerland and France propose keeping the indicator proposed by UN-Water on transboundary cooperation as a priority indicator
UNECE Environment Division, UN Secretary-General's Advisory Board on Water and Sanitation -UNSGAB: Supports second indicator “% of transboundary basin area with an operation arrangement for water cooperation” to cover the specific issue of transboundary water resources UN Water: supports the first but suggests a second indicator “Percentage of transboundary basin area with an operational arrangement for water cooperation” to fully cover target UNFF: The proposed indicator is rather vague. If maintained this indicator would have to be augmented by other indicators: The status of IWRM areas and the proportion of water basins under management (IWRM) would help reflect progress towards this target.
USA: Conceptual fit weak to moderate; This does not give a real indicator. The real indicators are hidden behind whatever is included in the survey used to determine IWRM implementation. This represents means of implementation and the scale will need to be robust and clearly defined for objective reportingGermany: integrate transboundary cooperation into the suggested questionnaire-based evaluation instead of a second specific indicator on transboundary cooperationEcuador, Cabo Verde, India: Clarify methodology for the calculation Japan: supports suggested indicator, however, member states should be consulted in drafting the national questionnaires to calculate "Degree" so that diverse conditions relating to IWRM (e.g. lack of transboundary water in a country) are reflected in evaluating the degree.African IAEG-SDG members: agree to suggested indicatorUK: support this indicator.The indicator on transboundary arrangements seems to be more restricted and potentially open to dispute between countries; will be very qualitative and it is not clear how useful it will be at a global aggregated level Estonia: is suitableEurostat: "degree of implementation" needs to be clarified. Does this refer to quantity (share of water bodies included in IWRM) or quality of implementationUNCEEA: This cannot be informed by the SEEA, but implementation of SEEA-Water should be seen as a tool in achieving this target.
UNEP on behalf of UN-Water
Suggested Indicators as of August 11
Possible Compiling Entity
Percentage of change in wetlands extent over time
USA: Suggested to add the terms "constructed as well as natural" in front of the word "wetlands"; UNFF: proposal is “Percentage of change in protected areas broken down by ecosystem type” to have holistic view; wetlands cover only small partICUN: suggests "Coverage of important sites for biodiversity by protected areas (freshwater)"
Cuba: Include "Proportion of land covered by forest"Estonia: Indicator is relevant for measuring the target but suggests additional indicator for measuring the target: "Percentage of water bodies with good ecological quality. "Canada: Consider supplementing with measures of health of rivers, lakes, forests and aquifers.
Colombia, Cabo Verde, African IAEG-SDG members, France: The suggest indicator does not cover the entire target. It is necessary to include other ecosystems, such as forest, rivers, lakes…Australia: Question the exclusion of other aspects, including rivers. Note the potential use of earth observation based monitoring of wetlands looking at land-use, land-cover, vegetation cover, inundation frequency, biodiversity. Denmark: indicator covers part of the agreed target scope. A dedicated indicator on sustainable withdrawals (under Target 6.4) may alleviate this gap if environmental flow requirements are explicitly included (if no change is made: “wetlands” is a good “proxy”, choice, to make it operational)Korea: Need more specification on method for calculating; need agreed standard for 'change'USA: Strong conceptual fit; remote sensing may be able to be used for this. Clear methodology will need to be established. covers only one of the ecosystems listed in the targetJapan: Definition of proposed indicator is not clearTurkey: It may not be an indicator that can be very important in determining the target. Although no change was observed over time, it is possible to ensure sustainable management for wetlands.UK: The indicator should address both extent and condition of wetlands however both are difficult to measure. UN System Submission, incl. UN Water and WHO/UNICEF: Suggested to use Ramsar broad definition of “wetland”, which includes rivers and lakes, which would partly address the concern voiced that other ecosystems should be covered as well; Eurostat: Indicator only covers a small segment of the target. There could be a water quality of freshwater ecosystems indicatorUNCEEA: This indicator could be aligned with the methodology used in the SEEA Experimental Ecosystem Accounting as it is developed.
CBD and UNEP on behalf of UN-Water

Summary of Comments - p. 44 of 265
Suggestions for Modifications and Replacement Indicators Suggestions for Additional Indicators Additional Comments Tier
6.a.1 OECD-DAC Tier II
Target 6.b Support and strengthen the participation of local communities in improving water and sanitation management. Suggestions for Modifications and Replacement Indicators Suggestions for Additional Indicators Additional Comments Tier
6.b.1
OTHER COMMENTS:
Target 6.a By 2030, expand international cooperation and capacity-building support to developing countries in water- and sanitation-related activities and programmes, including water harvesting, desalination, water efficiency, wastewater treatment, recycling and reuse technologies.
Suggested Indicators as of August 11
Possible Compiling Entity
ODA for water and sanitation related activities and programmes
Denmark: Suggest to add the word “volume” or “level” of ODAUN System Submission, incl. UN Water and WHO/UNICEF JMP: Suggested to slightly modify suggested indicator “Amount of water and sanitation related Official Development Assistance that is part of a government coordinated spending plan”, computed as the proportion between the amount of water and sanitation related ODA a government receives, and the total amount budgeted for water and sanitation in a government coordinated spending plan; suggested to add information about capacity building;
Colombia: suggest complementing the indicator with information about capacity building Japan: The definition of "water and sanitation related" needs to be clarified and activities and programes related to water-related disasters (floods, landslides, etc.) should be includedAfrican IAEG-SDG members: agree with suggested indicatorUK: If used will need considerable further work to define this as the proposed specification does not measure the target as it is too broad.
Suggested Indicators as of August 11
Possible Compiling Entity
African IAEG-SDG members: Proposed indicator: "percentage of local communities participating in water and sanitation management committees"UN System Submission, incl. UN Water and WHO/UNICEF JMP: suggests “Percentage of local administrative units with established and operational policies and procedures for participation of local communities in water and sanitation management” UNECE Environment Division:“Effective participation of local communities and other members of the public concerned in water and sanitation management”
Germany: Suggested headline indicators for goal 6: (1) Percentage of population using safely managed drinking water service and (2) Percentage of wastewater safely treatedWorld Bank on behalf International Finance Corporation: Suggested to use indicators that reflect private sector’s contribution such as “new loans for SMEs (# and $) for water and sanitation”, “Number of people with improved water and sanitation provided by the private sector” or “Private sector investment in water and sanitation “
UN System Submission, incl. UN Water and WHO/UNICEF JMP: concept of monitoring ladder is proposed; UNCEEA: SEEA, SEEA-Water and SEEA Experimental Ecosystem Accounting provide definitions and methods relevant for the compilation of many of the proposed indicatorsEurostat: Several of the proposed indicators throughout the goal use the term "safely managed". This has different meanings depending on the context and should either be replaced by more concrete wordings or clearly defined. (Eurostat)Australia: The majority of suggested indicators for Goal 6 are not currently available for Australia. More work will be needed to ensure quality reporting towards this Goal.

Summary of Comments - p. 45 of 265
Goal 7 Ensure access to affordable, reliable, sustainable and modern energy for all Target 7.1 By 2030, ensure universal access to affordable, reliable and modern energy services.
Suggestions for Modifications and Replacement Indicators Suggestions for Additional Indicators Additional Comments Tier
7.1.1 World Bank Tier I
7.1.2 Tier I
Target 7.2 By 2030, increase substantially the share of renewable energy in the global energy mix.Suggestions for Modifications and Replacement Indicators Suggestions for Additional Indicators Additional Comments Tier
7.2.1 Tier I
Suggested Indicators as of August 11
Possible Compiling Entity
Percentage of population with electricity access (%)
Canada: does not fully cover target; Consider adding indicators on reliability (outages, in terms of frequencies and/or duration) and on affordability.International and regional organizations which are part of UN-Energy, SE4ALL and the "Global Tracking Framework" effort, in particular WHO: Suggestion for additional third indicator “Percentage of population with primary reliance on clean fuels and technologies in the home, %”
Ecuador: suggested to divide into urban and rural areasInternational and regional organizations which are part of UN-Energy, SE4ALL and the "Global Tracking Framework" effort: Support the suggested indicatorUSA: Doesn't capture reliability and affordability dimensions; dependent on surveysJapan: Not relevant for JapanAfrican IAEG-SDG members: partially agree to the suggested indicator UK: The UK support this indicator. Should include share of the population with access to modern cooking solutions, by urban and ruralEurostat: Definition needs to be improved, it is not clear if this means energy services (national grid connections) or also small scale generationUNCEEA: Household surveys would be required to assess household access, but the SEEA-Accounts can provide much contextual information on the magnitude of electricity consumption by households relative to other sectors, as well as information on government and private spending on electicity services and associate infrastructure.
Percentage of population with primary reliance on non-solid fuels (%)
Eurostat: Proposed alternative indicator: "Percentage of population using clean cooking systems"WHO: Reformulate “Percentage of population with primary reliance on clean fuels and technologies at the household level” (as defined by WHO guidelines) UNWOMEN: Reformulate "Percentage of population with primary reliance on non-solid fuels, by income or wealth, urban/rural location"
Ecuador: Suggested to divide into urban and rural areasEurostat: This indicator ignores the possibility to use biomass as a clean way of cooking and ongoing work on thisJapan: This suggested indicator has little relationship with the target and is not relevant for Japan; clarify the meaning of "non-solid fuels" and "primary reliance"Turkey: Clarification is neededAfrican IAEG-SDG members: partially agree to the suggested indicator, needs to be more specific in particular regarding "non-solid fuels" France: clarify whether “non solid fuels” would address “modern energy services” ; can be discardedInternational and regional organizations which are part of UN-Energy, SE4ALL and the "Global Tracking Framework" effort: Support the suggested indicatorUNCEEA: Household surveys would be required to assess household reliance on non-solid fuels, but the SEEA-Accounts can provide much contextual information on the magnitude of consumption of such fuels by households relative to other sectors, as well as information on government and private spending on provision of services and associate infrastructure.
Suggested Indicators as of August 11
Possible Compiling Entity
Renewable energy share in the total final energy consumption (%)
Brazil: It would be better measured in terms of internal energy supply; replace with "Renewable energy share in the total primary energy (%)"UNFF: Our proposed indicator is: Share of total energy use from renewable energy sources by source/type (biomass, biofuels, geothermal, hydro, solar etc)
Australia: Need to define ‘substantially’. Relevant and measurable in Australia, but with a year or two lag in accuracy. Potential for biased results for resource and transport-based economies which use relatively large proportions of transport and non-electrical energy.Ecuador: Narrow focus on consumptionUSA: Doesn't differentiate between grid-connected and off-gridJapan: Support this suggested indicator; Japan can provide renewable energy composition of electricity generation (primary energy), not final energy consumptionAfrican IAEG-SDG members: agrees to the suggested indicatorCanada: The indicator should be in relation to total primary energy (and not total final consumption)Portugal, Russia, International and regional organizations which are part of UN-Energy, SE4ALL and the "Global Tracking Framework" effort: Support the suggested indicator which is also recommended by OECDEurostat: Needs to take account of sustainable management of natural resources for energy production - water and wood are both renewable energy sources but the indicator does not capture if these are being used sustainably for energy productionUNCEEA: indicator could be defined SEEA compliant: "e.g. Share of energy from renewable sources in the gross energy input"

Summary of Comments - p. 46 of 265
Target 7.3 By 2030, double the global rate of improvement in energy efficiency.Suggestions for Modifications and Replacement Indicators Suggestions for Additional Indicators Additional Comments Tier
7.3.1 Tier I
Suggestions for Modifications and Replacement Indicators Suggestions for Additional Indicators Additional Comments Tier
7.a.1 UNFCCC Tier II
Suggested Indicators as of August 11
Possible Compiling Entity
Rate of improvement in energy intensity (%) measured in terms of primary energy and GDP
Brazil: The energy intensity of economy should be observed; replace with "Overall energy intensity measured in terms of TOE/US$ GDP"
Russia: Suggests to use OECD Green Growth indicator “Energy productivity” and the indicator “Consumption of fuel - energy resources per unit of production, works and services”.Canada: does not fully cover target, intensity weak proxy for efficiency; Consider adding rate of improvement in final energy per capita. Consider adding structure adjusted energy intensity.
Ecuador: disaggregate by economic activity USA: Really need to have end-use sector data (e.g. transport, buildings)African IAEG-SDG members: agree to the suggested indicator Portugal, UK, International and regional organizations which are part of UN-Energy, SE4ALL and the "Global Tracking Framework" effort: Support the suggested indicatorUNCEEA: Energy Input and GDP can be directly derived from the PSUT for Energy and the SNA, but definitions would need to be aligned.
Target 7.a By 2030, enhance international cooperation to facilitate access to clean energy research and technology, including renewable energy, energy efficiency and advanced and cleaner fossil-fuel technology, and promote investment in energy infrastructure and clean energy technology.
Suggested Indicators as of August 11
Possible Compiling Entity
Improvement in the net carbon intensity of the energy sector (GHG/TFC in CO2 equivalents)
Germany: Proposed modification: Remove “Improvement in”Japan: Suggested re-formulation: “Improvement in the net carbon intensity of the energy sector (energy originated CO2 / TFC)” as the target seems to be intended for the CO2 reductionCuba: Proposed new indicator: “Amount of investments into renewable energy and energy savings”, as better responding to the targetColombia: Suggested indicator does not include international cooperation. Supports “Amount of Foreign Direct Investment and Financial transfer for these purposes” or two indicators- one regarding financial resources and other about non-financial resources to facilitate access to clean energy research and technologiesBrazil: replace with "Overall carbon intensity measured in terms of TCO2/Total primary energy consumption" and "investment in energy efficiency as percentage of GDP (%)"Canada: does not fully cover target; # of countries with programs in place to promote sharing clean energy research and technologyIndia: proposes an alternate indicator: “Net ODA on clean energy research and technology"
Australia: Measurable but not useful since it is not a direct measure of international co-operation or investment promotion and there is risk of misreporting. Some form of financial investment or quantitative indicator of capacity installed may be more useful. Ecuador: indicator not very relevant; suggests an indicator that measures cooperation in the generation of clean energyDenmark: technical in nature and difficult to communicate; alternative indicator on FDI and financial transfers may lack quantifiable objectiveUSA: Captures an important environmental indicator but progress towards diversification is more important to measure; the indicator does not capture well the emphasis in the target on transfer of clean technology.African IAEG-SDG members: agree to the suggested indicatorUK: clarify whether it relates to energy or electricity International and regional organizations which are part of UN-Energy, SE4ALL and the "Global Tracking Framework" effort: support suggested indicator as an indirect indicator for this target as broader picture of the environmental sustainability of the energy sector UNCEEA: The SEEA Emissions Accounts could inform this indicator if the indicator definition were changed to be SEEA aligned.

Summary of Comments - p. 47 of 265
Target 7.b By 2030, expand infrastructure and upgrade technology for supplying modern and sustainable energy services for all in developing countries, in particular least developed countries and small island developing States.
Suggestions for Modifications and Replacement Indicators Suggestions for Additional Indicators Additional Comments Tier
7.b.1 UNSD Tier I
Suggested Indicators as of August 11
Possible Compiling Entity
Ratio of value added to net domestic energy use, by industry.
Cuba: Replace with “Proportion of population with access to electricity from renewable resources” Brazil: Not correlated, replace with "Investments in energy efficiency as percentage of GDP (%) and the amount of foreign direct investment andfinancial transfer for infrastructure and technology to sustainable energy services"India proposes an alternate indicator: “Net ODA for expanding infrastructure and upgrading technology for supply of sustainable energy.”International and regional organizations which are part of UN-Energy, SE4ALL and the "Global Tracking Framework" effort: replace suggested indicator with indicator suggested for target 7.1 “Percentage of population with electricity access,%” as better fit
Canada: Does not cover target well; Consider adding Revenues from sales of clean technologies and services; clarify term 'net domestic energy use'
Denmark: Need for additional energy efficiency indicator questioned; alternative indicator related to implementation of international cooperation projects to facilitate access to clean energy not useful as global indicator as it measures “input” rather than “outcome”USA: Not an implementation indicatorJapan: Need to clarify the meaning of "Ratio of value added to net domestic energy use, by industry"Portugal, African IAEG-SDG members: agree to the suggested indicator UNCEEA: Note this indicator would be combined with the energy efficiency and energy intensity indicators above to produce one aggregate indicator which can be disaggregated by economic activity based on the SEEA accounting structure.
OTHER COMMENTS:
Germany: Suggested headline indicators for goal 6: (1) Percentage of population with electricity access; (2) Renewable energy share in the total final energy consumptionMalaysia: Please specify the definition “Energy” and the the diferrent between “Affordable, reliable, sustainable and modern categories listed under Goal 7Japan: We would like you to clarify the meaning of "modern" (according to "World Energy Outlook 2014" published by International Energy Agency, "modern energy services" is treated as electricity and other energy sources except traditional use of biomass for cooking (such as wood, crop waste and dung; based on the definition by World Health Organization), which may be suitable for the purpose of this target)International Finance Corporation: Suggested to use indicators that reflect private sector’s contribution such as “new loans for SMEs (# and $) for sustainable energy”, “Number of people with improved sustainable energy provided by the private sector” or “Private sector investment in sustainable energy“UNCEEA: SEEA accounts provide contextual information, definitions and methods relevant for the compilation of many of the proposed indicators, some of which could be redefined to be SEEA compliant
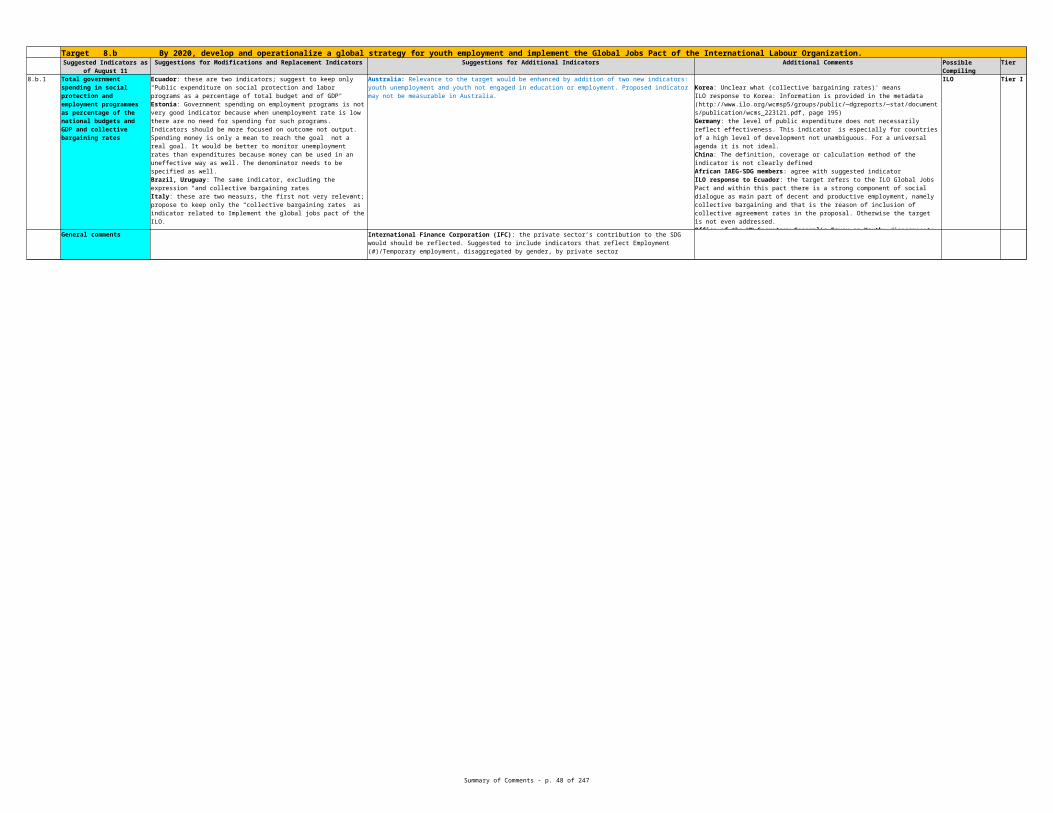
Summary of Comments - p. 48 of 265
Goal 8 Promote sustained, inclusive and sustainable economic growth, full and productive employment and decent work for all
Target 8.1 Sustain per capita economic growth in accordance with national circumstances and, in particular, at least 7 per cent gross domestic product growth per annum in the least developed countries.Suggestions for Modifications and Replacement Indicators Suggestions for Additional Indicators Additional Comments Tier
8.1.1 GDP per capita, PPP World Bank Tier I
Target 8.2 Achieve higher levels of economic productivity through diversification, technological upgrading and innovation, including through a focus on high-value-added and labour-intensive sectors.Suggestions for Modifications and Replacement Indicators Suggestions for Additional Indicators Additional Comments Tier
8.2.1 Tier I
Suggested Indicators as of August 11
Possible Compiling Entity
USA: suggests "Annual growth rate of GDP per capita", the target is the growth rate of per capita GDP. The growth rate does not require adjustment by Purchasing Power Parity exchange rates, though they come into play in other indicators. Portugal: We suggest using “GDP in volume”,since it is more suitable to measure GDP growth rates, instead of “GDP per capita, PPP”. Brazil: Use "Real GDP per capita growth rate"UN Statistical System organisations: supports suggested indicator, but suggests the following modification "GDP per capita growth rates"
UNCDF suggests an additional indicator “Number and % of subnational regions experiencing 7% per annum GDP growth”
Argentina: Argentina did not participate in the 2010 PPC RoundAustralia: The annual growth rate of real GDP per person is a more relevant measure than GDP per capita.Russia: regular global round of comparisons would be difficult and have high costs.Ecuador: use purchasing power parity for a determined time period (4-5 year periods)Germany, UK: Supports the suggested indicatorPeru: GDP purchasing power parity is jointly developed with countriesAfrican IAEG-SDG members: agree with suggested indicator
Suggested Indicators as of August 11
Possible Compiling Entity
Growth rate of GDP per employed person
USA: suggests alternatively using total factor productivitity (TFP) as the indicator. GDP/employed person is a weak measure of productivity because it does not account for informal activitiy, or efficient use of inputs. Figures are available for 80+ countries via World Bank Business Enterprise Surveys.Portugal: should be GDP in volume.IMF: total factor productivity (TFP) should be the preferred measure of productivity, and should be used to complement (if not substitute) for the series on average labor productivity
Switzerland propose an additional indicator on job creation or business start-upsUNCTAD/Partnership on Measuring ICT for Development: suggests as additional indicator "value added of the ICT sector"ITC: "Export diversification in terms of products and markets", originally proposed by ITC/WTO, should be considered as an important complement/alternative UNCDF suggests an additional indicator “% Increase in gross fixed capital formation in sub national regions”
Argentina: definition of the term "employed person" is neededAustralia: The growth rates of multifactor productivity and real GDP per hour worked are conceptually better indicators for this target than growth rate of GDP per employed person. Ecuador: identify sectors with high aggregated value and those that are labor intensiveColombia: The suggested indicator does not completely cover the target. It’s necessary to include information about diversification, technological upgrading and innovationRussia: We offer to calculate this indicator as the ratio of the volume index of GDP (in %) to the index changes in the number of employees (in %). African IAEG-SDG members: agree with suggested indicatorILO response to Colombia: chosen indicator will have to be combined with indicators under other goals in order to have a broader picture, in order to keep reduced number of indicators.Eurostat: Indicator only adresses productivity aspect of target.Disaggregation on sub-national level desirable, if available.
World Bank and ILO

Summary of Comments - p. 49 of 265
Suggestions for Modifications and Replacement Indicators Suggestions for Additional Indicators Additional Comments Tier
8.3.1 ILO Tier II
Target 8.3 Promote development-oriented policies that support productive activities, decent job creation, entrepreneurship, creativity and innovation, and encourage the formalization and growth of micro-, small- and medium-sized enterprises, including through access to financial services.
Suggested Indicators as of August 11
Possible Compiling Entity
Share of informal employment in non-agriculture employment by sex.
USA: replace with "Percent of micro, small, and medium enterprises (MSMEs) with a loan or line of credit (by sex of owner). "UK: should read "share of formal employment in non agriculture ‐employment by sex"Brazil: Use "Share of non formally registered workers in the population of workers" (the right concept is informal occupation, not informal employment)UNCDF: suggests to use "% of MSMEs with a loan or line of credit"
USA: additional indicator "Share of formal employment in non-agricultural employment by sex"UNCTAD/Partnership on Measuring ICT for Development: suggests as additional indicator "employment in the ICT sector/employment in ICT occupations"ITC: propose the possibility of rolling out a country survey that would allow calculating "N° of policies dedicated to the enhancement of MSMEs that have been implemented at the national/regional level." IMF: agree with the proposed indicator but also supports "percentage of MSMEs with a loan or line of credit"
Australia: an indicator on informal employment is not adequate to report against the target. Informal employment is not relevant in the Australian context.State of Palestine: has indicator about share of Household value added to GDP by activity that covers attributes of the target. Germany: useful indicator but concept of informal employment needs further conceptual specification for its application in developed countries; traget does not call for disaggregationIndia and USA comment that the indicator does not cover the major attributes of the target.China: The definition, coverage or calculation method of the indicator is not clearly definedAfrican IAEG-SDG members: agree with suggested indicatorItaly: suggests to find better indicatorColombia: does not completely cover target. necessary to include measures on entrepreneurship, creativity and innovation, and access to fin. services. Also, do not restrict to non-agri. employment.ILO response to Colombia: chosen indicator will have to be combined with indicators under other goals in order to have a broader picture, in order to keep reduced number of indicators.ILO: Recently agreed definition of informal employment is applicable to all countries and can be adapted to various types of countries; to be seen in combinaton with other indicators; captures the essence of the target if only one indicator used.Eurostat:Data availability is limitedOffice of the UN Secretary-General's Envoy on Youth: disaggregate by ageUNCTAD: disaggregate at least into industry and services

Summary of Comments - p. 50 of 265
Suggestions for Modifications and Replacement Indicators Suggestions for Additional Indicators Additional Comments Tier
8.4.1 UNEP and UNIDO Tier II
Target 8.4 Improve progressively, through 2030, global resource efficiency in consumption and production and endeavour to decouple economic growth from environmental degradation, in accordance with the 10-year framework of programmes on sustainable consumption and production, with developed countries taking the lead.
Suggested Indicators as of August 11
Possible Compiling Entity
Resource productivity.
Ecuador: suggested indicator does not indicate on what specific variable efficiency and sustainable developmental are measured and suggests alternative indicator “generation of non-contaminating electric energy rate” (e.g. hydroelectric energy), over total energy productionUSA: Replace with "Effective tax rate on energy use" as suggested indicator has only a weak conceptual fit with targetUNEP: suggests "National resource efficiency in consumption and production activities measured, also providing guidance for implementation of the 10-year framework of programmes on sustainable consumption and production patterns."Eurostat: consider following alternative indicators "Trade in environmental goods and services in USD/year", "Investments in environmental goods and services in USD/year" and/or the "Global Competitiveness Index"
Switzerland comments that the target discusses both consumption and production but the indicator only looks at production measures and propose as an additional indicator, "the material used abroad for the production of imported goods, represented by the material footprint (MF) we suggest to the Raw Material Consumption (RMC) related to GDP."World Bank: Proposes two indicators "Adjusted Net Savings indicator",which, as a percentage of the Gross National Income, measures gross savings minus consumption of fixed capital, plus education expenditures, minus energy depletion, mineral depletion, et forest depletion, and particulate emissions and carbon dioxide damage and "Adjusted Net National income per capita, which equals gross national income minus consumption of fixed capital, energy depletion, mineral depletion, and net forest depletion, divided by midyear population."
Colombia: Currently not feasible for our country. We are working on it and hope to have information in 5-10 years.Denmark: Priority to maintain resource productivity as indicator with a preference to use DMC/BNP as key indicator, possibly supplemented with DMC/GVA for selected sectors. Priority to include an indicator for “ decoupling of growth from environmental degradation”. Indicator should also measure environmental degradation. An indicator on GDP/natural capital should be included for example by using the work by World Bank and UNEP.Germany: We would like to use the indicator “resource productivity” defined as GDP/DMCJapan, Portugal: supports suggested indicatorCabo Verde: needs more information about definitionChina: There is no relevant surveys or data sources in ChinaAfrican IAEG-SDG members: partially agree with suggested indicator; indicator needs to be clarifiedEstonia: Indicator is relevant, but the potential value of the resource should be taken into account; calculate the resource productivity for some sectors and calculate the value added from using a certain productsIndia comments that the indicator does not cover the major attributes of the target.UNCEEA: This indicator could be informed by the SEEA Accounts if defined in alignment with the SEEA standard as Resource productivity - gross domestic product (GDP) divided by domestic material consumption (DMC)
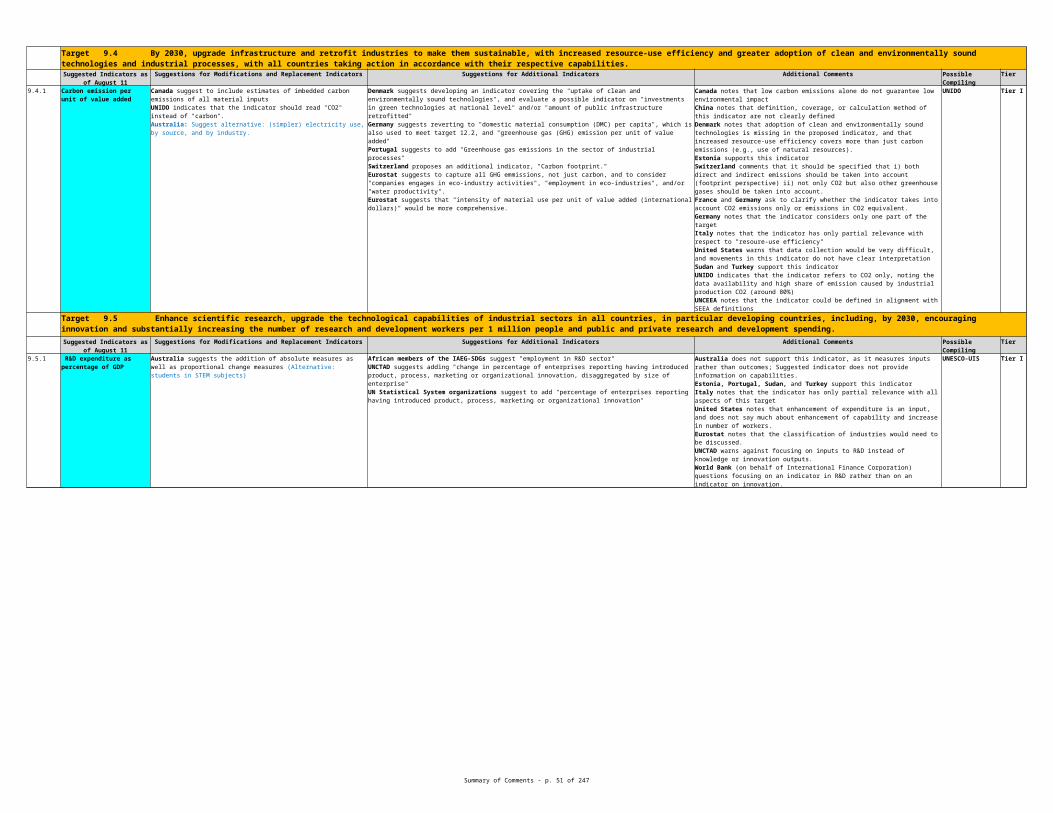
Summary of Comments - p. 51 of 265
Target 8.5 By 2030, achieve full and productive employment and decent work for all women and men, including for young people and persons with disabilities, and equal pay for work of equal value.
Suggestions for Modifications and Replacement Indicators Suggestions for Additional Indicators Additional Comments Tier
8.5.1 ILO Tier II
8.5.2 ILO Tier I/II
Target 8.6 By 2020, substantially reduce the proportion of youth not in employment, education or training.Suggestions for Modifications and Replacement Indicators Suggestions for Additional Indicators Additional Comments Tier
8.6.1 ILO/OECD Tier I
Suggested Indicators as of August 11
Possible Compiling Entity
Average hourly earnings of female and male employees by occupations (Wages/Gender wage gap)
Brazil: Use "Average hourly wages of female and male employees by occupations (Wages/Gender wage gap)UNDESA/DSPD/Secretariat for the Convention on the Rights of Persons with Disabilities: Suggests to use "Unemployment rate, disaggregated for persons with/without disabilities"
Canada: Suggest also looking at employment rates as an indicator to have fuller measure of the target; suggests disaggregation by disability where possibleUN Statistical System organisations: Employment to working population (15 years and above) ratio by sex and age group
Australia: Equal pay for work of equal value is difficult to measure. A broader labour underutilisation measure or employment/population ratios would be preferable to unemployment rates when measuring full and productive employment. Germany: We suggest supplementing the suggested indicator with the indicator “gender pay gap”African IAEG-SDG members: partially agree with suggested indicator, difficult to measure informal and rural activities in AfricaColombia: The suggested indicator does not cover completely the target. Decent work is more than earnings (opportunities, productive work, decent working hours, work-family conciliation, security and stability). Also, average does not inform about income; Therefore, suggested to measure the average monthly earnings, or complement with other indicators like labour market participation rate, hours worked per month and time-related underemployment.ILO response to Colombia: In most of the targets the indicator (and in some cases the set of indicators) is not enough to capture the objective of the target (e.g. decent work encompasses at least four dimensions but the selected indicators were selected taking other indicators from other goals in order to combine them. For example, working poor is part of the indicators under Goal 1 where it was suggested to have poverty rates BY EMPLOYMENT STATUS, in order to capture this missing dimension here as a proxy for labour productivity. UN Statistical System organizations: indicator could be extended to include also the self-employed and defined as Gender pay gapOffice of the UN Secretary-General's Envoy on Youth: supports suggested indicator
Unemployment rate by sex, age-group and disability.
Brazil: Use "Unemployment rate by gender and age groups", difficulty to include disability
Australia: do not include discouraged workers. While any single indicator is imperfect, either a broader labour underutilisation measure or employment/population ratios would be preferable. USA: Weak conceptual fit with target; May be misleading in the context of many developing countries, where only those from wealthier households -- often young people -- can afford to be openly unemployed. In contrast, poor people generally have no option to working, however unproductively. Germany: concept of disability should be further specified to allow for international comparability. African IAEG-SDG members: agree with suggested indicatorCabo Verde: We suggest to remove the disaggregation by disability. Disability is important and should be measured, but disaggregation of unemployment rate by disability will greatly increase the survey costOffice of the UN Secretary-General's Envoy on Youth: supports suggested indicatorEurostat: Definition of unemployment rate needs sensible treatment of informal employment. Disaggregation on sub-national level desirable, if available
Suggested Indicators as of August 11
Possible Compiling Entity
Percentage of youth (15-24) not in education, employment or training (NEET)
Office of the UN Secretary-General's Envoy on Youth: inclusion of an additional indicator “Youth unemployment rate”
Argentina: does not agree with theis indicator, because payed employment is not considered (on the contrary, the non paid employment as recognized by the19th WLO-CIET).Brazil: It’s necessary to define the scope of training and how to capture this information.Switzerland comments that this indicator is not relevant for their country and proposes further analysis on the need for this indicator.Korea: Need to harmonize NEET definition with the OECD definitionChina: There is no relevant surveys or data sources in China African IAEG-SDG members: agree with suggested indicatorUK: supports suggested indicatorCanada: Suggests gender disaggregationUN Statistical System orgaizations: suggested to disaggregate by sex

Summary of Comments - p. 52 of 265
Suggestions for Modifications and Replacement Indicators Suggestions for Additional Indicators Additional Comments Tier
8.7.1 ILO Tier II
Target 8.8 Protect labour rights and promote safe and secure working environments for all workers, including migrant workers, in particular women migrants, and those in precarious employment.Suggestions for Modifications and Replacement Indicators Suggestions for Additional Indicators Additional Comments Tier
8.8.1 ILO Tier II
8.8.2 ILO Tier I
Target 8.7 Take immediate and effective measures to eradicate forced labour, end modern slavery and human trafficking and secure the prohibition and elimination of the worst forms of child labour, including recruitment and use of child soldiers, and by 2025 end child labour in all its forms.
Suggested Indicators as of August 11
Possible Compiling Entity
Percentage and number of children aged 5-17 years engaged in child labour, per sex and age group (disaggregated by the worst forms of child labour)
Brazil: Use "Percentage of children 5-17 years old occupied in the employed population by sex and age groups" due to difficulty of capturing part of the worst forms of child laborSRSG on Violence against Children: supports the suggested indicator but currently proposed indicator under 16.2 “Number of victims of trafficking (within and across countries), slavery, exploitation and forced labour, per 100,000” would be more suitable, as it explicitly aims to eradicate forced labour, slavery and human traffickingEurostat: Add a a simple measure of presence or not of child recruitment into fighting forces. Add measurement on child sex tourism.
Australia: Redefine 'child labour' to differentiate from ‘child work’. Also, the indicator will not capture data on instances of human trafficking, slavery or slavery-like practices. Concern regarding age range. Ecuador: considering that the percentage of population in reference is small, a disaggregation by worst types of child labor is not relevantChina: The definition, coverage or calculation method of the indicator is not clearly definedAfrican IAEG-SDG members: partially agree with suggested indicator, legal age varies accross countries in AfricaParaguay has objections to this indicatorMexico: data on worst forms of child labor currently not compiledItaly: clear definition of child labor is requiredColombia: Disaggregation by worst forms currently not feasible for our country. It´s necessary to include measures of human traffickingKorea: Need further clarification on “by the worst forms of child labour”ILO response to Colombia: trafficking is included in other goalILO response to Korea: Forms of child labor refers to and is defined in ILO Convention 182 and the 18th. International Conference of Labour StatisticiansOffice of the UN Secretary-General's Envoy on Youth: supports suggested indicator
Suggested Indicators as of August 11
Possible Compiling Entity
Frequency rates of fatal and non-fatal occupational injuries and time lost due to occupational injuries by gender and migrant status
Brazil: Use "Frequency rates of fatal and non-fatal occupational injuries by gender and migrant status", as difficult to obtain information on time lost
Ecuador: we recommend a separation of two different indicators; one covering frequency of work-related accidents and another for time lost because of these accidents
USA: by sex.Colombia: Not completely feasible for our country. We have information about formal employment, but not about informal employment. Korea: Number of ILO conventions ratified is not appropriate measure of labor rights protection as ILO member countries are under different (legal and social) circumstances for ratification of conventions, and such ratification cannot be mandated among countriesAfrican IAEG-SDG members: agree with suggested indicatorUK: Frequency rates - clarify if incidence or prevalence of injury is being used. difficulty in disaggregating by migratory status.Paraguay has objections to this indicatorItaly: we suggest to use only frequencies, because the time lost due to occupational injuries is not particularly relevant and very difficult to estimate
Number of ILO conventions ratified by type of convention.
Ecuador: To reduce the number of indicators, we recommend the removal of the second indicator of Target 8.8 since the first indicator measures the target in the best wayUSA: Reformulate "Number of fundamental and other relevant ILO conventions ratified by type of convention"ILO proposes a revision to the indicator to read, "Number of fundamental and other relevant ILO conventions ratified by type of convention."
Colombia: The suggested indicator does not reflect the target; ratification of a convention is a mean but does not necessarily imply results in terms of protection of labour rights. We suggest including unionization rate as indicator.USA:to address implementation add indicator on "Systemic problems of implementation with regard to any of the following: (a) freedom of association and collective bargaining, (b) forced labor, (c) child labor, (d) discrimination in employment, as noted by ILO supervisory mechanisms."
Australia does not support the use of this indicator (binary) Recommend its removal. Japan: What is"Number of ILO conventions ratified by type of convention"?Does it mean all of the ILO conventions ratified? Although other targets are all concerned in ILO conventions, why does only Target8.8 mention them?Switzerland comment that the indicator has limited relevance as the ratification of a convention does not yield any information on their actual implementation. African IAEG-SDG members: agree with suggested indicatorBrazil: We propose the exclusion of this indicator.

Summary of Comments - p. 53 of 265
Target 8.9 By 2030, devise and implement policies to promote sustainable tourism that creates jobs and promotes local culture and products.Suggestions for Modifications and Replacement Indicators Suggestions for Additional Indicators Additional Comments Tier
8.9.1 UN-WTO Tier II
Target 8.10 Strengthen the capacity of domestic financial institutions to encourage and expand access to banking, insurance and financial services for all.Suggestions for Modifications and Replacement Indicators Suggestions for Additional Indicators Additional Comments Tier
8.10.1 IMF Tier I
8.10.2 World Bank Tier I
Target 8.a Increase Aid for Trade support for developing countries, in particular least developed countries, including through the Enhanced Integrated Framework for Trade-Related Technical Assistance to Least Developed Countries.
Suggestions for Modifications and Replacement Indicators Suggestions for Additional Indicators Additional Comments Tier
8.a.1 WTO/OECD Tier II
Suggested Indicators as of August 11
Possible Compiling Entity
Tourism direct GDP (as % of total GDP and in growth rate); and Number of jobs in tourism industries (as % total jobs and growth rate of jobs, by gender)
Ecuador: there are two proposed indicators; we recommend the use of only the indicator of tourism as a percentage of GDP, considering this is the best indicator.Denmark: Indicator does not at all cover the sustainability element and thus does not respond to the target; if no better indicator can be found, one solution could be to use “No of countries with dedicated strategies/programmes/action plans for sustainable tourism”as focus of the target is on policy.USA: by sex; if one gets dropped prefers second indicator on number of jobs. Estonia: Estonia: Number of jobs may not be best indicator. Effeciency could be more important than creation of low value added jobs (if this could be a case) in service sector. More relevant seems to be a tourism turnover. Brazil: Use "Number of jobs in tourism industries (as %total jobs and growth rate of jobs, by gender)" as the simpler of both proposed indicatorsICAO, supported by ILO : suggests to merge UNWTO indicator with ICAO's connectivity utilization indicator into one indicatorUN Statistical System organizations: Suggested additional indicator "Connectivity opportunity utilization as % of air connectivity opportunity available and utilised"
Germany: Suggested indicators do not completely meet the target; suggsted to rephrase the indicators as "Tourism direct GDP (as % of total GDP)" and "Number of decent jobs in tourism industries (as % total jobs)"UN Statistical System organisations: suggested slight reformulation "Tourism direct GDP (as % of total GDP, per capita and in growth rates) and number of jobs in tourism industries as % of total jobs and growth rates of jobs by sex"
Australia: Proposed indicator does not relate to sustainability. Colombia: We have information about added value by activities related with tourism, but not GDP. The suggested indicator does not include information about promotion of local culture and products. Japan: Number of jobs(all employees) in tourism is estimated from SNA and doesn't distinguish by sexCabo Verde: Please separate. They are two distinct indicatorsChina: There is no relevant surveys or data sources in ChinaAfrican IAEG-SDG members: agree with suggested indicatorFrance: a qualitative dimension on sustainability is missing Paraguay has objections to this indicatorItaly: The judgement about the feasibility of the estimate based on TSA seems too optimistic; suggested indicators are measures of the impact of tourism, but do not identify any specific element of sustainability concerning the promotion of local culture and products or environmental sustainability.Eurostat: Sustainability and local culture aspects missing. Disaggregation on sub-national level desirable.UNCEEA: Indicator could be defined in alignment with SNA satelite account for tourism, and eventually with the SEEA-tourism when it is developed;
Suggested Indicators as of August 11
Possible Compiling Entity
Number of commercial bank branches and ATMs per 100,000 adults
Ecuador: suggested indicator does not allow to observe access; recommends the inclusion of the following indicator: “Financial Depth Index in the first quintile”; in addition, another more relevant indicator for economic growth could be “volume of credit given”.Germany: We would like to replace indicator to better capture the target: "Holder of a debit-card, credit-card or bank account per 100,000 adults. and "Number of insurance policy holders per 100,000 adults"
Cabo Verde: Please separate. They are two distinct indicators Brazil: In addition to access it would be important to consider the credit terms to customersUSA: strongly supports suggested indicator..African IAEG-SDG members: agree with suggested indicator
% adults with a formal account or personally using a mobile money service in the past 12 months". Possible to have a break down by income e.g. bottom 40% of income share or <$1.25/day, by gender, age (youth) and rural. Adults: ages 15+
Ecuador: suggested indicator not clearly related with the objective or the target, should be replaced with an indicator that measures “microcredit participation rate over total productive credit”Germany: We would like to replace indicator to better capture the target: "Number of insurance policy holders per 100,000 adults"USA: by sex
USA: strongly supports suggested indicator.Japan: The suggested indicator is not appropriate to gauge "target 8.10". Expansion of mobile money services does not necessarily make it easier for consumers or firms to access to financial serviceCabo Verde: Supports this indicator as very relevant for African countriesAfrican IAEG-SDG members: disagree with suggested indicator
Suggested Indicators as of August 11
Possible Compiling Entity
Aid for Trade Commitments and Disbursements
Ecuador: does not support suggested indicator; suggest indicator "growth in exportation from developed countries to countries in development", or "exportations of goods with no tariff rates from countries in development".
USA: strong conceptual fit, measured by OECD CRSChina, Philippines: Not applicable to China/Philippines African IAEG-SDG members: agree with suggested indicatorWTO: agree with the suggested indicator

Summary of Comments - p. 54 of 265
Target 8.b By 2020, develop and operationalize a global strategy for youth employment and implement the Global Jobs Pact of the International Labour Organization.Suggestions for Modifications and Replacement Indicators Suggestions for Additional Indicators Additional Comments Tier
8.b.1 ILO Tier I
General comments
Suggested Indicators as of August 11
Possible Compiling Entity
Total government spending in social protection and employment programmes as percentage of the national budgets and GDP and collective bargaining rates
Ecuador: these are two indicators; suggest to keep only "Public expenditure on social protection and labor programs as a percentage of total budget and of GDP"Estonia: Government spending on employment programs is not very good indicator because when unemployment rate is low there are no need for spending for such programs. Indicators should be more focused on outcome not output. Spending money is only a mean to reach the goal not a real goal. It would be better to monitor unemployment rates than expenditures because money can be used in an uneffective way as well. The denominator needs to be specified as well. Brazil, Uruguay: The same indicator, excluding the expression “and collective bargaining rates”Italy: these are two measurs, the first not very relevant; propose to keep only the “collective bargaining rates” as indicator related to Implement the global jobs pact of the ILO.
Australia: Relevance to the target would be enhanced by addition of two new indicators: youth unemployment and youth not engaged in education or employment. Proposed indicator may not be measurable in Australia.
Korea: Unclear what (collective bargaining rates)' meansILO response to Korea: Information is provided in the metadata (http://www.ilo.org/wcmsp5/groups/public/—dgreports/—stat/documents/publication/wcms_223121.pdf, page 195)Germany: the level of public expenditure does not necessarily reflect effectiveness. This indicator is especially for countries of a high level of development not unambiguous. For a universal agenda it is not ideal.China: The definition, coverage or calculation method of the indicator is not clearly definedAfrican IAEG-SDG members: agree with suggested indicatorILO response to Ecuador: the target refers to the ILO Global Jobs Pact and within this pact there is a strong component of social dialogue as main part of decent and productive employment, namely collective bargaining and that is the reason of inclusion of collective agreement rates in the proposal. Otherwise the target is not even addressed.Office of the UN Secretary-General's Envoy on Youth: disaggregate by age
International Finance Corporation (IFC): the private sector’s contribution to the SDG would should be reflected. Suggested to include indicators that reflect Employment (#)/Temporary employment, disaggregated by gender, by private sector

Summary of Comments - p. 55 of 265
Goal 9 Build resilient infrastructure, promote inclusive and sustainable industrialization and foster innovation Target 9.1 Develop quality, reliable, sustainable and resilient infrastructure, including regional and transborder infrastructure, to support economic development and human well-being, with a focus on affordable and equitable access for all.
Suggestions for Modifications and Replacement Indicators Suggestions for Additional Indicators Additional Comments Tier
9.1.1 World Bank? Tier II
9.1.2 World Bank Tier II
Suggested Indicators as of August 11
Possible Compiling Entity
Share of the rural population who live within 2km of an all season road
Cabo Verde suggests to use time instead of distance if the source is a survey, since respondents may have difficulties estimating distance in kilometersEurostat notes that the suggested indicators are limited to transport infrastructure, and recommends broadening the scope to "all critical infrastructure". Eurostat suggests JRC Global Human Settlement Layer as a potential data sourceBrazil proposes this replacement indicator, "Countries implementing the framework on sustainable development/global citizenship education Amount of (public and private) investment in infrastructure as percentage of GDP". Also comments that indicator is limited to rural population and fails to cover the target, and suggests reclassifying the suggested indicator to Tier III since no internationally agreed methodology.
United States, UNIDO, ITU and IMF suggest adding "proportion of households with broadband internet access". IMF suggest adding "Public and private investment in infrastructure as a proportion of GDP"African members of the IAEG-SDGs suggest adding "% of paved/tared roads to total network" and "proportion of functional railway network to the total"IMF suggests adding "number of cellphones/inhabitant", survey measures of "infrastructure quality", and measures of "infrastructure services" (electricity consumption, access to water, roads per capita, etc)UNISDR suggests adding "number of countries that adopt and implment critical infrastructure protection plan"UNCTAD suggest adding World Bank's "Logistics Performance Index" (LPI), UNCTAD's "Liner Shipping Connectivity Index" (LSCI) and ICAO's "air connectivity index"UN Statistical System organizations and UNISDR suggest to add "damage to critical infrastructure due to hazardous events"
Australia and UNISDR call for synergies between indicators for this target and the Sendai Framework for Disaster Risk Reduction 2015-2030Australia notes that this indicator may be less relevant for Australia, and could identify complementary national indicators as necessary. Focusing on roads and transportation, the suggested indicator only partially covers critical infrastructure. Requires a definition of ‘all season road’Canada notes that reliability, affordability, and equity are not covered by the indicator; China notes differences with respect to national definition, coverage, or calculation method of this indicatorEcuador comments the indicator is not feasible for them.United Kingdom supports this indicator, and asks for clarification of "all season roads" and "urban/rural" definitions. Notes that expanding definition to "reliably passable all-year round" would require linking additional data, which would be problematic. United States notes that while historic data based on household surveys exists for many countries, current efforts are underway by the World Bank, DfID and others to develop a new methodology using GIS dataUnited States questions whether World Bank's LPI belongs in this list, as it reflects the quality of a country's infrastructure alongside its policy and regulatory environment in the area of trade.IMF supports this indicator, noting that it refers to economic infrastructure, but warns that in many cases data will not be available. IMF also points out that many of the suggested indicators are highly correlated with income or may "provide an unrealistically rosy picture", and the list of indicators should include measures of the level (i.e., quantity) of infrastructure. UN Statistical System organizations support this indicator
Passenger and freight volumes
Colombia and Turkey suggest to define the indicator in relative terms, i.e., per 1,000 inhabitants or GDPBrazil, Cabo Verde and Colombia ask to clarify the means of transport (whether refers to road transport only, or also includes air, water, and rail transport)African members of the IAEG-SDGs comment that the indicator should be "by road, railway, water, and air"
United Kingdom suggests indicators promoting sustainable/active modes (e.g., "% trips under 5 miles taken by walking/cycling/public transport")
Australia notes that this indicator may be less relevant for Australia, and could identify complementary national indicators as necessary, does not take into account differences in population size or quality of transport infrastructure.Ecuador and United States suggest to remove this indicator, commenting that it is not related to the targetGermany supports this indicator, but notes that this indicator alone does not meet the targetUnited Kingdom warns that this indicator may conflict with other goals; suggests focusing on sustainable/active modes (e.g., walking/cycling + public transport).UN Statistical System organizations suggest to eliminate this indicator

Summary of Comments - p. 56 of 265
Target 9.2 Promote inclusive and sustainable industrialization and, by 2030, significantly raise industry's share of employment and gross domestic product, in line with national circumstances, and double its share in least developed countries.
Suggestions for Modifications and Replacement Indicators Suggestions for Additional Indicators Additional Comments Tier
9.2.1 UNIDO Tier I
9.2.2 UNIDO Tier I
Target 9.3 Increase the access of small-scale industrial and other enterprises, in particular in developing countries, to financial services, including affordable credit, and their integration into value chains and markets.
Suggestions for Modifications and Replacement Indicators Suggestions for Additional Indicators Additional Comments Tier
9.3.1 UNIDO Tier I/II
Suggested Indicators as of August 11
Possible Compiling Entity
Manufacturing Value Added ( share in GDP, per capita, % growth)
Germany suggests Manufacturing Value Added (share in GDP)United Kingdom suggests to have sectoral breakdownUnited States suggests to expand the indicator to cover the rest of industry (mining and utilities)Australia: Suggested alternative: labour productivity.
United Kingdom suggests to add employment in each sector Argentina notes that GDP-related information is published in national currencyAustralia: Concerns that both indicators focus on growth of manufacturing, whereas some countries are pursuing services-led growth, rather than manufacturing-led growth. Colombia notes that the suggested indicators do not cover inclusivity and sustainabilityGermany, Sudan, Turkey, and United Kingdom support this indictor.Germany notes that this indicator does not reflect the social and environmental dimensions of sustainable industrialization (although the latter is covered by target 9.4)United States notes the indicator does not cover a sustainability dimension, and asks to clarify meaning of "sustainable industrialization"Eurostat notes that the suggested indicator does not cover sustainabilityWorld Bank (on behalf of International Finance Corporation) questions why measuring employment only in "public utilities" rather than utilities in general
Manufacturing employment, in percent to total employment
United States suggests to expand the indicator to cover the rest of industry (mining and utilities)
Australia notes that this indicator may be less relevant for Australia, and could identify complementary national indicators as necessaryGermany, Sudan, Turkey, and United Kingdom support this indictor.Germany notes that this indicator does not reflect the social and environmental dimensions of sustainable industrialization (although the latter is covered by target 9.4)United States notes that composition of employment can be interpreted in a number of waysEurostat notes that the suggested indicator does not cover sustainability
Suggested Indicators as of August 11
Possible Compiling Entity
Percentage share of (M) small scale industries' value added in total industry value added
United States suggest to apply the size categories used in the WB Enterprise Surveys, based on number of employees: micro (1-4), small (5-9), medium (20-99)Australia suggests this alternative, "the interest rate faced by small businesses compared to other businesses. "
Canada suggest to add "percentage of women-led enterprises that have access to financing"Canada and UN Statistical System organizations suggest to add "percentage of SME with a loan or line of credit"
Australia notes that this indicator may be less relevant for Australia, and could identify complementary national indicators as necessary. Indicator does not directly measure access to financial services. Canada notes that access to credit is not covered by the indicatorChina notes that definition, coverage, or calculation method of this indicator are not clearly definedColombia and United States note that the suggested indicator does not necessarily measure access to financial servicesEstonia noted that the suggested indicator does not cover economic sustainability, as it is not necessarily good to have more jobs in manufacturingGermany ask to clarify whether the indicator refers to small-scale industries or enterprises, and warns against duplication with indicator 8.3Sudan and United Kingdom support this indicator

Summary of Comments - p. 57 of 265
Suggestions for Modifications and Replacement Indicators Suggestions for Additional Indicators Additional Comments Tier
9.4.1 UNIDO Tier I
Suggestions for Modifications and Replacement Indicators Suggestions for Additional Indicators Additional Comments Tier
9.5.1 UNESCO-UIS Tier I
Target 9.4 By 2030, upgrade infrastructure and retrofit industries to make them sustainable, with increased resource-use efficiency and greater adoption of clean and environmentally sound technologies and industrial processes, with all countries taking action in accordance with their respective capabilities.
Suggested Indicators as of August 11
Possible Compiling Entity
Carbon emission per unit of value added
Canada suggest to include estimates of imbedded carbon emissions of all material inputsUNIDO indicates that the indicator should read "CO2" instead of "carbon".Australia: Suggest alternative: (simpler) electricity use, by source, and by industry.
Denmark suggests developing an indicator covering the "uptake of clean and environmentally sound technologies", and evaluate a possible indicator on "investments in green technologies at national level" and/or "amount of public infrastructure retrofitted"Germany suggests reverting to "domestic material consumption (DMC) per capita", which is also used to meet target 12.2, and "greenhouse gas (GHG) emission per unit of value added"Portugal suggests to add "Greenhouse gas emissions in the sector of industrial processes"Switzerland proposes an additional indicator, "Carbon footprint."Eurostat suggests to capture all GHG emmissions, not just carbon, and to consider "companies engages in eco-industry activities", "employment in eco-industries", and/or "water productivity".Eurostat suggests that "intensity of material use per unit of value added (international dollars)" would be more comprehensive.
Canada notes that low carbon emissions alone do not guarantee low environmental impactChina notes that definition, coverage, or calculation method of this indicator are not clearly definedDenmark notes that adoption of clean and environmentally sound technologies is missing in the proposed indicator, and that increased resource-use efficiency covers more than just carbon emissions (e.g., use of natural resources).Estonia supports this indicatorSwitzerland comments that it should be specified that i) both direct and indirect emissions should be taken into account (footprint perspective) ii) not only CO2 but also other greenhouse gases should be taken into account. France and Germany ask to clarify whether the indicator takes into account CO2 emissions only or emissions in CO2 equivalent. Germany notes that the indicator considers only one part of the targetItaly notes that the indicator has only partial relevance with respect to "resoure-use efficiency"United States warns that data collection would be very difficult, and movements in this indicator do not have clear interpretationSudan and Turkey support this indicatorUNIDO indicates that the indicator refers to CO2 only, noting the data availability and high share of emission caused by industrial production CO2 (around 80%)UNCEEA notes that the indicator could be defined in alignment with SEEA definitions
Target 9.5 Enhance scientific research, upgrade the technological capabilities of industrial sectors in all countries, in particular developing countries, including, by 2030, encouraging innovation and substantially increasing the number of research and development workers per 1 million people and public and private research and development spending.
Suggested Indicators as of August 11
Possible Compiling Entity
R&D expenditure as percentage of GDP
Australia suggests the addition of absolute measures as well as proportional change measures (Alternative: students in STEM subjects)
African members of the IAEG-SDGs suggest "employment in R&D sector" UNCTAD suggests adding "change in percentage of enterprises reporting having introduced product, process, marketing or organizational innovation, disaggregated by size of enterprise"UN Statistical System organizations suggest to add "percentage of enterprises reporting having introduced product, process, marketing or organizational innovation"
Australia does not support this indicator, as it measures inputs rather than outcomes; Suggested indicator does not provide information on capabilities.Estonia, Portugal, Sudan, and Turkey support this indicatorItaly notes that the indicator has only partial relevance with all aspects of this targetUnited States notes that enhancement of expenditure is an input, and does not say much about enhancement of capability and increase in number of workers. Eurostat notes that the classification of industries would need to be discussed.UNCTAD warns against focusing on inputs to R&D instead of knowledge or innovation outputs. World Bank (on behalf of International Finance Corporation) questions focusing on an indicator in R&D rather than on an indicator on innovation.

Summary of Comments - p. 58 of 265
Suggestions for Modifications and Replacement Indicators Suggestions for Additional Indicators Additional Comments Tier
9.a.1 Tier II
Target 9.b Support domestic technology development, research and innovation in developing countries, including by ensuring a conducive policy environment for, inter alia, industrial diversification and value addition to commodities.
Suggestions for Modifications and Replacement Indicators Suggestions for Additional Indicators Additional Comments Tier
9.b.1 UNIDO Tier I
Target 9.a Facilitate sustainable and resilient infrastructure development in developing countries through enhanced financial, technological and technical support to African countries, least developed countries, landlocked developing countries and small island developing States.
Suggested Indicators as of August 11
Possible Compiling Entity
Amount of investments in infrastructure as a % of GDP
Colombia suggests to include international support, and not just financial but also technological and technical supportGermany suggests "proportion of investment agreements with explicit human rights safeguards"IMF suggests including supportive measures such as "existence of independent regulators".
Australia noted that this indicator is of limited utility without building in some measure of quality; Proposal does not measure the quality of the infrastructure. China warns that there are no relevant surveys or data sources in ChinaEstonia noted that investments do not necessarily mean better infrastructureGermany asks to define infrastructure and to explain whether private or military expenditure on infrastructure are included, for the sake of comparabilitySwitzerland comments that the source is countries (FSO).Italy asks to define infrastructure, and notes that the possible source is NSI data based on National Accounts rather than "central bank data"Japan asks to clarify "amount of investments in infrastructure"Sudan and Turkey support this indicatorUnited States warns that data collection would be very difficult, questions whether this indicator has anything to do with sustainabilityIMF comments that this indicator does not address Target 9.a., which calls for increased support to LDCs in infrastructure development, as it leaves out technological and technical means of support.
Suggested Indicators as of August 11
Possible Compiling Entity
Percentage share of medium and high-tech (MHT) industry value added in total value added
United States recommends rewriting the indicator to include ICT, manufacturing, auto, energy, medical, and other advanced technologiesUNIDO indicates that the indicator should read "medium-high and high technology (MHT) industry"
United States suggest to look into an index that tracks "IPR and property rights", and to include "coefficient of industrial diversification"African members of the IAEG-SDGs suggest to add an indicator on patents, to capture innovation.UNCTAD suggests adding "change in exports of medium- and high-skills and technology intensive manufactures"
Australia: Proposed indicator does not capture concepts of a friendly business environment or direct support to businesses. Brazil supports the indicator, but notes that the indicator may not be adequate for international comparisons, as the definition of technological intensity varies from country to country.Canada asks to claify the target, and warns that the proposed indicator is a very indirect measure of intensity in technical knowledge capitalChina notes that definition, coverage, or calculation method of this indicator are not clearly defined; in particular, "MHT industries" needs to be clarifiedColombia notes that the suggested indicator does not reflect the target as a means of implementationGermany asks to define medium and high-tech industryItaly notes that this indicator is not useful for measuring industrial diversification and value addition to commoditiesTurkey notes that value added of medium tech and high tech industry should be measured separatelyUnited Kingdom supports this indicatorUnited States asks what are support mechanisms for technology, and how this applies to sustinability.UNIDO notes that MHT category combines High and medium-high levels of technological intensity based on R&D expenditure per unit of value added, and that this combined category captures technological shift from medium-low and low-tech (MLT) to MHT.

Summary of Comments - p. 59 of 265
Target 9.c Significantly increase access to information and communications technology and strive to provide universal and affordable access to the Internet in least developed countries by 2020.Suggestions for Modifications and Replacement Indicators Suggestions for Additional Indicators Additional Comments Tier
9.c.1 ITU Tier I
Suggested Indicators as of August 11
Possible Compiling Entity
Percentage of the population covered by a mobile network, by technology
Ecuador suggest to add "percentage of population with mobile phone service, access to internet and owning a computer"Malaysia suggests "number of community WiFi installed" and "number of active users at community WiFi"Turkey suggests "ratio of internet usage"African members of the IAEG-SDGs suggest to add an indicator on Internet.United States and UN Statistical System organizations suggest to add "broadband internet prices"
Australia: Suggested indicator (mobile network coverage) does not address the affordability aspect of the target. It also will not cover access to broadband. Cabo Verde asks whether the suggested indicator requires georeferencing the coverage of the different operators and to estimate population on the uncovered areaChina notes differences with respect to national definition, coverage, or calculation method of this indicatorEstonia and Japan support this indicatorMalaysia is of the view that the indicator may not be appropriate as it relates to the quality of service rather than to measuring the provision of universal and affordable access to the Internet in LDCsTurkey supports this indicatorUnited States notes that there is a large proportion of people covered through access that cannot afford services

Summary of Comments - p. 60 of 265
Goal 10 Reduce inequality within and among countries Target 10.1 By 2030, progressively achieve and sustain income growth of the bottom 40 per cent of the population at a rate higher than the national average.
Suggestions for Modifications and Replacement Indicators Suggestions for Additional Indicators Additional CommentsTier
10.1.1 World Bank Tier I
Target 10.2 By 2030, empower and promote the social, economic and political inclusion of all, irrespective of age, sex, disability, race, ethnicity, origin, religion or economic or other status.Suggestions for Modifications and Replacement Indicators Suggestions for Additional Indicators Additional Comments Tier
10.2.1 UNDESA. OECD. Tier I
Suggested Indicators as of August 11
Possible Compiling Entity
Growth rates of household expenditure or income per capita among the bottom 40 percent of the population and the total population
Ecuador suggests the calculation for the relation of mean income per capital as riches 10%/poorest 40%.Italy: The indicator should be referred to equivalent expenditure/income. UN Statistical System Organisations (UNSSO) proposes slightly modified suggested indicator as priority indicator: "Growth rates of household expenditure or income per capita among the bottom 40 percent of the population and the total population (to be disaggregated by single mother households and other relevant characteristics)"
Colombia suggests to use the Palma ratio.African IAEG-SDG members: Gini Coefficient.UN Statistical System Organisations: Growth rates of real household net-adjusted disposable income among the bottom 40 percent of the population and the total populationOHCHR proposes these indicators: "Income inequality pre- and post-social transfers/tax at national, regional and global levels"; "Growth rates of real household disposable income by income quintile"; "Proportion of people living below 60% of median income"; "Average tax rate by income quintile"
Germany: Preference for more traditional observation of income distribution.United States: This is a good, well-specified indicator focused on change over time.Turkey: RelevantPhilippines: Support this indicator. Feasible, and methodology and data available.Portugal: Agree with the suggested indicator.Canada: This indicator provides a full and adequate measure of the targetSwitzerland comments that the definition needs to be clarified.The UK: Support this indicator.African IAEG-SDG members: Partially AgreedIMF agrees that the suggested indicator is more direct than indicator 10.1.1 and stated that interpreting and communicating Gini coefficient, as well as collecting regional data for indicator 10.1.1 could be challenging.UN-Women states that the indicator suggested should be disaggregated to look at the growth rate of the income of single mother households.
Suggested Indicators as of August 11
Possible Compiling Entity
Proportion of people living below 50% of median income disaggregated by age and sex
Australia suggests an indicator of multidimensional poverty (noting links to the suggested indicator for Target 1.2).Brazil proposes "Gender wage gap ratio (and other disaggregations)" as priority indicator.Korea: Relative poverty line is defined as below 50% of average income in Korea (same as 1.2.2)Switzerland proposes an alternative indicator, "Material privation."The United States comments that the proposed indicator did not offer a good conceptual fit with the language of target 10.2 and suggested instead measuring economic inclusion on the basis of the ratio of employment to working age population; and political inclusion based on the share of the population voting in free elections.African IAEG-SDG members: Agreed but suggested to add disaggregation by disabilityIMF proposes to include other dimensions mentioned by the target.UN Statistical System Organisations proposes this indicator as a priority indicator: "Inequality gap (ratio of disadvantaged/advantaged groups) and/or the rate of change in this gap or ratio, disaggregated by grounds of discrimination prohibited by international human rights law"UNECE proposes this indicator: "Proportion of countries with legislation in place to progressively reduce inequalities over time in the fields of age, sex, disability, race, ethnicity, origin, religion or economic or other status."
Canada: Additional indicators: a) Represtation of various groups noted in target in the core public administration b) Labour force participation rates by groups noted in targetThe UK recommended indicators for % of seats held by People with Disabilities in national parliament and public institutions, and the existence of policies and legislative frameworks to deal with non discrimination.‐UN Statistical System Organisations proposes a slightly modified suggested indicator "Proportion of people living below 60% of median income disaggregated by age and sex" as an additional indicator.DSPD/DESA suggests these indicators:"Percentage of seats held by persons with disabilities in national parliament"(also proposed by the UK); "Percentage of positions in public institutions (national and local legislatures, public service, and judiciary) held by persons with disabilities"; "Percentage of government websites which meet the ISO/IEC 40500:2012 of accessibility for Web content"; "Percentage of population owning a mobile phone, disaggregated for persons with/without disabilities"; "Percentage of population with disabilities with internet access, disaggregated for persons with/without disabilities"OHCHR proposes these indicators:"Income inequality pre- and post-social transfers/tax at national, regional and global levels"; "Growth rates of real household disposable income by income quintile"; "Inequality gaps under other SDGs"; "Proportion of people living below 60% of median income"; "Proportion of people who feel safe walking alone around the area where they live"; "Proportion of population satisfied with their last experience of public services"; "Turnout as a proportion of the voting-age population"; "Proportion of public service positions held by women and members of target groups"; and other indicators that can be seen in their submission.
China: The definition, coverage or calculation method of the indicator differ from the ones used in ChinaColombia: This indicator does not cover the political inclusion aspect of the target, and some disaggregation would not be feasible (diability, race, ethinicity, religion)Turkey: RelevantSwitzerland comments that the indicator is a good estimation of inequality inside a country, but difficult to interpret in terms of inequality between countriesAustralia expresses concerns that the indicator was too narrow to reflect the issues of ‘social, economic and political inclusion of all’. Philippines: Feasible, but need to discuss and/or consider other idicatorsCanada: this indicator does not address social and political inclusionItaly agrees with this indicator and suggested to include it in goal 1 on poverty measurement Brazil: it would be more objective to calculate income inequalities among specific groups, as sex, color, age groups, etc.The UK supports this indicator.IMF states that the suggested indicator is straightforward and relatively easy to estimate using household expenditure survey. IMF does not think that indicator proposed by UNCDF directly measures the target.

Summary of Comments - p. 61 of 265
Target 10.3 Ensure equal opportunity and reduce inequalities of outcome, including by eliminating discriminatory laws, policies and practices and promoting appropriate legislation, policies and action in this regard.
Suggestions for Modifications and Replacement Indicators Suggestions for Additional Indicators Additional Comments Tier
10.3.1 Tier II
Target 10.4 Adopt policies, especially fiscal, wage and social protection policies, and progressively achieve greater equality.Suggestions for Modifications and Replacement Indicators Suggestions for Additional Indicators Additional Comments Tier
10.4.1 IMF, ILO Tier I
Suggested Indicators as of August 11
Possible Compiling Entity
Percentage of population reporting having personally felt discriminated against or harassed within the last 12 months on the basis of a ground of discrimination prohibited under international human rights law
Brazil proposes this replacement indicator: "Annual budget targeted at anti-discrimination policies, effectively executed, disaggregated by relevant groups"Singapore proposed to modify the suggested indicator as follows: “Percentage of population reporting having personally felt discriminated against or harassed within the last 12 months on the basis of a ground and form of discrimination prohibited under applicable international human rights law”UN Statistical System Organisations proposed to prioritise a new indicator: Gini coefficients on real disposable incomes (before and after taxes and social transfers).UNECE proposed this indicator: "Proportion of countries with legislation in place to against discrimination with regard to environmental rights on the grounds of citizenship, nationality or domicile."
Ecuador proposed a regional Gini coefficient to monitor inequalities among countries.UN Statistical System Organisations proposed to retain the suggested indicator "Percentage of population reporting having personally felt discriminated against or harassed within the last 12 months on the basis of a ground of discrimination prohibited by international human rights law" and suggested additional indicator "Level of compliance with international standards of independent body responsible for promoting and protecting nondiscrimination" as additional indicators.UNFPA proposed this indicator: "Proportion of reported cases investigaged and adjudicated by the judiciary, national human rights institutions or other mechanisms"OHCHR proposed these indicators:"Income inequality pre- and post-social transfers/tax at national, regional and global levels"; "Growth rates of real household disposable income by income quintile"; "Inequality gaps under other SDGs"; "Violent crime rate (intentional homicide, assault and sexual violence, including attempts) per 100,000 population"; "Percentage of the population subjected to physical, psychological or sexual violence within the last 12 months"; "Percentage of population reporting having personally felt discriminated against or harassed within the last 12 months on the basis of a ground of discrimination prohibited under international human rights law";"Existence of independent National Human Rights Institution in compliance with the Paris Principles"
China: There is no relevant surveys or data sources in ChinaEcuador requested a definition for discrimination.Germany recommended to retain this indicator.The United States raised the data availability and data quality issue for this indicator.Japan: The definition of “a ground of discrimination prohibited under international human rights law” is not clear.Switzerland comments that this is a "weak" indicator and difficult to ensure comparable results.Canada: This indicator provides a full and adequate measure of the targetBrazil stated that this indicator was not appropriate for this target, and proposed it instead for target 16.b.The UK supported this indicator.Sudan agreed with the indicator.African IAEG-SDG members: AgreedEurostat on indicator 10.3.1: Should take into account slavery and also disaggregate data for different groups that can be victims of discrimination: indigenous people and ethnic groups, people with disabilities, LGBT etc.
EU Fundamental Rights Agency
Suggested Indicators as of August 11
Possible Compiling Entity
Labour share of GDP, comprising wages and social protection transfers.
The United States believes that a composite index of the World Bank's Atlas of Social Protection would be a better indicator.Switzerland comments that the indicator should be disaggregated by gender.Australia: Prefer the use of GNI Coefficient suggested by the World Bank.UN Statistical System Organisations proposes to add second priority indicator: "Ratio of average income of the richest 10% to the poorest 40% (Palma ratio, before and after taxes/social transfers)"
Ecuador recommends these indicators:i) Percentage of the participation of direct taxes in total recollection and ii) Income tax concentration (10% with highest income/10% with lowest income)IMF suggests to use indicators that measure coverage, benefit adequacy, and benefit incidence of both cash and in-kind benefits.UN Statistical System Organisations proposes to add an additional indicator: Average tax rate by income quintile which is already collected by OECDUNFPA proposes: "Percentage of population covered by and accessing social protection schemes, that include basic education and health packages"; "Existence of policies that promote equal pay for equal jobs irrespective of sex, age, origin and other characteristics of relevance for each country"; "Existence of laws and policies that recognize and address unpaid care work"; "promote parental leave including paternity leave"DSPD/DESA suggests this indicator: "Percentage of persons with disabilities covered by social protection; or Percentage of persons with disabilities receiving benefits"OHCHR proposes these indicators:"Growth rates of real household disposable income by income quintile"; "Proportion of people living below 60% of median income"; "Average tax rate by income quintile";
African IAEG-SDG members: Partially Agreed, and suggested to include share of people covered by minimum social protection floorChina: The definition, coverage or calculation method of the indicator differ from the ones used in ChinaColombia believes that this target did not sufficiently cover the target, and suggested to include some information about fiscal policies and its impact on equality should be added.The United States views that there is not a strong connection between the labor share of GDP and income inequality and the proposed indicator only applies to wage-earners, and thus excluding the self-employed, who comprise a large majority of workers in poor countries.Turkey: RelevantAustralia: Does not support inclusion of this indicator.Italy: Not relevant since there is no direct connection between level of labor share and greater equality.IMF believes that the suggested indicator does not directly measure the progress.UN Statistical System Organisations proposed to retain the suggested indicator "Labour share of GDP, comprising wages and social protection transfers" as priority indicator.

Summary of Comments - p. 62 of 265
Target 10.5 Improve the regulation and monitoring of global financial markets and institutions and strengthen the implementation of such regulations Suggestions for Modifications and Replacement Indicators Suggestions for Additional Indicators Additional Comments Tier
10.5.1 Tier III
Target 10.6 Ensure enhanced representation and voice for developing countries in decision-making in global international economic and financial institutions in order to deliver more effective, credible, accountable and legitimate institutions.
Suggestions for Modifications and Replacement Indicators Suggestions for Additional Indicators Additional Comments Tier
10.6.1 Tier I
Suggested Indicators as of August 11
Possible Compiling Entity
Adoption of a financial transaction tax (Tobin tax) at a world level
Germany suggests an alternative indicator covering financial stability, efficiency and depth.France: This indicator should be changed into: "Number of countries which adopted a Tobin taxes"The United States proposes the Financial Stability Assessments under the IMF's Financial Stability Assessment Program (FSAP) as an indicator, and also was willing to consider the World Bank's suggested indicator: an average of the financial sector stability and efficiency & depth sub-indicators from the World Bank's Country Policy and Institutional Assessment (CPIA).
UNFPA proposed:- Labor share income or wage share in GDP (UNCTAD)- Distribution of income by quintiles, age, sex- Distribution of wealth by quintiles, age sexOHCHR also proposed: "Global average total cost of sending $200 (or equivalent in local sending currency, adjusted for inflation) with the three cheapest remittance services available in each market and accessible to the large majority of senders and recipients"
China: There are no relevant surveys or data sources in ChinaPoland requests clarification for the wording "Adoption" (whether it means "including the Tobin tax to the legal system or political support for this tax".Argentina: The target is not related to INDEC's tasks.Ecuador: A methodology for calculating Tobin tax is needed.Colombia: Not adequate. An indicator about financial stability should be considered.Denmark: does not support the indicatorGermany: this indicator is not an indicator but a political measure, and do not reflect improvement of monitoring global financial markets.Japan: This indicator is not feasible.Australia: Concurs with the World Bank's comments that a financial transcation tax is not relevant indicator, and the chosen indicator should cover "financial stability, efficiency and depth"Cape Verde: Not relevant for SDG framework.Philippines: Not relevant, do not support this indicator. Canada: This indicator does not really measure “Improve the regulation and monitoring of global financial markets and institutions and strengthen the implementation of such regulations.” Italy agrees to maintain this indicator, but proposed to change it to “whether or not the country adopted Tobin tax”Brazil: Not available at global level.The UK finds this indicator to be problematic.IMF: this indicator bears little relationship to the target "regulation and monitoring of global financial markets..."OHCHR agrees with the indicator.
Suggested Indicators as of August 11
Possible Compiling Entity
Percentage of members or voting rights of developing countries in international organizations.
OHCHR proposed "Percentage of voting rights in international organisations of developing countries"
Colombia states that indicator is not adquate, and suggested defining this indicator in relative terms according to the national GDP as percentage of global GDP, and including developed countries.The United States believes that the indicator should focus on transparent and merit-based hiring and promotion systems within the IFIs.Australia: Could be use as partial indicator for the target.Cape Verde: Indicator is extremely relevant, but need more information on method of measurement.African IAEG-SDG members: Partially Agreed.UN Statistical System Organisations proposes to retain the suggested priority indicator.Eurostat on indicator 10.6.1: The same as indicators for target 16.8.
United Nations/DESA.

Summary of Comments - p. 63 of 265
Target 10.7 Facilitate orderly, safe, regular and responsible migration and mobility of people, including through the implementation of planned and well-managed migration policies.Suggestions for Modifications and Replacement Indicators Suggestions for Additional Indicators Additional Comments Tier
10.7.1 Tier III
10.7.2 Tier III
Suggested Indicators as of August 11
Possible Compiling Entity
Recruitment cost born by employee as percentage of yearly income earned in country of destination.
The UK suggested recruitment cost born by employee as percentage of yearly income earned in country of destination as an indicator. UNFPA proposed: "Proportion of undocumented migrants who have managed to regularize their migration status, by sex, age, origin, health status and other characteristics of relevance for each country"
African IAEG-SDG members: Agreed. China: The definition, coverage or calculation method of the indicator differ from the ones used in China Ecuador requests definition and method of calculation.Colombia: Suggested indicator is not adequate and not feasible. Suggested including an indicator on restrictive migration actions.Germany supported the indicator, but stressed the data availability issue.Switzerland comments that the indicator is highly relevant and that they are working on a project to create a global data set.The United States: The Global Migration Group is a group of UN agencies organized to focus on and improve policies on international migration. Australia: Might not be as applicable to Australia as it is to other countries.Canada: This indicator provides a full and adequate measure of the targetItaly proposed to remove this indicator.The UK: Not clear that it measures target 10.7Sudan agreed with the indicator.Population Division agreed with the indicator.Eurostat: There is a mismatch between the very narrow focus of the indicator and the broad scope of the target.IOM proposed the suggested indicator.
National Statistical offices, Ministries of Labour. GMG
International Migration Policy Index
Germany and OHCHR perfers to replace the indicator by: "Number of migrants killed, injured or victims of crime while attempting to cross maritime, land and air borders".
Population Division: Indicators for dimensions of the International Migration Policy Index.a. Human rights dimension: "Ratification of relevant UN/ILO conventions"b. Crisis dimension:"Persons killed while crossing an international border (“migrant fatalities”)"c. Outcome dimension: "Naturalization rate"d. Mobility dimension: "Acceptance of dual citizenship"e. Cooperation dimension: "Number of bilateral/regional agreements ratified"OHCHR proposed an additional indicator: "number of migrants killed, injured or victims of crime while attempting to cross maritime, land or air borders
African IAEG-SDG members: Agreed. China: The definition, coverage or calculation method of the indicator is not clearly definedEcuador requests definition and method of calculation.Switzerland comments that a strong effort is needed to reach an instrument which would be globally applicable providing relevant data. Denmark: as a global index, it will not be suitable to evaluate (e.g. the African States are not covered by index)Germany stresses the data availability issue for this indicator.The United States: As of June 2015, no actual International Migration Policy Index existed. The adequacy of any index constructed needs to be judged on its merits once it's been developed. Singapore: Unable to find any information regarding the International Migration Policy Index. Also seek clarifications on obligations required of Singapore and the definition of ‘nondetected victims of trafficking’ and ‘per 100,000’.Japan: "International Migration Policy Index" is not clear. Please indicate its examples or detailed explanations.Mexico requests to establish the methodology, data sources and the dimensions of the indicator.The UK suggests Migration Policy Index as an indicator.Sudan agrees with the indicator.OHCHR stresses the need for appropriately defining the index.IOM agrees with the suggested indicator.
Global Migration Group

Summary of Comments - p. 64 of 265
10.7.3 UNODC Tier IINumber of detected and non-detected victims of human trafficking per 100,000; by sex, age and form of exploitation
African IAEG-SDG members proposes this indicator: "% of migrants who lose their lives, injured or are vicitims of crime while attempting to cross borders as a percentage of total migrants, disagreggated by age, sex and region".Australia suggests rephrasing: “Number of identified suspected victims of human trafficking, slavery and slavery-like practices per 100,000; by sex (or gender), age and form of exploitation”Cabo Verde suggests an alternative indicator: “"% of migrants who lose their lives, while attempting to cross borders as a percentage of total migrants, disagreggated by age, sex and region".Brazil proposes this indicator: "Number of victims of human trafficking identified by law enforcement officers per 100,000; by sex, age and form of exploitation"UN Statistical System Organisations proposes to add second priority indicator: Number of detected and non-detected smuggled migrants per 100,000.UN Statistical System Organisations also proposes to prioritise another indicator as third priority indicator: "Number of refugees, asylum seekers or migrants killed or injured while attempting to cross maritime, land or air borders"
Population Division: "Durable solutions for refugees" African IAEG-SDG members: Disagreed. Colombia and Switzerland: Not clear how to measure non-detective victims.China: There is no relevant surveys or data sources in ChinaThe United States: Getting reliable statistics on "non-detected victims of human trafficking" would seem to be fairly challenging. Otherwise okay.Cabe Verde: have reservation regarding the methodology to measure.Canada: How is "non-detected" measured?Italy proposes to remove the reference to “non-detected victims” as measuring non detected phenomena of criminal nature is highly uncertain and subject to overwhelming discretionality.Brazil: inadequate due to data availability issue.UN Statistical System Organisations proposes to retain the suggested priority indicator: Number of detected and non-detected victims of human trafficking per 100,000.Population Division suggests to remove this indicator from 10.7 since this is included as a suggested indicator under 16.2 and proposes to drop "number of non-detected victims" from measurement perspective.Eurostat: This target includes refugee issues, and suggest that direct policy measures and procedures should also be assessed: i.e. average time of processing of claims, time spent in detention, etc. Quantifying non-detected victims seems to be paradoxical.

Summary of Comments - p. 65 of 265
Target 10.a Implement the principle of special and differential treatment for developing countries, in particular least developed countries, in accordance with World Trade Organization agreements.Suggestions for Modifications and Replacement Indicators Suggestions for Additional Indicators Additional Comments Tier
10.a.1 UNCTAD Tier I
Suggestions for Modifications and Replacement Indicators Suggestions for Additional Indicators Additional Comments Tier
10.b.1 OECD Tier II
Suggested Indicators as of August 11
Possible Compiling Entity
Share of tariff lines applied to imports from LDCs/developing countries with zero-tariff
Germany suggests replacing the indicator by: "Number of countries with duty and quota free market access provisions in place"African IAEG-SDG members proposes this indicator: "Share of SDT commitments implemented in favour of LDCs as a percentage of all SDT commitments"ITC supports the suggested indicator, with some modifications, namely:- indicator should focus exclusively on non-reciprocal treatment- taking into account the amount of trade related to this tariff lines
WTO: "an inventory of the number of S&D provisions resulting from the Doha Round negotiations and the number of recommendations resulting from the Monitoring Mechanism on S&D that was adopted at the Bali Ministerial Conference."ITC proposes "Preferences utilization by developing and least developed countries on their export to developed countries" as an additional indicator (Data source: WTO/UNCTAD/ITC).OHCHR proposes "Proportion of international trade/investment agreements with explicit human rights safeguards"
African IAEG-SDG members: Disagreed. China: There is no relevant surveys or data sources in ChinaEcuador: this target is measured at global level because of its focus on developed countries, and not to be calculated at national levelsColombia: Indicator should be defined for both LDCs and Developing countries, and in relative terms compared to developed countries.Germany does not believe this indicator to be operational.The United States: Recommend dropping. This indicator is very close to the proposed indicator 17.12.1, in part because the targets are substantially duplicative.Switzerland comments that S&D treatment is not only limited to tariff preference and indicators measuring S&D Treatment efforts in WTO accessions, in services sector, in relation to intellectual property, and SPS requirements, etc. shold be considered.Japan: Cannot support this indicator.Cabo Verde: Need more information on this indicator.Philippines: Not applicable for the PhilippinesMexico: The number of zero-tariff lines does not necessarily indicate the degree of utilization.WTO agrees with the suggested indicator, but also likes to have it extended to South-South trade. Alternative indicator on degree of utilization of preferences duplicates the original one.
Target 10.b Encourage official development assistance and financial flows, including foreign direct investment, to States where the need is greatest, in particular least developed countries, African countries, small island developing States and landlocked developing countries, in accordance with their national plans and programmes.
Suggested Indicators as of August 11
Possible Compiling Entity
OECD ODA data, disaggregated by recipient and donor countries
African IAEG-SDG members proposes "% of committed ODA (0.7% of GNI) that is disbursed to LDCs, African countries, SIDS, and LLDCs" as priority indicator.
OHCHR proposes these indicators:"Proportion of international trade/investment agreements with explicit human rights safeguards";"Percentage of government revenues (including ODA and natural resource concessions) that are publicly available and reflected in national and sub-national budgets"
African IAEG-SDG members: Disagreed. China: The indicator is not applicable to ChinaEcuador: required more specificity on determining types of flows between donors and receptors of ODA's.The United States: ODA should not be the sole measure used. The target references multiple flows, including FDI (and presumably portfolio investment) but the indicator tracks only DAC data.Australia: Indicator is too narrow; exclusion of FDI omits a large part of the picture; indicator will also not measure whether ODA and other financial flows are being delieverd according to national plans and programsPhilippines: Not applicable for the Philippines
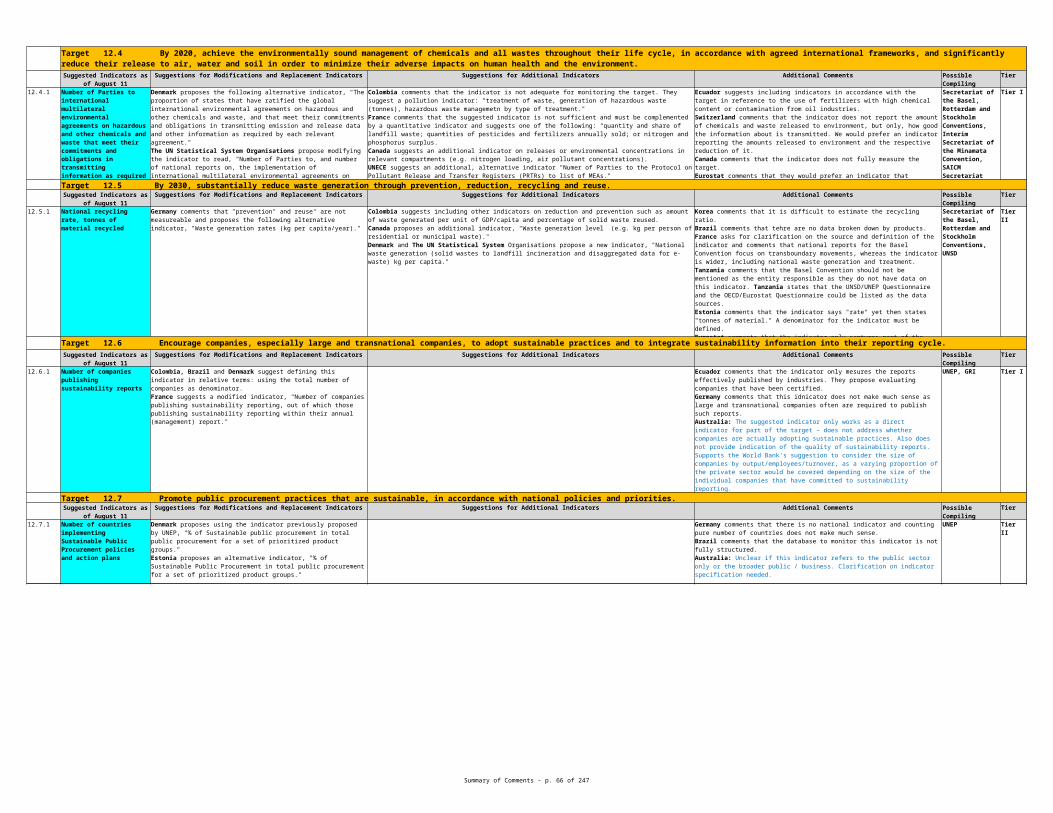
Summary of Comments - p. 66 of 265
Target 10.c By 2030, reduce to less than 3 per cent the transaction costs of migrant remittances and eliminate remittance corridors with costs higher than 5 per cent.Suggestions for Modifications and Replacement Indicators Suggestions for Additional Indicators Additional Comments Tier
10.c.1 World Bank Tier I
Suggested Indicators as of August 11
Possible Compiling Entity
Remittance costs as a percentage of the amount remitted
African IAEG-SDG members proposes "Percentage of remittances spent as transfer costs to be less that 3%"The United States supports the World Bank-suggested indicator of "Global average total cost of sending $200 (or equivalent in local sending currency, adjusted for inflation and expressed as % of amount sent)."
The United States was supportive of the World Bank's suggestion of including two collolary indicators: (1) Average total cost of sending $200 (or equivalent in local sending currency, adjusted for inflation) in each country corridor (expressed as % of amount sent) and (2) Global average total cost of sending $200 (or equivalent in local sending currency, adjusted for inflation) with the three cheapest services available in each market and accessible to the large majority of senders and recipients].UNFPA proposed: "Transaction cost of migrant remittance transfers by country of origin and destination"OHCHR proposed: "Global average total cost of sending $200 (or equivalent in local sending currency, adjusted for inflation) with the three cheapest remittance services available in each market and accessible to the large majority of senders and recipients"
China: The definition, coverage or calculation method of the indicator differ from ChinaKorea: Remittance fee charged by the original bank is decided by the bank, and thus it is unsuitable measure.Germany supported the suggested indicator.Philippines: Feasible with strong effort. We support this indicator.Canada: Some of the most inexpensive, and hardest to track, remittance methods are traditional and customary methodsAfrican IAEG-SDG members: Disagreed.
GENERAL COMMENTS:
Germany suggestetd the following indicators as headline indicators:- Gender pay gap- GDP per capita- Unemployment rate- Percentage of ODA in GNIInternational Finance Corporation proposed to use following indicators that measures private sector's participation in countries.- Doing Business- Private sector investment in infrastructure, such as investment in energy, transportation and telecommunications- Employment in private sector- Number of Women in Boards or percentage of firms with a majority of women on boards

Summary of Comments - p. 67 of 265
Goal 11 Make cities and human settlements inclusive, safe, resilient and sustainable Target 11.1 By 2030, ensure access for all to adequate, safe and affordable housing and basic services and upgrade slums.
Suggestions for Modifications and Replacement Indicators Suggestions for Additional Indicators Additional Comments Tier
11.1.1 UN-HABITAT Tier I
Suggestions for Modifications and Replacement Indicators Suggestions for Additional Indicators Additional Comments Tier
11.2.1 UN-HABITAT? Tier II
Suggested Indicators as of August 11
Possible Compiling Entity
Proportion of urban population living in slums
African Member States comment that "informal settlement" be added to the indicator.
Canada proposes considering additional indicators such as, "demand for subsidized housing (where applicable)", "number of households per dwelling" and "share of income dedicated to housing and utilities."United Kingdom proposes an additional indicator, "Percentage of population in urban areas with secure rights to land, measured by (i) percentage with documented or recognized evidence of tenure, and (ii) percentage who perceive their rights to land are recognized and protected."
Tanzania criticizes this indicator, claiming that most of the data required are not nationally available but rather modelled.France comments that the indicator only covers slums and should be more universal.Ecuador, Brazil and Turkey comment that a statistical definition of "slum" is fundamental.Canada comments that the indicator does not fully measure the target.United States comments that this indicator only captures a portion of the target and implies certain conditions about "slum housing" and "non-slum housing" that might not be completely accurate.Australia: Proposed indicator is not relevant for Australia. An indicator measuring the availability of housing of affordable (low income/wealth households) would be more relevant in an Australian context. UN-HABITAT responded to Tanzania stating that the indicator uses nationally produced data.
Target 11.2 By 2030, provide access to safe, affordable, accessible and sustainable transport systems for all, improving road safety, notably by expanding public transport, with special attention to the needs of those in vulnerable situations, women, children, persons with disabilities and older persons.
Suggested Indicators as of August 11
Possible Compiling Entity
Proportion of the population that has a public transit stop within 0.5 km
Poland proposes modifying the indicator to read: "Transport of passengers per one inhabitant."Brazil proposes an alternative indicator, "Average commute time to work or school."UNCDF proposes modifying the indicator to read, "Percentage of people within 0.5 KM of public transit running at least every 20 minutes.
Canada proposes additional indicators on transportation affordability and accessibility.The UN Statistical System Organisations propose an additional indicator, "Proportion of income spent by families on transport (to reach services such as employment, health, education, and community services."
Japan expressed doubt that data would be regularly available.Colombia states that the suggested indicator does not completely cover the target as it does not include a measure on "special attention to the needs of those in vulnerable situations."Cabo Verde comments that if the source of the data is a survey, it is preferrable to use time rather than distance as the metric.United States comments that this is only a partial indicator as it does not address whether the transportation is safe, affordable, accessible, sustainable nor whether there is improved road safety or if it has addressed the needs of those in vulnerable situations.Canada comments that the indicator does not fully measure the target.World Bank suggested an alternate indicator on "Share of jobs accessible within 60 minutes without private car."UNFPA suggested an indicator on "percentage of population within X travel time of vital service delivery points."DESA proposes 'percentage of public transport vehicles meeting the minimum national standards for accessibility by persons with disabilities'

Summary of Comments - p. 68 of 265
Target 11.3 By 2030, enhance inclusive and sustainable urbanization and capacity for participatory, integrated and sustainable human settlement planning and management in all countries.
Suggestions for Modifications and Replacement Indicators Suggestions for Additional Indicators Additional Comments Tier
11.3.1 Efficient land use UN-HABITAT Tier II
Target 11.4 Strengthen efforts to protect and safeguard the world's cultural and natural heritage.Suggestions for Modifications and Replacement Indicators Suggestions for Additional Indicators Additional Comments Tier
11.4.1 Tier II
Suggestions for Modifications and Replacement Indicators Suggestions for Additional Indicators Additional Comments Tier
Suggested Indicators as of August 11
Possible Compiling Entity
Brazil proposes an alternative indicator, "Percentage of cities with a direct participation of civil society in the urban planning and management, with a regular functioning structure and members who were democratically elected." For suggested indicator, disagrees with Tier II classification, and proposes it to be Tier III.Canada proposes an alternative indicator, "Land-cover change in and around urban areas."Switzerland supports a previous WB proposal as an alternative indicator, ""ratio of land consumption rate to population growth rate"France proposes an alternative indicator, "number of cities which implemented local urban planning schemes and/or urban mobility plans". African member states propose an alternative indicator, "Ratio of land consumption rate to population growth rate."UNFPA proposes modifying the indicator to read, "Percent of cities with more than 100,000 inhabitants that implement participatory urban and regional development plans integrating population projections and resource needs."
United Kingdom proposes an additional indicator, "km of high capacity (BRT, light rail, metro) public transport per person for cities with more than 500,000 inhabitants."Switzerland proposes an additional indicator, ""number of cities whose major urban infrastructure projects follow master plans"The UN Statistical System Organisations propose an additional indicator, "Percentage of cities with direct participation structure of civil society in urban planning and management, which operate regularly and democratically."UNECE proposes an additional indicator similar to the previous one, "Measure to what extent inhabitants of a city/local authority are enabled to access information and to actively participate in decision-making, through also e.g. number of Parties to the Convention on Access to Information, Public Participation in Decision-making and Access to Justice in Environmental Matters (Aarhus Convention)."UNCDF proposes a new indicator, "Resources per capita invested in human settlement per sq. km."UNFPA suugests an alternate indicator 'ratio of land consumption rate to urban population growth rate at comparable scale.'
Australia, Cuba, Canada, Ecuador, India, Tanzania, Turkey, United States and Germany comment that a definition of what is considered "efficient land use" is necessary. Australia recommends alignment with SEEA Land Account.Mexico comments that the indicator can be interpreted in many ways and therefore the results could quite diverse and non- comparable.Cabo Verde comments that they are unsure of the feasibility of this indicator as it is only currently available for 300 cities.UN-HABITAT comments that this indicator is connected to many other indicators of the SDGs and that it ensures that the SDGs integrate the wider dimensions of space, population and land adequately, providing the framework for the implementation of other goals such as poverty, health, education, energy, inequalities and climate change.UNCEEA: This indicator could be aligned with SEEA methodology.
Suggested Indicators as of August 11
Possible Compiling Entity
Share of national (or municipal) budget which is dedicated to preservation, protection and conservation of national cultural natural heritage including World Heritage sites
Brazil proposes an alternative indicator, "Relation between expenditures with preservation, protection and conservation of safeguarded cultural and natural heritage and the amount of protected goods."
The UN Statistical System Organisations propose an additional indicator, "Number and percentage of labour force that holds a heritage occupation or is employed in the heritage sector."
France states that the indicator needs to be defined more precisely and is not sure if the indicator is actually relevant to the target as some countries use more private money to safeguard cultural and natural heritage while others rely more on public funds.Mexico comments that it would be necessary to define what "cultural" means in this context.Italy agrees to maintain this indicator even though they suggest it would be better to split Natural capital and Cultural Heritage into two separate indicators.United States and Canada comment that this indicator is limited in its ability to measure the target.Australia: Indicator measures inputs. Would prefer an outcomes based indicator. Estonia comments that higher expenditure levels should not be the goal.UNCEEA: This indicator could be aligned with the SEEA:- Cultural and natural heritage are considered as ecosystem assets and hence efforts to protect and safeguard the world's cultural and natural heritage is considered as an environmental protection activities- EPEA in the SEEA Central Framework provide information on the output of environmental protection specific services produced across the economy and on the expenditure of resident units on all goods and services for environmental protection purposes. - The SEEA Central Framework provide a complete classification for environmental protection activities (Classification of Environmental Activities) comprises 16 basis classes and is presented in full in Annex I of the SEEA Central Framework. The classification allow the derivation of statistical information on environmental protection activities including the protection of biodiversity, landscape and cultural and natural heritage site.
UNESCO-UIS, UN-HABITAT
Target 11.5 By 2030, significantly reduce the number of deaths and the number of people affected and substantially decrease the direct economic losses relative to global gross domestic product caused by disasters, including water-related disasters, with a focus on protecting the poor and people in vulnerable situations.
Suggested Indicators as of August 11
Possible Compiling Entity

Summary of Comments - p. 69 of 265
11.5.1 UNISDR Tier IINumber of deaths, missing people, injured, relocated or evacuated due to disasters per 100,000 people.
Japan and Switzerland propose an alternate indicator, "'direct disaster economic loss in relation to global gross domestic product'.France proposes adding “economic losses relative to gross domestic product caused by disasters" as an additional indicator and disaggregating by social status.African member states request that "displaced" be added to the indicator.OCHA suggests using "displaced (including evacuated and relocated)" or "forced to leave their homes or places of habitual residence (including evacuated and relocated)" among the elements collectively comprising "affected."The UN Statistical System Organisations propose a modification that reads, "Number of deaths, missing and affected people due to hazardous events (per 100,000 people)."UNECE calls for 'number of deaths per year resulting from each disaster type', then disaggregating by six typesUNDESA: Number of people killed, injured, displaced, evacuated, relocated or otherwise affected by disasters, disaggregated by displacement status
Korea, Colombia and UNISDR propose including an additional indicator on economic losses due to disaster.The UN Statistical Systems Organisations propose an additional indicator, "Direct economic loss due to hazardous events in relation to global gross domestic product."UNCDF proposes a new indicator, "Proportion of housing units built on hazardous locations (per 100,000 housing units)." They state that the indicator has linkages with targets 1.5, 11.b and 11.1.
Korea comments that it is important to determine the scope of 'disaster' and also to different between natural disasters (that shold be approached as activites for reducing disaster) and social disaster (that should be approached from safety and management perspectives).United States and Canada comment that this indicator does not measure "economic loss."Cabo Verde comments that it is difficult to have an accurate measure of "injured."Denmark comments that merging "death" and "evacuation" numbers can be misleading and seems inappropriate. They suggest having an indicator with more focus on the impact on livelihoods.Turkey comments that the vulnerability factors that contribute to the occurrence of disasters should be taken into account and some indicators to measure this vulnerability should be constructed.Australia: Concerns regarding indicator specification. Current specification is a set of indirect output measures, which may introduce volatility into estimates, especially during extreme events. Potential for GIS to be used to develop a more direct indicator. Brasil and the UN Secretary-General's Advisory Board on water and sanitation (UNSGAB) support this indicator. Paraguay objects this indicator.Ecuador: The indicator of Target 11.5 is the same as the indicator of Target 1.5. The indicator of the target 11.5 is linked to targets 1.5 and 15.3. Also, the indicator proposed is the same indicator of the target 13.1European Commission: Specific ICD coded to be included need to be definedThe UN Mine Action Service suggests that landmines/ERW should be one of the causes that are disaggregated.UNISDR comments that the suggested indicator is important because it is multi-purpose and interlinked with several other targets.

Summary of Comments - p. 70 of 265
Target 11.6 By 2030, reduce the adverse per capita environmental impact of cities, including by paying special attention to air quality and municipal and other waste management.Suggestions for Modifications and Replacement Indicators Suggestions for Additional Indicators Additional Comments Tier
11.6.1 Tier III
11.6.2 Tier I
Target 11.7 By 2030, provide universal access to safe, inclusive and accessible, green and public spaces, in particular for women and children, older persons and persons with disabilities.Suggestions for Modifications and Replacement Indicators Suggestions for Additional Indicators Additional Comments Tier
Suggested Indicators as of August 11
Possible Compiling Entity
Percentage of urban solid waste regularly collected and well managed (disaggregated by type of waste)
Cabo Verde and African member states suggest removing "well managed" from the indicator.Canada proposes an alternative indicator, "Percent of waste recovered (recycling, compost etc.)."Brazil proposes a modified indicator, "Percentage of the urban solid waste regularly collected and adequate final discharge."
Turkey proposes an additional indicator on expenditure for waste management. Tanzania questions whether data on the indicator is readily available.Korea comments that it has a different standard for 'urban solid waste' and is thus unable to come up with this estimate. It comments that an estimate may be possible using Solid Waste Accounts in SEEA.Portugal agrees with the suggested indicator.France, Canada and United States ask for clarification on what “regularly collected and well managed” means. France also suggests an additional indicator: “quantity and share of landfill waste.” Tanzania asks for how many countries UN-Habitat and WHO have data and whether they are actual country data or estimates.Japan questions the feasibility of defining 'urban' as well as disaggregating by type of waste, proposing instead 'final disposal amount per capita',Turkey and Switzerland comment that the definition of "well managed" should be clarified.Estonia comments that the denominator of the indicator has not been defined.Switzerland suggests "recycling rate" could be used as the definition for "well-managed"UNCEEA: The indicator could be aligned with SEEA methodology: - Solid waste accounts in the SEEA Central Framework are useful in organizing information on the generation of solid waste and the management of flows of solid waste to recycling facilities, to controlled landfills or directly to the environment. Measures of the amount of waste in aggregate or of quantities of specific waste materials are important indicators of environmental pressures. The construction of solid waste accounts allows these indicators to be place in a broader context with economic data in both physical and monitoring terms. - The accounts highlight various activities of the waste collection, treatment and disposal industry that include landfill operation, incineration of solid waste, recycling and reuse activities and other treatment of solid waste
UN-HABITAT and WHO
Level of ambient particulate matter (PM 10 and PM 2.5)
France proposes as an alternative indicator, "quantity and share of landfill waste."Brazil proposes a modified indicator, "Level of ambient particulate matter in the environment (PM 10 and PM 2.5) for urban agglomerations with more than 100,000 residents."
Germany proposes an additional indicator, "Annual average NO2-equivalents in ug/m3 air in cities.Canada proposes several complementary/additional indicators, "Ambient level of other air pollutant (O3, VOCs, NO2, and SO2). Population exposure to PM2.5. "WHO proposes 'annual mean levels of fine particulate matter (i.e. PM2.5) air pollution in cities (population weighted)'
Germany comments that air quality is a multi-purpose indicator for the quality of life in a city. A disaggregation is not requested by the target and this not required within the indicator.United Kingdom supports this indicator but comments that it is not very clearly specified.Singapore comments that we should also take into account the contribution of transboundary sources to the level of ambient particulate matter if possible.Turkey comments that there should be a target value in the indicator.In other words the lower threshold value should be determined for particulate matter.Estonia comments that the indicator has the representativity problems. Quite often only the data for some single measurement points is available. The emission quantities could be considered as alternative.WB prefers an indicator on GHG emissions.
UNEP, UN-HABITAT
Suggested Indicators as of August 11
Possible Compiling Entity

Summary of Comments - p. 71 of 265
11.7.1 UN-HABITAT Tier IIIThe average share of the built-up areas of cities in open space in public ownership and use.
Cuba proposes a new indicator, "Area of urban green space per capita."Canada suggests modifying the indicator to include an accessibility element.Switzerland supports a previous World Bank proposal, ""proportion of population with 0.5 km access to (…)" as publically accessible green spaces are many times unevenly distributed geographically in developing countries.Brazil proposes a modified indicator, "Proportion of areas of public use and property over the total built-up urbanized area of the urban agglomerations with more than 100,000 residents."The UN Statistical System Organisations propose deleting "and use" from the indicator.Australia suggests indicator be re-specified towards steps taken by States in ensuring universal access to public spaces for all people, including laws and frameworks, rather than only physical access (focus of the current indicator). Support alignment with SEEA land accounts.
The UN Statistical System Organisations propose an additional indicator, "The average share of built up areas (of communities) that are accessible and safe for all, including women, children, older persons and those with disabilities."
Ecuador comments that the connected between target 11.7 and the rpoposed indicator is not apparent. They propose using the indicator "Green urban index."Mexico comments that it is necessary to redefine the proposed indicator since it is not clear to understand its objective nor the sources that would be used.Italy comments that it is necessary to have a definition of the indicator.Germany and United Kingdom comment that data availability might be very poor.United States comments that the indicator does not measure location and distribution of public space.Estonia comments that the definition of the indicator is not clear.UNCEEA: The indicator could be aligned with the SEEA methodlogy: - Land accounts in the SEEA Central Framework are useful in organization information on land use and land cover. In particular, the land use accounts provide the statistical methodology in organization information on land use ,which reflects both the activities undertaken and the institutional arrangements put in place, for a given area for the purposes of economic production, human activities or the main maintenance and restoration of environment function- The SEEA Central Framework provide a complete classification for land use comprises 46 basis classes and is presented in full in Annex I of the SEEA Central Framework. The classification allow the derivation of statistical information on land use of built up and related areas for recreational facilities.This indicator could be measured using satellite pictures.

Summary of Comments - p. 72 of 265
Target 11.a Support positive economic, social and environmental links between urban, peri-urban and rural areas by strengthening national and regional development planning Suggestions for Modifications and Replacement Indicators Suggestions for Additional Indicators Additional Comments Tier
11.a.1 Tier I
Suggestions for Modifications and Replacement Indicators Suggestions for Additional Indicators Additional Comments Tier
11.b.1 Tier I
Target 11.c Support least developed countries, including through financial and technical assistance, in building sustainable and resilient buildings utilizing local materials.Suggestions for Modifications and Replacement Indicators Suggestions for Additional Indicators Additional Comments Tier
11.c.1 Tier II
Suggested Indicators as of August 11
Possible Compiling Entity
Cities with more than 100,000 inhabitants that implement urban and regional development plans integrating population projections and resource needs
Brazil proposes a modified indicator, "Percentage of population living in cities with more than 100,000 residents which implement urban and regional development plans integrating estimates of population and of resources necessity."The UN Statistical System Organisations proposed a new priority indicator, "The number of countries that are developing or implementing a National Urban Policy that (a) responds to population dynamics, (b) ensures balanced territorial development, (c) prepares for infrastucture development, (d) promotes urban land-use efficiency, (e) enhances resilience to climate change, (f) protects public space, and (g) develops effective urban governance systems.The UN Statistical System Organisations suggest keeping the proposed indicator as a second priority indicator under this target.
Cabo Verde and African member states comment that just existence is insufficient and propose a complimentary indicator, " Share of land consumption rate to population growth rate at comparable scale."UNCDF propsoes a new indicator, "Local Fiscal Space, or % of sub-national governments revenues and expenditures on general government revenues and expenditures."UN-Women proposes 'proportion of women subjected to physical or sexual harassment, in the last 12 months (disaggregated by perpetrator and place of occurrence)’;DESA proposes 'percentage of public buildings meeting the ISO 21542:2011 standards on accessibility and usability of the built environment' and 'percentage of public green spaces (parks and recreational facilities) meeting the minimum national standards for accessibility by persons with disabilities'
China comments that explanatory notes need to be further clarified and Japan comments that the indicator is not clear.Mexico comments that if the indicator is not improved by including quality thresholds or criteria to evaluate the plan's design and implementation, progress could be overestimated.Germany comments that data availability might be very poor.Australia: Binary indicator-continued progress towards the target will not be possible. Indicator specification needs further clarification on ‘cities with development plans’. Concerns that this indicator will not be comparable across different population sizes. UNFPA proposes deletion of both indicators under this target and is working on a more concrete indicator proposal.WB prefers an indicator on density of street intersections
UNFPA, UN-HABITAT, DESA
Target 11.b By 2020, substantially increase the number of cities and human settlements adopting and implementing integrated policies and plans towards inclusion, resource efficiency, mitigation and adaptation to climate change, resilience to disasters, and develop and implement, in line with the Sendai Framework for Disaster Risk Reduction 2015-2030, holistic disaster risk management at all levels.
Suggested Indicators as of August 11
Possible Compiling Entity
Percentage of cities implementing risk reduction and resilience policies that include vulnerable and marginalized groups.
The Philippines proposes a modified indicator, " Percent of cities with more than 100,000 inhabitants that are implementing risk reduction and resilience strategies aligned with accepted international frameworks (such as the successor to the Hyogo Framework for Action on Disaster Risk Reduction) that include vulnerable and marginalized groups in their design, implementation and monitoring."Brazil proposes a modified indicator, "Percentage of the population living in cities which implement resilience and risk reduction policies including marginalized and vulnerable groups."Argentina: Percentage of cities implementing risk reduction and resilience policies that include vulnerable and marginalized groups. Argentina declared that there are no sources for the suggested indicator. The UN Statistical System Organisations propose the following modification to the suggested indicator, "Percent of cities with more than 100,000 inhabitants that are implementing risk reduction and resilience strategies aligned with accepted international frameworks (such as the successor to the Hyogo Framework for Action on Disaster Risk Reduction) that include vulnerable and marginalized groups in their design, implementation and monitoring."UNECE proposes the indicator , "Measure to what extent inhabitants of a city/local authority are enabled to access information and to actively participate in decision-making, through also e.g. number of Parties to the Convention on Access to Information, Public Participation in Decision-making and Access to Justice in Environmental Matters (Aarhus Convention)."
The Philippines proposes an additional indicator for the target, "Population density measured over continuous urban footprint."Mexico proposes an additional indicator, "percentage of zones of risk in the urban areas."Canada proposes the following set of indicators to measure the target, "Percentage of cities actively developing or implementing climate adaptation plans","Percentage of cities with risk reduction and resilience policies," and "Percentage of cities who specifically address vulnerable and marginalized groups in their policies and plans."The UN Statistical System Organisations propose an additional indicator, "Percentage of local governments that adopt and implement local DRR strategies in line with the Sendai Framework for Disaster Risk Reduction 2015-2030."UNECE proposes an additional indicator, "Number of national governments adopting strategies for resilience to disasters, including policies on safety and land-use planning/siting of hazardous activities."
China comments that explanatory notes need to be further clarified.Mexico comments that if the indicator is not improved by including quality thresholds or criteria to evaluate the plan's design and implementation, progress could be overestimated.Cabo Verde and African member states comment that this indicator should only be measured in cities with at least 100,000 inhabitants. Italy comments that a definition of the indicator is necessary.Estonia comments that the indicator is suitable, but only in cities with more than 100,000 inhabitants. For excample: in Estonia city with 2000 to 3000 people is already city, in China city starts propably from million.Australia: Note links to the Sendai Framework on Disaster Risk Reduction. Paraguay objects this indicator.
UN-Habitat, World Bank, ICLEI, UNISDR, Rockefeller Foundation, 100 Resilient Cities, Global Facility for Disaster Reduction and Reconstruction, Interamerican Development Bank, and C40 Climate Leadership Group
Suggested Indicators as of August 11
Possible Compiling Entity
Percentage of financial support that is allocated to the construction and retrofitting of sustainable, resilient and resource-efficient buildings
Cabo Verde and African member states suggest adding "utilizing local materials" to the indicator.Mexico proposes a modified indicator, "Percentage of financial support that is allocated to the construction and retrofitting of sustainable, resilient and resource-efficient buildings and areas suitable for human development."
The Philippines proposes an additional indicator, "Sub-national government revenues and expenditures as a percentage of general government revenues and expenditures, including for buildings; own revenue collection (source revenue) as a percentage of total city revenue."
India comments that the Indicator needs to be redrafted as the focus of the target is on support to LDCs.UNCEEA: The Indicator could be aligned with the SEEA methodology. Other Satellite Accounts (Households-CSV) can provide additional information to complete the indicator.
UN-HABITAT, World Bank
OTHER COMMENTS:
Germany proposes, "Proportion of urban population living in slums" as a headline indicator for the goal.

Summary of Comments - p. 73 of 265
Goal 12 Ensure sustainable consumption and production patterns
Suggestions for Modifications and Replacement Indicators Suggestions for Additional Indicators Additional Comments Tier
12.1.1 UNEP Tier II
Target 12.2 By 2030, achieve the sustainable management and efficient use of natural resources.Suggestions for Modifications and Replacement Indicators Suggestions for Additional Indicators Additional Comments Tier
12.2.1 UNEP/OECD Tier II
Target 12.3 By 2030, halve per capita global food waste at the retail and consumer levels and reduce food losses along production and supply chains, including post-harvest losses.Suggestions for Modifications and Replacement Indicators Suggestions for Additional Indicators Additional Comments Tier
12.3.1 FAO Tier II
Target 12.1 Implement the 10-year framework of programmes on sustainable consumption and production, all countries taking action, with developed countries taking the lead, taking into account the development and capabilities of developing countries.
Suggested Indicators as of August 11
Possible Compiling Entity
Number of countries with SCP National Actions Plans or SCP mainstreamed as a priority or target into national policies, poverty reduction strategies and sustainable development strategies
Colombia suggests that the indicator should monitor national progress on the implementation of these plans.Japan suggests modifying the indicator to read,"Number of countries with SCP National Actions Plans or SCP mainstreamed as a priority or target into national policies or strategies including poverty reduction strategies and sustainable development strategies"The UN Statistical System Organisations propose deleting "poverty reduction strategies and sustainable development strategies" from the indicator.
United Kingdom suggests an additional indicator, "household Incomes (and assets) of resource dependent ‐peoples."
Ecuador comments that the indicator is a global level indicator and not a national level one.Canada comments that the indicator does not fully address the target and suggests and indicator that links to the amount of waste produced in extraction and consumption activities implementation and success should be assessed.Estonia comments that the indicator is suitable.
Suggested Indicators as of August 11
Possible Compiling Entity
Material footprint (MF) and MF/capita
Germany proposes replacing this indicator with "DMCabiot per capita"France states that “material footprint” is not currently available and suggests the following indicator, “state of the fish stocks.”United Kingdom suggests an alternative indicator, "number of countries achieving Acihi targets."
Switzerland proposes additional indicators, "Carbon footprint (Greenhouse gases measured in CO2-eq) and CF/capita" that could also be used for target 9.4 and " FSC and PEFC-certified timber consumption as a % of total consumption by volume."
Korea comments that this indicator is good for a long-term indicator but a more short-term indicator is also necessary.Denmark comments that the indicator should be changed and should be used within the work of the Convention on Biodiversity.Brazil comments that the methodology used for this indicator is not fully mastered by NSOs.Portugal agrees with the proposed indicator.Turkey comments that the indicator needs clarification and assessment to whether domestic processed output should be included or not.Canada comments that it requires a definition of what "material footprint" is.Japan comments that this indicator is not appropriate.Estonia comments that the material footprint indicator needs further conceptual development.UNCEEA comments that this indicator could be aligned with SEEA.Eurostat comments that the indicator should also address water consumption and waste generation.
Suggested Indicators as of August 11
Possible Compiling Entity
Global Food Loss Index (GFLI)
Colombia suggests disaggregating the indicator into food waste at consumer and retail levels and along production and supply chains.Brazil comments that the indicator has poor database coverage.France asks if the GFLI has ever been used.Denmark, Japan and the United States comment that they do not know what the definition of the GFLI is. They ask for both a definition of "food loss" and "food waste". Denmark commentst hat the indicator should be replaced.Canada comments that the indicator is difficult to assess as it is not yet available.

Summary of Comments - p. 74 of 265
Suggestions for Modifications and Replacement Indicators Suggestions for Additional Indicators Additional Comments Tier
12.4.1 Tier I
Target 12.5 By 2030, substantially reduce waste generation through prevention, reduction, recycling and reuse.Suggestions for Modifications and Replacement Indicators Suggestions for Additional Indicators Additional Comments Tier
12.5.1 Tier II
Target 12.6 Encourage companies, especially large and transnational companies, to adopt sustainable practices and to integrate sustainability information into their reporting cycle.Suggestions for Modifications and Replacement Indicators Suggestions for Additional Indicators Additional Comments Tier
12.6.1 UNEP, GRI Tier I
Target 12.7 Promote public procurement practices that are sustainable, in accordance with national policies and priorities.Suggestions for Modifications and Replacement Indicators Suggestions for Additional Indicators Additional Comments Tier
12.7.1 UNEP Tier II
Target 12.4 By 2020, achieve the environmentally sound management of chemicals and all wastes throughout their life cycle, in accordance with agreed international frameworks, and significantly reduce their release to air, water and soil in order to minimize their adverse impacts on human health and the environment.
Suggested Indicators as of August 11
Possible Compiling Entity
Number of Parties to international multilateral environmental agreements on hazardous and other chemicals and waste that meet their commitments and obligations in transmitting information as required by each relevant agreement
Denmark proposes the following alternative indicator, "The proportion of states that have ratified the global international environmental agreements on hazardous and other chemicals and waste, and that meet their commitments and obligations in transmitting emission and release data and other information as required by each relevant agreement."The UN Statistical System Organisations propose modifying the indicator to read, "Number of Parties to, and number of national reports on, the implementation of international multilateral environmental agreements on hazardous checmicals and waste."
Colombia comments that the indicator is not adequate for monitoring the target. They suggest a pollution indicator: "treatment of waste, generation of hazardous waste (tonnes), hazardous waste managemetn by type of treatment."France comments that the suggested indicator is not sufficient and must be complemented by a quantitative indicator and suggests one of the following: “quantity and share of landfill waste; quantities of pesticides and fertilizers annually sold; or nitrogen and phosphorus surplus.”Canada suggests an additional indicator on releases or environmental concentrations in relevant compartments (e.g. nitrogen loading, air pollutant concentrations).UNECE suggests an additional, alternative indicator "Numer of Parties to the Protocol on Pollutant Release and Transfer Registers (PRTRs) to list of MEAs."
Ecuador suggests including indicators in accordance with the target in reference to the use of fertilizers with high chemical content or contamination from oil industries.Switzerland comments that the indicator does not report the amount of chemicals and waste released to environment, but only, how good the information about is transmitted. We would prefer an indicator reporting the amounts released to environment and the respective reduction of it.Canada comments that the indicator does not fully measure the target.Eurostat comments that they would prefer an indicator that measures progress not the mere existence of the agreement.
Secretariat of the Basel, Rotterdam and Stockholm Conventions, Interim Secretariat of the Minamata Convention, SAICM Secretariat
Suggested Indicators as of August 11
Possible Compiling Entity
National recycling rate, tonnes of material recycled
Germany comments that "prevention" and reuse" are not measureable and proposes the following alternative indicator, "Waste generation rates (kg per capita/year)."
Colombia suggests including other indicators on reduction and prevention such as amount of waste generated per unit of GDP/capita and percentage of solid waste reused.Canada proposes an additional indicator, "Waste generation level (e.g. kg per person of residential or municipal waste)."Denmark and The UN Statistical System Organisations propose a new indicator, "National waste generation (solid wastes to landfill incineration and disaggregated data for e-waste) kg per capita."
Korea comments that it is difficult to estimate the recycling ratio.Brazil comments that tehre are no data broken down by products.France asks for clarification on the source and definition of the indicator and comments that national reports for the Basel Convention focus on transboundary movements, whereas the indicator is wider, including national waste generation and treatment.Tanzania comments that the Basel Convention should not be mentioned as the entity responsible as they do not have data on this indicator. Tanzania states that the UNSD/UNEP Questionnaire and the OECD/Eurostat Questionnaire could be listed as the data sources.Estonia comments that the indicator says "rate" yet then states "tonnes of material." A denominator for the indicator must be defined.Eurostat comments that the indicator only captures part of the target and that the indicator on waste generation should also be included here.UNCEEA comments that this indicator could be aligned with SEEA.
Secretariat of the Basel, Rotterdam and Stockholm Conventions, UNSD
Suggested Indicators as of August 11
Possible Compiling Entity
Number of companies publishing sustainability reports
Colombia, Brazil and Denmark suggest defining this indicator in relative terms: using the total number of companies as denominator.France suggests a modified indicator, "Number of companies publishing sustainability reporting, out of which those publishing sustainability reporting within their annual (management) report."
Ecuador comments that the indicator only mesures the reports effectively published by industries. They propose evaluating companies that have been certified. Germany comments that this idnicator does not make much sense as large and transnational companies often are required to publish such reports.Australia: The suggested indicator only works as a direct indicator for part of the target – does not address whether companies are actually adopting sustainable practices. Also does not provide indication of the quality of sustainability reports. Supports the World Bank's suggestion to consider the size of companies by output/employees/turnover, as a varying proportion of the private sector would be covered depending on the size of the individual companies that have committed to sustainability reporting.
Suggested Indicators as of August 11
Possible Compiling Entity
Number of countries implementing Sustainable Public Procurement policies and action plans
Denmark proposes using the indicator previously proposed by UNEP, "% of Sustainable public procurement in total public procurement for a set of prioritized product groups."Estonia proposes an alternative indicator, "% of Sustainable Public Procurement in total public procurement for a set of prioritized product groups."
Germany comments that there is no national indicator and counting pure number of countries does not make much sense.Brazil comments that the database to monitor this indicator is not fully structured.Australia: Unclear if this indicator refers to the public sector only or the broader public / business. Clarification on indicator specification needed.
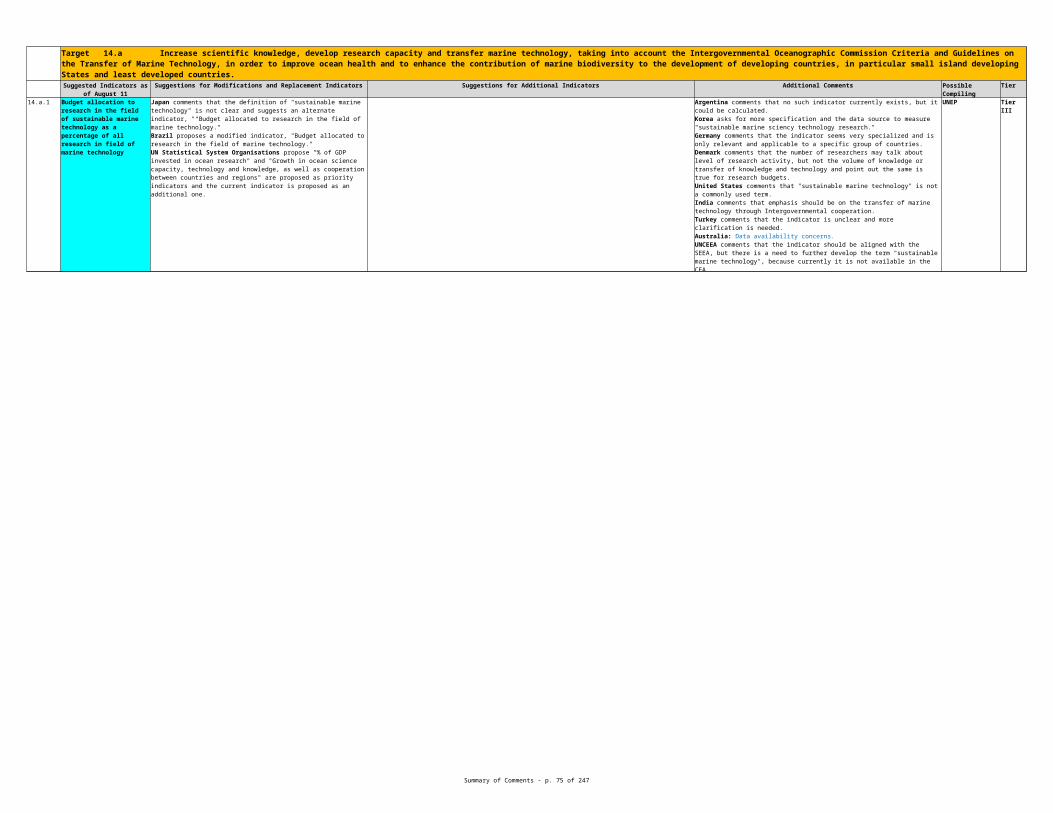
Summary of Comments - p. 75 of 265
Target 12.8 By 2030, ensure that people everywhere have the relevant information and awareness for sustainable development and lifestyles in harmony with nature.Suggestions for Modifications and Replacement Indicators Suggestions for Additional Indicators Additional Comments Tier
12.8.1 Tier III
Target 12.a Support developing countries to strengthen their scientific and technological capacity to move towards more sustainable patterns of consumption and production.Suggestions for Modifications and Replacement Indicators Suggestions for Additional Indicators Additional Comments Tier
12.a.1 WIPO Tier III
Target 12.b Develop and implement tools to monitor sustainable development impacts for sustainable tourism that creates jobs and promotes local culture and products.Suggestions for Modifications and Replacement Indicators Suggestions for Additional Indicators Additional Comments Tier
12.b.1 UN-WTO Tier III
Suggested Indicators as of August 11
Possible Compiling Entity
Number of countries reporting inclusion of sustainable development and lifestyles topics in formal education curricula
Denmark proposes an alternative indicator, "number of countries that have implemented the Convention on Access to Information, Public Participation in Decision-making and Access to Justice in Environmental matters (Aarhus Convention)."The UN Statistical System Organisations propose to modify the indicator to "Percentage of education institutions providing education for Sustainable Development UNESCO global modules (11 components including biodiversity and climate, disaster risk reduction and sustainable lifestyles, health promotion and cultural diversity)."UNECE proposes a modified indicator: "Legislative, regulatory and other measures taken to promote education on environmental awareness."
Colombia comments that the indicator should not be restricted to formal education curricula. They suggest including other related communication, dissemination and education means.Germany comments that there is no national indicator and counting pure number of countries does not make much sense.Singapore comments that formal curricula should not be the sole indicator. Relevant community outreach programmes should also be included.Canada comments that the indicator does not fully cover the target.Estonia comments that the indicator is not suitable for measuring the target.Australia: Noting that this is a Tier III indicator, indicator specification should allow progress towards the target to be shown (ie increments of effort can be shown, rather than a binary response) and must be transparent with the ability to be monitored in an objective manner.
Union for Ethical Biotrade
Suggested Indicators as of August 11
Possible Compiling Entity
Number of qualified green patent applications
Canada proposes a replacement indicator, "Total R&D expenditures."Brazil proposes a modified indicator, "Proportion of patents classified as "green" over the total of patents."
The UN Statistical System Organisations propose a different indicator: "Amount of spending on R&D in developing countries for SCP/environmentally sound technologies."
Australia: Limited relevance. Alternative approach: a more direct indicator of support provided would increase relevance. France comments that the information is not directly available.Mexico comments that there is no defined methodology for green patents.India comments that the focus should be on support to developing countries.Ecuador comments that there is no relationship between the indicator and the target and propose eliminating the indicator.Colombia comments that the suggested indicator does not measure support to developing countries and suggests defining it in terms of resources or number of technical cooperation projects to developing countries.United States comments that they do not understand what the term "green patent applications" means.Japan comments that there is no relationship between the indicator and the target and proposes an indicator like ODA.Estonia comments that the indicator is not suitable for measuring the target.African member states comment that more explanation is needed.
Suggested Indicators as of August 11
Possible Compiling Entity
Residual flows generated as a result of tourism direct GDP (derived from an extended version of the System of Environmental-Economic Accounting (SEEA) for tourism)
The UN Statistical System Organisations propose deleting the language in parenthesis in the indicator that references SEEA. and
The UN Statistical System Organisations propose an additional indicator: "Adopted National Policies to integrate sustainability in tourism operations."
Colombia comments that the suggested indicator is not currently feasible.Mexico comments that a conceptual framework would need to be developed first before measuring something like this.Brazil comments that there is no definition on what "sustainable tourism" is and it is likely this indicator would be some sort of index.Italy comments that the indicator is relevant but difficult to measure.Germany comments that they are uncertain how "sustainability" and "promotion of regional cultures and products" should be measured."Japan and United States comments that a different indicator should be selected as data for this indicator are too difficult to collect.Turkey comments that the indicator is unclear and clarification is needed.India comments that there is no conceptual framework in place to measure this.Australia: UNEP’s proposed indicator appears more useful in terms of being linked to the target (i.e. measuring/reporting on the development and implementation of tools); even though it does not measure an outcome per se. UNCEEA: The concptual framework for this indicator is being developed, and the indicator could be defined accordingly in due course.

Summary of Comments - p. 76 of 265
Suggestions for Modifications and Replacement Indicators Suggestions for Additional Indicators Additional Comments Tier
12.c.1 IEA Tier II
Target 12.c Rationalize inefficient fossil-fuel subsidies that encourage wasteful consumption by removing market distortions, in accordance with national circumstances, including by restructuring taxation and phasing out those harmful subsidies, where they exist, to reflect their environmental impacts, taking fully into account the specific needs and conditions of developing countries and minimizing the possible adverse impacts on their development in a manner that protects the poor and the affected communities.
Suggested Indicators as of August 11
Possible Compiling Entity
Amount of fossil fuel subsidies, per unit of GDP (production and consumption), and as proportion of total national expenditure on fossil fuels
Japan proposes a modified indicator, "Amount of insufficient fossil fuelsubsidies that encourge wasteful consumption, per unit of GDP."Brazil suggests an alternative, proxy indicator, "the comparison of the evolution of international prices and the prices charged at national level."
Ecuador states that since the Negotiations on the final document adopted at Rio+20 they have been hesitant on this means of implemention as "sustaining that goes against various dispositions of their national constitution and is against national law."France comments that the indicator is not available on a comparable basis between countries.United Kingdom supports this indicator. However, Tthe IEA definition is generally fine but they would strongly oppose the use of definitions that consider tax , such as OECD and the one being proposed by UNSD.Brazil comments that it is very difficult to measure subsidies.Estonia comments that the indicator is suitable, but a clear definition of the fossil fuel subsidies to be included is needed.Germany comments that the suggested indicator is based on IEA estimations.IMF questions the rationale for the second part of this indicator, "as proportion of toal national expenditure on fossil fuels". They ask why there should necessarily be any expenditure of fossil fuels? They also state that the concept of fossil fuel subsidies needs to be clearly defined. As the target is to remove market distortions and to also reflect environmental impacts from wasteful consumption, fossil fuel subsidies here should not only reflect the failure to recover the opportunity costs of supplying fossil fuels but also the failure to adequately charge for environmental damage from fossil fuel consumption (i.e., global warming, local pollution, traffic congestion and accidents) as well as to tax energy consumption in the same way as other consumption goods to raise government revenues. This subsidy concept is based on the true cost of fossil fuel consumption and benchmarks the actual fossil fuel prices to the optimal/desired levels from a societal perspective. An indicator based on this concept will be applicable not only for developing countries but also for advanced economies. The current IEA subsidy framework and databases do not appear sufficient for the estimation of this subsidy concept. The IMF, however, recently provided initial estimates under this broad concept for a large number of countries, which it intends to update on a regular basis.Australia: Indicator provides limited coverage of the target; measuring the amount of fossil fuel subsidies a Government provides as a proportion of GDP will measure the scale of identified subsidies rather than the specifics of Target 12.c (‘inefficient,’ ‘that encourage wasteful consumption’). The subsidies being measured may vary for reasons other than the issues identified in Target 12.c, without affecting the degree to which 12.c is being met. ‘Subsidy’ needs to be defined.
OTHER COMMENTS:
Germany proposes two headline indicators for goal 12: "DMCabiot per capita" and "GHG per capita."
Australia: Global indices such as those developed by FAO and other UN bodies will be most useful in assessing progress against global targets, whereas using these indicators to assess individual countries may be difficult, as not all countries will have capacity to collect the required data.

Summary of Comments - p. 77 of 265
Target 13.1 Strengthen resilience and adaptive capacity to climate-related hazards and natural disasters in all countries.Suggestions for Modifications and Replacement Indicators Suggestions for Additional Indicators Additional Comments Tier
13.1.1 UNISDR Tier II
Target 13.2 Integrate climate change measures into national policies, strategies and planning.Suggestions for Modifications and Replacement Indicators Suggestions for Additional Indicators Additional Comments Tier
13.2.1 Tier II
Goal 13 Take urgent action to combat climate change and its impacts (Acknowledging that the United Nations Framework Convention on Climate Change is the primary international, intergovernmental forum for negotiating the global response to climate change.)
Suggested Indicators as of August 11
Possible Compiling Entity
Number of deaths, missing people, injured, relocated or evacuated due to disasters per 100,000 people.
Korea notes that the target talks about response but the indicator relates to damage. They propose "time taken since outbreak of disaster to return to everyday life and value of damage, percentage of GDP spent on adaption capacity and resilience building.Cuba states that there are really two indicators here and proposes replacing the current indicator with: "Number of victims due to natural disasters and climate change" and "Economic losses due to climate change."Estonia suggests modifying the indicator so that it specifies "climate dependent natural disasters."United States proposes an alternate indicator, "ND-GAIN Country Index."Cabo Verde suggested removing "injured" from the indicator due to difficulty in measurement and adding "displaced."Canada suggests modifying the indicator to specify "climate-related and natural disasters."European Commission: 'Number of deaths, missing people, injured, relocated or evacuated due to climate -related disasters per 100,000 people'UNISDR proposes to modify: "Number of deaths, missing and affected people due to hazardous events per 100,000"(Possible to disaggregate by hazard and focus on cimate-related disasteres).
Colombia suggests a complimentary indicator on "population covered by climate change adaptation plans."Sweden suggests an additional indicator proposed by IUCN, "Red list index on impacts of climate change on threatened species."UNDP suggests the following two indicators, "Number of countries in which disaster and climate risk management explicity addressed in national, sub-national and sectorial planning frameworks, policies and budgetary systems" and "Number of countries with clearly defined institutional responsibilities and multi-stakeholder coordination mechanisms for disaster and climate risk management at national and sub-national level.The UN Statistical System Organisations propose an additional indicator, "Number of people per km2 exposed to climate related hazards and natural disasters.UNEP proposes an additional indicator "Percentage of population exposed to climate-related extreme events and other environmental shocks and disasters"UNISDR proposes to add "direct economic loss due to hazarouds events in relation to global gross domestic economic product".
Ecuador notes that the indicator for this target is the same as for target 1.5 and suggests removing this indicator.United Kingdom supports this indicator.France comments that the indicator depends too much on population growth and would support disaggregation by social status.Denmark states that the indicator should be changed as merging "death" and "evacuation" numbers seems inappropriate. The indicator should have more focus on the impact on livelihoods.Japan comments that both "death" and "economic loss" should be prioritized as indicators under this target.United States comments that the indicator only focuses on a limited aspect of climate and disaster resilience and wonders whether additional aspects such as "climate risk insurance coverage" be considered as well. They also note that the combination of deaths and displaced/relocated into one indicator does not make much sense and state that the target really requires multiple indicators.Australia: Suggested indicator does not measure all aspects of target. Concerns regarding indicator specification. Note links to the Sendai Framework on Disaster Risk Reduction. Euro-Commission comments that in the indicators current formulation, it does not distinguish between climate change related casualties and others (such as earthquakes) and as a result, does not very well measure the goal and target.UNISDR commented that disasters are classified by category and it is possible to only look at clmate related disasters.
Suggested Indicators as of August 11
Possible Compiling Entity
Number of countries that have formally communicated the establishment of integrated low-carbon, climate-resilient, disaster risk reduction development strategies (e.g. a national adaptation plan process, national policies and measures to promote transition to environmentally-friendly substances and technologies).
Korea notes that policy commitment across countries cannot be measure by the proposed indicator and suggests, "availability of budget plans on improvement and adaptation and its percentage of total budget."Cuba proposes eliminating this indicator. A more concrete and nationally measurable indicator should be developed.United Kingdom propose rewording to "'national adaptation planning process."ECE and Eurostat propose the indicator "GHG emissions (in CO2 equivalent)The UN Statistical System Organisations propose a modified indicator, "Number of countries that have formally communicated the establishment of climate change measures into national policies, strategies and planning (e.g. INDCs, national adaptation planning processes, national disaster risk reduction development strategies in line with Sendai Framework, low-carbon strategies, policies and measures)"UNISDR proposes to modify " Number of countries that adopt and implement national DRR strategies in line with the Sendai Framework for Disaster Risk Reduction 2015-2030" (Note: Can combine with adoption of CCA strategy etc.).European Commission: number of countries with national GHG emission reduction targetCanada: Number of relevant jurisdictions within a country that have formally communicated the establishment actions/activities related to the integration of climate change into relevant policies and plans or integrated low-carbon, climate-resilient, disaster risk reduction development, strategies and programs (e.g. a national adaptation plan process, national/provincial policies and measures, to promote transition to environmentally-friendly substances and technologies)
IMF proposes an additional indicator, "rates of taxation applied to fossil fuel consumption."UNDP proposes the following two indicators, "Number of countries with comprehensive measures - plans, strategies, policies, programmes and budgets - implemented to achieve low-emission and climate resilient objectives" and "Number of countries with legislative or regulatory provisions at national and sub-national level for managing disaster and climate risks.UNISDR proposes to add "Number of countries that integrate climate and disaster risk into development planning".
Colombia suggests to not only measure the communication of the establishment of these strategies, but also their implementation and population covered.United States comments that it is unclear what the success criteria are for this indicator.Japan comments that the term "environmentally-friendly" is not appropriately used and should not be included in the indicator.Australia: Note links to the Sendai Framework on Disaster Risk Reduction. Canada: If the target is intended to capture adaptation then more indicators on adaptation are needed - not just "national adaptation plan process
Secretariats for IMEAs.

Summary of Comments - p. 78 of 265
Target 13.3 Improve education, awareness-raising and human and institutional capacity on climate change mitigation, adaptation, impact reduction and early warning.Suggestions for Modifications and Replacement Indicators Suggestions for Additional Indicators Additional Comments Tier
13.3.1 UNICEF Tier III
Suggestions for Modifications and Replacement Indicators Suggestions for Additional Indicators Additional Comments Tier
13.a.1 UNFCCC Tier I
Suggested Indicators as of August 11
Possible Compiling Entity
Number of countries that have integrated mitigation, adaptation, impact reduction and early warning into primary, secondary and tertiary curricula
Colombia suggests that the indicator "% of population with increased knowledge on climate change" could better measure the target.France suggests a modified indicator, "Number of countries that have integrated climate change education into primary, secondary or tertiary curricula."Canada proposes modifying the indicator to read as follows, "Number of relevant jurisdications within a country that have formally communicated actions/activities related to the integration of climate change into relevant policies and plans or integrated low-carbon, climate-resilient, disaster risk reduction development, strategies and programs (e.g. a national adaptation plan process, national/provincial policies and measures, to promote transition to environmentally-friendly substances and technologies)."UNDP suggests the following indicator, "Number of countries with comprehensive measures - plans, strategies, policies, programmes and budgets - implemented to strengthen or build capacity at national and subnational level, within both institutions and communities."The UN Statistical System Organisations propose a modified indicator, "Percentage of education institutions providing Education for Sustainable Development UNESCO global modules (11 components including biodiversity and climate, disatser risk reduction and sustainable lifestyles, health promotion and cultural diversity)."
Denmark suggests a different indicator "Percentage of populated areas having a climate adaptation plan in place."Singapore suggests as an alternate indicator "number of countries that have put in place programmes to promote awareness of climate change issues to schools, communities, and the general public." UNISDR proposes to add "Number of countries that have multi-hazard early warning system" and " Number of countries that have multi-hazard national risk assessment with results in an accessible, understandable and usable format for stakeholders and people".
Germany comments that the meaning of this indicator is limited.Cuba proposes eliminating this indicator as SDG indicators should not measure the number of countries.Italy asks what "impact reduction and early warning" mean in the context of education.France comments that the suggested indicator needs clarification.United Kingdom ask for clarification of what is meant by 'impact reduction'.Japan comments that because the target is focusing on "education, awareness-raising and human and institutional capacity," using "primary, secondary and tertiary curricula" as indicator may not be appropriate.Australia: Too narrowly specified. The responsibility for managing the risks of climate change falls not only on individuals and households but on the private sector and across tiers of government. Focusing only on education is a limited pathway to building institutional capacity. Eurostat comments that there is no clear scope of the indicator.
Target 13.a Implement the commitment undertaken by developed-country parties to the United Nations Framework Convention on Climate Change to a goal of mobilizing jointly $100 billion annually by 2020 from all sources to address the needs of developing countries in the context of meaningful mitigation actions and transparency on implementation and fully operationalize the Green Climate Fund through its capitalization as soon as possible.
Suggested Indicators as of August 11
Possible Compiling Entity
Mobilized amount of USD per year starting in 2020 accountable towards the USD 100 billion commitment
United States and Japan propose a modification that reads "Mobilized per year towards the USD 100 billion commitment" to bring it into conformity with UNFCCC commitment.UNDP suggests the following indicator, "Number of countries with systems in place to access, deliver, monitor, report on and verify use of climate finances."
Ecuador comments that this indicator is measured at the global, not national level.France comments that this would require harmonized financial accounting rules.United Kingdom comment that they feel question marks over the consistency of the figures provided by different countries might prove problematic.Italy comments that it is necessary to have a clear definition of this indicator.Mexico comments that more specific counting principles are needed in order to harmonize country by country expenditures towards the target.Estonia comments that "mobilized amount" needs to be defined.Denmark notes that this indicator shold be referred to pending UNFCCC negotiations.The UN Statistical System Organisations state that the indicator should be developed at the conclusion of UNFCCC negotiations.

Summary of Comments - p. 79 of 265
Target 13.b Promote mechanisms for raising capacity for effective climate change-related planning and management in least developed countries, including focusing on women, youth and local and marginalized communities.
Suggestions for Modifications and Replacement Indicators Suggestions for Additional Indicators Additional Comments Tier
13.b.1 OECD Tier III
Suggested Indicators as of August 11
Possible Compiling Entity
Number of LDCs that are receiving specialized support for mechanisms for raising capacities for effective climate change related planning and management, including focusing on women, youth, local and marginalized communities
Japan proposes changing the term "specialized support" to just "support" as there is no agreed upon definition of what "specialized support refers to.United Kingdom propose rewording the indicator to, "Number of LDCs that are receiving specialized support towards effective plans that include a special focus on youth, women and marginalized groups to increase resilience to climate change and to make the transition to low carbon growth for all."Brazil proposes replacing the existing indicator with, "number of countries implementing capacity building public policies for planning related to climate change and effective management in the least developed countries, including focusing on women, youth, local and marginalized communities."UNDP suggests the following indicator, "Number of countries with adpatation strategy/action plans, disaster risk reduction and/or integrated disaster risk reduction and that specifically address equity and gender considerations."
African member states propose an additional indicator, "% of GCF funded projects finalized and sustained afterwards through national funding to produce climate neutral solutions."
Cuba proposes deleting this indicator because SDG indicators should not refer to the number of countries as this is not an indicator that can be monitored at the national level.Mexico comments that more specific counting principles are needed in order to harmonize country by country expenditures towards the target.Korea asks for further specification on "support for raising capacities for management."Denmark believes that sectoral indicators should be developed here.United States comments that the indicator lacks specificity.Germany comments that the meaning of this indicator is limited.The UN Statistical System Organisations state that the indicator should be developed at the conclusion of UNFCCC negotiations.
OTHER COMMENTS:
Germany suggests a headline indicator for the goal that is "GHG per capita."

Summary of Comments - p. 80 of 265
Goal 14 Conserve and sustainably use the oceans, seas and marine resources for sustainable development Target 14.1 By 2025, prevent and significantly reduce marine pollution of all kinds, in particular from land-based activities, including marine debris and nutrient pollution.
Suggestions for Modifications and Replacement Indicators Suggestions for Additional Indicators Additional Comments Tier
14.1.1 Tier III
Suggestions for Modifications and Replacement Indicators Suggestions for Additional Indicators Additional Comments Tier
14.2.1 Tier III
Suggested Indicators as of August 11
Possible Compiling Entity
Nitrogen use efficiency composite indicator
Ecuador proposes including an indicator more aligned with the target such as "Liquid discharge treatment plant care."Brazil suggests an alternative indicator, "Metric tons of fertilizers traded in relation to the total planted area (ha)."United Kingdom proposes an alternative indicator, "Nitrogen deposition."Colombia suggests an indicator on "Marine water quality" instead of the current indicator.Denmark comments that the indicator does not cover marine debris and proposes "Proportion of marine and coastal areas affected by pollution."UNDP comments that the indicator only incorporates nutrient pollution while the target also includes marine debris and suggests amending it and adding, "and metric tonnes per year of plastic waste entering ocean from all sources against 2015 baseline."UN Statistical System Organisations propose "Floating plastic debris" as a priority indicator with "Index of Coastal Eutrophication" as a secondary priority indicator and the current suggeted indicator listed as an additional indicator.
Canada proposes additional indicators, "Debris washed ashore, water quality monitoring data, bioindicators (residues in bivalves), spills at sea, disposal/dumping at sea ."
France comments that this indicator seems better suited to target 12.4.United States comments that the indicator is conceptually good but that it does not target marine debris.Cabo Verde comments that they need more information on this indicator.Sweden comments that the suggested indicator from OECD is "emissions of nitrates and phosphorous from agriculture to coastal Waters " and that Sweden currently reports these figures.Canada comments that a definition of "nitrogen use efficiency composite indicator" is necessary.African member states comment that the indicator should include all types of fertilizers.Australia: Not suitable in an Australian contextEurostat comments that the indicator is relevant but highly selective relative to the target as there is nothing on chemical pollution and microplastics.UNCEEA comments that the indicator could be aligned with SEEA.
Target 14.2 By 2020, sustainably manage and protect marine and coastal ecosystems to avoid significant adverse impacts, including by strengthening their resilience, and take action for their restoration in order to achieve healthy and productive oceans.
Suggested Indicators as of August 11
Possible Compiling Entity
% of coastal and marine development (to be defined) with formulated or implemented ICM/MSP plans (that are harmonized where applicable), based on an ecosystem approach, that builds resilient human communities and ecosystems and provides for equitable benefit sharing and decent work
India proposes an alternate indicator: “Marine protected areas.”United Kingdom propose an alternative indicator, "proportion of marine area covered by marine spatial plans."Brazil proposes a replacement indicator, "Percentage of coastline with integrated coastal management plans/Marine spatial planning, based on an ecosystem approach. (% of coastal and marine development (to be defined) with formulated or implemented ICM/MSP plans (that are harmonized where applicable), based on an ecosystem approach)."Australia: Suggest that ‘use’ is a better term to use than ‘development’ with regard to the definition of ‘coastal and marine development’.UN Statistical System Organisations propose "% of national EEZ managed using ecosystem-based approaches" as the sole priority indicator.UNISDR proposes "Number of deaths, missing and affected people due to hazardous events per 100,000"(Possible to disaggregate by hazard and focus on cimate-related disasteres) and "Direct economic loss due to hazarouds events in relation to global gross domestic economic product".
Canada comments that the indicator does not measure the target and proposes 2 alternative indicators, "# of bioregions for which risk assessments, to identify priority issues, are being conducted" and "# of bioregions implementing action measures, where the selected priority conservation tool is within a country's authority."Denmark comments that the indicator is very vague and proposes using indicators including in the work of the Convention on Biodiversity or "Marine trophic index."
Cabo Verde comments that they need more information on this indicator.United States comments that it is very specific and me be difficult to measure the "quality" of the plan. Germany comments that the indicator is limited and not well defined.France comments that they are unsure about data availability for this indicator.Estonia comments that the numerator of the indicator is not defined.Japan commented promoting ICM/MSP itself is not purpose of the target and other methods which are implemented without specifying areas are also contribute to the target. In addition, the definition of "ICM/MSP" is not clear.Eurostat comments that there is a need to agree on definitions included in this indicator.UNEP comments that this indicator needs further refinement and clarification.

Summary of Comments - p. 81 of 265
Target 14.3 Minimize and address the impacts of ocean acidification, including through enhanced scientific cooperation at all levels
Suggestions for Modifications and Replacement Indicators Suggestions for Additional Indicators Additional Comments Tier
14.3.1 Tier II
Suggestions for Modifications and Replacement Indicators Suggestions for Additional Indicators Additional Comments Tier
14.4.1 FAO Tier I
Target 14.5 By 2020, conserve at least 10 per cent of coastal and marine areas, consistent with national and international law and based on the best available scientific information.Suggestions for Modifications and Replacement Indicators Suggestions for Additional Indicators Additional Comments Tier
14.5.1 Coverage of protected areas UNEP-WCMC Tier I
Suggested Indicators as of August 11
Possible Compiling Entity
Average marine acidity (pH) measured at agreed suite of representative sampling stations
Denmark proposes using "Nitrogen use efficiency composite indicator" as the priority indicator.Canada proposes modifying the indicator to read, "Average marine acidity (pH) measured at agreed suite of representative sampling stations and the resulting data is provided to the Global Ocean Acidification Observing Network."United States proposes modifying the indicator to, "Parameters measured necessary to calculate aragonite saturation state (which include any two of: pH, carbon dioxide partial pressue (pCO2), Total Alkalinity (TA) or Dissolved Inorganic Carbon (DIC) plus temperature and salinity) at agreed suite of representative sampling stations per Global OA Observing Network Requirements Plan."UN Statistical System Organisations propose "carbonate chemistry parameters" as the priority indicator. The current indicator is proposed as an additional indicator.
Colombia comments that this indicator should be complemented with one about scientific cooperation.IPBES agrees with IUCN's proposal for a complimentary indicator, "Red List Index (Corals)"
Japan commented that in order to measure the average marine acidity(pH) precisely, the definition of "agreed suite of representative sampling stations" must be cleared.Sweden comments that SEEA is listed as a data source for this indicator but that to their knowledge no data is currently being collected.Eurostat comments that the indicator only measure the acidification, not its impacts.UNEP comments that this indicator needs further refinement and clarification.
Target 14.4 By 2020, effectively regulate harvesting and end overfishing, illegal, unreported and unregulated fishing and destructive fishing practices and implement science-based management plans, in order to restore fish stocks in the shortest time feasible, at least to levels that can produce maximum sustainable yield as determined by their biological characteristics.
Suggested Indicators as of August 11
Possible Compiling Entity
Proportion of fish stocks within biologically sustainable level
Brazil suggests an alternative indicator, "Endangered fish species."Germany and Eurostat comment that "biologically sustainable level" is a general term while the target uses "maximum sustainable yield (MSY)" that is commonly used in fisheries science. They propose a new wording that is "% of populations of fish stocks at or above biomass levels capable of producing maximum sustainable yield."Canada proposes modifying the indicator to read, “Proportion of fish stocks HARVESTED within biologically sustainable level.”
Ecuador comments that the calculation methodology for this indicator should be proposed based on an estimation of each known species and the determination of biologically sustainable levels.Korea comments that the indicator is not suitable for measuring the target.Denmark and Turkey state that this indicator is acceptable.Tanzania comments that data are not available at the country level and if the goal is to promote the use of national data, this is not a good indicator.Estonia comments that the indicator is suitable.United States comments that not all fish stocks are measured annually, or even at all.Japan does not support having any indicator for target 14.4.Australia: Definition of ‘biologically sustainable level’ requires clarification. ‘Proportion of fish stocks within biologically sustainable level’ gives the current point, but harvest strategies should be developed to move to where we want to be. Harvest Strategy Policies and Harvest Strategy Frameworks for key species can assist in maintaining sustainable fish stocks.UNCEEA comments that the indicator should be developed in alignment with SEEA asset accounts for aquatic resources.
Suggested Indicators as of August 11
Possible Compiling Entity
Ecuador and Cuba proposes the inclusion of "coastal areas" in the name of the indicator.Brazil proposes a modified indicator, "Coverage of protected areas of marine sites of particular importance for biodiversity."United Kingdom propose a modified indicator, "% of global ocean under Marine protected areas."France agrees with IUCN's proposal to reword as "Coverage by protected areas of marine sites of particular importance for biodiversity."United States proposes modifying the indicator to read, "Coverage as a percentage of coastal zone/areas."Canada proposes modifying the indicator to read, "Percentage of coastal and marine territory conserved through networks of protected areas and other effective area-based conservation measures."
Germany comments that the indicator is not well defined and misses a definition of what "protected areas" means.Denmark states that this indicator is acceptable but asks how "coverage" is defined.Japan and Turkey comment that the indicator is appropriateUNCEEA commentat that the indicator should be developed in alignment with SEEA Land Accounts, in partiular the the SEEA land use accounts.

Summary of Comments - p. 82 of 265
Suggestions for Modifications and Replacement Indicators Suggestions for Additional Indicators Additional Comments Tier
14.6.1 UNSD Tier III
Suggestions for Modifications and Replacement Indicators Suggestions for Additional Indicators Additional Comments Tier
14.7.1 Fisheries as a % of GDP UNSD Tier I
Target 14.6 By 2020, prohibit certain forms of fisheries subsidies which contribute to overcapacity and overfishing, eliminate subsidies that contribute to illegal, unreported and unregulated fishing and refrain from introducing new such subsidies, recognizing that appropriate and effective special and differential treatment for developing and least developed countries should be an integral part of the World Trade Organization fisheries subsidies negotiation.
Suggested Indicators as of August 11
Possible Compiling Entity
Dollar value of negative fishery subsidies against 2015 baseline
Brazil proposes a modified indicator, "Ratio between the volume of negative fishery subsidies and public expenditures (expressed in millions or billions of dollars)."FAO proposes, and supported by UN Statistical System Organisations, this indicator: “Progress by countries in [level/degree of] the implementation of international instruments aiming to combat IUU fishing”
India suggests that “Deep Sea Trawling ban” may be a suitable indicator.Canada comments that this indicator should be deleted and an indicator that measures the "prohibition of these types of subsidies" be developed.
Denmark comments that the indicator should be in line with WTO rules.France comments that data for the indicator is not available but is feasible.United Kingdom comments that they find this indicator problematic. More clarity is required over what is a 'negative' fishing subsidy?.‐United States comments that a dollar value decrease is not an effective measure.Japan comments that it makes no sense to have an indicator on subsidies as this discussion on defining fishery subsidies has not been finalized in WTO negotiations.Turkey comments that this indicator can be used to monitor the target and that for the countries which use the Quota System, the indicators acquired from the Quota System are very important to find overcapacity and overfishing.Cuba comments that the indicator should be deleted.Estonia comments that the indicator is relevant.WTO comments that the indicator poses a definitional issue as there is no consensus on what are harmful subsidies and there may be further difficulties in calculating a 2015 baseline as Member States would be reluctant to provide this information publicly.Eurostat comments that the definition is unclear.UNCEEA comments that the indicator should be aligned with the SEEA where possible. However the SEEA-CF does not provide a definition for harmful subsidies
Target 14.7 By 2030, increase the economic benefits to Small Island developing States and least developed countries from the sustainable use of marine resources, including through sustainable management of fisheries, aquaculture and tourism.
Suggested Indicators as of August 11
Possible Compiling Entity
Germany comments that the indicator does not reflect sustainable use of marine resources and suggests the following indicator "Coverage and management effectiveness of inshore and offshore protected areas."Canada proposes a modified indicator, "proportion of subsistance fishers' protein intake that is met by sustainable fishing and aquaculture; economic value of sustainable use of marine resources."France proposes adding "sustainable" before "fisheries in the indicator.UNDP comments that the indicator should be modified to read, "Fisheries, aquaculture and tourism as a % of GDP."UN Statistical System Organisations propose "Revenues and ecosystem services derived from sustainable fisheries, aquaculture, tourism and other coastal marine resources uses" as the priority indicator and list "productivity of aquaculture" as an additional indicator.
WTO comments that the indicator does not look at the sustainability of the fisheries nor the need to diversify exports. Proposes alternative indicators such as "percentage of fish produced by aquaculture" and "increase in services exports or employment derived from tourism and other services."
Ecuador comments that the indicator needs to be better defined so that it refers to fishing done in a sustainable manner and to reflect contribution to small fisher's income.Colombia comments that the indicator does not reflect the target because fisheries are not necessarily sustainably managed and does not include other marine resources.United States comments that the current indicator is ambiguous to interpret and will vary more due to other GDP components' movement.United Kingdom comment that the indicator is problemmatic as it could vary due to external factors.Denmark comments that aquaculture and tourism must also be included, as well as revenue from these and local value-added may also be relevant. They also mention that increasing as a % of GDP may not necessarily be desirable, as it could signal a lack of development in other sectors. Finally, they state that the indicator should reflect the sustainable use of resources, as mentioned in the target.Portugal comments that the proposed indicator does not correspond to a sustainable use of marine resources and proposes considering a replacement or alternative indicator.Tanzania comments that the source column is incorrect as the SEEA Central Framework and SEEA Agriculture, Forestry and Fisheries are not data collection methods.Peru comments that it is pertinent to point out that the GDP purchasing power parity at international agencies jointly developed with countries.Turkey comments that the proposed indicator is relevant.Australia: Indicator would need to account for confounding variables, such as changes in components of the GDP that may influence the percentage fisheries’ income relative to GDP. Questions relevance for Australia; suggests alternative: Sustainable fisheries management would be better achieved by output controls and use of harvest strategies, noting that they are data intensive.Eurostat is not sure about this indicator since the sustainability aspect is not considered.UNCEEA comments that the indicator should be aligned with SEEA.The SNA, SEEA Central Framework and the SEEA Agriculture Forestry and Fisheries provide information on the contribution to GDP of fisheries.

Summary of Comments - p. 83 of 265
Suggestions for Modifications and Replacement Indicators Suggestions for Additional Indicators Additional Comments Tier
14.a.1 UNEP Tier III
Target 14.a Increase scientific knowledge, develop research capacity and transfer marine technology, taking into account the Intergovernmental Oceanographic Commission Criteria and Guidelines on the Transfer of Marine Technology, in order to improve ocean health and to enhance the contribution of marine biodiversity to the development of developing countries, in particular small island developing States and least developed countries.
Suggested Indicators as of August 11
Possible Compiling Entity
Budget allocation to research in the field of sustainable marine technology as a percentage of all research in field of marine technology
Japan comments that the definition of "sustainable marine technology" is not clear and suggests an alternate indicator, "“Budget allocated to research in the field of marine technology."Brazil proposes a modified indicator, "Budget allocated to research in the field of marine technology."UN Statistical System Organisations propose "% of GDP invested in ocean research" and "Growth in ocean science capacity, technology and knowledge, as well as cooperation between countries and regions" are proposed as priority indicators and the current indicator is proposed as an additional one.
Argentina comments that no such indicator currently exists, but it could be calculated.Korea asks for more specification and the data source to measure "sustainable marine sciency technology research."Germany comments that the indicator seems very specialized and is only relevant and applicable to a specific group of countries.Denmark comments that the number of researchers may talk about level of research activity, but not the volume of knowledge or transfer of knowledge and technology and point out the same is true for research budgets.United States comments that "sustainable marine technology" is not a commonly used term.India comments that emphasis should be on the transfer of marine technology through Intergovernmental cooperation. Turkey comments that the indicator is unclear and more clarification is needed.Australia: Data availability concerns.UNCEEA comments that the indicator should be aligned with the SEEA, but there is a need to further develop the term "sustainable marine technology", because currently it is not available in the CEA.

Summary of Comments - p. 84 of 265
Target 14.b Provide access for small-scale artisanal fishers to marine resources and markets Suggestions for Modifications and Replacement Indicators Suggestions for Additional Indicators Additional Comments Tier
14.b.1 Tier III
Suggestions for Modifications and Replacement Indicators Suggestions for Additional Indicators Additional Comments Tier
14.c.1 ILO Tier II
Suggested Indicators as of August 11
Possible Compiling Entity
Percentage of catches that are subject to a catch documentation scheme or similar traceability system as a percentage of the total catches that are less than x tons and traded in major markets.
Ecuador comments that the proposed indicator has no relationship to the target and proposes, "rate of capture made by artisinal fishermen on the total catch."Brazil proposes the following alternative indicator, "By 2030, X% of small-scale artisanal fishers certified as sustainable; Y% increase in market access for small-scale artisanal fishers."Korea proposes an alternate indicator, "Proportion of national fishery production by country that are catches by small-medium fishery businesses."India proposes an alternative indicator: “Percentage of catch by traditional fishermen.”UN Statistical System Organisations propose "Progress by countries in adopting and implementing a legal/regulatory/policy/institutional framework which recognizes and protects access rights for small-scall fisheries" as priority indicator and the current indicator is listed as an additional one.
Colombia comments that they could report the number of fishers in the traceability plan.Italy comments that it is necessary to have a clear definition of the indicator.Denmark comments that the indicator should be changed as it says nothing about access to marine resources and markets.United Kingdom find this indicator problematic.France comments that they do not understand this indicator and that it seems two indicators would be necessary for this target.Turkey comments that the proposed indicator is relevantCanada comments that there is currently no definition of "small-scale" and "artisanal" and therefore difficult to measure the target.United States comments that an indicator that could track value-added/higher value production to get at the broader set of issue to large market access from those fisheries would be more approriate. Saying "Percentage of catches of the total catches that are less than x tons and traded in major markets" might encompass this broader set of issues with large market access. In addition, certifying a small scale fishery is not easy and certification schems are sometimes considered an outside burden. Japan comments that since the target is about the development of artisanal fisheries, the percentage of traceability products has no use for the indicator to the target.
Target 14.c Enhance the conservation and sustainable use of oceans and their resources by implementing law as reflected in UNCLOS, which provides the legal framework for the conservation and sustainable use of oceans and their resources, as recalled in paragraph 158 of The Future We Want.
Suggested Indicators as of August 11
Possible Compiling Entity
Number of countries implementing either legally or programmatically the provisions set out in regional seas protocols and ratification and implementation of the ILO Maritime and Fisheries Conventions
UN Statistical System Organisastions propose "Progress by countries in implementing either legall or programmatically the provisions set out in relevant legally binding and voluntary instruments for sustainable use and conservation of ocean including instruments related to fisheries, shipping, labour, conservation at global and regional levels" as priority indicator. They also propose several other additional indicators.
Japan comments that the purpose of the proposed indicator is unclear and is not appropriate as a statistical indicator for the target.Turkey comments that the proposed indicator is relevant.Cuba proposes eliminating this indicator.
OTHER COMMENTS:
Germany suggests a headline indicator for the goal that is "Proportion of fish stocks within biologically sustainable level (int level)."Malaysia commented on a previous version of the indicators.

Summary of Comments - p. 85 of 265
Suggestions for Modifications and Replacement Indicators Suggestions for Additional Indicators Additional Comments Tier
15.1.1 FAO Tier I
Target 15.2 By 2020, promote the implementation of sustainable management of all types of forests, halt deforestation, restore degraded forests and substantially increase afforestation and reforestation globally.
Suggestions for Modifications and Replacement Indicators Suggestions for Additional Indicators Additional Comments Tier
15.2.1 FAO Tier II
Goal 15 Protect, restore and promote sustainable use of terrestrial ecosystems, sustainably manage forests, combat desertification, and halt and reverse land degradation and halt biodiversity loss
Target 15.1 By 2020, ensure the conservation, restoration and sustainable use of terrestrial and inland freshwater ecosystems and their services, in particular forests, wetlands, mountains and drylands, in line with obligations under international agreements.
Suggested Indicators as of August 11
Possible Compiling Entity
Forest area as a percentage of total land area
Brazil proposes as an alternative indicator, "Area of natural vegetation cover as a percentage of total land area (broken down by phytophysiognomy)."World Bank, on behalf of the IFC proposes "Percentage of Land under protection by private or public management" as an alternate indicator.
Colombia comments that the suggested indicator does not cover other ecosystems included in the target and makes several suggestions such as: "Proportion in terms of arae of key ecosystems that have been preserved" and "Proportion of key ecosystems for which a management plan has been implemented."Denmark proposes a complementary sub-indicator, "Area with primary forest and other naturally regenerated forest."France suggests a complimentary indicator, "Coverage by protected areas of important sites for terrestrial and freshwater biodiversity."UN Statistical System Organisations propose a second indicator to monitor the target in addition to the already suggested one, "Protected area overlays with biodiversity." They also comment that the indicator "Percentage change in wetlands extent over time" proposed under Target 6.6 is also very relevant for this target.
Poland comments that its definition of forest area differs from those used by international agencies.Turkey comments that the definition of forest area should be clarified as to whether it includes only forests or forests and other wooded land etc.Germany, Canada and Denmark agree on the suggested indicator but would like it disaggregated by ecosystem type.Estonia comments that the indicator is relevant.Japan and United Kingdom comment that they support this indicator.United States asks why this is expressed as a ratio of total land area. The issue is not the ratio but whether a country is gaining or losing forest area.Australia: Financial barriers to accurate measurement are large/useful as a trend, but not for comparison among countries/Requests to refine specification to take into account age, condition and biomass/Simple 'percentage cover' will not provide meaningful information towards ‘conservation, restoration and sustainable use’./Broaden to include different ecosystem types, not just forests/suggests satellite remote sensing monitoring for cost effectiveness/Eurostat comments that the indicator is very limited in scope as only forests are included while the target also mentions wetlands, mountains and drylands.UNEP comments that this indicator is insufficient to measure the target.IPBES asks if this indicator can be cross-checked with satellite imagery maps or remote sensing.UNCEEA comments that the indicator should be developed in alignment with SEEA Land Accounts.
Suggested Indicators as of August 11
Possible Compiling Entity
Forest cover under sustainable forest management
Colombia suggests using two indicators for this target: "Proportion of deforested area" and "Net forest loss."Estonia proposes modifying the indicator to read, "Area of forest under sustainable forest management as a percent of total forest area".UN Statistical System Organisations propose two priority indicators for this target, "Sustainable Forest Management Index" and "Carbon stocks in woody biomass." They also suggest that "Forest Certification" may be used by some countries to complement other indicators.
Canada proposes additional indicators "area and proportion of forest cover loss"; "proportion of primary forest retained compared to a baseline year (say 2010)"; "proportion of forests degraded (suggest practical definition of degradation relating to loss of ecosystem function or services). "
Norway comments that there is no UN definition for "sustainable forest mangement." They suggest separate indicators for deforestation and restoration.Turkey comments that this is the most important indicator and states it is essential to define what "forest" means.Japan and Canada comments that the definition of "sustainable forest management" has yet to be agreed upon.Cuba supports this indicator.Germany and Denmark support the indicator proposed by UNEP on certified forest management as the suggested indicator.United States comments that there is no definition of "sustainable forest mangement" and that the indicator does not address afforestation nor reforestation.Australia: Limited data availability/Definition of 'sustainable management' and methodological guidance needed/Express as %/Most are only measuable qualitatively/Baseline for afforestation required/ Need to ensure that it is the outcome of sustainable forest management that is monitored, not simply the adoption of frameworks/suggests satellite remote sensing monitoring for cost effectiveness/Eurostat comments that the feasibility of providing this information on an international level is doubtful.UNCEEA comments that the indicator could be aligned with SEEA methodology but that further work is necessary.

Summary of Comments - p. 86 of 265
Target 15.3 By 2030, combat desertification, restore degraded land and soil, including land affected by desertification, drought and floods, and strive to achieve a land degradation-neutral world.Suggestions for Modifications and Replacement Indicators Suggestions for Additional Indicators Additional Comments Tier
15.3.1 Trends in land degradation UNCCD, UNSD Tier II
Suggested Indicators as of August 11
Possible Compiling Entity
India comments that the suggested indicator is not well defined and proposes using: “Percentage of degraded land to total geographical area.”Ecuador and Cuba comment that the proposed indicator is not well defined and proposes, "Percentage of land that is degraded over total land area."Denmark proposes two different indicators for the target, "Area under sustainable management" and "Trends in pressures from unsustainability agriculture, forestry, fisheries and aquaculture."Colombia suggests using two indicators for this target: "Proportion of reforested area for protection" and "Proportion of the area affected by desertification."FAO: the proposal is now a joint proposal by UNCCD and FAO
UNEP proposes an additional multipurpose indicator in collaboration with UNISDR, " climate-related extreme events and other environmental shocks and disasters."UNISDR proposes to add " Agriculture damage and loss to hazardous event", "Number of countries that have multi-hazard early warning system" and " Number of countries that have multi-hazard national risk assessment with results in an accessible, understandable and usable format for stakeholders and people".
Germany comments that the indicator is not well defined and might be, depending on national situations, meaningless.Brazil comments that this indicator is acceptable, provided that it is broader, encompassing other regions and the definition of standards of physical and biotic degradation and land use, specifying the parameters and guidelines necessary for its construction.Japan and Canada comments that the term "land degradation" is not yet internationally defined.Switzerland comments that the loss of fertile soil and its sealing through the construction of buildings, roads and other infrastructure should also be considered in the indicator. Feasable if only loss due to sealing is considered Estonia comments that the indicator needs a clear definition.United Kingdom support this indicator.United States comments that the indicator requires further specificity.Australia: not suitable or measurable/specification is vague/Assessment of achievement would be reliant on case studies and samples, rather than a robust national dataset/Suggests the specification be adapted to emphasise the need to monitor trends in land degradation across multiple factors. /New techniques for big data analysis will enable this to be tracked in more detail over time on a global basis.UN Statistical System Organisations agree that this should be the sole priority indicator for this target.UNCCD supports the suggested indicator.UNISDR highlighted their previous proposals for multipurpose indicators under this target that were included in the indicator list from 11 August.UNCEEA comments that the indicator could be aligned with SEEA methodology but that further work is necessary.
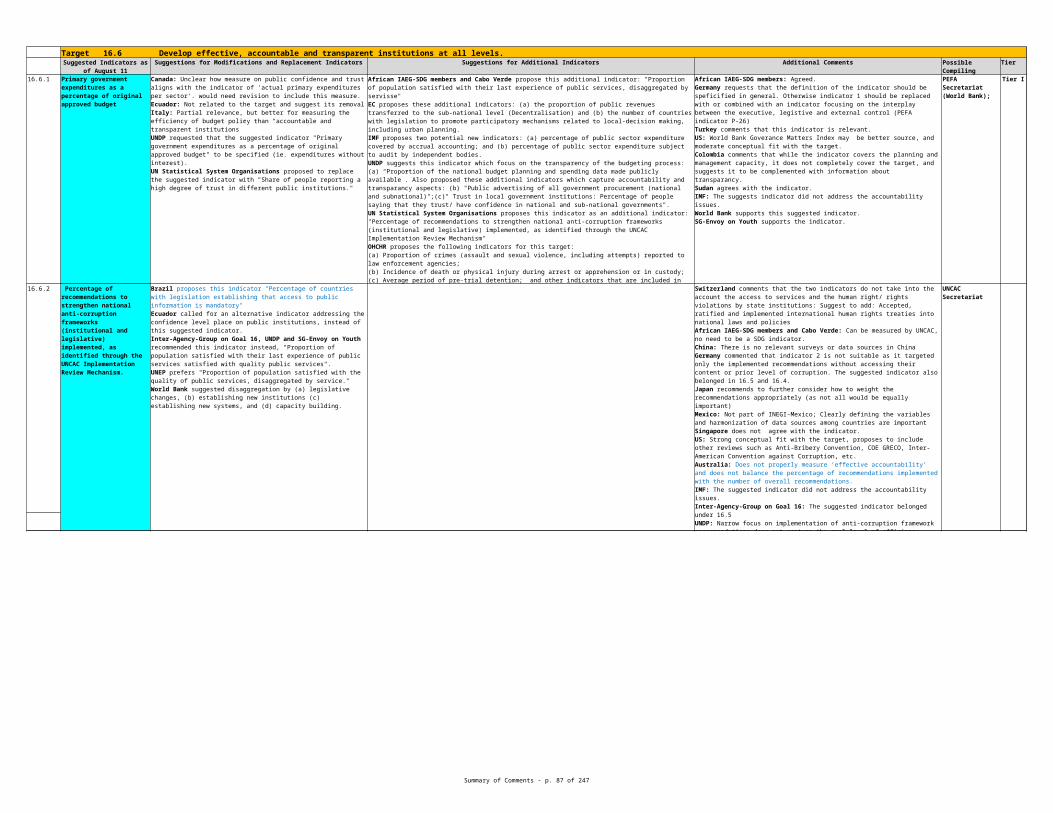
Summary of Comments - p. 87 of 265
Target 15.4 By 2030, ensure the conservation of mountain ecosystems, including their biodiversity, in order to enhance their capacity to provide benefits that are essential for sustainable development Suggestions for Modifications and Replacement Indicators Suggestions for Additional Indicators Additional Comments Tier
15.4.1 Coverage of protected areas UNEP-WCMC Tier I
15.4.2 Mountain Green Cover Index FAO Tier I
Target 15.5 Take urgent and significant action to reduce the degradation of natural habitats, halt the loss of biodiversity, and, by 2020, protect and prevent the extinction of threatened species.Suggestions for Modifications and Replacement Indicators Suggestions for Additional Indicators Additional Comments Tier
15.5.1 Red List Index IUCN Tier I
Suggested Indicators as of August 11
Possible Compiling Entity
Denmark states the indicator should be changed and proposes as alternatives, "Trends in pressures from unsustainability agriculture, forestry, fisheries and aquaculture" and "Trends in abundance and distribution of selected species" among others.Peru suggests modifying the indicator to read "Protected area coverage disaggregated by type of natural areas." France suggests rephrasing the indicator as "Coverage by protected areas of important sites for mountain biodiversity”.
Canada proposes several additional indicators, "land use on mountain ecosytems," "population trends in key species (those indicating ecosystem health, or with important human consumptive or nonconsumptive uses)"; "trends in water quality in mountain streams"; "vegetation trends; trends in slope stability; soil loss."
Poland notes that the indicator "Coverage of protected areas" does not specify mountain areas so they are unsure if it is appropraite for the target.Brazil comments that this indicator is acceptable, but it lacks guidelines for its construction.Germany comments that the indicator is not well defined and might be, depending on national situations, meaningless.Colombia suggests disaggregating this indicator by type of ecosystem.Canada comments that this indicator does not measure outcomes. Turkey comments that this indicator is relevant.Japan and United Kingdom support this indicator.Estonia comments that the indicator is relevant.United States comments that more specificity is needed.Australia: may be measurable with reserve system mapping; however there may be issues with coverage of state forests, state conservation areas, etc. UN Statistical System Organisations suggest that this be moved to an additional or complementary indicator for the target.UNCEEA comments that the indicator should be developed in alignment with SEEA Land Accounts.
France comments that the indicator “Mountain Green Cover Index” is not available and not necessary.Brazil comments that this indicator is acceptable, but it lacks guidelines for its construction.Ecuador comments that they find that a global scale standardization of the methodology of the calculation of the indicator is necessary.Germany comments that they would like a detailed definition of this indicator.Canada comments that this indicator does not measure the target and would need to be supplemented by additional indicators.Estonia comments that the indicator does not apply to their country but overall is relevant.Turkey comments that the indicator depends not only the green vegetation in mountain areas but also the geographical characterisation of the country so the indicator values would not be comparable and the index is not relevant internationally.Japan supports this indicator.United States comments that it is important to have a clear definition of "mountain."Australia: Support this indicator, although unsure if this data exists for Australia given the finite number of 'mountains' in Australia. UN Statistical System Organisations suggest this as the sole priority indicator.UNCEEA comments that land occupied by 'green' land cover types, e.g. forest, shrublands, grasslands can be potentially applied for this index
Suggested Indicators as of August 11
Possible Compiling Entity
Denmark states the indicator should be changed and proposes as alternatives, "Trends in extent, condition and vulnerability of ecosystems, biomes and habitats" and "Trends in pressures from unsustainability agriculture, forestry, fisheries and aquaculture" among others.United States suggests considering the "Living Planet Index" as an alternative indicator.
Japan supports this indicator.Canada comments that this indicator does not address the target as Red List Index only monitors threat of extinction so additional indicators are required.UN Statistical System Organisations agree that this should be the sole priority indicator for this target while "Living Planet Index" could be used by some countries to monitor progress towards the Aichi Targets.Eurostat comments that degradation of natural habitats is not covered.UNCEEA comments that the indicator could be developed where the SEEA can provide important contextual information.

Summary of Comments - p. 88 of 265
Target 15.6 Ensure fair and equitable sharing of the benefits arising from the utilization of genetic resources and promote appropriate access to such resources.Suggestions for Modifications and Replacement Indicators Suggestions for Additional Indicators Additional Comments Tier
15.6.1 CBD Tier I
Target 15.7 Take urgent action to end poaching and trafficking of protected species of flora and fauna and address both demand and supply of illegal wildlife products.Suggestions for Modifications and Replacement Indicators Suggestions for Additional Indicators Additional Comments Tier
15.7.1 IUCN Tier I
15.7.2 UNODC Tier II
Target 15.8 By 2020, introduce measures to prevent the introduction and significantly reduce the impact of invasive alien species on land and water ecosystems and control or eradicate the priority species.
Suggestions for Modifications and Replacement Indicators Suggestions for Additional Indicators Additional Comments Tier
15.8.1 IUCN Tier I
Suggested Indicators as of August 11
Possible Compiling Entity
Number of countries that have adopted legislative, administrative and policy frameworks for the implementation of the Nagoya Protocol
Brazil proposes to modify part of the indicator as such, replace "for the implementation..." with "...to ensure fair and equitable sharing of the benefits"Australia does not support the use of binary indicators, and would prefer a robust measure that can track progressive realisation. Alternate/additional indicators are available; other international treaties exist on the use of genetic resources. The number of countries using the International Treaty on Plant Genetic Resources is also relevant. UN Statistical System Organisations propose one priority indicator, "Number of permits or their equivalents made available to the Access and Benefit-sharing Clearinghouse established under the Nagoya Protocol and number of Standard Material Transfer Agreemetns as communicated to the Governing Body of the International Treaty."
Germany and Denmark support the suggested indicator.Colombia comments that the suggested indicator does not adequately cover the target as it should be focused on effective implementation of actions that ensure appropriate access to genetic resources.Japan and United Kingdom supports this indicator.France comments that this is an input indicator.United States comments that this indicator inappropriately only focuses on the Nagoyoa Protocol, to which only 59 countries are parties.Cuba suggests eliminating this indicator.Eurostat comments that the indicator also needs to cover the implementation aspect.
Suggested Indicators as of August 11
Possible Compiling Entity
Red List Index for species in trade
Brazil proposes it to be Tier II, also comments that doubts were raised about the scope of the indicator: internal trade and/or foreign trade? Canada proposes an alternative indicator, "population trends for species (or subunits) subject to poaching and/or illegal trade ."
Denmark supports this indicator.United States comments that since the trade is illegal, it is impossible to know if the measure would be at all accurate.Australia: Indicator not adequate. The quantum of trade in Red Listed Index species may not provide a useful indication of the scale of illegal wildlife trafficking. Risk of misreporting. UN Statistical System Organisations propose dropping this indicator as a priority indicator.Eurostat comments that this indicator is not relevant to the target.
Proportion of detected trade in wildlife and wildlife products that is illegal
UN Statistical System Organisations propose one priority indicator, "Ratio between detected illegal trafficking and legal trade in wildlife and wildlife products." This indicator is also proposed for target 15.c.
Canada proposes an additional indicator, "total estimated value of trade in illegal wildlife products." Korea comments that it is practically impossible to measure illegal trade volume for imported CITES.Brazil comments that doubts were raised about the scope of this indicator.Mexico comments that national information on illegal trade has significant limitations.United States comments that since the trade is illegal, it is impossible to know if the measure would be at all accurate.Australia: Data is not available to enable Australia to report against this indicator. Indicator may not be adequate; concern that detected trade in illegal wildlife products provides an indicator of seizure effort only, not of the scale of poaching and wildlife trafficking. Risk of misreporting. Eurostat comments that an indicator based on effective implementation of the CITES convention would be more comprehensive.
Suggested Indicators as of August 11
Possible Compiling Entity
Adoption of national legislation relevant to the prevention or control of invasive alien species
Ecuador proposes an alternate indicator, "The number of public policies adopted that prevent the entry of invasive species to the country" for the target.Brazil proposes the following alternative indicator, "Resources to prevent the introduction and to control invasive alien species."
Denmark and Japan support this indicator.France comments that this is an input indicator and insufficient to measure the target.Canada comments that this indicator does not address the target.United States comments that this indicator does not address compliance.UN Statistical System Organisations support the suggested indicator as the priority indicator.

Summary of Comments - p. 89 of 265
Target 15.9 By 2020, integrate ecosystem and biodiversity values into national and local planning, development processes, poverty reduction strategies and accounts.Suggestions for Modifications and Replacement Indicators Suggestions for Additional Indicators Additional Comments Tier
15.9.1 Tier II
Target 15.a Mobilize and significantly increase financial resources from all sources to conserve and sustainable use biodiversity and ecosystems.Suggestions for Modifications and Replacement Indicators Suggestions for Additional Indicators Additional Comments Tier
15.a.1 OECD Tier I
Suggestions for Modifications and Replacement Indicators Suggestions for Additional Indicators Additional Comments Tier
15.b.1 OECD Tier II
Target 15.c Enhance global support for efforts to combat poaching and trafficking of protected species, including by increasing the capacity of local communities to pursue sustainable livelihood opportunities.
Suggestions for Modifications and Replacement Indicators Suggestions for Additional Indicators Additional Comments Tier
15.c.1 UNODC Tier II
Suggested Indicators as of August 11
Possible Compiling Entity
Number of national development plans and processes integrating biodiversity and ecosystem services values
UN Statistical System Organisations propose a modified priority indicator, "Progress towards national targets established in accordance with Aichi Biodiversity Target 2 of the Strategic Plan for Biodiversity 2011-2020."
Denmark comments that this indicator should be changed on order to be used within the work of the Convention on Biodiversity.United States comments that just putting something into a strategy does not mean it will actually happen.Japan supports this indicator.Canada comments that this indicator does not address the target.Australia: Binary indicator, which Australia notes is less helpful in monitoring the effectiveness/processes of those plans in relation to the achievement of this target. However, qualitative monitoring will be difficult. UNCEEA comments that this topic "biodiversity and ecosystem values" is strongly related with the SEEA-EEA accounts and their implementation. This indicator could be developed where the SEEA can provide important contextual information but further work is needed.
Suggested Indicators as of August 11
Possible Compiling Entity
Official development assistance in support of the CBD
Brazil proposes this replacement indicator, "Countries implementing the framework on sustainable development/global citizenship education Amount of (public and private) investment in infrastructure as percentage of GDP Proportion of public expenditure on conservation and sustainable use of biodiversity and ecosystems in relation to the public budget"; suggests the suggested indicator to be Tier I.Denmark proposes an alternate indicator, "Official development assistance in support of CBD (OECD RIO markers) as well as domestic flows and flows from the private sector including knowledge transfer.
Brazil proposes an additional indicators, "Proportion of public expenditure on conservation and sustainable use of biodiversity and ecosystems in relation to the public budget."
Cuba suggests eliminating this indicator.China comments that this indicator is a qualitative description, making it difficult to quantify.France comments that the indicator is not sufficient to measure the target.United Kingdom supports this indicator.United States comments that using OECD data is only as good as the inputs themselves and United States and other major donors do not report relevant data on biodiversity.Japan comments that the indicator is not appropriate as it only measures ODA and the target discusses "financial resources from all sources."Australia: Indicator is too limited in covering ODA only. Investment from other sources, including investment by private organisations and businesses, should be considered. Recommend introducing a suitable classification into Balance of Payments to cover official and private development assistance. Risk of underreporting.
Target 15.b Mobilize significant resources from all sources and at all levels to finance sustainable forest management and provide adequate incentives to developing countries to advance such management, including for conservation and reforestation
Suggested Indicators as of August 11
Possible Compiling Entity
Forestry official development assistance and forestry FDI
Ecuador proposes an alternate indicator, "Resources invested in providing adequate incentives for forest conservation."
Germany supports the suggested indicator and would like to add a second indicator, "Public funding for sustainable forest management."
Colombia comments that the suggested indicator should be more accurate in terms of the relation to assistance with sustainability of the forest management.United States asks where this data will be obtained.
Suggested Indicators as of August 11
Possible Compiling Entity
Proportion of detected trade in wildlife and wildlife products that is illegal
Denmark proposes an alternate indicator, "Number of national prosecutions of illegal trade in wildlife."UN Statistical System Organisations propose one priority indicator, "Ratio between detected illegal trafficking and legal trade in wildlife and wildlife products."
Korea comments that it is practically impossible to measure illegal trade volume for imported CITES.United Kingdom comments that it could be difficult to implement such an indicator at the national level.Brazil comments that doubts were raised about the scope of this indicator. Tier IIColombia comments that the indicator does not measure the target as the indicator should reflect the global support.United States comments that since the trade is illegal, it is impossible to know if the measure would be at all accurate.Australia: Data is not available to enable Australia to report against this indicator. Indicator is inadequate; Australia is concerned that detected trade in illegal wildlife products provides an indicator of seizure effort only, not scale of poaching and wildlife trafficking. Resulting risk of underreporting.
OTHER COMMENTS:
Germany suggests two headline indicators for this goal: "Forest area as a percentage of total land area" and "Traffic and settlement area per capita."

Summary of Comments - p. 90 of 265
Goal 16 Promote peaceful and inclusive societies for sustainable development, provide access to justice for all and build effective, accountable and inclusive institutions at all levels
Target 16.1 Significantly reduce all forms of violence and related death rates everywhere.Suggestions for Modifications and Replacement Indicators Suggestions for Additional Indicators Additional Comments Tier
16.1.1 UNODC, WHO Tier I/II
16.1.2 Tier II
Suggested Indicators as of August 11
Possible Compiling Entity
Number of victims of intentional homicide by age, sex, mechanism and where possible type of perpetrator, per 100,000 population
African IAEG-SDG members and Cabo Verde: Partially agreed; exclude disaggregation by mechanism and type of perpetrator.Canada: Focusing on homicide is too narrow, should include "all forms of violence"Germany prefers to expand this indicator to “Number of victims of intentional homicide, assault, sexual violence and attempt per 100,000 population”European Commission (EC): Disaggregation by ethnicity and income quintile are also relevant.UNEP: Indicator has a strong relevance to the target, but can be strengthened further by elaboration on ‘cause’ of conflict to include, inter alia, i.e. “Number of cases and/or victims of environment and natural resource-related conflicts.”
Canada proposes this additional indicator: "Number of victims of assault causing bodily harm by age, sex, mechanism and where possible type of perpetrator, per 100,000 population"France comments that two suggested indicators do not consider the organized violence or permitted by the State, suggested to add an indicator "Existence of independent national human rights institutions (NHRIs) conducting work on the various forms of violence."US, OHCHR and UNODC propose this additional indicator: "Percentage of the population subjected to physical, psychological or sexual violence within the last 12 months;"US and OHCHR also proposes this additional indicator: "Proportion of people that feel safe walking alone around the area where they live."OHCHR proposes the following indicators for this target:(a) Violent crime rate (intentional homicide, assault and sexual violence, including attempts) per 100,000 population (Alternative: Reported conflict deaths per 100,000 population); (b) Reported number of victims of trafficking (within and across countries), slavery, exploitation and forced labour; (c) Proportion of crimes (assault and sexual violence, including attempts) reported to law enforcement agencies; (d) Number of migrants killed, injured or victims of crime while attempting to cross maritime, land or air borders; (e) Incidence of death or physical injury during arrest or apprehension or in custody; (f) Number of verified cases of killing, enforced disappearance, arbitrary detention, assault and torture of journalists, trade unionists or human rights defendersUNFPA proposes these indicators for this target.(a) Intentional homocide rate per 100,000 by sex of the victim, by age group, location/region (b) Percentage of the adult population subjected to physical, psychological or sexual violence within the last 12 months, by sex of the victim, by age group, location/region
China: There are no relevant surveys or data sources in ChinaColombia: This indicator is adequate.Estonia: The indicator seems relevant.Ecuador views that the indicator is difficult to measure and might benefit from a perception base complementary survey (e.g. "Did you know anybody who has been killed"?)Philippines: Easily Feasible, very relevant, and support the indicator.Turkey: Unclear, and clarification is needed.US views that this indicator has strong coneceptual fit with the target, and requests clarification for "type of perpetrator".Australia: Current specification will not measure progress to reduce forms of violence that do not result in homicide. Need to clarify definition of ‘type of perpetrator’ to clearly identify ‘relationship of offender to victim.’SRSG on Violence against Children supports the suggested indicator.UNDP comments that the focus on homicide benefits from ease and reliability of measurement. However the focus is narrow, and the indicator does not measure the domestic or gender-based violenceSG-Envoy on Youth supports the indicator.UN Statistical System Organisations agree with the indicator and request to classifed the suggested indicator as Tier I since standard methodology is widely available.
Conflict-related deaths per 100,000 people (disaggregated by age, sex and cause)
Brazil proposes this replacement indicator, "Policemen dead in conflict and people killed by police"UN Mine Action Service (UNMAS) recommends that the number of deaths due to landmines and other Explosive Remnants of War as one of the 'causes' in diaggregation.UNDP, UNEP and UN-Women recommends this indicator, “ homicide and conflict-related deaths per 100,000 people, disaggregated by sex and age"UNDP comments that the suggested indicator left out the measurement of violence that exists outside of conflict curcumstances, such as domestic violence and gender-based violence.
UN Statistical System Organisations wants to replace the suggested indicator with "Percentage of the population subjected to physical, sexual violence or psychological violence within the last 12 months, by type of violence".
Canada suggests considering an indicator that accounts for violence which doesn't result in death.Ecuador recommends "the number of violent deaths for 100,000 residents" for countries with no conflicts.
UN Statistical System Organisations proposes these indicators as additional indicators: (a) Conflict-related deaths (tier III) (b) Number of migrants killed, injured or victims of crime while attempting to cross maritime, land or aid borders (c) Incidence of death during arrest or apprehension or in custody (d) Number of people displaced due to conflict, war, persecution or human rights violationsUN-Women proposes these additional indicators: (a) "Proportion of women (aged 20-24) who were subjected to sexual violence before age 15 by any persons" and (b) "the Percentage of children aged 1-14 years who experienced any physical punishment by caregivers in the past month, by sex,
Brazil: The conflict concept should be developed in order to clarify its scope. In addition to the classification by geographic area, the conflict situation may be characterized by the type of action undertaken, regardless of the area. Canada: only cover the conflict related deaths, also inquires how "conflict" is defined.Switzerland suggest to also look at the Uppsala Data Conflict Program as an Entity China: The indicator is not applicable to ChinaCabo Verde proposes this indicator to be removed since there´s no methodology to measure, existing data are estimates, and recommends to be a regional indicator, not a global one.Cuba: Remove the indicator. Lacks methodological definition.Ecuador: Disaggregation by ethnicity and/or indigenous group is also relevantItaly: Agree with the indicator, but stress the challenges in data estimationColombia: Not a global indicator.Estonia: The indicator seems relevant.Philippines: Easily Feasible, very relevant, and support the indicator.Mexico: Not suitable; not possible to identify cause of deaths from statistics deaths by homicideTurkey: Unclear, and clarification is needed.US views that this indicator has strong coneceptual fit with the target, and recommends UPPSALA Conflict Database for global coverage.African IAEG-SDG members: Disagreed, and should be removed since there is no methodology to measure; recommend a regional indicator, not global.Australia: Need to clearly define ‘conflict related deaths.’SG-Envoy on Youth supports the indicator.
IISS Armed Conflict Database, the UCDP Battle-Related Deaths Dataset, PRIO Battle-Deaths Data and WHO estimates of deaths by cause.
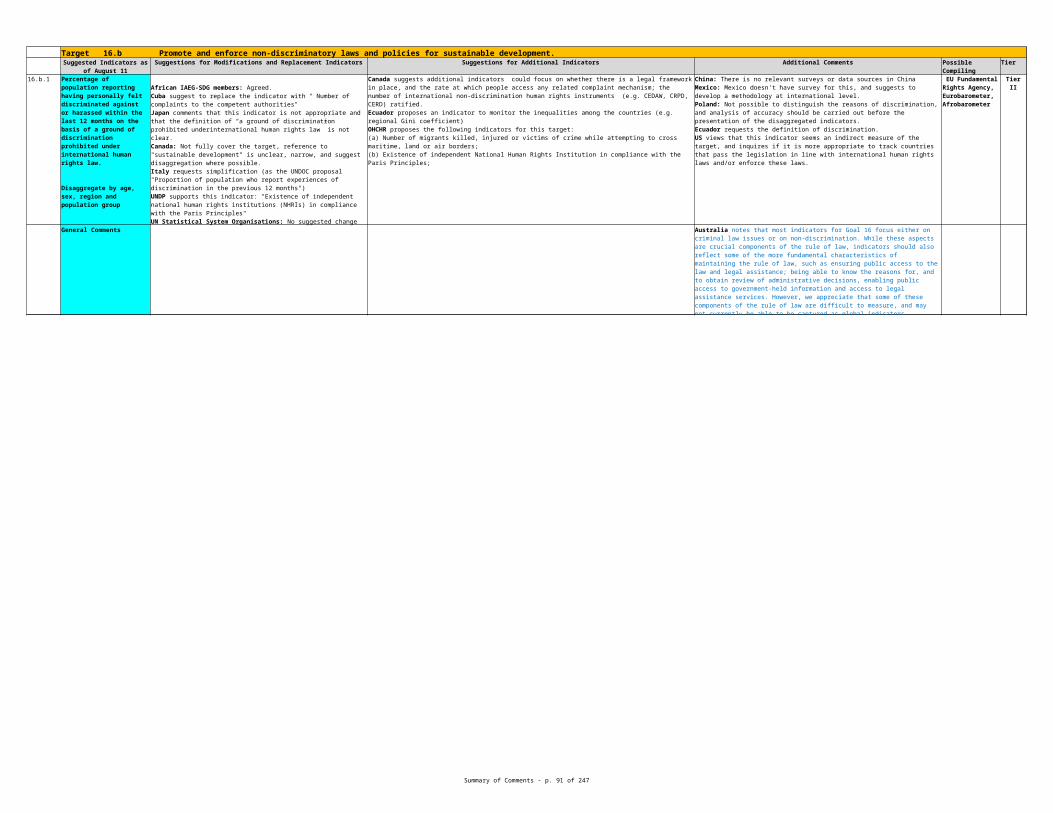
Summary of Comments - p. 91 of 265
Target 16.2 End abuse, exploitations, trafficking and all forms of violence against and torture of children.Suggestions for Modifications and Replacement Indicators Suggestions for Additional Indicators Additional Comments Tier
16.2.1 UNICEF Tier II
16.2.2 UNODC Tier I
Suggested Indicators as of August 11
Possible Compiling Entity
Percentage of children aged 1-14 years who experienced any physical punishment by caregivers in the past month
Canada suggests gender disaggregation, raising age to 18.Cuba: Remove the indicator; having no consistent definition "physical punishment" could lead to different interpretations.Germany proposed to rephrase the indicator to “Percentage of children aged 0-18 years who experienced any physical punishment in the past 12 months”.Switzerland proposes 2 alternative indicators, " Violent death of children 0-19 (data collected by WHO, Global Health Estimates)" and "Number of Children recruited by armed forces (Source UNICEF( Child Soldiers International)"Colombia suggests "Percentage of children victims of maltreatment in the past year"
Canada proposes these additioinal indicators: (a) Annual number of investigated and substantiated cases of reported child maltreatment; (b) annual number of police reported criminal incidents involving child victims of violence; (c) annual homicide rat of children; (d) annual number of reported incidents of online sexual exploitation of children;(e) annual number of children staying in residential facilities for abused women; (f) annual number of children using services from Child Advocacy Centres and Victim ServicesFrance propose this indicator "Existence of effective protection, complaints and redress mechanisms for children aged 1-14 years victims of violence."US and UNFPA proposes this additional indicator: "Percentage of young adults aged 18-24 years who have experienced violence by age 18, by type (physical, psychological and/or sexual)" (or) one of the following two indicators: "Proportion of received complaints on all forms of exploitation, torture or trafficking of children investigated and adjudicated by the national human rights institution, human rights ombudsperson or other mechanisms and the proportion of these responded to effectively by the Government " or "Number of perpetrators of violence against children (including abuse, trafficking, sexual exploitation and forced labor and other exploitations) arrested, adjudicated, convicted and serving sentences (by type of sentence)"UNDP UNICEF and SG-Envoy on Youth: : "Percentage of young women and men aged 18-24 years who experienced sexual violence by age 18"OHCHR: (a) Violent crime rate (intentional homicide, assault and sexual violence, including attempts) per 100,000 population (Alternative: Reported conflict deaths per 100,000 population);(b) Percentage of the population subjected to physical, psychological or sexual violence within the last 12 months; and others that can be found in their submisstion.UNFPA Number of victims of human trafficking per 100,000 people, by sex and age of the victim
UN Statistical System Organisations, UK and SRSG on Violence against Children suggest including this indicator as an additional priority indicator: "Percentage of young adults aged 18-24 years who have experienced violence by age 18, by type (physical, psychological and/or sexual)."
African IAEG-SDG members: Agreed.Canada comments that this indicator is narrow (physical punishment is narrower than "abuse, exploitation, trafficking and all forms of violence")Cabo Verde: The indicator should exclude the non-detected victims. The methodology is unclear and unreliable.China: There is no relevant surveys or data sources in ChinaDenmark comments that data collection method for this indicator would produce unreliable data. EC views that both indicators for this target fail to cover the broader aspects of abuse, exploitation, violence and torture of children. Not clear on definition of "any physical punishedment".France stresses the importance of the avoidance of victims of violence which could lead to incorrect interpretation of data.Philippines: Easily Feasible, very relevant, and support the indicator.US views that this indicator has moderate coneceptual fit with the target, and inquires about data on psychological aggression and whether school authorities are included in "caregivers" category.Australia: Need to clearly define 'caregivers' and 'acts of punishment'. There may be difficulties in obtaining accurate information from household surveys for this age group. Current age group does not capture infants and older children (0-17 year olds). SG-Envoy on Youth supports the indicator.UNICEF supports the indicator.
Number of detected and non-detected victims of human trafficking per 100,000; by sex, age and form of exploitation
African IAEG-SDG members: Partially Agreed; Exclude non-detected victim since methodology is unclear.Australia: Unclear how “non-detected victims” will be measured comprehensively. Suggested revision: 'Number of identified suspected victims of human trafficking, slavery and slavery-like practices per 100,000 population; by sex (or gender), age and form of exploitation.' Brazil suggests this indicator "Number of victims of human trafficking identified by law enforcement officers per 100,000; by sex, age and form of exploitation."Cuba: Remove the indicator; no data for non-detected victims.Canada suggests this indicator: "Annual number of investigations of human trafficking that involve children"UNDP suggested removing “detected” and “non-detected” to avoid confusion and to simplify the measurementUN Statistical Systems Organizations: No suggested change on this indicator, but propose revised classification as tier III.
Brazil: inadequate due to data not available; difficult to estimate "non-detected"Canada: Not fully cover the target.China: The indicator is not applicable to ChinaColombia: Not clear how to measure "non-detected" and necessary to clarify if each country should report national victims in other countries or foreign victims in its country.EC comments that 'non-detected victims' is unclear, and not easy to track illegal activities directly.Japan comments that definitions of “human trafficking” varies from one country to another and a simple comparison would not work.Mexico suggests that source should be prosecutorial authority; verification of source persons is also important for reliable data; NSO involvement should be considered.Philippines: Feasible with strong effort, very relevant, and support the indicator.US views that this indicator has strong coneceptual fit with the target.UK: Could be problematic for the UK; The Quality of the UNODC data varies;Singapore seeks clarifications on definitions of "non-detected victims of trafficking" and "per 100,000"SG-Envoy on Youth supports the indicator.

Summary of Comments - p. 92 of 265
Target 16.3 Promote the rule of law at the national and international levels and ensure equal access to justice for all Suggestions for Modifications and Replacement Indicators Suggestions for Additional Indicators Additional Comments Tier
16.3.1 UNODC Tier II
16.3.2 UNODC Tier II
Suggested Indicators as of August 11
Possible Compiling Entity
Percentage of victims of violence in the previous 12 months who reported their victimization to competent authorities or other officially recognized conflict resolution mechanisms (also called crime reporting rate)
African IAEG-SDG members and Cabo Verde: Disagree and propose this indicator: "Percentage of people who have experienced a dispute, or did not have access and have reported to an adequate resolution mechanism"Cuba suggests to replace the indicator with (a) " Number of complaints to the competent authorities for alleged breaches of law. (b) Percent of people who made complaints to the competent authorities for alleged breaches of law per 100.00 inhabitants , disaggregated by sex and ageUS suggested the following alternatives: (a)"the World Justice Project's Rule of Law Index";(b)"Proportion of those who have experienced a dispute in the past 12 months who have accessed a formal, informal, alternative or traditional dispute resolution mechanism"; (c)"Proportion of those who have accessed such a mechanism for resolution of a dispute in the past 12 months who feel the process was just"; d)"Percentage of people who voice confidence in the judicial system"; (e)"Number of independent judiciaries or legislation created and enforced on independent judiciaries"; f) number of registered and/or active NGOs (per 100,000 persons) involved in the promotion and protection of equal access to justice or ROL";g) Enact laws and regulations to ensure access to courts to seek judicial review of government decisions and access to courts to address violations of environmental laws"; Switzerland proposes 'Perception that rule of law and formal justice mechanism are accessible, affordable and received as fair'
Canada proposes these indicators : (a) number of litigants with access to a lawyer or legal aid; (b) number of self-represented litigants; (c) length of time to resolve disputes against established benchmark; (d) physical access to courts; cost of participating in court cases; (e) access to the laws (i.e. statutes and caselaw); (f) ability of population to understand legal system (intellectual access)US proposed the following additional indicators: " (a) "Proportion of those who have experienced a dispute in the past 12 months and who have accessed a fair formal, informal, alternative or traditional dispute mechanism] Household surveys World Bank (prospective)" (proposed originally by World Bank); (b) "% of people who express confidence in judicial system"
UN Statistical System Organisations proposes to add this additional indicator: "Average period of pre-trial detention"OHCHR proposes the following indicators for this target:(a) Proportion of crimes (assault and sexual violence, including attempts) reported to law enforcement agencies; (b) Number of migrants killed, injured or victims of crime while attempting to cross maritime, land or air borders; (c) Incidence of death or physical injury during arrest or apprehension or in custody; (d) Average period of pre-trial detention; (e) Proportion of international trade/investment agreements with explicit human rights safeguards; (f) Average salary of persons with judicial or public functions as percentage of regulated minimum wage or national median wage for a full-time worker; and other indicators. The full list can be found in their complete submission.UNEP proposes to include an indicator on the existence of efficient national institutions to promote the rule of law and equal access to justice and the number of cases dealt by these institutions during the year and the results of cases showing final decision on the cases.UNEP proposes additional indicator “Number and type of competent national institutions and percentage data on number of cases reported and impact of the outcomes in the past 12 months.”
Canada: Access to justice applies to both criminal and civil law, and reporting crime doesn't indicate whether the justice has been accessed.Cabo Verde comments that this indicator is limited.China: There is no relevant surveys or data sources in ChinaEcuador: Indicator is adequate.France supports this indicatorGermany and Switzerland: Not feasible for social court, and focuses exclusively on violent crime.EC views that both indicators are relevant, but narrow and suggests a complementary survey.Philippines: Easily Feasible, very relevant, and support the indicator.Singapore expresses the uncertainty on whether there is a sufficient direct correlation between the proposed indicator and Rule of Law at national level.Australia: Only some aspects of ‘rule of law’ are measured. Consider the inclusion of indicators relating to ‘access to legal assistance services’. See comments on Targets 16.7 and 16.10. PBSO, UNSG–ROLCRG, UNDP and World Bank point out that the crime report indicator is not subject to any of the expert group disccusions, and thus infer that it does not have the support of a wide range of stakeholders.Inter-Agency-Group on Goal 16, World Bank, UNDP, Commonwealth Secreatariat: The suggested indicator focus only on criminal justice, and does not cover the target adequately.SRSG on Violence against Children supports this suggested indicator.UN Statistical System Organisations: No suggested change on indicator, but proposes revised classification to tier I.Inter-Agency-Group on Goal 16 and UNDP support TST proposal.
Unsentenced detainees as percentage of overall prison population
Cuba: Remove the indicator; doesn't measure the target.UN Statistical System Organisations: No suggested change on indicator, but propose revised classification to tier I.PBSO, EOSG–ROLCRG, UNDP, World Bank, Commonwealth Secretariat comment that the suggested indicators do not cover the target adequately, and suggest an alternative indicator: "Proportion of those who have experienced a dispute in the past 12 months who have accessed a formal, informal, alternative or traditional dispute resolution mechanism and who feel it was just”.
African IAEG-SDG members: Agreed.Cabo Verde: Be sure to distinguish temporary imprisionment inside the legal limits of time, with imprisonment without sentence that already constitutes a crime.China: There is no relevant surveys or data sources in ChinaEcuador: Indicator is adequate.Germany: Not feasible for social court.Philippines: Easily Feasible, very relevant, and support the indicator.Sudan agrees with the indicator.UK supports this indicator.Australia: Does not measure accused persons access to legal representation which is an important measure of equal access to justice. Reason for being held in custody would be important for this indicator. Commonwealth Secretariat supported the suggested indicator.
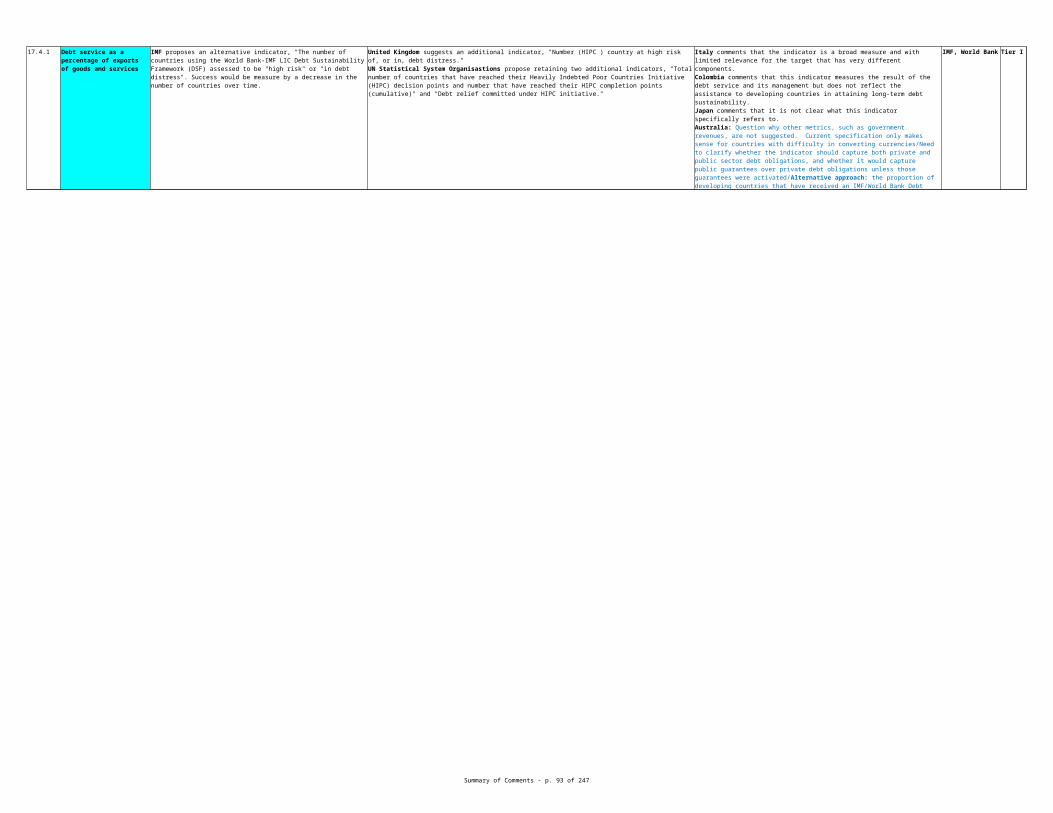
Summary of Comments - p. 93 of 265
Target 16.4 By 2030, significantly reduce illicit financial and arms flows, strengthen the recovery and return of stolen assets and combat all forms of organized crime.Suggestions for Modifications and Replacement Indicators Suggestions for Additional Indicators Additional Comments Tier
16.4.1 Tier II
16.4.2 UNODC Tier III
Suggested Indicators as of August 11
Possible Compiling Entity
Total value of inward and outward illicit financial flows (in current US$).
Italy agrees to maintain this indicator, but stresses the data availability issue. Also suggests to considers the indicator that measure the degree of "success" of the police with respect to criminal organizations.Switzerland proposes an alternative composite indicator that would include data related to information exchange (automatic and others) for tax purposes; stolen assets frozen and returned to foreign juristdictions as reported by countries; ODA tax related activities of technical cooperation, ownership information in taxation and financial market policies, etc . World Bank proposed this indicator: "Value of inward and outward illicit financial flows, by country (US$)."UN Statistical System Organisations proposed to replace the suggested indicator with "Value of illegal economy as percentage of national GDP"
France supports complementary indicator proposed by World Bank , "Criminal investigations and prosecutions focusing on combatting corruption, tax evasion, criminal networks and money laundering : by country (number of cases) and freezing confiscation.recovery and return of proceeds of crime (with details on key crimes) by country"UK suggests including an indicator for "at least 50% of the (40) anti money laundering global ‐recommendations are being implemented satisfactorily".World Bank proposed this additional indicator: "Value (by country) of assets that have been frozen, confiscated, and recovered relating to criminal offences and the cross-border sharing or return of such assets."UN Statistical System Organisationsproposed this indicator as an additional indicator: "Percentage of seized and collected firearms that are recorded and traced, in accordance with international standards and legal instruments"OHCHR proposed the following additional indicator for this target:"Reported number of victims of trafficking (within and across countries), slavery, exploitation and forced labour;"UNEP comments that the illicit financial flows should not be limited only to illicit arms sales and organized crime but also to illegal sales of wildlife/poaching and illegal trade with chemicals, hazardous waste and etc.
African IAEG-SDG members: Agreed.Brazil: Inability to obtain data on illicit flowsSwitzerland comments that global financial integrity data is contestedCuba: Remove the indicator; difficult to measure, and not based on the harmonized methodology to allow comparability for all countries.Canada comments that measuring this indicator may not be accurate, and recommend only countries agree to a standard methodology.China: There is no relevant surveys or data sources in ChinaColombia comments that while the suggested indicator is relevant and adequate, it is not feasible, and requests to establish a definition and method of measurement for "illicit financial flows".EC: Difficult to measure directly illegal and unreported activities.Mexico stresses the data availability issue for this indicator; Harmonization among data sources is important; Verification of data sources is critical for reliable data; NSO involvement should be considered.Philippines: Feasible strong effort, very relevant, and support the indicator.Australia: This measure would provide guidance on the scale of financial flows, but does not provide guidance on whether flows are increasing or decreasing. Nor does it reflect the risks and context of a country; countries with larger financial sectors will inherently have higher illicit financial flows. Expressing financial flows as a percentage of GDP may allow for better incorporation of a country's context and enable better cross-country comparison. IMF stated that data were not available in the IMF databases, and cautioned against attempting to measure the illicit financial flows by using discrepancies in macroeconomic datasets. Suggested that estimates of IFFs should reflect countries' circumstances and be based on admin data.World Bank believed that this indicator was ambiguous and that global data could not be reliably calculated.
IMF?, GFI publishes data for 151 countries."
Percentage of seized and collected firearms that are recorded and traced, in accordance with international standards and legal instruments
UNDP: delete "and collected" from the suggested indicator. US proposes the inclusion of EOSG/RoLU, PBSO, UNDP, UNODC proposal : "Percentage of small arms marked and recorded at the time of import in accordance with international standards"
African IAEG-SDG members: Agreed.Canada comments that the suggested indicator is not adequate.China: There is no relevant surveys or data sources in ChinaEcuador requests the determination of "international standards and legal instruments".Mexico: Harmonization among data sources is important; Verification of data sources is critical for reliable data; NSO involvement should be considered.Australia: Relevance to the indicator is low. Alternative approach: Consider the number of seized firearms. Clarification on the definitions of ‘seized’ and ‘collected’ is needed.UNDP points out that all states import small arms, but not all seize them. Thus the original proposed indicator "Percentage of small arms marked and recorded at the time of import in accordance with international standards" have an advantage since marking at the time of import was a commitment all states had agreed to.EC: Difficult to measure directly illegal and unreported activities.
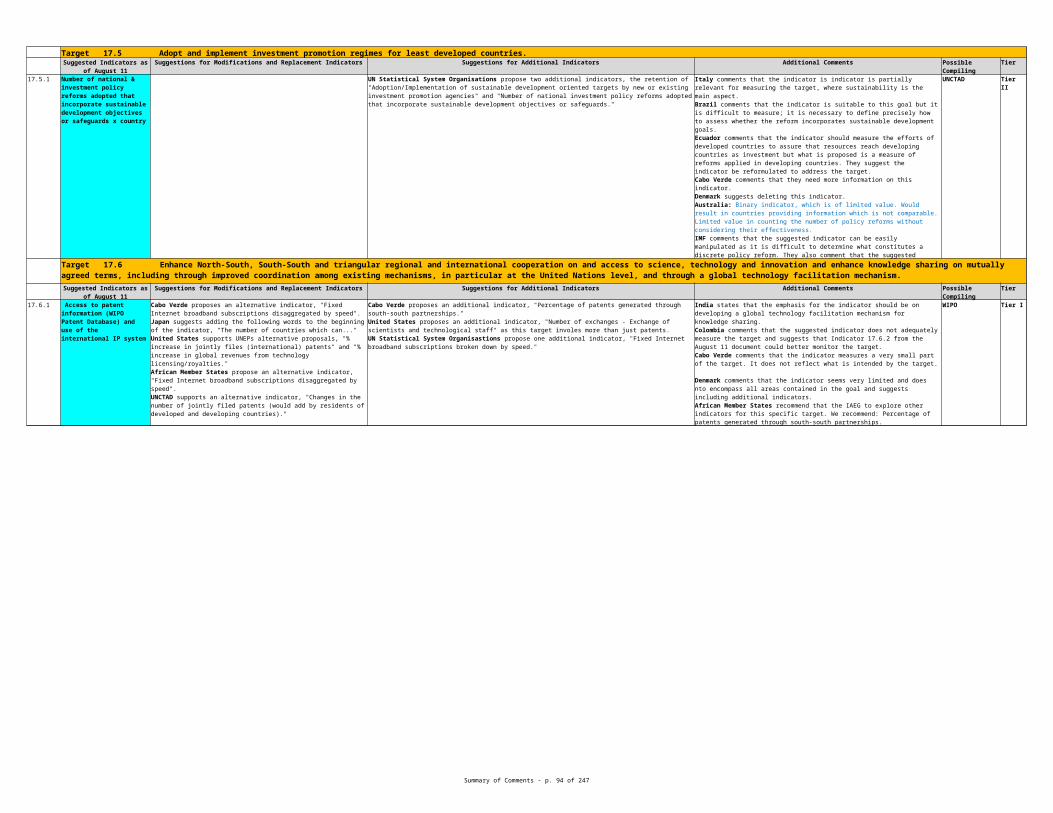
Summary of Comments - p. 94 of 265
Target 16.5 Substantially reduce corruption and bribery in all their forms.Suggestions for Modifications and Replacement Indicators Suggestions for Additional Indicators Additional Comments Tier
16.5.1 UNODC Tier II
Suggested Indicators as of August 11
Possible Compiling Entity
Percentage of persons who had at least one contact with a public official, who paid a bribe to a public official, or were asked for a bribe by these public officials, during the last 12 months. Disaggregate by age, sex, region and population group. This concept of bribery prevalence makes clear that it has to be measured amongst those who had contact with a public official.
African IAEG-SDG members: Disagreed; difficult to get data.Brazil suggests to expland this indicator to include other forms of corruption, and proposes this indicator "Percentage of companies with legal proceedings initiated, sentenced or sanctioned due to harmful actions against the State or due to accounting fraud, in the total of companies"Cuba: Remove the indicator; not possible to measure and lacks methodological definition.Canada proposes this modification: "Percentage of persons who had at least one contact with a public official AND who paid a bribe to a public official, or were asked for a bribe by these public officials, during the last 12 months."Colombia suggests that other types of corruption be included, not just briberyUS comments that the first part of the indicator ("had at least one contact with a public official"), doesn't seem necessary/relevant.
Canada proposes these indicators for consideration:(a) Existence of a legal framework; allocation of resources to law enforcement to permit investigation of corruption cases; (b) training to law enforcement and prosecution officials; (c) existence of a whistleblower regimeOHCHR proposed the following indicators for this target:(a) Percentage of government revenues (including ODA and natural resource concessions) that are publicly available and reflected in national and sub-national budgets;(b) Average salary of persons with judicial or public functions as percentage of regulated minimum wage or national median wage for a full-time worker;(c) Proportion of persons/businesses that did, were asked or were expected to pay a bribe or provide a product or service to a public official;(d) Total value of inward and outward illicit financial flows (in current US$);
China: There is no relevant surveys or data sources in ChinaJapan views that this indicator is not appropriate and is notfeasibility for almost countries.Switzerland comments that this does not take into account higher level corruption (state officials and companies)Singapore supports keeping the original 16.5.1 and 16.5.2 indicators.UK supports this indicator.US views that this indicator has strong coneceptual fit with the target.Australia: Concern about the difficulty in obtaining consistent corruption data, recommend this indicator is reviewed at an appropriate time, given the ongoing work of the Praia Group and the OECD on trust in government. IMF stated that data are not available in the IMF databases.EC views that this indicator focuses only on petty corruption, and fails to cover the other dimension.SG-Envoy on Youth supports the indicator.UN Statistical System Organisations: No suggested change on indicator, but propose revised classification to tier I.

Summary of Comments - p. 95 of 265
Target 16.6 Develop effective, accountable and transparent institutions at all levels.Suggestions for Modifications and Replacement Indicators Suggestions for Additional Indicators Additional Comments Tier
16.6.1 Tier I
16.6.2 UNCAC Secretariat
Suggested Indicators as of August 11
Possible Compiling Entity
Primary government expenditures as a percentage of original approved budget
Canada: Unclear how measure on public confidence and trust aligns with the indicator of 'actual primary expenditures per sector'. would need revision to include this measure. Ecuador: Not related to the target and suggest its removalItaly: Partial relevance, but better for measuring the efficiency of budget policy than “accountable and transparent institutions” UNDP requested that the suggested indicator "Primary government expenditures as a percentage of original approved budget" to be specified (ie. expenditures without interest).UN Statistical System Organisations proposed to replace the suggested indicator with "Share of people reporting a high degree of trust in different public institutions."
African IAEG-SDG members and Cabo Verde propose this additional indicator: "Proportion of population satisfied with their last experience of public services, disaggregated by servisse"EC proposes these additional indicators: (a) the proportion of public revenues transferred to the sub-national level (Decentralisation) and (b) the number of countries with legislation to promote participatory mechanisms related to local-decision making, including urban planning.IMF proposes two potential new indicators: (a) percentage of public sector expenditure covered by accrual accounting; and (b) percentage of public sector expenditure subject to audit by independent bodies.UNDP suggests this indicator which focus on the transparency of the budgeting process: (a) “Proportion of the national budget planning and spending data made publicly available”. Also proposed these additional indicators which capture accountability and transparancy aspects: (b) "Public advertising of all government procurement (national and subnational)";(c)" Trust in local government institutions: Percentage of people saying that they trust/ have confidence in national and sub-national governments".UN Statistical System Organisations proposes this indicator as an additional indicator: "Percentage of recommendations to strengthen national anti-corruption frameworks (institutional and legislative) implemented, as identified through the UNCAC Implementation Review Mechanism"OHCHR proposes the following indicators for this target:(a) Proportion of crimes (assault and sexual violence, including attempts) reported to law enforcement agencies;(b) Incidence of death or physical injury during arrest or apprehension or in custody;(c) Average period of pre-trial detention; and other indicators that are included in their complete submission.
African IAEG-SDG members: Agreed.Germany requests that the definition of the indicator should be speficified in general. Otherwise indicator 1 should be replaced with or combined with an indicator focusing on the interplay between the executive, legistive and external control (PEFA indicator P-26)Turkey comments that this indicator is relevant.US: World Bank Goverance Matters Index may be better source, and moderate conceptual fit with the target.Colombia comments that while the indicator covers the planning and management capacity, it does not completely cover the target, and suggests it to be complemented with information about transparancy.Sudan agrees with the indicator.IMF: The suggests indicator did not address the accountability issues.World Bank supports this suggested indicator.SG-Envoy on Youth supports the indicator.
PEFA Secretariat (World Bank);
Percentage of recommendations to strengthen national anti-corruption frameworks (institutional and legislative) implemented, as identified through the UNCAC Implementation Review Mechanism.
Brazil proposes this indicator "Percentage of countries with legislation establishing that access to public information is mandatory"Ecuador called for an alternative indicator addressing the confidence level place on public institutions, instead of this suggested indicator.Inter-Agency-Group on Goal 16, UNDP and SG-Envoy on Youth recommended this indicator instead, "Proportion of population satisfied with their last experience of public services satisfied with quality public services".UNEP prefers "Proportion of population satisfied with the quality of public services, disaggregated by service." World Bank suggested disaggregation by (a) legislative changes, (b) establishing new institutions (c) establishing new systems, and (d) capacity building.
Switzerland comments that the two indicators do not take into the account the access to services and the human right/ rights violations by state institutions: Suggest to add: Accepted, ratified and implemented international human rights treaties into national laws and policiesAfrican IAEG-SDG members and Cabo Verde: Can be measured by UNCAC, no need to be a SDG indicator.China: There is no relevant surveys or data sources in ChinaGermany commented that indicator 2 is not suitable as it targeted only the implemented recommendations without accessing their content or prior level of corruption. The suggested indicator also belonged in 16.5 and 16.4.Japan recommends to further consider how to weight the recommendations appropriately (as not all would be equally important)Mexico: Not part of INEGI-Mexico; Clearly defining the variables and harmonization of data sources among countries are importantSingapore does not agree with the indicator.US: Strong conceptual fit with the target, proposes to include other reviews such as Anti-Bribery Convention, COE GRECO, Inter-American Convention against Corruption, etc.Australia: Does not properly measure ‘effective accountability’ and does not balance the percentage of recommendations implemented with the number of overall recommendations. IMF: The suggested indicator did not address the accountability issues.Inter-Agency-Group on Goal 16: The suggested indicator belonged under 16.5UNDP: Narrow focus on implementation of anti-corruption framework recommendations does not capture the real level of efficiency, accountability and transparency of public institutions.World Bank supported this suggested indicator.

Summary of Comments - p. 96 of 265
Target 16.7 Ensure responsive, inclusive, participatory and representative decision-making at all levels Suggestions for Modifications and Replacement Indicators Suggestions for Additional Indicators Additional Comments Tier
16.7.1 Tier II
16.7.2 UNFPA Tier III
Suggested Indicators as of August 11
Possible Compiling Entity
Proportions of positions (by age, sex, disability and population groups) in public institutions (national and local legislatures, public service, and judiciary) compared to national distributions.
African IAEG-SDG members: Disagreed and proposed this indicator "Turnout as a share of voting-age population in national elections".Italy requests clear definition for this indicator.UN Statistical System Organisations proposes this indicator as an additional priority indicator "Proportion of countries that address young people’s mulisectoral needs with their national development plans and poverty reduction strategies as additional indicator"IMF proposes two new indicators: (a) percentage of government units publishing a detailed account of the implications of the budget for different demographic groups; and (b)percentage of government units (constituencies) providing citizens with a formal voice in budget deliberations
African IAEG-SDG members propose this additional indicator "Proportion of public service positions held by women and members of target groups."Canada suggested following additional indicator, "Proportion of women on boards of public and private institutions and of senior positions (e.g., CEO) held by women."EC proposes this additional indicator: "number of countries with institutionalised spaces for multi-stakeholder dialogues on national and local decision-making and existence of independent monitoring and feedback mechanisms"US proposes the following indicators for that: (a) "Number of times in which the public and civil society organizations are invited to comment on policy and legal initiatives, compared to the number of policy and legal initiatives in the last twelve months"; (b) "Proportions of the public and civil society organizations that believe that the government provides them adequate time, opportunity, and information to comment on policy and legal initiatives. (survey/poll) "; (c) "Proportions of the public and civil society organizations that believe that the government genuinely considers their comments on policy or legal initiatives.(survey/poll)";World Bank proposes these indicators:(a) "Percentage of parliamentary enquiries that hold open hearings with public submissions."; (b) "Percentage of decisions in parliament and committee where votes of individual members are made public."UN Statistical System Organisations and OHCHR propose these additional indicators: (a)"Turnout as a share of voting-age population (disaggregated by sex, age, disability and other population groups) in and frequency of national elections or referenda" (b) "Proportion of non-governmental organisations, trade unions and other associations consulted about government decisions, strategies and policies in their sector"OHCHR proposes additional indicators that are in their complete submission.UNFPA (and supported by SG-Envoy on Youth) proposes 4 indicators that can be seen in their complete submission. UNEP proposes to add "‘Existence of legal base for ensuring effective responsive, inclusive and participatory and representative decision-making”"
Brazil: The information contained in this indicator can be better assessed through a qualitative survey, including the analysis of the documentation related to the policies in this area. Measurement revealed inappropriate.Denmark: It is unclear if it possible to obtain specific data regarding persons with disabilities.China: There is no relevant surveys or data sources in ChinaEstonia: Indicator is relevant for measuring the target.Mexico: data on all levels will be available over a 5 years periodUK supports this indicator.IMF: the suggested indicator could be complemented with data on citizens’ informed participation in decisions regarding the government units’ budget.Germany and the World Bank support the suggested indicator.SG-Envoy on Youth supports the indicator.
UN Women, OHCHR, IPU.
Proportion of countries that address young people's multisectoral needs with their national development plans and poverty reduction strategies
African IAEG-SDG members: Disagreed; do not recommend as it is methodologically too complex.Cabo Verde does not recommend this indicator.Ecuador: Not relvant and suggest its removal.Switzerland proposes "Perception of inclusion in the political processes (national and local)"Estonia proposes "Open access to apply to jobs in the public sector". Germany and Switzerland believe that the suggested indicator does not meet the targe by focusing exclusively on the needs of young people, and recommends that all groups should be reflected when measuring the target.US proposes this alternative indicator: "Percentage of population who believe decision-making is inclusive and responsive.ion-making" or an indicator addressing the participation in environmental decisions (e.g. the Environmental Democracy Index's indicators)Inter-Agency-Group on Goal 16 and UNDP recommended this indicator: "Turnout as a share of voting-age population in national elections".
China: The indicator cannot be quantified as they have been defined qualitativelyEstonia: Does not measure sufficiently; referred database in unknown.Mexico: data for this indicator can be better assessed through qualitative survey; measurement revealed inappropriate.Mexico: INEGI-Mexico doesn't produce this data; defining variables and harmonizing the data sources are important.US: Weak conceptual fit with the target.Australia: Does not adequately reflect fundamental characteristics of maintaining ‘rule of law’. Consider the inclusion of indicators relating to legislation and government frameworks which enable people to seek and obtain (i) information about and (ii) external review of administrative decisions that affect them. IMF: the suggested indicator is feasible with data on citizens’ informed participation in decisions regarding the government units’ budget.Cabo Verde, Inter-Agency-Group on Goal 16 and UNDP: The reference to "proportion of countries" does not make sense.UNDP: The suggested indicator is not a national indicator. It collects data only from strategies, and does not measure implementation.SG-Envoy on Youth supports the indicator.

Summary of Comments - p. 97 of 265
Target 16.8 Broaden and strengthen the participation of developing countries in the institutions of global governance.Suggestions for Modifications and Replacement Indicators Suggestions for Additional Indicators Additional Comments Tier
16.8.1 Tier I
Target 16.9 By 2030, provide legal identity for all, including birth registration.Suggestions for Modifications and Replacement Indicators Suggestions for Additional Indicators Additional Comments Tier
16.9.1 Tier I
Suggested Indicators as of August 11
Possible Compiling Entity
Percentage of members or voting rights of developing countries in international organizations.
Estonia proposes to separate this indcator in two indices : 1) Percentage of members of developing countries in international organizations. 2) Percentage of members of developing countries with voting rights in international organizations.US recommends dropping this indicator in favor of more transparent measure.UN Statistical System Organisations: No suggested change on indicator.
OHCHR proposed the following indicator for this target: "Percentage of voting rights in international organizations of developing countries;"
African IAEG-SDG members: Agreed.Colombia suggests definiting this indicator in relative terms (national GDP as a percentage of global GDP) and including the developed countries.Mexico: Data available from UN and Ministry of Foreign Affairs; important to harmonize data sources among countries.EC: Difficult to aggregate, since rules vary. Interlink with 10.6Philippines: Feasible with strong effort, very relevant, and support the indicator.UK supports this indicator.Sudan agrees with the indicator.Australia: This indicator could be used as a partial indicator for the target, however there may be limitations. Representation and voice can also be achieved through other means.UNEP comments that the proposed indicator is legally proper and that the overall response to the target would be the reform of the UN system.
United Nations/DESA.
Suggested Indicators as of August 11
Possible Compiling Entity
Percentage of children under 5 whose births have been registered with civil authority
African IAEG-SDG members: Partially agreed; request to disaggregate by age (under 1 and under 5)Switzerland proposes to add "by gender" to the indicator.Cabe Verde proposes to disaggregate by age (under 1 and under 5)Inter-Agency-Group on Goal 16, UNFPA, SG-Envoy on Youth and World Bank proposes this modified indicator: "Percentage of children under 1 whose births have been registered with civil authority".UN Statistical System Organisations proposes to disaggregate by age: "Percentage of children under 5 whose births have been registered with civil authority, by age"DSPD/DESA suggests adding disaggregation by disability, which reads "Percentage of children under 5 whose births have been registered with civil authority, disaggregated for children with/without disabilities"
OHCHR proposes the following indicators for this target:(a) Percentage of adult population holding an identity document which allows them to access public services and entitlements, conclude a lease, open a bank account, and enter and leave their country of residence;(b) Percentage of children whose births have been registered with a civil authority;
China: There is no relevant surveys or data sources in ChinaEstonia: Not relevant in Estonia (all the births are registred in Estonia), but in general the indicator is suitable for the target.Germany: The indicator only focuses on one single aspect.EC: Dififcult to measure, and include a measure for stateless populations.Philippines: Easily Feasible, very relevant, and support the indicator.Turkey: this indicator is relevant.UK supports this indicator.SRSG on Violence against Children strongly supported this suggested indicator.World Bank: The UN Principles and Recommendations for a Vital Statistics System states that birth registration should be "immediate" (where defined, this is usually 7-30 days); up to 12 months is viewed as "late registration" and beyond 12 months is "delayed registration."UNICEF supports the indicator.
UNICEF, WHO, WB, UNSD, UNFPA

Summary of Comments - p. 98 of 265
Target 16.10 Ensure public access to information and protect fundamental freedoms, in accordance with national legislation and international agreements.Suggestions for Modifications and Replacement Indicators Suggestions for Additional Indicators Additional Comments Tier
16.10.1 Tier I
Target 16.a Strengthen relevant national institutions, including through international cooperation, for building capacity at all levels, in particular in developing countries, to prevent violence and combat terrorism and crime.
Suggestions for Modifications and Replacement Indicators Suggestions for Additional Indicators Additional Comments Tier
16.a.1 UNODC Tier II
Suggested Indicators as of August 11
Possible Compiling Entity
Number of verified cases of killing, kidnapping, enforced disappearance, arbitrary detention and torture of journalists, associated media personnel, trade unionists and human rights advocates in the previous 12 months
African IAEG-SDG members: Disagree and do not recommend; propose this indicator instead "Percentage of population who believe they can express political opinion without fear"Brazil: Indicator doesn't refelct target; recommends this indicator "Percentage of population with internet access"Cuba replace with "Number of countries with national plans or mechanisms for the promotion and protection of all human rights for all."Canada: Too narrow, access to information and "fundamental freedoms" are both broader than open media/ freedom of expressionEcuador: Not relevant and called for an alternative indicator.US proposes to modify the target as follows: Number of reported cases of killing, kidnapping, enforced disappearance, arbitrary detention, arbitrary blocking or shutting down of activities, and torture of journalists, associated media personnel, trade unionists, staff of civil society organizations, and human rights or governance advocates in the previous 12 months Australia: Focuses on criminal law or non-discrimination. Consider including access to laws and legal information. For example, possible indicators could be: (1) Percentage of people who are able to access current laws and legal information relevant to their jurisdiction (2) Percentage of people who are able to access assistance from legal service providers(3) Percentage of current laws available free of charge to the general public (for example online or in public libraries) (4) Existence of legislation which provides the public with a right of access to Government-held informationWorld Bank calls for two indicators (a) "Level of implementation of legislative guarantees and mechanisms for public access to information, including but not limited to information pertinent to each and all of the Sustainable Development Goals and protection of fundamental freedoms"; (b) current suggested indicator as the corollary indicator.
African IAEG-SDG members also propose this additional indicator "Percentage of actual government budget, procurement, revenues and natural resource concessions that are publicly available and easily accessible ( BBA )"Canada proposes the following indicators: (a) Presence of legislative framework that protects fundamental freedoms and recourse mechanism when they are violated; (b) length of time to participate in recourse mechanism; (c) percentage of public access to government information requests that are accepted or deniedUS proposes additional indicators for the “fundamental freedoms” component:(a) Number of times in which UN Special Rapporteurs report violations of fundamental freedoms, including freedoms of association, expression, and assembly, (b) Percentage of recommendations to strengthen fundamental freedoms—including freedoms of association, assembly, and expression—that were implemented, as identified through the UN Human Rights Council Universal Periodic Review, (c) Perception of the public and of civil society organizations on whether they can pursue issues of interest, including human rights and governance, in the public arena without fear of government retribution. (Surveys/polls; Disaggregated by age, sex, gender), (d) Adoption and implementation of access to information laws and regulations and the number and percentage of requests for information fulfilled in the past 12 months. (though it is difficult to measure), (e) Existence of enabling laws, policies, and practices with regard to the freedoms of expression, association, and assemblyIMF proposes 4 additional indicators that can be found in complete submission.OHCHR proposes 6 indicators that can be found in their full submission.UNFPA propose this indicator: "Existence of independent national human rights institutions (OHCHR proposal)"UNEP comments that the proposed indicators are not sufficient and limited, and proposes “Existence and implementation of legal and institutional instruments and practical tools for ensuring public access to information and protect fundamental freedoms” as an indicator, and expresses support for using internationally respected indexes such as Environmental Democracy Index, Human Rights Index, etc.UNESCO and UN Statistical System Organisations proposes this additional indicator: "Existence and implementation of constitutional, statutory and/or policy guarantees for public access to information. "
China: Data reflecting this aspect is difficult to obtain in China.Colombia comments that this indicator is not adequate, and suggests including the indicator related to diversification of media and interlink with internet access.Switzerland comments that the indicator focus to much on transparency of criminal prosecution / justice. The scope of the target is much broader (Access to information / Gouvernanz / protection of fundamental freedoms). we suggest to replace the sugguest indicator by an indicator on fundamental frredoms like freedom of expression, freedom of press, freedom of assembly.Mexico: Defining variables and harmonizing the data sources are important; verification of data sources for reliable data is important; NSO involvement should be considered.Turkey: Unclear, and clarification is needed.UNESCO supports the suggested indicator.UN Statistical System Organisations: No suggested change on indicator.The IMF also commented that the two indicators discussed on fiscal transparency—“Percentage of actual government budget, procurement, revenues and natural resource concessions that are publicly available and easily accessible” and “Public access to key fiscal information”—are defined very broadly, making it difficult to assess the degree to which public access to information translates into more effective and transparent decision-making.
OHCHR, UNESCO, ILO, ITUC, IFJ.
Suggested Indicators as of August 11
Possible Compiling Entity
Percentage of victims who report physical and/or sexual crime to law enforcement agencies during past 12 months Disaggregated by age, sex, region and population group
African IAEG-SDG members: Partially agreed, need more re-thinkingCanada: Narrow and not fully cover the target, does not measure the capacity building, terrorism and crime aspect, link between violence and prevention is unclear, suggest gender disaggregation.Ecuador: Not relevant and called for an alternative indicator.Mexico suggests to replace it with "Percentage of victims who report physical and/or sexual crime to law enforcement agencies during past 12 months."UNDP proposed alternative indicators (a) “number of verified crime, terror acts or violence that were prevented by national authorities or through international cooperation” or (b) “percentage of population protected through timely prevention of crime, terror acts or violence by national authorities or through international cooperation”World Bank proposed this indicator: "Percentage of victims of violence in the previous 12 months who reported their victimization to competent authorities or other officially recognized conflict resolution mechanisms (also called crime reporting rate)."UN Statistical System Organisations proposed to add this priority indicator: "Level of compliance of national human rights institutions with the Paris Principles"
Canada proposes the following alternative indicators: (a) existence of a regulatory/egal framework;(b) # of officials (police, prosecution, judicial, etc.) trained; (c) # of convictions for violent crimes, terrorism, and related crimes; (d) speed at which cases addressing violent crimes or terrorism are disposed of by the courtsUS proposes these additional indicators:(a) Confidence in police and judicial services. (b) % of people who feel safe walking at night (proposed under 16.1 as well)OHCHR proposed the following indicator for this target: "Existence of independent National Human Rights Institution in compliance with the Paris Principles;"
China: There is no relevant surveys or data sources in ChinaColombia comments that this indicator is not adequate, and suggests including the indicator related to cooperation for building capacities for preventing violence and combating terrorism and crime.Germany and Switzerland view that the important elements of targets were not covered by the indicator (e.g. international cooperation and fight against terrorism), and suggests looking at the expenditureUK: would be problematic to implement domestically; the definition needs to be tightened (physical crime, sexual crime, etc); Disaggregation might be problematic depending in sample size of the surveyUS: Weak conceptual fit with the target, and doesn't capture the target.Australia: Noting similarity to Target 16.3. Reasonably good indicator, but only provide a limited picture of capacity of national institutions to prevent violence and combat terrorism and crime. UNDP and World Bank: This indicator does not capture the full range of concepts and is only a proxy.

Summary of Comments - p. 99 of 265
Target 16.b Promote and enforce non-discriminatory laws and policies for sustainable development.Suggestions for Modifications and Replacement Indicators Suggestions for Additional Indicators Additional Comments Tier
16.b.1 Tier II
General Comments
Suggested Indicators as of August 11
Possible Compiling Entity
Percentage of population reporting having personally felt discriminated against or harassed within the last 12 months on the basis of a ground of discrimination prohibited under international human rights law. Disaggregate by age, sex, region and population group
African IAEG-SDG members: Agreed.Cuba suggest to replace the indicator with " Number of complaints to the competent authorities"Japan comments that this indicator is not appropriate and that the definition of “a ground of discrimination prohibited underinternational human rights law” is not clear.Canada: Not fully cover the target, reference to "sustainable development" is unclear, narrow, and suggest disaggregation where possible.Italy requests simplification (as the UNDOC proposal "Proportion of population who report experiences of discrimination in the previous 12 months")UNDP supports this indicator: "Existence of independent national human rights institutions (NHRIs) in compliance with the Paris Principles"UN Statistical System Organisations: No suggested change on indicator.
Canada suggests additional indicators could focus on whether there is a legal framework in place, and the rate at which people access any related complaint mechanism; the number of international non-discrimination human rights instruments (e.g. CEDAW, CRPD, CERD) ratified. Ecuador proposes an indicator to monitor the inequalities among the countries (e.g. regional Gini coefficient)OHCHR proposes the following indicators for this target:(a) Number of migrants killed, injured or victims of crime while attempting to cross maritime, land or air borders;(b) Existence of independent National Human Rights Institution in compliance with the Paris Principles;
China: There is no relevant surveys or data sources in China Mexico: Mexico doesn't have survey for this, and suggests to develop a methodology at international level.Poland: Not possible to distinguish the reasons of discrimination, and analysis of accuracy should be carried out before the presentation of the disaggregated indicators.Ecuador requests the definition of discrimination.US views that this indicator seems an indirect measure of the target, and inquires if it is more appropriate to track countries that pass the legislation in line with international human rights laws and/or enforce these laws.
EU Fundamental Rights Agency, Eurobarometer, Afrobarometer
Australia notes that most indicators for Goal 16 focus either on criminal law issues or on non-discrimination. While these aspects are crucial components of the rule of law, indicators should also reflect some of the more fundamental characteristics of maintaining the rule of law, such as ensuring public access to the law and legal assistance; being able to know the reasons for, and to obtain review of administrative decisions, enabling public access to government-held information and access to legal assistance services. However, we appreciate that some of these components of the rule of law are difficult to measure, and may not currently be able to be captured as global indicators.

Summary of Comments - p. 100 of 265
Goal 17 Strengthen the means of implementation and revitalize the global partnership for sustainable development Target 17.1 Strengthen domestic resource mobilization, including through international support to developing countries, to improve domestic capacity for tax and other revenue collection.
Suggestions for Modifications and Replacement Indicators Suggestions for Additional Indicators Additional Comments Tier
17.1.1 IMF/OECD Tier I
Suggestions for Modifications and Replacement Indicators Suggestions for Additional Indicators Additional Comments Tier
17.2.1 OECD Tier I
Target 17.3 Mobilize additional financial resources for developing countries from multiple sources.Suggestions for Modifications and Replacement Indicators Suggestions for Additional Indicators Additional Comments Tier
17.3.1 Total Capital Inflow (TCI) IMF, World Bank Tier I/III
Suggestions for Modifications and Replacement Indicators Suggestions for Additional Indicators Additional Comments Tier
Suggested Indicators as of August 11
Possible Compiling Entity
Composition of Tax Revenues (by sources), including revenues derived from environmental taxes, and as % of GDP
Brazil proposes this alternative replacement indicators1) environmental taxes as % of GDP; 2) Rent on natural resources as % of GDP;Cabo Verde and United States propose an alternative indicator, "Total tax revenue/GDP".African Member States propose an alternative indicator, "Total tax revenue/GDP" because the current indicator is too detailed and countries do not have to report composition of their tax revenues.IMF suggests replacing the suggested indicator with "Total government revenue as a percent of GDP" or "total government revenues raised per capita."World Bank suggests "Domestically generated revenues (general government) as a percentage of GDP" as a replacement indicator.
Brazil proposes two alternative indicators, "environmental taxes as % of GDP" and "Rent on natural resources as % of GDP."United Kingdom proposes an additional indicator, "Proportion of domestic budget funded by domestic taxes."Germany suggests as an additional indicator nationally defined domestic targets to enhance domestic revenues or a combination of selected qualitative indicators taken from TADAT could be used.UN Statistical System Organisations propose two additional indicators, "Total Tax/GDP" and "Total Tax per capital - $ value."UNCDF proposes an additional indicator, "Percentage of payments that are made electronically, by payment value and number of payments."
Brazil: It is not a single indicator, it is a table. Also, it focus only in tax revenue, which depends on other factors such as social security schemes of countries, which are not related to the target. Excludes other revenues that are related to sustainable development, such as royalties.Colombia comments that the indicator does not completely cover the target and should include information about support to develoing countries, mechanisms for Automatic Information Exchagne between countries and its impact on tax collection.France supports the suggested indicator.Germany comments that tax-to-GDP ratio is a good starting point but using it as a single quantitative indicator is problematic.Denmark comments that a precise descriptin of which taxes sources should be reported on is needed.Portugal comments that an increase in this indicator does not necessarily mean an improvement in domestic capacity for tax. This indicator does not have a clear interpretation towards its target and towards sustainable development and therefore should be dropped or replaced.Australia: Concerns regarding aiming for an optimal composition of tax revenue by source/ Unclear about what the appropriate benchmark/Definition of ‘environmental taxes’ is unclear/There are limitations in using a tax/GDP ratio in measuring tax performance, especially where there are challenges in sourcing accurate revenue and GDP figures. Alternative approach: an indicator based on the IMF’s Tax Administration Diagnostic Assessment Tool. Alternatively, a metric of ODA/OOF/revenue plus a comparison of revenue to expenditure to establish whether a country can raise sufficient revenue for its expenditure needs on its own, without the support of other countries. IMF comments that indicators should cover all revenue, not only tax revenue, and that that the indicator should acknowledge country circumstances, rather than a “one-size-fits-all” approach. Namely, as noted in the relevant UN paper, countries with a revenue to GDP ratio below 20 percent should aim to achieve this goal, and countries with the ratio above 20 percent should increase the ratio to the extent possible. UNCEEA comments that the development of this indicator should take into account relevant methodology used in the SEEA and SNA.
Target 17.2 Developed countries to implement fully their official development assistance commitments, including the commitment by many developed countries to achieve the target of 0.7 per cent ODA/GNI to developing countries and 0.15 to 0.20 per cent of ODA/GNI to least developed countries; ODA providers are encouraged to consider setting a target to provide at least 0.20 per cent of ODA/GNI to least developed countries.
Suggested Indicators as of August 11
Possible Compiling Entity
Net ODA, total and to LDCs, as percentage of OECD/Development Assistance Committee (DAC) donors' gross national income (GNI)
UN Statistical System Organisations propose a replacement indicator, "ODA Gap" and retaining the suggested indicator as an additional indicator.
Ecuador comments that the indicator is a global level indicator and not one calculated at the national level.United Kingdom supports this indicator.UNCTAD supports the proposal for 'ODA gap' as it is straight-forward and shows neatly the shortfall in DAC ODA.
Suggested Indicators as of August 11
Possible Compiling Entity
Brazil proposes replaces the suggested indicator with "Foreign direct investment."
African Member States recommend an additional indicator, ""Volume of remittances (USD) / GDP".UN Statistical System Organisations propose an additional indicator, "Foreign Direct Investments as % of total FDI + ODA."
Italy comments that the indicator is a broad measure and with limited relevance for the target that has very different components. Ecuador comments that the indicator should differentiate the origins of inflows per country and the concept of inflow (Direct Foreign Investment, transfers, etc).Japan comments that the definition of "Total Capital Inflow" is not clear.Australia comments that the indicator does not cover all sources of finance. Alternative approach: metric constructed from balance of payments data.
Target 17.4 Assist developing countries in attaining long-term debt sustainability through coordinated policies aimed at fostering debt financing, debt relief and debt restructuring, as appropriate, and address the external debt of highly indebted poor countries to reduce debt distress.
Suggested Indicators as of August 11
Possible Compiling Entity

Summary of Comments - p. 101 of 265
17.4.1 IMF, World Bank Tier IDebt service as a percentage of exports of goods and services
IMF proposes an alternative indicator, "The number of countries using the World Bank-IMF LIC Debt Sustainability Framework (DSF) assessed to be "high risk" or "in debt distress". Success would be measure by a decrease in the number of countries over time.
United Kingdom suggests an additional indicator, "Number (HIPC ) country at high risk of, or in, debt distress."UN Statistical System Organisastions propose retaining two additional indicators, "Total number of countries that have reached their Heavily Indebted Poor Countries Initiative (HIPC) decision points and number that have reached their HIPC completion points (cumulative)" and "Debt relief committed under HIPC initiative."
Italy comments that the indicator is a broad measure and with limited relevance for the target that has very different components.Colombia comments that this indicator measures the result of the debt service and its management but does not reflect the assistance to developing countries in attaining long-term debt sustainability.Japan comments that it is not clear what this indicator specifically refers to.Australia: Question why other metrics, such as government revenues, are not suggested. Current specification only makes sense for countries with difficulty in converting currencies/Need to clarify whether the indicator should capture both private and public sector debt obligations, and whether it would capture public guarantees over private debt obligations unless those guarantees were activated/Alternative approach: the proportion of developing countries that have received an IMF/World Bank Debt Sustainability Analysis in the last (e.g.) 5 years.

Summary of Comments - p. 102 of 265
Target 17.5 Adopt and implement investment promotion regimes for least developed countries.Suggestions for Modifications and Replacement Indicators Suggestions for Additional Indicators Additional Comments Tier
17.5.1 UNCTAD Tier II
Suggestions for Modifications and Replacement Indicators Suggestions for Additional Indicators Additional Comments Tier
17.6.1 WIPO Tier I
Suggested Indicators as of August 11
Possible Compiling Entity
Number of national & investment policy reforms adopted that incorporate sustainable development objectives or safeguards x country
UN Statistical System Organisations propose two additional indicators, the retention of "Adoption/Implementation of sustainable development oriented targets by new or existing investment promotion agencies" and "Number of national investment policy reforms adopted that incorporate sustainable development objectives or safeguards."
Italy comments that the indicator is indicator is partially relevant for measuring the target, where sustainability is the main aspect.Brazil comments that the indicator is suitable to this goal but it is difficult to measure; it is necessary to define precisely how to assess whether the reform incorporates sustainable development goals.Ecuador comments that the indicator should measure the efforts of developed countries to assure that resources reach developing countries as investment but what is proposed is a measure of reforms applied in developing countries. They suggest the indicator be reformulated to address the target.Cabo Verde comments that they need more information on this indicator.Denmark suggests deleting this indicator.Australia: Binary indicator, which is of limited value. Would result in countries providing information which is not comparable. Limited value in counting the number of policy reforms without considering their effectiveness. IMF comments that the suggested indicator can be easily manipulated as it is difficult to determine what constitutes a discrete policy reform. They also comment that the suggested indicator does not take effectiveness into account and reforms may be approved, but may not be well-designed or well-implemented.
Target 17.6 Enhance North-South, South-South and triangular regional and international cooperation on and access to science, technology and innovation and enhance knowledge sharing on mutually agreed terms, including through improved coordination among existing mechanisms, in particular at the United Nations level, and through a global technology facilitation mechanism.
Suggested Indicators as of August 11
Possible Compiling Entity
Access to patent information (WIPO Patent Database) and use of the international IP system
Cabo Verde proposes an alternative indicator, "Fixed Internet broadband subscriptions disaggregated by speed".Japan suggests adding the following words to the beginning of the indicator, "The number of countries which can..."United States supports UNEPs alternative proposals, "% increase in jointly files (international) patents" and "% increase in global revenues from technology licensing/royalties."African Member States propose an alternative indicator, "Fixed Internet broadband subscriptions disaggregated by speed".UNCTAD supports an alternative indicator, "Changes in the number of jointly filed patents (would add by residents of developed and developing countries)."
Cabo Verde proposes an additional indicator, "Percentage of patents generated through south-south partnerships."United States proposes an additional indicator, "Number of exchanges - Exchange of scientists and technological staff" as this target involes more than just patents.UN Statistical System Organisastions propose one additional indicator, "Fixed Internet broadband subscriptions broken down by speed."
India states that the emphasis for the indicator should be on developing a global technology facilitation mechanism for knowledge sharing.Colombia comments that the suggested indicator does not adequately measure the target and suggests that Indicator 17.6.2 from the August 11 document could better monitor the target.Cabo Verde comments that the indicator measures a very small part of the target. It does not reflect what is intended by the target. Denmark comments that the indicator seems very limited and does nto encompass all areas contained in the goal and suggests including additional indicators.African Member States recommend that the IAEG to explore other indicators for this specific target. We recommend: Percentage of patents generated through south-south partnerships.UNCTAD comments that they do not think the suggested indicator is relevant.

Summary of Comments - p. 103 of 265
Target 17.7 Promote the development, transfer, dissemination and diffusion of environmentally sound technologies to developing countries on favourable terms, including on concessional and preferential terms, as mutually agreed.
Suggestions for Modifications and Replacement Indicators Suggestions for Additional Indicators Additional Comments Tier
17.7.1 Tier I
Suggestions for Modifications and Replacement Indicators Suggestions for Additional Indicators Additional Comments Tier
17.8.1 ITU Tier I
Suggestions for Modifications and Replacement Indicators Suggestions for Additional Indicators Additional Comments Tier
17.9.1 Tier III
Suggested Indicators as of August 11
Possible Compiling Entity
Average applied tariffs imposed on environmental Goods
Colombia proposes an alternative priority indicator, "Total amount of approved funding for developing countries to promote the development, transfer, dissemination and diffusion of environmentally sound technologies on favourable terms, including on concessional and preferential terms, as mutually agreed."Denmark proposes an alternative priority indicator, "Official Development Assistance aimed at green development."African Member States propose replacing the indicator with, "Average applied tariffs imposed on environmentally sound technologies"UN Statistical System Organisastions propose a modified indicator, "Average applied tariffs imposed on environmentally sound goods and technologies."
UN Statistical System Organisations propose retaining two additional indicators, "Total STEM Investment/GDP" and "Total STEM per capital ($ value)".
India comments that the suggested indicator does not capture the target and states that the emphasis should be on the transfer of technologies to developing countries.Brazil comments that a better definition of "environmental goods" is needed.Germany and Switzerland comment that the content of the indicator is not clear.Denmark comments that the indicator does not reflect diffusion and uptake of environmentalyl sound technologies and should be changed.Australia: Indicator does not provide insight into the promotion of the development, transfer, dissemination or diffusion of technologies.WTO comments that there is still no agreed list/definition of "environmental goods." They suggest that each Member State can self-select its own list of environmental goods.ITC comments that an agreement must be reached on the list of environmental goods and also asks how the analysis of import tariffs can capture "transfer, dissemination and diffusion of environmental sound technologies to developing countries on favourable terms", as mentioned in the target.UNCEEA comments that the indicator may not be wholly informed by the SEEA and SNA, but existing methodology should be taking into account when developing this indicator.
WTO, UNCTAD, ITC
Target 17.8 Fully operationalize the technology bank and science, technology and innovation capacity-building mechanism for least developed countries by 2017 and enhance the use of enabling technology, in particular information and communications technology.
Suggested Indicators as of August 11
Possible Compiling Entity
Proportion of individuals using the Internet.
Cabo Verde proposes additional indicators, " Proportion of business establishment using the internet" and "Science, Techonology, Innovation, and ICT contribution to GDP." United States proposes an additional indicator, "Quality of internet access as measured by International Internet bandwidth per inhabitant."African Member States propose 2 additional indicators, " Proportion of business establishment using the internet" and "Science, Techonology, Innovation, ICT contribution to GDP"UN Statistical System Organisations propose an additional indicator, "International Internet bandwidth per inhabitant."DESA proposes an additional indicator, "Percentage of population with disabilities with internet access, disaggregated for persons with/without disabilities."
Korea comments that this indicator only cosists of ICT accessibility and additional indicators need to be considered.United Kingdom supports this indicator.Australia: Indicator does not consider the uses and therefore the extent to which it contributes to innovation capacity.UN-Women suggests that the indicator be disaggregated by sex, age, location and other relevant characteristics.
Target 17.9 Enhance international support for implementing effective and targeted capacity-building in developing countries to support national plans to implement all the sustainable development goals, including through North-South, South-South and triangular cooperation.
Suggested Indicators as of August 11
Possible Compiling Entity
The dollar value of financial and technical assistance, including through North-South, South-South, and triangular cooperation, committed to developing countries' designing and implementing a holistic policy mix that aim at sustainable development in three dimensions (including elements such as reducing inequality within a country and governance).
India recommends deleting the words “committed to…governance” from the indicator.UN Statistical System Organisations propose modifying the indicator to read, "$ value of financial and technical assistance, including through North-South, South-South, and triangual cooperation committed to developing countries."
UN Statistical System Organisations propose retaining two additional indicators, "Number (share) of national plans to implement SDGs approved by governments by end of 2016 compared to by 2020" and "Percentage of total capacity building ODA coming from South-South cooperation".
Mexico comments that it is feasible in the medium/long term. South-South cooperation providers are not ready to produce statistics to monetize their technical assistance.Colombia does not consider this indicator adequate because South-South Cooperation is not comparable with other types of cooperation like ODA as it is based on exchange and the measureable part of the management is minimal and does not reflect its actual impact.Cabo Verde comments that there are too many different elements to this indicator and suggests dividing it into several indicators.Denmark comments that the indicator is formulated in such a way that it is not easy to understand. They also comment that there is no mention of the quality of capacity development in the indicator.Japan comments that further clarification on the indicator is needed.United States comments that the indicator is poorly conceptualized.Australia: Lack of specification of terms in the proposed indicator. Geocentric and ideological language needs to be avoided to ensure the indicators apply across as broad a range of countries as possible.

Summary of Comments - p. 104 of 265
Target 17.10 Promote a universal, rules-based, open, non-discriminatory and equitable multilateral trading system under the World Trade Organization, including through the conclusion of negotiations under its Doha Development Agenda.
Suggestions for Modifications and Replacement Indicators Suggestions for Additional Indicators Additional Comments Tier
17.10.1 Tier I
Target 17.11 Significantly increase the exports of developing countries, in particular with a view to doubling the least developed countries' share of global exports by 2020.Suggestions for Modifications and Replacement Indicators Suggestions for Additional Indicators Additional Comments Tier
17.11.1 Tier I
Suggestions for Modifications and Replacement Indicators Suggestions for Additional Indicators Additional Comments Tier
17.12.1 Tier I
Suggested Indicators as of August 11
Possible Compiling Entity
Worldwide weighted tariff-average
This indicator can be disaggregated and analysed by type of tariff (MFN applied rates and preferential rates), by product sector, by region and by level of development. The unit of measurement will be in % terms. Ad valorem equivalents (AVE) will be calculated for those tariffs that are not expressed in percentage. This methodology also allows for cross-country comparisons. Calculations can be performed on a yearly basis.
These calculations are already part of the MDG Gap task force report.
India proposes an alternate indicator on the conclusion of the negotiations under the Doha Development Agenda.
United Kingdom proposes an additional indicator, "stock of potentially trade restrictive measures in WTO ‐members."Switzerland comments that Non-tariff measures are missing and proposes an additional indicator addressing technical Barriers to Trade, Trade Facilitation Indicators (OECD), Services Trade Restrictiveness Index (OECD), UNCTAD proposes a series of additional indicators that incorporate a gender perspective: "female share of seasonal export jobs"; "Gender wage gap, work conditions and social benefits in the export sector relative to the domestic sector"; "Female under-employment rate in import-competing sectors"; "Female share of high skilled jobs in export-oriented sectors"; "Female share of managerial jobs in export-oriented sectors"; and "Female share of permanent jobs in export-oriented sectors."ITC proposes as an additional indicator, "Trade restrictiveness." Methodological work would need to be completed to calaculate this composite indicator.
Cabo Verde comments that there are too many different elements to this indicator and suggests dividing it into several indicators.Germany comments that non-tariff measures and prohibitive tariffs are not covered due to the methodology.UNCTAD, ITC and WTO support the suggested indicator.WTO also suggested removing reference to the DDA round of trade negotiations from the indicator.UNCEEA comments that the indicator may not be wholly informed by the SEEA and SNA, but existing methodology should be taking into account when developing this indicator.
WTO, UNCTAD, ITC
Suggested Indicators as of August 11
Possible Compiling Entity
Developing country’s and LDCs' exports (by partner group and key sectors), including services.
India proposes an alternate indicator: “% share of developing countries’ and LDCs’ exports in total global exports, including services.”Brazil proposes a modified wording of the indicator, "Developing country’s and LDCs' share of global exports."Germany suggests modifying the indicator to read, "Imports from Developing Countries and LDCs."
UN Statistical System Organisations propose retaining three additional indicators, "Monitoring the evolution of developing countries export by partner group and key sectors such as a) Exports of high technological content , b) Labour-intensive exports as a proportion of total exports (pro-poor exports), and c) Export diversification (by product; by market destination)", "Percentage of non-oil exports from developing and LDCs derived from sustainable management of natural resources", and "Flow of e-commerce".
Colombia comments that the indicator should be defined in relative terms using global exports as the denominator.United Kindom supports this indicator.Germany comments that the indicator is very specific to a certain type of export that is not further specified in the Agenda 2030 or FfD document. As a disaggregation is not requested by the target, it is not required in the indicator.Palestine comments that it is better that this indicator is calculated on the annual basis either as total in Thousand US$.IMF comments that while they produce data on total exports, the level of granularity required (data by sector) is not collected or disseminated by them.UNCTAD, ITC and WTO support the suggested indicator.
WTO, UNCTAD, ITC
Target 17.12 Realize timely implementation of duty-free and quota-free market access on a lasting basis for all least developed countries, consistent with World Trade Organization decisions, including by ensuring that preferential rules of origin applicable to imports from least developed countries are transparent and simple, and contribute to facilitating market access.
Suggested Indicators as of August 11
Possible Compiling Entity
Average tariffs faced by developing countries and LDCs by key sectors
Brazil proposes this replacement indicator, "Average tariffs faced by developing countries and LDCs"India proposes rewording the indicator to read: “Average tariffs for exports faced by developing countries and LDCs by key source from developed countries” to increase clarity.United Kingdom proposes as the suggested indicator, "Preferences utilization by developing and least developed countries on their export to developed countries."
UN Statistical System Organisations propose retaining one additional indicator, "Preferences utilization by developing and least developed countries on their exports to developed countries."
Brazil comments that it is not a single indicator, it is a table. The term “by key sectors” should be deleted.Ecuador comments that "key sectors" need to be defined in order to assure uniformity across countries.Switzerland comments that a WTO Report on DFQF Market Access for LDCs calculates DFQF Coverage Rates on a regular Basis United States proposes revising the indicator as DFQF only applies to LDCs and not to developing countries.UNCTAD, ITC and WTO support the suggested indicator.
WTO, UNCTAD, ITC

Summary of Comments - p. 105 of 265
Target 17.13 Enhance global macroeconomic stability, including through policy coordination and policy coherence.Suggestions for Modifications and Replacement Indicators Suggestions for Additional Indicators Additional Comments Tier
17.13.1 GDP World Bank, UNSD Tier I
Target 17.14 Enhance policy coherence for sustainable development.Suggestions for Modifications and Replacement Indicators Suggestions for Additional Indicators Additional Comments Tier
17.14.1 OHCHR, UNEP Tier I
Suggested Indicators as of August 11
Possible Compiling Entity
Italy comments that the indicator should read "GDP growth rate" or, if the intention is to measure income levels, should read "PPP GDP per-capita."Brazil proposes an alternative indicator, "Current account surplus-deficit/GDP."UN Statistical System Organisations propose replacing the existing indicator with, "Macro-Economic Dashboard".
Ecuador comments that GDP are not the most ideal indicators and suggests a "suite" of indicators that should be used including, "GDP; Current account surplus/deficity / GDP; Capital flows; net international investment/GDP; terms of trade; export market shares; nominal unit labor cost", along with several others in their full submission.Cabo Verde proposes two additional indicators, "annual average inflation rate" and "debt/GDP ratio."African Member States recommend 2 additional indicators, "Growth rate of GDP" and "Annual average inflation rate."UN Statistical System Organisations propose retaining an additional indicator, "Current account surplus and deficit/GDP."
Colombia suggests defining a more complete indicator that measures variability in the main macroeconomic indicators.Germany comments that it would seem useful to also look at real GDP.Denmark comments that this indicator does not capture variability and does not measure the goal.France comments that the indicator does not capture the totality of the target and supports the use of a macro-economic dashboard.Portugal comments that the indicator does not measure the target and should be replaced.Australia: GDP does not capture all risks to global macroeconomic stability. Support UNCDF and UNEP calls for a suite of indicators. UNCTAD comments that they do not believe GDP is an appropriate indicator of macro-economic stability and argue that a 'dashboard' approach that incorporates elements such as debt, deficit, unemployment and price would be a better option.
Suggested Indicators as of August 11
Possible Compiling Entity
Number of countries that have ratified and implemented relevant international instruments including environmental, human rights, and labour instruments
UN Statistical System Organisations propose replacing the existing indicator with, "Number of countries that have ratified and implemented relevant international instruments under the IMO (safety, security, environmental protection, civil liability, and compensation and insurance) and adported carbon pricing mechanisms."ILO suggests modifying the indicator to read, "Number of countries that have ratified and implemented relevant international instruments under the IMO (safety, security, environmental protection, civil liability, and compensation and insurance) and the ILO Maritime Convention, and adopted carbon pricing mechanisms."
UN Statistical System Organisations propose retaining an additional indicator, "Number of countries with multi-sectoral and multi-stakeholder coordination mechanisms in place for a coordinated implementation of chemicals and wastes conventions and frameworks."
Cabo Verde comments that there are too many different elements to this indicator and suggests dividing it into several indicators.India comments that the indicator does not address the target.Germany comments that they generally support this indicator but that it does not mention anything regarding coordination of, nor synergies or overlaps between the relevant international instruments.Switzerland comments that the indicator is not satistfactory but they do not have an alternative proposal. They comment that "ratified" is overly restrictive as many commitments are voluntary and non-binding as well.

Summary of Comments - p. 106 of 265
Target 17.15 Respect each country's policy space and leadership to establish and implement policies for poverty eradication and sustainable development.Suggestions for Modifications and Replacement Indicators Suggestions for Additional Indicators Additional Comments Tier
17.15.1 UNCTAD Tier I
Suggestions for Modifications and Replacement Indicators Suggestions for Additional Indicators Additional Comments Tier
17.16.1 UNDP Tier II
Target 17.17 Encourage and promote effective public, public-private and civil society partnerships, building on the experience and resourcing strategies of partnerships.Suggestions for Modifications and Replacement Indicators Suggestions for Additional Indicators Additional Comments Tier
17.17.1 World Bank Tier III
Suggested Indicators as of August 11
Possible Compiling Entity
Numbers of constraints that are embodied in ODA or loan agreements, IIAs. RTAs etc.
Ecuador suggests an alternative indicator that deals directly with international treaties to battle poverty and on sustainable production.Germany proposes an alternative indicator, "Number of specific policy constraints in ODA financing and lending agreements not including any definition of financing/lending purpose, covenants, social and environmental safeguards, references to established standards for preventing corruption, money laundering and financing of terrorism."
Denmark suggests considering the reporting ongoing within the GPEDC monitoring process in which recipient countries report on the following indicators, 1) "Development cooperation is focused on results that meetin developing countries' priorities", 2) "Aid on budget", and 3) "Aid is untied".UN Statistical System Organisations propose retaining an additional indicator, "Number of countries signing on for sharing of fiscal information."
Ecuador comments that it is necessary to specify the international treaties and compromises that are being considered.Cabo Verde comments that they need more information on the defintion of "constraints" and what, precisely, will be measured.India comments that the indicator is not clearly defined.Germany comments that the meaning of constraint must be defined and that the definition of financing/lending purpose, covenants, social and environmental safeguards do not count towards these constraints.United States comments that there is no known framework for ODA or loan agreements and that OECD does not measure this.Denmark comments that the indicator does not seem sufficient to measure the target and suggesting using the word "conditions" instead of "constraints" as it is a well-known terminology in the development sector.Japan comments that the definition of "constraints" is not clear.Australia: ‘Constraints’ are not clearly defined. Also number of constraints is of limited value without a sense of the nature of constraints.
Target 17.16 Enhance the global partnership for sustainable development, complemented by multi-stakeholder partnerships that mobilize and share knowledge, expertise, technology and financial resources, to support the achievement of the sustainable development goals in all countries, in particular developing countries.
Suggested Indicators as of August 11
Possible Compiling Entity
Indicator 7 from Global Partnership Monitoring Exercise: Mutual accountability among development co-operation actors is strengthened through inclusive reviews
Ecuador comments that the indicator is not clear and propsoes an alternative, "Number of countries participating in regional or global association members that have come together for development cooperation."
UN Statistical System Organisations propose two additional indicators, "Percentage of countries participating at annual SDG meetings" and "Number of countries reporting on the full set of SDGs."
Colombia comments that this target is not measurable through a quantitative indicator and suggest political monitoring that takes into account reports such as the "Addis Ababa Action Agenda."Cabo Verde requests more information on this indicator.India comments that the indicator does not address the attributes of the target.
Suggested Indicators as of August 11
Possible Compiling Entity
Amount of US$ committed to public-private partnerships
Brazil proposes a modified indicator, "Public expenditure on public-private partnerships as a percentage of total public expenditure"United Kingdom suggests replacing the indicator with the following two indicators, "Indicator 2 from Global Partnership Monitoring Exercise: Civil society operates within an environment that maximises its engagement in – and contribution to – development (this draws from the CIVICUS Enabling Environment Index (EEI))" and "Indicator 3 from Global Partnership Monitoring Exercise: Engagement and contribution of the private sector to development."IMF suggests a replacement indicator "amount of PPP commitments" or "the number of PPPs."
UN Statistical System Organisations propose two additional indicators, "Number of PPP projects" and "Amount of US$ annually committed to public-private partnerships as a percentage of all money spent on development projects on national level."IMF suggests as an additional indicator, "Share of PPP projects cancelled or under distress."
Italy comments that the suggested indicator must be made relative to the size of the Country as the amount in US$ alone is not meaningful; could be calculated as a ratio to the investment of the Government sector. Japan comments that it is not clear whether the commitments are those based on the countries only or they include those commitments from countries and the private sectors and it will be very difficult for the countries if it includes those from the private sector.African Member States comment that the indicator should include partnerships with civil society.

Summary of Comments - p. 107 of 265
Suggestions for Modifications and Replacement Indicators Suggestions for Additional Indicators Additional Comments Tier
17.18.1 Tier I
Target 17.19 By 2030, build on existing initiatives to develop measurements of progress on sustainable development that complement gross domestic product, and support statistical capacity-building in developing countries.
Suggestions for Modifications and Replacement Indicators Suggestions for Additional Indicators Additional Comments Tier
17.19.1 Tier II
17.19.2 Inclusive Wealth Index UNEP Tier I
Target 17.18 By 2020, enhance capacity-building support to developing countries, including for least developed countries and small island developing States, to increase significantly the availability of high-quality, timely and reliable data disaggregated by income, gender, age, race, ethnicity, migratory status, disability, geographic location and other characteristics relevant in national contexts.
Suggested Indicators as of August 11
Possible Compiling Entity
Proportion of sustainable development indicators with full disaggregation produced at the national level.
Japan proposes adding the words "except un-relevant targets" to the indicator to take into account those indicators that do not need any form of disaggregation.
Cabo Verde proposes two additional indicators, "Number of countries that have national statistical legislation that complies with the Fundamental Principles of Official statistics" and "Ratio of available funding / budget for the production of indicators with full disaggregation."African Member States propose two additional indicators, "Number of countries that have national statistical legislation that complies with the Fundamental Principles of Official statistics" and "Number of countries that have access to adequate funding for the implementation of functional statistical systems."UN Statistical System Organisations propose retaining two additional indicators, "Number of countries that have national statistical legislation (that [a] enshrine statistical independence; [b] mandate data collection; and [c] secure access to national administrative data" and "Number of countries that have formal institutional arrangements for the coordination of the compilation of official statistics (at international, national and regional level)."UNFPA proposes an additional indicator, "Proportion of countries that regularly collect essential data on the population."DESA proposes an additional indicator, "Percentage of countries with data for all disability related indicators and disability disaggregation of the SDG framework, in the last 5 years."OECD proposes two additional indicators that address a broader range of partnerships and they are, "Quality of public-private dialogue" and "Extent to which governments and providers of development cooperation contribute to an enabling environment; and extent to which CSOs are implementing development effectiveness principles in their own operations."
Colombia comments that the indicator does not adequately monitor the target and that it should be defined in terms of support to developing countries.Italy comments that the indicator should be better defined.United Kingdom comments that PARIS21 and the Royal Statistics Society are working on an indicator for this target.Germany comments that disaggregation is not possible for a significant number of indicators.Denmark comments that the suggested indicator seeks to measure the effect of the targeted capacity-developing effort instead of capacity itself.Portugal supports the suggested indicator.United States comments that this indicator does not directly measure achievement of the target itself and leaves out 4 of the 5 relevant parts of the target.Australia: May not adequately monitor the target in terms of enhancing statistical capacity-building support/ Indicators do not necessarily need to be produced by the national statistical system to be produced at the national level. The emphasis should also be on more than the production of statistics, but the ability to turn the statistics into useful information for policy and advocacy. Suggest an alternative approach based on an assessment of national statistical capacity. Such an assessment could build on existing frameworks such as: the Paris 21 "National Strategies for the Development of Statistics"; the UNESCAP based Developing National Capacity in Population and Social Statistics in Asia and the Pacific: A framework; World Bank "Data on Statistical Capacity". As part of the assessment, the quality (including timeliness) measurement of key indicators should be included (eg CVRS and population estimates, health, education, GDP, BoP, CPI, etc.)
UNFPA, UNDP, DESA
Suggested Indicators as of August 11
Possible Compiling Entity
Financial and other resources made available to strengthen the statistical capacity in developing countries
UN Statistical System Organisations propose modifying the indicator to read, "$ Value of all resources made available to strengthen statistical capacity in developing countries."UNIDO suggests replacing "financial and other resources" by "financial and staff resources."
UN-Women proposes an additional indicator, "Resources devoted to improvinggender statistics as a percentage of all resources devoted to statistics."
Ecuador comments that this indicator shold be aided by Target 17.18 by making resources available.Denmark supports this indicator.Turkey comments that the indicator is not measurable and comparable as it does not produce a rate, proportion, amount, etc.Japan comments that the indicator is not appropriate as it will be very difficult to report on.
African Member States propose an alternative indicator, "Proportion of countries that regularly collect essencial data on population (Census, Civil registration)."Australia opposes the inclusion of the Inclusive Wealth Index as measure of statistical capacity building in developing countries. Suggest: an indicator which focuses on building on existing initiatives intended to strengthen the use of earth observation and geospatial information and other digital information (e.g. phone based data, internet based data, business systems data)
Brazil comments that the indicator is a synthetic measure and not widely accepted.Ecuador proposes deleting this indicator as its relation to the target is unclear.Italy comments that the indicator very controversial because it uses monetary measure for all aggregates, even for non-market activities and is a revised GDP measure instead of a beyong GDP measure.China and India comment that the definition and calculation method for the indicator need to be further clarified.Germany comments that this indicator in not suitable.Denmark and Portugal support this indicator.
OTHER COMMENTS:
Germany suggests two headling indicators: "GDP per capita" and "% of ODA in GNI."
Ecuador proposes deleting this indicator as its relation to the target is unclear.
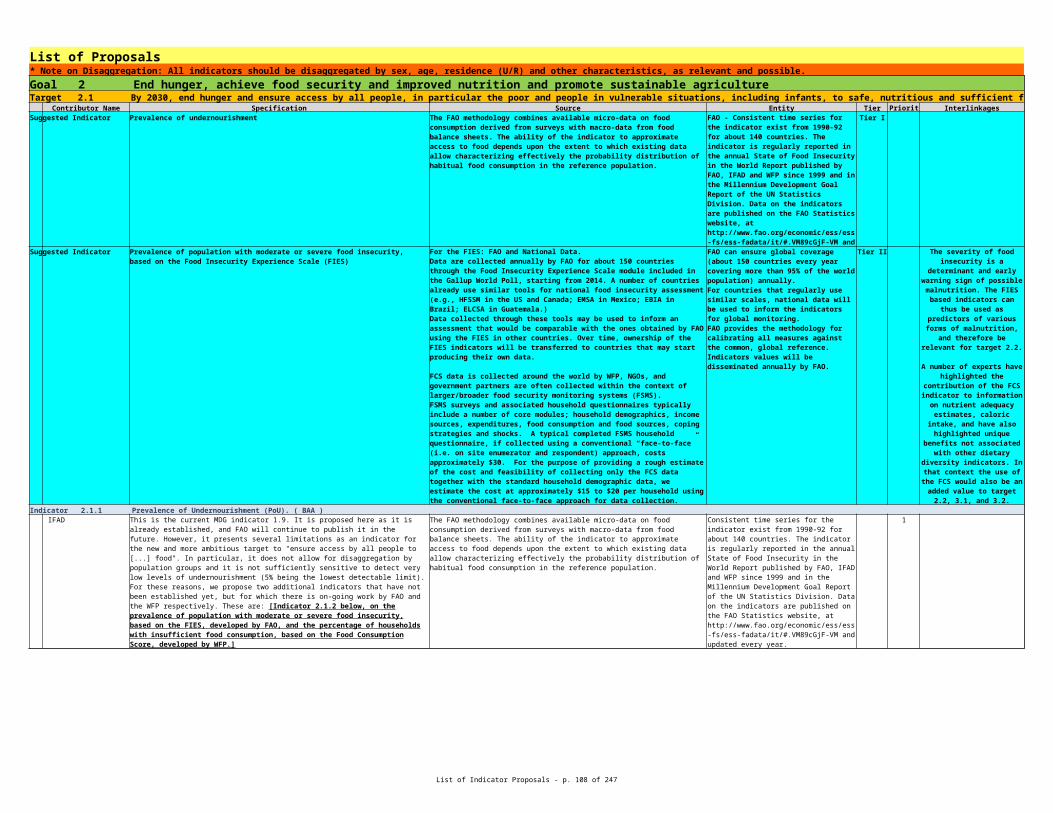
List of Indicator Proposals - p. 108 of 265
List of Proposals* Note on Disaggregation: All indicators should be disaggregated by sex, age, residence (U/R) and other characteristics, as relevant and possible.Goal 1 End poverty in all its forms everywhereTarget 1.1 By 2030, eradicate extreme poverty for all people everywhere, currently measured as people living on less than $1.25 a day.
Contributor Name Specification Source Entity Tier Priority InterlinkagesSuggested Indicator Household surveys (LFS, HIES, LSMS, Integrated HH surveys, etc.) World Bank and ILO Tier I 2.3,1.2,8.5
Indicator 1.1.1 Proportion of population below $1.25 (PPP) per day disaggregated by sex and age group ( ABB ) IFAD 1 2.3 ILO Household surveys (LFS, HIES, LSMS, Integrated HH surveys, etc.). 1 8.5
UNICEF World Bank PovCalNet; Micro database (World Bank) World Bank. Globally available. 1 1.2
WB Household Survey World Bank 1
Target 1.2 By 2030, reduce at least by half the proportion of men, women and children of all ages living in poverty in all its dimensions according to national definitions. Contributor Name Specification Source Entity Tier Priority Interlinkages
Suggested Indicator Household surveys Tier I 1.1,8.5,
Indicator 1.2.1 Multidimensional Poverty Index (MPI) disaggregated by sex and age group ( BBA ) IFAD Disaggregated by urban and rural 1 2.3 UNICEF MICS and DHS; household surveys 1
WB 2
Proportion of population below $1.25 (PPP) per day disaggregated by sex and age group and employment status (or Proportion of employed people living on less that $1.25 PPP) a day)
Alternative text: [Proportion of population below $1.25 (PPP) per day per capita disaggregated by sex and age group and employment status.] Justification: the disaggregation by status in employment will allow for capturing the working poor which is one of the core MDG indicators
Responsible entities: World Bank and ILO. Availability: ILO has estimates available by employment status for 119 countries.
The extreme poverty rate is the proportion of the population living on less than the extreme poverty line (currently at US$1.25 per day), measured at 2011 international prices, adjusted for purchasing power parity (PPP). This indicator is expressed as a percentage. The underlying disaggregation can calculate the poverty rates for the different population subgroups, specifically the child poverty rate (aged 0-17) . Other dimensions of disaggregation are location.
Poor populations are defined by comparing household consumption or income aggregates per capita with a new international poverty line after switching the 2005 PPP with the 2011 PPP. We suggest the indicator description be modified to: ["Proportion of population below $1.25 (PPP) per day, with disaggregations of it by sex and age group."] In this way, it is clear that we need to monitor the proportion for all people as well."
Proportion of population living below national poverty line, disaggregated by sex and age group
World Bank
Data availability:Unisex: Data available for all countries that have household income or consumption surveys. SPC: data are widely available and used by Pacific Island countries, most of which have by now two data points; ILO: working poverty available by employment status for 44 countries;
[Proportion of children living in multidimensional poverty.] This indicator is expressed as a percentage. Deprivation dimensions and indicators should be based on internationally agreed standards and definitions. Deprivation dimensions include inter alia: nutrition, education, health, housing , water and sanitation.
UNDP, UNICEF. MPI is available over 100 countries.
1.1; 2.1; 2.2; 3.1; 3.2; 3.7; 3.8; 4.1; 4.2; 4.5; 4.6; 6.1; 6.2;
10.3; 11.1
The MPI (Multi-Dimensional Poverty Index) cannot measure Target 1.2. Instead, we propose an indicator that is more directly linked to this indicator. Target 1.2 says for each of all dimensions, we need to halve the proportion of people living in poverty. But, MPI does not measure that. In other words, even if MPI is halved by 2030, the proportion of people living in poverty in some dimensions might not be halved. In other words, this indicator does not fit the objective of Target 1.2 well. Instead, we would propose measuring the [proportion of people in poverty for each dimension separately]. By doing this, we can directly see whether the proportion of people living in poverty is halved for all dimensions or not.

List of Indicator Proposals - p. 109 of 265
List of Proposals* Note on Disaggregation: All indicators should be disaggregated by sex, age, residence (U/R) and other characteristics, as relevant and possible.Indicator 1.2.2 Proportion of population living below national poverty line, disaggregated by sex and age group ( AAA )
IFAD 2 2.3 ILO Household surveys (LFS, HIES, LSMS, Integrated HH surveys, etc.). 1 8.5
UNICEF Household budget or income surveys 2 1.1
UNWOMEN 1
WB 1
Alternative text: [Proportion of population living below national poverty line, disaggregated by sex and age group and employment status.] Justification: the disaggregation by status in employment, namely : employed, unemployed, outside the labour force, will allow for capturing the working poor which is one of the core MDG indicators
Responsible entities: World Bank and ILO. Availability: ILO working poverty available by employment status for 44 countries.
[Proportion of children (0-17) living in households defined as poor according to the national poverty line .] This indicator is expressed as a percentage. The underlying disaggregation can calculate the poverty rates for the different subgroups specified in the target, specifically children (aged 0-17) and women and girls to be able to measure progress towards Target 1.2.
World Bank, UNICEF. Data available for all countries that have household income or consumption surveys.
UN Women supports the disaggregation of the population living below the national poverty line by sex and age group. At the regional level, CEPAL has made progress in identifying innovative ways to measure poverty by sex. For example, the ratio of women to men living below the national poverty line (often referred to as the Poverty Femininity Index) is routinely calculated by countries in Latin America and the Caribbean as a supplementary measure under Goal 1 of the MDGs. The measure yields important findings about women's vulnerability to poverty. The measure is currently calculated for women and men age 20 to 59 as follows: sum of female in poor households/Sum of male in poor households/sum of female in all households/sum of male in all households.
In the case of Latin America and the Caribbean, the ratio is calculated using data come from national household-budget surveys. When such surveys are not available, other household surveys conducted by official institutions of statistics are used. Analysis done for other regions has tended to use the DHS and MICs, in these cases the wealth index has been used as the proxy for identifying poorest households.
Country coverage: this indicator has been calculated for about 90 countries; but likely possible for a greater number of countries.
Poor populations are defined as those whose household expenditure or income aggregates per capita (or per adult equivalence scale) are smaller than national poverty lines and the ratio of the poor population over the total population is used for this indicator. Disaggregations of this by sex and age groups will be also calculated.
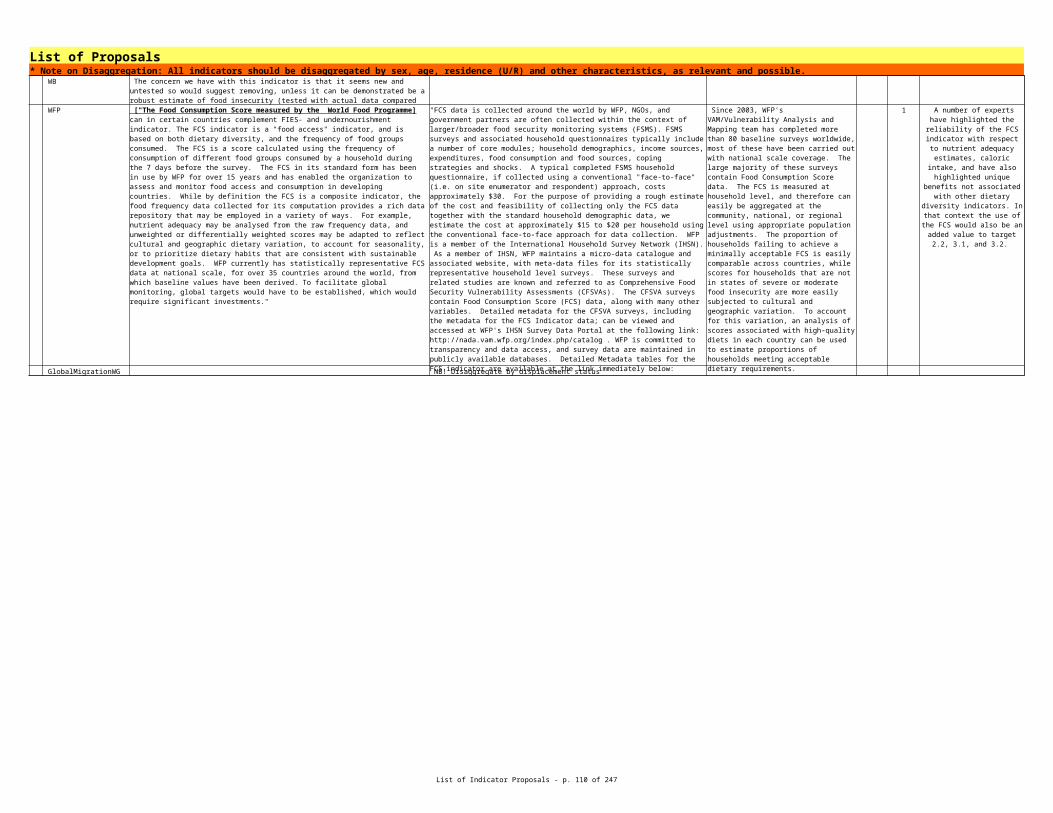
List of Indicator Proposals - p. 110 of 265
List of Proposals* Note on Disaggregation: All indicators should be disaggregated by sex, age, residence (U/R) and other characteristics, as relevant and possible.Target 1.3 Implement nationally appropriate social protection systems and measures for all, including floors, and by 2030 achieve substantial coverage of the poor and the vulnerable.
Contributor Name Specification Source Entity Tier Priority InterlinkagesSuggested Indicator Tier II 5.4, 8.5, 8.8, 10.4
ILO 1 5.4, 8.5, 8.8, 10.4
WB [1]
Indicator 1.3.2 Average social protection transfers as % of income / or poverty line ( BBB ) UNICEF ASPIRE Database (World Bank) World Bank, ILO, UNICEF 1 1.1; 1.2
Percentage of population covered by social protection floors/systems, disaggregated by sex, composed of the following: a) Percentage of older persons receiving a pension; b) Percentage of households with children receiving child support; c) Percentage of working-age persons without jobs receiving support; d)Percentage of persons with disabilities receiving benefits; e) Percentage of women receiving maternity benefits at childbirth; f) Percentage of workers covered against occupational injury; and g) Percentage of poor and vulnerable people receiving benefits.
Social Security administrative data consolidated by the ILO Social Security Inquiry.
Responsible entity: ILO. Availability: Information on old age coverage for 175 countries; on jobless support for 79 countries; on disability for 171 countries; on maternity for 139 countries; on child benefits for 109 countries; on occupational injury coverage for 172 countries. Also responsible: OECD.
Indicator 1.3.1 Percentage of population covered by social protection floors/systems, disaggregated by sex, with break down by children, unemployed, old age, people with disabilities, pregnant women/new-borns, work injury victims, poor and vulnerable, including one or more of the following: a) Percentage of older persons receiving a pension; b) Percentage of households with children receiving child support; c) Percentage of unemployed persons receiving unemployment benefits; d)Percentage of persons with disabilities receiving disability benefits; e) Alternative text: [Percentage of population covered by social protection
floors/systems, disaggregated by sex, composed of the following: a) Percentage of older persons receiving a pension; b) Percentage of households with children receiving child support; c) Percentage of working-age persons without jobs receiving support; d)Percentage of persons with disabilities receiving benefits; e) Percentage of women receiving maternity benefits at childbirth; f) Percentage of workers covered against occupational injury; and g) Percentage of poor and vulnerable people receiving benefits.]
Social Security administrative data consolidated by the ILO Social Security Inquiry.
Responsible entity: ILO. Availability: Information on old age coverage for 175 countries; on jobless support for 79 countries; on disability for 171 countries; on maternity for 139 countries; on child benefits for 109 countries; on occupational injury coverage for 172 countries.
Alternative formulation: "Percentage of poor and vulnerable people covered by social protection systems further break downsincluding one or more of the following: • Percentage of older persons receiving a pension;• Percentage of households with children receiving child support;• Percentage of unemployed persons receiving unemployment benefits;• Percentage of persons with disabilities receiving disability benefits;• Percentage of pregnant women receiving maternity benefits;• Percentage of workers covered against occupational accidents;• Percentage of poor and vulnerable people receiving benefits"
Household surveys reported in the ASPIRE platform (world bank): www.worldbank.org/aspire
For main indicator - percentage of poor and vulnerable covered - World Bank, data currently available for 112 countries, with expansion to 140 countries in July 2015; for break down: Social Security Inquiry (ILO)
1.4; 1.5; and :3.8 : universal health coverage; coverage by social protection is the main vehicle on how to ensure that people are protected against the financial consequences of ill health 5.4 (social protection explicitly mentioned);8.8 (coverage by SP as important part of the decent work agenda)10.4.: social protection is the most reliable way to achieve redistribution in favour of the bottom 40%, 12.c: coverage by compensatory social protection transfers is the proven way to protect the poor in energy subsidy reforms13.1 : social protection measures directly contribute to resilience to climate shocks
[Percentage of children receiving a child or other social grant (disaggregated as possible by poverty status, wealth quintiles, disability, gender and location).] Note: Social grants include cash grants, assistance for school fees, material support for education, income generation support in cash or kind, food assistance provided at the household level, or material or financial support for shelter

List of Indicator Proposals - p. 111 of 265
List of Proposals* Note on Disaggregation: All indicators should be disaggregated by sex, age, residence (U/R) and other characteristics, as relevant and possible.
Contributor Name Specification Source Entity Tier Priority InterlinkagesSuggested Indicator Proportion of the population living in households with access to basic services. MICS and DHS; household surveys World Bank, UNDP, UNICEF Tier II
Suggested Indicator Share of women among agricultural land owners by age and location (U/R) Included in Minimum Set Gender Indicators FAO and UNSD (EDGE)
Indicator 1.4.1 Proportion of population/households with access to basic services (to be defined) by sex and age group ( BBA ) ITU 9.1, 9.c, 11.1
UNCDF Global Findex World Bank 1 1.4, 2.3, 5.a, 8.10
UNEP Database for each of the services selected can be identified at a second stage Can be identified at a second stage 2
UNICEF MICS and DHS; household surveys World Bank, UNDP, UNICEF 1
UPU 1
Target 1.4 By 2030, ensure that all men and women, in particular the poor and the vulnerable, have equal rights to economic resources, as well as access to basic services, ownership and control over land and other forms of property, inheritance, natural resources, appropriate new technology and financial services, including microfinance.
1.2; 3.1; 3.2; 3.7; 3.8;4.1; 4.2; 4.5; 4.6; 5.6; 6.1; 6.2; 7.1;
11.1
Tier III soon Tier II
Proposed indicator to measure this target: [proportion of households with broadband Internet access, by urban/rural]
Data on this indicator are produced by NSOs, through household surveys. Some countries conduct a household survey where the question on households with broadband Internet access is included every year. For others, the frequency is every two or three years. Overall, the indicator is available for 53 countries at least from one survey in the years 2011-2014. Survey data for the proportion of households with Internet access (not broken down by narrowband/broadband) is available for 101 countries and ITU estimates data for this indicator for almost all other countries.
ITU collects data for this indicator from NSOs annually. Overall, the indicator is available for 53 countries at least from one survey in the years 2011-2014. Survey data for the proportion of households with Internet access (not broken down by narrowband/broadband) are available for 101 countries and ITU estimates data for this indicator for almost all other countries.
“% adults with a formal account or personally using a mobile money service in the past 12 months". Possible to have a break down by income e.g. bottom 40% of income share or <$1.25/day, by gender, age (youth) and rural. Adults: ages 15+
We suggest following basic but transformational services: renewable energy and water, sustainable transport, insurance, credit, justice, and information
Targets in Goals 2,3 4, 6,7, 9, 10, 16
[Proportion of the population living in households with access to basic services]. Basic services to be defined but should include: antenatal care (access to health professionals at birth), basic vaccines, access to primary and secondary education, improved water source, improved sanitation, electricity and social security (TBC).
1.2; 3.1; 3.2; 3.7; 3.8;4.1; 4.2; 4.5; 4.6; 5.6; 6.1; 6.2; 7.1;
11.1
The key issue is the definition of a basket of transformative basic services to be included in this indicator: (1) included in this should be electronic access, more specifically to ICT, such as the proportion of households with access to the Internet, ownership of a mobile phone, and with broadband internet, but also physical access to basic e-commerce logistics and postal services, such as the proportion of population with a physical address and benefiting from home delivery for postal and parcel services. (2) for access to formal financial services provided by financial institutions, payment and account services should be ideally distinguished: \% adults with a formal account or personally using a mobile money service in the past 12 months". Possible to have a break down by income e.g. bottom 40% of income share or <$1.25/day. Adults: ages 15+. Formal account: account at a bank or at another type of financial institution, such as a credit union, microfinance institution, cooperative, or the post office (if applicable), or a debit card; including an account at a financial institution for the purposes of receiving wages, government transfers, or payments for agricultural products, paying utility bills or school fees or a card for the purposes of receiving wages or government transfers. Account/card ownership within the past 12 months. Mobile money account includes GSM Association (GSMA) Mobile Money for the Unbanked (MMU) services in the past 12 months to pay bills or to send or receive money along with receiving wages, government transfers, or payments for agricultural products through a mobile phone in the past 12 months."
UPU existing data; ITU existing data; World Bank Global Findex (individual survey - added module to Gallup World Poll)
(1) On home delivery for postal and parcel services: Universal Postal Union. Data availability: ~ 160 countries. Annual. Available since 1875 (19th century) up to 2014 (21st century). (2) On postal accounts and payment services: Universal Postal Union. Data availability: ~ 130 countries. Annual. Available since 1899 (19th century) up to 2014 (21st century).
5.b, 9.1, 9.c, 10.3, 11.1, 16.7, 17.6, 17.8; And 1.4, 2.3, 5.a,
8.10

List of Indicator Proposals - p. 112 of 265
List of Proposals* Note on Disaggregation: All indicators should be disaggregated by sex, age, residence (U/R) and other characteristics, as relevant and possible.
WB 1
Indicator 1.4.2 Proportion of adult population with tenure that is legally recognised and documented or perceived as secure, by sex and age group ( BBB ) IFAD 1 5.a
Basic services is a complicated and unclear metric, and success of this indicator will rely on the clear definition of services as sub-indicators. It doesn't seem feasible/technically robust to aggregate "ownership and control of land and other forms of property, inheritance, natural resources, appropriate new technology and financial services" under one overarching category "basic services" as the "services" included in the target seem to be quite diverse. (1) Included in this should be access to the internet, ownership of a mobile phone, and households with broadband internet access. (2) For access to financial services, there exists a well-established and widely available existing indicator that is comparable across countries: "% adults with a formal account or personally using a mobile money service in the past 12 months". Possible to have a break down by income e.g. bottom 40% of income share or <$1.25/day. Adults: ages 15+. Formal account: account at a bank or at another type of financial institution, such as a credit union, microfinance institution, cooperative, or the post office (if applicable), or a debit card; including an account at a financial institution for the purposes of receiving wages, government transfers, or payments for agricultural products, paying utility bills or school fees or a card for the purposes of receiving wages or government transfers. Account/card ownership within the past 12 months. Mobile money account includes GSM Association (GSMA) Mobile Money for the Unbanked (MMU) services in the past 12 months to pay bills or to send or receive money along with receiving wages, government transfers, or payments for agricultural products through a mobile phone in the past 12 months."
ITU Existing data; World Bank Global Findex (individual survey - added module to Gallup World Poll)
On Financial Services: World Bank. Data availability: ~ 145 countries. Triennial. Available for 2011 and 2014.
5.b, 9.1, 9.c, 10.3, 11.1, 16.7, 17.6, 17.8; And 1.4, 2.3, 5.a,
8.10
FAO recognizes the value of the indicator 1.4.2 currently included in the UNSD template. However, such indicator poses several challenges in terms of feasibility, methodology and data availability. In order to be operational, the indicator should be more specific, and focus either on "equality in recognition and documentation" or on "perception of tenure security". The attempt to address the two issues (equality and perception) with one indicator could result into misleading and incomparable data. In addition, "perception of tenure security" requires focused and not trivial methodological efforts in order to reach a proper operational definition. On this basis, FAO believes an alternative indicator will be more appropriate to monitor Target 1.4 adequately. As an alternative to the current 1.4.2 indicator, FAO proposes the following indicator: "[Percentage of female/male agricultural landowners out of total agricultural landowners", disaggregated by age groups, ethnicity and income levels".] This indicator shows the distribution of male and female owners of agricultural land and hence zooms in on gender inequalities in this highly important productive resource. An increase in the percentage of female landowners indicates that out of those with ownership rights to land, a larger proportion is women, signifying progress towards equal rights to land. This indicator is based on a broad definition of ownership. In addition to officially titled ownership, it also includes other proxies, such as the right to use, sell or bequeath the land, or the right to use it as collateral. This enable the indicator to capture a "bundle of rights" related to land, rather than land ownership in the strictest sense of the term. The indicator frames gender differences in resource ownership by comparing the proportions of men and women out of those that have some degree of rights to land.
No data is available for the indicator 1.4.2 currently included in this template. For the landownership indicator proposed by FAO, data is available for 11 countries. Additional, but yet unprocessed surveys lead to a conservative estimate of additional 10-15 countries for which the indicator will be derived. This indicator will be more available in the future through the data collection processes indicated in the relevant factsheet.
FAO-UN. FAO has the mandate to collect and disseminate information related to agriculture and is strategically positioned to monitor legal frameworks related to land tenure, as well as to collect, analyse and disseminate land-related statistics. FAO is working to strengthen and improve data collection through efforts such as the new Guidelines for the World Census of Agriculture (WCA 2020) as well as the development of the AGRIS toolkit are clear indications of the commitment of FAO in sex-disaggregated land indicators.
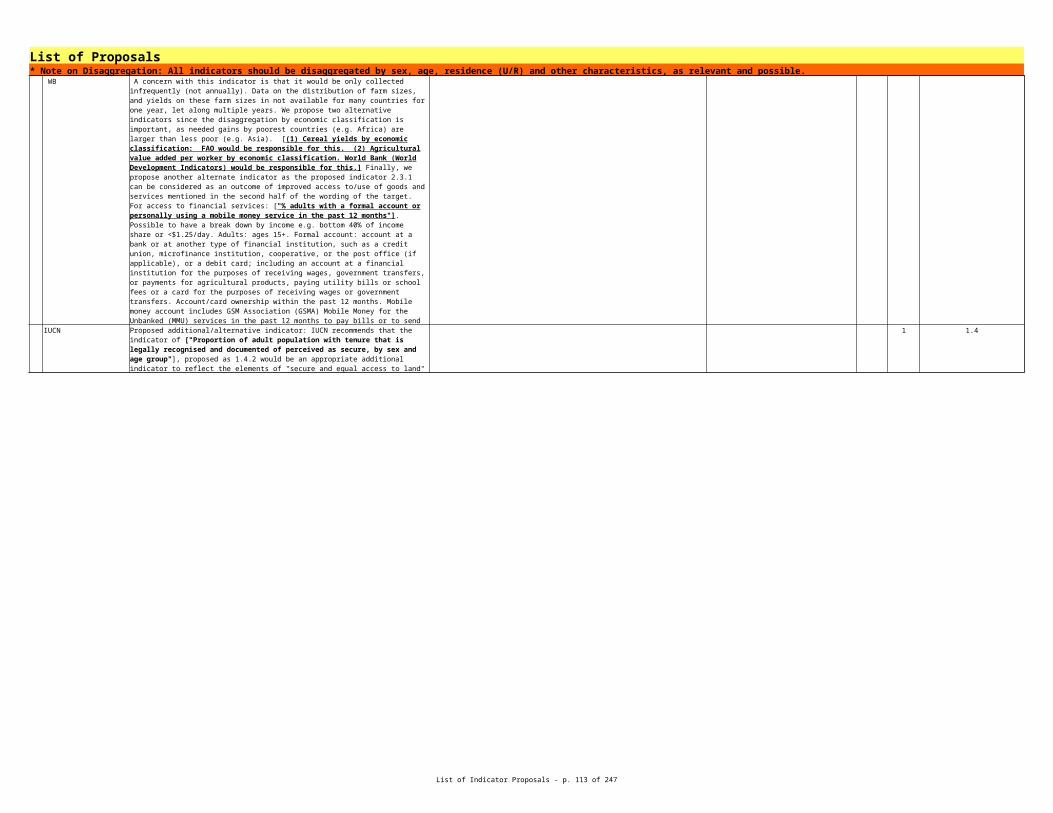
List of Indicator Proposals - p. 113 of 265
List of Proposals* Note on Disaggregation: All indicators should be disaggregated by sex, age, residence (U/R) and other characteristics, as relevant and possible.
FAO 1 5.a
UNCDF Global Findex 2 Targets 2.3 , 5.a , 8.10, 10.2
UNEP 1
UNWOMEN FAO, UNSD, UN Women 1 5.a, 2.3
UPU 2
IUCN Currently proposed indicator: IUCN supports adoption of this indicator. 1 2.3
FAO recognizes the value of the indicator 1.4.2 currently included in the UNSD template. However, such indicator poses several challenges in terms of feasibility, methodology and data availability. In order to be operational, the indicator should be more specific, and focus either on “equality in recognition and documentation” or on “perception of tenure security”. The attempt to address the two issues (equality and perception) with one indicator could result into misleading and incomparable data. In addition, “perception of tenure security” requires focused and not trivial methodological efforts in order to reach a proper operational definition. On this basis, FAO believes an alternative indicator will be more appropriate to monitor Target 1.4 adequately. As an alternative to the current 1.4.2 indicator, FAO proposes the following indicator: “Percentage of female/male agricultural landowners out of total agricultural landowners”, disaggregated by age groups, ethnicity and income levels”. This indicator shows the distribution of male and female owners of agricultural land and hence zooms in on gender inequalities in this highly important productive resource. An increase in the percentage of female landowners indicates that out of those with ownership rights to land, a larger proportion is women, signifying progress towards equal rights to land. This indicator is based on a broad definition of ownership. In addition to officially titled ownership, it also includes other proxies, such as the right to use, sell or bequeath the land. This enable the indicator to capture a “bundle of rights” related to land, rather than land ownership in the strictest sense of the term. The indicator frames gender differences in resource ownership by comparing the proportions of men and women out of those that have some degree of rights to land. See metadata for complete description of indicator
No data is available for the indicator 1.4.2 currently included in this template. For the landownership indicator proposed by FAO, data is available for 11 countries. Additional, but yet unprocessed surveys lead to a conservative estimate of additional 10-15 countries for which the indicator will be derived. This indicator will be more available in the future through the data collection processes indicated in the relevant factsheet.
FAO-UN. FAO has the mandate to collect and disseminate information related to agriculture and is strategically positioned to monitor legal frameworks related to land tenure, as well as to collect, analyse and disseminate land-related statistics. FAO is working to strengthen and improve data collection through efforts such as the new Guidelines for the World Census of Agriculture (WCA 2020) as well as the development of the AGRIS toolkit are clear indications of the commitment of FAO in sex-disaggregated land indicators.
Propose a Multi-Purpose Indicator: [Adults owning an account either through a financial institution or mobile money provider, disaggregated by income level, geography location gender, age and education]
World Bank - Data is available for 142 countries
[Percentage of women, men, indigenous peoples and local communities with secure tenure rights to individually or communally held land, property and natural resources]
This will be measured by: i) percentage with legally documented or recognized evidence of tenure, and ii) percentage who perceive their rights are recognized and protected (disaggregation by sex, urban/rural). Using administrative data, global polls, surveys, censuses (More info in the attached doc - Suggested phased approach)
FAO, UN-Habitat, UNEP, WRI - A few countries, but scaling-up is feasible
1.4; 2.3; 5.a.; 10.2; 11.1.; 15.a
As an alternative to the current 1.4.2 UN Women joins FAO in proposing the following indicator: ["Proportion of women who own and/or control land out of total agricultural landowners. Landowners are defined as those having the right sell (where applicable), bequeath and make decisions about the use of the land".] The indicator is based on a broad definition of ownership covering officially titled ownership, but also other proxies, such as the right to use, sell (in context where the right to sell is applicable) or bequeath the land. This enable the indicator to capture a "bundle of rights" related to land. This conceptualization of ownership is important, particularly in economies where the framework of ownership is not well defined. In such situations, ownership may be supported by legal documents or simply recognized within the community. As conceptualized the indicator captures a 'bundle of rights', with respect to land ownership .
No data is available for the indicator 1.4.2 currently included in this template. For the alternative proposed indicator: the EDGE project will have data for 8 countries. FAO has identified another 11 or so countries with more surveys planned.
One missing issue here was the lack of explicit reference to geography or a proper and formal street address. The indicator should be refined as follows: [proportion of adult population (by sex and age) with tenure that is legally recognised and documented, including a formal street address, by sex and age group.]
On the population formally covered by street addressing systems, the Universal Postal Union regularly uses as proxy \percentage of the population having mail delivered at home\"
On home delivery for postal services: Universal Postal Union. Data availability: ~ 160 countries. Annual. Available since 1875 (19th century) up to 2014 (21st century).
1.4; 2.3; 5.a.; 10.2; 11.1.; 15.a

List of Indicator Proposals - p. 114 of 265
List of Proposals* Note on Disaggregation: All indicators should be disaggregated by sex, age, residence (U/R) and other characteristics, as relevant and possible.
Contributor Name Specification Source Entity Tier Priority InterlinkagesSuggested Indicator National Disaster Loss Databases, 85 (will be more than 115 by 2016) UNISDR Tier II 11.5, 13.1, 14.2, 15.3
Indicator 1.5.1 Number of people affected by hazardous events by sex ( CBB ) UNEP UNEP/UNISDR see UNEP Supplementary technical document UNEP/UNISDR Global - all countries 1 2.1;2.4;11.5;13.1
IFAD 1 13.1 UNICEF
UNISDR National Disaster Loss Databases, 85 (will be more than 115 by 2016) UNISDR 1 11.5, 13.1, 14.2, 15.3
Indicator 1.5.2 Proportion of health and educational facilities affected by hazardous events ( BBB ) IFAD 2 UNICEF
UNISDR National Disaster Loss Databases, 85 (will be more than 115 by 2016) UNISDR 2 11.5, 13.1, 14.2, 15.3, 2.4
OHCHR 1 11.5, 16.1, 10.7, 13.1
Target 1.5 By 2030, build the resilience of the poor and those in vulnerable situations and reduce their exposure and vulnerability to climate-related extreme events and other economic, social and environmental shocks and disasters.
Number of deaths, missing people, injured, relocated or evacuated due to disasters per 100,000 people.
Alternative: [Proportion of population resilient/robust to hazards and climate -related events by sex]
[Number of people affected by hazardous events by sex.] Should also be disaggregated by age and disability. Could consider categorizing 'affected' (dead. Injured, displaced etc.). The ISDR expert group when developing similar indicators for Sendai stated: The "affected" indicator is very subjective, not easily defined, and therefore, any measure of this variable would be not comparable over time or among countries, thus making it inappropriate to track progress or use as a target. It is advisable to use instead a combination or one of the following: injured, evacuated, relocated, houses damaged, houses destroyed and directly exposed.
UNISR proposes refinement into \[Number of deaths, missing people, injured, relocated or evacuated due to disasters per 100,000 people."]. Please see UNISDR input paper attached." Disaster is defined by UNISDR as a "serious disruption of the functioning of a community or a society involving widespread human, material, economic or environmental losses and impacts, which exceeds the ability of the affected community or society to cope using its own resources." The terms "relocated" and "evacuated" are still under discussion by relevant agencies.
[Proportion of health and educational facilities affected by hazardous events.] Impact of events should be measured on a scale, not left up to governments to interpret 'affected'. So as per above perhaps 'damaged' may be better, is more measurable and links with Sendai targets language (though appreciate this may not capture economic and social shocks).
UNISR proposes ["Direct disaster economic loss in relation to global gross domestic product"]. Please see UNISDR input paper attached."
[Percentage of persons forcibly displaced by disasters, crises and other shocks who have found a durable solution to their displacement] Current indicators 1.5.1 and 1.5.2 should be replaced as they are covered more comprehensively by/under 11.5.1 and 11.5.2. However, whereas 11.5 and its indicators cover only disasters, 1.5 covers a wider range of hazards, such as social, economic and environmental shocks. Hence a multi-purpose global indicator covering the number of people killed, injured, displaced or otherwise affected by disasters, crises and other (social, economic and environmental) shocks (linked to 1.5, 11.5, 13.1, 16.1 as well as 10.7) would be advisable, complemented by the above alternative indicator 1 for 1.5 (linked also to 11.5, 13.1, 16.1 as well as 10.7) ) that would measure the (number and) percentage of forcibly displaced people who have found a durable solution to their displacement as a measure of resilience among particularly vulnerable and marginalized groups (i.e. refugees and internally displaced persons). See supplementary metadata material for justification.
Existing/developing (national level) Government statistics and population data. Registration and documentation of IDPs and refugees, in particular UNHCR registration (figures disaggregated by age, gender and disabilities - AGD mainstreaming) and profiling exercises, annual refugee flow and stock figures and number of asylum applications, participatory needs assessments and population surveys by humanitarian actors. IOM Displacement Tracking Matrix. Internal Displacement Monitoring Centre (IDMC) IDP Database and Annual Global Estimates Reports for displacement induced by conflict/generalized violence and disasters, as well as UN Population Fund (UNFPA) figures to normalize displacement estimates. Joint IDP Profiling Service (collects data disaggregated by sex, age, location and diversity). OCHA situation reports (in ongoing humanitarian emergencies). Centre for Research on the Epidemiology of Disasters (CRED) EM-DAT International Disaster Database
UNHCR (global coverage, with data generally provided by Governments, based on their own definitions and methods of data collection). Internal Displacement Monitoring Centre (Currently internal displacement profiles for 50 countries. Global reports since 1998.)

List of Indicator Proposals - p. 115 of 265
List of Proposals* Note on Disaggregation: All indicators should be disaggregated by sex, age, residence (U/R) and other characteristics, as relevant and possible.
Contributor Name Specification Source Entity Tier Priority InterlinkagesSuggested Indicator World Bank Tier III
Indicator 1.a.1 Resources mobilized and spent for poverty reduction, including government, private sector and development partners ( BBB ) UNICEF UNICEF Total coverage is 124 countries. 1
WB
Contributor Name Specification Source Entity Tier Priority InterlinkagesSuggested Indicator Tier I Targets 1.b, 13.2 and 15.9
WB
UNEP 1 Targets 1.b, 13.2 and 15.9
Target 1.a Ensure significant mobilization of resources from a variety of sources, including through enhanced development cooperation, in order to provide adequate and predictable means for developing countries, in particular least developed countries, to implement programmes and policies to end poverty in all its dimensions.
Share of total overall government spending (incl. subnationals) on programs directed to bottom 40% of population of country (%).
[3.1; 3.2; 3.3; 3.4; 3.7; 3.8; 4.1; 4.2; 4.3; 4.6; 5.6]
[New indicator proposed] [Spending on essential services (education and health) as % of total government spending (% of total government spending)]. This indicator is expressed as a percentage.
Government expenditure data: IMF's World Economic Outlook database (total government expenditures), UNESCO's Institute for Statistics database (education expenditures) and World Bank Development Indicators (health expenditures).
3.1; 3.2; 3.3; 3.4; 3.7; 3.8; 4.1; 4.2; 4.3; 4.6; 5.6
Indicator 1.a.1 has no precise meaning and cannot be measured as proposed. Suggest to drop. Alternatively replace with something like: ["Share of total overall government spending (incl. subnationals) on programs directed to bottom 40% of population of country (%)."] New possible indicator for 1a: ["Sum of Total Grants and FDI and non-debt creating inflows - $$$ equivalent."]
Target 1.b Create sound policy frameworks at the national, regional and international levels, based on pro-poor and gender sensitive development strategies, to support accelerated investment in poverty eradication actions.
Number of national action plans related to multi-lateral environmental agreements that support accelerated investment in actions that eradicate poverty and sustainably use natural resources.
Data on all national action plans for MEAs can be found in INFORMEA, which in turn draws upon the data from individual MEAs such as the National Biodiversity Strategy and Action Plans (http://www.bipindicators.net/statusofNBSAPs and http://www.cbd.int/nbsap/)
INFORMEA (www.informea.org). Information currently available for more than 160 countries
A suggestion is that indicator 1.b should read: [“Share of government recurrent and capital spending going to sectors that disproportionately benefit women, poor and vulnerable groups (%)”]
[Number of national action plans related to multi-lateral environmental agreements that support accelerated investment in actions that eradicate poverty and sustainably use natural resources]
Data on all national action plans for MEAs can be found in INFORMEA, which in turn draws upon the data from individual MEAs such as the National Biodiversity Strategy and Action Plans (http://www.bipindicators.net/statusofNBSAPs and http://www.cbd.int/nbsap/)
INFORMEA (www.informea.org). Information currently available for more than 160 countries

List of Indicator Proposals - p. 116 of 265
List of Proposals* Note on Disaggregation: All indicators should be disaggregated by sex, age, residence (U/R) and other characteristics, as relevant and possible.Goal 2 End hunger, achieve food security and improved nutrition and promote sustainable agriculture Target 2.1 By 2030, end hunger and ensure access by all people, in particular the poor and people in vulnerable situations, including infants, to safe, nutritious and sufficient food all year round.
Contributor Name Specification Source Entity Tier Priority InterlinkagesSuggested Indicator Prevalence of undernourishment Tier I
Suggested Indicator Tier II
Indicator 2.1.1 Prevalence of Undernourishment (PoU). ( BAA ) IFAD
The FAO methodology combines available micro-data on food consumption derived from surveys with macro-data from food balance sheets. The ability of the indicator to approximate access to food depends upon the extent to which existing data allow characterizing effectively the probability distribution of habitual food consumption in the reference population.
FAO - Consistent time series for the indicator exist from 1990-92 for about 140 countries. The indicator is regularly reported in the annual State of Food Insecurity in the World Report published by FAO, IFAD and WFP since 1999 and in the Millennium Development Goal Report of the UN Statistics Division. Data on the indicators are published on the FAO Statistics website, at http://www.fao.org/economic/ess/ess-fs/ess-fadata/it/#.VM89cGjF-VM and updated every year.
Prevalence of population with moderate or severe food insecurity, based on the Food Insecurity Experience Scale (FIES)
For the FIES: FAO and National Data. Data are collected annually by FAO for about 150 countries through the Food Insecurity Experience Scale module included in the Gallup World Poll, starting from 2014. A number of countries already use similar tools for national food insecurity assessment (e.g., HFSSM in the US and Canada; EMSA in Mexico; EBIA in Brazil; ELCSA in Guatemala.) Data collected through these tools may be used to inform an assessment that would be comparable with the ones obtained by FAO using the FIES in other countries. Over time, ownership of the FIES indicators will be transferred to countries that may start producing their own data.
FCS data is collected around the world by WFP, NGOs, and government partners are often collected within the context of larger/broader food security monitoring systems (FSMS).FSMS surveys and associated household questionnaires typically include a number of core modules; household demographics, income sources, expenditures, food consumption and food sources, coping strategies and shocks. A typical completed FSMS household questionnaire, if collected using a conventional “face-to-face” (i.e. on site enumerator and respondent) approach, costs approximately $30. For the purpose of providing a rough estimate of the cost and feasibility of collecting only the FCS data together with the standard household demographic data, we estimate the cost at approximately $15 to $20 per household using the conventional face-to-face approach for data collection.See attached metadata for a more complete explanation.
FAO can ensure global coverage (about 150 countries every year covering more than 95% of the world population) annually.For countries that regularly use similar scales, national data will be used to inform the indicators for global monitoring. FAO provides the methodology for calibrating all measures against the common, global reference.Indicators values will be disseminated annually by FAO.
The severity of food insecurity is a determinant and early warning sign of possible malnutrition. The FIES based indicators can
thus be used as predictors of various forms of
malnutrition, and therefore be relevant for target 2.2.
A number of experts have highlighted the contribution
of the FCS indicator to information on nutrient
adequacy estimates, caloric intake, and have also
highlighted unique benefits not associated with other
dietary diversity indicators. In that context the use of the FCS would also be an added value to target 2.2, 3.1, and
3.2.
This is the current MDG indicator 1.9. It is proposed here as it is already established, and FAO will continue to publish it in the future. However, it presents several limitations as an indicator for the new and more ambitious target to "ensure access by all people to [...] food". In particular, it does not allow for disaggregation by population groups and it is not sufficiently sensitive to detect very low levels of undernourishment (5% being the lowest detectable limit). For these reasons, we propose two additional indicators that have not been established yet, but for which there is on-going work by FAO and the WFP respectively. These are: [Indicator 2.1.2 below, on the prevalence of population with moderate or severe food insecurity, based on the FIES, developed by FAO, and the percentage of households with insufficient food consumption, based on the Food Consumption Score, developed by WFP.]
The FAO methodology combines available micro-data on food consumption derived from surveys with macro-data from food balance sheets. The ability of the indicator to approximate access to food depends upon the extent to which existing data allow characterizing effectively the probability distribution of habitual food consumption in the reference population.
Consistent time series for the indicator exist from 1990-92 for about 140 countries. The indicator is regularly reported in the annual State of Food Insecurity in the World Report published by FAO, IFAD and WFP since 1999 and in the Millennium Development Goal Report of the UN Statistics Division. Data on the indicators are published on the FAO Statistics website, at http://www.fao.org/economic/ess/ess-fs/ess-fadata/it/#.VM89cGjF-VM and updated every year.
1
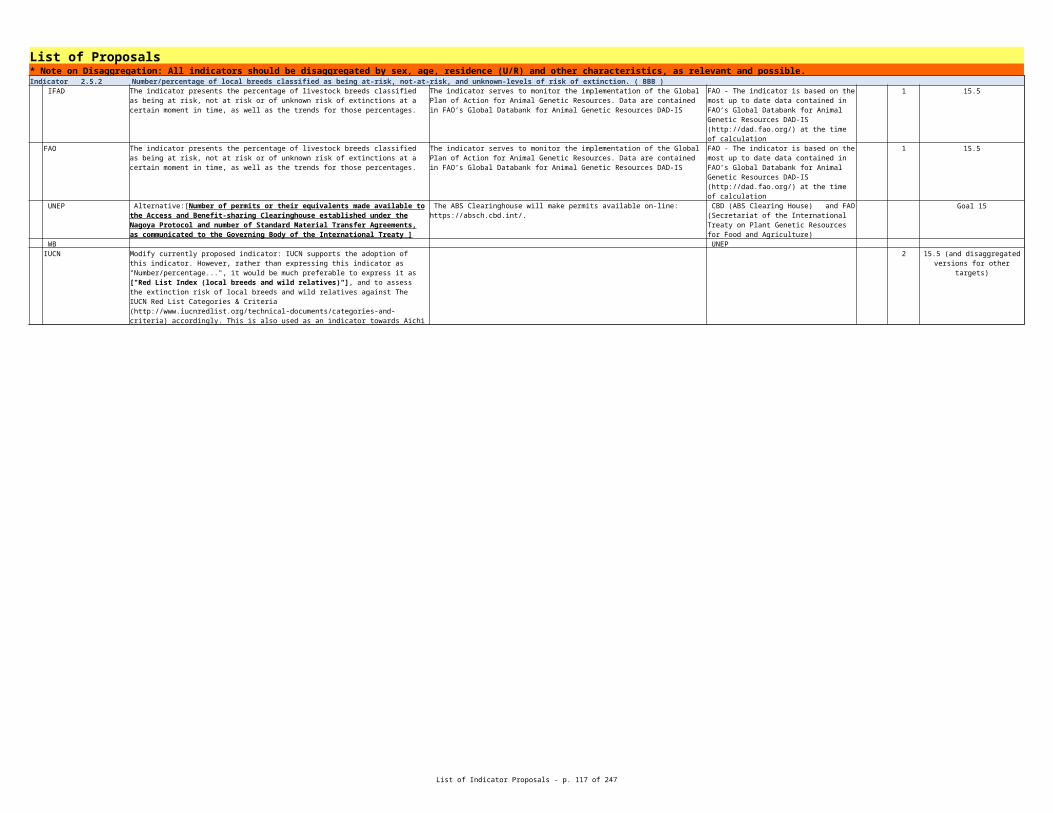
List of Indicator Proposals - p. 117 of 265
List of Proposals* Note on Disaggregation: All indicators should be disaggregated by sex, age, residence (U/R) and other characteristics, as relevant and possible.
FAO 1
UNWOMEN UN Women calls for this indicator to be disaggregated by sex and age. WB FAO
Indicator 2.1.2 Prevalence of population with moderate or severe food insecurity, based on the Food Insecurity Experience Scale (FIES). ( CBB ) IFAD
This is the current MDG indicator 1.9. It is proposed here as it is already established, and FAO will continue to publish it in the future. However, it presents several limitations as an indicator for the new and more ambitious target to "ensure access by all people to [...] food". In particular, it does not allow for disaggregation by population groups and it is not sufficiently sensitive to detect very low levels of undernourishment (5% being the lowest detectable limit). For these reasons, we propose two additional indicators that have not been established yet, but for which there is on-going work by FAO and the WFP respectively. These are: Indicator 2.1.2 below, on the [prevalence of population with moderate or severe food insecurity, based on the FIES, developed by FAO, and the percentage of households with insufficient food consumption, based on the Food Consumption Score, developed by WFP.]
The FAO methodology combines available micro-data on food consumption derived from surveys with macro-data from food balance sheets. The ability of the indicator to approximate access to food depends upon the extent to which existing data allow characterizing effectively the probability distribution of habitual food consumption in the reference population.
Consistent time series for the indicator exist from 1990-92 for about 140 countries. The indicator is regularly reported in the annual State of Food Insecurity in the World Report published by FAO, IFAD and WFP since 1999 and in the Millennium Development Goal Report of the UN Statistics Division. Data on the indicators are published on the FAO Statistics website, at http://www.fao.org/economic/ess/ess-fs/ess-fadata/it/#.VM89cGjF-VM and updated every year.
This indicator is a direct implementation of the concept of “access to food” that informs the target and is based on the FIES, which is an example of experience-based food insecurity scales, directly measuring the effective ability to access food at the individual or household level.Experience-based food security scales have been tested since 1995 and used in a number of countries for regular monitoring of food insecurity among households. FAO has piloted its application in 2013, and started collecting data globally in 2014.A global reference scale of severity and universal thresholds for classification of moderate and severe levels of food insecurity for comparable use worldwide are produced by the FAO Voices of the Hungry project.
The Food Consumption Score measured by the World Food Programme can in certain countries complement FIES- and undernourishment indicator. The FCS indicator is a “food access” indicator, and is based on both dietary diversity, and the frequency of food groups consumed.
The FCS is a score calculated using the frequency of consumption of different food groups consumed by a household during the 7 days before the survey. The FCS in its standard form has been in use by WFP for over 15 years and has enabled the organization to assess and monitor food access and consumption in developing countries. See attached metadata for a more complete explanation.
For the FIES: FAO and National Data. Data are collected annually by FAO for about 150 countries through the Food Insecurity Experience Scale module included in the Gallup World Poll, starting from 2014. A number of countries already use similar tools for national food insecurity assessment (e.g., HFSSM in the US and Canada; EMSA in Mexico; EBIA in Brazil; ELCSA in Guatemala.) Data collected through these tools may be used to inform an assessment that would be comparable with the ones obtained by FAO using the FIES in other countries. Over time, ownership of the FIES indicators will be transferred to countries that may start producing their own data.
FCS data is collected around the world by WFP, NGOs, and government partners are often collected within the context of larger/broader food security monitoring systems (FSMS).FSMS surveys and associated household questionnaires typically include a number of core modules; household demographics, income sources, expenditures, food consumption and food sources, coping strategies and shocks. A typical completed FSMS household questionnaire, if collected using a conventional “face-to-face” (i.e. on site enumerator and respondent) approach, costs approximately $30. For the purpose of providing a rough estimate of the cost and feasibility of collecting only the FCS data together with the standard household demographic data, we estimate the cost at approximately $15 to $20 per household using the conventional face-to-face approach for data collection.See attached metadata for a more complete explanation.
FAO can ensure global coverage (about 150 countries every year covering more than 95% of the world population) annually.For countries that regularly use similar scales, national data will be used to inform the indicators for global monitoring. FAO provides the methodology for calibrating all measures against the common, global reference.Indicators values will be disseminated annually by FAO.
2 The severity of food insecurity is a determinant and early warning sign of possible malnutrition. The
FIES based indicators can thus be used as predictors of
various forms of malnutrition, and therefore be relevant for
target 2.2.
A number of experts have highlighted the contribution
of the FCS indicator to information on nutrient
adequacy estimates, caloric intake, and have also
highlighted unique benefits not associated with other
dietary diversity indicators. In that context the use of the FCS would also be an added value to target 2.2, 3.1, and
3.2.
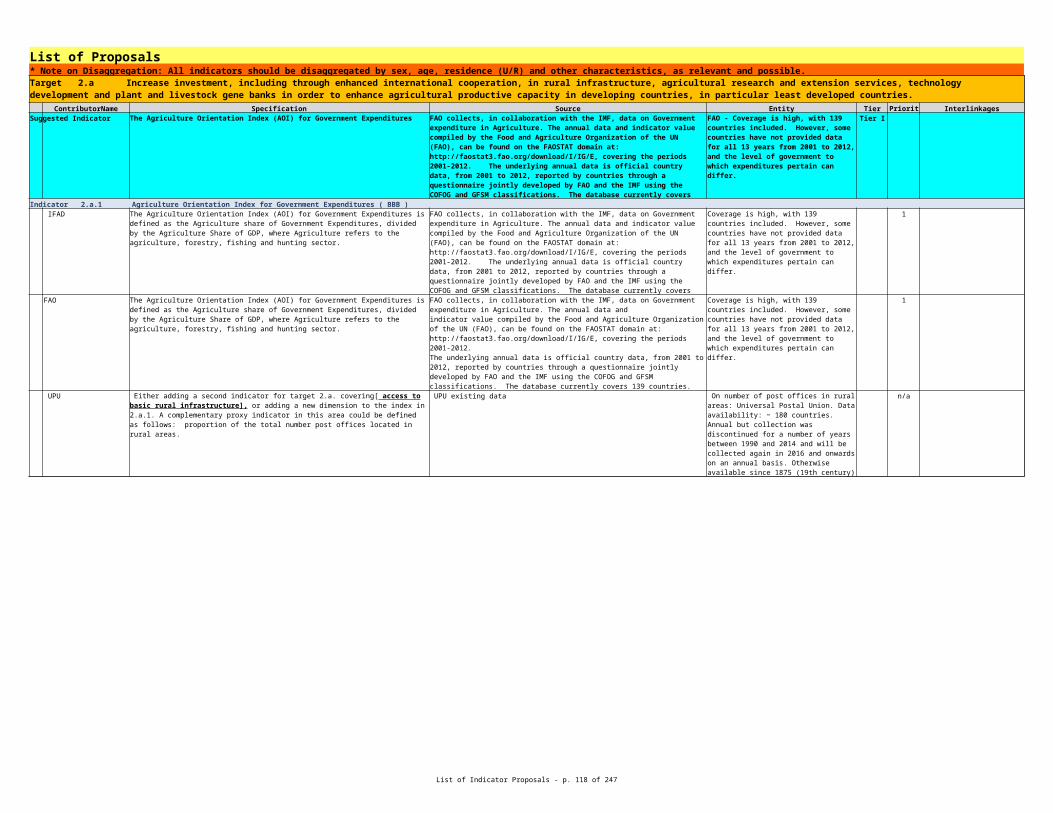
List of Indicator Proposals - p. 118 of 265
List of Proposals* Note on Disaggregation: All indicators should be disaggregated by sex, age, residence (U/R) and other characteristics, as relevant and possible.
FAO 2
UNWOMEN UN Women calls for this indicator to be disaggregated by sex and age. WB
WFP 1
GlobalMigrationWG NB! Disaggregate by displacement status
This indicator is a direct implementation of the concept of “access to food” that informs the target and is based on the FIES, which is an example of experience-based food insecurity scales, directly measuring the effective ability to access food at the individual or household level.Experience-based food security scales have been tested since 1995 and used in a number of countries for regular monitoring of food insecurity among households. FAO has piloted its application in 2013, and started collecting data globally in 2014.A global reference scale of severity and universal thresholds for classification of moderate and severe levels of food insecurity for comparable use worldwide are produced by the FAO Voices of the Hungry project.
The Food Consumption Score measured by the World Food Programme can in certain countries complement FIES- and undernourishment indicator. The FCS indicator is a “food access” indicator, and is based on both dietary diversity, and the frequency of food groups consumed.
The FCS is a score calculated using the frequency of consumption of different food groups consumed by a household during the 7 days before the survey. The FCS in its standard form has been in use by WFP for over 15 years and has enabled the organization to assess and monitor food access and consumption in developing countries. See attached metadata for a more complete explanation.
For the FIES: FAO and National Data. Data are collected annually by FAO for about 150 countries through the Food Insecurity Experience Scale module included in the Gallup World Poll, starting from 2014. A number of countries already use similar tools for national food insecurity assessment (e.g., HFSSM in the US and Canada; EMSA in Mexico; EBIA in Brazil; ELCSA in Guatemala.) Data collected through these tools may be used to inform an assessment that would be comparable with the ones obtained by FAO using the FIES in other countries. Over time, ownership of the FIES indicators will be transferred to countries that may start producing their own data.
FCS data is collected around the world by WFP, NGOs, and government partners are often collected within the context of larger/broader food security monitoring systems (FSMS).FSMS surveys and associated household questionnaires typically include a number of core modules; household demographics, income sources, expenditures, food consumption and food sources, coping strategies and shocks. A typical completed FSMS household questionnaire, if collected using a conventional “face-to-face” (i.e. on site enumerator and respondent) approach, costs approximately $30. For the purpose of providing a rough estimate of the cost and feasibility of collecting only the FCS data together with the standard household demographic data, we estimate the cost at approximately $15 to $20 per household using the conventional face-to-face approach for data collection.See attached metadata for a more complete explanation.
FAO can ensure global coverage (about 150 countries every year covering more than 95% of the world population) annually.For countries that regularly use similar scales, national data will be used to inform the indicators for global monitoring. FAO provides the methodology for calibrating all measures against the common, global reference.Indicators values will be disseminated annually by FAO.
The severity of food insecurity is a determinant and early warning sign of possible malnutrition. The
FIES based indicators can thus be used as predictors of
various forms of malnutrition, and therefore be relevant for
target 2.2.
A number of experts have highlighted the contribution
of the FCS indicator to information on nutrient
adequacy estimates, caloric intake, and have also
highlighted unique benefits not associated with other
dietary diversity indicators. In that context the use of the FCS would also be an added value to target 2.2, 3.1, and
3.2.
The concern we have with this indicator is that it seems new and untested so would suggest removing, unless it can be demonstrated be a robust estimate of food insecurity (tested with actual data compared to other indicators)
["The Food Consumption Score measured by the World Food Programme] can in certain countries complement FIES- and undernourishment indicator. The FCS indicator is a "food access" indicator, and is based on both dietary diversity, and the frequency of food groups consumed. The FCS is a score calculated using the frequency of consumption of different food groups consumed by a household during the 7 days before the survey. The FCS in its standard form has been in use by WFP for over 15 years and has enabled the organization to assess and monitor food access and consumption in developing countries. While by definition the FCS is a composite indicator, the food frequency data collected for its computation provides a rich data repository that may be employed in a variety of ways. For example, nutrient adequacy may be analysed from the raw frequency data, and unweighted or differentially weighted scores may be adapted to reflect cultural and geographic dietary variation, to account for seasonality, or to prioritize dietary habits that are consistent with sustainable development goals. WFP currently has statistically representative FCS data at national scale, for over 35 countries around the world, from which baseline values have been derived. To facilitate global monitoring, global targets would have to be established, which would require significant investments."
"FCS data is collected around the world by WFP, NGOs, and government partners are often collected within the context of larger/broader food security monitoring systems (FSMS). FSMS surveys and associated household questionnaires typically include a number of core modules; household demographics, income sources, expenditures, food consumption and food sources, coping strategies and shocks. A typical completed FSMS household questionnaire, if collected using a conventional "face-to-face" (i.e. on site enumerator and respondent) approach, costs approximately $30. For the purpose of providing a rough estimate of the cost and feasibility of collecting only the FCS data together with the standard household demographic data, we estimate the cost at approximately $15 to $20 per household using the conventional face-to-face approach for data collection. WFP is a member of the International Household Survey Network (IHSN). As a member of IHSN, WFP maintains a micro-data catalogue and associated website, with meta-data files for its statistically representative household level surveys. These surveys and related studies are known and referred to as Comprehensive Food Security Vulnerability Assessments (CFSVAs). The CFSVA surveys contain Food Consumption Score (FCS) data, along with many other variables. Detailed metadata for the CFSVA surveys, including the metadata for the FCS Indicator data; can be viewed and accessed at WFP's IHSN Survey Data Portal at the following link: http://nada.vam.wfp.org/index.php/catalog . WFP is committed to transparency and data access, and survey data are maintained in publicly available databases. Detailed Metadata tables for the FCS indicator are available at the link immediately below: http://www.wfp.org/content/meta-data-food-consumption-score-fcs-indicator""
Since 2003, WFP's VAM/Vulnerability Analysis and Mapping team has completed more than 80 baseline surveys worldwide, most of these have been carried out with national scale coverage. The large majority of these surveys contain Food Consumption Score data. The FCS is measured at household level, and therefore can easily be aggregated at the community, national, or regional level using appropriate population adjustments. The proportion of households failing to achieve a minimally acceptable FCS is easily comparable across countries, while scores for households that are not in states of severe or moderate food insecurity are more easily subjected to cultural and geographic variation. To account for this variation, an analysis of scores associated with high-quality diets in each country can be used to estimate proportions of households meeting acceptable dietary requirements.
A number of experts have highlighted the reliability of
the FCS indicator with respect to nutrient adequacy
estimates, caloric intake, and have also highlighted unique benefits not associated with
other dietary diversity indicators. In that context the use of the FCS would also be an added value to target 2.2,
3.1, and 3.2.

List of Indicator Proposals - p. 119 of 265
List of Proposals* Note on Disaggregation: All indicators should be disaggregated by sex, age, residence (U/R) and other characteristics, as relevant and possible.
Contributor Name Specification Source Entity Tier Priority InterlinkagesSuggested Indicator MICS, DHS and other national household surveys Tier I
Indicator 2.2.1 Prevalence of Stunting (low height-for-age) in children under 5 years of age. ( BAA ) IFAD
FAO
UNICEF MICS, DHS and other national household surveys 1
UNWOMEN UN Women calls for this indicator to be disaggregated by sex. WB WHO 1
Indicator 2.2.2 Prevalence of overweight children under 5 years of age. ( BAA ) UNICEF MICS, DHS and other national household surveys 2 targets 3.4
UNWOMEN UN Women calls for this indicator to be disaggregated by sex. WB WHO 2 UNICEF MICS, DHS and other national household surveys 3
UNICEF [Exclusive breastfeeding among 0-5 month olds ] MICS, DHS and other national household surveys UNICEF Global databases (126 countries) 4 Target 2.1, 3.2
UNICEF [ Prevalence of anaemia (Hb = 11 g/dl) among women of reproductive age ] MICS, DHS and other national household surveys 5
Target 2.2 By 2030, end all forms of malnutrition, including achieving, by 2025, the internationally agreed targets on stunting and wasting in children under 5 years of age, and address the nutritional needs of adolescent girls, pregnant and lactating women and older persons.
Prevalence of stunting (height for age <-2 SD from the median of the WHO Child Growth Standards) among children under five years of age
UNICEF, WHO, World Bank joint dataset (145 countries)
While we support use of the two listed indicators on stunting and overweight, maintained by WHO and UNICEF, we strongly encourage inclusion of the [Minimum Dietary Diversity for Women (MDD-W) indicator], that is the percentage of women, 15-49 years of age, who consume at least 5 out of 10 defined food groups.This is an indicator of the probability of micronutrient adequacy, which provides a necessary link between food and nutrition in the global assessment.
The MDD-W is a new indicator that has been developed and validated against high-quality quantitative dietary data.It is not yet regularly reported although similar data on dietary diversity of women have been reported in the past.Potential data sources include the DHS surveys and the UNICEF MICS.
FAO proposes to become the maintainer of the MDD-W indicator.
While we support use of the two listed indicators on stunting and overweight, maintained by WHO and UNICEF, we strongly encourage inclusion of the Minimum Dietary Diversity for Women (MDD-W) indicator, that is the percentage of women, 15-49 years of age, who consume at least 5 out of 10 defined food groups.This is an indicator of the probability of micronutrient adequacy, which provides a necessary link between food and nutrition in the global assessment.
The MDD-W is a new indicator that has been developed and validated against high-quality quantitative dietary data.It is not yet regularly reported although similar data on dietary diversity of women have been reported in the past.Potential data sources include the DHS surveys and the UNICEF MICS.
FAO proposes to become the maintainer of the MDD-W indicator.
[Prevalence of stunting (height for age <-2 SD from the median of the WHO Child Growth Standards) among children under five years of age]
UNICEF, WHO, World Bank Joint dataset (145 countries)
targets 1.1, 1.2, 2.1, 3.1, 3.2, 4.1, 4.2
[Prevalence of overweight (weight for height >+2 SD from the median of the WHO Child Growth Standards) among children under five years of age ]
UNICEF, WHO, World Bank Joint dataset ( 145 countries)
[Prevalence of wasting (weight for height <-2 SD from the median of the WHO Child Growth Standards) among children under five years of age]
UNICEF, WHO, World Bank Joint dataset (145 countries)
targets 1.1, 1.2, 2.1, 3.1, 3.2,
WHO Global databases (all countries globally; developed and developing as they are modelled estimates)
Target 1.1, 1.2, 2.1, 3.1, 3.2, 4.1, 4.5, 5.5

List of Indicator Proposals - p. 120 of 265
List of Proposals* Note on Disaggregation: All indicators should be disaggregated by sex, age, residence (U/R) and other characteristics, as relevant and possible.
Contributor Name Specification Source Entity Tier Priority InterlinkagesSuggested Indicator Tier II
Indicator 2.3.1 Value of agricultural production per hectare (measured in constant USD/hectare, disaggregated for the two lowest quintiles of countries' farm size distribution, as well as for female-headed smallholder producer households) ( BBB ) IFAD 1
FAO 1
UNCDF Global Findex 2 Targets 1.4 , 5.a , 8.10 , 10.2
UNWOMEN FAO, UNSD, UN Women 2 1.4, 5a
Target 2.3 By 2030, double the agricultural productivity and incomes of small-scale food producers, in particular women, indigenous peoples, family farmers, pastoralists and fishers, including through secure and equal access to land, other productive resources and inputs, knowledge, financial services, markets and opportunities for value addition and non-farm employment.
Value of production per labour unit (measured in constant USD), by classes of farming/pastoral/forestry enterprise size
Νational enterprise surveys. For agriculture, specialized farm surveys , or integrated household surveys including an agricultural module already exist (eg., LSMS-ISA, Integrated Surveys for Agriculture) FAO and the World Bank are working to define a new Agricultural and Rural Integrated Survey (AGRIS) program, that may be used as a source of data to inform this and many others indicators of relevance for the SDG that depend on farm/enterprise level information.
FAO and the World bank. Data to compute the indicator for agricultural producers are currently available for nine developing countries through LSMS-ISA. When the AGRIS program will be in operation, indicators will be published through FAOSTAT.
Propose improved alternative: "[Value of production per labour unit (measured in constant USD), by classes of farming/pastoral/forestry enterprise size]". This indicator measures labour productivity as a proxy for net income of small food producers, and thus is more directly relevant to the formulation of the target.Agreement needs to be found on a comparable definition of "small scale producer" in each sector.
Νational enterprise surveys. For agriculture, specialized farm surveys , or integrated household surveys including an agricultural module already exist (eg., LSMS-ISA, Integrated Surveys for Agriculture) FAO and the World Bank are working to define a new Agricultural and Rural Integrated Survey (AGRIS) program, that may be used as a source of data to inform this and many others indicators of relevance for the SDG that depend on farm/enterprise level information.
FAO and the World bank. Data to compute the indicator for agricultural producers are currently available for nine developing countries through LSMS-ISA. When the AGRIS program will be in operation, indicators will be published through FAOSTAT.
Propose improved alternative: ["Value of production per labour unit (measured in constant USD), by classes of farming/pastoral/forestry enterprise size". ]This indicator measures labour productivity as a proxy for net income of small food producers, and thus is more directly relevant to the formulation of the target.Agreement needs to be found on a comparable definition of "small scale producer" in each sector.
Νational enterprise surveys.For agriculture, specialized farm surveys , or integrated household surveys including an agricultural module already exist (eg., LSMS-ISA, Integrated Surveys for Agriculture)FAO and the World Bank are working to define a new Agricultural and Rural Integrated Survey (AGRIS) program, that may be used as a source of data to inform this and many others indicators of relevance for the SDG that depend on farm/enterprise level information.
FAO and the World bank.Data to compute the indicator for agricultural producers are currently available for nine developing countries through LSMS-ISA.When the AGRIS program will be in operation, indicators will be published through FAOSTAT.
Propose an additional Multi-Purpose Indicator: [Adults owning an account either through a financial institution or mobile money provider, disaggregated by income level, geography location gender, age and education ]
World Bank - Data is available for 142 countries
As an additional indicator UN Women proposes the following: ["Proportion of women who own and/or control land out of total agricultural landowners. Landowners are defined as those having the right sell (where applicable), bequeath and make decisions about the use of the land".] The indicator is based on a broad definition of ownership covering officially titled ownership, but also other proxies, such as the right to use, sell (in context where the right to sell is applicable) or bequeath the land. This enable the indicator to capture a "bundle of rights" related to land. This conceptualization of ownership is important, particularly in economies where the framework of ownership is not well defined. In such situations, ownership may be supported by legal documents or simply recognized within the community. As conceptualized the indicator captures a 'bundle of rights', with respect to land ownership .
No data is available for the indicator 1.4.2 currently included in this template. For the alternative proposed indicator: the EDGE project will have data for 8 countries. FAO has identified another 11 or so countries with more surveys planned.
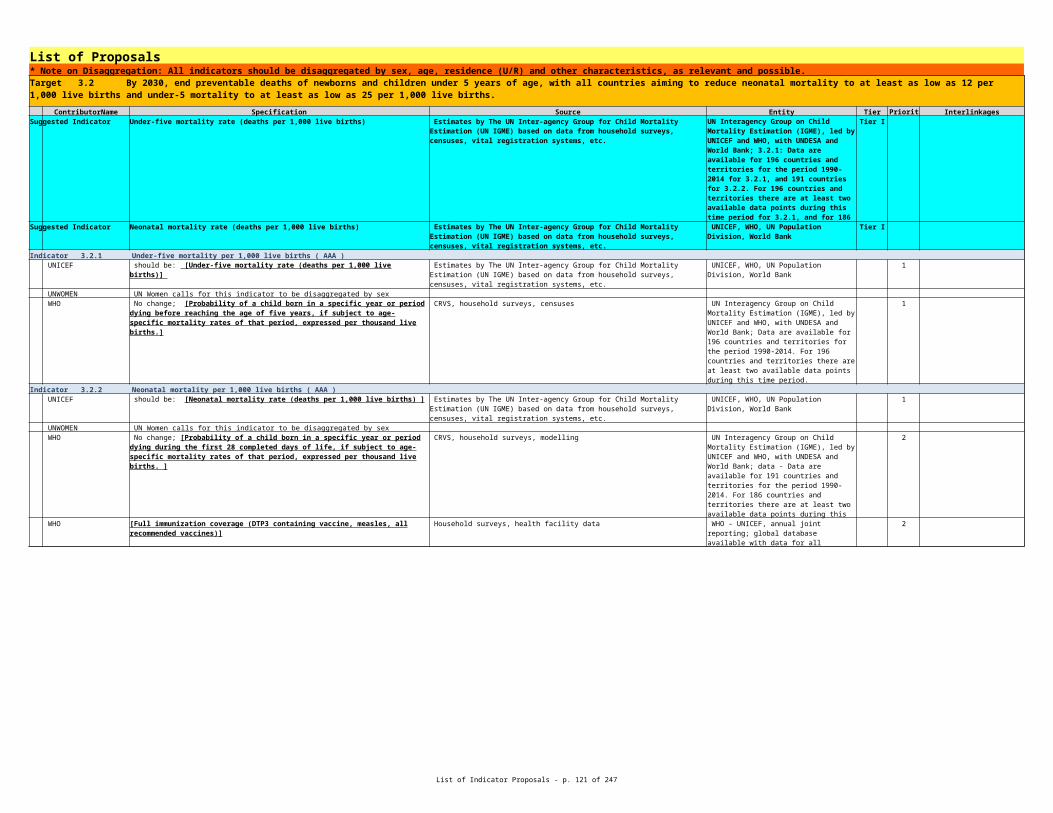
List of Indicator Proposals - p. 121 of 265
List of Proposals* Note on Disaggregation: All indicators should be disaggregated by sex, age, residence (U/R) and other characteristics, as relevant and possible.
WB
IUCN 1 1.4
A concern with this indicator is that it would be only collected infrequently (not annually). Data on the distribution of farm sizes, and yields on these farm sizes in not available for many countries for one year, let along multiple years. We propose two alternative indicators since the disaggregation by economic classification is important, as needed gains by poorest countries (e.g. Africa) are larger than less poor (e.g. Asia). [(1) Cereal yields by economic classification: FAO would be responsible for this. (2) Agricultural value added per worker by economic classification. World Bank (World Development Indicators) would be responsible for this.] Finally, we propose another alternate indicator as the proposed indicator 2.3.1 can be considered as an outcome of improved access to/use of goods and services mentioned in the second half of the wording of the target. For access to financial services: ["% adults with a formal account or personally using a mobile money service in the past 12 months"]. Possible to have a break down by income e.g. bottom 40% of income share or <$1.25/day. Adults: ages 15+. Formal account: account at a bank or at another type of financial institution, such as a credit union, microfinance institution, cooperative, or the post office (if applicable), or a debit card; including an account at a financial institution for the purposes of receiving wages, government transfers, or payments for agricultural products, paying utility bills or school fees or a card for the purposes of receiving wages or government transfers. Account/card ownership within the past 12 months. Mobile money account includes GSM Association (GSMA) Mobile Money for the Unbanked (MMU) services in the past 12 months to pay bills or to send or receive money along with receiving wages, government transfers, or payments for agricultural products through a mobile phone in the past 12 months."
Proposed additional/alternative indicator: IUCN recommends that the indicator of ["Proportion of adult population with tenure that is legally recognised and documented of perceived as secure, by sex and age group"], proposed as 1.4.2 would be an appropriate additional indicator to reflect the elements of "secure and equal access to land" in this Target.

List of Indicator Proposals - p. 122 of 265
List of Proposals* Note on Disaggregation: All indicators should be disaggregated by sex, age, residence (U/R) and other characteristics, as relevant and possible.
ContributorName Specification Source Entity Tier Priority InterlinkagesSuggested Indicator Percentage of agricultural area under sustainable agricultural practices. Tier II
Indicator 2.4.1 Emissions of greenhouse gases in agriculture (per hectare of land and per unit of output, separately for crop and livestock sectors). ( BBB ) IFAD 1
FAO 1
UNISDR National Disaster Loss Databases, 85 (will be more than 115 by 2016) UNISDR 1 15.3, 1.5, 13.1, 11.5, 14.2
WB FAO
Target 2.4 By 2030, ensure sustainable food production systems and implement resilient agricultural practices that increase productivity and production, that help maintain ecosystems, that strengthen capacity for adaptation to climate change, extreme weather, drought, flooding and other disasters and that progressively improve land and soil quality.
At global level, currently there is no data available. However many if not most of the countries record areas which are the object of practices contributing to environmental sustainability under various schemes, either of a regulatory nature, like protected areas for instance, or as part of a subsidies scheme or in a payment for environmental services scheme or as part of voluntary standards, public or private. Countries are also preparing, as part of national reports for the state of the world biodiversity for food and agriculture, statistics on practices contributing to biodiversity, most of which have a broader positive impact on the environment. Moreover, many countries are participating in internationally established strategic frameworks which promote the collection of data at country level. Hence, the data for computing the indicator should be collected through the records that are held in the process of the country participation to those schemes and strategies.
FAO is carrying on a consultation process to develop an indicator on “Area under sustainable land management”, to be developed by the end of 2015. The process will be within the framework of the “World Overview of Conservation Approaches and Technologies” (WOCAT) partnership and in the support of UNCCD implementation and will support countries to assess, map and monitor SLM as well as land degradation.
The proposed alternative is used as one component of
indicator 15.3.2, Area of land/soils under sustainable
management
Propose improved alternative: ["Percentage of agricultural area under sustainable agricultural practices"]. The indicator is more directly linked with the target, particularly to the aspects of sustainable production, adaptation to climate change and improvement of land and soil. The indicator is defined by the following formula: A= area on which are conducted practices contributing to environmental sustainability of agriculture / agricultural area, where Agricultural Area = Arable land and Permanent crops + Permanent meadows and pastures (FAOSTAT), and Area on which are conducted practices contributing to environmental sustainability of agriculture = the surface area identified and/or acknowledged by the government as being affected by agronomic activities and practices that contribute to environmental sustainability of agriculture.
At global level, currently there is no data available. However many if not most of the countries record areas which are the object of practices contributing to environmental sustainability under various schemes, either of a regulatory nature, like protected areas for instance, or as part of a subsidies scheme or in a payment for environmental services scheme or as part of voluntary standards, public or private. Countries are also preparing, as part of national reports for the state of the world biodiversity for food and agriculture, statistics on practices contributing to biodiversity, most of which have a broader positive impact on the environment. Moreover, many countries are participating in internationally established strategic frameworks which promote the collection of data at country level. Hence, the data for computing the indicator should be collected through the records that are held in the process of the country participation to those schemes and strategies.
FAO is carrying on a consultation process to develop an indicator on “Area under sustainable land management”, to be developed by the end of 2015. The process will be within the framework of the “World Overview of Conservation Approaches and Technologies” (WOCAT) partnership and in the support of UNCCD implementation and will support countries to assess, map and monitor SLM as well as land degradation.
The proposed alternative is used as one component of
indicator 15.3.2, Area of land/soils under sustainable
management
UNISR proposes \[Agricultural loss due to disasters"]. Please see UNISDR input paper attached."
Change indicator name to \[Emissions of greenhouse gases in agriculture (CO2 equivalent per hectare of land and per unit of output, separately for crop and livestock sectors).]"

List of Indicator Proposals - p. 123 of 265
List of Proposals* Note on Disaggregation: All indicators should be disaggregated by sex, age, residence (U/R) and other characteristics, as relevant and possible.Indicator 2.4.2 Absolute levels of emissions in relevant sectors and sub-sectors. ( BBB )
IFAD
FAO
UNISDR National Disaster Loss Databases, 85 (will be more than 115 by 2016) UNISDR 2 11.5, 13.1, 14.2, 15.3, 2.4
WB
IUCN 2
Propose dropping in favour of above alternative, ["Percentage of agricultural area under sustainable agricultural practices"]
Propose dropping in favour of above alternative, ["Percentage of agricultural area under sustainable agricultural practices"]
UNISR proposes "[Direct disaster economic loss in relation to global gross domestic product]". Please see UNISDR input paper attached."
The concern we have with this indicator is that it implies that the absolute levels of emissions across all countries and sectors should decline. But it is better for overall emissions reduction to produce more beef in Ireland (for example) that has lower emissions intensive production than some other European countries. This may raise absolute emissions in Ireland, but lower it by more in other countries with substitution of production.
Proposed additional/alternative indicator: Focusing both indicators under Target 2.4 on GHG emissions seems too narrow. IUCN suggests complementing them with ["Red List Index (biodiversity used for food and medicine)"]. This would also help to reflect contributions towards resilience, maintenance of ecosystems, and adaptation to climate change. It is used as an indicator towards Aichi Target 14 (http://www.bipindicators.net/foodandmedicine).
Data sources: IUCN Red List of Threatened Species (http://www.iucnredlist.org/), generating "RLI for species used for food and medicine" as used by Butchart et al. (2010) Science 328: 1164-1168.
Responsible entities and national availability: TRAFFIC and IUCN Red List Partnership (http://www.iucnredlist.org/partners/partners-and-technical-support). Available globally since 1980s, and can be disaggregated to national and regional levels (Rodrigues et al. 2014 PLoS ONE 9(11): e113934).
15.5 (and disaggregated versions for other targets)

List of Indicator Proposals - p. 124 of 265
List of Proposals* Note on Disaggregation: All indicators should be disaggregated by sex, age, residence (U/R) and other characteristics, as relevant and possible.
ContributorName Specification Source Entity Tier Priority InterlinkagesSuggested Indicator Tier I 15.5
Indicator 2.5.1 Ex-situ crop collections indicator. ( CBB ) UNEP Goal 15
FAO 1 1 15.5
IFAD 1 15.5
WB
IUCN 1
Target 2.5 By 2020, maintain the genetic diversity of seeds, cultivated plants and farmed and domesticated animals and their related wild species, including through soundly managed and diversified seed and plant banks at the national, regional and international levels, and ensure access to and fair and equitable sharing of benefits arising from the utilization of genetic resources and associated traditional knowledge, as internationally agreed.
Ex Situ Crop Collections Enrichment index Data are reported by member countries to the Commission of Genetic Resources of Food and Agriculture on the implementation of the Second Global Plan of Action for PGRFA, as agreed at CGRFA-15
FAO - The indicator has been calculated by FAO in 2008 and 2014. It will be calculated again in 2015 and then periodically every 2-3 years based on data reported by member countries to the Commission of Genetic Resources of Food and Agriculture. Country data are stored in WIEWS, the FAO PGRFA information system.
The two indicators 2.5.1 and 2.5.2 should be rolled into one, so that a second indicator can measure ABS which is a second part of this Target. Therefore, propose Indicator 2.5.1 to read: [Number/percentage of local crops and breeds, and their wild relatives, classified as being at-risk, not-at-risk, and unknown-levels of risk of extinction]
http://www.bipindicators.net/domesticanimals and http://www.bipindicators.net/cropcollections : data collected from Domestic Animal Diversity Information System (DAD-IS), and EURISCO, USDA-GRIN, ICRISAT, CIAT, SINGER, ILRI
WCMC working with FAO, International Livestock Research Institute (ILRI), Bioversity International
Proposed reformulation of the name: [Ex Situ Crop Collections Enrichment index]It measures global trends in the diversity of ex situ conserved materials, providing an overall assessment of the extent to which we are managing to maintain and/or increase the total genetic diversity required for current and future production and therefore secure under controlled conditions from any permanent loss of this type of genetic diversity occurring in the field.For a detailed description see http://www.bipindicators.net/cropcollections
Data are reported by member countries to the Commission of Genetic Resources of Food and Agriculture on the implementation of the Second Global Plan of Action for PGRFA, as agreed at CGRFA-15
FAO - The indicator has been calculated by FAO in 2008 and 2014. It will be calculated again in 2015 and then periodically every 2-3 years based on data reported by member countries to the Commission of Genetic Resources of Food and Agriculture. Country data are stored in WIEWS, the FAO PGRFA information system.
No sure what this means. An alternative is \[Number of varieties and animal breeds integrating germplasm accessed from gene banks under benefit sharing contracts"]
Currently proposed indicator: IUCN supports the adoption of this indicator. It is used as an indicator towards Aichi Target 13 (http://www.bipindicators.net/cropcollections).

List of Indicator Proposals - p. 125 of 265
List of Proposals* Note on Disaggregation: All indicators should be disaggregated by sex, age, residence (U/R) and other characteristics, as relevant and possible.Indicator 2.5.2 Number/percentage of local breeds classified as being at-risk, not-at-risk, and unknown-levels of risk of extinction. ( BBB )
IFAD 1 15.5
FAO 1 15.5
UNEP Goal 15
WB UNEP IUCN 2
The indicator presents the percentage of livestock breeds classified as being at risk, not at risk or of unknown risk of extinctions at a certain moment in time, as well as the trends for those percentages.
The indicator serves to monitor the implementation of the Global Plan of Action for Animal Genetic Resources. Data are contained in FAO’s Global Databank for Animal Genetic Resources DAD-IS
FAO - The indicator is based on the most up to date data contained in FAO’s Global Databank for Animal Genetic Resources DAD-IS (http://dad.fao.org/) at the time of calculation
Alternative:[Number of permits or their equivalents made available to the Access and Benefit-sharing Clearinghouse established under the Nagoya Protocol and number of Standard Material Transfer Agreements, as communicated to the Governing Body of the International Treaty ]
The ABS Clearinghouse will make permits available on-line: https://absch.cbd.int/.
CBD (ABS Clearing House) and FAO (Secretariat of the International Treaty on Plant Genetic Resources for Food and Agriculture)
Modify currently proposed indicator: IUCN supports the adoption of this indicator. However, rather than expressing this indicator as "Number/percentage...", it would be much preferable to express it as ["Red List Index (local breeds and wild relatives)"], and to assess the extinction risk of local breeds and wild relatives against The IUCN Red List Categories & Criteria (http://www.iucnredlist.org/technical-documents/categories-and-criteria) accordingly. This is also used as an indicator towards Aichi Target 13 (http://www.bipindicators.net/domesticatedanimals).
15.5 (and disaggregated versions for other targets)

List of Indicator Proposals - p. 126 of 265
List of Proposals* Note on Disaggregation: All indicators should be disaggregated by sex, age, residence (U/R) and other characteristics, as relevant and possible.
ContributorName Specification Source Entity Tier Priority InterlinkagesSuggested Indicator The Agriculture Orientation Index (AOI) for Government Expenditures Tier I
Indicator 2.a.1 Agriculture Orientation Index for Government Expenditures ( BBB ) IFAD 1
FAO 1
UPU UPU existing data n/a
Target 2.a Increase investment, including through enhanced international cooperation, in rural infrastructure, agricultural research and extension services, technology development and plant and livestock gene banks in order to enhance agricultural productive capacity in developing countries, in particular least developed countries.
FAO collects, in collaboration with the IMF, data on Government expenditure in Agriculture. The annual data and indicator value compiled by the Food and Agriculture Organization of the UN (FAO), can be found on the FAOSTAT domain at: http://faostat3.fao.org/download/I/IG/E, covering the periods 2001-2012. The underlying annual data is official country data, from 2001 to 2012, reported by countries through a questionnaire jointly developed by FAO and the IMF using the COFOG and GFSM classifications. The database currently covers 139 countries.
FAO - Coverage is high, with 139 countries included. However, some countries have not provided data for all 13 years from 2001 to 2012, and the level of government to which expenditures pertain can differ.
The Agriculture Orientation Index (AOI) for Government Expenditures is defined as the Agriculture share of Government Expenditures, divided by the Agriculture Share of GDP, where Agriculture refers to the agriculture, forestry, fishing and hunting sector.
FAO collects, in collaboration with the IMF, data on Government expenditure in Agriculture. The annual data and indicator value compiled by the Food and Agriculture Organization of the UN (FAO), can be found on the FAOSTAT domain at: http://faostat3.fao.org/download/I/IG/E, covering the periods 2001-2012. The underlying annual data is official country data, from 2001 to 2012, reported by countries through a questionnaire jointly developed by FAO and the IMF using the COFOG and GFSM classifications. The database currently covers 139 countries.
Coverage is high, with 139 countries included. However, some countries have not provided data for all 13 years from 2001 to 2012, and the level of government to which expenditures pertain can differ.
Either adding a second indicator for target 2.a. covering[ access to basic rural infrastructure], or adding a new dimension to the index in 2.a.1. A complementary proxy indicator in this area could be defined as follows: proportion of the total number post offices located in rural areas.
On number of post offices in rural areas: Universal Postal Union. Data availability: ~ 180 countries. Annual but collection was discontinued for a number of years between 1990 and 2014 and will be collected again in 2016 and onwards on an annual basis. Otherwise available since 1875 (19th century) up to 2014 (21st century).
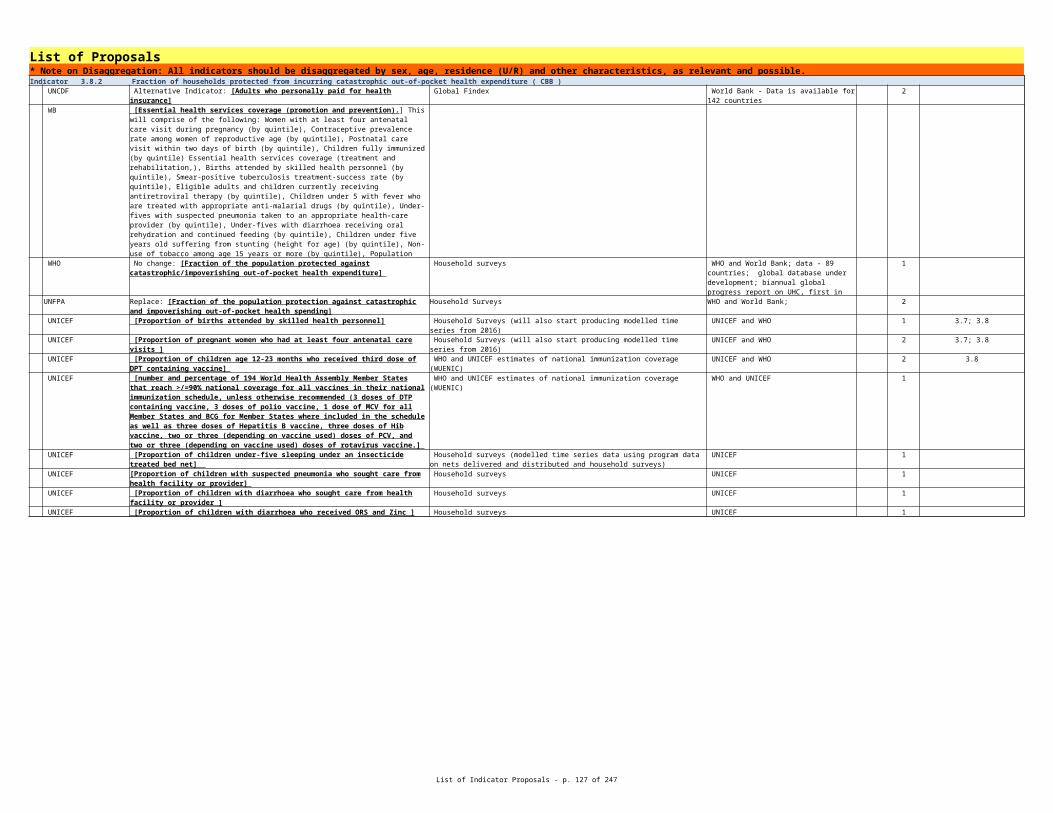
List of Indicator Proposals - p. 127 of 265
List of Proposals* Note on Disaggregation: All indicators should be disaggregated by sex, age, residence (U/R) and other characteristics, as relevant and possible.
ContributorName Specification Source Entity Tier Priority InterlinkagesSuggested Indicator Percent change in Import and Export tariffs on agricultural products WTO WTO Tier ISuggested Indicator Agricultural Export Subsidies OECD OECD Tier I
WB 17.10
ESCAP WTO WTO
OECD OECD 1
ContributorName Specification Source Entity Tier Priority InterlinkagesSuggested Indicator Indicator of (food) Price Anomalies (IPA) ( CBB ) FAO Tier IIIndicator 2.c.1 Indicator of (food) Price Anomalies (IPA) ( CBB )
IFAD FAO 1
FAO FAO 1
Target 2.b Correct and prevent trade restrictions and distortions in world agricultural markets, including through the parallel elimination of all forms of agricultural export subsidies and all export measures with equivalent effect, in accordance with the mandate of the Doha Development Round.
As stated, this is not a measurable indicator. Alternatives could be [(1) Trade restrictiveness indicators (OTRI) for agricultural sector or (2) Distortions to Agricultural Incentives]. (1) Trade restrictiveness indicators (OTRI) for agricultural sector: The overall trade restrictiveness indicators (OTRI) summarizes the trade policy stance of a country by calculating the equivalent uniform tariff that will keep its overall imports at the current level when the country in fact has different tariffs and non-tariff barriers for different sectors, including agricultural goods. OTRI and some other related indices, such as the Trade Restrictiveness Index (TRI) and the Market Access Overall Trade Restrictiveness Index (MAOTRI). The rigorous analytical method can be used to update the indicators on an annual basis. (2) Distortions to Agricultural Incentives: The World Bank’s research project on “Distortions to Agricultural Incentives” has produced a core database of Nominal Rates of Assistance to producers, or NRAs, together with a set of Consumer Tax Equivalents, or CTEs, for farm products and a set of Relative Rates of Assistance to farmers in 82 focus countries
(1) Trade restrictiveness indicators (OTRI) for agricultural sector: Data is available for up to 170 countries. The website of trade restrictiveness with more information: http://econ.worldbank.org/WBSITE/EXTERNAL/EXTDEC/EXTRESEARCH/0,,contentMDK:22574446~pagePK:64214825~piPK:64214943~theSitePK:469382,00.html (2) Distortions to Agricultural Incentives: Data is available for up to 82 countries. For more details:http://econ.worldbank.org/WBSITE/EXTERNAL/EXTDEC/EXTRESEARCH/EXTPROGRAMS/EXTTRADERESEARCH/0,,contentMDK:21012395~pagePK:64168182~piPK:64168060~theSitePK:544849,00.html
(1) Trade restrictiveness indicators (OTRI) for agricultural sector: World Bank (2) Distortions to Agricultural Incentives: World Bank. Current work on distortions to agricultural incentives is ongoing in partnership with IFPRI and other organizations: http://www.ag-incentives.org/
The indicator does not reflect the target correctly. New Indicator - [Reduction in the following specific indicators of the WTO members: 1. Import and Export tariffs 2. Anti dumping, safeguard and CVD cases 3. Domestic subsidy on agricultural products. 4. Export subsidy on agricultural products 5. Non tariff measures.]
Suggested Alternative Indicator: [Producer Support Estimates in Agriculture that are highly production and trade distortive.] This indicator fits the target very well, a well-established methodology exists and data cover a large number of the countries for which this issue is most relevant.
OECD; Producer and Consumer Support Estimates Database; see http://www.oecd.org/tad/agricultural-policies/producerandconsumersupportestimatesdatabase.htm
Target 2.c Adopt measures to ensure the proper functioning of food commodity markets and their derivatives and facilitate timely access to market information, including on food reserves, in order to help limit extreme food price volatility.
The IPA is uniquely suited to the Target 2.c as it allows early detection of abnormal market conditions, permitting the timely adoption of policies and measures aiming to limit extreme food price volatility.
The IPA is uniquely suited to the Target 2.c as it allows early detection of abnormal market conditions, permitting the timely adoption of policies and measures aiming to limit extreme food price volatility.

List of Indicator Proposals - p. 128 of 265
List of Proposals* Note on Disaggregation: All indicators should be disaggregated by sex, age, residence (U/R) and other characteristics, as relevant and possible.Goal 3 Ensure healthy lives and promote well-being for all at all ages Target 3.1 By 2030, reduce the global maternal mortality ratio to less than 70 per 100,000 live births.
ContributorName Specification Source Entity Tier Priority InterlinkagesSuggested Indicator Maternal deaths per 100,000 live births Tier I
Suggested Indicator Proportion of births attended by skilled health personnel Household Surveys (will also start producing modelled time series from 2016) UNICEF and WHO Tier I 3.7, 3.8
Indicator 3.1.1 Maternal deaths per 100,000 live births ( AAA ) UNICEF [Maternal deaths per 100,000 live births ] WHO, UNICEF, UNFPA, The World Bank 1
UNWOMEN
WHO 1
UNFPA 1
Indicator 3.1.2 Skilled birth attendance ( AAA ) UNICEF [Proportion of births attended by skilled health personnel ] Household Surveys (will also start producing modelled time series from 2016) UNICEF and WHO 1 3.7; 3.8
UNWOMEN UN Women calls for this indicator to be disaggregated by location and income group.
WHO Household surveys, health facility data 2
UNFPA Household surveys (DHS and MICS); Health Facility Data WHO, UNICEF 2
CRVS, household surveys, censuses, health facility data, RAMOS, confidential enquiries, modelling
Maternal Mortality Expert and Interagency Group (MMEIG), led by WHO with UNICEF, UNFPA, World Bank, UNDESA; data - all countries, global database available; bi-annual global reporting
Estimates by UN Interagency Maternal mortality Estimation Interagency Group (MMEIG) based on national data from vital registration, household surveys, surveillance or sample registration systems, Census and RAMOS,
UN Women calls for this indicator to be disaggregated by causes of maternal death, where data allows.
No change; [Maternal deaths per 100,000 live births]: annual number of female deaths from any cause related to or aggravated by pregnancy or its management (excluding accidental or incidental causes) during pregnancy and childbirth or within 42 days of termination of pregnancy, irrespective of the duration and site of the pregnancy, per 100 000 live births, for a specified time period
CRVS, household surveys, censuses, health facility data, confidential enquiries, modelling
Maternal Mortality Expert and Interagency Group (MMEIG), led by WHO with UNICEF, UNFPA, World Bank, UNDESA; data - all countries, global database available; bi-annual global reporting
[Maternal deaths per 100,000 live births]: annual number of female deaths from any cause related to or aggravated by pregnancy or its management (excluding accidental or incidental causes) during pregnancy and childbirth or within 42 days of termination of pregnancy, irrespective of the duration and site of pregnancy, per 100,000 live births, for a specified time period.
CRVS, Household Surveys and Population census, plus modelling by the MMEIG; confidential enquiries
WHO, UNFPA, the World Bank, UNICEF, UNPD. Data available for all UN countries and series for the period 1990-2015
No change; [Percentage of live births attended by skilled health personnel during a specified time period ]
WHO, UNICEF; data - all countries, global database available
[Per cent of births attended by skilled health personnel (SBA) during a specified time period]

List of Indicator Proposals - p. 129 of 265
List of Proposals* Note on Disaggregation: All indicators should be disaggregated by sex, age, residence (U/R) and other characteristics, as relevant and possible.
ContributorName Specification Source Entity Tier Priority InterlinkagesSuggested Indicator Tier I
Suggested Indicator Neonatal mortality rate (deaths per 1,000 live births) Tier I
Indicator 3.2.1 Under-five mortality per 1,000 live births ( AAA ) UNICEF 1
UNWOMEN UN Women calls for this indicator to be disaggregated by sex WHO CRVS, household surveys, censuses 1
Indicator 3.2.2 Neonatal mortality per 1,000 live births ( AAA ) UNICEF 1
UNWOMEN UN Women calls for this indicator to be disaggregated by sex WHO CRVS, household surveys, modelling 2
WHO Household surveys, health facility data 2
Target 3.2 By 2030, end preventable deaths of newborns and children under 5 years of age, with all countries aiming to reduce neonatal mortality to at least as low as 12 per 1,000 live births and under-5 mortality to at least as low as 25 per 1,000 live births.
Under-five mortality rate (deaths per 1,000 live births)
Estimates by The UN Inter-agency Group for Child Mortality Estimation (UN IGME) based on data from household surveys, censuses, vital registration systems, etc.
UN Interagency Group on Child Mortality Estimation (IGME), led by UNICEF and WHO, with UNDESA and World Bank; 3.2.1: Data are available for 196 countries and territories for the period 1990-2014 for 3.2.1, and 191 countries for 3.2.2. For 196 countries and territories there are at least two available data points during this time period for 3.2.1, and for 186 countries for 3.2.2.
Estimates by The UN Inter-agency Group for Child Mortality Estimation (UN IGME) based on data from household surveys, censuses, vital registration systems, etc.
UNICEF, WHO, UN Population Division, World Bank
should be: [Under-five mortality rate (deaths per 1,000 live births)] Estimates by The UN Inter-agency Group for Child Mortality Estimation (UN IGME) based on data from household surveys, censuses, vital registration systems, etc.
UNICEF, WHO, UN Population Division, World Bank
No change; [Probability of a child born in a specific year or period dying before reaching the age of five years, if subject to age-specific mortality rates of that period, expressed per thousand live births.]
UN Interagency Group on Child Mortality Estimation (IGME), led by UNICEF and WHO, with UNDESA and World Bank; Data are available for 196 countries and territories for the period 1990-2014. For 196 countries and territories there are at least two available data points during this time period.
should be: [Neonatal mortality rate (deaths per 1,000 live births) ] Estimates by The UN Inter-agency Group for Child Mortality Estimation (UN IGME) based on data from household surveys, censuses, vital registration systems, etc.
UNICEF, WHO, UN Population Division, World Bank
No change; [Probability of a child born in a specific year or period dying during the first 28 completed days of life, if subject to age-specific mortality rates of that period, expressed per thousand live births. ]
UN Interagency Group on Child Mortality Estimation (IGME), led by UNICEF and WHO, with UNDESA and World Bank; data - Data are available for 191 countries and territories for the period 1990-2014. For 186 countries and territories there are at least two available data points during this time period.
[Full immunization coverage (DTP3 containing vaccine, measles, all recommended vaccines)]
WHO - UNICEF, annual joint reporting; global database available with data for all countries

List of Indicator Proposals - p. 130 of 265
List of Proposals* Note on Disaggregation: All indicators should be disaggregated by sex, age, residence (U/R) and other characteristics, as relevant and possible.Target 3.3 By 2030, end the epidemics of AIDS, tuberculosis, malaria and neglected tropical diseases and combat hepatitis, water-borne diseases and other communicable diseases.
ContributorName Specification Source Entity Tier Priority InterlinkagesSuggested Indicator Tier I
Suggested Indicator TB incidence per 1,000 persons per year CRVS, household surveys, health facility data, modelling Tier I
Suggested Indicator Malaria incident cases per 1,000 person per year Household surveys, health facility data, modelling Tier I
Suggested Indicator Household surveys, health facility data, madling Tier I
Indicator 3.3.1 HIV incidence per 100 susceptible person years (adults, key populations, children, adolescents) ( AAA ) UNAIDS Country owned, internationally-consistent modelled estimates UNAIDS, 158 countries; Updated annually 1 3.2, 3.1, 10.2
UNICEF 1
UNWOMEN UN Women calls for this indicator to be disaggregated by sex. WB Country owned, internationally-consistent modelled estimates UNAIDS, 158 countries 1 3.2, 3.1, 10.2
WHO Household surveys, surveillance, modelling 1
UNFPA Household surveys, surveillance, modelling UNAIDS; WHO; Data - all countries 1
Number of new HIV infections per 1,000 susceptible population (by age, sex, and key populations)
Country owned, internationally-consistent modelled estimates
UNAIDS158 countriesUpdated annually
3.2, 3.1, 10.2; is partly overlapping with 6.1 and 6.2
WHO; data - all countries; global database available; annual reporting
WHO; data - all countries; global database available; annual reporting
Estimated number of new hepatitis B infections per 100,000 population in a given year
WHO - data: estimates under development for all countries;
[ Number of new HIV infections per 1000 susceptible population (by age, sex, and key populations) ]
The target is "Reducing new HIV infections among adults to below 200,000", but the indicator is a case rate - number of new HIV infections per 1000 susceptible population. The proposed indicator is not consistent with the target which is a number, i.e. 200,000 new infections by 2030. If the indicator remains as a case rate, then replace the word 'susceptible' with 'uninfected population'. Susceptible is ambiguous and subject to multiple interpretations, if all that is intended to mean is 'uninfected population'. OR Simplify the indicator to ["Number of new infections"] so it is in line with the current wording of the target.
We suggest changing to [\Number of new HIV infections per 1000 susceptible population (by age, sex, and key populations)" ]
No change; [Number of new HIV infections per 1,000 person years among susceptible persons]
UNAIDS, WHO; data - all countries; global database available; biannual reporting for countries, annual for regions and global
[Number of new HIV infections per 1,000 person years among susceptible persons (age, sex, key populations)]

List of Indicator Proposals - p. 131 of 265
List of Proposals* Note on Disaggregation: All indicators should be disaggregated by sex, age, residence (U/R) and other characteristics, as relevant and possible.Indicator 3.3.2 HIV/AIDS deaths per 100,000 population ( AAA )
UNAIDS Country owned, internationally-consistent modelled estimates UNAIDS, 158 countries, Updated annually 2 3.2, 3.1, 10.2
UNICEF 1
UNWOMEN UN Women calls for this indicator to be disaggregated by sex. WB Country owned, internationally-consistent modelled estimates UNAIDS, 158 countries 2 3.2, 3.1, 10.2
WHO CRVS, household surveys, health facility data, modelling 2
UNFPA CRVS, household surveys, health facility data, modelling UNAIDS, WHO; data - all countries 2
Indicator 3.3.3 TB incidence per 1,000 person years ( AAA ) UNICEF [TB incidence per 1,000 person years] UNWOMEN UN Women calls for this indicator to be disaggregated by sex. WHO CRVS, household surveys, health facility data, modelling 1
Indicator 3.3.4 Number of TB deaths ( AAA ) UNWOMEN UN Women calls for this indicator to be disaggregated by sex. WB
WHO CRVS, household surveys, health facility data, modelling 2
Indicator 3.3.5 Malaria incident cases per 1,000 person years ( AAA ) UNICEF [Malaria incident cases per 1,000 person years] UNWOMEN UN Women calls for this indicator to be disaggregated by sex. WHO Household surveys, health facility data, modelling 1
Indicator 3.3.6 Malaria deaths per 100,000 population ( AAA ) UNWOMEN UN Women calls for this indicator to be disaggregated by sex. WHO CRVS, household surveys, health facility data, modelling 2
Indicator 3.3.7 Prevalence of hepatitis B surface antigen in children under 5 ( BBA ) UNWOMEN UN Women calls for this indicator to be disaggregated by sex. WHO Household surveys, health facility data, modelling 1
Indicator 3.3.8 Presence of 13 IHR core capacities for surveillance and response ( BBB ) WHO Move to 3.d.1 Now as indicator 3.d.1 WHO [Number of people requiring interventions against neglected tropical diseases] Household surveys, health facility data, administrative data WHO - data: all countries 2
[AIDS-related deaths per 100,000 of the total population (by age, sex, and key populations)]
Similar to the comments above, the target is a number, i.e. zero AIDS-related deaths, while the indicator is a case rate. It is not, therefore, clear what the ideal case rate threshold should be that countries would use for measuring progress. Also need to clarify whether this will be based on all the population in the country, or only the total number of people living with HIV, so it is more specific to the intended target population. Alternatively simplify the indicator to ['number of AIDS related deaths'] to be in line with the wording of the proposed target.
We suggest changing terminology to ["AIDS-related deaths per 100,000 population"]
No change; [Estimated number of adults and children that have died due to HIV/AIDS in a specific year, expressed as a rate per 100 000 population]
UNAIDS, WHO; data - all countries; global database available; biannual reporting for countries, annual for regions and global
[Estimated number of adults and children that have died due to HIV/AIDS in a specific year, expressed as a rate per 100,000 population.]
["TB incidence per 1,000 persons per year"] - No change; Estimated number of new and relapse tuberculosis (TB) cases arising in a given year, expressed as the rate per 100 000 population. All forms of TB are included, including cases in people living with HIV
WHO; data - all countries; global database available; annual reporting
We suggest changing to [\Number of deaths attributable to tuberculosis (TB) in a given year, expressed as the rate per 100 000 population"]
No change; [Estimated number of deaths attributable to tuberculosis (TB) in a given year, excluding HIV-positive TB deaths]
WHO; data - all countries; global database available; annual reporting
No change; [Number of confirmed reported malaria cases per 1000 persons per year] WHO; data - all countries; global database available; annual reporting
No change; [Number of adults and children that have died due to malaria in a specific year, expressed as a rate per 100 000 population]
WHO; data - all countries; global database available; annual reporting
Replace: [Estimated number of new hepatitis B infections per 100,000 population in a given year]
WHO - data: estimates under development for all countries;

List of Indicator Proposals - p. 132 of 265
List of Proposals* Note on Disaggregation: All indicators should be disaggregated by sex, age, residence (U/R) and other characteristics, as relevant and possible.Target 3.4 By 2030, reduce by one third premature mortality from non-communicable diseases through prevention and treatment and promote mental health and well being.
ContributorName Specification Source Entity Tier Priority InterlinkagesSuggested Indicator CRVS, household surveys WHO; data - all countries Tier II
Indicator 3.4.1 Probability of dying of cardiovascular disease, cancer, diabetes, or chronic respiratory disease between ages 30 and 70 ( BAA ) UNWOMEN UN Women calls for this indicator to be disaggregated by sex and income. WHO CRVS, household surveys WHO; data - all countries 1
Indicator 3.4.2 Current tobacco use among persons 15 years and over ( AAA ) UNWOMEN UN Women calls for this indicator to be disaggregated by sex, age and income.
WHO Move to 3.a.1 Now as Indicator 3.a.1 Target 3.5 Strengthen the prevention and treatment of substance abuse, including narcotic drug abuse and harmful use of alcohol
ContributorName Specification Source Entity Tier Priority InterlinkagesSuggested Indicator Tier II
Indicator 3.5.1 Coverage of opioid substitution therapy among opioid-dependent drug users ( BBB ) UNWOMEN UN Women calls for this indicator to be disaggregated by sex and income. WHO Special surveys; administrative records UNODC; global database; annual updating 2
UNODC 1
Indicator 3.5.2 Coverage of interventions for the prevention of substance abuse interventions among people under 25 ( BBB ) UNWOMEN UN Women calls for this indicator to be disaggregated by sex and income. WHO Administrative records 1
UNODC 2
Target 3.6 By 2020, halve the number of global deaths and injuries from road traffic accidents ContributorName Specification Source Entity Tier Priority Interlinkages
Suggested Indicator Number of road traffic fatal injury deaths per 100 000 population (age-standardized) CRVS, household surveys, administrative records Tier I
Indicator 3.6.1 Number of deaths due to road traffic accidents ( AAA ) UNWOMEN UN Women calls for this indicator to be disaggregated by sex and age. WB Decade of Road Safety
WHO CRVS, household surveys, administrative records 1
Probability of dying of cardiovascular disease, cancer, diabetes, or chronic respiratory disease between ages 30 and 70
No change; [Probability of dying between the exact ages 30 and 70 years from cardiovascular diseases, cancer, diabetes, or chronic respiratory diseases.]
Coverage of treatment interventions (pharmacological, psychosocial and rehabilitation and aftercare services) for substance use disorders
Administrative records;Annual Report Questionnaire Part II Comprehensive Approach to Drug Demand Reduction and Supply as mandated by the Drug Conventions and compiled annually by UNODC; WHO, Global Information System on Alcohol and Health (GISAH); WHO, ATLAS-SU: Resources for Treatment and Prevention of Substance Use Disorders
WHO; data - all countries; global database available; regular global monitoring report; UNODC for drug-related treatments, all countries are mandated to report as a yearly cycle (Response Rate=60-65% of MS)
[Percentage of people who suffer from substance abuse disorders receiving treatment and care (by substance and type)]
Coverage of treatment interventions (pharmacological, psychosocial and rehabilitation and aftercare services) for substance use disorders
Administrative records;Annual Report Questionnaire Part II Comprehensive Approach to Drug Demand Reduction and Supply as mandated by the Drug Conventions and compiled annually by UNODC; WHO, Global Information System on Alcohol and Health (GISAH); WHO, ATLAS-SU: Resources for Treatment and Prevention of Substance Use Disorders
WHO; data - all countries; global database available; regular global monitoring report; UNODC for drug-related treatments, all countries are mandated to report as a yearly cycle (Response Rate=60-65% of MS)
Replace: [Total alcohol per capita (APC) is defined as the total (sum of recorded APC three-year average and unrecorded APC) amount of alcohol consumed per adult (15+ years) over a calendar year, in litres of pure alcohol]
WHO; data - all countries; global database available; regular global monitoring report
Coverage of evidence based and evaluated interventions for the prevention of substance use
Annual Report Questionnaire Part II Comprehensive Approach to Drug Demand Reduction and Supply as mandated by the Drug Conventions and compiled annually by UNODC; WHO, Global Information System on Alcohol and Health (GISAH); WHO, ATLAS-SU: Resources for Treatment and Prevention of Substance Use Disorders
UNODC for drug-related prevention, all countries are mandated to report as a yearly cycle (Response Rate=60-65% of MS) and WHO for alcohol
WHO and UN Road Safety Collaboration data collation data - all countries; global database available; annual updating, regular global report
is partly overlapping with 11.2
Consider changing to ["Fatalities due to road crashes" (this target is in place as part of the UN global Decade of Action on Road Safety, Note that the target deadline is 2020)."]
WHO and UN Road Safety Collaboration data collation
No change: [Number of road traffic fatal injury deaths per 100 000 population (age-standardized)]
WHO; data - all countries; global database available; annual updating, regular global report

List of Indicator Proposals - p. 133 of 265
List of Proposals* Note on Disaggregation: All indicators should be disaggregated by sex, age, residence (U/R) and other characteristics, as relevant and possible.
ContributorName Specification Source Entity Tier Priority InterlinkagesSuggested Indicator Household surveys Tier I
Suggested Indicator Adolescent birth rate (10-14; 15-19) per 1,000 women in that age group CRVS, household surveys, censuses Tier I 5.3, 5.6
Indicator 3.7.1 Adolescent birth rate (10-14, 15-19) ( AAA ) UNICEF [Adolescent birth rate (10-14, 15-19)] Household Surveys UNWOMEN
WHO CRVS, household surveys, censuses 2 Target 5.3 and 5.6
UNFPA [Adolescent birth rate (10-14; 15-19) years per 1,000 women in that age group.] Vital statistics and household surveys (DHS and MICS) UNPD, UNFPA 2
Indicator 3.7.2 Demand satisfied with modern contraceptives ( BBA ) UNICEF [Demand satisfied with modern contraceptives] Household Surveys WB
WHO Household surveys 1 Target 5.6
Target 3.7 By 2030, ensure universal access to sexual and reproductive health-care services, including for family planning, information and education, and the integration of reproductive health into national strategies and programmes.
Percentage of women of reproductive age (15-49 years) who have their need for family planning satisfied with modern methods.
UNDESA, UNFPA; Data are available for 138 countries and territories for the period 1990-2014; 90 countries and territories have at least two available data points.
183 countries and territories have data on contraceptive prevalence (one component of this indicator); 156 countries and territories have at least two data points.
UNDESA; Data for the adolescent birth rate (15-19) are available for 225 countries and territories for the period 1990-2014; 223 countries and territories have at least two data points. Data on births to mothers under the age of 15 are available for at least 102 countries and territories for the period 2000-2014, UNFPA.
UN Women recommends giving priority 1 to indicator 3.7.2 [Demand satisfied with modern contraceptives.] The indicator should be disaggregated by income group, rural/urban location and other context specific factors.
[Annual number of births to women aged 15-19 years per 1,000 women in that age group.] The birth rate among adolescents younger than age 15 is more meaningfully measured for ages 12-14 as births among 10-11 year olds are rare and a rate with respect to the 10-14 year old population would not correctly reflect the increased risk of early childbearing by age.
UNDESA; Data for the adolescent birth rate (15-19) are available for 225 countries and territories for the period 1990-2014; 223 countries and territories have at least two data points. Data on births to mothers under the age of 15 are available for at least 102 countries and territories for the period 2000-2014.
The global RH community has suggested this. The question is whether it will be easy to track and interpret. [Contraceptive prevalence rate] which is commonly measured in surveys (DHS and MICS) and is MDG indicator is an alternative
[Percentage of women of reproductive age (15-49 years) who have their need for family planning satisfied with modern methods.] The numerator is the percentage of women of reproductive age (15-49 years old) who are currently using, or whose sexual partner is currently using, at least one modern contraceptive method. The denominator is the total demand for family planning (the sum of contraceptive prevalence (any method) and the unmet need for family planning.
UNDESA, UNFPA; Data are available for 138 countries and territories for the period 1990-2014; 90 countries and territories have at least two available data points. 183 countries and territories have data on contraceptive prevalence (one component of this indicator); 156 countries and territories have at least two data points.

List of Indicator Proposals - p. 134 of 265
List of Proposals* Note on Disaggregation: All indicators should be disaggregated by sex, age, residence (U/R) and other characteristics, as relevant and possible.
UNFPA Household surveys (DHS and MICS) UNFPA, UNPD 1[Percentage of women of reproductive age (15-49 years) who have their need for family planning satisfied with modern methods.] The numerator is the percentage of women of reproductive age (15-49 years old) who are currently using at least one modern contraceptive method. The denominator is the total demand for family planning (the sum of contraceptive prevalence (any method) and the unmet need for family planning.

List of Indicator Proposals - p. 135 of 265
List of Proposals* Note on Disaggregation: All indicators should be disaggregated by sex, age, residence (U/R) and other characteristics, as relevant and possible.Target 3.8 Achieve universal health coverage, including financial risk protection, access to quality essential health-care services and access to safe, effective, quality and affordable essential medicines and vaccines for all.
ContributorName Specification Source Entity Tier Priority InterlinkagesSuggested Indicator household surveys and facility data Tier II
Suggested Indicator Household surveys Tier II
Indicator 3.8.1 Fraction of the population protected against impoverishment by out-of-pocket health expenditures ( BBB ) WB
WHO Household surveys, health facility data 1
UNFPA Household surveys, health facility data WHO and World Bank; 1
Coverage of tracer interventions (e.g. child full immunization, ARV therapy, TB treatment, hypertension treatment, skilled attendant at birth, etc.)
WHO and World Bank; data - all countries; WHO global database for tracer indicators available; biannual global progress report on UHC, first in 2015.
is part of 1.2; partly overlapping with 10.4
Fraction of the population protected against catastrophic/impoverishing out-of-pocket health expenditure
WHO and World Bank; data - 89 countries; global database under development; biannual global progress report on UHC, first in 2015
Suggest to consider the following wording: [Financial protection coverage, People experiencing impoverishment due to out-of-pocket health care expenditures (by quintiles), People experiencing catastrophic health expenditures (by quintiles)]
Replace: [Coverage of tracer interventions (e.g. child full immunization, ARV therapy, TB treatment, hypertension treatment, skilled attendant at birth, etc.).] NOTE: Coverage of tracer interventions may include: antenatal care (4+ visits), NTD preventive chemotherapy, ARV therapy, TB treatment, ITN use; also pneumonia care seeking, diarrhoea treatment with ORS+zinc in children, ACT for malaria treatment, treatment severe mental illness, coverage emergency obstetrics care, hypertension treatment, diabetes treatment etc. Indicators in other targets also used for monitoring 3.8 are skilled birth attendance, immunization coverage, demand for modern contraceptives satisfied, coverage of treatment and care for people who suffer from substance abuse, harmful use of alcohol, air pollution levels, and tobacco use.
WHO and World Bank; data - all countries; WHO global database for tracer indicators available; biannual global progress report on UHC, first in 2015
Replace: [Coverage of tracer interventions (e.g., child full immunisation, ARV therapy, TB treatment, skilled birth attendance, etc.).] *Coverage of tracer interventions may include: antenatal care, NTD preventive chemotherapy, ARV therapy, TB treatment, ITN use, also pneumonia care seeking and diarrhoea treatment with ORS+zinc in children; treatment severe mental illness; coverage emergency obstetric care, etc.

List of Indicator Proposals - p. 136 of 265
List of Proposals* Note on Disaggregation: All indicators should be disaggregated by sex, age, residence (U/R) and other characteristics, as relevant and possible.Indicator 3.8.2 Fraction of households protected from incurring catastrophic out-of-pocket health expenditure ( CBB )
UNCDF Global Findex 2
WB
WHO Household surveys 1
UNFPA Household Surveys WHO and World Bank; 2
UNICEF [Proportion of births attended by skilled health personnel] Household Surveys (will also start producing modelled time series from 2016) UNICEF and WHO 1 3.7; 3.8
UNICEF [Proportion of pregnant women who had at least four antenatal care visits ] Household Surveys (will also start producing modelled time series from 2016) UNICEF and WHO 2 3.7; 3.8
UNICEF WHO and UNICEF estimates of national immunization coverage (WUENIC) UNICEF and WHO 2 3.8
UNICEF WHO and UNICEF estimates of national immunization coverage (WUENIC) WHO and UNICEF 1
UNICEF [Proportion of children under-five sleeping under an insecticide treated bed net] UNICEF 1
UNICEF Household surveys UNICEF 1
UNICEF Household surveys UNICEF 1
UNICEF [Proportion of children with diarrhoea who received ORS and Zinc ] Household surveys UNICEF 1
Alternative Indicator: [Adults who personally paid for health insurance] World Bank - Data is available for 142 countries
[Essential health services coverage (promotion and prevention).] This will comprise of the following: Women with at least four antenatal care visit during pregnancy (by quintile), Contraceptive prevalence rate among women of reproductive age (by quintile), Postnatal care visit within two days of birth (by quintile), Children fully immunized (by quintile) Essential health services coverage (treatment and rehabilitation,), Births attended by skilled health personnel (by quintile), Smear-positive tuberculosis treatment-success rate (by quintile), Eligible adults and children currently receiving antiretroviral therapy (by quintile), Children under 5 with fever who are treated with appropriate anti-malarial drugs (by quintile), Under-fives with suspected pneumonia taken to an appropriate health-care provider (by quintile), Under-fives with diarrhoea receiving oral rehydration and continued feeding (by quintile), Children under five years old suffering from stunting (height for age) (by quintile), Non-use of tobacco among age 15 years or more (by quintile), Population using improved drinking-water sources (by quintile), Population using improved sanitation facilities (by quintile)
No change: [Fraction of the population protected against catastrophic/impoverishing out-of-pocket health expenditure]
WHO and World Bank; data - 89 countries; global database under development; biannual global progress report on UHC, first in 2015
Replace: [Fraction of the population protection against catastrophic and impoverishing out-of-pocket health spending]
[Proportion of children age 12-23 months who received third dose of DPT containing vaccine]
[number and percentage of 194 World Health Assembly Member States that reach >/=90% national coverage for all vaccines in their national immunization schedule, unless otherwise recommended (3 doses of DTP containing vaccine, 3 doses of polio vaccine, 1 dose of MCV for all Member States and BCG for Member States where included in the schedule as well as three doses of Hepatitis B vaccine, three doses of Hib vaccine, two or three (depending on vaccine used) doses of PCV, and two or three (depending on vaccine used) doses of rotavirus vaccine.]
Household surveys (modelled time series data using program data on nets delivered and distributed and household surveys)
[Proportion of children with suspected pneumonia who sought care from health facility or provider]
[Proportion of children with diarrhoea who sought care from health facility or provider ]

List of Indicator Proposals - p. 137 of 265
List of Proposals* Note on Disaggregation: All indicators should be disaggregated by sex, age, residence (U/R) and other characteristics, as relevant and possible.Target 3.9 By 2030, substantially reduce the number of deaths and illnesses from hazardous chemicals and air, water and soil pollution and contamination.
ContributorName Specification Source Entity Tier Priority InterlinkagesSuggested Indicator Administrative records; satellite data Tier I
Indicator 3.9.1 Population in urban areas exposed to outdoor air pollution levels above WHO guideline values ( BBB ) UNEP 6.2, 6.3,
WHO No change Administrative records; satellite data 1
Target 3.a Strengthen the implementation of the World Health Organization Framework Convention on Tobacco Control in all countries, as appropriate. ContributorName Specification Source Entity Tier Priority Interlinkages
Suggested Indicator Household surveys Tier I
WHO Household surveys 1
ContributorName Specification Source Entity Tier Priority InterlinkagesSuggested Indicator Facility surveys WHO; data - all countries Tier I
WHO Facility surveys WHO; data - all countries 1
ContributorName Specification Source Entity Tier Priority InterlinkagesSuggested Indicator Health worker density and distribution Census, household surveys, health facility data, administrative systems Tier I
WHO National Health Accounts 2
WHO Census, household surveys, health facility data, administrative systems 1
Target 3.d Strengthen the capacity of all countries, in particular developing countries, for early warning, risk reduction and management of national and global health risks.
ContributorName Specification Source Entity Tier Priority InterlinkagesSuggested Indicator Country report and independent assessment Tier II
WHO Country report and independent assessment 1
Population in urban areas exposed to outdoor air pollution levels above WHO guideline values
WHO; data - 91 countries in global database; biannual updates planned; OECD also has geospatially-based measures for air pollution exposure with significant granularity at local level. It is rather straightforward to extend country coverage to a global level.
is partly overlapping with 6.3, 11.6 and 12.4
Alternative: [Death and disability (disaggregated by sex and age) from indoor and outdoor air quality, water/sanitation, and contaminated sites ]
Measured against 2012 baseline (note: Global Burden of Disease methodologies) . Data on water/sanitation and contaminated sites can be obtained from the Basel, Rotterdam and Stockholm convention's national reports. Data for small particulate matter due to transportation in urban areas.
WHO , and Secretariats of the Basel, Rotterdam and Stockholm Conventions. National air quality observatories.
WHO; data - 91 countries in global database; biannual updates planned
Tobacco use among persons 18 years and older
Age-standardized prevalence of current tobacco use among persons aged 18 years and older
WHO; data - all countries; global database available; regular global reporting
[Tobacco use among persons 18 years and older]: Age-standardized prevalence of current tobacco use among persons aged 18 years and older
WHO; data - all countries; global database available; regular global reporting
Target 3.b Support the research and development of vaccines and medicines for the communicable and non-communicable diseases that primarily affect developing countries, provide access to affordable essential medicines and vaccines, in accordance with the Doha Declaration on the TRIPS Agreement and Public Health, which affirms the right of developing countries to use to the full the provisions in the Agreement on Trade-Related Aspects of Intellectual Property Rights regarding flexibilities to protect public health, and, in particular, provide access to medicines for all.
Proportion of population with access to affordable essential medicines on a sustainable basis
[Access to affordable essential medicines]: [Proportion of population with access to affordable essential medicines on a sustainable basis]
Target 3.c Substantially increase health financing and the recruitment, development, training and retention of the health workforce in developing countries, especially in least developed countries and small island developing States.
WHO; data - all countries; global database available; annual updating
[General government expenditure on health as % of GDP]: Current expenditure on health by general government and compulsory schemes (% current expenditure on health)
WHO; data - all countries; global database available; annual updating
[Health worker density and distribution:] Number of health workers per 10000 population (by categories, geographic distribution, place of employment, etc.)
WHO; data - all countries; global database available; annual updating
Percentage of attributes of 13 core capacities that have been attained at a specific point in time.
WHO; data - all countries; global database available; regular updating
Percentage of attributes of 13 core capacities that have been attained at a specific point in time. The 13 core capacities are: (1) National legislation, policy and financing, (2) Coordination and National Focal Point communications; (3) Surveillance; (4) Response; (5) Preparedness; (6) Risk communication; (7) Human resources; (8) Laboratory; (9) Points of entry; (10) Zoonosis; (11) Food safety; (12) Chemical; (13) Radionuclear.
WHO; data - all countries; global database available; regular updating
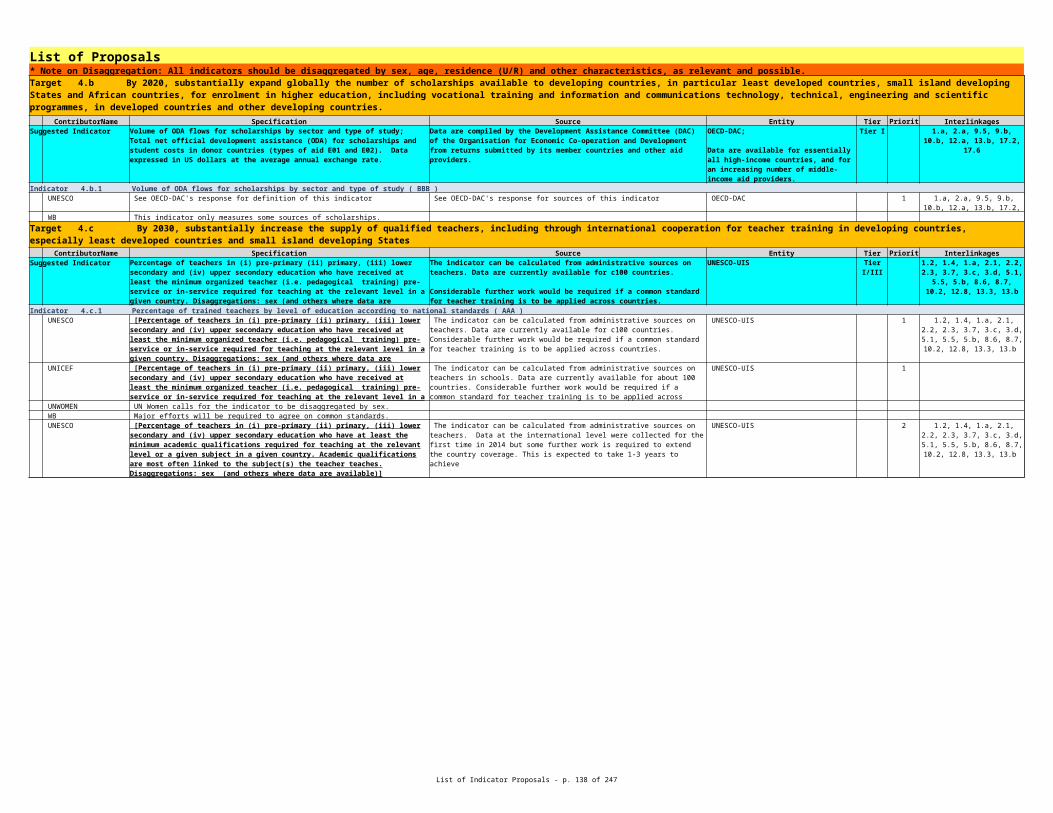
List of Indicator Proposals - p. 138 of 265
List of Proposals* Note on Disaggregation: All indicators should be disaggregated by sex, age, residence (U/R) and other characteristics, as relevant and possible.Goal 4 Ensure inclusive and equitable quality education and promote lifelong learning opportunities for all Target 4.1 By 2030, ensure that all girls and boys complete free, equitable and quality primary and secondary education leading to relevant and effective learning outcomes.
ContributorName Specification Source Entity Tier Priority InterlinkagesSuggested Indicator Tier III
Indicator 4.1.1 Percentage of children who achieve minimum proficiency standards in reading and mathematics at end of: (i) primary (ii) lower secondary ( BAA ) UNESCO 1
UNICEF 1
UNWOMEN UN Women calls for the indicator to be disaggregated by sex. WB
Indicator 4.1.2 Completion rate (primary, lower secondary, upper secondary) ( AAA ) UNESCO 2
UNICEF 2
UNWOMEN UN Women calls for the indicator to be disaggregated by sex. WB
Percentage of children/young people at the end of each level of education achieving at least a minimum proficiency level in (a) reading and (b) mathematics. Disaggregations: sex, location, wealth (and others where data are available)
Various international (eg PIRLS, PISA, TIMSS), regional learning assessments (eg LLECE, SACMEQ, PASEC) national and citizen-led learning assessments.
Data are available at the primary level for about 50 countries from PIRLS and at lower secondary level for about 70 countries from PISA and 65 countries from TIMSS. Once the learning scale has been created the existing results can be reported according to a common scale. This is expected to take 3-5 years to achieve.
UNESCO-UIS will form a broad technical group including Member States to develop and maintain measures.
UNESCO-UIS will compile data from learning assessments conducted by other organizations and transform them to the common learning scale.
1.2, 1.4, 1.5, 2.1, 2.2, 2.3, 3.1, 3.3, 3.4, 3.7, 3.c, 5.3, 5.4, 5.5,
5.b,7.a, 8.6, 8.7, 8.b, 10.2, 10.6, 12.8, 13.3, 13.b, 16.a;
is part of 4.5
[Percentage of children/young people at the end of each level of education achieving at least a minimum proficiency level in (a) reading and (b) mathematics.] These minimum proficiency levels will be defined with reference to a new universal learning scale which is being developed to allow for the calibration of different assessments according to a common metric. Disaggregations: sex, location, wealth (and others where data are available)
Various international (eg PIRLS, PISA, TIMSS), regional learning assessments (eg LLECE, SACMEQ, PASEC) national and citizen-led learning assessments. Data are available at the primary level for about 50 countries from PIRLS and at lower secondary level for about 70 countries from PISA and 65 countries from TIMSS. Once the learning scale has been created the existing results can be reported according to a common scale. This is expected to take 3-5 years to achieve.
UNESCO-UIS will form a broad technical group including Member States to develop and maintain measures. UNESCO-UIS will compile data from learning assessments conducted by other organizations and transform them to the common learning scale.
1.2, 1.4, 1.5, 2.1, 2.2, 2.3, 3.1, 3.3, 3.4, 3.7, 3.c, 5.3, 5.4, 5.5,
5.b,7.a, 8.6, 8.7, 8.b, 10.2, 10.6, 12.8, 13.3, 13.b, 16.a
[Percentage of children who achieve minimum proficiency standards in reading and mathematics at end of: (i) Grade 2; (ii) primary; and (iii) lower secondary.] UNICEF suggest the inclusion of "grade 2" as a critical stage for monitoring children's learning. Percentage of children/young people at the end of each level of education achieving at least a fixed level in (a) reading and (b) mathematics. The fixed level will vary according to the specific learning assessment used as may the age or grade of the pupils covered. A new universal learning scale is being developed which will allow for the calibration of different assessments according to a common scale.
Various international (eg PIRLS, PISA, TIMSS), regional learning assessments (eg LLECE, SACMEQ, PASEC) and citizen-led assessments. Data are available at the primary level for about 50 countries from PIRLS and at lower secondary level for about 70 countries from PISA and 65 countries from TIMSS. Once the learning scale has been created the existing results can be reported according to a common scale. This is expected to take 3-5 years to achieve.
UNESCO-UIS will form a broad technical group including Member States to develop and maintain measures. UNESCO-UIS will compile data from learning assessments conducted by other organizations and transform them to the common learning scale.
The indicator requires the development of a global metric for each subject as a reference point to which different assessments (national, regional and international) can be anchored. Assessments at other levels (e.g. Grade 2) could be considered.
[Percentage of children/young people aged 3-5 years above the official age for the last grade of each level of education who have completed that level. Disaggregations: sex, location, wealth (and others where data are available)]
Household surveys including DHS, MICS, national surveys which collect data on the highest grade/year of education completed. Currently available for c100 low and middle income countries. Further development work is needed to agree on a common indicator methodology and to extend the coverage especially to more developed countries. This is expected to take a further 1-3 years.
UNESCO-UIS will convene an inter-agency group of experts to develop common methodologies for, initially, completion and participation indicators derived from household surveys. UNESCO-UIS will compile data from household surveys conducted by other organizations.
1.2, 1.4, 1.5, 2.1, 2.2, 2.3, 3.1, 3.3, 3.4, 3.7, 3.c, 5.3, 5.4, 5.5,
5.b,7.a, 8.6, 8.7, 8.b, 10.2, 10.6, 12.8, 13.3, 13.b, 16.a
[Percentage of children/young people aged 3-5 years above the official age for the last grade of each level of education who have completed that level.]
Household surveys including DHS, MICS, national surveys which collect data on the highest grade/year of education completed. Currently available for c100 low and middle income countries. Further development work is needed to agree on a common indicator methodology and to extend the coverage especially to more developed countries. This is expected to take a further 1-3 years.
UNESCO-UIS will convene an inter-agency group of experts to develop common methodologies for, initially, completion and participation indicators derived from household surveys. UNESCO-UIS will compile data from household surveys conducted by other organizations.
This indicator is currently available but work is required to finalise a common methodology and increase the number of surveys available to calculate it.
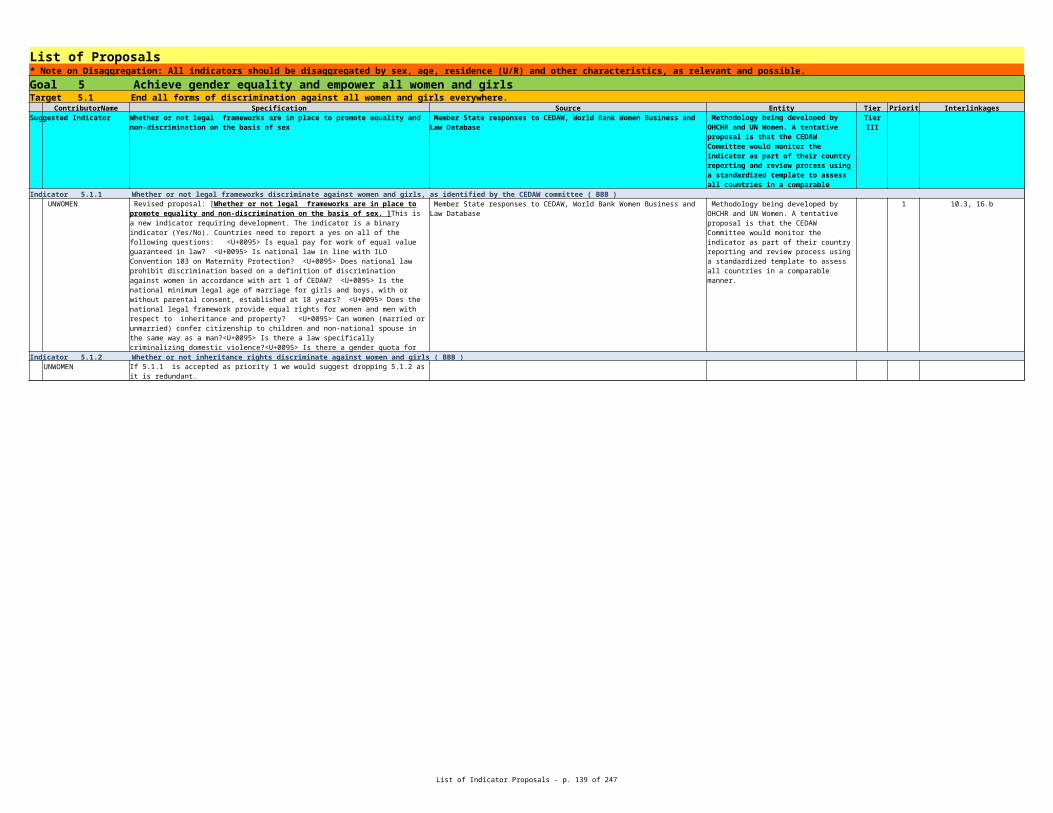
List of Indicator Proposals - p. 139 of 265
List of Proposals* Note on Disaggregation: All indicators should be disaggregated by sex, age, residence (U/R) and other characteristics, as relevant and possible.Target 4.2 By 2030, ensure that all girls and boys have access to quality early childhood development, care and pre-primary education so that they are ready for primary education.
ContributorName Specification Source Entity Tier Priority InterlinkagesSuggested Indicator Tier III
Indicator 4.2.1 Early Childhood Development Index ( BBB ) UNESCO 1 1.4
WB
Indicator 4.2.2 Participation rate in organized learning (one year before the official primary entry age) ( BAB ) UNESCO 2 1.4
UNWOMEN UN Women calls for the indicator to be disaggregated by sex. WB
Percentage of children under 5 years of age who are developmentally on track in health, learning and psychosocial well-being
Disaggregations: sex, location, wealth (and others where data are available)
One possible source is the ECDI from MICS but other sources should be explored in order to ensure that the range of characteristics and their levels are relevant in all parts of the world. This is expected to take 3-5 years to achieve.
The ECDI is currently available for about 30 countries.
UNESCO-UIS will compile data from household surveys conducted by other organizations.
1.4;is part of 4.5
ECDI is replaced by a more generic title ["Percentage of children under 5 years of age who are developmentally on track in health, learning and psychosocial well-being"], but this is essentially the same indicator. The more generic title allows for the use of a wider range of data sources in addition to UNICEF's MICS (from which the ECDI is produced). The indicator is calculated from individual level data (eg from household surveys). It is a composite measure across a range of agreed characteristics which demonstrate the levels of health, learning and psychosocial well-being of each child and whether they exceed a fixed level commensurate with being on-track developmentally in each area for their given age. Disaggregations: sex, location, wealth (and others where data are available)
One possible source is the ECDI from MICS but other sources should be explored in order to ensure that the range of characteristics and their levels are relevant in all parts of the world. This is expected to take 3-5 years to achieve. The ECDI is currently available for about 30 countries.
UNESCO-UIS will compile data from household surveys conducted by other organizations.
This indicator is currently tracked via the Early Childhood Development Index available from MICS but work is needed over the next 3-5 years to examine other alternatives, reach consensus and develop a set of questions for use across surveys.
Proposed modification: ["Participation rate in organized learning (from 24 months to the official primary entry age)"] The age range for the indicator has been widened to include younger children and hence a broader range of organized learning opportunities: Participation rate in organized learning (from 24 months to the official primary entry age). The indicator is the percentage of children in the given age range who participate in one or more organized learning programme. The age range will vary by country though would most commonly cover the age group 2-5 years as 6 years is the most common official age for entry to primary education. Disaggregations: sex, location, wealth (and others where data are available) from household surveys; sex (and others where data are available) from administrative sources
This indicator can be calculated from two different sources: (i) administrative data from schools and other centres of organized learning or (ii) household surveys (eg MICS, DHS, national surveys). The first of these is often limited to formal types of learning and hence may not cover the full range of learning opportunities. It may also double-count children participating in more than one programme in different settings. (The UIS survey currently collects data on both early childhood educational development and pre-primary education by single year of age from 2 years upwards.) The latter may require some adaptation to cover the youngest children and also the full range of learning opportunities. This is expected to take 3-5 years to achieve. Data for the age-group 3 and above is currently available from MICS/DHS for about 60 developing countries.
UNESCO-UIS from administrative sources. UNICEF and others from household surveys. UNESCO-UIS will convene an inter-agency group of experts to develop common methodologies for, initially, completion and participation indicators derived from household surveys. UNESCO-UIS will compile data from household surveys conducted by other organizations.
It is necessary to harmonise this indicator across surveys in two areas: (i) age group of reference (e.g. MICS asks question about 3- to 4-year-olds) and (ii) description of programmes (e.g. many surveys may not capture the concept of organized learning).

List of Indicator Proposals - p. 140 of 265
List of Proposals* Note on Disaggregation: All indicators should be disaggregated by sex, age, residence (U/R) and other characteristics, as relevant and possible.Target 4.3 By 2030, ensure equal access for all women and men to affordable and quality technical, vocational and tertiary education, including university
ContributorName Specification Source Entity Tier Priority InterlinkagesSuggested Indicator Tier II 1.4, 4.4, 5.b, 8.5, 9.2
Indicator 4.3.1 Enrolment ratios by level and type of education (TVET and tertiary) ( AAA ) UNESCO 2
UNICEF 1
UNWOMEN UN Women calls for the indicator to be disaggregated by sex. WB
UNESCO 1 1.4, 4.4, 5.b, 8.5, 9.2
UNICEF 2
Participation rate of adults in formal and non-formal education and training in the last 12 months
This indicator is usually calculated from individual level data collected in household surveys. One such source is the European Union's Adult Education Survey covering about 30 countries. Considerable work is required to develop a set of questions to be applied in labour force or other surveys globally. This is expected to take 1-3 years to achieve.
UNESCO-UIS will convene an inter-agency group of experts to develop common methodologies for, initially, completion and participation indicators derived from household surveys. UNESCO-UIS will compile data from household surveys conducted by other organizations.
["Enrolment ratios by level and type of education: (a) participation rate of 15-24 year olds in TVET and (b) gross enrolment ratio in tertiary education"] *** [This is really two indicators as the TVET one is now proposed as a net participation rate.] Enrolment ratios by level and type of education: (a) participation rate of 15-24 year olds in TVET and (b) gross enrolment ratio in tertiary education (a) the percentage of young people aged 15-24 years participating in technical and vocational education or training (in a given time period eg last 12 months) (b) total enrolments of any age in tertiary education expressed as a percentage of the 5-year age-group immediately following the end of upper secondary education. Disaggregations: sex, location, wealth (and others where data are available) from household surveys; sex (and others where data are available) from administrative sources
These indicators can be calculated from two different sources: (i) administrative data from educational institutions (eg schools, colleges and universities) or (ii) household surveys with specific questions/modules on education and training of those aged 15 years and above. The first of these is often limited to formal types of learning and usually does not cover TVET provided by employers or in other settings then educational institutions. The latter is most easily captured through surveys of individuals. This is expected to take 3-5 years to achieve.
(i) UNESCO-UIS (ii) UNESCO-UIS will compile the data collected in household surveys run by other organizations.
1.4, 3.b, 5.b, 8.5, 8.6, 8.b, 9.2, 9.5, 10.2, 14.a
[This is really two indicators as the TVET one is now proposed as a net participation rate.] [Enrolment ratios by level and type of education: (a) participation rate of 15-24 year olds in TVET and (b) gross enrolment ratio in tertiary education (a) the percentage of young people aged 15-24 years participating in technical and vocational education or training (in a given time period eg last 12 months) (b) total enrolments of any age in tertiary education expressed as a percentage of the 5-year age-group immediately following the end of upper secondary education]
These indicators can be calculated from two different sources: (i) administrative data from educational institutions (eg schools, colleges and universities) or (ii) household surveys with specific questions/modules on education and training of those aged 15 years and above. The first of these is often limited to formal types of learning and usually does not cover TVET provided by employers or in other settings then educational institutions. The latter is most easily captured through surveys of individuals. This is expected to take 3-5 years to achieve.
(i) UNESCO-UIS (ii) UNESCO-UIS will compile the data collected in household surveys run by other organizations.
Enrolment ratio for tertiary is available. Data are available on technical-vocational enrolment in upper secondary, post-secondary non-tertiary and short-cycle tertiary education. There are difficulties in collecting data by age and TVET in settings other than formal schools/universities.
New proposal (previously under Target 4.3 but we think it fits better under 4.4): [Participation rate of adults in formal and non-formal education and training in the last 12 months.] The percentage of people in a given age-range (eg 25-64 years) participating in education or training in the 12 months prior to being interviewed. Disaggregations: sex, location, wealth (and others where data are available)
This indicator is usually calculated from individual level data collected in household surveys. One such source is the European Union's Adult Education Survey covering about 30 countries. Considerable work is required to develop a set of questions to be applied in labour force or other surveys globally. This is expected to take 1-3 years to achieve.
UNESCO-UIS will convene an inter-agency group of experts to develop common methodologies for, initially, completion and participation indicators derived from household surveys. UNESCO-UIS will compile data from household surveys conducted by other organizations.
New proposal (previously under Target 4.4 but we think it fits better under 4.3): [Participation rate in formal and non-formal education and training in the last 12 months.] The percentage of people in a given age-range (eg 25-64 years) participating in education or training in the 12 months prior to being interviewed
This indicator is usually calculated from individual level data collected in household surveys. One such source is the European Union's Adult Education Survey covering about 30 countries. Considerable work is required to develop a set of questions to be applied in labour force or other surveys globally. This is expected to take 1-3 (or 3-5?) years to achieve.
UNESCO-UIS will convene an inter-agency group of experts to develop common methodologies for, initially, completion and participation indicators derived from household surveys. UNESCO-UIS will compile data from household surveys conducted by other organizations.

List of Indicator Proposals - p. 141 of 265
List of Proposals* Note on Disaggregation: All indicators should be disaggregated by sex, age, residence (U/R) and other characteristics, as relevant and possible.Target 4.4 By 2030, substantially increase the number of youth and adults who have relevant skills, including technical and vocational skills, for employment, decent jobs and entrepreneurship
ContributorName Specification Source Entity Tier Priority InterlinkagesSuggested Indicator Percentage of youth/adults with ICT skills by type of skill Tier I 5.b, 8.5, 8.6, 8.b, 9.2, 9.c
Indicator 4.4.1 Participation rate in formal and non-formal education and training in the last 12 months among 25-64 year-olds ( BAB ) UNESCO 2 1.4, 4.3, 5.b, 8.5, 9.2
UNICEF
UNWOMEN UN Women calls for the indicator to be disaggregated by sex. WB
Indicator 4.4.2 Percentage of youth/adults who are computer and information literate ( BBB ) ILO 1
UNESCO 1 5.b, 8.5, 8.6, 8.b, 9.2, 9.c
UNICEF Already collected by ITU. See indicator 5.b.2 for further details. ITU 1
UNWOMEN UN Women calls for the indicator to be disaggregated by sex. WB 4.3, 5.b, 8.2, 8.3
Already collected by ITU. See ITU's response on indicator 5.b.2 for further details.
International Telecommunications Union (ITU)
Suggest to move this indicator to Target 4.3 as it is a measure of participation not a measure of skills acquired. [The percentage of people in a given age-range (eg 25-64 years) participating in education or training in the 12 months prior to being interviewed. Disaggregations: sex, location, wealth (and others where data are available)]
This indicator is usually calculated from individual level data collected in household surveys. One such source is the European Union's Adult Education Survey covering about 30 countries. Considerable work is required to develop a set of questions to be applied in labour force or other surveys globally. This is expected to take 1-3 years to achieve.
UNESCO-UIS will convene an inter-agency group of experts to develop common methodologies for, initially, completion and participation indicators derived from household surveys. UNESCO-UIS will compile data from household surveys conducted by other organizations.
Suggest to move this indicator to Target 4.3 as it is a measure of participation not a measure of skills acquired.
Currently data are only available on adult education in European Union countries. Considerable work is required to develop a set of questions to be applied in labour force or other surveys globally.
Alternative indicator: ["Skills mismatch index"]. Justification: Computer and information literacy is a narrow indicator to access the level of skills for employment. The skills mismatch index captures the underutilization or inadequate employment related to skills by occupation and other variables and therefore captures the decent aspect of jobs.
Household surveys (LFS, HIES, LSMS, Integrated HH surveys, etc.). Currently calculations only available based on European LFS.
Responsible entity: ILO. Availability: ILO skills mismatch index available for 33 countries.
["Percentage of youth/adults with ICT skills by type of skill"] *** The name of the indicator has been modified to better reflect the proposal of the Partnership on Measuring ICT for Development: Percentage of youth/adults with ICT skills by type of skill. According to UN definitions, youth are in the age group 15-24 years and adults are represented by the population aged 15 years and above. See ITU's response on indicator 5.b.2 for further details. Disaggregations: sex (and others where data are available)
Already collected by ITU. See ITU's response on indicator 5.b.2 for further details.
International Telecommunications Union (ITU)
The name of the indicator has been modified to better reflect the proposal of the Partnership on Measuring ICT for Development: [Percentage of youth/adults with ICT skills by type of skill.] Youth are normally defined as the age group 15-24 years. Adults are normally the population aged 15 years and above. See indicator 5.b.2 for further details.
Few surveys (e.g. ICILS) attempt to measure such skills. Major efforts are required to improve global data collection. There is an indicator on Individuals with ICT skills, by type of skill, by age.
Existing Indicator collected and maintained by ITU

List of Indicator Proposals - p. 142 of 265
List of Proposals* Note on Disaggregation: All indicators should be disaggregated by sex, age, residence (U/R) and other characteristics, as relevant and possible.
ContributorName Specification Source Entity Tier Priority InterlinkagesSuggested Indicator Same sources and availability as the underlying indicators themselves Tier I
Indicator 4.5.1 Parity indices (female/male, urban/rural, bottom/top wealth quintile] for all indicators on this list that can be disaggregated ( BBA ) UNESCO Same sources and availability as the underlying indicators themselves. 1
UNICEF Same sources and availability as the underlying indicators themselves. 1 All equity targets
UNWOMEN UIS Data available for over 100 countries
WB
Target 4.5 By 2030, eliminate gender disparities in education and ensure equal access to all levels of education and vocational training for the vulnerable, including persons with disabilities, indigenous peoples and children in vulnerable situations.
Parity indices (female/male, urban/rural, bottom/top wealth quintile] for all indicators on this list that can be disaggregated
UIS;Data available for over 100 countries
All equity targets and targets associated with the
underlying indicators; covers also 4.1, 4.2, 4.3, 4.4,
4.6is part of 5.1
These indices require no additional data than the specific disaggregations of interest. They are simply the ratio of the indicator value for one group to that of the other. Typically the likely more disadvantaged group is the numerator. A value of exactly 1 indicates parity between the two groups. The indicator is not symmetrical about 1 but a simple transformation can make it so (by inverting ratios that exceed 1 and subtracting them from 2). This will make interpretation easier. In addition, education indicators for with disabilities or in conflict-affected or emergency situations will be monitored in line with efforts to improve coverage. Disaggregations: sex, location, wealth (and others such as disability status or conflict-affected as data become available)
Same sources and availability as the underlying indicators themselves.
All equity targets and targets associated with the
underlying indicators
These indices require no additional data than the specific disaggregations of interest. They are simply the ratio of the indicator value for one group to that of the other. Typically the likely more disadvantaged group is the numerator. A value of exactly 1 indicates parity between the two groups. The indicator is not symmetrical about 1 but a simple transformation can make it so (by inverting ratios that exceed 1 and subtracting them from 2). This will make interpretation easier. Other disaggregations such as by disability status should be added as data become available.
Same sources and availability as the underlying indicators themselves.
UN Women supports this indicator and It is included as a Tier I indicators (#24) under the 52 minimum set of gender statistics .
NA (would not be appropriate for other targets)
Alternative ideas instead of the parity index may be: [(i) odds ratio; (ii) concentration index; or (iii) least advantaged group (e.g. poorest rural girls) relative to the mean.] In addition, education indicators for people with disabilities will be monitored in line with efforts to improve coverage.
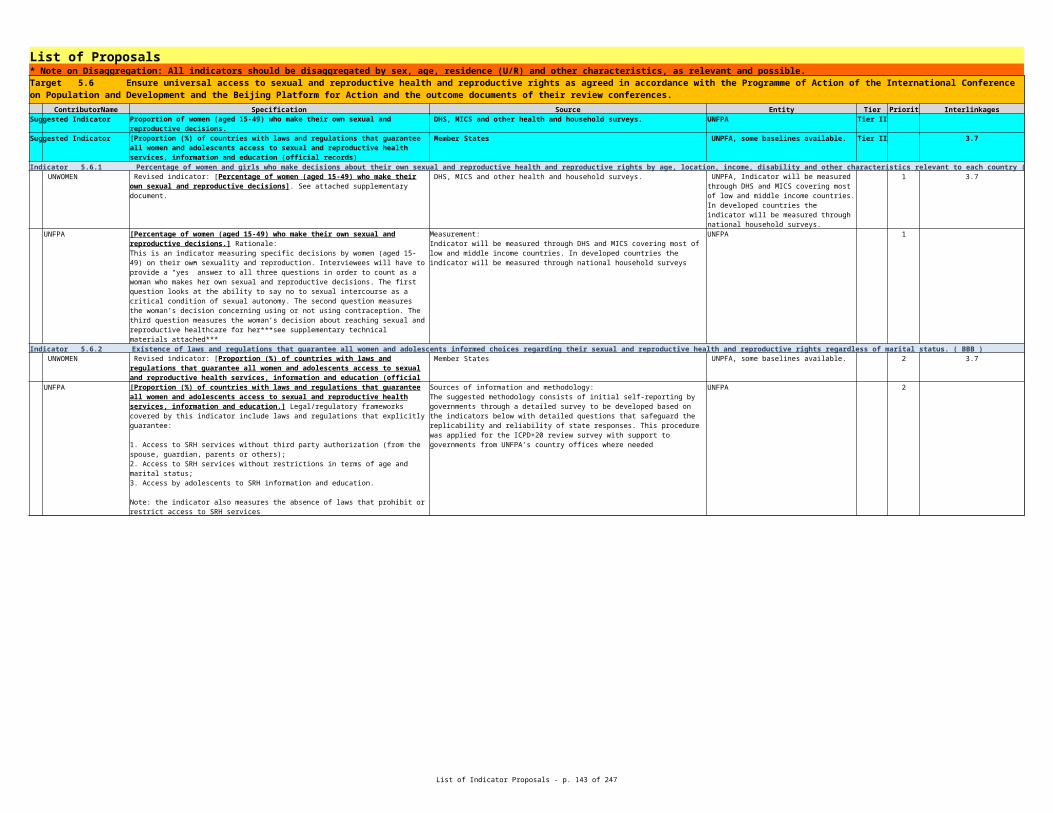
List of Indicator Proposals - p. 143 of 265
List of Proposals* Note on Disaggregation: All indicators should be disaggregated by sex, age, residence (U/R) and other characteristics, as relevant and possible.Target 4.6 By 2030, ensure that all youth and a substantial proportion of adults, both men and women, achieve literacy and numeracy.
ContributorName Specification Source Entity Tier Priority InterlinkagesSuggested Indicator Tier III
Indicator 4.6.1 Percentage of youth/adults proficient in literacy and numeracy skills ( BAA ) UNESCO 1
UNICEF 1
UNWOMEN UN Women calls for the indicator to be disaggregated by sex. WB
Indicator 4.6.2 Youth/adult literacy rate ( AAA ) UNESCO UNESCO-UIS 2
UNICEF UNESCO-UIS 2
UNWOMEN
Percentage of the population in a given age group achieving at least a fixed level of proficiency in functional (a) literacy and (b) numeracy skills.
Disaggregations: sex, location, wealth (and others where data are available)
This indicator is collected via skills' assessment surveys of the adult population.
Currently data are available for 33 mostly high-income countries from PIAAC. Similar information is available for (urban areas of) of 13 low- and middle-income countries from STEP.
Considerable work is required to develop a cost-effective module that can be integrated into national and international surveys. This is expected to take 3-5 years to achieve.
OECD (PIAAC)World Bank (STEP)
UNESCO-UIS will compile the data collected in assessment surveys run by other organizations.
1.2, 1.5, 2.1, 2.2, 2.3, 3.1, 3.3, 3.4, 3.7, 5.3, 5.4, 5.5, 5.6, 8.5,
8.6, 8.b, 10.2, 12.8, 13.3, 13.b,
[Percentage of the population in a given age group achieving at least a fixed level of proficiency in functional (a) literacy and (b) numeracy skills.] According to UN definitions, youth are in the age group 15-24 years and adults are represented by the population aged 15 years and above. Disaggregations: sex, location, wealth (and others where data are available)
This indicator is collected via skills' assessment surveys of the adult population. Currently data are available for 33 mostly high-income countries from PIAAC. Similar information is available for (urban areas of) of 13 low- and middle-income countries from STEP. Considerable work is required to develop a cost-effective module that can be integrated into national and international surveys. This is expected to take 3-5 years to achieve.
OECD (PIAAC), World Bank (STEP), UNESCO-UIS will compile the data collected in assessment surveys run by other organizations.
1.2, 1.5, 2.1, 2.2, 2.3, 3.1, 3.3, 3.4, 3.7, 5.3, 5.4, 5.5, 5.6, 8.5,
8.6, 8.b, 10.2, 12.8, 13.3, 13.b,
[Percentage of the population in a given age group achieving at least a fixed level of proficiency in functional (a) literacy and (b) numeracy skills.] Youth are normally defined as the age group 15-24 years. Adults are normally the population aged 15 years and above.
This indicator is collected via skills' assessment surveys of the adult population. Currently data are available for 33 mostly high-income countries from PIAAC. Similar information is available for (urban areas of) of 13 low- and middle-income countries from STEP. Considerable work is required to develop a cost-effective module that can be integrated into national and international surveys. This is expected to take 3-5 years to achieve.
OECD (PIAAC), World Bank (STEP). UNESCO-UIS will compile the data collected in assessment surveys run by other organizations.
While a number of middle-income (STEP) and high-income (PIAAC) countries have assessed literacy skills of adults, a cost-effective tool needs to be inserted in other surveys for use across countries.
[Percentage of the population in a given age group able to read with understanding a simple sentence about their every day life.] According to UN definitions, youth are in the age group 15-24 years and adults are represented by the population aged 15 years and above. Disaggregations: sex and location (and others where data are available)
Household surveys including DHS, MICS, national surveys and censuses which collect data on literacy skills. Available regularly (at least once every 5-10 years) but not annually for c160 developing countries but few developed countries collect similar data.
1.2, 1.5, 2.1, 2.2, 2.3, 3.1, 3.3, 3.4, 3.7, 5.3, 5.4, 5.5, 5.6, 8.5,
8.6, 8.b, 10.2, 12.8, 13.3, 13.b,
[Percentage of the population in a given age group able to read with understanding a simple sentence about their every day life.] Youth are normally defined as the age group 15-24 years. Adults are normally the population aged 15 years and above.
Household surveys including DHS, MICS, national surveys and censuses which collect data on literacy skills. Available regularly (at least once every 5-10 years) but not annually for c160 developing countries but few developed countries collect similar data.
UN Women supports this indicator and part of it is (Youth literacy rate) included as a Tier I indicators (#20) under the 52 minimum set of gender statistics, but we would like it to be disaggregated by sex.

List of Indicator Proposals - p. 144 of 265
List of Proposals* Note on Disaggregation: All indicators should be disaggregated by sex, age, residence (U/R) and other characteristics, as relevant and possible.
ContributorName Specification Source Entity Tier Priority InterlinkagesSuggested Indicator Tier III
Indicator 4.7.1 Percentage of 15- year old students showing proficiency in knowledge of environmental science and geoscience ( BBB ) UNESCO 1
UNICEF 1
UNWOMEN UN Women calls for the indicator to be disaggregated by sex. WB PISA (2006)
UNFPA Data source: EMIS Annual School Census. UNESCO 1
Target 4.7 By 2030, ensure that all learners acquire the knowledge and skills needed to promote sustainable development, including, among others, through education for sustainable development and sustainable lifestyles, human rights, gender equality, promotion of a culture of peace and non-violence, global citizenship and appreciation of cultural diversity and of culture's contribution to sustainable development.
Percentage of 15-year old students enrolled in secondary school demonstrating at least a fixed level of knowledge across a selection of topics in environmental science and geoscience. The exact choice/range of topics will depend on the survey or assessment in which the indicator is collected.
Disaggregations: sex and location (and others where data are available)
PISA 2006, administered in 57 countries, estimated an “environmental science performance index.”
ICCS 2009, which included 38 countries, contains workable items for larger-scale tracking that will require validation in developing world settings.
ICCS 2016 will provide globally-comparable data on civic knowledge and engagement, and students’ roles in peaceful functioning of schools.
Major efforts will be required to develop a tool for use in other surveys. This is expected to take 3-5 years to achieve.
OECD (PISA), IEA (ICCS)
UNESCO-UIS will compile data from assessments and surveys run by other organizations
1.5, 3.d, 11.6, 12.2, 12.8, 13.1, 13.3, 13.b, 15.9
[Percentage of 15-year old students enrolled in secondary school demonstrating at least a fixed level of knowledge across a selection of topics in environmental science and geoscience.] The exact choice/range of topics will depend on the survey or assessment in which the indicator is collected. Disaggregations: sex and location (and others where data are available)
PISA 2006, administered in 57 countries, estimated an "environmental science performance index." ICCS 2009, which included 38 countries, contains workable items for larger-scale tracking that will require validation in developing world settings. ICCS 2016 will provide globally-comparable data on civic knowledge and engagement, and students' roles in peaceful functioning of schools. Major efforts will be required to develop a tool for use in other surveys. This is expected to take 3-5 years to achieve.
OECD (PISA), IEA (ICCS) UNESCO-UIS will compile data from assessments and surveys run by other organizations
1.5, 3.d, 11.6, 12.2, 12.8, 13.1, 13.3, 13.b, 15.9
[ Percentage of 15-year old students enrolled in secondary school demonstrating at least a fixed level of knowledge across a selection of topics in environmental science and geoscience.] The exact choice/range of topics will depend on the survey or assessment in which the indicator is collected.
PISA 2006, administered in 57 countries, estimated an "environmental science performance index." ICCS 2009, which included 38 countries, contains workable items for larger-scale tracking that will require validation in developing world settings. ICCS 2016 will provide globally-comparable data on civic knowledge and engagement, and students' roles in peaceful functioning of schools. Major efforts will be required to develop a tool for use in other surveys. This is expected to take 3-5 years to achieve.
OECD (PISA), IEA (ICCS), UNESCO-UIS will compile data from assessments and surveys run by other organizations
Only one survey (PISA 2006) attempts to measure such knowledge. Major efforts will be required to develop a global measurement tool. Defining this indicator via the knowledge of environmental science and geoscience is reaching very high. Instead a simple, standardized test could be designed that looks at basic sustainability concepts, such as: land use (long term productivity ensured); biodiversity (humans coexisting with other species); resource security (water, land, mineral resources); consumption, material flows and recycling (how can I consume and manage my waste with maximum sustainability?); pollution (and how it affects basic resources and ecosystem services); population growth, economic growth (how many people, and how much consumption, can an ecosystem support?); fragility of ecosystems (major threats such as climate change, deforestation, pollution, depletion of resources, collapse of ecosystems – e.g. oceans). Such a standardized test would probably show very precisely which level of awareness the youth of a society has. The adult population is of course another matter.
Replace with: [Percentage of schools that provided life skills-based HIV and sexuality education] This indicator is in a testing phase, with the infrastructure in place. Proposal is consistent with indicator 28 of the Framework for Action of the Post 2015 Education agenda (draft version 31 March 2015), Annex I (Technical Advisory Group/TAG proposed indicators).]

List of Indicator Proposals - p. 145 of 265
List of Proposals* Note on Disaggregation: All indicators should be disaggregated by sex, age, residence (U/R) and other characteristics, as relevant and possible.Indicator 4.7.2 Percentage of 13-year old students endorsing values and attitudes promoting equality, trust and participation in governance ( CBB )
UNESCO 1
UNICEF 2
UNWOMEN Country reports UNESCO 2 3.7, 5.6
UNFPA OHCHR 2
[Percentage of 13-year old students enrolled in school supporting a range of values and attitudes promoting equality, trust and participation in governance.] The exact choice/range of values and attitudes will depend on the survey or assessment in which the indicator is collected. Disaggregations: sex and location (and others where data are available)
ICCS 2009, which included 38 countries, has measured such attitudes. Major efforts will be required to develop a tool for use in other surveys. This is expected to take 3-5 years to achieve.
IEA (ICCS), UNESCO-UIS will compile data from assessments and surveys run by other organizations
1.5, 5.2, 5.3, 5.5, 12.8, 13.3, 13.b, 16.1, 16.3, 16.6, 16.7
[Percentage of 13-year old students enrolled in school supporting a range of values and attitudes promoting equality, trust and participation in governance.] The exact choice/range of values and attitudes will depend on the survey or assessment in which the indicator is collected.
ICCS 2009, which included 38 countries, has measured such attitudes. Major efforts will be required to develop a tool for use in other surveys. This is expected to take 3-5 years to achieve.
IEA (ICCS), UNESCO-UIS will compile data from assessments and surveys run by other organizations
Alternative proposal: [Percentage of schools that provide life skills-based HIV and sexuality education.] This indicator is currently proposed as a thematic indicator by Technical Advisory Group on Education. The indicator requires development. An overhaul of the way countries report on this indicator will be required to ensure estimates are better linked to the reality at the school level.
Replace with: [Countries implementing the framework on the World Programme on Human Rights Education] Proposal is consistent with indicator 29 of the Framework for Action of the Post 2015 Education agenda (draft version 31 March 2015), Annex I (Technical Advisory Group/TAG proposed indicators).]
(as per UNGA resolution 59/113, and part of the existing accountability framework as per Recommendation 1974, part of statutory reporting and with a reporting track record. )

List of Indicator Proposals - p. 146 of 265
List of Proposals* Note on Disaggregation: All indicators should be disaggregated by sex, age, residence (U/R) and other characteristics, as relevant and possible.Target 4.a Build and upgrade education facilities that are child, disability and gender sensitive and provide safe, non-violent, inclusive and effective learning environments for all
ContributorName Specification Source Entity Tier Priority InterlinkagesSuggested Indicator UNESCO-UIS and UNICEF Tier II 6.1, 6.2, 7.1, 9.c, 17.8
Indicator 4.a.1 Percentage of schools with access to (i) electricity; (ii) drinking water; and (iii) single-sex sanitation facilities (as per the WASH indicator definitions) ( BAA ) UNESCO UNESCO-UIS and UNICEF 1 6.1, 6.2, 7.1, 9.c, 17.8
UNICEF UNESCO-UIS and UNICEF 1
UNISDR UNISDR
WB Existing data collected by UIS UIS 4.1, 9.1
UNFPA UNESCO
UNESCO Not yet identified 2 1.4, 6.2, 10.210.3
Percentage of schools with access to (i) electricity; (ii) Internet for pedagogical purposes (iii) basic drinking water and (iv) basic sanitation facilities; and (v) basic handwashing facilities (as per the WASH indicator definitions)
The indicator can be calculated from administrative sources on school facilities. Data are currently available on electricity and Internet for c70 countries and on water and sanitation for c100 countries.
Considerable efforts will be required to apply the WASH definitions fully and extend coverage to more countries. This is expected to take 1-3 years.
Proposed modification: ["Percentage of schools with access to (i) electricity; (ii) Internet for pedagogical purposes (iii) basic drinking water and (iv) single-sex basic sanitation facilities; and (v) basic handwashing facilities (as per the WASH indicator definitions)"]. The indicator is the percentage of schools (primary, lower and upper secondary) with each of the facilities listed. Basic drinking water is defined as: A functional drinking water source (MDG 'improved' categories) on or near the premises and water points accessible to all users during school hours. Basic sanitation facilities are defined as: Functional sanitation facilities (MDG 'improved' categories) separated for males and females on or near the premises. Basic handwashing facilities are defined as: Functional handwashing facilities, soap (or ash) and water available to girls and boys. Disaggregations: location and, for basic sanitation and handwashing facilities, sex
The indicator can be calculated from administrative sources on school facilities. Data are currently available on electricity and Internet for c70 countries and on water and sanitation for c100 countries. Considerable efforts will be required to apply the WASH definitions fully and extend coverage to more countries. This is expected to take 1-3 years.
[Percentage of schools with access to (i) electricity; (ii) Internet for pedagogical purposes (iii) basic drinking water and (iv) basic sanitation facilities; and (v) basic handwashing facilities (as per the WASH indicator definitions)] The indicator is the percentage of schools (primary, lower and upper secondary) with each of the facilities listed. Basic drinking water is defined as: A functional drinking water source (MDG 'improved' categories) on or near the premises and water points accessible to all users during school hours. Basic sanitation facilities are defined as: Functional sanitation facilities (MDG 'improved' categories) separated for males and females on or near the premises. Basic handwashing facilities are defined as: Functional handwashing facilities, soap (or ash) and water available to girls and boys
The indicator can be calculated from administrative sources on school facilities. Data are currently available on electricity and Internet for c70 countries and on water and sanitation for c100 countries. Considerable efforts will be required to apply the WASH definitions fully and extend coverage to more countries. This is expected to take 1-3 years.
UNISDR propose ([a) \Number of educational facilities damaged due to disasters" and (b) "Number of countries with critical infrastructure protection plan".] Please see UNISDR input paper attached."
(a) National Disaster Loss Databases, 85 (will be more than 115 by 2016), (b) SFDRR Monitor (to be developed), 0 (but HFA Monitor covered 133 countries in 2013)
(a) 1, (b)2
(a)(b) 9.1, 1.5, 11.5, 13.1, 14.2, 15.3
Could also include \([iv) computers for pedagogical purposes]. However, it should be noted that considerable work is required to extend the coverage of current data collection efforts to all countries."
[Percentage of students experiencing bullying, corporal punishment, harassment, violence, sexual discrimination and abuse] [Proposal is consistent with indicator 34 of the Framework for Action of the Post 2015 Education agenda (draft version 31 March 2015), Annex I (Technical Advisory Group/TAG proposed indicators). Whereas the current indicator addresses physical aspects of an enabling learning environment, the proposed additional indicator addresses social and safety aspects, in line with the target. Given that the target covers multiple areas, the two indicators together try to capture this better than only one.
This indicator is part of an existing accountability framework and available through the Global School-based Student Health Survey by UIS-UNESCO
The indicator is the [percentage of schools (primary, lower and upper secondary) with adapted facilities and resources designed for those with disabilities.] Disaggregations: location
Major preparatory work will be required to develop an approach on the assessment of school conditions for people with disabilities. This is expected to take 3-5 years.

List of Indicator Proposals - p. 147 of 265
List of Proposals* Note on Disaggregation: All indicators should be disaggregated by sex, age, residence (U/R) and other characteristics, as relevant and possible.
ContributorName Specification Source Entity Tier Priority InterlinkagesSuggested Indicator Tier I
Indicator 4.b.1 Volume of ODA flows for scholarships by sector and type of study ( BBB ) UNESCO See OECD-DAC's response for definition of this indicator See OECD-DAC's response for sources of this indicator OECD-DAC 1
WB This indicator only measures some sources of scholarships.
ContributorName Specification Source Entity Tier Priority InterlinkagesSuggested Indicator Tier I/III
Indicator 4.c.1 Percentage of trained teachers by level of education according to national standards ( AAA ) UNESCO UNESCO-UIS 1
UNICEF UNESCO-UIS 1
UNWOMEN UN Women calls for the indicator to be disaggregated by sex. WB Major efforts will be required to agree on common standards. UNESCO UNESCO-UIS 2
Target 4.b By 2020, substantially expand globally the number of scholarships available to developing countries, in particular least developed countries, small island developing States and African countries, for enrolment in higher education, including vocational training and information and communications technology, technical, engineering and scientific programmes, in developed countries and other developing countries.
Volume of ODA flows for scholarships by sector and type of study;Total net official development assistance (ODA) for scholarships and student costs in donor countries (types of aid E01 and E02). Data expressed in US dollars at the average annual exchange rate.
Data are compiled by the Development Assistance Committee (DAC) of the Organisation for Economic Co-operation and Development from returns submitted by its member countries and other aid providers.
OECD-DAC;
Data are available for essentially all high-income countries, and for an increasing number of middle-income aid providers.
1.a, 2.a, 9.5, 9.b, 10.b, 12.a, 13.b, 17.2, 17.6
1.a, 2.a, 9.5, 9.b, 10.b, 12.a, 13.b, 17.2, 17.6
Target 4.c By 2030, substantially increase the supply of qualified teachers, including through international cooperation for teacher training in developing countries, especially least developed countries and small island developing States
Percentage of teachers in (i) pre-primary (ii) primary, (iii) lower secondary and (iv) upper secondary education who have received at least the minimum organized teacher (i.e. pedagogical training) pre-service or in-service required for teaching at the relevant level in a given country. Disaggregations: sex (and others where data are available)
The indicator can be calculated from administrative sources on teachers. Data are currently available for c100 countries.
Considerable further work would be required if a common standard for teacher training is to be applied across countries.
UNESCO-UIS 1.2, 1.4, 1.a, 2.1, 2.2, 2.3, 3.7, 3.c, 3.d, 5.1, 5.5, 5.b, 8.6, 8.7,
10.2, 12.8, 13.3, 13.b
[Percentage of teachers in (i) pre-primary (ii) primary, (iii) lower secondary and (iv) upper secondary education who have received at least the minimum organized teacher (i.e. pedagogical training) pre-service or in-service required for teaching at the relevant level in a given country. Disaggregations: sex (and others where data are available)]
The indicator can be calculated from administrative sources on teachers. Data are currently available for c100 countries. Considerable further work would be required if a common standard for teacher training is to be applied across countries.
1.2, 1.4, 1.a, 2.1, 2.2, 2.3, 3.7, 3.c, 3.d, 5.1, 5.5, 5.b, 8.6, 8.7,
10.2, 12.8, 13.3, 13.b
[Percentage of teachers in (i) pre-primary (ii) primary, (iii) lower secondary and (iv) upper secondary education who have received at least the minimum organized teacher (i.e. pedagogical training) pre-service or in-service required for teaching at the relevant level in a given country. ]
The indicator can be calculated from administrative sources on teachers in schools. Data are currently available for about 100 countries. Considerable further work would be required if a common standard for teacher training is to be applied across countries.
[Percentage of teachers in (i) pre-primary (ii) primary, (iii) lower secondary and (iv) upper secondary education who have at least the minimum academic qualifications required for teaching at the relevant level or a given subject in a given country. Academic qualifications are most often linked to the subject(s) the teacher teaches. Disaggregations: sex (and others where data are available)]
The indicator can be calculated from administrative sources on teachers. Data at the international level were collected for the first time in 2014 but some further work is required to extend the country coverage. This is expected to take 1-3 years to achieve
1.2, 1.4, 1.a, 2.1, 2.2, 2.3, 3.7, 3.c, 3.d, 5.1, 5.5, 5.b, 8.6, 8.7,
10.2, 12.8, 13.3, 13.b

List of Indicator Proposals - p. 148 of 265
List of Proposals* Note on Disaggregation: All indicators should be disaggregated by sex, age, residence (U/R) and other characteristics, as relevant and possible.Goal 5 Achieve gender equality and empower all women and girlsTarget 5.1 End all forms of discrimination against all women and girls everywhere.
ContributorName Specification Source Entity Tier Priority InterlinkagesSuggested Indicator Tier III
Indicator 5.1.1 Whether or not legal frameworks discriminate against women and girls, as identified by the CEDAW committee ( BBB ) UNWOMEN 1 10.3, 16.b
Indicator 5.1.2 Whether or not inheritance rights discriminate against women and girls ( BBB ) UNWOMEN If 5.1.1 is accepted as priority 1 we would suggest dropping 5.1.2 as it is redundant.
Whether or not legal frameworks are in place to promote equality and non-discrimination on the basis of sex
Member State responses to CEDAW, World Bank Women Business and Law Database
Methodology being developed by OHCHR and UN Women. A tentative proposal is that the CEDAW Committee would monitor the indicator as part of their country reporting and review process using a standardized template to assess all countries in a comparable manner.
Revised proposal: [Whether or not legal frameworks are in place to promote equality and non-discrimination on the basis of sex. ]This is a new indicator requiring development. The indicator is a binary indicator (Yes/No). Countries need to report a yes on all of the following questions: <U+0095> Is equal pay for work of equal value guaranteed in law? <U+0095> Is national law in line with ILO Convention 103 on Maternity Protection? <U+0095> Does national law prohibit discrimination based on a definition of discrimination against women in accordance with art 1 of CEDAW? <U+0095> Is the national minimum legal age of marriage for girls and boys, with or without parental consent, established at 18 years? <U+0095> Does the national legal framework provide equal rights for women and men with respect to inheritance and property? <U+0095> Can women (married or unmarried) confer citizenship to children and non-national spouse in the same way as a man?<U+0095> Is there a law specifically criminalizing domestic violence?<U+0095> Is there a gender quota for parliament and local government to accelerate women's representation?
Member State responses to CEDAW, World Bank Women Business and Law Database
Methodology being developed by OHCHR and UN Women. A tentative proposal is that the CEDAW Committee would monitor the indicator as part of their country reporting and review process using a standardized template to assess all countries in a comparable manner.

List of Indicator Proposals - p. 149 of 265
List of Proposals* Note on Disaggregation: All indicators should be disaggregated by sex, age, residence (U/R) and other characteristics, as relevant and possible.Target 5.2 Eliminate all forms of violence against all women and girls in the public and private spheres, including trafficking and sexual and other types of exploitation.
ContributorName Specification Source Entity Tier Priority InterlinkagesSuggested Indicator Tier II
Suggested Indicator Tier II 16.1
Indicator 5.2.1 Proportion of ever-partnered women and girls (aged 15-49) subjected to physical and/or sexual violence by a current or former intimate partner, in the last 12 months ( BAA ) UNICEF Household surveys such as DHS. 1
UNWOMEN 1 Can be used to track 16.1
WB DHS 39 countries GlobalMigrationWG 1 10.7; 16.2
UNFPA UN Women, WHO, UNICEF, UNFPA
Indicator 5.2.2 Proportion of women and girls (aged 15-49) subjected to sexual violence by persons other than an intimate partner, since age 15. ( BAA ) UNWOMEN 2 16.1
WB DHS 39 countries UNFPA , WHO, UNICEF, UNFPA
Proportion of ever-partnered women and girls (aged 15-49) subjected to physical and/or sexual violence by a current or former intimate partner, in the last 12 months
The data would come from DHS and other specialized VAW surveys. Included in the Minimum Set of Gender Indicators
The data would be compiled by UNICEF, UN Women and UNSD -- around 100 but not fully comparable, UNFPA, WHO.
Proportion of women and girls (aged 15-49) subjected to sexual violence by persons other than an intimate partner, since age 15
The data would come from DHS and other specialized VAW surveys. Included in the Minimum Set of Gender Indicators.
The data would be compiled by UNICEF, UN Women, UNSD, UNFPA, and WHO.
[Proportion of ever-partnered women and girls (aged 15-49) subjected to physical and/or sexual violence by a current or former intimate partner, in the last 12 months ]
Unisex maintains a global database on the issue since 2014. Fully comparable data are available for more than 40 low- and middle-income countries. Additional data (based on slightly different definitions) are available for a number of LAMI and high income countries.
This indicator is included as a Tier II indicator under the 52 minimum set of gender statistics endorsed by the Statistical Commission through its decision 44/109. The indicator should be disaggregated by age groups (5 year groups), income, rural/urban location and other context specific factors.
The data would come from DHS and other specialized VAW surveys, not yet compiled by EDGE data portal and Minimum Set of Gender Indicators
The data would be compiled by UNICEF, UN Women and UNSD
[Number of victims of human trafficking per 100,000 persons (5.2 and 16.2).] See full specification in attached meta-data word file
Administrative statistics from the criminal justice system (courts, police, etc.). Current data sources include the UNODC Global Report on Trafficking in Persons, the U.S. Department of State's Trafficking in Persons Report; IOM Trafficked Migrants Assistance Database
Ministries of Justice/Interior, Global Migration Group
[Proportion of ever-partnered women and girls (aged 15-49) subjected to physical and/or sexual violence by a current or former intimate partner, in the last 12 months (explore expansion to women over 49 years of age)]. While disaggregation is currently limited to ages 15-49, we would advocate for efforts to explore expansion of this measurement to women over 49, for possible consideration in a periodic review of the indicators somewhere down the line. UNFPA could lead this effort
Household and specialized surveys using WHO methodology. Data available for majority of countries and trends for few of them.
This is included as a Tier II indicator under the 52 minimum set of gender statistics endorsed by the Statistical Commission through its decision 44/109.
The data would come from DHS and other specialized VAW surveys, , not yet compiled by EDGE and Minimum Set of Gender Indicators
The data would be compiled by UNICEF, UN Women and UNSD
[Proportion of women and girls (aged 15-49) subjected to sexual violence by persons other than an intimate partner, in the last 12 months (explore expansion to women over 49 years of age)]. While disaggregation is currently limited to ages 15-49, we would advocate for efforts to explore expansion of this measurement to women over 49, for possible consideration in a periodic review of the indicators somewhere down the line. UNFPA could lead this effort
Household and specialized surveys using WHO methodology. Data available for majority of countries and trends for few of them.

List of Indicator Proposals - p. 150 of 265
List of Proposals* Note on Disaggregation: All indicators should be disaggregated by sex, age, residence (U/R) and other characteristics, as relevant and possible.Target 5.3 Eliminate all harmful practices, such as child, early and forced marriage and female genital mutilation.
ContributorName Specification Source Entity Tier Priority InterlinkagesSuggested Indicator Tier I
Suggested Indicator Tier I
Indicator 5.3.1 Percentage of women aged 20-24 who were married or in a union before age 18 (i.e. child marriage) ( AAA ) UNICEF Household surveys such as MICS and DHS. 1
UNWOMEN Household surveys such as MICS and DHS. Also relevant for 5.6
WB DHS 90 countries UNFPA Household surveys (DHS and MICS) UNFPA and UNICEF
Indicator 5.3.2 Percentage of girls and women aged 15-49 years who have undergone FGM/C, by age group (for relevant countries only) ( CBB ) UNICEF Household surveys such as MICS and DHS. 2
UNWOMEN Household surveys such as MICS and DHS.
UNFPA [Percentage of girls and women aged 15-19 who have undergone FGM] Household surveys (DHS and MICS) UNFPA, UNICEF
Percentage of women aged 20-24 who were married or in a union before age 18 (i.e. child marriage)
Household surveys such as MICS and DHS. Included in the Minimum Set of Gender Indicators
UNICEF maintains a global database on the issue since 2003. Fully comparable data are available for some 117 low- and middle-income countries. UNICEF is also the agency responsible for reporting on this indicator as part of the UN expert group on gender indicators. UNFPA.
Percentage of girls and women aged 15-49 years who have undergone FGM/C, by age group (for relevant countries only)
Household surveys such as MICS and DHS. Included in the Minimum Set of Gender Indicators
UNICEF maintains a global database on the issue since 2004. Data are available for some 29 low- and middle-income countries where the practice is concentrated. UNICEF is also the agency responsible for reporting on this indicator as part of the UN expert group on gender indicators. UNFPA.
[Percentage of women aged 20-24 who were married or in a union before age 18 (i.e. child marriage) ]
UNICEF maintains a global database on the issue since 2003. Fully comparable data are available for some 117 low- and middle-income countries. UNICEF is also the agency responsible for reporting on this indicator as part of the UN expert group on gender indicators.
Equal priority
[Percentage of women aged 20-24 who were married or in a union before age 18 (i.e. child marriage)]
[Percentage of girls and women aged 15-49 years who have undergone FGM/C, by age group (for relevant countries only) ]
UNICEF maintains a global database on the issue since 2004. Data are available for some 29 low- and middle-income countries where the practice is concentrated. UNICEF is also the agency responsible for reporting on this indicator as part of the UN expert group on gender indicators.
Revised formulation: [Percentage of girls and women aged 15-49 years who have undergone FGM/C, disaggregated by age group with a particular focus on 15-19]. Note: monitoring the 15-19 age group will enable focussing on the most vulnerable age group and would be a more sensitive measure of the impact of policy interventions.
UNICEF maintains a global database on the issue since 2004. Data are available for some 29 low- and middle-income countries where the practice is concentrated. UNICEF is also the agency responsible for reporting on this indicator as part of the UN expert group on gender indicators.
Equal priority

List of Indicator Proposals - p. 151 of 265
List of Proposals* Note on Disaggregation: All indicators should be disaggregated by sex, age, residence (U/R) and other characteristics, as relevant and possible.
ContributorName Specification Source Entity Tier Priority InterlinkagesSuggested Indicator Tier II
Indicator 5.4.1 Average weekly hours spent on unpaid domestic and care work, by sex, age and location (for individuals five years and above) ( CBB ) UNWOMEN Time use surveys 1
WB LSMS and LFS (World Bank) 12 countries Indicator 5.4.2 Proportion of households within 15 minutes of nearest water source ( BBB )
UNWOMEN Household surveys (DHS and MICs) 2 Target 6.1
Target 5.5 Ensure women's full and effective participation and equal opportunities for leadership at all levels of decision-making in political, economic and public life. ContributorName Specification Source Entity Tier Priority Interlinkages
Suggested Indicator Proportion of seats held by women in national parliaments Tier I
Suggested Indicator Proportion of seats held by women in local governments Tier I 16.7
Indicator 5.5.1 Proportion of seats held by women in local governments ( AAA ) UNWOMEN Member States 1 16.7
Indicator 5.5.2 Proportion of women who have a say in household decisions (for large purchases, their own health and visiting relatives) ( BBB ) UNWOMEN Member States 1 16.7
Target 5.4 Recognize and value unpaid care and domestic work through the provision of public services, infrastructure and social protection policies and the promotion of shared responsibility within the household and the family as nationally appropriate.
Average daily (24 hours) spent on unpaid domestic and care work, by sex, age and location (for individuals five years and above)
68 countries with TUS data since 2005; UNSD has compiled info on unpaid work for 51 countries. Included in the Minimum Set of Gender Indicators
UN Women and UNSD will monitor. Time use surveys data compiled from databases from ECLAC, OECD, UNECE and national statistical offices for 75 countries.
This indicator is included as a Tier II indicator under the 52 minimum set of gender statistics. Data exists for this indicator exists, coming from several time use surveys. Currently we have data disaggregated by sex for a specific age group per survey. Not all of the surveys have the data disaggregated by location. In the future we aspire to be collect this data for individuals five years and above, but currently it is not available.
UN Women and UNSD will monitor. Time use surveys data compiled from databases from ECLAC, OECD, UNECE and national statistical offices for 75 countries.
Revised indicator: [Percentage of population using an improved source with a total collection time of 30 minutes or less for a roundtrip including queuing.]
JMP on WASH would monitor the indicator. The DHS database (Statcompiler) has data available for 60 countries since 2000. MICs data reaches 108 countries since 1994.
Member States. Included in the Minimum Set of Gender Indicators.
IPU, Country coverage: all countries with national parliaments
Member States. Included in the Minimum Set of Gender Indicators.
UN Women UCLG; Country coverage: All countries.
UN Women proposes that indicator 5.5.1 (local government) and the alternative proposal for 5.5.2 (national parliaments) should have equal priority. 5.5.1 is an indicator that will complement data on national parliaments to provide a more complete picture of women's representation in public life at all levels, as the target specifies. There is strong demand for this data from multiple stakeholders, yet no global dataset exists. Methodologies and standards are currently being developed by UN Women and UCLG to enable global comparison of national data.
UN Women UCLG; Country coverage: All countries.
Alternative proposal: [Proportion of women in national parliaments] IPU, Country coverage: all countries with national parliaments

List of Indicator Proposals - p. 152 of 265
List of Proposals* Note on Disaggregation: All indicators should be disaggregated by sex, age, residence (U/R) and other characteristics, as relevant and possible.
ContributorName Specification Source Entity Tier Priority InterlinkagesSuggested Indicator DHS, MICS and other health and household surveys. UNFPA Tier II
Suggested Indicator Member States UNPFA, some baselines available. Tier II 3.7
Indicator 5.6.1 Percentage of women and girls who make decisions about their own sexual and reproductive health and reproductive rights by age, location, income, disability and other characteristics relevant to each country ( CBB ) UNWOMEN DHS, MICS and other health and household surveys. 1 3.7
UNFPA UNFPA 1
Indicator 5.6.2 Existence of laws and regulations that guarantee all women and adolescents informed choices regarding their sexual and reproductive health and reproductive rights regardless of marital status. ( BBB ) UNWOMEN Member States UNPFA, some baselines available. 2 3.7
UNFPA UNFPA 2
Target 5.6 Ensure universal access to sexual and reproductive health and reproductive rights as agreed in accordance with the Programme of Action of the International Conference on Population and Development and the Beijing Platform for Action and the outcome documents of their review conferences.
Proportion of women (aged 15-49) who make their own sexual and reproductive decisions.
[Proportion (%) of countries with laws and regulations that guarantee all women and adolescents access to sexual and reproductive health services, information and education (official records)
Revised indicator: [Percentage of women (aged 15-49) who make their own sexual and reproductive decisions]. See attached supplementary document.
UNPFA, Indicator will be measured through DHS and MICS covering most of low and middle income countries. In developed countries the indicator will be measured through national household surveys.
[Percentage of women (aged 15-49) who make their own sexual and reproductive decisions.] Rationale:This is an indicator measuring specific decisions by women (aged 15-49) on their own sexuality and reproduction. Interviewees will have to provide a “yes” answer to all three questions in order to count as a woman who makes her own sexual and reproductive decisions. The first question looks at the ability to say no to sexual intercourse as a critical condition of sexual autonomy. The second question measures the woman’s decision concerning using or not using contraception. The third question measures the woman’s decision about reaching sexual and reproductive healthcare for her***see supplementary technical materials attached***
Measurement:Indicator will be measured through DHS and MICS covering most of low and middle income countries. In developed countries the indicator will be measured through national household surveys
Revised indicator: [Proportion (%) of countries with laws and regulations that guarantee all women and adolescents access to sexual and reproductive health services, information and education (official records)]
[Proportion (%) of countries with laws and regulations that guarantee all women and adolescents access to sexual and reproductive health services, information and education.] Legal/regulatory frameworks covered by this indicator include laws and regulations that explicitly guarantee:
1. Access to SRH services without third party authorization (from the spouse, guardian, parents or others); 2. Access to SRH services without restrictions in terms of age and marital status;3. Access by adolescents to SRH information and education.
Note: the indicator also measures the absence of laws that prohibit or restrict access to SRH services***See supplementary technical materials attached***
Sources of information and methodology: The suggested methodology consists of initial self-reporting by governments through a detailed survey to be developed based on the indicators below with detailed questions that safeguard the replicability and reliability of state responses. This procedure was applied for the ICPD+20 review survey with support to governments from UNFPA’s country offices where needed
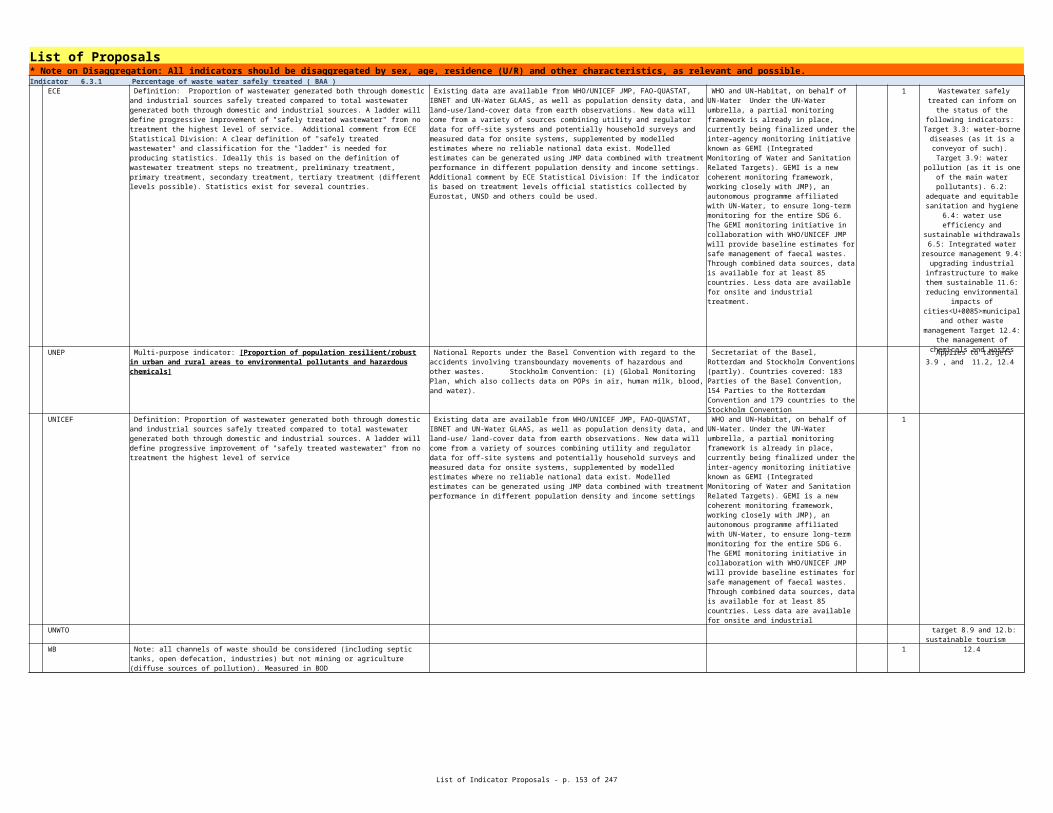
List of Indicator Proposals - p. 153 of 265
List of Proposals* Note on Disaggregation: All indicators should be disaggregated by sex, age, residence (U/R) and other characteristics, as relevant and possible.
ContributorName Specification Source Entity Tier Priority InterlinkagesSuggested Indicator Share of women among agricultural land owners by age and location (U/R) Included in Minimum Set Gender Indicators FAO and UNSD (EDGE), UN Women
Suggested Indicator Tier II 1.4
Indicator 5.a.1 Proportion of adult population owning land, by sex, age and location ( BBB ) IFAD 1 1.4
Target 5.a Undertake reforms to give women equal rights to economic resources, as well as access to ownership and control over land and other forms of property, financial services, inheritance and natural resources, in accordance with national laws.
Tier III soon Tier II
The legal framework includes special measures to guarantee women's equal rights to land ownership and control.
Data for both alternative proposals are available and currently disseminated by FAO. Indeed, some indicators are already available through FAO's Gender and Land Rights Database (see next section). In addition to existing data, FAO is working to strengthen and improve data collection through efforts such as the new Guidelines for the World Census of Agriculture (WCA 2020) as well as the development of the AGRIS toolkit. These are clear indications of the commitment of FAO in sex-disaggregated land indicators.
"FAO - FAO has the mandate to collect and disseminate information related to agriculture and is working to monitor legal frameworks related to land tenure, as well as to collect, analyse and disseminate land-related statistics. This applies to both alternative indicators proposed. For the rights-based indicator, data is available for over 80 countries (Gender and Land Rights Database, http://www.fao.org/gender-landrights-database/en/ ). Data on the proportion of adult women landowners out of total landowners is available for 11 countries: http://www.fao.org/gender-landrights-database/data-map/statistics/en/?sta_id=1162. \"
FAO suggests that alternative indicators may be more appropriate to monitor Target 5.a adequately, compared to the proposals contained in the UN Statistical Division's preliminary list of global SDG indicators. As an alternative to the current indicator on landowners in this list for target 5.a, FAO proposes the following rights-based indicator: ["The legal framework includes special measures to guarantee women's equal rights to landownership and control"]. The indicator is based on rights and focuses on the legal framework. This makes it more appropriate and valid to monitor Target 5.a which focuses on legal reform processes. The indicator monitors reforms to guarantee women's equal rights to economic resources, as well as access to ownership and control over land through the use of special measures. More specifically, the indicator allows for monitoring progress towards gender equity through the adoption of women-specific measures to strengthen women's secure rights to land and other productive resources. The proposed indicator is supported also by a number of international instruments and, in particular, monitors legal reforms that guarantee women's land rights and increase their access and ownership of land or other productive resources. The indicator also provides a good indication of governments' efforts to move towards the realization of women's land rights and more gender-equal land tenure. For more information on this indicator, please see the relevant factsheet.
Data for both alternative proposals are available and currently disseminated by FAO. Indeed, some indicators are already available through FAO's Gender and Land Rights Database (see next section). In addition to existing data, FAO is working to strengthen and improve data collection through efforts such as the new Guidelines for the World Census of Agriculture (WCA 2020) as well as the development of the AGRIS toolkit. These are clear indications of the commitment of FAO in sex-disaggregated land indicators.
"FAO - FAO has the mandate to collect and disseminate information related to agriculture and is working to monitor legal frameworks related to land tenure, as well as to collect, analyse and disseminate land-related statistics. This applies to both alternative indicators proposed. For the rights-based indicator, data is available for over 80 countries (Gender and Land Rights Database, http://www.fao.org/gender-landrights-database/en/ ). Data on the proportion of adult women landowners out of total landowners is available for 11 countries: http://www.fao.org/gender-landrights-database/data-map/statistics/en/?sta_id=1162. \"

List of Indicator Proposals - p. 154 of 265
List of Proposals* Note on Disaggregation: All indicators should be disaggregated by sex, age, residence (U/R) and other characteristics, as relevant and possible.
FAO 1 1.4
UNWOMEN 1 1.4, 2.3
FAO suggests that alternative indicators may be more appropriate to monitor Target 5.a adequately, compared to the proposals contained in the UN Statistical Division’s preliminary list of global SDG indicators. As an alternative to the current indicator on landowners in this list for target 5.a, FAO proposes the following rights-based indicator: [“The legal framework includes special measures to guarantee women’s equal rights to landownership and control”]. The indicator is based on rights and focuses on the legal framework. This makes it more appropriate and valid to monitor Target 5.a which focuses on legal reform processes. The indicator monitors reforms to guarantee women’s equal rights to economic resources, as well as access to ownership and control over land through the use of special measures. More specifically, the indicator allows for monitoring progress towards gender equity through the adoption of women-specific measures to strengthen women’s secure rights to land and other productive resources. The proposed indicator is supported also by a number of international instruments and, in particular, monitors legal reforms that guarantee women’s land rights and increase their access and ownership of land or other productive resources. The indicator also provides a good indication of governments’ efforts to move towards the realization of women’s land rights and more gender-equal land tenure. For more information on this indicator, please see the relevant factsheet.
Data for both alternative proposals are available and currently disseminated by FAO. Indeed, some indicators are already available through FAO’s Gender and Land Rights Database (see next section). In addition to existing data, FAO is working to strengthen and improve data collection through efforts such as the new Guidelines for the World Census of Agriculture (WCA 2020) as well as the development of the AGRIS toolkit. These are clear indications of the commitment of FAO in sex-disaggregated land indicators.
FAO - FAO has the mandate to collect and disseminate information related to agriculture and is working to monitor legal frameworks related to land tenure, as well as to collect, analyse and disseminate land-related statistics. This applies to both alternative indicators proposed. For the rights-based indicator, data is available for over 80 countries (Gender and Land Rights Database, http://www.fao.org/gender-landrights-database/en/ ). Data on the proportion of adult women landowners out of total landowners is available for 11 countries: http://www.fao.org/gender-landrights-database/data-map/statistics/en/?sta_id=1162.
Alternative proposal from FAO supported by UN Women: ["The legal framework includes special measures to guarantee women's equal rights to landownership and control"]. The indicator monitors reforms to guarantee women's equal rights to economic resources, as well as access to ownership and control over land through the use of special measures. More specifically, the indicator allows for monitoring progress towards gender equity through the adoption of women-specific measures to strengthen women's secure rights to land and other productive resources. The proposed indicator is supported also by a number of international instruments and, in particular, monitors legal reforms that guarantee women's land rights and increase their access and ownership of land or other productive resources. The indicator also provides a good indication of governments' efforts to move towards the realization of women's land rights and more gender-equal land tenure. For more information on this indicator, please see the supplementary information.
Data for both alternative proposals are available and currently disseminated by FAO. Indeed, some indicators are already available through FAO's Gender and Land Rights Database (see next section). In addition to existing data, FAO is working to strengthen and improve data collection through efforts such as the new Guidelines for the World Census of Agriculture (WCA 2020) as well as the development of the AGRIS toolkit. These are clear indications of the commitment of FAO in sex-disaggregated land indicators.
FAO - FAO has the mandate to collect and disseminate information related to agriculture and is working to monitor legal frameworks related to land tenure, as well as to collect, analyse and disseminate land-related statistics. This applies to both alternative indicators proposed. For the rights-based indicator, data is available for over 80 countries (Gender and Land Rights Database, http://www.fao.org/gender-landrights-database/en/ ). Data on the proportion of adult women landowners out of total landowners is available for 11 countries: http://www.fao.org/gender-landrights-database/data-map/statistics/en/?sta_id=1162.

List of Indicator Proposals - p. 155 of 265
List of Proposals* Note on Disaggregation: All indicators should be disaggregated by sex, age, residence (U/R) and other characteristics, as relevant and possible.
UPU 2Indicator 5.a.2 Proportion of population with an account at a formal financial institution, by sex and age ( BBB )
UNCDF Global Findex Targets 1.4 , 2.3 , 8.10, 10.2
UNWOMEN No changes World Bank Findex World Bank 2 UPU 1
WB 1
GlobalMigrationWG NB! Disaggregate by migratory status
Refine indicator to be a Multi-Purpose Indicator: [Adults owning an account either through a financial institution or mobile money provider, disaggregated by income level, geography location gender, age and education]
World Bank - Data is available for 142 countries
Payment and account services should be ideally distinguished: \[% adults with a formal account or personally using a mobile money service in the past 12 months]". Possible to have a break down by gender, age (i.e. youth) among other categories (e.g. income, rural). Adults: ages 15+. Formal account: account at a bank or at another type of financial institution, such as a credit union, microfinance institution, cooperative, or the post office (if applicable), or a debit card; including an account at a financial institution for the purposes of receiving wages, government transfers, or payments for agricultural products, paying utility bills or school fees or a card for the purposes of receiving wages or government transfers. Account/card ownership within the past 12 months. Mobile money account includes GSM Association (GSMA) Mobile Money for the Unbanked (MMU) services in the past 12 months to pay bills or to send or receive money along with receiving wages, government transfers, or payments for agricultural products through a mobile phone in the past 12 months."
World Bank Global Findex (individual survey - added module to Gallup World Poll)
World Bank. Data availability: ~ 145 countries. Triennial. Available for 2011 and 2014.
Definition for \% adults with a formal account or personally using a mobile money service in the past 12 months". Possible to have a break down by gender, age (i.e. youth) among other categories (e.g. income, rural). Adults: ages 15+. Formal account: account at a bank or at another type of financial institution, such as a credit union, microfinance institution, cooperative, or the post office (if applicable), or a debit card; including an account at a financial institution for the purposes of receiving wages, government transfers, or payments for agricultural products, paying utility bills or school fees or a card for the purposes of receiving wages or government transfers. Account/card ownership within the past 12 months. Mobile money account includes GSM Association (GSMA) Mobile Money for the Unbanked (MMU) services in the past 12 months to pay bills or to send or receive money along with receiving wages, government transfers, or payments for agricultural products through a mobile phone in the past 12 months."
World Bank Global Findex (individual survey - added module to Gallup World Poll)
World Bank. Data availability: ~ 145 countries. Triennial. Available for 2011 and 2014.
Indicator 5.a.2 can be used for 1.4, 2.3, 5.a, 8.10
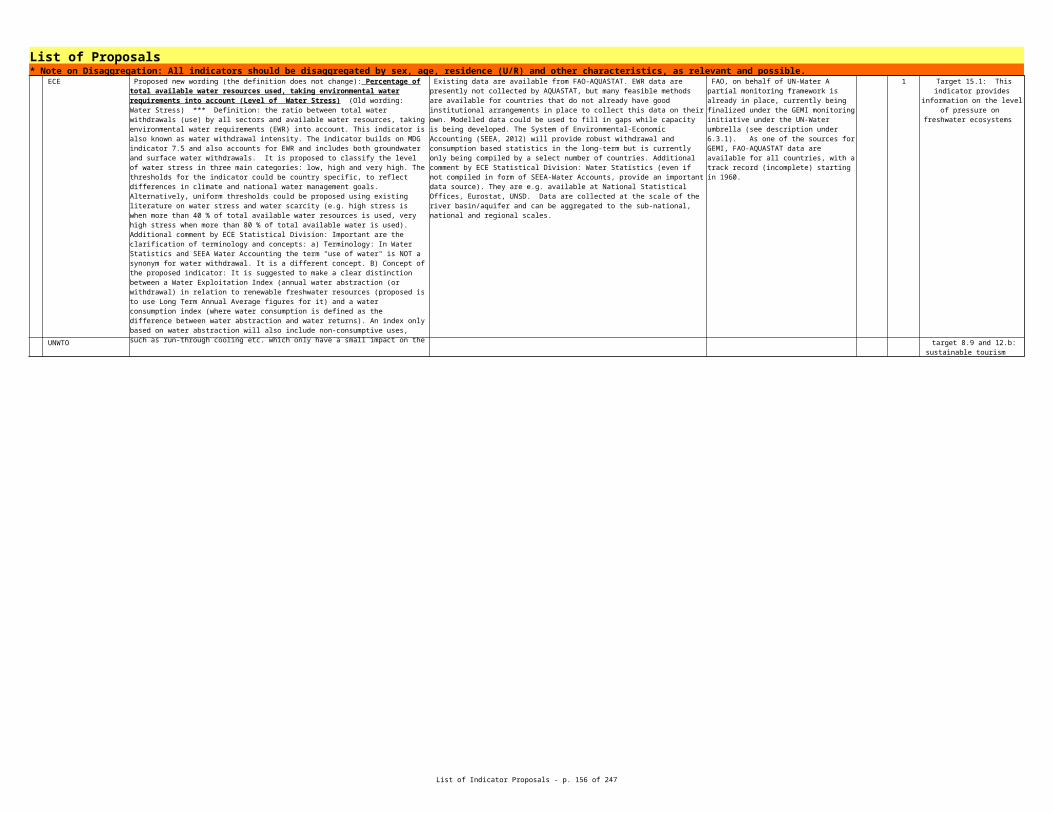
List of Indicator Proposals - p. 156 of 265
List of Proposals* Note on Disaggregation: All indicators should be disaggregated by sex, age, residence (U/R) and other characteristics, as relevant and possible.Target 5.b Enhance the use of enabling technology, in particular information and communications technology, to promote the empowerment of women.
ContributorName Specification Source Entity Tier Priority InterlinkagesSuggested Indicator Proportion of individuals who own a mobile telephone, by sex ITU Tier II
Indicator 5.b.1 Individuals who own a mobile phone, by sex ( AAA ) ITU
UNWOMEN 1
WB [Individuals who own a mobile phone, by sex, of which share of smart phones ] ITU 1 1.4, 11.b, 13.1
Indicator 5.b.2 Individuals with ICT skills, by type of skill, by sex ( BAA ) ITU 4.3, 4.4
UNWOMEN 2 4.3, 4.4
WB [Individuals with ICT skills, by type of skill, by age] ITU ITU, existing indicator 2 4.3, 4.4, 8.2, 8.3
Data for the this indicator are collected by NSOs, through household surveys. A number of countries already collect this indicator but data will only be collected at the international level as of 2015
Correct indicator name: [proportion of individuals who own a mobile telephone, by sex]
Data for the this indicator are collected by NSOs, through household surveys. A number of countries already collect this indicator but data will only be collected at the international level as of 2015
ITU will start data collection at the international level in 2015. A number of countries already collect this indicator through official surveys at the national level.
1.4, 2.c, 11.b, 12.8, 13.1, 16.10, 17.8
Correct indicator name: [proportion of individuals who own a mobile telephone, by sex]
Data for the proportion of individuals owning a mobile phone are collected by national statistical offices (NSO). A number of countries already collect this indicator through official surveys but data will only be collected at the international level as of 2015
ITU will start data collection at the international level in 2015. A number of countries already collect this indicator through official surveys at the national level.
1.4, 2.c, 11.b, 12.8, 13.1, 16.10, 17.8
Existing data but new at the international level, data to be collected by ITU from 2015
Correct indicator name: [proportion of individuals with ICT skills, by type of skills, by sex]
Data for this indicator are collected by NSOs, though household surveys. By 2015, data for this indicator were available for only 3 developing countries although OECD countries have been collecting data for this indicator for a number of years.
ITU collect data on this indicator from NSOs, annually. By 2015, data for this indicator were available for only 3 developing countries although OECD countries have been collecting data for this indicator for a number of years.
Correct indicator name: [proportion of individuals with ICT skills, by type of skills, by sex]
Data for the proportion of individuals with ICT skills, by type of skills, by sex are collected by national statistical offices (NSO). By 2015, data for this indicator were available for only 3 developing countries although OECD countries have been collecting data for this indicator for a number of years.
ITU collect data on this indicator from NSO, annually. By 2015, data for this indicator were available for only 3 developing countries although OECD countries have been collecting data for this indicator for a number of years.
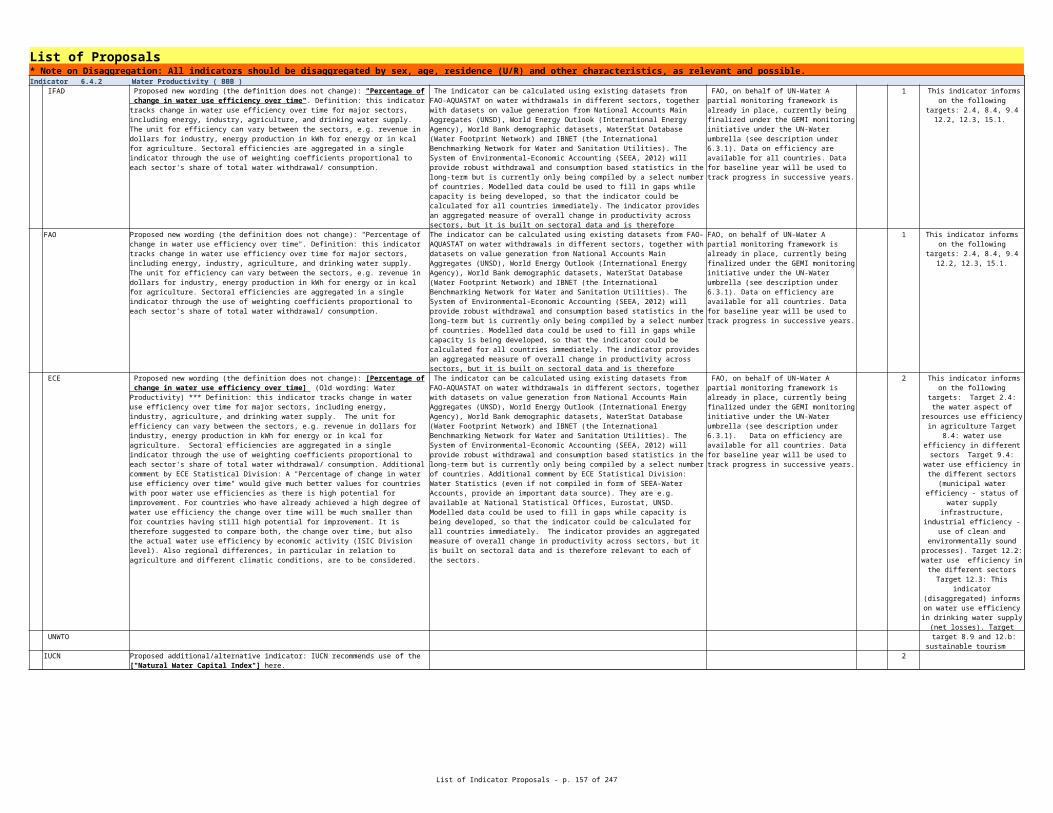
List of Indicator Proposals - p. 157 of 265
List of Proposals* Note on Disaggregation: All indicators should be disaggregated by sex, age, residence (U/R) and other characteristics, as relevant and possible.Target 5.c Adopt and strengthen sound policies and enforceable legislation for the promotion of gender equality and the empowerment of all women and girls at all levels.
ContributorName Specification Source Entity Tier Priority InterlinkagesSuggested Indicator Methodology being developed. Tier III
Indicator 5.c.1 Indicator to be finalized which will monitor the existence and quality of policies to achieve gender equality ( BBB ) UNWOMEN Alternative proposal (priority 2): See proposal for 5.1.1 2 5.1
Indicator 5.c.2 Percentage of countries with systems to track and make public allocations for gender equality and women's empowerment ( BBB ) UNWOMEN National governments 1 17.1
Percentage of countries with systems to track and make public allocations for gender equality and women’s empowerment
UN Women takes lead in monitoring progress on the indicator. Through its programmes, UN Women is providing technical support to the governments in setting up accountability systems to track gender equality allocations. The indicator is included in UN Women's Strategic Plan (SP) 2014-2017, allows systematic and regular monitoring on the progress. ** Data is available for 35 countries which reported on the indicator in the first round of monitoring. Detailed list of these countries can be found in Table A 6 of 'Making Development Cooperation more Effective: First Progress Report (2014)'.
Methodology being developed by OHCHR and UN Women. A tentative proposal is that the CEDAW Committee would monitor the indicator as part of their country reporting and review process using a standardized template to assess all countries in a comparable manner.
\This indicator on gender equality promotes government's accountability towards adequate allocation of resources to address gender equality commitments. The indicator measures whether the governments put in place a system to track and make public resource allocations for gender equality. The indicator recognises that governments play a significant role in the achievement of gender equality outcomes by improving the accountability systems and the efficient management of public resources. The indicator is included as one of ten global indicators in the Busan monitoring framework. For the first round of monitoring, which took place in the last quarter of 2013, UN-DOCO coordinated the process through a joint UNCT effort. Focal points and coordinators from within the national governments were designated to collect the data including for the indicator on gender equality. UNDOCO prepared supplementary guidance for UN participation and each UNCT designated its own focal point for participating in the monitoring process. UN Women also took part in the data collection by working closely with the designated government focal points to ensure that reporting on the gender indicator is completed. Once the data collection process was completed, a UNDP-OCED joint support team (JST) analysed the data to prepare the first progress report on the Busan Partnership Agreement. In case of gender indicator, UN Women took lead in analysing the data and compiling the report in collaboration with the OECD-Gendernet. See metadata for more detailed information.
UN Women takes lead in monitoring progress on the indicator. Through its programmes, UN Women is providing technical support to the governments in setting up accountability systems to track gender equality allocations. The indicator is included in UN Women's Strategic Plan (SP) 2014-2017, allows systematic and regular monitoring on the progress. ** Data is available for 35 countries which reported on the indicator in the first round of monitoring. Detailed list of these countries can be found in Table A 6 of 'Making Development Cooperation more Effective: First Progress Report (2014).

List of Indicator Proposals - p. 158 of 265
List of Proposals* Note on Disaggregation: All indicators should be disaggregated by sex, age, residence (U/R) and other characteristics, as relevant and possible.Goal 6 Ensure availability and sustainable management of water and sanitation for all Target 6.1 By 2030, achieve universal and equitable access to safe and affordable drinking water for all.
ContributorName Specification Source Entity Tier Priority InterlinkagesSuggested Indicator Tier I
Suggested Indicator DHS/MICs Tier I
Indicator 6.1.1 Percentage of population using safely managed drinking water services ( AAA ) ECE 1
UNICEF 1
UNWOMEN DHS/MICs 2
WHO 1
Percentage of population using safely managed drinking water services Data on use of basic drinking water sources is already available from national household surveys and censuses for all developing countries and from administrative sources for all developed countries. Data on safety and continuity of supplies are currently available from household surveys and administrative sources including regulators for c.100 countries
WHO/UNICEF JMP already maintains a global database and regularly reports on progress in access to drinking water for all countries. WHO/UNICEF JMP is currently developing estimates for the safety and continuity of drinking water services based on available data.
Average weekly time spent in water collection (including waiting time at public supply points), by sex, age, location and income.
JMP on WASH could monitor this indicator. This data is collected in MICS and DHS, for over 100 countries.
Additional could also monitor 5.4.
No change to indicator. For further details see statistical note prepared by WHO/UNICEF Joint Monitoring Programme on Water Supply and Sanitation (JMP). Definition: Population using a basic drinking water source (current JMP categories for improved drinking water) which is located on premises and available when needed; free of faecal contamination and/or regulated by a competent authority
Data on use of basic drinking water sources is already available from national household surveys and censuses for all developing countries and from administrative sources for all developed countries Data on safety and continuity of supplies are currently available from household surveys and administrative sources including regulators for c.100 countries
WHO/UNICEF JMP already maintains a global database and regularly reports on progress in access to drinking water for all countries WHO/UNICEF JMP is currently developing estimates for the safety and continuity of drinking water services based on available data.
Use of safely managed drinking water services is
relevant to the achievement of targets 1.1, 1.2, 1.4, 1.5,
2.1, 2.2, 2.3, 3.1, 3.2, 3.3, 3.9, 4.1, 4.2, 4a, 5.2, 5.4, 6.4, 6.5,
6.6, 10.3, 11.1, 11.3, 11.5, 13.1
No change to indicator. For further details see statistical note prepared by WHO/UNICEF Joint Monitoring Programme on Water Supply and Sanitation (JMP). Definition: Population using a basic drinking water source (current JMP categories for improved drinking water) which is located on premises and available when needed; free of faecal contamination and/or regulated by a competent authority
Data on use of basic drinking water sources is already available from national household surveys and censuses for all developing countries and from administrative sources for all developed countries. Data on safety and continuity of supplies are currently available from household surveys and administrative sources including regulators for c.100 countries
WHO/UNICEF JMP already maintains a global database and regularly reports on progress in access to drinking water for all countries. WHO/UNICEF JMP is currently developing estimates for the safety and continuity of drinking water services based on available data.
Use of safely managed drinking water services is
relevant to the achievement of targets 1.1, 1.2, 1.4, 1.5,
2.1, 2.2, 2.3, 3.1, 3.2, 3.3, 3.9, 4.1, 4.2, 4a, 5.2, 5.4, 6.4, 6.5,
6.6, 10.3, 11.1, 11.3, 11.5, 13.1
Additional proposal: UN Women would like to add another indicator here, [Average weekly time spent in water collection (including waiting time at public supply points), by sex, age, location and income.]
JMP on WASH could monitor this indicator. This data is collected in MICS and DHS, for over 100 countries.
Additional could also monitor 5.4.
No change to indicator. For further details see statistical note prepared by WHO/UNICEF Joint Monitoring Programme on Water Supply and Sanitation (JMP). ** Definition: Population using a basic drinking water source (current JMP categories for improved drinking water) which is located on premises and available when needed; free of faecal contamination and/or regulated by a competent authority
Data on use of basic drinking water sources is already available from national household surveys and censuses for all developing countries and from administrative sources for all developed countries. ** Data on safety and continuity of supplies are currently available from household surveys and administrative sources including regulators for c.100 countries
WHO/UNICEF JMP already maintains a global database and regularly reports on progress in access to drinking water for all countries ( http://www.wssinfo.org/ ) ** WHO/UNICEF JMP is currently developing estimates for the safety and continuity of drinking water services based on available data.
Use of safely managed drinking water services is
relevant to the achievement of targets 1.1, 1.2, 1.4, 1.5,
2.1, 2.2, 2.3, 3.1, 3.2, 3.3, 3.9, 4.1, 4.2, 4a, 5.2, 5.4, 6.4, 6.5,
6.6, 10.3, 11.1, 11.3, 11.5, 13.1

List of Indicator Proposals - p. 159 of 265
List of Proposals* Note on Disaggregation: All indicators should be disaggregated by sex, age, residence (U/R) and other characteristics, as relevant and possible.Target 6.2 By 2030, achieve access to adequate and equitable sanitation and hygiene for all and end open defecation, paying special attention to the needs of women and girls and those in vulnerable situations.
ContributorName Specification Source Entity Tier Priority InterlinkagesSuggested Indicator Percentage of population using safely managed sanitation services Tier II
Indicator 6.2.1 Percentage of population using safely managed sanitation services ( AAA ) ECE 1
UNICEF 1
WB [Percentage of population whose faecal waste is safely managed] JMP 1 3.1, 3.2, 3.4 WHO 1
UNSD No change to indicator 1
Data on use of basic sanitation facilities is already available from national household surveys and censuses for all developing countries and from administrative sources for all developed countries ** Data on disposal or treatment of excreta are limited but estimates for safe management of faecal wastes can be calculated based on faecal waste flows associated with the use of different types of basic sanitation facility.
WHO/UNICEF JMP already maintains a global database and regularly reports on progress in access to basic sanitation for all countries (http://www.wssinfo.org/). ** WHO/UNICEF JMP is working with the GEMI initiative to develop global baseline estimates for safe management of faecal wastes.
Use of safely managed sanitation services is relevant
to the achievement of targets 1.1, 1.2, 1.4, 1.5, 2.1, 2.2, 2.3, 3.1, 3.2, 3.3, 3.9, 4.1, 4.2, 4a, 5.2, 5.4, 6.3, 6.4, 6.5,
6.6, 8.9, 10.3, 11.1, 11.3, 11.5, 13.1
No change to indicator. For further details see statistical note prepared by WHO/UNICEF JMP Definition: Population using a basic sanitation facility (current JMP categories for improved sanitation) which is not shared with other households and where excreta is safely disposed in situ or transported to a designated place for safe disposal or treatment
Data on use of basic sanitation facilities is already available from national household surveys and censuses for all developing countries and from administrative sources for all developed countries Data on disposal or treatment of excreta are limited but estimates for safe management of faecal wastes can be calculated based on faecal waste flows associated with the use of different types of basic sanitation facility.
WHO/UNICEF JMP already maintains a global database and regularly reports on progress in access to basic sanitation for all countries WHO/UNICEF JMP is working with the GEMI initiative to develop global baseline estimates for safe management of faecal wastes.
Use of safely managed sanitation services is relevant to the achievement of targets 1.1, 1.2, 1.4, 1.5, 2.1, 2.2, 2.3, 3.1, 3.2, 3.3, 3.9, 4.1, 4.2, 4a, 5.2, 5.4, 6.3, 6.4, 6.5, 6.6, 8.9, 10.3, 11.1, 11.3, 11.5, 13.1
No change to indicator. For further details see statistical note prepared by WHO/UNICEF JMP. Definition: Population using a basic sanitation facility (current JMP categories for improved sanitation) which is not shared with other households and where excreta is safely disposed in situ or transported to a designated place for safe disposal or treatment
Data on use of basic sanitation facilities is already available from national household surveys and censuses for all developing countries and from administrative sources for all developed countries. Data on disposal or treatment of excreta are limited but estimates for safe management of faecal wastes can be calculated based on faecal waste flows associated with the use of different types of basic sanitation facility.
WHO/UNICEF JMP already maintains a global database and regularly reports on progress in access to basic sanitation for all countries. WHO/UNICEF JMP is working with the GEMI initiative to develop global baseline estimates for safe management of faecal wastes.
Use of safely managed sanitation services is relevant to the achievement of targets 1.1, 1.2, 1.4, 1.5, 2.1, 2.2, 2.3, 3.1, 3.2, 3.3, 3.9, 4.1, 4.2, 4a, 5.2, 5.4, 6.3, 6.4, 6.5, 6.6, 8.9,
10.3, 11.1, 11.3, 11.5, 13.1
No change to indicator. For further details see statistical note prepared by WHO/UNICEF JMP ** Definition: Population using a basic sanitation facility (current JMP categories for improved sanitation) which is not shared with other households and where excreta is safely disposed in situ or transported to a designated place for safe disposal or treatment. ** Definition: Population with a handwashing facility with soap and water in the household
Data on use of basic sanitation facilities is already available from national household surveys and censuses for all developing countries and from administrative sources for all developed countries ** Data on disposal or treatment of excreta are limited but estimates for safe management of faecal wastes can be calculated based on faecal waste flows associated with the use of different types of basic sanitation facility.
WHO/UNICEF JMP already maintains a global database and regularly reports on progress in access to basic sanitation for all countries (http://www.wssinfo.org/). ** WHO/UNICEF JMP is working with the GEMI initiative to develop global baseline estimates for safe management of faecal wastes.
Use of safely managed sanitation services is relevant to the achievement of targets 1.1, 1.2, 1.4, 1.5, 2.1, 2.2, 2.3, 3.1, 3.2, 3.3, 3.9, 4.1, 4.2, 4a, 5.2, 5.4, 6.3, 6.4, 6.5, 6.6, 8.9,
10.3, 11.1, 11.3, 11.5, 13.1
However, any methodology developed under the GEMI initiative should be aligned with the SEEA standard which deals with the collection and treatment of wastewater.

List of Indicator Proposals - p. 160 of 265
List of Proposals* Note on Disaggregation: All indicators should be disaggregated by sex, age, residence (U/R) and other characteristics, as relevant and possible.Indicator 6.2.2 Population with a hand washing facility with soap and water in the household ( BAA )
ECE 1
UNICEF 1
WHO No change to indicator. For further details see statistical note. 1
No change to indicator. Definition: Population with a handwashing facility with soap and water in the household
Data on use of hand washing facilities is available from national hh surveys and censuses. Data is currently available for 50-100 developing countries.
WHO/UNICEF JMP already maintains a global database on the use of handwashing facilities with soap and water in the household
Use of handwashing facilities with soap and water is
relevant to the achievement of targets 1.1, 1.2, 1.4, 1.5,
2.1, 2.2, 2.3, 3.1, 3.2, 3.3, 3.9, 4.1, 4.2, 4a, 6.3, 6.4, 6.5, 11.1,
11.3, 11.5, 13.1.
Data on use of hand washing facilities is available from national hh surveys and censuses. Data is currently available for 50-100 developing countries.
WHO/UNICEF JMP already maintains a global database on the use of handwashing facilities with soap and water in the household ( http://www.wssinfo.org/ )
Use of handwashing facilities with soap and water is
relevant to the achievement of targets 1.1, 1.2, 1.4, 1.5,
2.1, 2.2, 2.3, 3.1, 3.2, 3.3, 3.9, 4.1, 4.2, 4a, 6.3, 6.4, 6.5, 11.1,
11.3, 11.5, 13.1.

List of Indicator Proposals - p. 161 of 265
List of Proposals* Note on Disaggregation: All indicators should be disaggregated by sex, age, residence (U/R) and other characteristics, as relevant and possible.
ContributorName Specification Source Entity Tier Priority InterlinkagesSuggested Indicator Tier II
Suggested Indicator Tier II
Target 6.3 By 2030, improve water quality by reducing pollution, eliminating dumping and minimizing release of hazardous chemicals and materials, halving the proportion of untreated wastewater and substantially increasing recycling and safe reuse globally.
Percentage of wastewater safely treated , disaggregated by economic activity
Existing data are available from WHO/UNICEF JMP, FAO-QUASTAT, IBNET and UN-Water GLAAS, as well as population density data, and land-use/ land-cover data from earth observations. New data will come from a variety of sources combining utility and regulator data for off-site systems and potentially household surveys and measured data for onsite systems, supplemented by modelled estimates where no reliable national data exist. Modelled estimates can be generated using JMP data combined with treatment performance in different population density and income settings
WHO and UN-Habitat, on behalf of UN-Water. Under the UN-Water umbrella, a partial monitoring framework is already in place, currently being finalized under the inter-agency monitoring initiative known as GEMI (Integrated Monitoring of Water and Sanitation Related Targets). GEMI is a new coherent monitoring framework, working closely with JMP), an autonomous programme affiliated with UN-Water, to ensure long-term monitoring for the entire SDG 6. The GEMI monitoring initiative in collaboration with WHO/UNICEF JMP will provide baseline estimates for safe management of faecal wastes. Through combined data sources, data is available for at least 85 countries. Less data are available for onsite and industrial.
Safe treatment of wastewater is relevant to the achievement of targets 1.4,
1.5, 2.3, 3.2, 3.3, 3.9, 6.4, 8.9, 9.4, 10.3, 11.1, 11.3, 11.5,
1.6, 12.4, 13.1, 14.1.
Percentage of receiving water bodies with ambient water quality not presenting risk to the environment or human health
Existing data (direct values) are available from UNEP's GEMS/Water, GEMStat and OECD. Additional information on optical water properties from remote sensing can be used as proxies for sediments and eutrophication/nutrient loading. Measurements would be completed at local laboratories and/or achieved using field measurements on appropriate protocols for sample collection and analysis. For data-poor areas estimates can be generated using existing - in situ - data combined with modelled data and remote sensing information. Data is collected at the scale of the receiving water body basin scale and can be aggregated to the country and regional scale.
UNEP (through GEMS/Water), on behalf of UN-Water A partial monitoring framework is already in place, currently being finalized under the GEMI monitoring initiative under the UN-Water umbrella (see description under 6.3.1). Related to indicator 6.3.2, GEMI will draw upon metadata standards which are already in place, among other sources on pre-existing datasets such as GEMStat and FAO-AQUASTAT.
3.3, 8.4, 9.4, 11.5, 12.4, 14.1, 14.2, 15.1

List of Indicator Proposals - p. 162 of 265
List of Proposals* Note on Disaggregation: All indicators should be disaggregated by sex, age, residence (U/R) and other characteristics, as relevant and possible.Indicator 6.3.1 Percentage of waste water safely treated ( BAA )
ECE 1
UNEP
UNICEF 1
UNWTO
Definition: Proportion of wastewater generated both through domestic and industrial sources safely treated compared to total wastewater generated both through domestic and industrial sources. A ladder will define progressive improvement of "safely treated wastewater" from no treatment the highest level of service. Additional comment from ECE Statistical Division: A clear definition of "safely treated wastewater" and classification for the "ladder" is needed for producing statistics. Ideally this is based on the definition of wastewater treatment steps no treatment, preliminary treatment, primary treatment, secondary treatment, tertiary treatment (different levels possible). Statistics exist for several countries.
Existing data are available from WHO/UNICEF JMP, FAO-QUASTAT, IBNET and UN-Water GLAAS, as well as population density data, and land-use/land-cover data from earth observations. New data will come from a variety of sources combining utility and regulator data for off-site systems and potentially household surveys and measured data for onsite systems, supplemented by modelled estimates where no reliable national data exist. Modelled estimates can be generated using JMP data combined with treatment performance in different population density and income settings. Additional comment by ECE Statistical Division: If the indicator is based on treatment levels official statistics collected by Eurostat, UNSD and others could be used.
WHO and UN-Habitat, on behalf of UN-Water Under the UN-Water umbrella, a partial monitoring framework is already in place, currently being finalized under the inter-agency monitoring initiative known as GEMI (Integrated Monitoring of Water and Sanitation Related Targets). GEMI is a new coherent monitoring framework, working closely with JMP), an autonomous programme affiliated with UN-Water, to ensure long-term monitoring for the entire SDG 6. The GEMI monitoring initiative in collaboration with WHO/UNICEF JMP will provide baseline estimates for safe management of faecal wastes. Through combined data sources, data is available for at least 85 countries. Less data are available for onsite and industrial treatment.
Wastewater safely treated can inform on the status of
the following indicators: Target 3.3: water-borne
diseases (as it is a conveyor of such). Target 3.9: water
pollution (as it is one of the main water pollutants). 6.2:
adequate and equitable sanitation and hygiene 6.4:
water use efficiency and sustainable withdrawals 6.5:
Integrated water resource management 9.4: upgrading industrial infrastructure to
make them sustainable 11.6: reducing environmental
impacts of cities<U+0085>municipal and
other waste management Target 12.4: the management
of chemicals and wastes (present in wastewater). 13.1 resilience to climate related
hazards and natural disasters Target 14.1: the status of
marine water pollution (as it is one of the main marine
water pollutants).
Multi-purpose indicator: [Proportion of population resilient/robust in urban and rural areas to environmental pollutants and hazardous chemicals]
National Reports under the Basel Convention with regard to the accidents involving transboundary movements of hazardous and other wastes. Stockholm Convention: (i) (Global Monitoring Plan, which also collects data on POPs in air, human milk, blood, and water).
Secretariat of the Basel, Rotterdam and Stockholm Conventions (partly). Countries covered: 183 Parties of the Basel Convention, 154 Parties to the Rotterdam Convention and 179 countries to the Stockholm Convention
Applies to targets 3.9 , and 11.2, 12.4
Definition: Proportion of wastewater generated both through domestic and industrial sources safely treated compared to total wastewater generated both through domestic and industrial sources. A ladder will define progressive improvement of "safely treated wastewater" from no treatment the highest level of service
Existing data are available from WHO/UNICEF JMP, FAO-QUASTAT, IBNET and UN-Water GLAAS, as well as population density data, and land-use/ land-cover data from earth observations. New data will come from a variety of sources combining utility and regulator data for off-site systems and potentially household surveys and measured data for onsite systems, supplemented by modelled estimates where no reliable national data exist. Modelled estimates can be generated using JMP data combined with treatment performance in different population density and income settings
WHO and UN-Habitat, on behalf of UN-Water. Under the UN-Water umbrella, a partial monitoring framework is already in place, currently being finalized under the inter-agency monitoring initiative known as GEMI (Integrated Monitoring of Water and Sanitation Related Targets). GEMI is a new coherent monitoring framework, working closely with JMP), an autonomous programme affiliated with UN-Water, to ensure long-term monitoring for the entire SDG 6. The GEMI monitoring initiative in collaboration with WHO/UNICEF JMP will provide baseline estimates for safe management of faecal wastes. Through combined data sources, data is available for at least 85 countries. Less data are available for onsite and industrial
target 8.9 and 12.b: sustainable tourism

List of Indicator Proposals - p. 163 of 265
List of Proposals* Note on Disaggregation: All indicators should be disaggregated by sex, age, residence (U/R) and other characteristics, as relevant and possible.
WB 1 12.4
WHO 1
UNSD No change to indicator 1
Indicator 6.3.2 Percentage of receiving water bodies with ambient water quality not presenting risk to the environment or human health ( CBB ) ECE 1
UNEP [Water quality Index]
UNWTO
Note: all channels of waste should be considered (including septic tanks, open defecation, industries) but not mining or agriculture (diffuse sources of pollution). Measured in BOD
No change to indicator. For further details see statistical note. ** Definition: Proportion of wastewater generated both through domestic and industrial sources safely treated compared to total wastewater generated both through domestic and industrial sources. ** A ladder will define progressive improvement of "safely treated wastewater" from no treatment the highest level of service.
Existing data are available from WHO/UNICEF JMP, FAO-QUASTAT, IBNET and UN-Water GLAAS, as well as population density data, and land-use/land-cover data from earth observations. ** New data will come from a variety of sources combining utility and regulator data for off-site systems and potentially household surveys and measured data for onsite systems, supplemented by modelled estimates where no reliable national data exist. ** Modelled estimates can be generated using JMP data combined with treatment performance in different population density and income settings.
WHO and UN-Habitat, as part of an inter-agency monitoring initiative known as GEMI (Integrated Monitoring of Water and Sanitation Related Targets). ( http://www.unwater.org/gemi/en/) ** GEMI is a new coherent monitoring framework, working closely with JMP. ** Through combined data sources, data is available for at least 85 countries. Less data are available for onsite and industrial treatment.
Safe treatment of wastewater is relevant to the achievement of targets 1.4,
1.5, 2.3, 3.2, 3.3, 3.9, 6.4, 8.9, 9.4, 10.3, 11.1, 11.3, 11.5, 1.6,
12.4, 13.1, 14.1.
The SEEA will provide robust statistics on the generation of wastewater by different sectors and treatment of said wastewater in the long-term. It is important that the data collected by the OECD/Eurostat and UNSD/UNEP questionnaire is made fully SEEA compliant.
However, the System of Environmental Economic Accounts provides a standard methodology to measure this indicator, and monitoring initiatives should align to the standard over time.
Definition: Proportion of receiving water bodies with ambient water quality not presenting risk to the environment or human health compared to all receiving water bodies. Water quality is estimated through a water quality index (WQI), compiling a core set of parameters: total dissolved solids (TDS); percentage dissolved oxygen (%DO); dissolved inorganic nitrogen (DIN); dissolved inorganic phosphorus (DIP); and Escherichia coli (E. coli). The GEMStat Index approach is used to calculate the index, in which measured parameter values are compared to guideline values (proximity to target approach).The actual parameters as well as guideline values can be adapted to local conditions. WQI ranges from 0 (very bad water quality) to 100 (excellent water quality). Further information will be provided in forthcoming metadata notes for targets 6.3-6.6
Existing data (direct values) are available from UNEP's GEMS/Water, GEMStat and OECD. Additional information on optical water properties from remote sensing can be used as proxies for sediments and eutrophication/nutrient loading. Measurements would be completed at local laboratories and/or achieved using field measurements on appropriate protocols for sample collection and analysis. For data-poor areas estimates can be generated using existing - in situ - data combined with modelled data and remote sensing information. Data is collected at the scale of the receiving water body basin scale and can be aggregated to the country and regional scale.
UNEP (through GEMS/Water), on behalf of UN-Water A partial monitoring framework is already in place, currently being finalized under the GEMI monitoring initiative under the UN-Water umbrella (see description under 6.3.1). Related to indicator 6.3.2, GEMI will draw upon metadata standards which are already in place, among other sources on pre-existing datasets such as GEMStat and FAO-AQUASTAT.
This indicator can inform on the following targets: Target 3.3: water-borne diseases (E. coli). Target 8.4: decoupling
progress and resource efficiency and effects on ambient WQ Target 9.4:
progress in technology and process transitions towards
sustainability and innovation. Target 11.5: risk for people to
be prone to water related disasters (linked to poor WQ) Target 12.4: outcome of the management of chemicals and wastes (water quality).
Targets 14.1 & 14.2: progress in receiving coastal waters
and estuaries pollution, management and restoration efficiency. Target 15.1: the
status of freshwater ecosystems.
http://www.bipindicators.net/wqib as well as Stockholm Convention: (i) (Global Monitoring Plan, which also collects data on POPs in air, human milk, blood, and water).
GEMS/Water (Indicator under the BIP) and Secretariat of the Basel, Rotterdam and Stockholm Conventions (partly). Countries covered: 183 Parties of the Basel Convention, 154 Parties to the Rotterdam Convention and 179 countries to the Stockholm Convention
target 8.9 and 12.b: sustainable tourism

List of Indicator Proposals - p. 164 of 265
List of Proposals* Note on Disaggregation: All indicators should be disaggregated by sex, age, residence (U/R) and other characteristics, as relevant and possible.
WB UNEP 1 15.1, 15.8 [Nitrate level of surface water and groundwater measured in a representative number of points]
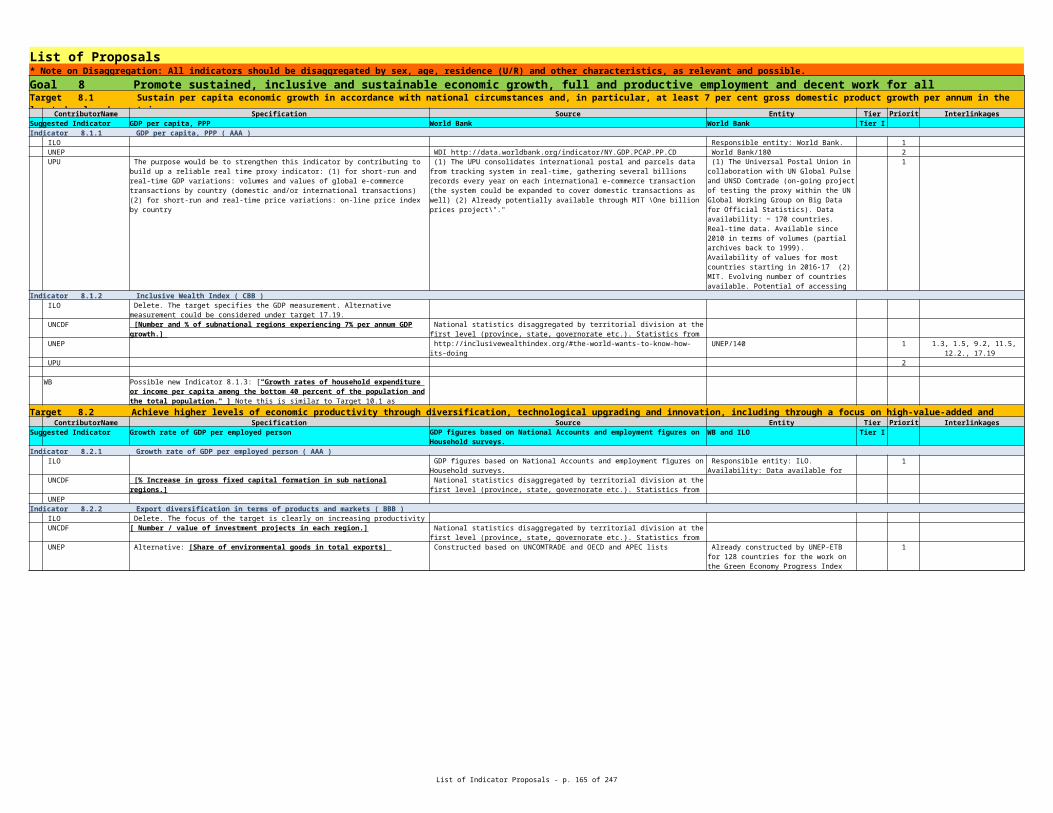
List of Indicator Proposals - p. 165 of 265
List of Proposals* Note on Disaggregation: All indicators should be disaggregated by sex, age, residence (U/R) and other characteristics, as relevant and possible.
ContributorName Specification Source Entity Tier Priority InterlinkagesSuggested Indicator Tier I
Suggested Indicator Tier I
Indicator 6.4.1 Water Stress ( BAA ) IFAD 1
Target 6.4 By 2030, substantially increase water-use efficiency across all sectors and ensure sustainable withdrawals and supply of freshwater to address water scarcity and substantially reduce the number of people suffering from water scarcity.
Percentage change in water use efficiency over time.
The indicator can be calculated using existing datasets from FAO-AQUASTAT on water withdrawals in different sectors, together with datasets on value generation from National Accounts Main Aggregates (UNSD), World Energy Outlook (International Energy Agency), World Bank demographic datasets, WaterStat Database (Water Footprint Network) and IBNET (the International Benchmarking Network for Water and Sanitation Utilities). The System of Environmental-Economic Accounting (SEEA, 2012) will provide robust withdrawal and consumption based statistics in the long-term but is currently only being compiled by a select number of countries. Modelled data could be used to fill in gaps while capacity is being developed, so that the indicator could be calculated for all countries immediately. The indicator provides an aggregated measure of overall change in productivity across sectors, but it is built on sectoral data and is therefore relevant to each of the sectors
FAO, on behalf of UN-Water A partial monitoring framework is already in place, currently being finalized under the GEMI monitoring initiative under the UN-Water umbrella (see description under 6.3.1). Data on efficiency are available for all countries. Data for baseline year will be used to track progress in successive years.
This indicator informs on the following targets: 2.4, 8.4,
9.4 12.2, 12.3, 15.1.
Percentage of total available water resources used, taking environmental water requirements into account (Level of Water Stress)
Existing data are available from FAO-AQUASTAT. EWR data are presently not collected by AQUASTAT, but many feasible methods are available for countries that do not already have good institutional arrangements in place to collect this data on their own. Modelled data could be used to fill in gaps while capacity is being developed. The System of Environmental-Economic Accounting (SEEA, 2012) will provide robust withdrawal and consumption based statistics in the long-term but is currently only being compiled by a select number of countries. Data are collected at the scale of the river basin/aquifer and can be aggregated to the sub-national, national and regional scales.
FAO, on behalf of UN-Water. A partial monitoring framework is already in place, currently being finalized under the GEMI monitoring initiative under the UN-Water umbrella. As one of the sources for GEMI, FAO-AQUASTAT data are available for all countries, with a track record (incomplete) starting in 1960.
Target 15.1: This indicator provides information on the
level of pressure on freshwater ecosystems
Proposed new wording (the definition does not change): [Percentage of total available water resources used, taking environmental water requirements into account (Level of Water Stress).] Definition: the ratio between total water withdrawals (use) by all sectors and available water resources, taking environmental water requirements (EWR) into account. This indicator is also known as water withdrawal intensity. The indicator builds on MDG indicator 7.5 and also accounts for EWR and includes both groundwater and surface water withdrawals. It is proposed to classify the level of water stress in three main categories: low, high and very high. The thresholds for the indicator could be country specific, to reflect differences in climate and national water management goals. Alternatively, uniform thresholds could be proposed using existing literature on water stress and water scarcity (e.g. high stress is when more than 40 % of total available water resources is used, very high stress when more than 80 % of total available water is used).
Existing data are available from FAO-AQUASTAT. EWR data are presently not collected by AQUASTAT, but many feasible methods are available for countries that do not already have good institutional arrangements in place to collect this data on their own. Modelled data could be used to fill in gaps while capacity is being developed. The System of Environmental-Economic Accounting (SEEA, 2012) will provide robust withdrawal and consumption based statistics in the long-term but is currently only being compiled by a select number of countries. Data are collected at the scale of the river basin/aquifer and can be aggregated to the sub-national, national and regional scales.
FAO, on behalf of UN-Water. A partial monitoring framework is already in place, currently being finalized under the GEMI monitoring initiative under the UN-Water umbrella. As one of the sources for GEMI, FAO-AQUASTAT data are available for all countries, with a track record (incomplete) starting in 1960.
Target 15.1: This indicator provides information on the
level of pressure on freshwater ecosystems

List of Indicator Proposals - p. 166 of 265
List of Proposals* Note on Disaggregation: All indicators should be disaggregated by sex, age, residence (U/R) and other characteristics, as relevant and possible.
FAO 1
ECE 1
UNWTO
Proposed new wording (the definition does not change): [Percentage of total available water resources used, taking environmental water requirements into account (Level of Water Stress)]Definition: the ratio between total water withdrawals (use) by all sectors and available water resources, taking environmental water requirements (EWR) into account. This indicator is also known as water withdrawal intensity. The indicator builds on MDG indicator 7.5 and also accounts for EWR and includes both groundwater and surface water withdrawals. It is proposed to classify the level of water stress in three main categories: low, high and very high. The thresholds for the indicator could be country specific, to reflect differences in climate and national water management goals. Alternatively, uniform thresholds could be proposed using existing literature on water stress and water scarcity (e.g. high stress is when more than 40 % of total available water resources is used, very high stress when more than 80 % of total available water is used).
Existing data are available from FAO-AQUASTAT. EWR data are presently not collected by AQUASTAT, but many feasible methods are available for countries that do not already have good institutional arrangements in place to collect this data on their own. Modelled data could be used to fill in gaps while capacity is being developed. The System of Environmental-Economic Accounting (SEEA, 2012) will provide robust withdrawal and consumption based statistics in the long-term but is currently only being compiled by a select number of countries. Data are collected at the scale of the river basin/aquifer and can be aggregated to the sub-national, national and regional scales.
FAO, on behalf of UN-Water. A partial monitoring framework is already in place, currently being finalized under the GEMI monitoring initiative under the UN-Water umbrella. As one of the sources for GEMI, FAO-AQUASTAT data are available for all countries, with a track record (incomplete) starting in 1960.
Target 15.1: This indicator provides information on the
level of pressure on freshwater ecosystems
Proposed new wording (the definition does not change): Percentage of total available water resources used, taking environmental water requirements into account (Level of Water Stress) (Old wording: Water Stress) *** Definition: the ratio between total water withdrawals (use) by all sectors and available water resources, taking environmental water requirements (EWR) into account. This indicator is also known as water withdrawal intensity. The indicator builds on MDG indicator 7.5 and also accounts for EWR and includes both groundwater and surface water withdrawals. It is proposed to classify the level of water stress in three main categories: low, high and very high. The thresholds for the indicator could be country specific, to reflect differences in climate and national water management goals. Alternatively, uniform thresholds could be proposed using existing literature on water stress and water scarcity (e.g. high stress is when more than 40 % of total available water resources is used, very high stress when more than 80 % of total available water is used). Additional comment by ECE Statistical Division: Important are the clarification of terminology and concepts: a) Terminology: In Water Statistics and SEEA Water Accounting the term "use of water" is NOT a synonym for water withdrawal. It is a different concept. B) Concept of the proposed indicator: It is suggested to make a clear distinction between a Water Exploitation Index (annual water abstraction (or withdrawal) in relation to renewable freshwater resources (proposed is to use Long Term Annual Average figures for it) and a water consumption index (where water consumption is defined as the difference between water abstraction and water returns). An index only based on water abstraction will also include non-consumptive uses, such as run-through cooling etc. which only have a small impact on the overall water balance. It is also suggested to define how in-situ uses and hydropower use of water are to be included or excluded in the definition of water abstraction.
Existing data are available from FAO-AQUASTAT. EWR data are presently not collected by AQUASTAT, but many feasible methods are available for countries that do not already have good institutional arrangements in place to collect this data on their own. Modelled data could be used to fill in gaps while capacity is being developed. The System of Environmental-Economic Accounting (SEEA, 2012) will provide robust withdrawal and consumption based statistics in the long-term but is currently only being compiled by a select number of countries. Additional comment by ECE Statistical Division: Water Statistics (even if not compiled in form of SEEA-Water Accounts, provide an important data source). They are e.g. available at National Statistical Offices, Eurostat, UNSD. Data are collected at the scale of the river basin/aquifer and can be aggregated to the sub-national, national and regional scales.
FAO, on behalf of UN-Water A partial monitoring framework is already in place, currently being finalized under the GEMI monitoring initiative under the UN-Water umbrella (see description under 6.3.1). As one of the sources for GEMI, FAO-AQUASTAT data are available for all countries, with a track record (incomplete) starting in 1960.
Target 15.1: This indicator provides information on the
level of pressure on freshwater ecosystems
target 8.9 and 12.b: sustainable tourism

List of Indicator Proposals - p. 167 of 265
List of Proposals* Note on Disaggregation: All indicators should be disaggregated by sex, age, residence (U/R) and other characteristics, as relevant and possible.Indicator 6.4.2 Water Productivity ( BBB )
IFAD 1
FAO 1
ECE 2
UNWTO
Proposed new wording (the definition does not change): "Percentage of change in water use efficiency over time". Definition: this indicator tracks change in water use efficiency over time for major sectors, including energy, industry, agriculture, and drinking water supply. The unit for efficiency can vary between the sectors, e.g. revenue in dollars for industry, energy production in kWh for energy or in kcal for agriculture. Sectoral efficiencies are aggregated in a single indicator through the use of weighting coefficients proportional to each sector's share of total water withdrawal/ consumption.
The indicator can be calculated using existing datasets from FAO-AQUASTAT on water withdrawals in different sectors, together with datasets on value generation from National Accounts Main Aggregates (UNSD), World Energy Outlook (International Energy Agency), World Bank demographic datasets, WaterStat Database (Water Footprint Network) and IBNET (the International Benchmarking Network for Water and Sanitation Utilities). The System of Environmental-Economic Accounting (SEEA, 2012) will provide robust withdrawal and consumption based statistics in the long-term but is currently only being compiled by a select number of countries. Modelled data could be used to fill in gaps while capacity is being developed, so that the indicator could be calculated for all countries immediately. The indicator provides an aggregated measure of overall change in productivity across sectors, but it is built on sectoral data and is therefore relevant to each of the sectors
FAO, on behalf of UN-Water A partial monitoring framework is already in place, currently being finalized under the GEMI monitoring initiative under the UN-Water umbrella (see description under 6.3.1). Data on efficiency are available for all countries. Data for baseline year will be used to track progress in successive years.
This indicator informs on the following targets: 2.4, 8.4, 9.4
12.2, 12.3, 15.1.
Proposed new wording (the definition does not change): "Percentage of change in water use efficiency over time". Definition: this indicator tracks change in water use efficiency over time for major sectors, including energy, industry, agriculture, and drinking water supply. The unit for efficiency can vary between the sectors, e.g. revenue in dollars for industry, energy production in kWh for energy or in kcal for agriculture. Sectoral efficiencies are aggregated in a single indicator through the use of weighting coefficients proportional to each sector’s share of total water withdrawal/ consumption.
The indicator can be calculated using existing datasets from FAO-AQUASTAT on water withdrawals in different sectors, together with datasets on value generation from National Accounts Main Aggregates (UNSD), World Energy Outlook (International Energy Agency), World Bank demographic datasets, WaterStat Database (Water Footprint Network) and IBNET (the International Benchmarking Network for Water and Sanitation Utilities). The System of Environmental-Economic Accounting (SEEA, 2012) will provide robust withdrawal and consumption based statistics in the long-term but is currently only being compiled by a select number of countries. Modelled data could be used to fill in gaps while capacity is being developed, so that the indicator could be calculated for all countries immediately. The indicator provides an aggregated measure of overall change in productivity across sectors, but it is built on sectoral data and is therefore relevant to each of the sectors
FAO, on behalf of UN-Water A partial monitoring framework is already in place, currently being finalized under the GEMI monitoring initiative under the UN-Water umbrella (see description under 6.3.1). Data on efficiency are available for all countries. Data for baseline year will be used to track progress in successive years.
This indicator informs on the following targets: 2.4, 8.4, 9.4
12.2, 12.3, 15.1.
Proposed new wording (the definition does not change): [Percentage of change in water use efficiency over time] (Old wording: Water Productivity) *** Definition: this indicator tracks change in water use efficiency over time for major sectors, including energy, industry, agriculture, and drinking water supply. The unit for efficiency can vary between the sectors, e.g. revenue in dollars for industry, energy production in kWh for energy or in kcal for agriculture. Sectoral efficiencies are aggregated in a single indicator through the use of weighting coefficients proportional to each sector's share of total water withdrawal/ consumption. Additional comment by ECE Statistical Division: A "Percentage of change in water use efficiency over time" would give much better values for countries with poor water use efficiencies as there is high potential for improvement. For countries who have already achieved a high degree of water use efficiency the change over time will be much smaller than for countries having still high potential for improvement. It is therefore suggested to compare both, the change over time, but also the actual water use efficiency by economic activity (ISIC Division level). Also regional differences, in particular in relation to agriculture and different climatic conditions, are to be considered.
The indicator can be calculated using existing datasets from FAO-AQUASTAT on water withdrawals in different sectors, together with datasets on value generation from National Accounts Main Aggregates (UNSD), World Energy Outlook (International Energy Agency), World Bank demographic datasets, WaterStat Database (Water Footprint Network) and IBNET (the International Benchmarking Network for Water and Sanitation Utilities). The System of Environmental-Economic Accounting (SEEA, 2012) will provide robust withdrawal and consumption based statistics in the long-term but is currently only being compiled by a select number of countries. Additional comment by ECE Statistical Division: Water Statistics (even if not compiled in form of SEEA-Water Accounts, provide an important data source). They are e.g. available at National Statistical Offices, Eurostat, UNSD. Modelled data could be used to fill in gaps while capacity is being developed, so that the indicator could be calculated for all countries immediately. The indicator provides an aggregated measure of overall change in productivity across sectors, but it is built on sectoral data and is therefore relevant to each of the sectors.
FAO, on behalf of UN-Water A partial monitoring framework is already in place, currently being finalized under the GEMI monitoring initiative under the UN-Water umbrella (see description under 6.3.1). Data on efficiency are available for all countries. Data for baseline year will be used to track progress in successive years.
This indicator informs on the following targets: Target 2.4: the water aspect of resources
use efficiency in agriculture Target 8.4: water use
efficiency in different sectors Target 9.4: water use
efficiency in the different sectors (municipal water
efficiency - status of water supply infrastructure,
industrial efficiency - use of clean and environmentally sound processes). Target
12.2: water use efficiency in the different sectors Target
12.3: This indicator (disaggregated) informs on
water use efficiency in drinking water supply (net
losses). Target 15.1: the use of inland freshwater
ecosystems and their services
target 8.9 and 12.b: sustainable tourism

List of Indicator Proposals - p. 168 of 265
List of Proposals* Note on Disaggregation: All indicators should be disaggregated by sex, age, residence (U/R) and other characteristics, as relevant and possible.
IUCN 2Proposed additional/alternative indicator: IUCN recommends use of the ["Natural Water Capital Index"] here.
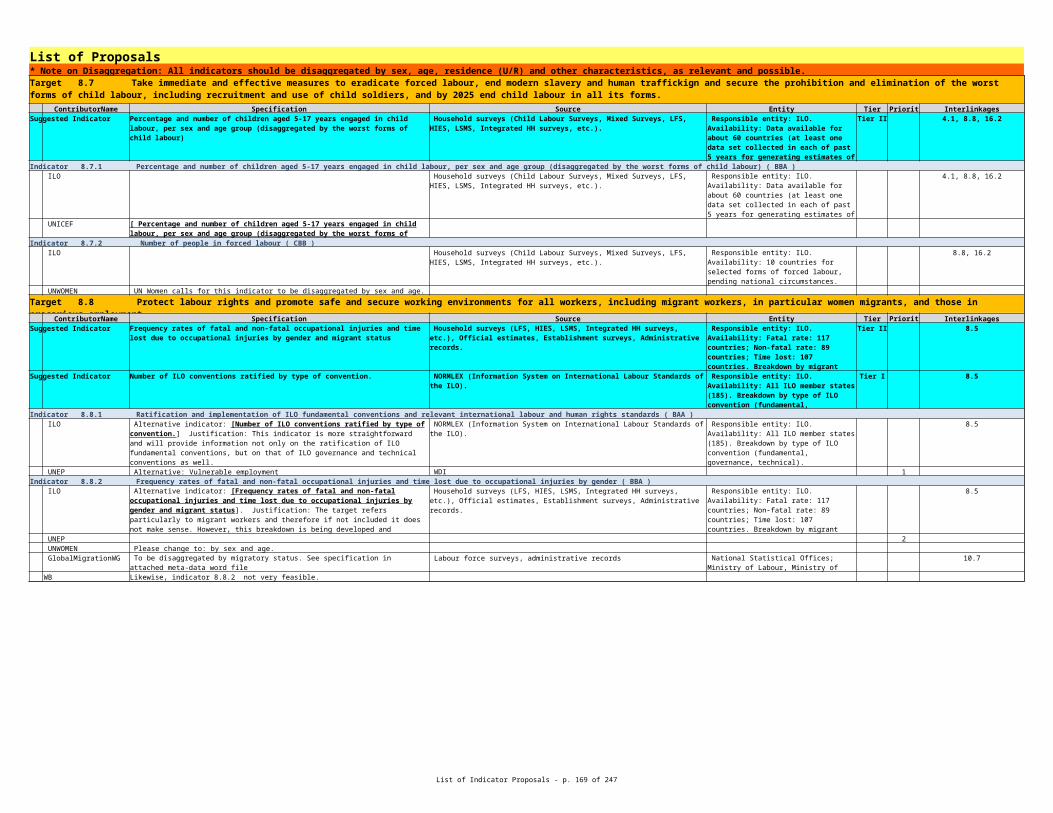
List of Indicator Proposals - p. 169 of 265
List of Proposals* Note on Disaggregation: All indicators should be disaggregated by sex, age, residence (U/R) and other characteristics, as relevant and possible.Target 6.5 By 2030, implement integrated water resources management at all levels, including through transboundary cooperation as appropriate
ContributorName Specification Source Entity Tier Priority InterlinkagesSuggested Indicator Degree of integrated water resources management (IWRM) implementation (0-100) Tier I
Indicator 6.5.1 Status of IWRM Implementation ( BBB ) ECE 1
WB
Data for 134 countries are available from UNEP-DHI (e.g. http://www.unepdhi.org/rioplus20 (see data file zip link) – full data available on request).Data are collected through the use of national IWRM questionnaires (one per country), measuring both qualitative and quantitative aspects of IWRM. This approach has been successfully applied to measure the status of IWRM for the Commission on Sustainable Development in both 2008 and 2012 (Rio+20).Results can easily be disaggregated to give a more nuanced picture of status both at national and regional (transboundary) levels.
UNEP, on behalf of UN-Water.Under the UN-Water umbrella, the GEMI monitoring initiative (see further information and description under 6.3.1), will draw on UNEP-DHI data, which are available for 134 countries. This can be used to provide a baseline for measurements.The UN World Water Assessment Programme (WWAP) initiated a project in 2014 to develop a methodology for gender-disaggregated data collection and produce gender-sensitive indicators. In November 2014, the Gender-Disaggregated Indicators presented by WWAP were officially endorsed by the African Ministers’ Council on Water (AMCOW).AMCOW officially committed to “establish national targets and a monitoring and evaluation framework for each of the seven pillars of the AMCOW gender policy and strategy, including sex-disaggregated indicators in the African context following guidelines developed by WWAP, by 2016.”
This indicator directly underpins all the other water and sanitation related goals
and targets, as it informs about the Means of
Implementation for SDG 6 technical targets. The indicator can thus be employed to support
reporting on targets 6.a and 6.b, and be further
complemented by the UN-Water Global Analysis and
Assessment of Sanitation and Drinking-Water (GLAAS) for
WASH-related issues.Target 1.b,
Target 11.b.
Proposed new wording (the definition does not change): [Degree of integrated water resources management (IWRM) implementation (0-100)] (Old wording: Status of IWRM Implementation) *** Definition: this indicator defines the extent to which integrated water resources management (IWRM) is implemented, by describing (1) the extent to which an enabling environment for IWRM (policy, strategic planning, legal framework and financing) has been established, (2) the structure and performance of an institutional framework to support IWRM processes, and (3) the degree to which management instruments/tools are applied. Issues relating to gender, governance, ecosystems, capacity, and transboundary aspects of water management are included. Status of implementation can be described as a percentage and as stages in a process, ranging from not developed to fully implemented (0 to 100 %). Calculations are based on a statistical analysis of national questionnaires (one per country).
Data for 134 countries are available from UNEP-DHI (e.g. http://www.unepdhi.org/rioplus20 (see data file zip link) - full data available on request). Data are collected through the use of national IWRM questionnaires (one per country), measuring both qualitative and quantitative aspects of IWRM. This approach has been successfully applied to measure the status of IWRM for the Commission on Sustainable Development in both 2008 and 2012 (Rio+20). Results can easily be disaggregated to give a more nuanced picture of status both at national and regional (transboundary) levels.
UNEP, on behalf of UN-Water Under the UN-Water umbrella, the GEMI monitoring initiative (see further information and description under 6.3.1), will draw on UNEP-DHI data, which are available for 134 countries. This can be used to provide a baseline for measurements. The UN World Water Assessment Programme (WWAP) initiated a project in 2014 to develop a methodology for gender-disaggregated data collection and produce gender-sensitive indicators. In November 2014, the Gender-Disaggregated Indicators presented by WWAP were officially endorsed by the African Ministers' Council on Water (AMCOW). AMCOW officially committed to "establish national targets and a monitoring and evaluation framework for each of the seven pillars of the AMCOW gender policy and strategy, including sex-disaggregated indicators in the African context following guidelines developed by WWAP, by 2016."
This indicator directly underpins all the other water and sanitation related goals
and targets, as it informs about the Means of
Implementation for SDG 6 technical targets. The indicator can thus be employed to support
reporting on targets 6.a and 6.b, and be further
complemented by the UN-Water Global Analysis and
Assessment of Sanitation and Drinking-Water (GLAAS) for
WASH-related issues. Target 1.b: This indicator informs on the existence of sound policy
frameworks to support accelerated investments in
poverty eradication actions. Target 11.b.
[ Percentage of basins/catchments with mechanisms for stakeholder involvement in WRM decisions/water allocation]

List of Indicator Proposals - p. 170 of 265
List of Proposals* Note on Disaggregation: All indicators should be disaggregated by sex, age, residence (U/R) and other characteristics, as relevant and possible.Indicator 6.5.2 Availability of operational arrangements for transboundary basin management ( CBB )
ECE 2 Proposed new wording (the definition does not change): [Percentage of transboundary basin areas with operational arrangements for integrated management in place] (Old wording: Availability of operational arrangements for transboundary basin management) *** Definition: proportion of surface area of transboundary basins (both surface and groundwater) that have an operational agreement/arrangement or institution for transboundary water cooperation in management, compared to total surface area of transboundary basins. For the cooperation framework to be considered as "operational", it requires that there are regular meetings of the riparian countries to discuss the integrated management of the water resource and to exchange information.
A global database exists of freshwater treaties and international river basin organizations, as well as several regional ones, e.g., for the Pan-European region the second Assessment under the Convention on the Protection and Use of Transboundary Watercourses and International Lakes (Water Convention). A global baseline comparative assessment of transboundary waters, including river basins (286) and 166 aquifers in 90 countries, has been undertaken by the Transboundary Waters Assessment Project (TWAP, completed in 2014), involving generation of geo-referenced datasets. Basin level data can be disaggregated to country level (for national reporting) and aggregated to regional and global level.
UNECE (as Secretariat for the Water Convention) and UNEP, on behalf of UN-Water Under the UN-Water umbrella, the GEMI monitoring initiative will provide a basis for monitoring proposed indicator 6.5.2 under the leadership of UNEP, UNECE and UNESCO-IGRAC (Integrated Groundwater Resources Assessment Centre) for this indicator (see 6.3.1 for further description on GEMI). UNECE acts as Secretariat for the Convention on the Protection and Use of Transboundary Watercourses and International Lakes (the "Water Convention"). Reporting on transboundary water cooperation is currently being developed under the Water Convention. Spatial data (delineating transboundary basins) are available for all known (286) transboundary basins. Data available at global level on the 120 international river basin organisations.
Target 1.b: This indicator informs on the existence of sound policy frameworks at regional and international
levels, based on pro-poor and gender-sensitive
development strategies to support accelerated
investments in poverty eradication actions Target
11.b: This indicator informs on the existence of integrated
policies and plans for transboundary water
management.

List of Indicator Proposals - p. 171 of 265
List of Proposals* Note on Disaggregation: All indicators should be disaggregated by sex, age, residence (U/R) and other characteristics, as relevant and possible.Target 6.6 By 2020, protect and restore water-related ecosystems, including mountains, forests, wetlands, rivers, aquifers and lakes.
ContributorName Specification Source Entity Tier Priority InterlinkagesSuggested Indicator Percentage of change in wetlands extent over time Tier II
Indicator 6.6.1 Change in wetlands extent over time (% change over time) ( BBB ) ECE 1
The indicator uses the existing Living Planet Index methodology for data collection and analysis.
Data are compiled and disseminated through the Ramsar Convention’s “State of the World’s Wetlands and their Services” (SoWWS) reports which are overseen by its Scientific and Technical Review Panel. The data originates from multiple sources including national reports submitted to the Ramsar Convention, published scientific papers and, increasingly, through analysis of remote sensing data. Currently, 169 Parties regularly report on trends in wetlands to the Ramsar Convention. Other data sources enable fully global coverage. The data can be disaggregated by wetland type: for example, for lakes, floodplains, coastal wetlands or artificial/constructed wetlands.
Wetland area is most accurately estimated through manual digitalization of aerial or satellite images, a methodology that in the coming years will be advanced by remote sensing. Supplementary information comes through scientific papers and national reports. Heterogeneous datasets are considered to be acceptable, if not desirable: change in extent will still be captured and heterogeneous datasets allow for more discrete analysis by wetland type, location and region.
CBD and UNEP, on behalf of UN-Water Assessments are undertaken by the Ramsar Convention on Wetlands, in collaboration with CBD (including the biodiversity indicators partnership) and UNEP, through the GEMI monitoring initiative. Under the UN-Water umbrella, the GEMI monitoring initiative will integrate the monitoring Framework in place under the SoWWS (see description of GEMI under 6.3.1). Baseline data are available at the global level. Historical records are available for some regions and wetlands types from the 1700's. The baseline assessment will be 2015 (first SoWWS report) with remote sensing data using 1970 as the baseline year. Currently, 169 Parties regularly report on trends in wetlands to the Ramsar Convention. Other data sources enable fully global coverage.
This indicator can inform on the following targets: Target
9.1 and 9.2, Target 11.5, Target 11.6, Target 11.7, Target 12.2, Target 12.4, Target 13.1, Target 14.1,
Target 14.2 and 14.5, Target 15.1, 15.2 and 15.3
Proposed new wording (the definition does not change): [Percentage of change in wetlands extent over time] *** Definition: Change in total wetland area over time (% change/year). The Ramsar broad definition of "wetland" is used, which includes rivers and lakes, enabling three of the biome types mentioned in the target to be assessed - wetlands, rivers, lakes - plus other wetland types.
The indicator uses the existing Living Planet Index methodology for data collection and analysis. Data are compiled and disseminated through the Ramsar Convention's "State of the World's Wetlands and their Services" (SoWWS) reports which are overseen by its Scientific and Technical Review Panel. A summary of the first assessment exercise is being provided to Ramsar COP-12 in June 2015 providing baseline analysis (http://www.ramsar.org/sites/default/files/documents/library/cop12_doc23_bn7_sowws_e_0.pdf) The indicator is also a sub-indicator for Aichi Biodiversity Target 5 (with reporting mechanism in place for that). The data originates from multiple sources including national reports submitted to the Ramsar Convention, published scientific papers and, increasingly, through analysis of remote sensing data. Wetland area is most accurately estimated through manual digitalization of aerial or satellite images, a methodology that in the coming years will be advanced by remote sensing. Supplementary information comes through scientific papers and national reports. Heterogeneous datasets are considered to be acceptable, if not desirable: change in extent will still be captured and heterogeneous datasets allow for more discrete analysis by wetland type, location and region. The data can be disaggregated by wetland type: for example, for lakes, floodplains, coastal wetlands or artificial/constructed wetlands. This enables more refined assessment of progress towards target 6.6 since wetland type and location are relevant variables when assessing progress towards target 6.6.
CBD and UNEP, on behalf of UN-Water Assessments are undertaken by the Ramsar Convention on Wetlands, in collaboration with CBD (including the biodiversity indicators partnership) and UNEP, through the GEMI monitoring initiative. Under the UN-Water umbrella, the GEMI monitoring initiative will integrate the monitoring Framework in place under the SoWWS (see description of GEMI under 6.3.1). Baseline data are available at the global level. Historical records are available for some regions and wetlands types from the 1700's. The baseline assessment will be 2015 (first SoWWS report) with remote sensing data using 1970 as the baseline year. Currently, 169 Parties regularly report on trends in wetlands to the Ramsar Convention. Other data sources enable fully global coverage.
This indicator can inform on the following targets: Target
9.1 and 9.2, Target 11.5, Target 11.6, Target 11.7, Target 12.2, Target 12.4, Target 13.1, Target 14.1,
Target 14.2 and 14.5, Target 15.1, 15.2 and 15.3

List of Indicator Proposals - p. 172 of 265
List of Proposals* Note on Disaggregation: All indicators should be disaggregated by sex, age, residence (U/R) and other characteristics, as relevant and possible.
UNEP Database of individual wetland extent time series harvested from the literature.
IUCN 1
UNSD Percentage change in wetlands extent over time 1
ContributorName Specification Source Entity Tier Priority InterlinkagesODA for water and sanitation related activities and programmes OECD-DAC OECD-DAC Tier II
NATarget 6.b Support and strengthen the participation of local communities in improving water and sanitation management.
ContributorName Specification Source Entity Tier Priority Interlinkages
NA
[Wetland Extent Trends (WET) Index, an adaptation of the Living Planet Index (LPI) of species population abundance proposed for target 15.5.] The WET Index presents proportional change in extent over time against a baseline value of 1 (baseline year = 1970 but can be varied). Currently this is the only global indicator of wetland extent available. Methodology and first global and regional results submitted for peer reviewed publication (also used by the CBD Secretariat as a contribution to GBO-4 in 2014, and the Ramsar Secretariat in various State of the World's Wetlands assessment and communication materials produced in 2015). Quality of the index is dependent upon the underlying database of wetland change time series from which it is derived. This can be enhanced over time with more recent (and more representative) time series data and the use of large scale remotely sensed data.
Methodology developed by, and global database currently held by, UNEP-WCMC working in collaboration with the Ramsar Secretariat (Indicator under the BIP)
The WET index is directly relevant to Target 15.1 and 15.5; A coastal and marine
wetland cut of the WET Index would be relevant for Target
14.2
Proposed additional/alternative indicator: "Change in wetlands extent" focuses solely on area, and so is a poor measure of whether the most important places for biodiversity are protected. IUCN suggests complementing this with an indicator of ["Coverage by protected areas of freshwater sites of particular importance for biodiversity"], using Key Biodiversity Areas to identify these. The indicator is used by the BIP as an indicator towards Aichi Target 11 (http://www.bipindicators.net/paoverlays).
Data sources: Protected Planet (http://www.protectedplanet.net/) for protected areas data; Important Bird & Biodiversity Areas (http://www.birdlife.org/datazone/site) and Alliance for Zero Extinction sites (http://www.zeroextinction.org/) for Key Biodiversity Areas data; indicator developed by Butchart et al. (2012) PLoS ONE 7(3): e32529.
Responsible entities and national availability: IUCN & UNEP-WCMC, BirdLife International, AZE. Available globally since 1950s, and can be disaggregated to national and regional levels.
15.1 (and disaggregated versions for other targets)
As the SEEA Experimental Ecosystem Accounts is being established, the Ecosystem Unit (EU) described in the SEEA EEA Technical Guidance 2015 provides at the framework for classifying wetland assets. The wetland EU can be tailored to country needs and be linked to condition assessments and wetland ecosystem services. The wetland EU can be adapted to both international (Ramsar) and national systems of wetland classifications.
Target 6.a By 2030, expand international cooperation and capacity-building support to developing countries in water- and sanitation-related activities and programmes, including water harvesting, desalination, water efficiency, wastewater treatment, recycling and reuse technologies

List of Indicator Proposals - p. 173 of 265
List of Proposals* Note on Disaggregation: All indicators should be disaggregated by sex, age, residence (U/R) and other characteristics, as relevant and possible.Goal 7 Ensure access to affordable, reliable, sustainable and modern energy for all Target 7.1 By 2030, ensure universal access to affordable, reliable and modern energy services
ContributorName Specification Source Entity Tier Priority InterlinkagesSuggested Indicator Percentage of population with electricity access (%) World Bank (as part of SE4All) Tier ISuggested Indicator Percentage of population with primary reliance on non-solid fuels (%) Tier IIndicator 7.1.1 Percentage of population with electricity access (%) ( AAA )
UNICEF [Percentage of population with electricity access] UNWOMEN UN Women calls for this indicator to be disaggregated by location and income.
WB
Indicator 7.1.2 Percentage of population with primary reliance on non-solid fuels (%) ( BAA ) UNICEF [Percentage of population with primary reliance on non-solid fuels (%) ] UNWOMEN UN Women calls for this indicator to be disaggregated by location and income.
WB Solid and fit for purposeTarget 7.2 By 2030, increase substantially the share of renewable energy in the global energy mix
ContributorName Specification Source Entity Tier Priority InterlinkagesSuggested Indicator Renewable energy share in the total final energy consumption (%) Tier IIndicator 7.2.1 Renewable energy share in the total final energy consumption (%) ( AAA )
UNWTO
WB Solid and fit for purposeUNSD Share of energy from renewable sources in net domestic energy use UNSD/OECD
Indicator 7.2.2 Enabling legislation and framework for renewable energy production established by 2020 ( BBA ) WB
Target 7.3 By 2030, double the global rate of improvement in energy efficiency ContributorName Specification Source Entity Tier Priority Interlinkages
Suggested Indicator Tier I 7.3
Indicator 7.3.1 Rate of improvement in energy intensity (%) measured in terms of primary energy and GDP ( AAA ) UNWTO
UPU 2WB Solid and fit for purposeUNSD Ratio of value added to net domestic energy use, by industry. UNSD 1
Indicators 7.1.1 and 7.1.2 are solid and fit for purpose. However, we would like to note that there is scope to improve these indicators over time to capture important dimensions of energy access such as the reliability and affordability of service, which are highlighted in the formulation if SDG7. A large consortium of agencies co-led by WB and IEA is currently working on a more sophisticated multitier methodology, which is not yet available, but which may - over time - be able to contribute to the improvement of these basic access measures.
target 8.9 and 12.b: sustainable tourism
The SEEA Central Framework and the SEEA Energy provide standard methodology for calculating this indicator. The EA methodology should be evaluated against the standard.
Indicator 7.2.2 is not really an indicator of renewable energy outcomes, but rather a measure of the effort that policy makers are putting into creating a regulatory environment for renewable energy. While this is important and valuable, we do not feel it belongs as an SDG indicator.
Rate of improvement in energy intensity (%) measured in terms of primary energy and GDP
target 8.9 and 12.b: sustainable tourism
Energy productivity indicators defined as value added generated over net domestic energy use. Such indicator can be calculated at the aggregate economy-wide level, as well as by industry and by primary energy source.

List of Indicator Proposals - p. 174 of 265
List of Proposals* Note on Disaggregation: All indicators should be disaggregated by sex, age, residence (U/R) and other characteristics, as relevant and possible.Indicator 7.3.2 Composite Energy Efficiency Improvement Index built up of sub-indicators measuring transport energy efficiency, industrial energy efficiency, power generation energy efficiency, buildings energy efficiency and agricultural energy efficiency ( CBA )
IFAD
UNWTO
UPU 1
WB IEA IEA
ContributorName Specification Source Entity Tier Priority InterlinkagesSuggested Indicator Tier II
Indicator 7.a.1 Improvement in the net carbon intensity of the energy sector (GHG/TFC in CO2 equivalents) ( BBA ) WB
Indicator 7.a.2 Amount of Foreign Direct Investment and Financial transfer for these purposes ( BBB ) WB
MODIFIED: [Composite Energy Efficiency Improvement Index built up of sub-indicators measuring average fuel economy of vehicles in litres per 100 kilometre, energy efficiency, industrial energy efficiency, power generation energy efficiency, buildings energy efficiency and agricultural energy efficiency]
The transport sector is a major user of fossil fuels, and a major emitter of greenhouse gasses. CO2 emissions are growing more rapidly than any other sector - set to go from one quarter today to one third by 2050. By measuring the average fuel economy we can measure the overall CO2 emissions of the global fleet. A number of global fora - IPCC, G20, SE4ALL, GFEI, have adopted a target of at least doubling the efficiency of the average vehicles / the global fleet, which would save 2GT CO2e/ year by 2050
The Global Fuel Economy Initiative keeps track of this and publishes a report every 2 years. http://www.fiafoundation.org/our-work/global-fuel-economy-initiative/about-gfei
target 8.9 and 12.b: sustainable tourism
The Universal Postal Union, with postal and logistics networks heavily involved in transportation, supports the following modification introduced by UNEP: composite Energy Efficiency Improvement Index built up of sub-indicators measuring average fuel economy of vehicles in litres per 100 kilometre, energy efficiency, industrial energy efficiency, power generation energy efficiency, buildings energy efficiency and agricultural energy efficiency.
The Universal Postal Union produces a Annual Carbon Inventor for the postal operators of its 192 member countries. This inventory covers postal activities under scope 1, 2 and 3, including energy consumption for transports and buildings at country, regional and global level. As indicated by UNEP: the transport sector is a major user of fossil fuels, and a major emitter of greenhouse gasses. CO2 emissions are growing more rapidly than any other sector - set to go from one quarter today to one third by 2050. By measuring the average fuel economy we can measure the overall CO2 emissions of the global fleet. A number of global fora - IPCC, G20, SE4ALL, GFEI, have adopted a target of at least doubling the efficiency of the average vehicles / the global fleet, which would save 2GT CO2e/ year by 2050
As indicated by UNEP: the Global Fuel Economy Initiative keeps track of this and publishes a report every 2 years. http://www.fiafoundation.org/our-work/global-fuel-economy-initiative/about-gfei ** UPU data availability: 130 countries on an annual basis since 2010/2011
Indicator 7.3.2 is valuable at pointing to the need to measure underlying energy input to output measures in different sectors. Unfortunately, the data needed to implement such an indicator is only available for a handful of countries. However, as input to composite indicator, ["Fuel Economy on New Light Duty Vehicles"] is available for major countries, regions and the globe
Target 7.a By 2030, enhance international cooperation to facilitate access to clean energy research and technology, including renewable energy, energy efficiency and advanced and cleaner fossil-fuel technology, and promote investment in energy infrastructure and clean energy technology
Improvement in the net carbon intensity of the energy sector (GHG/TFC in CO2 equivalents)
UNFCCC (or GHG data derived from the energy data above using the IPCC guidelines)
Indicator 7.a.1 is useful insofar as the carbon intensity of energy production is a measure that paints a much broader picture of the environmental sustainability of the energy sector, going beyond renewable energy to capture nuclear power as well as lower carbon fossil fuels.
Indicator 7.a.2 focuses primarily on financing, which is an input variable, and we doubt the necessary data would be available.

List of Indicator Proposals - p. 175 of 265
List of Proposals* Note on Disaggregation: All indicators should be disaggregated by sex, age, residence (U/R) and other characteristics, as relevant and possible.
ContributorName Specification Source Entity Tier Priority InterlinkagesSuggested Indicator Ratio of value added to net domestic energy use, by industry. UNSD Tier I 7.3
Indicator 7.b.1 Rate of improvement in energy productivity (the amount of economic output achieved for a given amount of energy consumption). ( BBA ) WB
UNSD Ratio of value added to net domestic energy use, by industry. UNSD 1 7.3
Indicator 7.b.2 Percentage of international cooperation projects being implemented to facilitate access to clean energy ( BBB ) WB
Target 7.b By 2030, expand infrastructure and upgrade technology for supplying modern and sustainable energy services for all in developing countries, in particular least developed countries and small island developing States
Energy productivity indicators defined as value added generated over net domestic energy use. Such indicator can be calculated at the aggregate economy-wide level, as well as by industry and by primary energy source.
Indicator 7.b.1 is mathematically almost identical to indicator 7.3.1 on energy efficiency, as energy productivity and energy intensity are essentially the same thing.
Energy productivity indicators defined as value added generated over net domestic energy use. Such indicator can be calculated at the aggregate economy-wide level, as well as by industry and by primary energy source.
Indicator 7.b.2 again refers to financing, which is an input rather than an output. We also have doubts whether suitable data would be available. An alternative approach that could be considered would be to look at trade data on uptake of clean energy technologies by lower income countries. Good data is available on the extent if clean energy imports and the existence of tariffs and non-tariff barriers. These indicators successfully capture whether or not countries have access to technologies. This approach is put forward in the SE4ALL Global Tracking Framework 2015.

List of Indicator Proposals - p. 176 of 265
List of Proposals* Note on Disaggregation: All indicators should be disaggregated by sex, age, residence (U/R) and other characteristics, as relevant and possible.Goal 8 Promote sustained, inclusive and sustainable economic growth, full and productive employment and decent work for all Target 8.1 Sustain per capita economic growth in accordance with national circumstances and, in particular, at least 7 per cent gross domestic product growth per annum in the least developed countries
ContributorName Specification Source Entity Tier Priority InterlinkagesSuggested Indicator GDP per capita, PPP World Bank World Bank Tier IIndicator 8.1.1 GDP per capita, PPP ( AAA )
ILO Responsible entity: World Bank. 1 UNEP WDI http://data.worldbank.org/indicator/NY.GDP.PCAP.PP.CD World Bank/180 2 UPU 1
Indicator 8.1.2 Inclusive Wealth Index ( CBB ) ILO
UNCDF [Number and % of subnational regions experiencing 7% per annum GDP growth.]
UNEP http://inclusivewealthindex.org/#the-world-wants-to-know-how-its-doing UNEP/140 1
UPU 2
WB
Target 8.2 Achieve higher levels of economic productivity through diversification, technological upgrading and innovation, including through a focus on high-value-added and labour-intensive sectors ContributorName Specification Source Entity Tier Priority Interlinkages
Suggested Indicator Growth rate of GDP per employed person WB and ILO Tier I
Indicator 8.2.1 Growth rate of GDP per employed person ( AAA ) ILO 1
UNCDF
UNEP Indicator 8.2.2 Export diversification in terms of products and markets ( BBB )
ILO Delete. The focus of the target is clearly on increasing productivity levels. UNCDF [ Number / value of investment projects in each region.]
UNEP Constructed based on UNCOMTRADE and OECD and APEC lists 1
The purpose would be to strengthen this indicator by contributing to build up a reliable real time proxy indicator: (1) for short-run and real-time GDP variations: volumes and values of global e-commerce transactions by country (domestic and/or international transactions) (2) for short-run and real-time price variations: on-line price index by country
(1) The UPU consolidates international postal and parcels data from tracking system in real-time, gathering several billions records every year on each international e-commerce transaction (the system could be expanded to cover domestic transactions as well) (2) Already potentially available through MIT \One billion prices project\"."
(1) The Universal Postal Union in collaboration with UN Global Pulse and UNSD Comtrade (on-going project of testing the proxy within the UN Global Working Group on Big Data for Official Statistics). Data availability: ~ 170 countries. Real-time data. Available since 2010 in terms of volumes (partial archives back to 1999). Availability of values for most countries starting in 2016-17 (2) MIT. Evolving number of countries available. Potential of accessing real-time data.
Delete. The target specifies the GDP measurement. Alternative measurement could be considered under target 17.19.
National statistics disaggregated by territorial division at the first level (province, state, governorate etc.). Statistics from major cities.
1.3, 1.5, 9.2, 11.5, 12.2., 17.19
Possible new Indicator 8.1.3: [“Growth rates of household expenditure or income per capita among the bottom 40 percent of the population and the total population."”] Note this is similar to Target 10.1 as proposed below.
GDP figures based on National Accounts and employment figures on Household surveys.
GDP figures based on National Accounts and employment figures on Household surveys.
Responsible entity: ILO. Availability: Data available for 124 countries.
[% Increase in gross fixed capital formation in sub national regions.] National statistics disaggregated by territorial division at the first level (province, state, governorate etc.). Statistics from major cities
National statistics disaggregated by territorial division at the first level (province, state, governorate etc.). Statistics from major cities
Alternative: [Share of environmental goods in total exports] Already constructed by UNEP-ETB for 128 countries for the work on the Green Economy Progress Index

List of Indicator Proposals - p. 177 of 265
List of Proposals* Note on Disaggregation: All indicators should be disaggregated by sex, age, residence (U/R) and other characteristics, as relevant and possible.
ContributorName Specification Source Entity Tier Priority InterlinkagesSuggested Indicator Household surveys (LFS, HIES, LSMS, Integrated HH surveys, etc.). Tier II 8.5, 8.8
Indicator 8.3.1 Job openings rate (openings as % of employment and openings) and total separations (separations as % of employment) in non-farm establishments ( BBB ) ILO Household surveys (LFS, HIES, LSMS, Integrated HH surveys, etc.). 1 8.5, 8.8
WB
Indicator 8.3.2 % of MSMEs with a loan or line of credit ( CBB ) ILO Delete. Access to financial services is measured in other targets. UNCDF Same Indicator Enterprise Surveys 2 Target 9.3.2
UNEP WIPO Data available for 123 countries 1 WB World Bank Enterprise Surveys 2
Target 8.3 Promote development-oriented policies that support productive activities, decent job creation, entrepreneurship, creativity and innovation, and encourage the formalization and growth of micro-, small- and medium-sized enterprises, including through access to financial services
Share of informal employment in non-agriculture employment by sex.
Responsible entity: ILO. Availability: Share of informal employment available for 62 countries.
Alternative indicator: [Share of informal employment in non-agriculture employment by sex.] Justification: As the target promotes formalization, it is key to have available information on this aspect to address policies. Moreover, the indicator provides certain continuity to the former indicator on vulnerable employment in the MDGs. The initial proposed indicator is not available for most countries and it has not been agreed or used internationally yet.
Responsible entity: ILO. Availability: Share of informal employment available for 62 countries.
As proposed, 8.3.1. in our view should be CBB – it is not very feasible to collect the proposed indicator. The core element of this target is 'supportive policies' related to entrepreneurship and SME development (which may lead to job creation, but for which the proposed indicators will be very hard to measure). It may be more relevant to use Doing Business DTF for "starting a Business'"
World Bank - Data is available for 135 countries
Alternative: [Share of environmental patents in total patents] For further details, see http://www.enterprisesurveys.org. Firm size levels are 5-19 (small), 20-99 (medium), and 100+ employees (large-sized firms).
World Bank. Data availability: ~135 developing economies, every 3-4 years, starting in 2006
8.3 and 9.3. Can potentially be used for 5.a if broken down by \ownership by
gender\"."

List of Indicator Proposals - p. 178 of 265
List of Proposals* Note on Disaggregation: All indicators should be disaggregated by sex, age, residence (U/R) and other characteristics, as relevant and possible.
ContributorName Specification Source Entity Tier Priority InterlinkagesSuggested Indicator Resource productivity. Tier II 9.4, 12.1, 12.2
Indicator 8.4.1 Indicator for national material efficiency (production and consumption approaches) ( CBB ) UNEP International Resource Panel 1UNSD 1 9.4, 12.1, 12.2
OECD OECD 1 12.c, 13.2
Indicator 8.4.2 Sectoral material efficiency ( CBB ) UNEP International Resource Panel 2
Target 8.4 Improve progressively, through 2030, global resource efficiency in consumption and production and endeavour to decouple economic growth from environmental degradation, in accordance with the 10-year framework of programmes on sustainable consumption and production, with developed countries taking the lead
- Statistical surveys and administrative data on material use and value added collected from the national statistics office
- UNEP/International resources panel is responsible for policy application of data but not on the data collection and dissemination per se. - UNIDO: Data are partially available for international reporting- The System of Environmental Economic Accounts provides a standard methodology for calculating this indicator. However, no international data collection mechanism is yet in place and countries are still in implementation phase.
[Resource productivity.] Resource productivity is gross domestic product (GDP) divided by domestic material consumption (DMC). DMC measures the total amount of materials directly used by an economy. It is defined as the annual quantity of raw materials extracted from the domestic territory of the focal economy, plus all physical imports minus all physical exports.
- Statistical surveys and administrative data on material use and value added collected from the national statistics office
- UNEP/International resources panel is responsible for policy application of data but not on the data collection and dissemination per se. - UNIDO: Data are partially available for international reporting- The System of Environmental Economic Accounts provides a standard methodology for calculating this indicator. However, no international data collection mechanism is yet in place and countries are still in implementation phase.
Suggested alternative indicator: [Effective Tax Rates on Energy Use.] This indicator fits the target very well, a well-established methodology exists and data cover 80% of world energy and 84% of global carbon emissions from energy.
See http://www.oecd.org/tax/tax-policy/taxingenergyuse.htm and http://www.oecd-ilibrary.org/docserver/download/2313021e.pdf?expires=1434984054&id=id&accname=ocid84004878&checksum=AC6BDF712748EA74C98B4C18438173D9

List of Indicator Proposals - p. 179 of 265
List of Proposals* Note on Disaggregation: All indicators should be disaggregated by sex, age, residence (U/R) and other characteristics, as relevant and possible.Target 8.5 By 2030, achieve full and productive employment and decent work for all women and men, including for young people and persons with disabilities, and equal pay for work of equal value
ContributorName Specification Source Entity Tier Priority InterlinkagesSuggested Indicator Tier II 10.3,10.4
Suggested Indicator Unemployment rate by sex, age-group and disability. Tier I/II 8.6
Indicator 8.5.1 Employment to working-age population (15 years and above) ratio by gender and age group, and people with disabilities ( AAA ) ILO Household surveys (LFS, HIES, LSMS, Integrated HH surveys, etc.). 2 8.6; 10.3
WB Standard Indicator, in agreementIndicator 8.5.2 Unemployment rate by gender and age-group ( AAA )
ILO 1 10.3,10.4
UNWOMEN Labour Force Surveys 1
GlobalMigrationWG NB! Disaggregate by migratory status WB Standard Indicator, in agreement
Target 8.6 By 2020, substantially reduce the proportion of youth not in employment, education or training ContributorName Specification Source Entity Tier Priority Interlinkages
Suggested Indicator Percentage of youth (15-24) not in education, employment or training (NEET) Tier I
Indicator 8.6.1 Percentage of youth (15-24) not in education, employment or training (NEET) ( AAA ) ILO 1 8.5
UNEP WDI: http://data.worldbank.org/indicator/SL.UEM.NEET.ZS 1 UNWOMEN UN Women calls for this indicator to be disaggregated by sex. WB Standard Indicator, in agreement
Indicator 8.6.2 Youth (15-24) unemployment rate ( AAA ) ILO 2 8.5
UNEP WDI http://data.worldbank.org/indicator/SL.UEM.1524.ZS 2 UNWOMEN UN Women calls for this indicator to be disaggregated by sex. WB Standard Indicator, in agreement
Average hourly earnings of female and male employees by occupations (Wages/Gender wage gap)
Household surveys (LFS, HIES, LSMS, Integrated HH surveys, etc.), Establishment surveys, Administrative records.
Responsible entity: ILO. Availability: Hourly earnings and gender wage gap: 66 countries.
Household surveys (LFS, HIES, LSMS, Integrated HH surveys, etc.), Administrative records.
Responsible entity: ILO. Availability: 224 countries.
Responsible entity: ILO. Availability: 181 countries (without breakdown for people with disabilities).
Alternative indicator: [Average hourly earnings of female and male employees by occupations (Wages/Gender wage gap)] Justification: The target is explicit in measuring equal pay for work of equal value and therefore it is crucial to include certain component addressing this aspect. Besides, it provides continuity to the MDG indicator. The initial proposed indicator is already captured in 8.6.2
Household surveys (LFS, HIES, LSMS, Integrated HH surveys, etc.), Establishment surveys, Administrative records.
Responsible entity: ILO. Availability: Hourly earnings and gender wage gap: 66 countries.
Additional indicator proposed by UN Women: [Gender gap in wages]. This indicator should be added to capture the target element on equal pay for work of equal value. The indicator is a Tier 3 indicator part of the minimum set of gender indicators. More methodological development is requires to enable global comparability.
ILO, country coverage from ILO database and other national sources is 119
Household surveys (LFS, HIES, LSMS, Integrated HH surveys, etc.), Administrative records.
Responsible entity: ILO/OECD. Availability: 88 countries.
Household surveys (LFS, HIES, LSMS, Integrated HH surveys, etc.), Administrative records.
Responsible entity: ILO./OECD Availability: 88 countries.
Alternative indicator: [Unemployment rate by gender and age-group.] Justification: By including an age group covering 15-24 years, the indicator covers youth and compares their situation with the rest of population. It makes therefore the unemployment rate redundant in 8.5.2 allowing to better capture quality aspects of decent work.
Household surveys (LFS, HIES, LSMS, Integrated HH surveys, etc.), Official estimates, Administrative records.
Responsible entity: ILO. Availability: 224 countries.
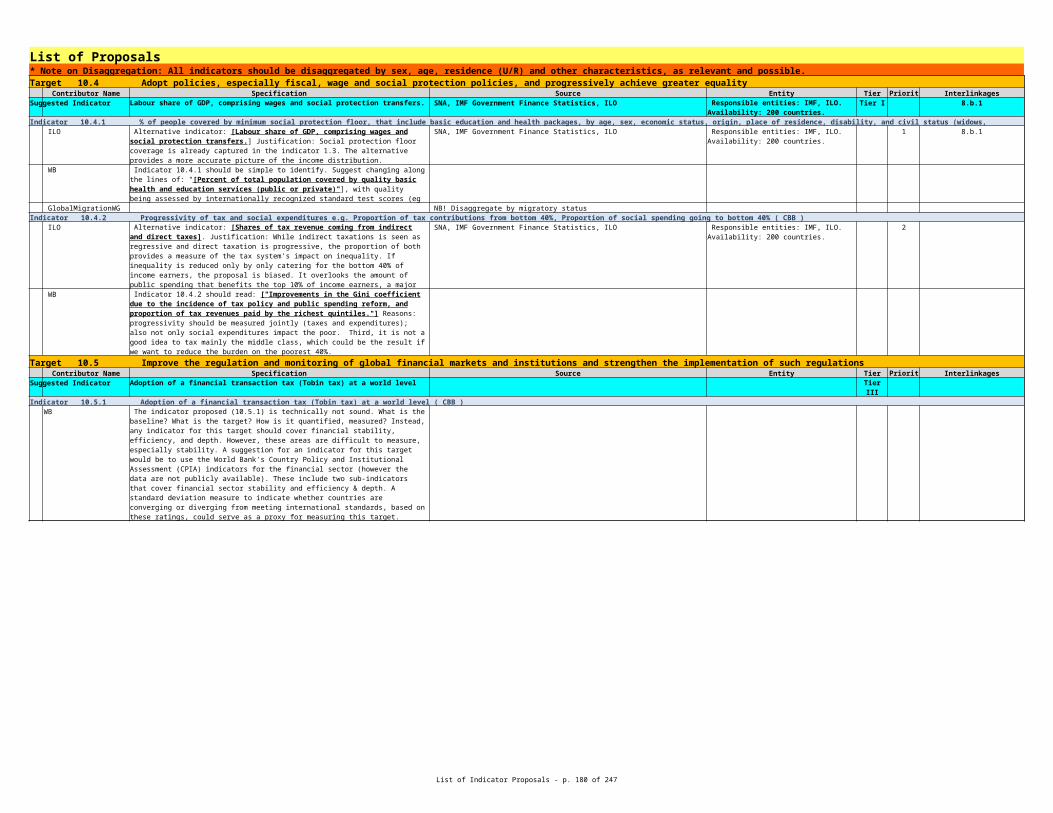
List of Indicator Proposals - p. 180 of 265
List of Proposals* Note on Disaggregation: All indicators should be disaggregated by sex, age, residence (U/R) and other characteristics, as relevant and possible.
ContributorName Specification Source Entity Tier Priority InterlinkagesSuggested Indicator Tier II 4.1, 8.8, 16.2
Indicator 8.7.1 Percentage and number of children aged 5-17 years engaged in child labour, per sex and age group (disaggregated by the worst forms of child labour) ( BBA ) ILO 4.1, 8.8, 16.2
UNICEF
Indicator 8.7.2 Number of people in forced labour ( CBB ) ILO 8.8, 16.2
UNWOMEN UN Women calls for this indicator to be disaggregated by sex and age. Target 8.8 Protect labour rights and promote safe and secure working environments for all workers, including migrant workers, in particular women migrants, and those in precarious employment
ContributorName Specification Source Entity Tier Priority InterlinkagesSuggested Indicator Tier II 8.5
Suggested Indicator Number of ILO conventions ratified by type of convention. NORMLEX (Information System on International Labour Standards of the ILO). Tier I 8.5
Indicator 8.8.1 Ratification and implementation of ILO fundamental conventions and relevant international labour and human rights standards ( BAA ) ILO NORMLEX (Information System on International Labour Standards of the ILO). 8.5
UNEP Alternative: Vulnerable employment WDI http://data.worldbank.org/indicator/SL.EMP.VULN.ZS/countries 1Indicator 8.8.2 Frequency rates of fatal and non-fatal occupational injuries and time lost due to occupational injuries by gender ( BBA )
ILO 8.5
UNEP 2 UNWOMEN Please change to: by sex and age. GlobalMigrationWG Labour force surveys, administrative records 10.7
WB
Target 8.7 Take immediate and effective measures to eradicate forced labour, end modern slavery and human traffickign and secure the prohibition and elimination of the worst forms of child labour, including recruitment and use of child soldiers, and by 2025 end child labour in all its forms.
Percentage and number of children aged 5-17 years engaged in child labour, per sex and age group (disaggregated by the worst forms of child labour)
Household surveys (Child Labour Surveys, Mixed Surveys, LFS, HIES, LSMS, Integrated HH surveys, etc.).
Responsible entity: ILO. Availability: Data available for about 60 countries (at least one data set collected in each of past 5 years for generating estimates of the proposed indicators).
Household surveys (Child Labour Surveys, Mixed Surveys, LFS, HIES, LSMS, Integrated HH surveys, etc.).
Responsible entity: ILO. Availability: Data available for about 60 countries (at least one data set collected in each of past 5 years for generating estimates of the proposed indicators).
[ Percentage and number of children aged 5-17 years engaged in child labour, per sex and age group (disaggregated by the worst forms of child labour) ]
Household surveys (Child Labour Surveys, Mixed Surveys, LFS, HIES, LSMS, Integrated HH surveys, etc.).
Responsible entity: ILO. Availability: 10 countries for selected forms of forced labour, pending national circumstances.
Frequency rates of fatal and non-fatal occupational injuries and time lost due to occupational injuries by gender and migrant status
Household surveys (LFS, HIES, LSMS, Integrated HH surveys, etc.), Official estimates, Establishment surveys, Administrative records.
Responsible entity: ILO. Availability: Fatal rate: 117 countries; Non-fatal rate: 89 countries; Time lost: 107 countries. Breakdown by migrant status not currently available.
Responsible entity: ILO. Availability: All ILO member states (185). Breakdown by type of ILO convention (fundamental, governance, technical).
Alternative indicator: [Number of ILO conventions ratified by type of convention.] Justification: This indicator is more straightforward and will provide information not only on the ratification of ILO fundamental conventions, but on that of ILO governance and technical conventions as well.
Responsible entity: ILO. Availability: All ILO member states (185). Breakdown by type of ILO convention (fundamental, governance, technical).
Alternative indicator: [Frequency rates of fatal and non-fatal occupational injuries and time lost due to occupational injuries by gender and migrant status]. Justification: The target refers particularly to migrant workers and therefore if not included it does not make sense. However, this breakdown is being developed and information is not currently available.
Household surveys (LFS, HIES, LSMS, Integrated HH surveys, etc.), Official estimates, Establishment surveys, Administrative records.
Responsible entity: ILO. Availability: Fatal rate: 117 countries; Non-fatal rate: 89 countries; Time lost: 107 countries. Breakdown by migrant status not currently available.
To be disaggregated by migratory status. See specification in attached meta-data word file
National Statistical Offices; Ministry of Labour, Ministry of Health
Likewise, indicator 8.8.2 not very feasible.
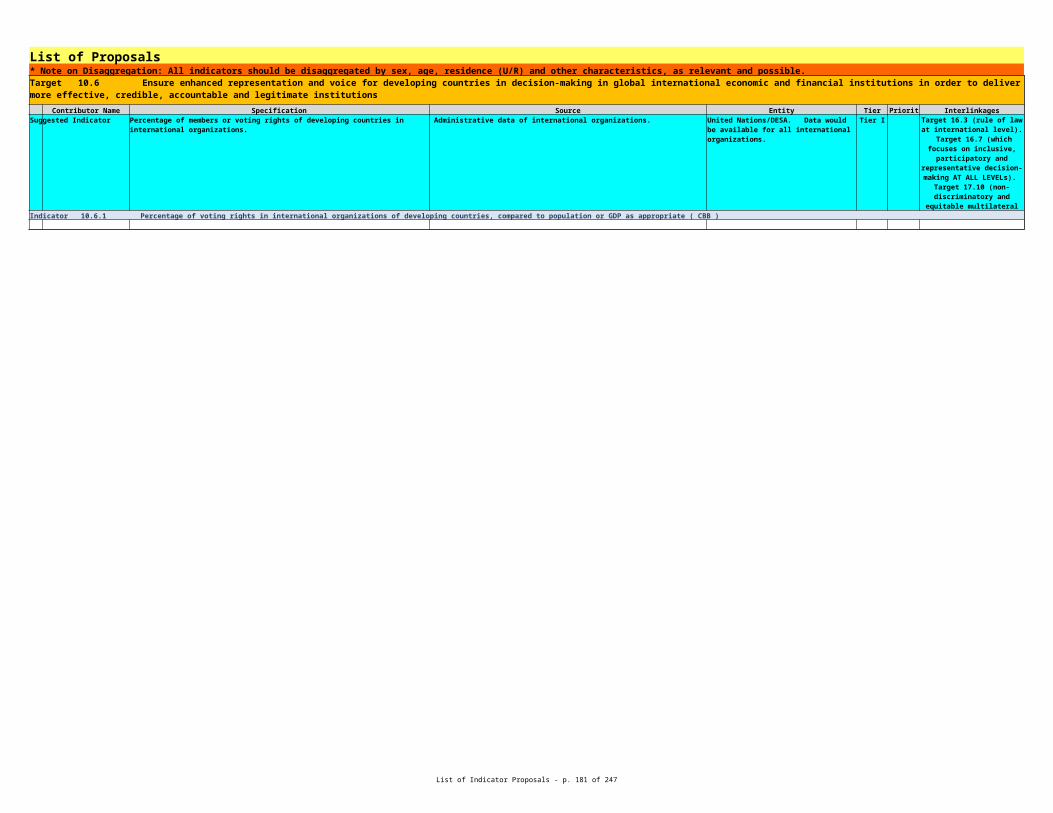
List of Indicator Proposals - p. 181 of 265
List of Proposals* Note on Disaggregation: All indicators should be disaggregated by sex, age, residence (U/R) and other characteristics, as relevant and possible.Target 8.9 By 2030, devise and implement policies to promote sustainable tourism that creates jobs and promotes local culture and products
ContributorName Specification Source Entity Tier Priority InterlinkagesSuggested Indicator Tier II
Indicator 8.9.1 Tourism direct GDP ( BAA ) ICAO 1
UNWTO 1
WB
Indicator 8.9.2 Tourism consumption ( BAA ) UNEP 2
UNWTO 2
WB
Tourism direct GDP (as % of total GDP and in growth rate); and Number of jobs in tourism industries (as % total jobs and growth rate of jobs, by gender)
Existing data sources: National Statistical Offices and National Tourism Administrations. Not all countries have GDP figures for tourism, therefore value added could be used instead. The same applies for employment: not all countries count the number of jobs, some will have only the number of employees (or the full-time equivalents) which is a good substitute.
World Tourism Organisation (UNWTO). Currently around 60 countries have a fully developed System of Tourism Statistics that allows to construct a Tourism Satellite Account (TSA) and obtain economic aggregates like tourism GDP. All countries have at least a basic system of Tourism Statistics that allows to gather information about physical flows and monetary aggregates like tourism expenditures.
ICAO proposes that its ['Connectivity Opportunities Utilisation Indicator'] and the current proposed indicators be merged into one indicator. More than half of the tourists arrive by air, increasing connectivity is therefore the key catalyst in promoting sustainable tourism and economic development. The merged indicator specifically measures the efficacy of policy making at the State level aimed at maximizing air connectivity and tourism opportunities. With the merged indicator, States can monitor and benchmark the pace of their policy implementation to increase air connectivity and tourism along with tourism's contribution to GDP. The gap between connectivity opportunity available and unutilized can be monitored at the State level as a function of the opportunity available to the State to increase its GDP. It is expected that this will accelerate the pace of implementation of policies leading to increasing of air connectivity and sustainable tourism and economic development. The merged indicator monitors critical policy implementation and thus is better suited to monitoring Target 8.9.
ICAO Data needed for this proposed indicator is collected by ICAO as part of its Core Statistics Program (see above). For tourisms contribution to GDP, Data is collected by UNWTO. Metadata on tourism statistics is available with UNWTO. ICAO and UNWTO collaborate actively in sharing and analysis of each others data.
ICAO is responsible for global monitoring of the 'Connectivity Opportunities Utilisation Indicator'. Data is available for all ICAO Member States. UNWTO is responsible for global monitoring of indicators related to tourism contribution to GDP.
Economic aggregates indicator: [tourism direct GDP (as % of total GDP and in growth rate) and number of jobs in tourism industries (as % total jobs and growth rate of jobs, by gender)]
existing data sources: National Statistical Offices and National Tourism Administrations. Not all countries have GDP figures for tourism, therefore value added could be used instead. The same applies for employment: not all countries count the number of jobs, some will have only the number of employees (or the full-time equivalents) which is a good substitute.
World Tourism Organisation (UNWTO). Currently around 60 countries have a fully developed System of Tourism Statistics that allows to construct a Tourism Satellite Account (TSA) and obtain economic aggregates like tourism GDP. All countries have at least a basic system of Tourism Statistics that allows to gather information about physical flows and monetary aggregates like tourism expenditures.
Likewise, indicator not very feasible. (For ‘tourism’ there is a challenge in attributing the extent of use of several services by tourists vs non-tourists; it would be a measure of particular sub-service sectors regardless of users).
Alternative: [Number of jobs in the sustainable tourism sector / total number of green and decent jobs x countries ]
Replace the indicator \tourism consumption" by [Environmental pressure indicator: residual flows and natural inputs (absolute figures and % change rates) derived from a System of Environmental-Economic Accounting (SEEA) for Tourism "]
to be developed data sources: National Statistical Offices in collaboration with National Tourism Administrations
Only a handful of countries experimented with environmental-economic account for tourism in the past years. This is an area where the World Tourism Organisation (UNWTO) has already initiated work to identify SDG specific indicators for tourism.
[these two indicators may have difficulties in measurement. Jobs created would also depend on definition of 'tourism' sectors/companies. May be more realistic to use more accessible indicators such as ["Tourist arrivals".]

List of Indicator Proposals - p. 182 of 265
List of Proposals* Note on Disaggregation: All indicators should be disaggregated by sex, age, residence (U/R) and other characteristics, as relevant and possible.Target 8.10 Strengthen the capacity of domestic financial institutions to encourage and expand access to banking, insurance and financial services for all
ContributorName Specification Source Entity Tier Priority InterlinkagesSuggested Indicator Number of commercial bank branches and ATMs per 100,000 adults IMF Financial Access Survey/189 countries Tier I
Suggested Indicator Tier I 1.4, 2.3, 5.a, 8.10
Indicator 8.10.1 Getting Credit: Distance to Frontier (CBB)WB 3
UPU 1
Indicator 8.10.2 Number of commercial bank branches and ATMs per 100,000 adults (AAA) UNCDF Same Indicator IMF Financial Access Survey IMF - Data is available for 189 countries 1
% adults with a formal account or personally using a mobile money service in the past 12 months". Possible to have a break down by income e.g. bottom 40% of income share or <$1.25/day, by gender, age (youth) and rural. Adults: ages 15+
World Bank Global Findex (individual survey - added module to Gallup World Poll)
World Bank. Data availability: ~ 145 countries. Triennial. Available for 2011 and 2014.
In addition to the 2 indicators, 8.10.1 and 8.10.2, we propose 8.10.3: Access to financial services: ["% adults with a formal account or personally using a mobile money service in the past 12 months". Possible to have a break down by income e.g. bottom 40% of income share or <$1.25/day, by gender, age (youth) and rural. Adults: ages 15+]. Formal account: account at a bank or at another type of financial institution, such as a credit union, microfinance institution, cooperative, or the post office (if applicable), or a debit card; including an account at a financial institution for the purposes of receiving wages, government transfers, or payments for agricultural products, paying utility bills or school fees or a card for the purposes of receiving wages or government transfers. Account/card ownership within the past 12 months. Mobile money account includes GSM Association (GSMA) Mobile Money for the Unbanked (MMU) services in the past 12 months to pay bills or to send or receive money along with receiving wages, government transfers, or payments for agricultural products through a mobile phone in the past 12 months. For indicator 8.10.1 see http://www.doingbusiness.org. For indicator 8.10.2 see http://fas.imf.org.
For 8.10.1 World Bank Doing Business. For 8.10.2 IMF Financial Access Survey (survey of financial regulators). 8.10.3 World Bank Global Findex (individual survey - added module to Gallup World Poll)
For 8.10.1 World Bank. Data availability: ~ 180 countries. Available annually starting 2010. For 8.10.2 IMF. Data availability: ~180 countries. Available annually starting 2004. For 8.10.3 World Bank. Data availability: ~ 145 countries. Triennial. Available for 2011 and 2014.
Proposed indicator in cell D196 can also be used for 1.4,
2.3, 5.a, 8.10
The UPU supports the World Bank proposition to add an additional indicator to the 2 indicators, 8.10.1 and 8.10.2, namely: Indicator 8.10.3 measuring access to financial services defined as "[% adults with a formal account or personally using a mobile money service in the past 12 months". Possible to have a break down by income e.g. bottom 40% of income share or <$1.25/day, by gender, age (youth) and rural. Adults: ages 15+]. Formal account: account at a bank or at another type of financial institution, such as a credit union, microfinance institution, cooperative, or the post office (if applicable), or a debit card; including an account at a financial institution for the purposes of receiving wages, government transfers, or payments for agricultural products, paying utility bills or school fees or a card for the purposes of receiving wages or government transfers. Account/card ownership within the past 12 months. Mobile money account includes GSM Association (GSMA) Mobile Money for the Unbanked (MMU) services in the past 12 months to pay bills or to send or receive money along with receiving wages, government transfers, or payments for agricultural products through a mobile phone in the past 12 months. For indicator 8.10.1 see http://www.doingbusiness.org. For indicator 8.10.2 see http://fas.imf.org.
UPU existing data. For 8.10.1 World Bank Doing Business. For 8.10.2 IMF Financial Access Survey (survey of financial regulators). 8.10.3 World Bank Global Findex (individual survey - added module to Gallup World Poll)
On postal accounts and payment services: Universal Postal Union. Data availability: ~ 130 countries. Annual. Available since 1899 (19th century) up to 2014 (21st century).
Proposed indicator in cell D196 (D196 of the original
Excel file, D23 here) can also be used for 1.4, 2.3, 5.a, 8.10

List of Indicator Proposals - p. 183 of 265
List of Proposals* Note on Disaggregation: All indicators should be disaggregated by sex, age, residence (U/R) and other characteristics, as relevant and possible.
Contributor Name Specification Source Entity Tier Priority InterlinkagesSuggested Indicator Aid for Trade Commitments and Disbursements ( CBB ) OECD/WTO WTO/OECD Tier IIIndicator 8.a.1 Evolution in Aid for Trade Commitments and Disbursements ( CBB )
ESCAP OECD/WTO WTO
Target 8.b By 2020, develop and operationalize a global strategy for youth employment and implement the Global Jobs Pact of the International Labour Organization
Contributor Name Specification Source Entity Tier Priority InterlinkagesSuggested Indicator Tier I
Indicator 8.b.1 Total government spending in social protection and employment programmes as percentage of the national budgets and GDP ( AAA ) ILO
WB
Target 8.a Increase Aid for Trade support for developing countries, in particular least developed countries, including through the Enhanced Integrated Framework for Trade-Related Technical Assistance to Least Developed Countries
New - [Enhanced AfT support - In 5 years the amount of AfT should be doubled].
Total government spending in social protection and employment programmes as percentage of the national budgets and GDP and collective bargaining rates
Household surveys (LFS, HIES, LSMS, Integrated HH surveys, etc.), Official estimates, Establishment surveys, Administrative records.
Responsible entity: ILO. Availability: Collective bargaining rates available for 84 countries.
Alternative indicator: [Total government spending in social protection and employment programmes as percentage of the national budgets and GDP and collective bargaining rates]. Justification: the Global Jobs Pact called for sound social dialogue and therefore collective bargaining rates and coverage should be reported and combined to administrative data on government expenditure.
Household surveys (LFS, HIES, LSMS, Integrated HH surveys, etc.), Official estimates, Establishment surveys, Administrative records.
Responsible entity: ILO. Availability: Collective bargaining rates available for 84 countries.
[Total government spending in employment programmes as percentage of the national budgets and GDP]

List of Indicator Proposals - p. 184 of 265
List of Proposals* Note on Disaggregation: All indicators should be disaggregated by sex, age, residence (U/R) and other characteristics, as relevant and possible.Goal 9 Build resilient infrastructure, promote inclusive and sustainable industrialization and foster innovation
Contributor Name Specification Source Entity Tier Priority InterlinkagesSuggested Indicator Share of the rural population who live within 2km of an all season road Tier II 2.3, 11.2
Suggested Indicator Passenger and freight volumes Tier II 2.3, 11.2
Indicator 9.1.1 Percentage share of people employed in business infrastructure (consultancy, accounting, IT and other business services) in total employment ( BBB ) ICAO 1
ILO The ILO does not compile the numerator of the share. ITU 1.4, 9.c, 11.1
UNEP 2 UNIDO 1 1.4, 9.c, 11.1
UNISDR National Disaster Loss Databases, 85 (will be more than 115 by 2016) UNISDR 1 1.5,11.5,4.a, 13.1, 14.2, 15.3
UNWOMEN UN Women calls for disaggregation by sex UPU UPU existing data; World Bank LPI 1
WB Surveys 2
Target 9.1 Develop quality, reliable, sustainable and resilient infrastructure, including regional and transborder infrastructure, to support economic development and human well-being, with a focus on affordable and equitable access for all
For Rural access, while historic data based on household surveys exists for many countries, current efforts are underway by the World Bank, DFID, and others to develop a new methodology using GIS data.
Methodology and initial test country data to be completed by June, data to be available for 7 pilot countries by Dec 2015, with dramatic expansion planned in 2016.
For Passenger and Freight volumes, data available from World Bank World Development Indicators.
World Bank, Passenger and freight data available from World Development Indicators, Baseline data exists for [80] countries, with the new methodology to be applied in an expanding set of countries.
ICAO proposes that its indicator "Percentage of effective implementation in the infrastructure development of aerodromes and ground aids" replaces the current indicator 9.1.1. The intent of the target is to have infrastructures of good quality which are resilient and sustainable. Aerodromes are key infrastructures for a State, related to tourism and economic development. The ICAO indicator measures directly the quality and reliability factors of a representative infrastructure, whereas the current indicator focuses on people employed in that sector which is unrelated to quality or sustainability of those infrastructures. The ICAO indicator is a percentage which can be targeted, whereas targeting the employment percentage share is difficult."
ICAO has been collecting and validating data for Effective Implementation Monitoring since 2005. The data source and methodology used are fully mature with data available for 98 percent of all UN Member States. See the metadata provided with the indicator for further information.
ICAO is responsible for global monitoring of the level of implementation of aerodrome and ground aids. Data is available for all ICAO Member States.
Target 8.9.1 as aerodromes are a driver for tourism
Proposed alternative indicator: [Proportion of households with broadband Internet access, by urban/rural]
Data on this indicator are produced by NSOs, through household surveys. Some countries conduct a household survey where the question on households with broadband Internet access is included every year. For others, the frequency is every two or three years. Overall, the indicator is available for 53 countries at least from one survey in the years 2011-2014. Survey data for the proportion of households with Internet access (not broken down by narrowband/broadband) is available for 101 countries and ITU estimates data for this indicator for almost all other countries.
ITU collects data for this indicator from NSOs annually. Overall, the indicator is available for 53 countries at least from one survey in the years 2011-2014. Survey data for the proportion of households with Internet access (not broken down by narrowband/broadband) are available for 101 countries and ITU estimates data for this indicator for almost all other countries.
Proposed new indicator [Proportion of households with broadband internet access, by urban, rural ]
Annual surveys by NSOs. Data are available in ITU for more than 170 countries (see technical notes ITU)
ITU For international monitoring data available in ITU for more than 170 countries
UNISR proposes \[Number of health and educational facilities affected, length of road affected by disasters]". Please see UNISDR input paper attached."
This indicator should be given up and replaced by an overall indicator on the quality of logistics service in the era of e-commerce. In that regard, the UPU would welcome the introduction of [World Bank's Logistics Performance Index (LPI) complemented by a postal and express quality of service indicator: average parcel shipping time/parcel shipping time standards, by country, both for domestic and international service, and by product (UNSD Comtrade HS classification for international trade) and for each bilateral flow for any country-pair.]
UPU - big data available for most countries, both on an annual and real-time basis (trough consolidated tracking systems data and quality of service measurement systems) with real-time data potentially back to 1999 with progressive coverage of almost all countries by 2012 and onwards. World Bank - Data available for most countries
New Indicator Suggested: [Logistics Performance Index ] World Bank - Data available for most countries

List of Indicator Proposals - p. 185 of 265
List of Proposals* Note on Disaggregation: All indicators should be disaggregated by sex, age, residence (U/R) and other characteristics, as relevant and possible.Indicator 9.1.2 Transport by air, road and rail (millions of passengers and ton-km and % population with access to all season road) ( BAA )
ICAO
UNEP (sources will be identified) 1
UNIDO Administrative data from national sources 2 2.3
UNISDR UNISDR 2 1.5,11.5,4.a, 13.1, 14.2, 15.3
UPU UPU existing data 1
WB 1 2.3, 11.2
ICAO supports this indicator as a complement to the ICAO indicator proposed under 9.1.1. Actual usage rates of transport infrastructure are a measure of the effectiveness of those infrastructures. This indicator ties in best with a quality related indicator as the one ICAO proposes as a replacement of 9.1.1. Usage rates alone do not indicate if an infrastructure is of high quality or is sustainable, unless they are seen in conjunction with a quality related standard like the one proposed by ICAO.
Alternative: [Kilometres of walking and cycling facilities, and person- kilometres of mass transit systems]
There is a need to switch to more sustainable modes of transport - i.e. walking/ cycling and public transport. The target is about sustainable infrastructure . The currently proposed indicator does not measure that.
Alternative indicator would also be relevant for 11.2
Proposed new indicator [Percentage of paved road in total] World Bank/UNIDO (data not available for international reporting)
UNISR proposes "[Number of countries with critical infrastructure plan"]. Please see UNISDR input paper attached.
SFDRR Monitor (to be developed), 0 (but HFA Monitor covered 133 countries in 2013)
The postal and express tonnage related to the development of e-commerce (both at the domestic and international levels, by product (HS classification), and by country-pair) could be provided by the Universal Postal Union to complement this indicator.
UPU - big data available for most countries, both on an annual and real-time basis (trough consolidated tracking systems data) with real-time data potentially back to 1999 for international tonnage and with a progressive coverage of all countries by 2012 and onwards. World Bank - Data available for most countries
This is merging two separate indicators sets, passenger and freight volumes, and proportion of population living within two kilometres of an all season road. For access to all season road, the specific indicator should read "[Share of the rural population who live within 2km of an all season road]"
For Passenger and Freight volumes, data available from World Bank World Development Indicators. For Rural access, while historic data based on household surveys exists for many countries, current efforts are underway by the World Bank, DFID, and others to develop a new methodology using GIS data.
World Bank, Passenger and freight data available from World Development Indicators, Baseline data exists for [80] countries, with the new methodology to be applied in an expanding set of countries. Methodology and initial test country data to be completed by June, data to be available for 7 pilot countries by Dec 2015, with dramatic expansion planned in 2016.

List of Indicator Proposals - p. 186 of 265
List of Proposals* Note on Disaggregation: All indicators should be disaggregated by sex, age, residence (U/R) and other characteristics, as relevant and possible.
Contributor Name Specification Source Entity Tier Priority InterlinkagesSuggested Indicator Manufacturing Value Added ( share in GDP, per capita, % growth) Tier I
Suggested Indicator Manufacturing employment, in percent to total employment Industrial surveys (NSOs) and UNIDO Gender disaggregated data available Tier I 8.5.1
Indicator 9.2.1 MVA ( share in GDP, per capita, % growth) ( AAB ) UNIDO NSOs and UNIDO MVA database 1
Eurostat available from Eurostat, assuming MVA means manufacturing value added 1
WB
Indicator 9.2.2 Manufacturing employment (share of total employment and % growth ( AAA ) ILO
UNIDO Industrial surveys (NSOs) and UNIDO Gender disaggregated data available 2 8.5.1
Target 9.3 Increase the access of small-scale industrial and other enterprises, in particular in developing countries, to financial services, including affordable credit, and their integration into value chains and markets
Contributor Name Specification Source Entity Tier Priority InterlinkagesSuggested Indicator Tier I/II
Indicator 9.3.1 Percentage share of (M) small scale industries' value added in total industry value added ( BAA ) UNIDO Industrial surveys (NSO) and UNIDO 1 2.3
Indicator 9.3.2 % of (M)SMEs with a loan or line of credit ( BBB ) UNCDF Same Indicator Enterprise Surveys 2 Target 8.3.2
UNIDO Central Bank data 2 1.4
WB World Bank Enterprise Surveys 2
Target 9.2 Promote inclusive and sustainable industrialization and, by 2030, significantly raise industry's share of employment and gross domestic product, in line with national circumstances, and double its share in least developed countries
MVA data are available in a large number of countries. Currently UNIDO maintains the World MVA database which contains data for about 200 economies. Data are presented at constant and current prices. Data can be presented for country groups (LDCs, LLDC) and the world regions.
UNIDO Data are available in UNIDO for more than 200 economies
UNIDO Data are available in UNIDO for more than 180 countries
"[[Manufacturing value added, per capita, in percent to GDP and growth rates] *** Manufacturing value added is the key indicator for measuring industrialization of an economy. The description of data sources and compilation method is given on technical notes. No replacement of this indicator is proposed.
UNIDO Data are available in UNIDO for more than 200 economies
The concept of “sustainability” in industrialization is not really reflected by the indicators. What does “sustainable industrialization” actually mean? Or is this only about economic sustainability, discounting the two other pillars, social and environmental?
Alternative indicator: [Share of industry (identifying manufacturing) in total employment]. Justification: The target is to increase industry's share of employment, of which manufacturing is a subset. Moreover, data for industry as a whole is more widely available than for the manufacturing sector, improving the robustness of regional and global estimates that could be produced. However, the manufacturing part should be identified.
Household surveys (LFS, HIES, LSMS, Integrated HH surveys, etc.), Official estimates, Establishment surveys.
Responsible entity: ILO with UNIDO inputs. Availability: 175 countries for industry's share of employment; more limited coverage for annual growth rates which would require consecutive annual data points.
"[Manufacturing employment, in percent to total employment]" *** This indicator measures the job creation in manufacturing compared to the whole economy. It has high rating from the member states. Specifications are provided in technical notes
UNIDO Data are available in UNIDO for more than 180 countries
Percentage share of (M) small scale industries' value added in total industry value added
Refers to valued added of small industries in relation to total value added (See UNIDO technical notes)
Industrial surveys (NSO) and UNIDO/ UNIDO
"[Share of small scale industries in total industry value added]" *** Refers to valued added of small industries in relation to total value added (See UNIDO technical notes)
UNIDO (Data for international reporting are partially available)
World Bank - Data is available for 135 countries
Proposed to reformulate as - [Percentage of small scale industry receiving loan or other financial services] (see UNIDO notes)
UNIDO (data not available for international reporting)
World Bank. Data availability: ~135 developing economies, every 3-4 years, starting in 2006
8.3 and 9.3. Can potentially be used for 5.a if broken down by \ownership by
gender"."

List of Indicator Proposals - p. 187 of 265
List of Proposals* Note on Disaggregation: All indicators should be disaggregated by sex, age, residence (U/R) and other characteristics, as relevant and possible.
Contributor Name Specification Source Entity Tier Priority InterlinkagesSuggested Indicator Carbon emission per unit of value added Industrial surveys (NSO) / UNIDO database and estimates of emission Tier I 8.5.1
Indicator 9.4.1 Intensity of material use per unit of value added (international dollars) ( CBB ) UNIDO Priority of this indicator is changed (see UNIDO technical notes) Industrial surveys (NSO) ; UNIDO 2 8.4.1 and 8.4.2
UNSD 9.4, 12.1, 12.2
Indicator 9.4.2 Energy intensity per unit of value added (international dollars) ( BBB ) UNIDO Industrial surveys (NSO) / UNIDO database and estimates of emission 1 8.5.1
Contributor Name Specification Source Entity Tier Priority InterlinkagesSuggested Indicator Research and development surveys (NSO, Line ministries) Tier I 2a, 3b, 12a, 14a, 17.6, 17.7
Indicator 9.5.1 Research and development expenditure and employment ( BAA ) UNIDO Research and development surveys (NSO, Line ministries) 2
UNWOMEN
Target 9.4 By 2030, upgrade infrastructure and retrofit industries to make them sustainable, with increased resource-use efficiency and greater adoption of clean and environmentally sound technologies and industrial processes, with all countries taking action in accordance with their respective capabilities
UNIDO Data available for more than 150 countries for international reporting
UNIDO Data are partially available for international reporting
Resource productivity. Resource productivity is gross domestic product (GDP) divided by domestic material consumption (DMC). DMC measures the total amount of materials directly used by an economy. It is defined as the annual quantity of raw materials extracted from the domestic territory of the focal economy, plus all physical imports minus all physical exports.
- Statistical surveys and administrative data on material use and value added collected from the national statistics office
- UNEP/International resources panel is responsible for policy application of data but not on the data collection and dissemination per se. - UNIDO: Data are partially available for international reporting- The System of Environmental Economic Accounts provides a standard methodology for calculating this indicator. However, no international data collection mechanism is yet in place and countries are still in implementation phase.
This indicator is replaced by [Carbon emission per unit of value added] (see UNIDO technical notes)
UNIDO Data available for more than 150 countries for international reporting
Target 9.5 Enhance scientific research, upgrade the technological capabilities of industrial sectors in all countries, in particular developing countries, including, by 2030, encouraging innovation and substantially increasing the number of research and development workers per 1 million people and public and private research and development spending
R&D expenditure as percentage of GDP
UNESCO-UIS Data available for about 135 countries for international reporting
This indicator combines expenditure and employment. It is proposed to replace by a single indicator - [the number of researchers per million inhabitants.]
UNESCO - UIS Data available for more than 140 countries for international reporting
2a, 3b, 5.5, 12a, 14a, 17.6, 17.7
UN Women calls for the indicator on employment in research and development to be disaggregated by sex.
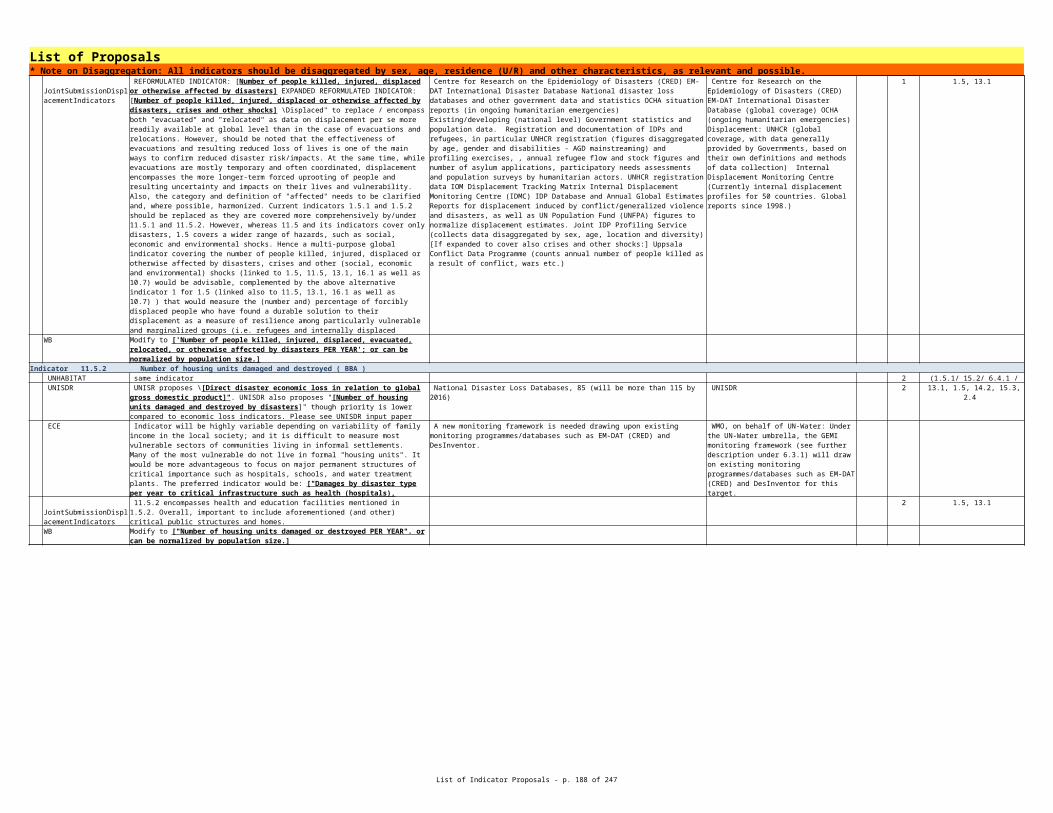
List of Indicator Proposals - p. 188 of 265
List of Proposals* Note on Disaggregation: All indicators should be disaggregated by sex, age, residence (U/R) and other characteristics, as relevant and possible.
UNESCO UNESCO-UIS 1 [(a) Research and development expenditure: R&D expenditure as a % of GDP] ** Disaggregations: field of science (relevant for targets 2a, 3b, 12a, 14a, 17.6 and 17.7) *** (b) [Research and development employment: Researchers per million inhabitants (in head counts)] Disaggregations: field of science (relevant for targets 2a, 3b, 12a, 14a, 17.6 and 17.7) and sex (relevant for target 5.5)
R&D surveys (NSOs and line ministries) *** (a) Research and development expenditure: Data available for 134 countries; (b) Research and development employment: Data available for 142 countries
(a) R&D expenditure: 2a, 3b, 12a, 14a, 17.6, 17.7 Overall
R&D data provide a reference for specific areas of R&D,
such as health, agriculture, etc. Also, data by field of
science provide more targeted data. *** (b) R&D
employment: 2a, 3b, 5.5, 12a, 14a, 17.6, 17.7 Overall R&D data provide a reference for
specific areas of R&D, such as health, agriculture, etc. Also,
data by field of science provide more targeted data. Data by sex (for researchers)
could contribute to Target 5.5
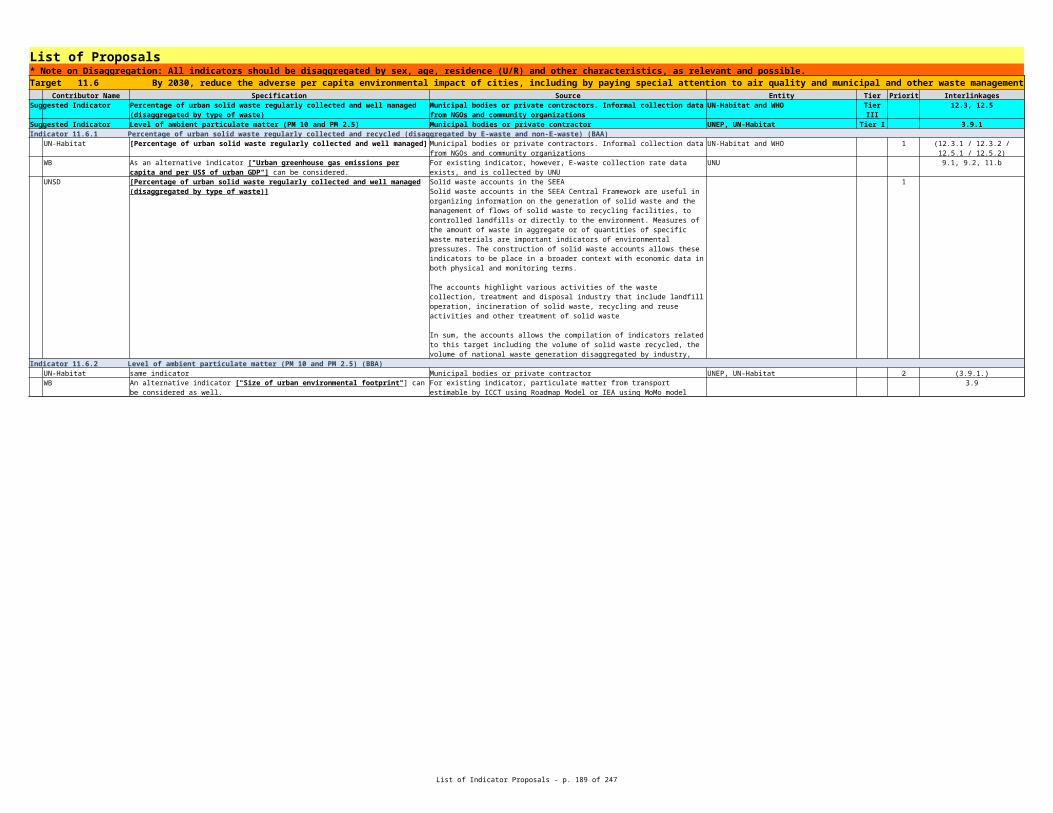
List of Indicator Proposals - p. 189 of 265
List of Proposals* Note on Disaggregation: All indicators should be disaggregated by sex, age, residence (U/R) and other characteristics, as relevant and possible.Indicator 9.5.2 Percentage share of medium and high-tech industry value added in total value added ( BBB )
UNESCO 3 UNIDO *** Move to Means of Implementation *** UNIDO Research and development surveys (NSO, Line ministries) 1 2a, 3b, 12a, 14a, 17.6, 17.7
Contributor Name Specification Source Entity Tier Priority InterlinkagesSuggested Indicator Amount of investments in infrastructure as a % of GDP Central Bank data Tier II
Indicator 9.a.1 Annual credit flow to infrastructure projects (in International Dollar) ( BBB ) UNIDO Central Bank data 1
WB indicator does not reflect the sustainability concept expressed in target 9.a.Indicator 9.a.2 Percentage share of infrastructure loans in total loans ( BBB )
UNIDO Central Bank data 2
WB indicator does not reflect the sustainability concept expressed in target 9.a.
Contributor Name Specification Source Entity Tier Priority InterlinkagesSuggested Indicator Industrial surveys (NSO), UNIDO Tier I
Indicator 9.b.1 Aggregate value of all support mechanisms for technology and innovation (in International Dollar, % of GDP) ( CBB ) UNIDO Industrial surveys (NSO), UNIDO 1
Indicator 9.b.2 Aggregate value of expenditure on diversification and value addition policy related instruments and mechanisms (in International Dollar; % of GDP) ( CBB ) UNIDO Industrial surveys (NSO), UNIDO 2 8.2.2
New indicator proposed: [R&D expenditure as percentage of GDP] - Earlier indicator (Percentage share of medium and high-tech (MHT)) is moved to means of implementation
UNESCO-UIS Data available for about 135 countries for international reporting
Target 9.a Facilitate sustainable and resilient infrastructure development in developing countries through enhanced financial, technological and technical support to African countries, least developed countries, landlocked developing countries and small island developing States
Data not available for international reporting
Reformulate as "[Amount of investment in infrastructure]" Data not available for international reporting
Reformulated as [Annual credit flow to infrastructure projects] Data not available for international reporting
Target 9.b Support domestic technology development, research and innovation in developing countries, including by ensuring a conducive policy environment for, inter alia, industrial diversification and value addition to commodities
Percentage share of medium and high-tech (MHT) industry value added in total value added
UNIDO Data available for more than 150 countries for international reporting
New indicator proposed due to low rating of existing indicator - [Percentage share of medium and high-tech (MHT) industry value added in total value added] - See UNIDO notes
UNIDO Data available for more than 150 countries for international reporting
New indicator proposed due to low rating and limited data availability -[Coefficient of industrial diversification.] Methodology is described in UNIDO notes
UNIDO Data available for more than 150 countries for international reporting

List of Indicator Proposals - p. 190 of 265
List of Proposals* Note on Disaggregation: All indicators should be disaggregated by sex, age, residence (U/R) and other characteristics, as relevant and possible.Target 9.c Significantly increase access to information and communications technology and strive to provide universal and affordable access to the Internet in least developed countries by 2020
Contributor Name Specification Source Entity Tier Priority InterlinkagesSuggested Indicator Percentage of the population covered by a mobile network, by technology Tier I 1.4, 2.3, 2.c, 9.1, 11.b, 13.1,
Indicator 9.c.1 Fixed and Mobile broadband quality measured by mean download speed ( BBA ) ITU 9.1
UNIDO Survey Data from National ICT authorities, ITU 9.1
UPU 2 WB [ Fixed broadband subscriptions broken down by speed ] Existing collected by ITU ITU 2 8.1, 17.6
Indicator 9.c.2 Subscription to mobile cellular and/or fixed broad band internet (per household/100 people) ( AAA ) ITU 1.4, 2.3, 2.c, 9.1, 11.b, 13.1,
UNIDO Survey Data from National ICT authorities, ITU 1.4, 2.3, 2.c, 9.1, 11.b, 13.1,
UPU UPU existing data; UNCTAD measurement of the information society 1
WB Existing collected by ITU ITU 1
Data are produced by national regulatory telecom authorities or Information and Communication Technology Ministries, who collect the data from Internet service providers. By 2014, data on 2G mobile population coverage were available for about 144 countries, from developed and developing regions, and covering all key global regions. Data on 3G mobile population coverage were available for 135 countries.
ITU collects data annually. By 2014, data on 2G mobile population coverage were available for about 144 countries, from developed and developing regions, and covering all key global regions. Data on 3G mobile population coverage were available for 135 countries.
Official data on the current indicator do not exist. Proposed alternative indicator to monitor affordability of Internet access: [Broadband Internet prices]
Data are compiled by national regulatory telecom authorities or Information and Communication Technology Ministries, who collect the data from operators/Internet service providers. For countries that do not respond to the questionnaire, ITU collects data on the broadband Internet prices directly from operators/Internet service providers' websites. By 2014, data were available for 160 economies, from developed and developing regions, and covering all key global regions.
ITU collects data for this indicator annually. By 2014, data were available for 160 economies, from developed and developing regions, and covering all key global regions.
Proposed new indicator [Broadband Internet prices]. It refers to the price of a monthly subscription to an entry-level (fixed or mobile) broadband plan, based on the offer by the operator with the largest market share in the country
ITU Data available for more than 145 countries for international reporting
The current indicator is already proposed for Target 9.1. Proposed alternative indicator, which is particularly relevant for LDCs: [Percentage of the population covered by a mobile network, broken down by technology]
Data are produced by national regulatory telecom authorities or Information and Communication Technology Ministries, who collect the data from Internet service providers. By 2014, data on 2G mobile population coverage were available for about 144 countries, from developed and developing regions, and covering all key global regions. Data on 3G mobile population coverage were available for 135 countries.
ITU collects data annually. By 2014, data on 2G mobile population coverage were available for about 144 countries, from developed and developing regions, and covering all key global regions. Data on 3G mobile population coverage were available for 135 countries.
Proposed new indicator - [Percentage of the population covered by a mobile broadband network, broken down by technology (see ITU notes)] ** Percentage of the population covered by a mobile broadband network, broken down by technology
ITU Data available for more than 145 countries for international reporting
The UPU proposes to add a third indicator for target 9.c, namely indicator 9.c.3 related to e-commerce development: [e-commerce as a share of total GDP and/or total international trade.]
UPU - big data available for most countries on a real-time basis (trough consolidated tracking systems data) with real-time data potentially back to 1999 for international tonnage, volumes and with a progressive coverage of all countries by 2012 and onwards. Generalization of the capture of the value of goods (e-commerce related customs declarations) from 2016-17 onwards.
1.4, 5.b, 9.1, 10.3, 11.1, 16.7, 17.6, 17.8

List of Indicator Proposals - p. 191 of 265
List of Proposals* Note on Disaggregation: All indicators should be disaggregated by sex, age, residence (U/R) and other characteristics, as relevant and possible.Goal 10 Reduce inequality within and among countries Target 10.1 By 2030, progressively achieve and sustain income growth of the bottom 40 per cent of the population at a rate higher than the national average
Contributor Name Specification Source Entity Tier Priority InterlinkagesSuggested Indicator Household Surveys World Bank Tier I
Indicator 10.1.1 Measure income inequality using the Gini coefficient or Palma ratio, pre- and post-social transfers/tax, at global, regional and national level disaggregated by groups as defined above ( AAA ) OHCHR Household survey 1 10.2, 10.3
WB This indicator does not directly measure the target but Indicator 10.1.2 does. Household Surveys Indicator 10.1.2 Change in real disposable income and consumption by quintiles over time, at global, regional and national level. ( BAA )
WB Household Surveys World Bank 1
Target 10.2 By 2030, empower and promote the social, economic and political inclusion of all, irrespective of age, sex, disability, race, ethnicity, origin, religion or economic or other status Contributor Name Specification Source Entity Tier Priority Interlinkages
Suggested Indicator National income and expenditure surveys. Tier I 1.2
UNCDF Global Findex 2 Targets 1.4 , 2.3 , 5.a, 8.10
Indicator 10.2.2 Proportion of people living below 50% of median income ( AAA ) UNICEF National income and expenditure surveys. 1 1.2
UNWOMEN
Target 10.3 Ensure equal opportunity and reduce inequalities of outcome, including by eliminating discriminatory laws, policies and practices and promoting appropriate legislation, policies and action in this regard
Contributor Name Specification Source Entity Tier Priority InterlinkagesSuggested Indicator Survey Tier II 10.2, 10.3, 16.3, 16b
Indicator 10.3.1 Percentage of population reporting perceived existence of discrimination based on all grounds of discrimination prohibited by international human rights law ( CBB ) OHCHR Survey 1 10.2, 10.3, 16.3, 16b
GlobalMigrationWG NB! Disaggregate by migratory status Indicator 10.3.2 Existence of an independent body responsible for promoting and protecting the right to non-discrimination ( BBB )
OHCHR 2 10.3, 16a, 16b
Growth rates of household expenditure or income per capita among the bottom 40 percent of the population and the total population
is partly overlapping with 1.2
[Income inequality pre- and post-social transfers/tax at national, regional and global levels]
World Bank currently collects relevant data at global level, but at a lower level of disaggregation than required by this indicator.
To make the indicator fully consistent with the target we suggest modifying indicator description to \[Growth rates of household expenditure or income per capita among the bottom 40 percent of the population and the total population]." The part on 'global' and 'regional' should be taken out due to concerns about aggregation. "
Proportion of people living below 50% of median income disaggregated by age and sex
UNDESA. OECD.
Widely available for OECD and EU countries.
Indicator 10.2.1 Measure the progressive reduction of inequality gaps over time, disaggregated by groups as defined above, for selected social, economic, political and environmental SDG targets (at least one target per goal where relevant should be monitored using this approach) ( BBB ) Propose a Multi-Purpose Indicator: [Adults owning an account either through a
financial institution or mobile money provider, disaggregated by income level, geography location gender, age and education ]
World Bank - Data is available for 142 countries
[Amended to disaggregate for age and gender] [Proportion of people living below 50% of median income disaggregated by age and gender]. This would enable capturing children living in relative poverty including in higher income countries.
UNDESA. OECD. Widely available for OECD and EU countries.
UN Women calls for this indicator to be disaggregated by sex and other context specific characteristics.
Percentage of population reporting having personally felt discriminated against or harassed within the last 12 months on the basis of a ground of discrimination prohibited under international human rights law
Data available at regional level, e.g. EU Fundamental Rights Agency collects for all 28 EU Member States. No current global collector.
[Percentage of population reporting having personally felt discriminated against or harassed within the last 12 months on the basis of a ground of discrimination prohibited under international human rights law]
Data available at regional level, e.g. EU Fundamental Rights Agency collects for all 28 EU Member States. No current global collector.
[Existence of independent National Human Rights Institution in compliance with the Paris Principles ]
OHCHR, International Coordinating Committee of National Human Rights Institutions
OHCHR, International Coordinating Committee of National Human Rights Institutions
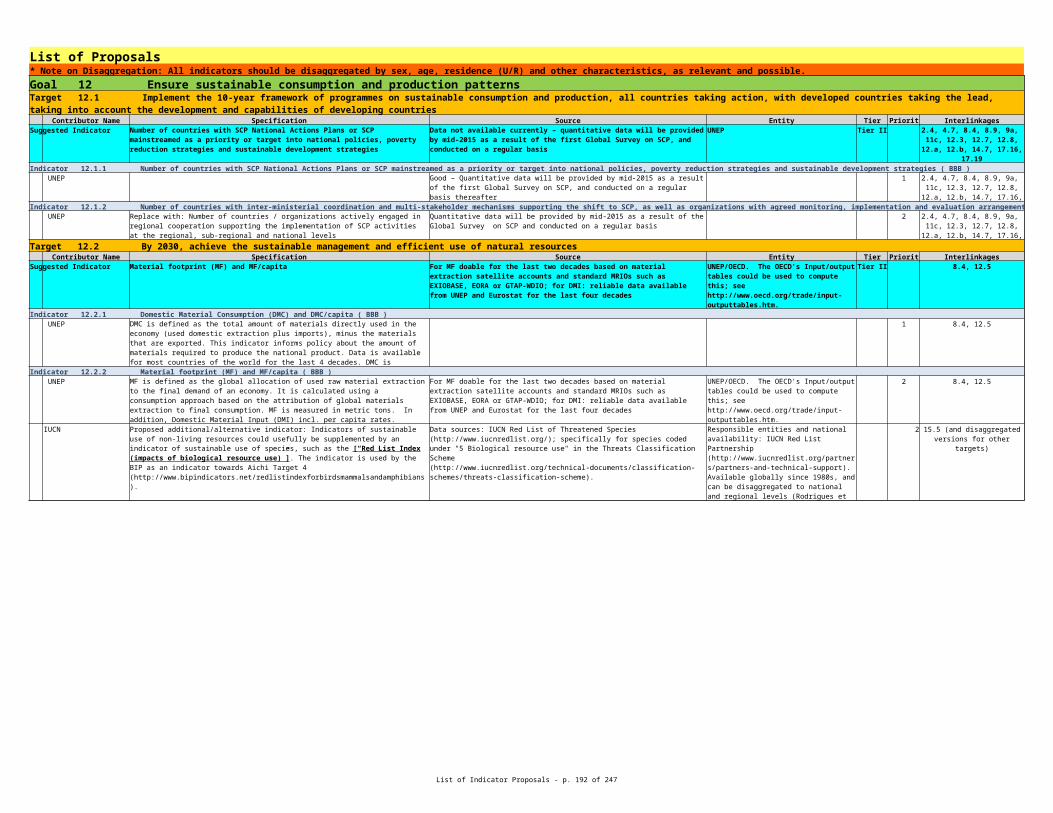
List of Indicator Proposals - p. 192 of 265
List of Proposals* Note on Disaggregation: All indicators should be disaggregated by sex, age, residence (U/R) and other characteristics, as relevant and possible.Target 10.4 Adopt policies, especially fiscal, wage and social protection policies, and progressively achieve greater equality
Contributor Name Specification Source Entity Tier Priority InterlinkagesSuggested Indicator SNA, IMF Government Finance Statistics, ILO Tier I 8.b.1
ILO SNA, IMF Government Finance Statistics, ILO 1 8.b.1
WB
GlobalMigrationWG NB! Disaggregate by migratory status Indicator 10.4.2 Progressivity of tax and social expenditures e.g. Proportion of tax contributions from bottom 40%, Proportion of social spending going to bottom 40% ( CBB )
ILO SNA, IMF Government Finance Statistics, ILO 2
WB
Target 10.5 Improve the regulation and monitoring of global financial markets and institutions and strengthen the implementation of such regulations Contributor Name Specification Source Entity Tier Priority Interlinkages
Suggested Indicator Tier III
Indicator 10.5.1 Adoption of a financial transaction tax (Tobin tax) at a world level ( CBB ) WB
Labour share of GDP, comprising wages and social protection transfers.
Responsible entities: IMF, ILO. Availability: 200 countries.
Indicator 10.4.1 % of people covered by minimum social protection floor, that include basic education and health packages, by age, sex, economic status, origin, place of residence, disability, and civil status (widows, partners in union outside of marriage, divorced spouses, orphan children) and other characteristics of relevance for each country ( BBB ) Alternative indicator: [Labour share of GDP, comprising wages and social protection
transfers.] Justification: Social protection floor coverage is already captured in the indicator 1.3. The alternative provides a more accurate picture of the income distribution.
Responsible entities: IMF, ILO. Availability: 200 countries.
Indicator 10.4.1 should be simple to identify. Suggest changing along the lines of: "[Percent of total population covered by quality basic health and education services (public or private)"], with quality being assessed by internationally recognized standard test scores (eg PISA).
Alternative indicator: [Shares of tax revenue coming from indirect and direct taxes]. Justification: While indirect taxations is seen as regressive and direct taxation is progressive, the proportion of both provides a measure of the tax system's impact on inequality. If inequality is reduced only by only catering for the bottom 40% of income earners, the proposal is biased. It overlooks the amount of public spending that benefits the top 10% of income earners, a major factor in the persistent income inequalities.
Responsible entities: IMF, ILO. Availability: 200 countries.
Indicator 10.4.2 should read: ["Improvements in the Gini coefficient due to the incidence of tax policy and public spending reform, and proportion of tax revenues paid by the richest quintiles."] Reasons: progressivity should be measured jointly (taxes and expenditures); also not only social expenditures impact the poor. Third, it is not a good idea to tax mainly the middle class, which could be the result if we want to reduce the burden on the poorest 40%.
Adoption of a financial transaction tax (Tobin tax) at a world level
The indicator proposed (10.5.1) is technically not sound. What is the baseline? What is the target? How is it quantified, measured? Instead, any indicator for this target should cover financial stability, efficiency, and depth. However, these areas are difficult to measure, especially stability. A suggestion for an indicator for this target would be to use the World Bank's Country Policy and Institutional Assessment (CPIA) indicators for the financial sector (however the data are not publicly available). These include two sub-indicators that cover financial sector stability and efficiency & depth. A standard deviation measure to indicate whether countries are converging or diverging from meeting international standards, based on these ratings, could serve as a proxy for measuring this target. Further consultation is needed on an adequate indicator for this target.

List of Indicator Proposals - p. 193 of 265
List of Proposals* Note on Disaggregation: All indicators should be disaggregated by sex, age, residence (U/R) and other characteristics, as relevant and possible.
Contributor Name Specification Source Entity Tier Priority InterlinkagesSuggested Indicator Administrative data of international organizations. Tier I
Indicator 10.6.1 Percentage of voting rights in international organizations of developing countries, compared to population or GDP as appropriate ( CBB )
Target 10.6 Ensure enhanced representation and voice for developing countries in decision-making in global international economic and financial institutions in order to deliver more effective, credible, accountable and legitimate institutions
Percentage of members or voting rights of developing countries in international organizations.
United Nations/DESA. Data would be available for all international organizations.
Target 16.3 (rule of law at international level). Target
16.7 (which focuses on inclusive, participatory and
representative decision-making AT ALL LEVELs).
Target 17.10 (non-discriminatory and equitable multilateral trading system).

List of Indicator Proposals - p. 194 of 265
List of Proposals* Note on Disaggregation: All indicators should be disaggregated by sex, age, residence (U/R) and other characteristics, as relevant and possible.Target 10.7 Facilitate orderly, safe, regular and responsible migration and mobility of people, including through the implementation of planned and well-managed migration policies
Contributor Name Specification Source Entity Tier Priority InterlinkagesSuggested Indicator Tier III 8.8; 10.7
Suggested Indicator International Migration Policy Index Tier III 5.2; 8.8; 10.7; 16.1; 16.2
Suggested Indicator National governments/Field studies Tier II 5.2, 16.2
Indicator 10.7.1 Index on Human Mobility Governance measuring key features of good-governance of migration ( CBB ) ILO NORMLEX (Information System on International Labour Standards of the ILO). 1
GlobalMigrationWG 1 5.2; 8.8; 10.7; 16.1; 16.2
Indicator 10.7.2 Number of migrants killed, injured or victims of crime while attempting to cross maritime, land, air borders ( CBB ) OHCHR See attached metadata Multiple data sources - see attached metadata 1 10.7, 16.1, 16.2, 16.3, 16b UNWOMEN UN Women calls for this indicator to be disaggregated by sex and age. WB
GlobalMigrationWG 2 8.8; 10.7
UNODC National governments/Field studies 1 Target 5.2
Target 10.a Implement the principle of special and differential treatment for developing countries, in particular least developed countries, in accordance with World Trade Organization agreements Contributor Name Specification Source Entity Tier Priority Interlinkages
Suggested Indicator Computed with data from TRAINS-UNCTAD. Tier I 17.10
Indicator 10.a.1 Degree of utilization and of implementation of SDT measures in favour of LDCs ( CBB ) WB Computed with data from TRAINS-UNCTAD. TRAINS data is available for 180+ countries 1 "17.10"
Indicator 10.a.2 List of government actions (by LDCs) that can be covered under the S&D of the WTO agreements, with a view to measuring the "policy space" available to them ( CBB )
Recruitment cost born by employee as percentage of yearly income earned in country of destination.
Annual cost surveys based on household surveys, labour force surveys or ad hoc surveys.
National Statistical offices, Ministries of Labour. GMG
Government agencies, including reporting to follow-up mechanisms of relevant human rights instruments. The United Nations Inquiry among Governments on Population and Development. World Population Policies Database. Migration Profiles. Existing migration policy indices
Collective effort by members of the Global Migration Group, supported by national governments and statistical agencies
Number of detected and non-detected victims of human trafficking per 100,000; by sex, age and form of exploitation
UNODC, Data on the number of detected victims of TIP is available for over 130 countries
Alternative indicator: [Ratification and implementation of the ILO Labour Migration Conventions]
Responsible entity: ILO. Availability: Information on all ILO member states (185), of which 49 ratified convention n<U+00B0>97 and 23 ratified convention n<U+00B0>143.
[International Migration Policy Index]. See full specification in attached meta-data word file
Government agencies, including reporting to follow-up mechanisms of relevant human rights instruments. The United Nations Inquiry among Governments on Population and Development. World Population Policies Database. Migration Profiles. Existing migration policy indices
Collective effort by members of the Global Migration Group, supported by national governments and statistical agencies
Change to \[Number of victims of human trafficking per 100,000 persons.]" Also, a new indicator 10.7.3 is proposed: "[Recruitment costs borne by agricultural workers' employee, domestic workers' employee and construction workers' employee]"
[ Recruitment cost born by employee as percentage of yearly income earned in country of destination]. See full specification in attached meta-data word file
Annual cost surveys based on household surveys, labour force surveys or ad hoc surveys.
National Statistical offices, Ministries of Labour. GMG
[Number of detected and non-detected victims of human trafficking per 100,000; by sex, age and form of exploitation]
UNODC, Data on the number of detected victims of TIP is available for over 130 countries
Share of tariff lines applied to imports from LDCs/developing countries with zero-tariff
TRAINS data is available for 180+ countries
An alternate indicator is proposed: ["Share of tariff lines applied to imports from LDCs/developing countries with zero-tariff."]

List of Indicator Proposals - p. 195 of 265
List of Proposals* Note on Disaggregation: All indicators should be disaggregated by sex, age, residence (U/R) and other characteristics, as relevant and possible.
WB 2 17.10-17.11An alternate indicator is proposed: ["Services Trade Restrictions."] The Services Trade Restrictions Database covers 103 countries that represent all regions and income groups of the world. For each country, five major services sectors are covered that encompass a total of 19 subsectorsEach subsector in turn covers the most relevant modes of supplying the respective services, yielding overall 34 country-subsector-mode combinations:Mode 1: financial services, transportation and professional servicesMode 3: all subsectorsMode 4: professional services. The Eight WTO Ministerial Conference in 2011 adopted a waiver, enabling WTO members to provide preferential treatment to services and service suppliers of LDCs. The services sector has become a key driver of growth and development, accounting for 47 percent of all LDCs' overall GDP in 2011. However compared with the value of world services trade, LDC services trade is still marginal. Hence, over the coming years, the waiver can provide significant opportunities to further enhance the growth of service sectors in LDCs
World Bank. Data available forhttp://iresearch.worldbank.org/servicetrade/aboutData.htm
World Bank. Data available for up to 103 countrieshttp://iresearch.worldbank.org/servicetrade/aboutData.htm

List of Indicator Proposals - p. 196 of 265
List of Proposals* Note on Disaggregation: All indicators should be disaggregated by sex, age, residence (U/R) and other characteristics, as relevant and possible.
Contributor Name Specification Source Entity Tier Priority InterlinkagesSuggested Indicator OECD ODA data, disaggregated by recipient and donor countries OECD OECD Tier IIIndicator 10.b.1 FDI inflows as a share of GDP to developing countries, broken down by group (LDCs, African countries, SIDS, LLDCS) and by source country ( BAA )
Indicator 10.b.2 OECD ODA data, disaggregated by recipient and donor countries ( BBB )
Target 10.c By 2030, reduce to less than 3 per cent the transaction costs of migrant remittances and eliminate remittance corridors with costs higher than 5 per cent Contributor Name Specification Source Entity Tier Priority Interlinkages
Suggested Indicator Remittance costs as a percentage of the amount remitted World Bank Tier I 10.7; 17.3
Indicator 10.c.1 Percentage of remittances spent as transfer cost less than 3% ( CBB ) WB World Bank
GlobalMigrationWG World Bank 1 10.7; 17.3
WB World Bank Remittance Prices Worldwide database World Bank 1
WB World Bank Remittance Prices Worldwide database World Bank 1
Target 10.b Encourage official development assistance and financial flows, including foreign direct investment, to States where the need is greatest, in particular least developed countries, African countries, small island developing States and landlocked developing countries, in accordance with their national plans and programmes
Data already collected through quarterly surveys in 226 migration corridors. Information is compiled in existing remittance price database: http://remittanceprices.worldbank.org/en, (survey based, mystery shopping)
Firstly, If possible we suggest target 10.c. be made more specific to ""By 2030, reduce to less than 3% the transaction cost of migrant remittances, with at least one reliable and accessible service available in each corridor at a cost significantly lower than the average for that corridor, through enhanced information, transparency, competition and cooperation with partners."Regarding the indicators we have following comments. The indicator proposed (10.c.1) is not fully addressing this target. In addition, putting a limit on the price may be harmful for the supply of formal remittance services, causing informal methods to sprout. Instead, we suggest the following 3 indicators, the data for which are readily available. Please note that these 3 proposed indicators are also in line with the global 5x5 objective on remittances: 10.c.1. Global average total cost of sending $200 (or equivalent in local sending currency, adjusted for inflation and expressed as % of amount sent)(Source: Remittance Prices Worldwide database by the World Bank; Same figure has been used as reference for 5x5 objective; This is the simple average of all services included in the RPW database; Target is max 3%)10.c.2. Average total cost of sending $200 (or equivalent in local sending currency, adjusted for inflation) in each country corridor (expressed as % of amount sent)
World Bank Remittance Prices Worldwide database.
(Data are available for 226 corridors in Remittance Prices Worldwide database by the World Bank; Target is max 5% by 2030 in each corridor)10.c.3. Global average total cost of sending $200 (or equivalent in local sending currency, adjusted for inflation) with the three cheapest services available in each market and accessible to the large majority of senders and recipients(This can be calculated from Remittance Prices Worldwide database by the World Bank; This is the simple average of the three cheapest available services in each corridor meeting requirements of availability and reach; This will allow to monitor the cost of services that are available to senders for a minimum price, regardless of the presence in the market of other more expensive services)Please note that setting a target on prices may lead to price regulations, and in turn, may have unintended consequences such as market distortions that encourage the illegal sector.The current global average price of sending $200 remittances is 7.9% as per the World Bank Remittance Prices Worldwide database, available at http://remittanceprices.worldbank.org.
[Remittance costs as a percentage of the amount remitted]. See full specification in attached meta-data word file
Data already collected through quarterly surveys in 226 migration corridors. Information is compiled in existing remittance price database: http://remittanceprices.worldbank.org/en, (survey based, mystery shopping)
[Global average total cost of sending $200 (or equivalent in local sending currency, adjusted for inflation and expressed as % of amount sent).] Same figure has been used as reference for 5x5 objective; This is the simple average of all services included in the RPW database; Target is max 3%
[Average total cost of sending $200 (or equivalent in local sending currency, adjusted for inflation) in each country corridor (expressed as % of amount sent)] Data are available for 226 corridors in Remittance Prices Worldwide database by the World Bank; Target is max 5% by 2030 in each corridor

List of Indicator Proposals - p. 197 of 265
List of Proposals* Note on Disaggregation: All indicators should be disaggregated by sex, age, residence (U/R) and other characteristics, as relevant and possible.
WB World Bank Remittance Prices Worldwide database World Bank 1[Global average total cost of sending $200 (or equivalent in local sending currency, adjusted for inflation) with the three cheapest services available in each market and accessible to the large majority of senders and recipients] This can be calculated from Remittance Prices Worldwide database by the World Bank; This is the simple average of the three cheapest available services in each corridor meeting requirements of availability and reach; This will allow to monitor the cost of services that are available to senders for a minimum price, regardless of the presence in the market of other more expensive services. Please note that setting a target on prices may lead to price regulations, and in turn, may have unintended consequences such as market distortions that encourage the illegal sector. The current global average price of sending $200 remittances is 7.9% as per the World Bank Remittance Prices Worldwide database, available at http://remittanceprices.worldbank.org.

List of Indicator Proposals - p. 198 of 265
List of Proposals* Note on Disaggregation: All indicators should be disaggregated by sex, age, residence (U/R) and other characteristics, as relevant and possible.Goal 11 Make cities and human settlements inclusive, safe, resilient and sustainable Target 11.1 By 2030, ensure access for all to adequate, safe and affordable housing and basic services and upgrade slums
Contributor Name Specification Source Entity Tier Priority InterlinkagesSuggested Indicator Proportion of urban population living in slums Census, DHS, MICs and household surveys Tier I 1.4, 1.a, 5.4, 6.1, 6.2, 6.3, 6.4.
Indicator 11.1.1 Percentage of urban population living in slums or informal settlements ( BBA ) UNHABITAT [Proportion of urban population living in slums] Census, DHS, MICs and household surveys 1
Indicator 11.1.2 Proportion of population that spends more than 30% of its income on accommodation ( BAA ) UNHABITAT same indicator Household surveys 2 (10.1.2/ 10.1.2)
Contributor Name Specification Source Entity Tier Priority InterlinkagesSuggested Indicator Proportion of the population that has a public transit stop within 0.5 km Tier II 3.9, 7.3
Indicator 11.2.1 Percentage of people living within 0.5 km of public transit [running at least every 20 minutes] in cities with more than 500,000 inhabitants ( CBB ) UNHABITAT [Proportion of the population that has a public transit stop within 0.5 km ] 1 (3.9.1 / 7.3.2)
Indicator 11.2.2 Km of high capacity (BRT, light rail, metro) public transport per person for cities with more than 500,000 inhabitants ( CBB ) UNHABITAT same indicator 2 (3.9.1 / 7.3.2)
WB Measurable through GIS based on Open Data 1 9.1, 11.7
WB Household surveys 2
UN-HABITAT. The data is available for all countries in the world. Global Urban Observatory and City Prosperity Initiative.
UN-HABITAT. The data is available for all countries in the world. Global Urban Observatory and City Prosperity Initiative.
(1.4.1 / 1.4.2 / 1.a.1 /5.4.2/ 6.1.1 / 6.2.1 / 6.3.1/6.4.1 )
no agency. Data is available for many countries. Household surveys on income and consumption.
Target 11.2 By 2030, provide access to safe, affordable, accessible and sustainable transport systems for all, improving road safety, notably by expanding public transport, with special attention to the needs of those in vulnerable situations, women, children, persons with disabilities and older persons
Administrative city information and private/public transport companies. Community-based information
Potential lead Agency UN-Habitat. Data is not yet available.
Administrative city information and private/public transport companies. Community-based information
Potential lead Agency UN-Habitat. Data is not yet available.
Map of the city. Administrative city information and private/public transport companies. Community-based information
Potential lead Agency UN-Habitat - City Prosperity Initiative is already collecting this indicator in 320 cities
[Share of jobs in the metropolitan area an 'average' household can access within 60/75 minutes without a private car i.e. using walking, cycling and public transport.]
World Bank - Data is currently available for an expanding set of cities
[Proportion of income spent by urban families on transport to reach employment, education, health and community services.]
Data exists for some major cities , but not all cities have yet systematically collected relevant data

List of Indicator Proposals - p. 199 of 265
List of Proposals* Note on Disaggregation: All indicators should be disaggregated by sex, age, residence (U/R) and other characteristics, as relevant and possible.Target 11.3 By 2030, enhance inclusive and sustainable urbanization and capacity for participatory, integrated and sustainable human settlement planning and management in all countries
Contributor Name Specification Source Entity Tier Priority InterlinkagesSuggested Indicator Efficient land use population growth (UNDESA). Satellite images of cities (open source). Tier II
Indicator 11.3.1 Ratio of land consumption rate to population growth rate at comparable scale ( CBB ) UNHABITAT [Efficient land use ] population growth (UNDESA). Satellite images of cities (open source) 1
WB Earth Observation Data- DLR GUF, ESA Sentinelle 2; Population, WorldPop 1
UNFPA Satellite imagery (Landsat) and census data; SDSN proposed indicator 1 11.a
UNSD [Efficient land use] 1
Indicator 11.3.2 Cities with more than 100,000 inhabitants that implement urban and regional development plans integrating population projections and resource needs ( BBB ) UNHABITAT same indicator City reporting. UN-Habitat. 2 same than 11.a.1 WB 2
UNFPA 2 11.a
UN-HABITAT. The data is available for all countries in the world. The City Prosperity Initiative is collecting data for this indicator in more than 300 cities. Lincoln Institute and University of New York and UN-Habitat collect for a Global Sample of Cities (200 cities)
2.1, 3.9, 6.4, 6.6, 11.a, 11.1, 11.b, 12.1, 13.2, 15.3, 15.4
UN-HABITAT. The data is available for all countries in the world. The City Prosperity Initiative is collecting data for this indicator in more than 300 cities. Lincoln Institute and University of New York and UN-Habitat collect for a Global Sample of Cities (200 cities)
(2.1.2 / 3.9.1 / 6.4.1 / 6.6.1 / 11.a / 11.1 /11.b.1/ 12.1.1 /
13.2.1 / 15.3.1 / 15.4.1)
This is a much better indicator. It has a clear methodology and can be standardized and collected on a regular basis. The growing availability of EO data, such as the GUF from DLR, the GHSL can serve as baseline, combined with WorldPop. Moving forward, the Sentinell2 will be able to provide data to monitor this indicator, systematically for the world.
[Ratio of land consumption rate to urban population growth rate at comparable scale]
Land cover account in the SEEA Land accounts in the SEEA Central Framework are useful in organization information on land use and land cover. In particular, the land cover accounts provide the statistical methodology in organization information on land cover ,which reflects the observed physical and biological cover of the Earth's source that is a function of natural changes in the environment and of previous and current land use.
The SEEA Central Framework provide a complete classification for land cover. based on the FAO Land Cover Classification, comprises 14 basis classes and is presented in full in Annex I of the SEEA Central Framework. The classification allow the derivation of statistical information on land cover.
The land cover account allow an additional step in the analysis of land cover change showing reasons for land cover change, such as changes relates to urban growth and development of infrastructure (through conversion of crops or tree-covered areas), deforestation, desertification, etc. The land use account allows the compilation of indicators related to this target including the urbanization rate, etc.
This indicator is ambiguous and does not reflect the actual coordination of planning for participatory, integrated and sustainable cities. The indicator does not require the plan to be current, or to actually adequately reflect the challenges in the city. Furthermore 'implementing' the development plan is also unclear, as there can be many levels of implementation.
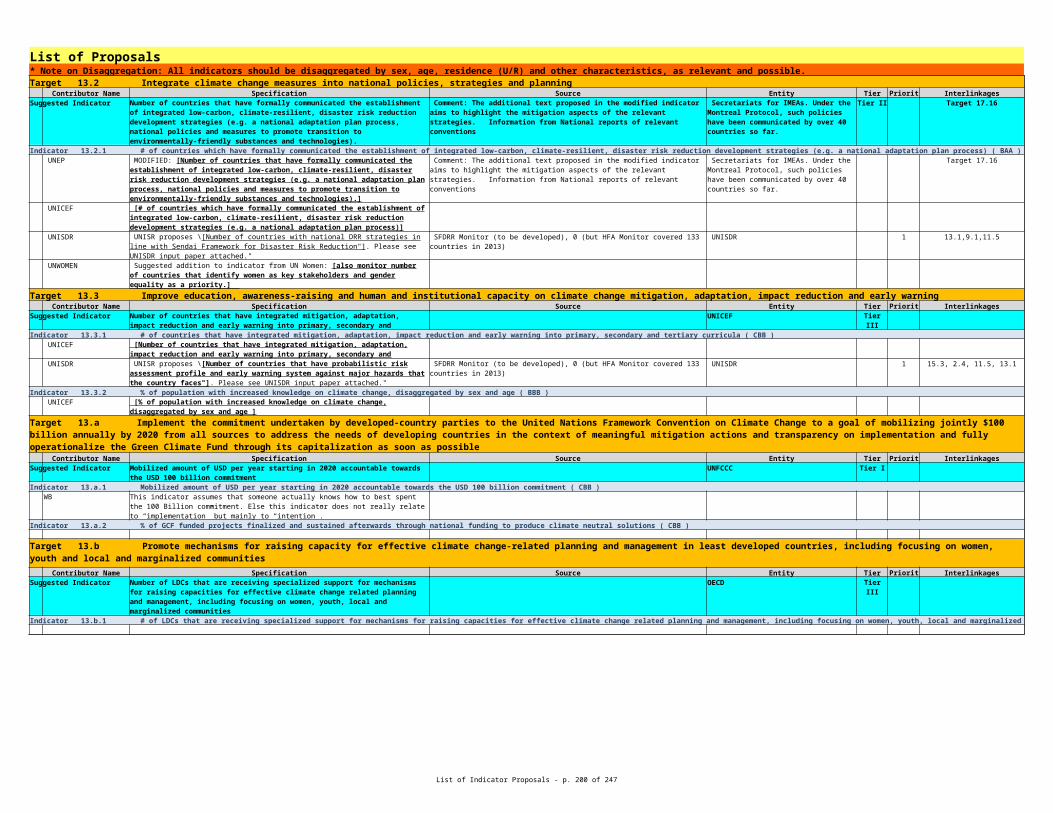
List of Indicator Proposals - p. 200 of 265
List of Proposals* Note on Disaggregation: All indicators should be disaggregated by sex, age, residence (U/R) and other characteristics, as relevant and possible.Target 11.4 Strengthen efforts to protect and safeguard the world's cultural and natural heritage
Contributor Name Specification Source Entity Tier Priority InterlinkagesSuggested Indicator Tier II 8.9, 11,7, 12.b
Indicator 11.4.1 Percentage of budget provided for maintaining cultural and natural heritage ( BBA ) UNESCO Ministry of Finance/Budget and National Statistical Offices 2
UNHABITAT same indicator National accounts and state, provincial and local budgets UNESCO, UN-Habitat 1
UNSD 1
Indicator 11.4.2 Percentage of urban area and percentage of historical/cultural sites accorded protected status ( BAA ) UNESCO Municipal/national data and heritage office records; National inventories 3
UNHABITAT same indicator National government and state/provincial inventory UNESCO, UN-Habitat 2
IUCN 1
UNESCO Labour Force Surveys 1
Share of national (or municipal) budget which is dedicated to preservation, protection and conservation of national cultural natural heritage including World Heritage sites
Ministry of Finance/Budget and National Statistical Offices UNESCO-UIS (but there are no current data collections for this), UN-HABITAT
[Share of national (or municipal) budget which is dedicated to preservation, protection and conservation of national cultural natural heritage including World Heritage sites]. Disaggregations: none
UNESCO-UIS (but there are no current data collections for this)
(8.9.1 / 8.9.2 / 11.7.1 / 12.b.1 / 12.b.2)
[Share of national (or municipal) budget which is dedicated to preservation, protection and conservation of national cultural natural heritage including World Heritage sites]
Environmental Protection Expenditure Accounts (EPEA) in the SEEACultural and natural heritage are considered as ecosystem assets and hence efforts to protect and safeguard the world's cultural and natural heritage is considered as an environmental protection activities
EPEA in the SEEA Central Framework provide information on the output of environmental protection specific services produced across the economy and on the expenditure of resident units on all goods and services for environmental protection purposes.
The SEEA Central Framework provide a complete classification for environmental protection activities (Classification of Environmental Activities) comprises 16 basis classes and is presented in full in Annex I of the SEEA Central Framework. The classification allow the derivation of statistical information on environmental protection activities including the protection of biodiversity, landscape and cultural and natural heritage site.
[Historical/cultural sites and urban area which are subject to protection by law (legislative regulation?) ensuring their integrity.] Disaggregations: none
UNESCO-UIS (but there are no current data collections for this)
(8.9.1 / 8.9.2 / 12.b.1 / 12.b.2)
Proposed additional/alternative indicator: IUCN recommends that [“Change in aggregate World Heritage Outlook ratings”] would be a useful complementary indicator here.
Data sources: World Heritage Outlook (http://www.worldheritageoutlook.iucn.org).
IUCN. Available globally, and can be disaggregated to national and regional levels.
[Number and Percentage of the labour force that holds a heritage occupation or is employed in the heritage sector] Disaggregations: sex (and others where data are available)
UNESCO-UIS from the Cultural Employment Survey which will be launched in July 2015
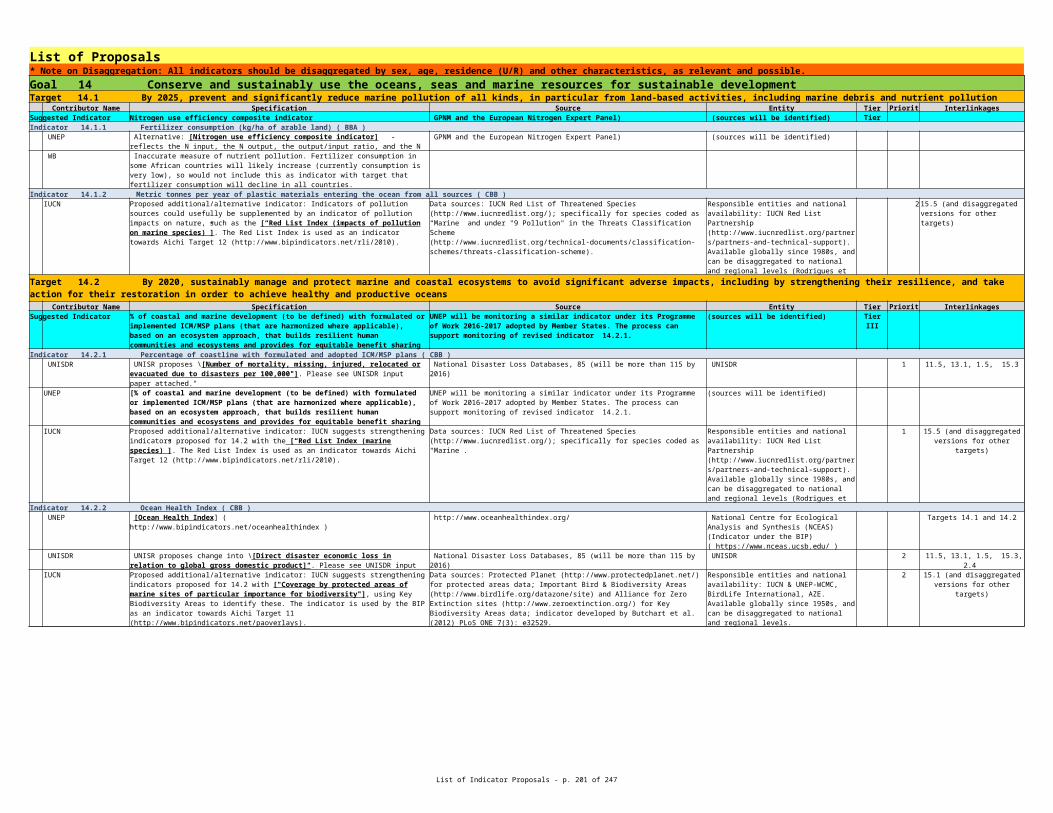
List of Indicator Proposals - p. 201 of 265
List of Proposals* Note on Disaggregation: All indicators should be disaggregated by sex, age, residence (U/R) and other characteristics, as relevant and possible.
Contributor Name Specification Source Entity Tier Priority InterlinkagesSuggested Indicator National Disaster Loss Databases, 85 (will be more than 115 by 2016) UNISDR Tier II 1.5, 13.1, 14.2, 15.3
Indicator 11.5.1 Number of people killed, injured, displaced, evacuated, relocated or otherwise affected by disasters ( BBA ) UNEP
UNHABITAT Government data, OCHA, NGO sources, UNHCR, IOM and IDMC World Bank, OCHA, UN-Habitat 1
UNISDR National Disaster Loss Databases, 85 (will be more than 115 by 2016) UNISDR 1 13.1, 1.5, 14.2, 15.3
UNWOMEN UN Women calls for this indicator to be disaggregated by sex. ECE 1
GlobalMigrationWG NB! Disaggregate by displacement status
Target 11.5 By 2030, significantly reduce the number of deaths and the number of people affected and substantially decrease the direct economic losses relative to global gross domestic product caused by disasters, including water-related disasters, with a focus on protecting the poor and people in vulnerable situations
Number of deaths, missing people, injured, relocated or evacuated due to disasters per 100,000 people.
Multi-purpose indicator: [Proportion of population resilient/robust to hazards and climate -related events]
[Number of people killed, injured, displaced, or otherwise affected by critical and slow onset events.]
(1.4.1 / 1.4.2 / 1.5.1 / 1.5.2 / 6.1.1 / 6.2.1 / 6.3.1/ 6.4.1 /
7.1.1 / 11.1.1/ 11.b.1)
UNISR proposes the refinement into \[Number of deaths, missing people, injured, relocated or evacuated due to disasters per 100,000 people.]". Please see UNISDR input paper attached."
This indicator comprises 6 separate categories where each requires monitoring. The trends in numbers mentioned other than number of people killed or injured are reflective of government DRR strategies and are not absolute indications of their effectiveness. A zero evacuation rate might imply a high level of protective structural measures or a high number of people killed due to inaction. Impact of each category is different, that is one death is not equivalent to one person evacuated, making a composite metric for the indicator 11.5.1 difficult to attain. To make this easier to measure and monitor, it could be reduced to the indicator: ["Number of deaths per year resulting from each disaster type." ] At the global level, the core indicator should be able to be disaggregated by disaster type (floods, droughts, tsunamis, earthquakes, landslides etc.) and could be disaggregated by income, gender, and age of victims; further disaggregation at national level to include frequency of event and its magnitude would be insightful.
A new monitoring framework is needed drawing upon existing monitoring programmes/databases such as EM-DAT (CRED) and DesInventor.
WMO, on behalf of UN-Water. Under the UN-Water umbrella, the GEMI monitoring framework (see further description under 6.3.1) will draw on existing monitoring programmes/databases such as EM-DAT (CRED) and DesInventor for this target.
This indicator can inform on the following targets: 1.5 by 2030 build the resilience of
the poor and those in vulnerable situations, and reduce their exposure and
vulnerability to climate-related extreme events and other economic, social and environmental shocks and disasters. 13.1 strengthen
resilience and adaptive capacity to climate related
hazards and natural disasters in all countries

List of Indicator Proposals - p. 202 of 265
List of Proposals* Note on Disaggregation: All indicators should be disaggregated by sex, age, residence (U/R) and other characteristics, as relevant and possible.
1 1.5, 13.1
WB
Indicator 11.5.2 Number of housing units damaged and destroyed ( BBA ) UNHABITAT same indicator 2 (1.5.1/ 15.2/ 6.4.1 / 7.1.1 ) UNISDR National Disaster Loss Databases, 85 (will be more than 115 by 2016) UNISDR 2 13.1, 1.5, 14.2, 15.3, 2.4
ECE
2 1.5, 13.1
WB
JointSubmissionDisplacementIndicators
REFORMULATED INDICATOR: [Number of people killed, injured, displaced or otherwise affected by disasters] EXPANDED REFORMULATED INDICATOR: [Number of people killed, injured, displaced or otherwise affected by disasters, crises and other shocks] \Displaced" to replace / encompass both "evacuated" and "relocated" as data on displacement per se more readily available at global level than in the case of evacuations and relocations. However, should be noted that the effectiveness of evacuations and resulting reduced loss of lives is one of the main ways to confirm reduced disaster risk/impacts. At the same time, while evacuations are mostly temporary and often coordinated, displacement encompasses the more longer-term forced uprooting of people and resulting uncertainty and impacts on their lives and vulnerability. Also, the category and definition of "affected" needs to be clarified and, where possible, harmonized. Current indicators 1.5.1 and 1.5.2 should be replaced as they are covered more comprehensively by/under 11.5.1 and 11.5.2. However, whereas 11.5 and its indicators cover only disasters, 1.5 covers a wider range of hazards, such as social, economic and environmental shocks. Hence a multi-purpose global indicator covering the number of people killed, injured, displaced or otherwise affected by disasters, crises and other (social, economic and environmental) shocks (linked to 1.5, 11.5, 13.1, 16.1 as well as 10.7) would be advisable, complemented by the above alternative indicator 1 for 1.5 (linked also to 11.5, 13.1, 16.1 as well as 10.7) ) that would measure the (number and) percentage of forcibly displaced people who have found a durable solution to their displacement as a measure of resilience among particularly vulnerable and marginalized groups (i.e. refugees and internally displaced persons). See metadata for more detailed information.
Centre for Research on the Epidemiology of Disasters (CRED) EM-DAT International Disaster Database National disaster loss databases and other government data and statistics OCHA situation reports (in ongoing humanitarian emergencies) Existing/developing (national level) Government statistics and population data. Registration and documentation of IDPs and refugees, in particular UNHCR registration (figures disaggregated by age, gender and disabilities - AGD mainstreaming) and profiling exercises, , annual refugee flow and stock figures and number of asylum applications, participatory needs assessments and population surveys by humanitarian actors. UNHCR registration data IOM Displacement Tracking Matrix Internal Displacement Monitoring Centre (IDMC) IDP Database and Annual Global Estimates Reports for displacement induced by conflict/generalized violence and disasters, as well as UN Population Fund (UNFPA) figures to normalize displacement estimates. Joint IDP Profiling Service (collects data disaggregated by sex, age, location and diversity) [If expanded to cover also crises and other shocks:] Uppsala Conflict Data Programme (counts annual number of people killed as a result of conflict, wars etc.)
Centre for Research on the Epidemiology of Disasters (CRED) EM-DAT International Disaster Database (global coverage) OCHA (ongoing humanitarian emergencies) Displacement: UNHCR (global coverage, with data generally provided by Governments, based on their own definitions and methods of data collection) Internal Displacement Monitoring Centre (Currently internal displacement profiles for 50 countries. Global reports since 1998.)
Modify to ['Number of people killed, injured, displaced, evacuated, relocated, or otherwise affected by disasters PER YEAR'; or can be normalized by population size.]
UNISR proposes \[Direct disaster economic loss in relation to global gross domestic product]". UNISDR also proposes "[Number of housing units damaged and destroyed by disasters]" though priority is lower compared to economic loss indicators. Please see UNISDR input paper attached. "
Indicator will be highly variable depending on variability of family income in the local society; and it is difficult to measure most vulnerable sectors of communities living in informal settlements. Many of the most vulnerable do not live in formal "housing units". It would be more advantageous to focus on major permanent structures of critical importance such as hospitals, schools, and water treatment plants. The preferred indicator would be: ["Damages by disaster type per year to critical infrastructure such as health (hospitals), educational (schools), and water treatment plants.]
A new monitoring framework is needed drawing upon existing monitoring programmes/databases such as EM-DAT (CRED) and DesInventor.
WMO, on behalf of UN-Water: Under the UN-Water umbrella, the GEMI monitoring framework (see further description under 6.3.1) will draw on existing monitoring programmes/databases such as EM-DAT (CRED) and DesInventor for this target.
JointSubmissionDisplacementIndicators
11.5.2 encompasses health and education facilities mentioned in 1.5.2. Overall, important to include aforementioned (and other) critical public structures and homes.
Modify to ["Number of housing units damaged or destroyed PER YEAR". or can be normalized by population size.]
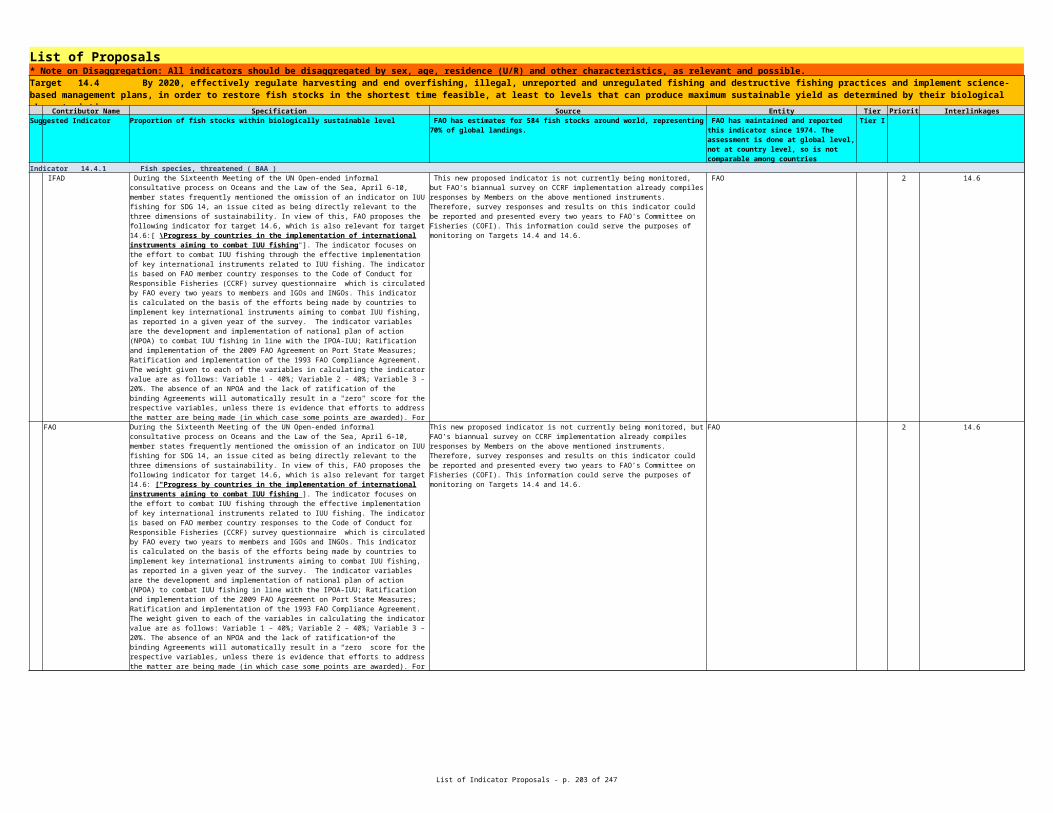
List of Indicator Proposals - p. 203 of 265
List of Proposals* Note on Disaggregation: All indicators should be disaggregated by sex, age, residence (U/R) and other characteristics, as relevant and possible.Target 11.6 By 2030, reduce the adverse per capita environmental impact of cities, including by paying special attention to air quality and municipal and other waste management
Contributor Name Specification Source Entity Tier Priority InterlinkagesSuggested Indicator UN-Habitat and WHO Tier III 12.3, 12.5
Suggested Indicator Level of ambient particulate matter (PM 10 and PM 2.5) Municipal bodies or private contractor UNEP, UN-Habitat Tier I 3.9.1Indicator 11.6.1 Percentage of urban solid waste regularly collected and recycled (disaggregated by E-waste and non-E-waste) (BAA)
UN-Habitat [Percentage of urban solid waste regularly collected and well managed] UN-Habitat and WHO 1
WB UNU 9.1, 9.2, 11.b
UNSD 1
Indicator 11.6.2 Level of ambient particulate matter (PM 10 and PM 2.5) (BBA)UN-Habitat same indicator Municipal bodies or private contractor UNEP, UN-Habitat 2 (3.9.1.)WB 3.9
Percentage of urban solid waste regularly collected and well managed (disaggregated by type of waste)
Municipal bodies or private contractors. Informal collection data from NGOs and community organizations
Municipal bodies or private contractors. Informal collection data from NGOs and community organizations
(12.3.1 / 12.3.2 / 12.5.1 / 12.5.2)
As an alternative indicator ["Urban greenhouse gas emissions per capita and per US$ of urban GDP"] can be considered.
For existing indicator, however, E-waste collection rate data exists, and is collected by UNU
[Percentage of urban solid waste regularly collected and well managed (disaggregated by type of waste)]
Solid waste accounts in the SEEASolid waste accounts in the SEEA Central Framework are useful in organizing information on the generation of solid waste and the management of flows of solid waste to recycling facilities, to controlled landfills or directly to the environment. Measures of the amount of waste in aggregate or of quantities of specific waste materials are important indicators of environmental pressures. The construction of solid waste accounts allows these indicators to be place in a broader context with economic data in both physical and monitoring terms.
The accounts highlight various activities of the waste collection, treatment and disposal industry that include landfill operation, incineration of solid waste, recycling and reuse activities and other treatment of solid waste
In sum, the accounts allows the compilation of indicators related to this target including the volume of solid waste recycled, the volume of national waste generation disaggregated by industry, etc.
An alternative indicator ["Size of urban environmental footprint"] can be considered as well.
For existing indicator, particulate matter from transport estimable by ICCT using Roadmap Model or IEA using MoMo model

List of Indicator Proposals - p. 204 of 265
List of Proposals* Note on Disaggregation: All indicators should be disaggregated by sex, age, residence (U/R) and other characteristics, as relevant and possible.Target 11.7 By 2030, provide universal access to safe, inclusive and accessible, green and public spaces, in particular for women and children, older persons and persons with disabilities
Contributor Name Specification Source Entity Tier Priority InterlinkagesSuggested Indicator UN-Habitat Tier III 12.b, 16.1
Indicator 11.7.1 Area of public space as a proportion of total city space ( BBB ) UNHABITAT UN-Habitat 1 (12.b.1 / 16.1.1 )
IUCN Currently proposed indicator: IUCN supports adoption of this indicator. 1
WB 2
UNSD 1
Indicator 11.7.2 Proportion of residents within 0.5 km of accessible green and public space ( CBB ) UNHABITAT same indicator UN-Habitat 2 -
WB 1
The average share of the built-up areas of cities in open space in public ownership and use.
Satellite imagery (open sources), legal documents outlining publicly owned land, community-based maps
[The average share of the built-up areas of cities in open space in public ownership and use.]
Satellite imagery (open sources), legal documents outlining publicly owned land, community-based maps
Data sources: Protected Planet (http://www.protectedplanet.net/) for protected areas data, overlaid onto urban spatial data.
Responsible entities and national availability: IUCN & UNEP-WCMC. Available globally since 1950s, and can be disaggregated to national and regional levels.
This target should not only target the total number of green and public spaces, but also the distribution of those spaces along the city. This proposed indicator fails to highlight the spatial distribution of green and public spaces. We note the critical importance of public spaces, which include the street network, for providing the main channel through which infrastructure such as water pipes can be laid. Intersections per km is one way to measure the adequacy of the street network.
[The average share of the built-up areas of cities in open space in public ownership and use.]
Land use account in the SEEA Central FrameworkLand accounts in the SEEA Central Framework are useful in organization information on land use and land cover. In particular, the land use accounts provide the statistical methodology in organization information on land use ,which reflects both the activities undertaken and the institutional arrangements put in place, for a given area for the purposes of economic production, human activities or the main maintenance and restoration of environment function
The SEEA Central Framework provide a complete classification for land use comprises 46 basis classes and is presented in full in Annex I of the SEEA Central Framework. The classification allow the derivation of statistical information on land use of built up and related areas for recreational facilities.
In sum, the land use account allows the compilation of indicators related to this target including the average share of the built-up areas of cities in open space for recreational use, etc.
Please refer to Chapter 5.6 in the SEEA Central Framework for more information on the land accounts
Satellite imagery (open sources), legal documents outlining publicly owned land, community-based maps
This indicator is better, but still does not adequately capture the target. This indicator does not highlight the connectivity (and services) that should be provided by green and specially public spaces. The buffer is too big to be considered accessible. Furthermore, it will be hard to get high resolution spatially representative socio-demographic data which includes older persons and people with disabilities as is being proposed by some.

List of Indicator Proposals - p. 205 of 265
List of Proposals* Note on Disaggregation: All indicators should be disaggregated by sex, age, residence (U/R) and other characteristics, as relevant and possible.Target 11.a Support positive economic, social and environmental links between urban, peri-urban and rural areas by strengthening national and regional development planning
Contributor Name Specification Source Entity Tier Priority InterlinkagesSuggested Indicator UNDESA, Census information, city data UNFPA , UN-Habitat, DESA Tier I
Indicator 11.a.1 Cities with more than 100,000 inhabitants that implement urban and regional development plans integrating population projections and resource needs ( CBB ) UNHABITAT same indicator UNDESA, Census information, city data UNFPA , UN-Habitat 1 no link UNFPA 1 11.3
Indicator 11.a.2 Ratio of land consumption rate to population growth rate at comparable scale ( CBB ) UNHABITAT used as indicator 11.3.1 and modified as efficient land use UN-Habitat and World Bank 2
WB
UNFPA 2 11.3
Contributor Name Specification Source Entity Tier Priority InterlinkagesSuggested Indicator Government data, OCHA, NGO sources, UNHCR, IOM and IDMC Tier I 13.3
UNHABITAT Government data, OCHA, NGO sources, UNHCR, IOM and IDMC 1 (13.3.1)
UNISDR UNISDR 1 13.1, 9.1, 11.5, 14.2
Indicator 11.b.2 Population density measured over continuous urban footprint ( BBB ) UNHABITAT refer to indicator 11.3.1 2 refer to indicator 11.3.1
Target 11.c Support least developed countries, including through financial and technical assistance, in building sustainable and resilient buildings utilizing local materials Contributor Name Specification Source Entity Tier Priority Interlinkages
Suggested Indicator National accounts and state, provincial and local budgets UN-Habitat, World Bank Tier II
Indicator 11.c.1 Percentage of financial support that is allocated to the construction and retrofitting of sustainable, resilient and resource-efficient buildings ( CBB ) UNHABITAT same indicator National accounts and state, provincial and local budgets UN-Habitat, World Bank 1 no link
Indicator 11.c.2 Sub-national government revenues and expenditures as a percentage of general government revenues and expenditures, including for buildings; own revenue collection (source revenue) as a percentage of total city revenue ( CBB ) UNHABITAT same indicator 2
Cities with more than 100,000 inhabitants that implement urban and regional development plans integrating population projections and resource needs
already covered by indicator 11.3.1 that is a multi-purpose
indicator (2.1.2 / 3.9.1 / 6.4.1 / 6.6.1 / 11.a / 11.1 /11.b.1/ 12.1.1 / 13.2.1 /
15.3.1 / 15.4.1)
Land consumption vs. population growth has probably hit a ceiling in some countries, where there are simply no more land resources to distribute ( e.g. Bangladesh, Rwanda, Burundi(. Thus this will have to be looked at with a clear context to the current country baseline.
Target 11.b By 2020, substantially increase the number of cities and human settlements adopting and implementing integrated policies and plans towards inclusion, resource efficiency, mitigation and adaptation to climate change, resilience to disasters, and develop and implement, in line with theSendai Framework for Disaster Risk Reduction 2015-2030, holistic disaster risk management at all levels
Percentage of cities implementing risk reduction and resilience policies that include vulnerable and marginalized groups.
UN-Habitat, World Bank, ICLEI, UNISDR, Rockefeller Foundation, 100 Resilient Cities, Global Facility for Disaster Reduction and Reconstruction, Interamerican Development Bank, and C40 Climate Leadership Group
Indicator 11.b.1 Percent of cities with more than 100,000 inhabitants that are implementing risk reduction and resilience strategies aligned with accepted international frameworks (such as the successor to the Hyogo Framework for Action on Disaster Risk Reduction) that include vulnerable and marginalized groups in their design, implementation and monitoring ( CBB ) [Percentage of cities implementing risk reduction and resilience policies that include
vulnerable and marginalized groups. ] UN-Habitat, World Bank, ICLEI, UNISDR, Rockefeller Foundation, 100 Resilient Cities, Global Facility for Disaster Reduction and Reconstruction, Interamerican Development Bank, and C40 Climate Leadership Group
UNISDR proposes [Number of local governments with more than 100,000 inhabitants and capital cities that adopt and implement local DRR strategies in line with Sendai Framework for Disaster Risk Reduction, in relation to total number of local governments with more than 100,000 inhabitants and capital cities"]. Please see UNISDR input paper attached."
SFDRR Monitor (to be developed), 0 (but HFA Monitor covered 133 countries in 2013)
covered by Indicator 11.3.1 that has been modified as follows: [Efficient land use]
Percentage of financial support that is allocated to the construction and retrofitting of sustainable, resilient and resource-efficient buildings

List of Indicator Proposals - p. 206 of 265
List of Proposals* Note on Disaggregation: All indicators should be disaggregated by sex, age, residence (U/R) and other characteristics, as relevant and possible.Goal 12 Ensure sustainable consumption and production patterns
Contributor Name Specification Source Entity Tier Priority InterlinkagesSuggested Indicator UNEP Tier II
Indicator 12.1.1 Number of countries with SCP National Actions Plans or SCP mainstreamed as a priority or target into national policies, poverty reduction strategies and sustainable development strategies ( BBB ) UNEP 1
Indicator 12.1.2 Number of countries with inter-ministerial coordination and multi-stakeholder mechanisms supporting the shift to SCP, as well as organizations with agreed monitoring, implementation and evaluation arrangements ( CBB ) UNEP 2
Target 12.2 By 2030, achieve the sustainable management and efficient use of natural resources Contributor Name Specification Source Entity Tier Priority Interlinkages
Suggested Indicator Material footprint (MF) and MF/capita Tier II 8.4, 12.5
Indicator 12.2.1 Domestic Material Consumption (DMC) and DMC/capita ( BBB ) UNEP 1 8.4, 12.5
Indicator 12.2.2 Material footprint (MF) and MF/capita ( BBB ) UNEP 2 8.4, 12.5
IUCN 2
Target 12.1 Implement the 10-year framework of programmes on sustainable consumption and production, all countries taking action, with developed countries taking the lead, taking into account the development and capabilities of developing countries
Number of countries with SCP National Actions Plans or SCP mainstreamed as a priority or target into national policies, poverty reduction strategies and sustainable development strategies
Data not available currently – quantitative data will be provided by mid-2015 as a result of the first Global Survey on SCP, and conducted on a regular basis
2.4, 4.7, 8.4, 8.9, 9a, 11c, 12.3, 12.7, 12.8, 12.a,
12.b, 14.7, 17.16, 17.19
Good – Quantitative data will be provided by mid-2015 as a result of the first Global Survey on SCP, and conducted on a regular basis thereafter
2.4, 4.7, 8.4, 8.9, 9a, 11c, 12.3, 12.7, 12.8, 12.a,
12.b, 14.7, 17.16, 17.19
Replace with: Number of countries / organizations actively engaged in regional cooperation supporting the implementation of SCP activities at the regional, sub-regional and national levels
Quantitative data will be provided by mid-2015 as a result of the Global Survey on SCP and conducted on a regular basis
2.4, 4.7, 8.4, 8.9, 9a, 11c, 12.3, 12.7, 12.8, 12.a,
12.b, 14.7, 17.16, 17.19
For MF doable for the last two decades based on material extraction satellite accounts and standard MRIOs such as EXIOBASE, EORA or GTAP-WDIO; for DMI: reliable data available from UNEP and Eurostat for the last four decades
UNEP/OECD. The OECD's Input/output tables could be used to compute this; see http://www.oecd.org/trade/input-outputtables.htm.
DMC is defined as the total amount of materials directly used in the economy (used domestic extraction plus imports), minus the materials that are exported. This indicator informs policy about the amount of materials required to produce the national product. Data is available for most countries of the world for the last 4 decades. DMC is measured in metric tons
MF is defined as the global allocation of used raw material extraction to the final demand of an economy. It is calculated using a consumption approach based on the attribution of global materials extraction to final consumption. MF is measured in metric tons. In addition, Domestic Material Input (DMI) incl. per capita rates.
For MF doable for the last two decades based on material extraction satellite accounts and standard MRIOs such as EXIOBASE, EORA or GTAP-WDIO; for DMI: reliable data available from UNEP and Eurostat for the last four decades
UNEP/OECD. The OECD's Input/output tables could be used to compute this; see http://www.oecd.org/trade/input-outputtables.htm.
Proposed additional/alternative indicator: Indicators of sustainable use of non-living resources could usefully be supplemented by an indicator of sustainable use of species, such as the [“Red List Index (impacts of biological resource use)”]. The indicator is used by the BIP as an indicator towards Aichi Target 4 (http://www.bipindicators.net/redlistindexforbirdsmammalsandamphibians).
Data sources: IUCN Red List of Threatened Species (http://www.iucnredlist.org/); specifically for species coded under "5 Biological resource use" in the Threats Classification Scheme (http://www.iucnredlist.org/technical-documents/classification-schemes/threats-classification-scheme).
Responsible entities and national availability: IUCN Red List Partnership (http://www.iucnredlist.org/partners/partners-and-technical-support). Available globally since 1980s, and can be disaggregated to national and regional levels (Rodrigues et al. 2014 PLoS ONE 9(11): e113934).
15.5 (and disaggregated versions for other targets)

List of Indicator Proposals - p. 207 of 265
List of Proposals* Note on Disaggregation: All indicators should be disaggregated by sex, age, residence (U/R) and other characteristics, as relevant and possible.Target 12.3 By 2030, halve per capita global food waste at the retail and consumer levels and reduce food losses along production and supply chains, including post-harvest losses
Contributor Name Specification Source Entity Tier Priority InterlinkagesSuggested Indicator Global Food Loss Index (GFLI) Tier II
Indicator 12.3.1 Global Food Loss Index (GFLI) ( CBB ) IFAD 1
FAO 1
Indicator 12.3.2 Per capita food waste (kg/year), measured using Food Loss and Waste Protocol ( CBB ) UNEP 1 1.5, 2.4, 8.4
Contributor Name Specification Source Entity Tier Priority InterlinkagesSuggested Indicator Tier I Applicable to target 17.14
Indicator 12.4.1 Number of Parties to, and number of national reports on the implementation of, international multilateral environmental agreements on hazardous chemicals and waste ( BBB ) UNEP 1 Applicable to target 17.14
IUCN 1
The indicator is primarily model-based. The calculation of the indicator relies on primary data collected from government agencies in the Agricultural Production Questionnaire or harvested from official publications and other sources.
FAO will compile the indicator on a regular basis as part of the Food Balance Sheets in FAOSTAT
The indicator measures the totality of losses occurring from the time at which production of an agricultural product is recorded until it reaches the final consumer as food.
The indicator is primarily model-based. The calculation of the indicator relies on primary data collected from government agencies in the Agricultural Production Questionnaire or harvested from official publications and other sources.
FAO will compile the indicator on a regular basis as part of the Food Balance Sheets in FAOSTAT
data availability and quality currently poor, baseline needs to be established in order to track percentage reduction. The Food Loss Index will be integrated into the Protocol, and it includes good data on food loss.
Target 12.4 By 2020, achieve the environmentally sound management of chemicals and all wastes throughout their life cycle, in accordance with agreed international frameworks, and significantly reduce their release to air, water and soil in order to minimize their adverse impacts on human health and the environment
Number of Parties to international multilateral environmental agreements on hazardous and other chemicals and waste that meet their commitments and obligations in transmitting information as required by each relevant agreement
Very good availability of information through the Secretariat of the Basel, Rotterdam and Stockholm Conventions, SAICM, Minamata Convention, and Montreal Protocol(Ozone).
Secretariat of the Basel, Rotterdam and Stockholm Conventions, Interim Secretariat of the Minamata Convention, SAICM Secretariat . Countries covered: 183 Parties of the Basel Convention, 154 Parties to the Rotterdam Convention and 179 countries to the Stockholm Convention; Montreal Protocol Data are available for up to 196 countries.
Modified : [Number of Parties to international multilateral environmental agreements on hazardous and other chemicals and waste that meet their commitments and obligations in transmitting information as required by each relevant agreement]
Very good availability of information through the Secretariat of the Basel, Rotterdam and Stockholm Conventions, SAICM, Minamata Convention, and Montreal Protocol(Ozone).
Secretariat of the Basel, Rotterdam and Stockholm Conventions, Interim Secretariat of the Minamata Convention, SAICM Secretariat . Countries covered: 183 Parties of the Basel Convention, 154 Parties to the Rotterdam Convention and 179 countries to the Stockholm Convention; Montreal Protocol Data are available for up to 196 countries.
Proposed additional/alternative indicator: Indicators of pollution control could usefully be supplemented by an indicator of pollution impacts on nature, such as the [“Red List Index (impacts of pollution)”]. The Red List Index is used as an indicator towards Aichi Target 12 (http://www.bipindicators.net/rli/2010).
Data sources: IUCN Red List of Threatened Species (http://www.iucnredlist.org/); specifically for species coded under “9 Pollution” in the Threats Classification Scheme (http://www.iucnredlist.org/technical-documents/classification-schemes/threats-classification-scheme).
Responsible entities and national availability: IUCN Red List Partnership (http://www.iucnredlist.org/partners/partners-and-technical-support). Available globally since 1980s, and can be disaggregated to national and regional levels (Rodrigues et al. 2014 PLoS ONE 9(11): e113934).
15.5 (and disaggregated versions for other targets)

List of Indicator Proposals - p. 208 of 265
List of Proposals* Note on Disaggregation: All indicators should be disaggregated by sex, age, residence (U/R) and other characteristics, as relevant and possible.Indicator 12.4.2 Annual average levels of selected contaminants in air, water and soil from industrial sources, energy generation, agriculture, transport and wastewater and waste treatment plants ( BBA )
UNEP Targets 6.3, 12.4, 14.1
WB
Data on nitrogen surplus, nitrogen deposition, loss of reactive nitrogen to the environment can be obtained from : http://bipindicators.net/nitrogendposition Data on POPs and hazardous wastes can be obtained from National reports under the Basel, Rotterdam and Stockholm Conventions .
International Nitrogen Initiative (Indicator under the BIP) and Secretariat of the Basel, Rotterdam and Stockholm Conventions (partly). Countries covered: 183 Parties of the Basel Convention, 154 Parties to the Rotterdam Convention and 179 countries to the Stockholm Convention
Indicator 12.4.2 will need a lot of careful thinking about the data sources and processing. There will be big differences in monitoring and analytical quality between countries, and data may be diverse and hard to standardize and compare. It may be necessary to issue very details instructions on which parameters to measure, where, how, how frequently and how to format the data.

List of Indicator Proposals - p. 209 of 265
List of Proposals* Note on Disaggregation: All indicators should be disaggregated by sex, age, residence (U/R) and other characteristics, as relevant and possible.Target 12.5 By 2030, substantially reduce waste generation through prevention, reduction, recycling and reuse
Contributor Name Specification Source Entity Tier Priority InterlinkagesSuggested Indicator National recycling rate, tonnes of material recycled Tier II Applicable to target 11.6
Indicator 12.5.1 National waste generation (solid waste to landfill and incineration and disaggregated data for e-waste) in kg per capita/year ( BAA ) UNEP Applicable to target 11.6
Indicator 12.5.2 National recycling rate, tonnes of material recycled ( BAA ) UNEP ADD: Share of the re-used goods on the market
WB
UNSD National recycling rate, tonnes of material recycled 1
For national recycling rate: poor data availability and quality, waste and recycling statistics not well standardized, waste amount often underestimated; for 're-used goods': data availability and quality unknown, no info about such data collection so far. But Basel Convention (National reports) include information on the generation of hazardous and other wastes, also with the indication which wastes are destined for recycling and which are for disposal).
Secretariat of the Basel, Rotterdam and Stockholm Conventions (partly). Countries covered: 183 Parties of the Basel Convention, 154 Parties to the Rotterdam Convention and 179 countries to the Stockholm Convention, UNSD
Alternatives: [Waste generation rates (kg per capita/year, overall and by economic sector and waste type); Percentage of hazardous wastes and other wastes, including obsolete stockpiles of pesticides, recovered, reused and recycled, and disposed; Number of facilities for environmentally sound management of hazardous waste; E-waste collection rate]
Basel Convention (National reports include information on the generation of hazardous and other wastes, also with the indication which wastes are destined for recycling and which are for disposal) and UNU (Step Initiative)
Secretariat of the Basel, Rotterdam and Stockholm Conventions (partly). Countries covered: 183 Parties of the Basel Convention, 154 Parties to the Rotterdam Convention and 179 countries to the Stockholm Convention
For national recycling rate: poor data availability and quality, waste and recycling statistics not well standardized, waste amount often underestimated; for 're-used goods': data availability and quality unknown, no info about such data collection so far. But Basel Convention (National reports) include information on the generation of hazardous and other wastes, also with the indication which wastes are destined for recycling and which are for disposal).
Secretariat of the Basel, Rotterdam and Stockholm Conventions (partly). Countries covered: 183 Parties of the Basel Convention, 154 Parties to the Rotterdam Convention and 179 countries to the Stockholm Convention
Applicable to targets 8.4, 11.6, 12.3
Indicator 12.5.2 could include percentage of waste going towards waste to energy schemes (waste incinerators with coupled power or heat generation)
Solid waste accounts in the SEEA Central Framework are useful in organizing information on the generation of solid waste and the management of flows of solid waste to recycling facilities, to controlled landfills or directly to the environment. Measures of the amount of waste in aggregate or of quantities of specific waste materials are important indicators of environmental pressures. The construction of solid waste accounts allows these indicators to be place in a broader context with economic data in both physical and monitoring terms.
The SEEA accounts highlight various activities of the waste collection, treatment and disposal industry that include landfill operation, incineration of solid waste, recycling and reuse activities and other treatment of solid waste
In sum, the accounts allows the compilation of indicators related to this target including the volume of solid waste recycled, the volume of national waste generation disaggregated by industry, etc.
Please refer to Chapter 3.6.5 in the SEEA Central Framework for more information on the solid waste accounts

List of Indicator Proposals - p. 210 of 265
List of Proposals* Note on Disaggregation: All indicators should be disaggregated by sex, age, residence (U/R) and other characteristics, as relevant and possible.Target 12.6 Encourage companies, especially large and transnational companies, to adopt sustainable practices and to integrate sustainability information into their reporting cycle
Contributor Name Specification Source Entity Tier Priority InterlinkagesSuggested Indicator Number of companies publishing sustainability reporting UNEP, GRI Tier I 12.8
UNEP 2
UNWOMEN UN Women fully supports this indicator. WB
Indicator 12.6.2 Number or % of companies that produce sustainability reports or include sustainability information in integrated reporting ( CBB ) UNEP 1 12.8
WB
Target 12.7 Promote public procurement practices that are sustainable, in accordance with national policies and priorities Contributor Name Specification Source Entity Tier Priority Interlinkages
Suggested Indicator UNEP Tier II 8.4, 12.2
Indicator 12.7.1 Number of countries implementing Sustainable Public Procurement policies and action plans ( CBB ) UNEP 1 8.4, 12.2
Indicator 12.7.2 % of Sustainable Public Procurement in total public procurement for a set of prioritized product groups ( CBB ) UNEP ADD: Impact of SPP on CO2 Emissions 2
Very Good; GRI, IIRC, UNGC or SASB all have data oncompany reporting and reporting content (though this would need to be pulled together and mapped against the companies listed in the Fortune Global 500
Indicator 12.6.1 Sustainability reporting rate and quality: 1) Percentage of the world's largest companies disclosing sustainability information 2) the % of such reporting which is addressing the entire supply chain ; 3) % of the reporting companies with information in their sustainability reporting aligned with relevant indicators in the SDGs ( CBB ) replace with: [Market share of goods and services certified by independently verified
sustainability labelling scheme] (covering 12.8 as well)related to 'market share' indicator: Poor; lack of data from retailers and consumer goods manufacturers, especially on a per country basis
market share' indicator: 8.5
Would it make sense to define the size of the targeted companies? If so, by which criteria? E.g. Output? Employees? Turnover?
revise: [Number of companies publishing sustainability reporting] Very Good; GRI, IIRC, UNGC or SASB all have data on company reporting and reporting content (though this would need to be pulled together and mapped against the companies listed in the Fortune Global 500
Would it make sense to define the size of the targeted companies? If so, by which criteria? E.g. Output? Employees? Turnover?
Number of countries implementing Sustainable Public Procurement policies and action plans
Medium. Easy access to adopted policies and action plans – more difficult to have proof of implementation
Medium. Easy access to adopted policies and action plans – more difficult to have proof of implementation
for %of SPP: Poor; developed at a pilot level. Issues with availability ofprocurement data, selection of criteria and product groups; for CO2 emissions: Poor; developed at a pilot level. Issue with the availabilityof procurement data
% of SPP in total PP': 8.4, 12.2; 'CO2 emissions: 8.4, 7.2

List of Indicator Proposals - p. 211 of 265
List of Proposals* Note on Disaggregation: All indicators should be disaggregated by sex, age, residence (U/R) and other characteristics, as relevant and possible.Target 12.8 By 2030, ensure that people everywhere have the relevant information and awareness for sustainable development and lifestyles in harmony with nature
Contributor Name Specification Source Entity Tier Priority InterlinkagesSuggested Indicator Tier III
Indicator 12.8.1 Number of countries reporting inclusion of sustainable development and lifestyles topics in formal education curricula ( BBB ) UNEP 1
WB
UNFPA
Indicator 12.8.2 Frequency of researches online for key words with direct links with sustainable development and lifestyles ( CBB ) UNEP 2 4.7, 8.4,
WB
Target 12.a Support developing countries to strengthen their scientific and technological capacity to move towards more sustainable patterns of consumption and production Contributor Name Specification Source Entity Tier Priority Interlinkages
Suggested Indicator Number of qualified green patent applications WIPO Tier III 8.9, 14.7
Indicator 12.a.1 Amount of spending on R&D in developing countries, for SCP ( BBB ) UNEP 2 17.7, 17.8, 17.18
Indicator 12.a.2 Number of patents granted annually in developing countries, for SCP products / innovations ( BBB ) UNEP WIPO 1 17.7, 17.8
Number of countries reporting inclusion of sustainable development and lifestyles topics in formal education curricula
Data availability is poor. One source focusing on biodiversity is the Biodiversity Barometer (http://www.bipindicators.net/biodiversitybarometer) but other sources are still under development.
Union for Ethical Biotrade (Indicator under the BIP)
Targets 4.1, 4.7 , 8.4, 12.1, and 12.8
Data availability is poor. One source focusing on biodiversity is the Biodiversity Barometer (http://www.bipindicators.net/biodiversitybarometer) but other sources are still under development.
Union for Ethical Biotrade (Indicator under the BIP)
Targets 4.1, 4.7 , 8.4, 12.1, and 12.8
We refer to earlier comments on indicator 4.7.1, and the need to ‘ask the right questions in the right way” to really find out about people’s awareness and understanding of “sustainability”. The term might have very different shades and meanings across countries and cultures.
Suggested specification of 12.8.1 (or alternative to 12.8.2 to help improve rating): [Percentage of education institutions providing Education for Sustainable Development UNESCO global module (all eleven components, ranging from biodiversity and climate, to disaster risk reduction and sustainable lifestyles, to health promotion and cultural diversity, together offering a holistic approach).]
UNESCO ESD is a global mechanism (as compared to UNECE ESD, which is regional).UNESCO ESD:http://www.unesco.org/new/en/education/themes/leading-the-international-agenda/education-for-sustainable-development/UNECE ESD:http://www.unece.org/environmental-policy/education-for-sustainable-development/about-the-strategy-for-esd/the-strategy.html
No data for now – but data could be easily gathered through a searchengine, analysing search query data
Excellent approach for data collection. Can this be done for other indicators dealing with “popular awareness”? The only caveat we see is that it should be normalized by the rate of internet access, and a presumed bias of higher education levels having better www access.
Poor; however, different patent granting norms prevail across countriesGreen/SCP related patents can be selected from these databases
revise: [R&D spending in environmentally sound technologies] Poor; reported on an annual basis, but there is a paucity of data for developing countries. R&D for environmentally sound technologies need to be selected from R&D spending for the environment
revise: [Number of qualified green patent applications] Poor; however, different patent granting norms prevail across countriesGreen/SCP related patents can be selected from these databases

List of Indicator Proposals - p. 212 of 265
List of Proposals* Note on Disaggregation: All indicators should be disaggregated by sex, age, residence (U/R) and other characteristics, as relevant and possible.Target 12.b Develop and implement tools to monitor sustainable development impacts for sustainable tourism that creates jobs and promotes local culture and products
Contributor Name Specification Source Entity Tier Priority InterlinkagesSuggested Indicator to be developed: National Statistical Offices Tier III
Indicator 12.b.1 Percentage of the destinations with a sustainable tourism strategy/action plan, with agreed monitoring, development control and evaluation arrangement ( CBB ) UNEP 2 8.9, 14.7
UNWTO to be developed: National Statistical Offices 1
Indicator 12.b.2 Adopted national legislation to integrate sustainability objectives in tourism operations ( BBB ) UNEP 1 8.9, 14.7
UNWTO to be developed: National Statistical Offices 2
Contributor Name Specification Source Entity Tier Priority InterlinkagesSuggested Indicator IEA Tier II 13.2
Indicator 12.c.1 Amount of fossil fuel subsidies, per unit of GDP (production and consumption), and as proportion of total national expenditure on fossil fuels ( BBB ) UNEP IEA 1 13.2
UNSD UNSD 1
Residual flows generated as a result of tourism direct GDP (derived from an extended version of the System of Environmental-Economic Accounting (SEEA) for tourism)
World Tourism Organisation (UNWTO) does not collect this data since the conceptual framework is not yet in place.
Good in Europe, Eurostat already monitors energy and emissions by sector, as well as municipal waste. However, in many countries tourism is not disaggregated from services, and data may be misleading
Proposed alternative and to be developed indicator: [Residual flows generated as a result of tourism direct GDP (derived from an extended version of the System of Environmental-Economic Accounting (SEEA) for tourism) ]
World Tourism Organisation (UNWTO) does not collect this data since the conceptual framework is not yet in place.
Revise: [ADOPTED NATIONAL POLICIES TO FRAME SUSTAINABILITY IN TOURISM OPERATION ]
Poor; opportunity to monitor this on the national level together with other areas on tourism
Proposed alternative and to be developed indicator: [Resources used and resource efficiency in the production of tourism products and services (derived from an extended version of the System of Environmental-Economic Accounting (SEEA) for tourism) ]
World Tourism Organisation (UNWTO) does not collect this data since the conceptual framework is not yet in place.
Target 12.c Rationalize inefficient fossil-fuel subsidies that encourage wasteful consumption by removing market distortions, in accordance with national circumstances, including by restructuring taxation and phasing out those harmful subsidies, where they exist, to reflect their environmental impacts, taking fully into account the specific needs and conditions of developing countries and minimizing the possible adverse impacts on their
Amount of fossil fuel subsidies, per unit of GDP (production and consumption), and as proportion of total national expenditure on fossil fuels
Good; EA is estimating fossil fuel subsidies in a regular manner, within the framework of the World Energy Outlook with database. Considerably less information on producer subsidies.
Good; EA is estimating fossil fuel subsidies in a regular manner, within the framework of the World Energy Outlook with database.Considerably less information on producer subsidies, no agreed methodology to benchmark them
SEEA Energy
Methodology related to data on energy taxes and subsidies are discussed in Ch 4 of SEEA CF as well as in SEEA Energy. Input data to populate the various energy taxes and subsidies tables come from the national accounts.

List of Indicator Proposals - p. 213 of 265
List of Proposals* Note on Disaggregation: All indicators should be disaggregated by sex, age, residence (U/R) and other characteristics, as relevant and possible.
Target 13.1 Strengthen resilience and adaptive capacity to climate-related hazards and natural disasters in all countries Contributor Name Specification Source Entity Tier Priority Interlinkages
Suggested Indicator National Disaster Loss Databases, 85 (will be more than 115 by 2016) UNISDR Tier II 1.5, 11.5, 14.2, 15.3
Indicator 13.1.1 # of countries that report having progressed from a perceived low to an intermediate or from an intermediate to a high level of adaptive capacity in relation to a two-degree world ( CBB ) UNEP
UNISDR National Disaster Loss Databases, 85 (will be more than 115 by 2016) UNISDR 1 11.5, 1.5, 14.2, 15.3
UNWOMEN
IUCN 2
WB
Indicator 13.1.2 # of casualties and amount of economic losses ( BBB ) UNISDR National Disaster Loss Databases, 85 (will be more than 115 by 2016) UNISDR 2 11.5, 1.5, 14.2, 15.3, 2.4
Goal 13 Take urgent action to combat climate change and its impacts (Acknowledging that the United Nations Framework Convention on Climate Change is the primary international, intergovernmental forum for negotiating the global response to climate change.)
Number of deaths, missing people, injured, relocated or evacuated due to disasters per 100,000 people.
[Decrease in the ratio of vulnerable vs resilient (in terms of death and impact) sub-population (disaggregated+D12, poor) to exposure of climate-related extreme events and other economic, social and environmental shocks and disasters, (and food safety, cf target 2.1 and 2.4) ]
National Population Areas (geographically defined) ** Area impacted by drought event/risk: - http://www.munichre.com/en/homepage/index.html ; - http://preview.grid.unep.ch/index.php?preview=data&lang=eng ; - http://www.pdc.org/ ; - https://www.ifrc.org/en/what-we-do/disaster-management/about-disasters/definition-of-hazard/industrial-accidents/ ** Area impacted by flooding event/risk ; - http://www.dartmouth.edu/~floods/Dataaccess.htm ; - http://preview.grid.unep.ch/index.php?preview=data&lang=eng ; - http://www.munichre.com/en/homepage/index.html ; - http://www.pdc.org/ ; - https://www.ifrc.org/en/what-we-do/disaster-management/about-disasters/definition-of-hazard/industrial-accidents/ ** Area impacted by storm surge event/ risk ; - http://preview.grid.unep.ch/index.php?preview=data&lang=eng ; - http://www.munichre.com/en/homepage/index.html ; - http://www.pdc.org/ ; - https://www.ifrc.org/en/what-we-do/disaster-management/about-disasters/definition-of-hazard/industrial-accidents/ ** Area im+E265pacted by tsunami event/risk+E258 ; - http://preview.grid.unep.ch/index.php?preview=data&lang=eng ; - http://www.munichre.com/en/homepage/index.html ; - http://www.tsunami.noaa.gov/observations_data.html ; - http://www.pdc.org/ ; - https://www.ifrc.org/en/what-we-do/disaster-management/about-disasters/definition-of-hazard/industrial-accidents/ ** Area impacted by heat wave event/risk: - http://www.pdc.org/ ; - https://www.ifrc.org/en/what-we-do/disaster-management/about-disasters/definition-of-hazard/industrial-accidents/
Multi-purpose Indicator Targets 1.5 - 2.1 - 2.4 - 11.5 -
13.1
UNISR proposes [Number of deaths, missing people, injured, relocated or evacuated due to disasters per 100,000 people]. Please see UNISDR input paper attached."
Suggested addition to indicator from UN Women: [also monitor number of countries that identify women as key stakeholders and gender equality as a priority.]
Proposed additional/alternative indicator: Indicators of climate change adaptation could usefully be supplemented by an indicator of climate change vulnerability, such as the [“Red List Index (impacts of climate change)”]. The Red List Index is used as an indicator towards Aichi Target 12 (http://www.bipindicators.net/rli/2010).
Data sources: IUCN Red List of Threatened Species (http://www.iucnredlist.org/); specifically for species coded under “11 Climate change & severe weather” in the Threats Classification Scheme (http://www.iucnredlist.org/technical-documents/classification-schemes/threats-classification-scheme).
Responsible entities and national availability: IUCN Red List Partnership (http://www.iucnredlist.org/partners/partners-and-technical-support). Available globally since 1980s, and can be disaggregated to national and regional levels (Rodrigues et al. 2014 PLoS ONE 9(11): e113934).
15.5 (and disaggregated versions for other targets)
It is unclear what stands behind “adaptive capacity”, but it looks like a complex amalgamate of a plethora of information, criteria, sub-indicators and subjective judgment. We are not sure it will be workable or meaningful. Would it be possible to define sectoral indicators, that could serve as proxies for overall adaptive capacity in a country? E.g. pick out agriculture / irrigation, water supply / management, and energy production as representative sectors?
UNISR proposes refinement into [\Direct disaster economic loss in relation to global gross domestic product"]. Please see UNISDR input paper attached. "

List of Indicator Proposals - p. 214 of 265
List of Proposals* Note on Disaggregation: All indicators should be disaggregated by sex, age, residence (U/R) and other characteristics, as relevant and possible.Target 13.2 Integrate climate change measures into national policies, strategies and planning
Contributor Name Specification Source Entity Tier Priority InterlinkagesSuggested Indicator Tier II Target 17.16
Indicator 13.2.1 # of countries which have formally communicated the establishment of integrated low-carbon, climate-resilient, disaster risk reduction development strategies (e.g. a national adaptation plan process) ( BAA ) UNEP Target 17.16
UNICEF
UNISDR UNISDR 1 13.1,9.1,11.5
UNWOMEN
Target 13.3 Improve education, awareness-raising and human and institutional capacity on climate change mitigation, adaptation, impact reduction and early warning Contributor Name Specification Source Entity Tier Priority Interlinkages
Suggested Indicator UNICEF Tier III
Indicator 13.3.1 # of countries that have integrated mitigation, adaptation, impact reduction and early warning into primary, secondary and tertiary curricula ( CBB ) UNICEF
UNISDR UNISDR 1 15.3, 2.4, 11.5, 13.1
Indicator 13.3.2 % of population with increased knowledge on climate change, disaggregated by sex and age ( BBB ) UNICEF
Contributor Name Specification Source Entity Tier Priority InterlinkagesSuggested Indicator UNFCCC Tier I
Indicator 13.a.1 Mobilized amount of USD per year starting in 2020 accountable towards the USD 100 billion commitment ( CBB ) WB
Indicator 13.a.2 % of GCF funded projects finalized and sustained afterwards through national funding to produce climate neutral solutions ( CBB )
Contributor Name Specification Source Entity Tier Priority InterlinkagesSuggested Indicator OECD Tier III
Indicator 13.b.1 # of LDCs that are receiving specialized support for mechanisms for raising capacities for effective climate change related planning and management, including focusing on women, youth, local and marginalized communities ( CBB )
Number of countries that have formally communicated the establishment of integrated low-carbon, climate-resilient, disaster risk reduction development strategies (e.g. a national adaptation plan process, national policies and measures to promote transition to environmentally-friendly substances and technologies).
Comment: The additional text proposed in the modified indicator aims to highlight the mitigation aspects of the relevant strategies. Information from National reports of relevant conventions
Secretariats for IMEAs. Under the Montreal Protocol, such policies have been communicated by over 40 countries so far.
MODIFIED: [Number of countries that have formally communicated the establishment of integrated low-carbon, climate-resilient, disaster risk reduction development strategies (e.g. a national adaptation plan process, national policies and measures to promote transition to environmentally-friendly substances and technologies).]
Comment: The additional text proposed in the modified indicator aims to highlight the mitigation aspects of the relevant strategies. Information from National reports of relevant conventions
Secretariats for IMEAs. Under the Montreal Protocol, such policies have been communicated by over 40 countries so far.
[# of countries which have formally communicated the establishment of integrated low-carbon, climate-resilient, disaster risk reduction development strategies (e.g. a national adaptation plan process)]
UNISR proposes \[Number of countries with national DRR strategies in line with Sendai Framework for Disaster Risk Reduction"]. Please see UNISDR input paper attached."
SFDRR Monitor (to be developed), 0 (but HFA Monitor covered 133 countries in 2013)
Suggested addition to indicator from UN Women: [also monitor number of countries that identify women as key stakeholders and gender equality as a priority.]
Number of countries that have integrated mitigation, adaptation, impact reduction and early warning into primary, secondary and tertiary curricula
[Number of countries that have integrated mitigation, adaptation, impact reduction and early warning into primary, secondary and tertiary curricula ]
UNISR proposes \[Number of countries that have probabilistic risk assessment profile and early warning system against major hazards that the country faces"]. Please see UNISDR input paper attached."
SFDRR Monitor (to be developed), 0 (but HFA Monitor covered 133 countries in 2013)
[% of population with increased knowledge on climate change, disaggregated by sex and age ]
Target 13.a Implement the commitment undertaken by developed-country parties to the United Nations Framework Convention on Climate Change to a goal of mobilizing jointly $100 billion annually by 2020 from all sources to address the needs of developing countries in the context of meaningful mitigation actions and transparency on implementation and fully operationalize the Green Climate Fund through its capitalization as soon as possible
Mobilized amount of USD per year starting in 2020 accountable towards the USD 100 billion commitment
This indicator assumes that someone actually knows how to best spent the 100 Billion commitment. Else this indicator does not really relate to “implementation” but mainly to “intention”.
Target 13.b Promote mechanisms for raising capacity for effective climate change-related planning and management in least developed countries, including focusing on women, youth and local and marginalized communities
Number of LDCs that are receiving specialized support for mechanisms for raising capacities for effective climate change related planning and management, including focusing on women, youth, local and marginalized communities

List of Indicator Proposals - p. 215 of 265
List of Proposals* Note on Disaggregation: All indicators should be disaggregated by sex, age, residence (U/R) and other characteristics, as relevant and possible.Goal 14 Conserve and sustainably use the oceans, seas and marine resources for sustainable development Target 14.1 By 2025, prevent and significantly reduce marine pollution of all kinds, in particular from land-based activities, including marine debris and nutrient pollution
Contributor Name Specification Source Entity Tier Priority InterlinkagesSuggested Indicator Nitrogen use efficiency composite indicator GPNM and the European Nitrogen Expert Panel) (sources will be identified) Tier IIIIndicator 14.1.1 Fertilizer consumption (kg/ha of arable land) ( BBA )
UNEP GPNM and the European Nitrogen Expert Panel) (sources will be identified)
WB
Indicator 14.1.2 Metric tonnes per year of plastic materials entering the ocean from all sources ( CBB ) IUCN 2
Contributor Name Specification Source Entity Tier Priority InterlinkagesSuggested Indicator (sources will be identified) Tier III
Indicator 14.2.1 Percentage of coastline with formulated and adopted ICM/MSP plans ( CBB ) UNISDR National Disaster Loss Databases, 85 (will be more than 115 by 2016) UNISDR 1 11.5, 13.1, 1.5, 15.3
UNEP (sources will be identified)
IUCN 1
Indicator 14.2.2 Ocean Health Index ( CBB ) UNEP http://www.oceanhealthindex.org/ Targets 14.1 and 14.2
UNISDR National Disaster Loss Databases, 85 (will be more than 115 by 2016) UNISDR 2 11.5, 13.1, 1.5, 15.3, 2.4
IUCN 2
Alternative: [Nitrogen use efficiency composite indicator] - reflects the N input, the N output, the output/input ratio, and the N surplus/deficit.
Inaccurate measure of nutrient pollution. Fertilizer consumption in some African countries will likely increase (currently consumption is very low), so would not include this as indicator with target that fertilizer consumption will decline in all countries.
Proposed additional/alternative indicator: Indicators of pollution sources could usefully be supplemented by an indicator of pollution impacts on nature, such as the [“Red List Index (impacts of pollution on marine species)”]. The Red List Index is used as an indicator towards Aichi Target 12 (http://www.bipindicators.net/rli/2010).
Data sources: IUCN Red List of Threatened Species (http://www.iucnredlist.org/); specifically for species coded as “Marine” and under "9 Pollution" in the Threats Classification Scheme (http://www.iucnredlist.org/technical-documents/classification-schemes/threats-classification-scheme).
Responsible entities and national availability: IUCN Red List Partnership (http://www.iucnredlist.org/partners/partners-and-technical-support). Available globally since 1980s, and can be disaggregated to national and regional levels (Rodrigues et al. 2014 PLoS ONE 9(11): e113934).
15.5 (and disaggregated versions for other targets)
Target 14.2 By 2020, sustainably manage and protect marine and coastal ecosystems to avoid significant adverse impacts, including by strengthening their resilience, and take action for their restoration in order to achieve healthy and productive oceans
% of coastal and marine development (to be defined) with formulated or implemented ICM/MSP plans (that are harmonized where applicable), based on an ecosystem approach, that builds resilient human communities and ecosystems and provides for equitable benefit sharing and decent work
UNEP will be monitoring a similar indicator under its Programme of Work 2016-2017 adopted by Member States. The process can support monitoring of revised indicator 14.2.1.
UNISR proposes \[Number of mortality, missing, injured, relocated or evacuated due to disasters per 100,000"]. Please see UNISDR input paper attached."
[% of coastal and marine development (to be defined) with formulated or implemented ICM/MSP plans (that are harmonized where applicable), based on an ecosystem approach, that builds resilient human communities and ecosystems and provides for equitable benefit sharing and decent work]
UNEP will be monitoring a similar indicator under its Programme of Work 2016-2017 adopted by Member States. The process can support monitoring of revised indicator 14.2.1.
Proposed additional/alternative indicator: IUCN suggests strengthening indicators proposed for 14.2 with the [“Red List Index (marine species)”]. The Red List Index is used as an indicator towards Aichi Target 12 (http://www.bipindicators.net/rli/2010).
Data sources: IUCN Red List of Threatened Species (http://www.iucnredlist.org/); specifically for species coded as “Marine”.
Responsible entities and national availability: IUCN Red List Partnership (http://www.iucnredlist.org/partners/partners-and-technical-support). Available globally since 1980s, and can be disaggregated to national and regional levels (Rodrigues et al. 2014 PLoS ONE 9(11): e113934).
15.5 (and disaggregated versions for other targets)
[Ocean Health Index] ( http://www.bipindicators.net/oceanhealthindex ) National Centre for Ecological Analysis and Synthesis (NCEAS) (Indicator under the BIP) ( https://www.nceas.ucsb.edu/ )
UNISR proposes change into \[Direct disaster economic loss in relation to global gross domestic product]". Please see UNISDR input paper attached. "
Proposed additional/alternative indicator: IUCN suggests strengthening indicators proposed for 14.2 with ["Coverage by protected areas of marine sites of particular importance for biodiversity"], using Key Biodiversity Areas to identify these. The indicator is used by the BIP as an indicator towards Aichi Target 11 (http://www.bipindicators.net/paoverlays).
Data sources: Protected Planet (http://www.protectedplanet.net/) for protected areas data; Important Bird & Biodiversity Areas (http://www.birdlife.org/datazone/site) and Alliance for Zero Extinction sites (http://www.zeroextinction.org/) for Key Biodiversity Areas data; indicator developed by Butchart et al. (2012) PLoS ONE 7(3): e32529.
Responsible entities and national availability: IUCN & UNEP-WCMC, BirdLife International, AZE. Available globally since 1950s, and can be disaggregated to national and regional levels.
15.1 (and disaggregated versions for other targets)
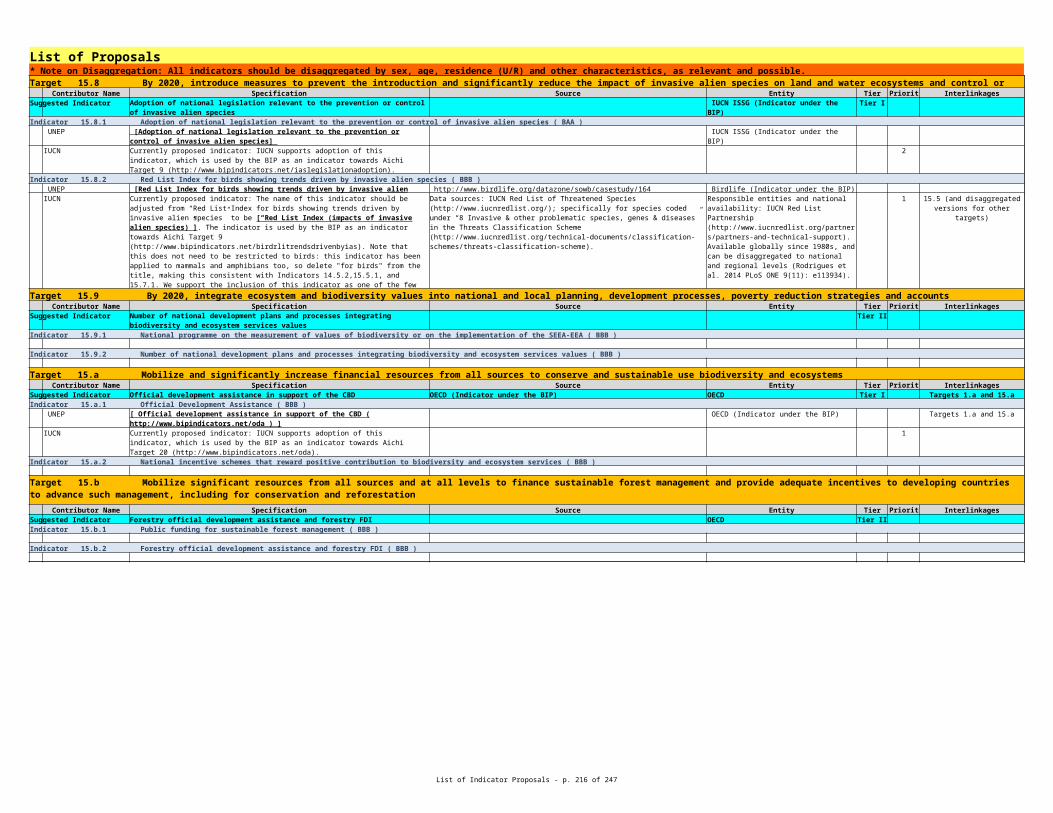
List of Indicator Proposals - p. 216 of 265
List of Proposals* Note on Disaggregation: All indicators should be disaggregated by sex, age, residence (U/R) and other characteristics, as relevant and possible.Target 14.3 Minimize and address the impacts of ocean acidification, including through enhanced scientific cooperation at all levels
Contributor Name Specification Source Entity Tier Priority InterlinkagesSuggested Indicator Tier II
Indicator 14.3.1 Average marine acidity (pH) measured at agreed suite of representative sampling stations ( CBB ) IUCN 2
UNSD 1
Indicator 14.3.2 Coral coverage ( CBB ) UNEP
WB
Average marine acidity (pH) measured at agreed suite of representative sampling stations
Marine acidity – SEEA Experimental Ecosystem Accounting condition accounts for Marine and coastal areas can be used as measurement framework for acidity.
Proposed additional/alternative indicator: IUCN suggests strengthening indicators proposed for 14.3 with the [“Red List Index (corals)”]. The Red List Index is used as an indicator towards Aichi Target 12 (http://www.bipindicators.net/rli/2010).
Data sources: IUCN Red List of Threatened Species (http://www.iucnredlist.org/); specifically for coral species (Carpenter et al. 2008 Science 321: 560–563).
Responsible entities and national availability: IUCN Red List Partnership (http://www.iucnredlist.org/partners/partners-and-technical-support). Available globally since 1980s, and can be disaggregated to national and regional levels (Rodrigues et al. 2014 PLoS ONE 9(11): e113934).
15.5 (and disaggregated versions for other targets)
Average marine acidity (pH) measured at agreed suite of representative sampling stations
Marine acidity – SEEA Experimental Ecosystem Accounting condition accounts for Marine and coastal areas can be used as measurement framework for acidity.
Modification: [Change in area coverage of coral functional groups. (Total coral cover itself provides limited information on health/productivity in context of acidification. )]
Important to verify if there is a baseline available, against which to compare? Same goes for indicator 14.1.1. Else this would mean that we are only starting to observe a trend, that could take years to become clear and attributable to causal factors

List of Indicator Proposals - p. 217 of 265
List of Proposals* Note on Disaggregation: All indicators should be disaggregated by sex, age, residence (U/R) and other characteristics, as relevant and possible.
Contributor Name Specification Source Entity Tier Priority InterlinkagesSuggested Indicator Proportion of fish stocks within biologically sustainable level Tier I
Indicator 14.4.1 Fish species, threatened ( BAA ) IFAD FAO 2 14.6
Target 14.4 By 2020, effectively regulate harvesting and end overfishing, illegal, unreported and unregulated fishing and destructive fishing practices and implement science-based management plans, in order to restore fish stocks in the shortest time feasible, at least to levels that can produce maximum sustainable yield as determined by their biological characteristics
FAO has estimates for 584 fish stocks around world, representing 70% of global landings.
FAO has maintained and reported this indicator since 1974. The assessment is done at global level, not at country level, so is not comparable among countries
During the Sixteenth Meeting of the UN Open-ended informal consultative process on Oceans and the Law of the Sea, April 6-10, member states frequently mentioned the omission of an indicator on IUU fishing for SDG 14, an issue cited as being directly relevant to the three dimensions of sustainability. In view of this, FAO proposes the following indicator for target 14.6, which is also relevant for target 14.6:[ \Progress by countries in the implementation of international instruments aiming to combat IUU fishing"]. The indicator focuses on the effort to combat IUU fishing through the effective implementation of key international instruments related to IUU fishing. The indicator is based on FAO member country responses to the Code of Conduct for Responsible Fisheries (CCRF) survey questionnaire which is circulated by FAO every two years to members and IGOs and INGOs. This indicator is calculated on the basis of the efforts being made by countries to implement key international instruments aiming to combat IUU fishing, as reported in a given year of the survey. The indicator variables are the development and implementation of national plan of action (NPOA) to combat IUU fishing in line with the IPOA-IUU; Ratification and implementation of the 2009 FAO Agreement on Port State Measures; Ratification and implementation of the 1993 FAO Compliance Agreement. The weight given to each of the variables in calculating the indicator value are as follows: Variable 1 - 40%; Variable 2 - 40%; Variable 3 - 20%. The absence of an NPOA and the lack of ratification of the binding Agreements will automatically result in a "zero" score for the respective variables, unless there is evidence that efforts to address the matter are being made (in which case some points are awarded). For each variable, the maximum score will be obtained if implementation is also present."
This new proposed indicator is not currently being monitored, but FAO's biannual survey on CCRF implementation already compiles responses by Members on the above mentioned instruments. Therefore, survey responses and results on this indicator could be reported and presented every two years to FAO's Committee on Fisheries (COFI). This information could serve the purposes of monitoring on Targets 14.4 and 14.6.

List of Indicator Proposals - p. 218 of 265
List of Proposals* Note on Disaggregation: All indicators should be disaggregated by sex, age, residence (U/R) and other characteristics, as relevant and possible.
FAO FAO 2 14.6During the Sixteenth Meeting of the UN Open-ended informal consultative process on Oceans and the Law of the Sea, April 6-10, member states frequently mentioned the omission of an indicator on IUU fishing for SDG 14, an issue cited as being directly relevant to the three dimensions of sustainability. In view of this, FAO proposes the following indicator for target 14.6, which is also relevant for target 14.6: ["Progress by countries in the implementation of international instruments aiming to combat IUU fishing”]. The indicator focuses on the effort to combat IUU fishing through the effective implementation of key international instruments related to IUU fishing. The indicator is based on FAO member country responses to the Code of Conduct for Responsible Fisheries (CCRF) survey questionnaire which is circulated by FAO every two years to members and IGOs and INGOs. This indicator is calculated on the basis of the efforts being made by countries to implement key international instruments aiming to combat IUU fishing, as reported in a given year of the survey. The indicator variables are the development and implementation of national plan of action (NPOA) to combat IUU fishing in line with the IPOA-IUU; Ratification and implementation of the 2009 FAO Agreement on Port State Measures; Ratification and implementation of the 1993 FAO Compliance Agreement. The weight given to each of the variables in calculating the indicator value are as follows: Variable 1 – 40%; Variable 2 – 40%; Variable 3 – 20%. The absence of an NPOA and the lack of ratification of the binding Agreements will automatically result in a “zero” score for the respective variables, unless there is evidence that efforts to address the matter are being made (in which case some points are awarded). For each variable, the maximum score will be obtained if implementation is also present.
This new proposed indicator is not currently being monitored, but FAO’s biannual survey on CCRF implementation already compiles responses by Members on the above mentioned instruments. Therefore, survey responses and results on this indicator could be reported and presented every two years to FAO’s Committee on Fisheries (COFI). This information could serve the purposes of monitoring on Targets 14.4 and 14.6.

List of Indicator Proposals - p. 219 of 265
List of Proposals* Note on Disaggregation: All indicators should be disaggregated by sex, age, residence (U/R) and other characteristics, as relevant and possible.
UNEP http://www.bipindicators.net/certifiedfisheries MSC (Indicator under the BIP) Targets 12.1, 12.6 and 14.4
IUCN 1
Indicator 14.4.2 Proportion of fish stocks within biologically sustainable limits ( BBA ) IFAD 1
FAO 1
UNEP
IUCN 2
Marine Stewardship Council engaged fisheries (Tonnage) (http://www.bipindicators.net/certifiedfisheries )
Modify currently proposed indicator: IUCN supports the adoption of this indicator, but the current formulation of this indicator as “Fish species, threatened” would be better framed as [“Red List Index (impacts of biological resource use on marine species)”]. The indicator is used by the BIP as an indicator towards Aichi Target 4 (http://www.bipindicators.net/redlistindexforbirdsmammalsandamphibians).
Data sources: IUCN Red List of Threatened Species (http://www.iucnredlist.org/); specifically for species coded as “Marine” and under “5 Biological Resource Use” in the Threats Classification Scheme (http://www.iucnredlist.org/technical-documents/classification-schemes/threats-classification-scheme).
Responsible entities and national availability: IUCN Red List Partnership (http://www.iucnredlist.org/partners/partners-and-technical-support). Available globally since 1980s, and can be disaggregated to national and regional levels (Rodrigues et al. 2014 PLoS ONE 9(11): e113934).
15.5 (and disaggregated versions for other targets)
Propose improved formulation: ["Proportion of fish stocks within biologically sustainable levels"], not limits. It is therefore slightly different from the FAO indicator 7.4 currently included in the Millennium Development Goals. The FAO Committee on Fisheries has requested changes (see the Reports of the 30th and 31st Sessions of the Committee on Fisheries (2012 and 2014) in the description of the status of the stocks based on sustainability to ensure clarify and reduce misunderstandings by the general public. The concept of "within biologically sustainable levels" means that abundance of the fish stock is at or higher than the level that can produce the maximum sustainable yield. Hence the new formulation is more in keeping with the objective of the target
FAO has estimates for 584 fish stocks around world, representing 70% of global landings.
FAO has maintained and reported this indicator since 1974. The assessment is done at global level, not at country level, so is not comparable among countries
Propose improved formulation: [“Proportion of fish stocks within biologically sustainable levels”], not limits. It is therefore slightly different from the FAO indicator 7.4 currently included in the Millennium Development Goals. The FAO Committee on Fisheries has requested changes (see the Reports of the 30th and 31st Sessions of the Committee on Fisheries (2012 and 2014) in the description of the status of the stocks based on sustainability to ensure clarify and reduce misunderstandings by the general public. The concept of “within biologically sustainable levels” means that abundance of the fish stock is at or higher than the level that can produce the maximum sustainable yield. Hence the new formulation is more in keeping with the objective of the target
FAO has estimates for 584 fish stocks around world, representing 70% of global landings.
FAO has maintained and reported this indicator since 1974. The assessment is done at global level, not at country level, so is not comparable among countries
[Proportion of fish stocks within biologically sustainable limits ( http://www.bipindicators.net/fishstocksinsafebiologicallimits )]
State of the World Marine Fishery Resources ( http://www.fao.org/fishery/sofia/en )
FAO Fisheries and Aquaculture Department - Data available from 1974 onwards (Indicator under the BIP) ( http://www.fao.org/fishery/sofia/en )
Currently proposed indicator: IUCN supports adoption of this indicator, which is used by the BIP as an indicator towards Aichi Target 6 (http://www.bipindicators.net/fishstocksinsafebiologicallimits).

List of Indicator Proposals - p. 220 of 265
List of Proposals* Note on Disaggregation: All indicators should be disaggregated by sex, age, residence (U/R) and other characteristics, as relevant and possible.Target 14.5 By 2020, conserve at least 10 per cent of coastal and marine areas, consistent with national and international law and based on the best available scientific information
Contributor Name Specification Source Entity Tier Priority InterlinkagesSuggested Indicator Coverage of protected areas World Database on Protected Areas (WDPA) UNEP-WCMC (Indicator under the BIP) Tier I
Indicator 14.5.1 Percentage area of each country's EEZ in MPA Percentage area of ABNJ in MPA Percentage area of global ocean under MPA ( CBB ) UNEP
Indicator 14.5.2 Coverage of protected areas ( BBA ) UNEP [ Coverage of protected areas ]
IUCN 1
Contributor Name Specification Source Entity Tier Priority InterlinkagesSuggested Indicator Dollar value of negative fishery subsidies against 2015 baseline UNSD Tier III
Indicator 14.6.1 Dollar value of negative fishery subsidies against 2015 baseline ( CBB ) UNSD [Dollar value of negative fishery subsidies against 2015 baseline] UNSD 1
Indicator 14.6.2 Legal framework or tax/trade mechanisms prohibiting certain forms of fisheries subsidies ( CBB )
Targets 6.6, 14.2, 14.5, 15.1 and 15.4
14.5.1 and 14.5.2 are very similar. See our supplemental note for suggestions on how to differentiate them.
World Database on Protected Areas (WDPA) ( http://www.protectedplanet.net/ )
UNEP-WCMC (Indicator under the BIP) ( http://www.unep-wcmc.org/news/new-unep-report-unveils-world-on-track-to-meet-2020-target-for-protected-areas-on-land-and-sea )
Targets 6.6, 14.2, 14.5, 15.1 and 15.4
Modify currently proposed indicator: "Coverage of protected areas" focuses solely on numeric coverage, but this is a poor measure of whether the most important places for biodiversity are protected. Suggest rewording as ["Coverage by protected areas of marine sites of particular importance for biodiversity"], using Key Biodiversity Areas to identify this. The indicator is used by the BIP as an indicator towards Aichi Target 11 (http://www.bipindicators.net/paoverlays).
Data sources: Protected Planet (http://www.protectedplanet.net/) for protected areas data; Important Bird & Biodiversity Areas (http://www.birdlife.org/datazone/site) and Alliance for Zero Extinction sites (http://www.zeroextinction.org/) for Key Biodiversity Areas data; indicator developed by Butchart et al. (2012) PLoS ONE 7(3): e32529.
Responsible entities and national availability: IUCN & UNEP-WCMC, BirdLife International, AZE. Available globally since 1950s, and can be disaggregated to national and regional levels.
15.1 (and disaggregated versions for other targets)
Target 14.6 By 2020, prohibit certain forms of fisheries subsidies which contribute to overcapacity and overfishing, eliminate subsidies that contribute to illegal, unreported and unregulated fishing and refrain from introducing new such subsidies, recognizing that appropriate and effective special and differential treatment for developing and least developed countries should be an integral part of the World Trade Organization fisheries subsidies negotiation
The SEEA Central Framework provides the measurement framework for environmental subsidies. Further disaggregation may be needed for negative fishery subsidies depending on how they are defined.
The SEEA Central Framework provides the measurement framework for environmental subsidies. Further disaggregation may be needed for negative fishery subsidies depending on how they are defined.
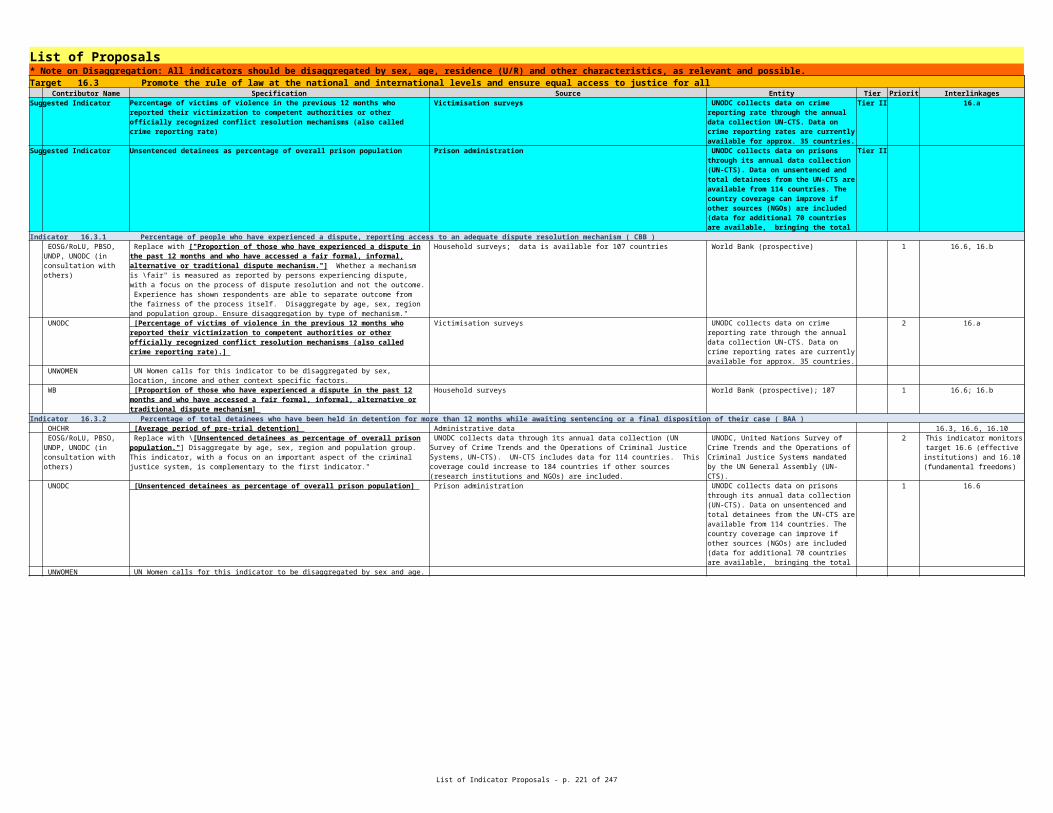
List of Indicator Proposals - p. 221 of 265
List of Proposals* Note on Disaggregation: All indicators should be disaggregated by sex, age, residence (U/R) and other characteristics, as relevant and possible.
Contributor Name Specification Source Entity Tier Priority InterlinkagesSuggested Indicator Fisheries as a % of GDP UNSD Tier I
Indicator 14.7.1. Fisheries as a % of GDP ( AAA ) UNSD [Fisheries as a % of GDP] UNSD 1
Indicator 14.7.2 Level of revenue generated from sustainable use of marine resources ( CBB ) IFAD 2
FAO 2
Contributor Name Specification Source Entity Tier Priority InterlinkagesSuggested Indicator UNEP Tier III
Indicator 14.a.1 Number of researchers working in this area ( BBB )
Indicator 14.a.2 Budget allocated to research in the field of marine technology ( BBB ) UNEP
Target 14.7 By 2030, increase the economic benefits to Small Island developing States and least developed countries from the sustainable use of marine resources, including through sustainable management of fisheries, aquaculture and tourism
SEEA Central Framework and the SEEA Agriculture Forestry and Fisheries provide information on the contribution to GDP of fisheries. The Tourism Satellite Accounts provide information on the contribution of GDP to tourism.
SEEA Central Framework and the SEEA Agriculture Forestry and Fisheries provide information on the contribution to GDP of fisheries. The Tourism Satellite Accounts provide information on the contribution of GDP to tourism.
Propose alternative to be used as second tier indicator: "[Productivity of aquaculture in utilizing natural resources (land, water and wild stock)"]. Target 14.7 implies that economic benefits can be derived from the sustainable use of marine resources, including through aquaculture. In fact aquaculture can generate economic benefits, and increase in aquaculture production can increase economic benefits. Increases in aquaculture productivity can further contribute to economic benefits when the natural resources are utilized more efficiently, i.e. when aquaculture yield is enhanced while the use of natural resources is better managed."
While data on aquaculture production are regularly provided by members, data sets on the use of natural resources in aquaculture are still being developed, with coverage and quality of data on land area use being much more advanced than water use and use of wild stocks.
The proposed aquaculture productivity indicator has not yet been established as a standard and readily available indicator, though FAO continues to collect data on aquaculture natural resource use.
Propose alternative to be used as second tier indicator: "Productivity of aquaculture in utilizing natural resources (land, water and wild stock)". Target 14.7 implies that economic benefits can be derived from the sustainable use of marine resources, including through aquaculture. In fact aquaculture can generate economic benefits, and increase in aquaculture production can increase economic benefits. Increases in aquaculture productivity can further contribute to economic benefits when the natural resources are utilized more efficiently, i.e. when aquaculture yield is enhanced while the use of natural resources is better managed.
While data on aquaculture production are regularly provided by members, data sets on the use of natural resources in aquaculture are still being developed, with coverage and quality of data on land area use being much more advanced than water use and use of wild stocks.
The proposed aquaculture productivity indicator has not yet been established as a standard and readily available indicator, though FAO continues to collect data on aquaculture natural resource use.
Target 14.a Increase scientific knowledge, develop research capacity and transfer marine technology, taking into account the Intergovernmental Oceanographic Commission Criteria and Guidelines on the Transfer of Marine Technology, in order to improve ocean health and to enhance the contribution of marine biodiversity to the development of developing countries, in particular small island developing States and least developed countries
Budget allocation to research in the field of sustainable marine technology as a percentage of all research in field of marine technology
Modification : [Budget allocation to research in the field of sustainable marine technology as a percentage of all research in field of marine technology ]

List of Indicator Proposals - p. 222 of 265
List of Proposals* Note on Disaggregation: All indicators should be disaggregated by sex, age, residence (U/R) and other characteristics, as relevant and possible.Target 14.b Provide access for small-scale artisanal fishers to marine resources and markets
Contributor Name Specification Source Entity Tier Priority InterlinkagesSuggested Indicator Tier III
Indicator 14.b.1 By 2030, X% of small scale fisheries certified as sustainable; Y% increase in market access for small scale fisheries ( CBB ) IFAD 1
FAO 1
Percentage of catches that are subject to a catch documentation scheme or similar traceability system as a percentage of the total catches that are less than x tons and traded in major markets.
The indicator does not exist, but the information does exist for some countries where such catch documentation schemes already exist, which is primarily the case for developed countries. However, FAO is leading the development of guidelines for such schemes and it is anticipated that the guidelines will be discussed and possibly endorsed in 2016 (at COFI). There is sufficient interest in CDS to begin to discuss/develop a globally agreed indicator for products traded through major markets. A catch documentation scheme will provide the framework on which to build and manage the indicator.
The feasibility of the indicator will primarily be determined by countries and regions that put in place a CDS, and if instituted the cost of data collection will be a part of the CDS, and will operate on a continuing basis. The information in a CDS is collected along the value chain and to precisely calculate the indicator, the country where distribution of the product ends will be the collector of the information since they will have the point of origin and destination and will be able to determine the total volume of product landed and the volume of product landed that is subject to a CDS for catch less than X tons."
Propose improved alternative: ["Percentage of catches that are subject to a catch documentation scheme or similar traceability system as a percentage of the total catches that are less than x tons and traded in major markets"]. This indicator measures the "access to markets" aspect of the target by using the % of the catch that is subject to some form of a catch document scheme (or similar traceability system) traded in major markets. It is assumed this level of catch is associated with small scale artisanal fisheries since catches of less than x tons are characteristic of such fisheries and that this catch is traceable and legally caught, and changes in the % will reflect changes in access to markets by small scale artisanal fisheries. In terms of the development agenda, fishers are more likely to have improved incomes when they can access major markets either directly or indirectly, and this access to major markets is increasingly dependent on being able to document that the fish were caught legally and/or sustainably. A catch documentation scheme (or similar), and especially one that follows the developing guidelines, will provide the means to track the changes in access to markets."
The indicator does not exist, but the information does exist for some countries where such catch documentation schemes already exist, which is primarily the case for developed countries. However, FAO is leading the development of guidelines for such schemes and it is anticipated that the guidelines will be discussed and possibly endorsed in 2016 (at COFI). There is sufficient interest in CDS to begin to discuss/develop a globally agreed indicator for products traded through major markets. A catch documentation scheme will provide the framework on which to build and manage the indicator.
\The feasibility of the indicator will primarily be determined by countries and regions that put in place a CDS, and if instituted the cost of data collection will be a part of the CDS, and will operate on a continuing basis. The information in a CDS is collected along the value chain and to precisely calculate the indicator, the country where distribution of the product ends will be the collector of the information since they will have the point of origin and destination and will be able to determine the total volume of product landed and the volume of product landed that is subject to a CDS for catch less than X tons."
Propose improved alternative: ["Percentage of catches that are subject to a catch documentation scheme or similar traceability system as a percentage of the total catches that are less than x tons and traded in major markets".] This indicator measures the “access to markets” aspect of the target by using the % of the catch that is subject to some form of a catch document scheme (or similar traceability system) traded in major markets. It is assumed this level of catch is associated with small scale artisanal fisheries since catches of less than x tons are characteristic of such fisheries and that this catch is traceable and legally caught, and changes in the % will reflect changes in access to markets by small scale artisanal fisheries. In terms of the development agenda, fishers are more likely to have improved incomes when they can access major markets either directly or indirectly, and this access to major markets is increasingly dependent on being able to document that the fish were caught legally and/or sustainably. A catch documentation scheme (or similar), and especially one that follows the developing guidelines, will provide the means to track the changes in access to markets.
The indicator does not exist, but the information does exist for some countries where such catch documentation schemes already exist, which is primarily the case for developed countries. However, FAO is leading the development of guidelines for such schemes and it is anticipated that the guidelines will be discussed and possibly endorsed in 2016 (at COFI). There is sufficient interest in CDS to begin to discuss/develop a globally agreed indicator for products traded through major markets. A catch documentation scheme will provide the framework on which to build and manage the indicator.
The feasibility of the indicator will primarily be determined by countries and regions that put in place a CDS, and if instituted the cost of data collection will be a part of the CDS, and will operate on a continuing basis. The information in a CDS is collected along the value chain and to precisely calculate the indicator, the country where distribution of the product ends will be the collector of the information since they will have the point of origin and destination and will be able to determine the total volume of product landed and the volume of product landed that is subject to a CDS for catch less than X tons.

List of Indicator Proposals - p. 223 of 265
List of Proposals* Note on Disaggregation: All indicators should be disaggregated by sex, age, residence (U/R) and other characteristics, as relevant and possible.Indicator 14.b.2 By 2030, increase by X% the proportion of global fish catch from sustainably managed small scale fisheries ( CBB )
IFAD FAO/COFI 1
FAO FAO/COFI 1
Contributor Name Specification Source Entity Tier Priority InterlinkagesSuggested Indicator ILO Tier II
Indicator 14.c.1 Adoption of a legal framework and number of associated court cases ( CBB )
Indicator 14.c.2 Number of countries implementing either legally or programmatically the provisions set out in regional seas protocols ( BBB ) ILO
During the Sixteenth Meeting of the UN Open-ended informal consultative process on Oceans and the Law of the Sea, April 6-10, member states generally agreed that the preliminary indicators on small-scale fisheries are deemed inadequate to measure the social dimensions of Target 14.b. Concern was also expressed that the target's preliminary indicators do not seem to provide a comprehensive monitoring mechanism for the implementation of the FAO's Voluntary Guidelines for Securing Sustainable Small-Scale Fisheries in the Context of Food Security and Poverty Eradication. In view of these concerns, FAO proposes an alternative indicator formulated as \[Progress by countries in adopting and implementing a legal/regulatory/policy/institutional framework which recognizes and protects access rights for small-scale fisheries"]. This indicator measures the "access rights" aspect of the target. Due to the diverse nature of small-scale fisheries in different countries, there is no globally agreed definition for small-scale fisheries, which became also evident during the development process of the Voluntary Guidelines for Securing Sustainable Small-Scale Fisheries in the Context of Food Security and Poverty Eradication (SSF Guidelines) recently endorsed by the FAO Committee on Fisheries (COFI). See metadata for a more detailed explanation.
There is currently no such indicator but the biennial FAO survey questionnaire on the CCRF implementation will include new questions in relation to small-scale fisheries and the implementation of the SSF Guidelines. The first results will become available for FAO's Committee on Fisheries (COFI) in 2016. COFI 2016 can provide an opportunity to sharpen the questions if needed. In addition, there will be a specific COFI agenda item on small-scale fisheries. Data could therefore be produced at country level every two years for COFI through the electronic questionnaire.
During the Sixteenth Meeting of the UN Open-ended informal consultative process on Oceans and the Law of the Sea, April 6-10, member states generally agreed that the preliminary indicators on small-scale fisheries are deemed inadequate to measure the social dimensions of Target 14.b. Concern was also expressed that the target’s preliminary indicators do not seem to provide a comprehensive monitoring mechanism for the implementation of the FAO’s Voluntary Guidelines for Securing Sustainable Small-Scale Fisheries in the Context of Food Security and Poverty Eradication. In view of these concerns, FAO proposes an alternative indicator formulated as ["Progress by countries in adopting and implementing a legal/regulatory /policy/institutional framework which recognizes and protects access rights for small-scale fisheries".] This indicator measures the “access rights” aspect of the target. Due to the diverse nature of small-scale fisheries in different countries, there is no globally agreed definition for small-scale fisheries, which became also evident during the development process of the Voluntary Guidelines for Securing Sustainable Small-Scale Fisheries in the Context of Food Security and Poverty Eradication (SSF Guidelines) recently endorsed by the FAO Committee on Fisheries (COFI). See metadata for a more detailed explanation.
There is currently no such indicator but the biennial FAO survey questionnaire on the CCRF implementation will include new questions in relation to small-scale fisheries and the implementation of the SSF Guidelines. The first results will become available for FAO’s Committee on Fisheries (COFI) in 2016. COFI 2016 can provide an opportunity to sharpen the questions if needed. In addition, there will be a specific COFI agenda item on small-scale fisheries. Data could therefore be produced at country level every two years for COFI through the electronic questionnaire.
Target 14.c Enhance the conservation and sustainable use of oceans and their resources by implementing law as reflected in UNCLOS, which provides the legal framework for the conservation and sustainable use of oceans and their resources, as recalled in paragraph 158 of The Future We Want.
Number of countries implementing either legally or programmatically the provisions set out in regional seas protocols and ratification and implementation of the ILO Maritime and Fisheries Conventions
Alternative indicator: [Number of countries implementing either legally or programmatically the provisions set out in regional seas protocols and ratification and implementation of the ILO Maritime and Fisheries Conventions]

List of Indicator Proposals - p. 224 of 265
List of Proposals* Note on Disaggregation: All indicators should be disaggregated by sex, age, residence (U/R) and other characteristics, as relevant and possible.
Contributor Name Specification Source Entity Tier Priority InterlinkagesSuggested Indicator Forest area as a percentage of total land area Tier I 6.6
Indicator 15.1.1 Coverage of protected areas broken down by ecosystem type, including total area of forests in protected areas (thousands of hectares) ( BAA ) UNEP http://www.bipindicators.net/paoverlays
IUCN 1
Indicator 15.1.2 Forest area as a percentage of total land area ( AAA ) IFAD 1 6.6
FAO 1 6.6
UNEP Global Database on Protected Area Management Effectiveness (GD-PAME) UNEP-WCMC (Indicator under the BIP)
IUCN 2
Goal 15 Protect, restore and promote sustainable use of terrestrial ecosystems, sustainably manage forests, combat desertification, and halt and reverse land degradation and halt biodiversity loss
Target 15.1 By 2020, ensure the conservation, restoration and sustainable use of terrestrial and inland freshwater ecosystems and their services, in particular forests, wetlands, mountains and drylands, in line with obligations under international agreements
FAO: Retain as most relevant indicator. The indicator is already included among the indicators for the Millennium Development Goals (MDG) (indicator 7.1 “Proportion of land covered by forest”). In order to provide a precise definition of the indicator, it is crucial to provide a definition of “Forest” and “Total Land Area”. According to the FAO definitions, Forest is defined as “land spanning more than 0.5 hectares with trees higher than 5 meters and a canopy cover of more than 10 percent, or trees able to reach these thresholds in situ. It does not include land that is predominantly under agricultural or urban land use.
FAO carries out global forest resources assessments at 5 year intervals, the results of the FRA 2015 will be released in September 2015 and next assessment will most likely be in 2020
[ Protected area overlays with biodiversity (http://www.bipindicators.net/paoverlays ) ]
UNEP-WCMC, Alliance for Zero Extinction, Conservation International, BirdLife International (Indicator under the BIP)
Targets 6.6, 14.2, 14.5, 15.1 and 15.4
Modify currently proposed indicator: “Coverage of protected areas broken down by ecosystem type” is a more useful indicator than coverage alone (see comments on indicator 14.5.2 above), but it would be much better to use [“Coverage by protected areas of important sites for terrestrial and freshwater biodiversity”] as these are the precise locations where effective conservation is needed to “halt the decline in biodiversity” (Butchart et al PLoS ONE 7(3): e32529). The indicator is used by the BIP as an indicator towards Aichi Target 11 (http://www.bipindicators.net/paoverlays).
Data sources: Protected Planet (http://www.protectedplanet.net/) for protected areas data; Important Bird & Biodiversity Areas (http://www.birdlife.org/datazone/site) and Alliance for Zero Extinction sites (http://www.zeroextinction.org/) for Key Biodiversity Areas data; indicator developed by Butchart et al. (2012) PLoS ONE 7(3): e32529.
Responsible entities and national availability: IUCN & UNEP-WCMC, BirdLife International, AZE. Available globally since 1950s, and can be disaggregated to national and regional levels.
Disaggregated versions for 6.6, 14.2, 14.5, 15.4
Retain as most relevant indicator. The indicator is already included among the indicators for the Millennium Development Goals (MDG) (indicator 7.1 "Proportion of land covered by forest"). In order to provide a precise definition of the indicator, it is crucial to provide a definition of "Forest" and "Total Land Area". According to the FAO definitions, Forest is defined as "land spanning more than 0.5 hectares with trees higher than 5 meters and a canopy cover of more than 10 percent, or trees able to reach these thresholds in situ. It does not include land that is predominantly under agricultural or urban land use.
The national figures in the global assessments are reported by the countries themselves following standardized format, definitions and reporting years
FAO carries out global forest resources assessments at 5 year intervals, the results of the FRA 2015 will be released in September 2015 and next assessment will most likely be in 2020
Retain as most relevant indicator. The indicator is already included among the indicators for the Millennium Development Goals (MDG) (indicator 7.1 “Proportion of land covered by forest”). In order to provide a precise definition of the indicator, it is crucial to provide a definition of “Forest” and “Total Land Area”. According to the FAO definitions, Forest is defined as “land spanning more than 0.5 hectares with trees higher than 5 meters and a canopy cover of more than 10 percent, or trees able to reach these thresholds in situ. It does not include land that is predominantly under agricultural or urban land use.
The national figures in the global assessments are reported by the countries themselves following standardized format, definitions and reporting years
FAO carries out global forest resources assessments at 5 year intervals, the results of the FRA 2015 will be released in September 2015 and next assessment will most likely be in 2020
[Management Effectiveness of Protected Areas ( http://www.bipindicators.net/pamanagement ) ]
Targets 14.2, 14.4, 14.5, 15.1, 15.2
Currently proposed indicator: IUCN supports adoption of this indicator, which is used by the BIP as an indicator towards Aichi Target 5 (http://www.bipindicators.net/forestextent).
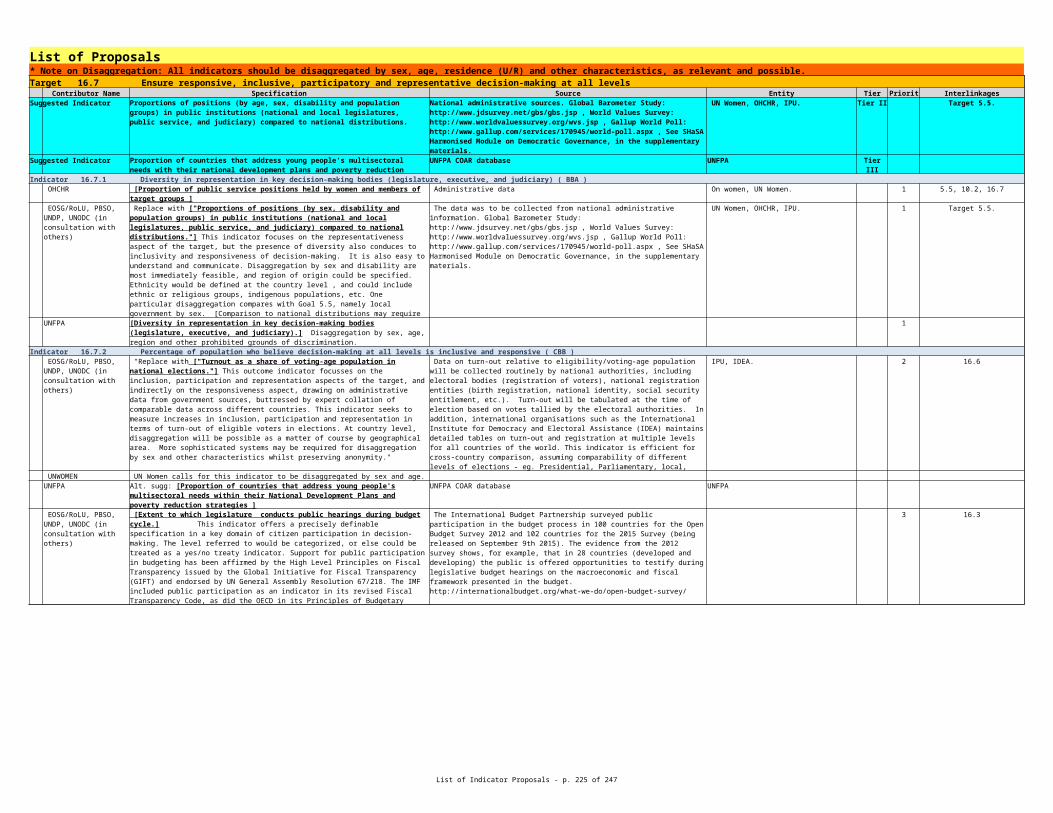
List of Indicator Proposals - p. 225 of 265
List of Proposals* Note on Disaggregation: All indicators should be disaggregated by sex, age, residence (U/R) and other characteristics, as relevant and possible.Target 15.2 By 2020, promote the implementation of sustainable management of all types of forests, halt deforestation, restore degraded forests and substantially increase afforestation and reforestation globally.
Contributor Name Specification Source Entity Tier Priority InterlinkagesSuggested Indicator Forest cover under sustainable forest management Tier II 15.3
Indicator 15.2.1 Net forest emissions ( BBB ) IFAD 1
FAO 1
WB
Indicator 15.2.2 Forest cover under sustainable forest management ( BBA ) IFAD FAO/Forest Resources Assessment (FRA) 2 15.3
FAO 1 15.3
UNEP FAO, FSC, PEFC (Indicator under the BIP) Targets 15.2 and 15b
IUCN
A quality descriptor is associated with the forest area, forest management planning and operational stakeholder involvement components of the index. Coverage is aggregated to the country level in the country reports. In 2015 some 155 countries reported for most of the elements in the index that add to a total of 2.200 M ha (55% global forest area). A common definition is used for each element so comparability across countries is good.
FAO maintains this index based on country reporting beginning with the Global Forest Resources Assessment (FRA) 2015. Data is collected globally every 5 years with reporting anticipated in 2015, 2020, 2025 and 2030.
Propose alternative: \[Carbon stock in woody biomass"]. Carbon stocks in woody biomass reflect both forest extent and quality, and change in these stocks indicate changes relevant not only to greenhouse gas emissions but also trends related to production, conservation and management. The implementation of sustainable forest management, a reduction of deforestation, an increase in restored forest and increased afforestation are all directly linked to increased biomass carbon stocks - as success is achieved in each of these areas, biomass carbon stocks should remain stable or increase."
The national figures in the global assessments are reported by countries following a standardized format, definitions and reporting years to provide a means of comparability across countries.
FAO carries out global forest resources assessments at 5 year intervals. The indicator is aggregated to the national scale.
Propose alternative: ["Carbon stock in woody biomass"]. Carbon stocks in woody biomass reflect both forest extent and quality, and change in these stocks indicate changes relevant not only to greenhouse gas emissions but also trends related to production, conservation and management. The implementation of sustainable forest management, a reduction of deforestation, an increase in restored forest and increased afforestation are all directly linked to increased biomass carbon stocks - as success is achieved in each of these areas, biomass carbon stocks should remain stable or increase.
The national figures in the global assessments are reported by countries following a standardized format, definitions and reporting years to provide a means of comparability across countries.
FAO carries out global forest resources assessments at 5 year intervals. The indicator is aggregated to the national scale.
Important to specify what “net forest emissions’ means? Carbon emissions from deforestation? An alternate key indicator to watch would be net forest loss
The value computed for each country will be in the form of "percentage (%) of forest area", which is calculated as follows: Numerator: Total area (in hectares) of forests under Forest Management Plans, Denominator: Total area (in hectares) of forest cover
Data quality and completeness are still very low. All underlying data is collected via the Global Forest Resources Assessment (FRA), administered by FAO's Forestry Department every 5 years
Also known as ["Sustainable Forest Management Index"], this indicator is defined as the area of permanent forest use as modified by the presence of: A) Policies and legislation supporting SFM; B) A national stakeholder platform for input to forest policy; C) National forest inventory data; D) National forest reporting; E) Forest management plans that include soil and water conservation, high conservation value forest and social engagement, and; F) Stakeholder involvement in operational planning, operations and review. The unit of measure is the number of hectares covered by these attributes.
A quality descriptor is associated with the forest area, forest management planning and operational stakeholder involvement components of the index. Coverage is aggregated to the country level in the country reports. In 2015 some 155 countries reported for most of the elements in the index that add to a total of 2.200 M ha (55% global forest area). A common definition is used for each element so comparability across countries is good.
FAO maintains this index based on country reporting beginning with the Global Forest Resources Assessment (FRA) 2015. Data is collected globally every 5 years with reporting anticipated in 2015, 2020, 2025 and 2030.
[Area of forest under sustainable management: certification ( http://www.bipindicators.net/forestcertification ) ]
Area of Forest under Sustainable Management: Certification ( http://www.bipindicators.net/forestcertification )
Currently proposed indicator: IUCN supports adoption of this indicator, which is used by the BIP as an indicator towards Aichi Target 5 (http://www.bipindicators.net/forestdegradation).

List of Indicator Proposals - p. 226 of 265
List of Proposals* Note on Disaggregation: All indicators should be disaggregated by sex, age, residence (U/R) and other characteristics, as relevant and possible.Target 15.3 By 2030, combat desertification, restore degraded land and soil, including land affected by desertification, drought and floods, and strive to achieve a land degradation-neutral world
Contributor Name Specification Source Entity Tier Priority InterlinkagesSuggested Indicator Trends in land degradation UNCCD, UNSD Tier II
Indicator 15.3.1 Trends in land degradation ( BBA ) UNCCD 1
UNISDR National Disaster Loss Databases, 85 (will be more than 115 by 2016) UNISDR 1 2.4, 1.5, 13.1, 11.5, 14.2
WB
UNSD Trends in land degradation SEEA EEA - provides the statistical framework for measuring land degradation. UNSD
** Trends in Land Cover/Land Use: (1) Global: e.g. http://www.glcn.org/databases/se_change_en.jsp, http://www.esa-landcover-cci.org/ (2) Regional: e.g. http://www.eea.europa.eu/data-and-maps/data/corine-land-cover ** Trends in Land Productivity: remote sensing data bases of NDVI and other Vegetation Indices/Variables, e.g. http://gcmd.gsfc.nasa.gov/index.html, http://land.copernicus.eu/global/themes/Vegetation, http://wad.jrc.ec.europa.eu/ ** Trends in Soil Organic Carbon: global spatial layers: Harmonized World Soil Database (HWSD), http://eusoils.jrc.ec.europa.eu/ESDB_Archive/octop/Global.html ** More detail on all elements of data sources may be found in the attached document on meta-data
1.5, 2.3, 2.4, 6.6, 12.2, 13.1, 14.1, 15.1, 15.2 and 15.5
[Trends in land degradation]: The indicator provides trends in the areal extent of degrading versus stable/improving land at global, regional and national levels. The trends would be built upon and refer to a baseline of the current areal extent of actually degrading and stable/improving land. The measurement unit of the indicator is total spatial area (e.g. ha, km2) of land showing degrading trend/stability/improving trend per reference land unit (e.g. global land surface, continental/regional/national land surface) or the respective proportion (% of land surface of spatial reference unit). In a tiered approach the indicator derivation is based on the synoptic utilization of trends in land cover/land use (Tier 1), trends in land productivity (Tier 2a) and soil organic carbon (SOC) (Tier 2b) primarily available through widely used global data sources. ** Tier 1: Trends in land use/cover; Tier 2a: Trends in land productivity; Tier 2b: Trends in soil organic carbon stocks. ** This indicator will be used by UNCCD country Parties to set nationally voluntary targets on land degradation neutrality and report on progress towards achieving these targets.
** Trends in Land Cover/Land Use: (1) Global: e.g. http://www.glcn.org/databases/se_change_en.jsp, http://www.esa-landcover-cci.org/ (2) Regional: e.g. http://www.eea.europa.eu/data-and-maps/data/corine-land-cover ** Trends in Land Productivity: remote sensing data bases of NDVI and other Vegetation Indices/Variables, e.g. http://gcmd.gsfc.nasa.gov/index.html, http://land.copernicus.eu/global/themes/Vegetation, http://wad.jrc.ec.europa.eu/ ** Trends in Soil Organic Carbon: global spatial layers: Harmonized World Soil Database (HWSD), http://eusoils.jrc.ec.europa.eu/ESDB_Archive/octop/Global.html ** More detail on all elements of data sources may be found in the attached document on meta-data
The United Nations Convention to Combat Desertification (UNCCD) compiles data for this indicator. The necessary data are obtained primarily from remote sensing data acquired and processed by various international organizations. As part of the reporting and review process, national estimates derived from global datasets are validated by UNCCD country Parties or replaced with national estimates using data sourced/computed nationally/locally.
1.5, 2.3, 2.4, 6.6, 12.2, 13.1, 14.1, 15.1, 15.2 and 15.5
UNISR proposes[ \Agricultural loss due to disasters"]. Please see UNISDR input paper attached."
Are there reliable remote sensing techniques to capture these? Else it may be difficult to define, let alone capture degradation, especially as this often is a gradual process with a strong cyclical overlay (e.g. a long term trend masked by strong fluctuations of a few years)
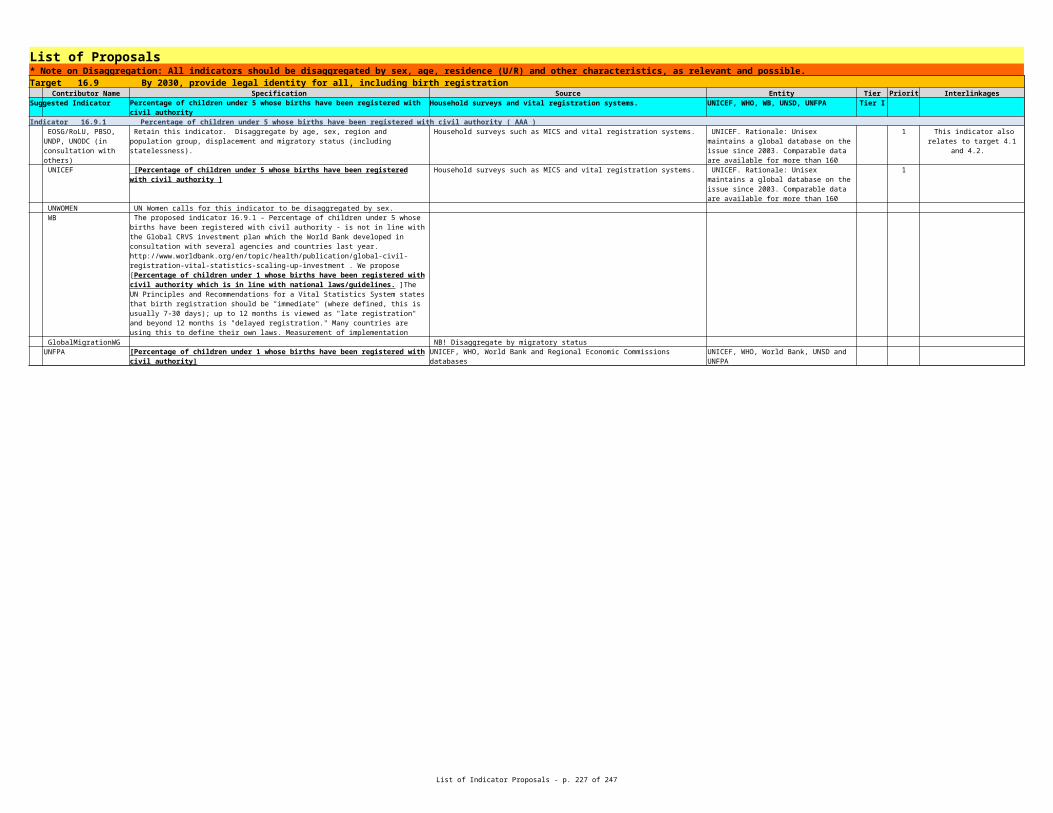
List of Indicator Proposals - p. 227 of 265
List of Proposals* Note on Disaggregation: All indicators should be disaggregated by sex, age, residence (U/R) and other characteristics, as relevant and possible.Indicator 15.3.2 Area of land/soils under sustainable management ( BBA )
IFAD FAO 1 2.4 and 15.2 - see definition
FAO FAO 1 2.4 and 15.2 - see definition
UNEP http://www.fao.org/nr/lada/ FAO (Indicator under the BIP)
UNISDR UNISDR 2 13.3, 2.4, 11.5, 13.1
IUCN 1
WB Same as above
This indicator aims to assess the adoption of sustainable land management practices pertaining to land use/management of crops, pastures and forestry of which Sustainable Forest Management (SFM) is a subset. It is therefore proposed that this indicator is produced as an aggregation of the new indicator proposal for target 2.4, ["Percentage of agricultural area under sustainable agricultural practices" and the current indicator proposal for 15.2.2, "Forest cover under sustainable forest management". "]
At global level, currently there is no data available. However many if not most of the countries record areas which are the object of practices contributing to environmental sustainability under various schemes, from which the data could be computed.
This indicator aims to assess the adoption of sustainable land management practices pertaining to land use/management of crops, pastures and forestry of which Sustainable Forest Management (SFM) is a subset. It is therefore proposed that this indicator is produced as an aggregation of the new indicator proposal for target 2.4, "Percentage of agricultural area under sustainable agricultural practices" and the current indicator proposal for 15.2.2, "Forest cover under sustainable forest management".
At global level, currently there is no data available. However many if not most of the countries record areas which are the object of practices contributing to environmental sustainability under various schemes, from which the data could be computed.
[ Area of agricultural Ecosystems under Sustainable Management ( http://www.bipindicators.net/sustainableagriculture ) ]
UNISR proposes [\Number of countries that have probabilistic risk assessment profile and early warning system against major hazards that the country faces".] Please see UNISDR input paper attached."
SFDRR Monitor (to be developed), 0 (but HFA Monitor covered 133 countries in 2013)
Currently proposed indicator: IUCN supports adoption of this indicator, which is used by the BIP as an indicator towards Aichi Target 7 (http://www.bipindicators.net/sustainableagriculture).

List of Indicator Proposals - p. 228 of 265
List of Proposals* Note on Disaggregation: All indicators should be disaggregated by sex, age, residence (U/R) and other characteristics, as relevant and possible.Target 15.4 By 2030, ensure the conservation of mountain ecosystems, including their biodiversity, in order to enhance their capacity to provide benefits that are essential for sustainable development
Contributor Name Specification Source Entity Tier Priority InterlinkagesSuggested Indicator Coverage of protected areas Tier I
Suggested Indicator Mountain Green Cover Index Tier I
Indicator 15.4.1 Coverage of protected areas ( AAA ) UNEP [Coverage of protected areas ( http://www.bipindicators.net/pacoverage ) ]
IUCN 1
UNSD Coverage of protected areas UNSD 1
Indicator 15.4.2 Mountain Green Cover Index ( CBB ) IFAD 1
World Database on Protected Areas (WDPA) ( http://www.protectedplanet.net/ )
UNEP-WCMC (Indicator under the BIP) ( http://www.unep-wcmc.org/news/new-unep-report-unveils-world-on-track-to-meet-2020-target-for-protected-areas-on-land-and-sea )
Targets 6.6, 14.2, 14.5, 15.1 and 15.4
The data set GLC SHARE developed by FAO will be used as basis for the computation of the indicator, jointly with the definition of mountain areas as provided by UNEP-WCMC.
Thanks to the way GLC-SHARE is structured, FAO's Mountain Green Cover Index has a global coverage and it is possible to compute the indicator at the global, regional, national and sub-national level.
The proposedIndex will provide a
meaningful proxy for assessing the progress of all three mountain targets (ie.,
6.6.; 15.1; and 15.4)
World Database on Protected Areas (WDPA) ( http://www.protectedplanet.net/ )
UNEP-WCMC (Indicator under the BIP) ( http://www.unep-wcmc.org/news/new-unep-report-unveils-world-on-track-to-meet-2020-target-for-protected-areas-on-land-and-sea )
Targets 6.6, 14.2, 14.5, 15.1 and 15.4
Modify currently proposed indicator: “Coverage of protected areas” focuses solely on numeric coverage, but this is a poor measure of whether the most important places for biodiversity are protected. Suggest rewording as [“Coverage by protected areas of important sites for montane biodiversity”], using Key Biodiversity Areas as one way of identifying the latter. The indicator is used by the BIP as an indicator towards Aichi Target 11 (http://www.bipindicators.net/paoverlays).
Data sources: Protected Planet (http://www.protectedplanet.net/) for protected areas data; Important Bird & Biodiversity Areas (http://www.birdlife.org/datazone/site) and Alliance for Zero Extinction sites (http://www.zeroextinction.org/) for Key Biodiversity Areas data; indicator developed by Butchart et al. (2012) PLoS ONE 7(3): e32529.
Responsible entities and national availability: IUCN & UNEP-WCMC, BirdLife International, AZE. Available globally since 1950s, and can be disaggregated to national and regional levels.
15.1 (and disaggregated versions for other targets)
The SEEA Experimental Ecosystem Accounts provides a classification of ecosystem assets included protected areas. WCMC has a data-base on protected areas/mountains which is obtained looking at elevation and slopes.
Even though many protected areas are found in mountains, in general they are not an adequate proxy for the overall global situation of biodiversity conservation in mountain areas. Protected areas, as they name says, are protected from overexploitation as often people are not allowed to live and have economic activities in these areas. The information gathered by monitoring only the situation of mountain protected areas would not, in our views, represent an adequate proxy for monitoring the non protected areas which in fact can experience high population pressure, deforestation, overexploitation, degradation, etc. that are not found in protected areas. Indeed, "islands" of protected areas can be surrounded by areas that are totally degraded and overexploited especially when communities are not allowed to live in protected areas and therefore tend to amass around them. By adopting the "green cover index" all mountain green cover will be assessed and used to analyse the trend. Hence the green cover index seems a more comprehensive and reliable indicator. In addition, as technology develops, it is expected that additional tools will soon be available (such as google earth) to monitor the vegetation cover changes with a very high definition (1sqm or less) and a high frequency (weekly or even daily updates).
The data set GLC SHARE developed by FAO will be used as basis for the computation of the indicator, jointly with the definition of mountain areas as provided by UNEP-WCMC.
Thanks to the way GLC-SHARE is structured, FAO's Mountain Green Cover Index has a global coverage and it is possible to compute the indicator at the global, regional, national and sub-national level.
The proposed Index will provide a meaningful proxy for assessing the progress of
all three mountain targets (ie., 6.6.; 15.1; and 15.4)

List of Indicator Proposals - p. 229 of 265
List of Proposals* Note on Disaggregation: All indicators should be disaggregated by sex, age, residence (U/R) and other characteristics, as relevant and possible.
FAO 1Even though many protected areas are found in mountains, in general they are not an adequate proxy for the overall global situation of biodiversity conservation in mountain areas. Protected areas, as they name says, are protected from overexploitation as often people are not allowed to live and have economic activities in these areas. The information gathered by monitoring only the situation of mountain protected areas would not, in our views, represent an adequate proxy for monitoring the non protected areas which in fact can experience high population pressure, deforestation, overexploitation, degradation, etc. that are not found in protected areas. Indeed, “islands” of protected areas can be surrounded by areas that are totally degraded and overexploited especially when communities are not allowed to live in protected areas and therefore tend to amass around them. By adopting the “green cover index” all mountain green cover will be assessed and used to analyse the trend. Hence the green cover index seems a more comprehensive and reliable indicator. In addition, as technology develops, it is expected that additional tools will soon be available (such as google earth) to monitor the vegetation cover changes with a very high definition (1sqm or less) and a high frequency (weekly or even daily updates).
The data set GLC SHARE developed by FAO will be used as basis for the computation of the indicator, jointly with the definition of mountain areas as provided by UNEP-WCMC.
Thanks to the way GLC-SHARE is structured, FAO's Mountain Green Cover Index has a global coverage and it is possible to compute the indicator at the global, regional, national and sub-national level.
The proposedIndex will provide a
meaningful proxy for assessing the progress of all three mountain targets (ie.,
6.6.; 15.1; and 15.4)
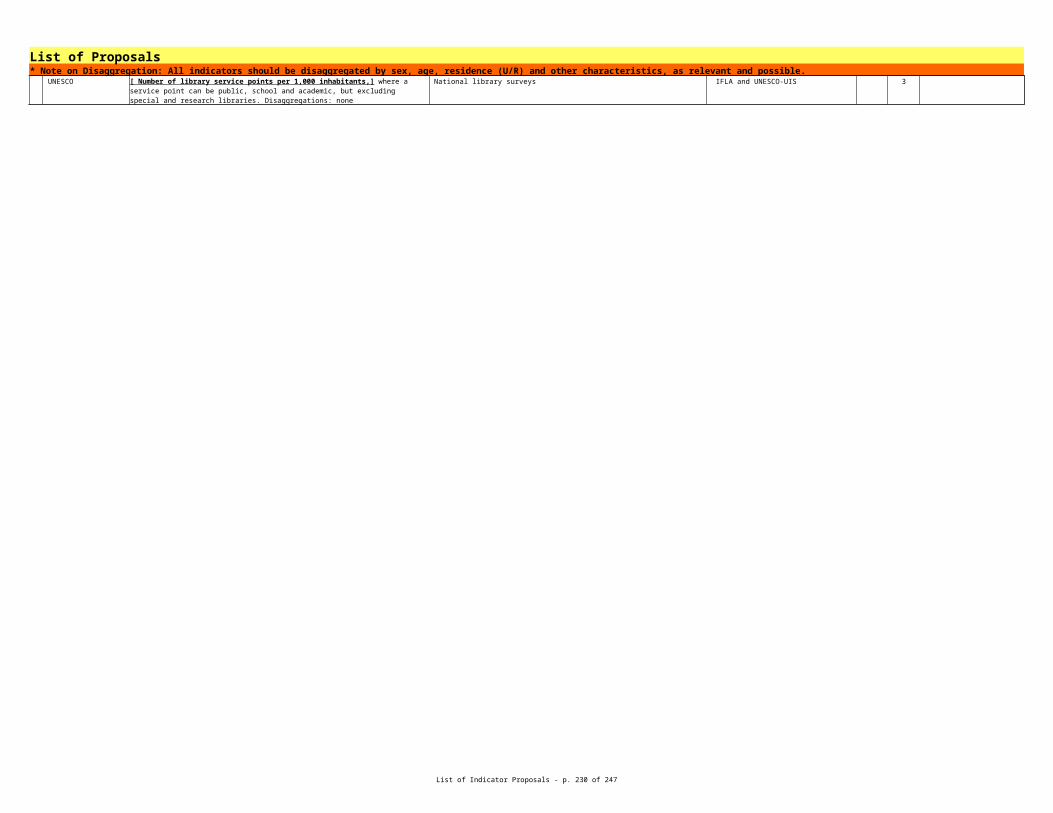
List of Indicator Proposals - p. 230 of 265
List of Proposals* Note on Disaggregation: All indicators should be disaggregated by sex, age, residence (U/R) and other characteristics, as relevant and possible.Target 15.5 Take urgent and significant action to reduce the degradation of natural habitats, halt the loss of biodiversity, and, by 2020, protect and prevent the extinction of threatened species
Contributor Name Specification Source Entity Tier Priority InterlinkagesSuggested Indicator Red List Index IUCN (Indicator under the BIP) Tier I Targets 15.5, 12.2, 12.4,
Indicator 15.5.1 Red List Index ( BAA ) UNEP [Red List Index ( http://www.bipindicators.net/rli/2010 )] IUCN (Indicator under the BIP) Targets 15.5, 12.2, 12.4,
IUCN Data sources: IUCN Red List of Threatened Species (http://www.iucnredlist.org/). 1
Indicator 15.5.2 Living Planet Index ( CBB ) UNEP [Living Planet Index ( http://www.bipindicators.net/lpi ) ] WWF (Indicator under the BIP)
IUCN 2
Target 15.6 Ensure fair and equitable sharing of the benefits arising from the utilization of genetic resources and promote appropriate access to such resources Contributor Name Specification Source Entity Tier Priority Interlinkages
Suggested Indicator CBD (Indicator under the BIP) Tier I Targets 1.4, 15.6
Indicator 15.6.1 Number of countries that have adopted legislative, administrative and policy frameworks for the implementation of the Nagoya Protocol ( BBB ) UNEP CBD (Indicator under the BIP) Targets 1.4, 15.6
IUCN 1
IFAD 1
FAO 1
IUCN Red List Index ( http://www.iucnredlist.org/about/publication/red-list-index )
IUCN Red List Index ( http://www.iucnredlist.org/about/publication/red-list-index )
Currently proposed indicator: The score of B indicates that some countries think that this indicator is challenging to implement. However, an indicator based on a relevant disaggregation of the global RLI is easy to produce. IUCN and BirdLife International are facilitating this by working on making it easy to download the national RLI and data from the IUCN Red List and BirdLife International websites. This comment also applies to Indicators 15.7.1 and 15.8.2. The indicator is used by the BIP as an indicator towards Aichi Target 12 (http://www.bipindicators.net/rli/2010). (For information, note that the name “Red List Index” should not be taken to imply that the indicator is produced by aggregating a number of disparate metrics, in the same way that, e.g., the Multidimensional Poverty Index is compiled. Instead the RLI is an indicator of trends in species' extinction risk, as measured using the IUCN Red List Categories and Criteria, and is compiled from data on changes over time in the Red List Category for each species, excluding any changes driven by improved knowledge or revised taxonomy.)
Responsible entities and national availability: IUCN Red List Partnership (http://www.iucnredlist.org/partners/partners-and-technical-support). Available globally since 1980s, and can be disaggregated to national and regional levels (Rodrigues et al. 2014 PLoS ONE 9(11): e113934).
Disaggregated versions for 2.4, 2.5, 3.9, 12.2, 12.4, 13.1, 14.1, 14.2, 14.3, 14.4, 15.7,
15.8
Living Planet Index ( http://wwf.panda.org/about_our_earth/all_publications/living_planet_report/living_planet_index2/ )
Currently proposed indicator: IUCN supports adoption of this indicator, which is used by the BIP as an indicator towards Aichi Target 12 (www.bipindicators.net/lpi).
Number of countries that have adopted legislative, administrative and policy frameworks for the implementation of the Nagoya Protocol
CBD Nagoya Protocol Website, List of signatures and ratifications ( http://www.bipindicators.net/NagoyaProtocolratification )
[Ratification Status of the Nagoya Protocol ( http://www.bipindicators.net/NagoyaProtocolratification ) ]
CBD Nagoya Protocol Website, List of signatures and ratifications ( http://www.bipindicators.net/NagoyaProtocolratification )
Currently proposed indicator: IUCN supports adoption of this indicator, which is used by the BIP as an indicator towards Aichi Target 16 (http://www.bipindicators.net/NagoyaProtocolratification).
Indicator 15.6.2 Number of permits or their equivalents made available to the Access and Benefit-sharing Clearinghouse established under the Nagoya Protocol and number of Standard Material Transfer Agreements, as communicated to the Governing Body of the International Treaty ( CBB ) This indicator builds on concrete cases in which agreement has been reached on the
transfer of genetic resources between the resource provider and the resource recipient, including on how benefits arising from the use of the genetic resources will be shared. An increase of permits or their equivalents made available to the ABS Clearinghouse and an increase of SMTAs communicated to the Governing Body of the International Treaty will indicate an increased number of cases in which access to genetic resources has been granted and in which resulting benefits will be shared on the basis of "mutually agreed terms".
The information the indicator is based on is already being collected under the International Treaty. The ABS Clearinghouse is ready to start collecting permits/ equivalents
The CBD Secretariat, through its ABS Clearinghouse, would be responsible for the ABS permits or their equivalents (https://absch.cbd.int/). FAO, through its Secretariat of the International Treaty on Plant Genetic Resources for Food and Agriculture, would track the SMTAs.
This indicator is also relevant to the access and benefit
sharing segment of target 2.5.
This indicator builds on concrete cases in which agreement has been reached on the transfer of genetic resources between the resource provider and the resource recipient, including on how benefits arising from the use of the genetic resources will be shared. An increase of permits or their equivalents made available to the ABS Clearinghouse and an increase of SMTAs communicated to the Governing Body of the International Treaty will indicate an increased number of cases in which access to genetic resources has been granted and in which resulting benefits will be shared on the basis of “mutually agreed terms”.
The information the indicator is based on is already being collected under the International Treaty. The ABS Clearinghouse is ready to start collecting permits/ equivalents
The CBD Secretariat, through its ABS Clearinghouse, would be responsible for the ABS permits or their equivalents (https://absch.cbd.int/). FAO, through its Secretariat of the International Treaty on Plant Genetic Resources for Food and Agriculture, would track the SMTAs.
This indicator is also relevant to the access
and benefit sharing segment of target 2.5.

List of Indicator Proposals - p. 231 of 265
List of Proposals* Note on Disaggregation: All indicators should be disaggregated by sex, age, residence (U/R) and other characteristics, as relevant and possible.Target 15.7 Take urgent action to end poaching and trafficking of protected species of flora and fauna and address both demand and supply of illegal wildlife products
Contributor Name Specification Source Entity Tier Priority InterlinkagesSuggested Indicator Red List Index for species in trade Tier I
Suggested Indicator Proportion of detected trade in wildlife and wildlife products that is illegal Tier II
Indicator 15.7.1 Red List Index for species in trade ( BBB ) UNEP [Status of Species in Trade ( http://www.bipindicators.net/speciestrade ) ] IUCN Red List of Threatened Species CITES, IUCN (Indicator under the BIP) UNODC
IUCN 1
Indicator 15.7.2 Ratio of indexed value of total CITES-listed wildlife seizures to indexed value of total CITES wild-sourced export permits issued. ( CBB ) UNODC 1 n/a
Data sources: IUCN Red List of Threatened Species (http://www.iucnredlist.org/); specifically for species coded under "5 Biological resource use" in the Threats Classification Scheme (http://www.iucnredlist.org/technical-documents/classification-schemes/threats-classification-scheme).
Responsible entities and national availability: IUCN Red List Partnership (http://www.iucnredlist.org/partners/partners-and-technical-support). Available globally since 1980s, and can be disaggregated to national and regional levels (Rodrigues et al. 2014 PLoS ONE 9(11): e113934).
15.5 (and disaggregated versions for other targets)
1. The records of the legal trade are collected by the CITES Secretariat and are maintained in a database by the UNEP-World Conservation Monitoring Centre, United Kingdom. All CITES Parties are required to report and data availability is good. 2.The wildlife seizure records are being collected by the CITES Secretariat and the World Customs Organization. UNODC has complied these data in a global database which contains over 125,000 seizure incidents at present. 3.Declared values for imported wildlife products. These are collected by national governments and are maintained in the World WISE database by UNODC.
UNODC (in cooperation with the CITES Secretariat)
2 (UNODC comment: This indicator tracks species decline due to all causes, and is not specific to poaching and trafficking)
Data sources: IUCN Red List of Threatened Species (http://www.iucnredlist.org/); specifically for species coded under “5 Biological resource use” in the Threats Classification Scheme (http://www.iucnredlist.org/technical-documents/classification-schemes/threats-classification-scheme).
Data sources: IUCN Red List of Threatened Species (http://www.iucnredlist.org/); specifically for species coded under "5 Biological resource use" in the Threats Classification Scheme (http://www.iucnredlist.org/technical-documents/classification-schemes/threats-classification-scheme).
Responsible entities and national availability: IUCN Red List Partnership (http://www.iucnredlist.org/partners/partners-and-technical-support). Available globally since 1980s, and can be disaggregated to national and regional levels (Rodrigues et al. 2014 PLoS ONE 9(11): e113934).
15.5 (and disaggregated versions for other targets)
Indicator of poaching: [Proportion of detected trade in wildlife and wildlife products that is illegal] (PIT) Definition: The proportion of detected trade in wildlife and wildlife products that is illegal is defined as the proportion of total CITES-listed wildlife seizures to the total CITES wild-sourced export permits issued. The different wildlife products traded and seized are compared and aggregated by applying a value index.
1. The records of the legal trade are collected by the CITES Secretariat and are maintained in a database by the UNEP-World Conservation Monitoring Centre, United Kingdom. All CITES Parties are required to report and data availability is good. 2.The wildlife seizure records are being collected by the CITES Secretariat and the World Customs Organization. UNODC has complied these data in a global database which contains over 125,000 seizure incidents at present. 3.Declared values for imported wildlife products. These are collected by national governments and are maintained in the World WISE database by UNODC.
UNODC (in cooperation with the CITES Secretariat)

List of Indicator Proposals - p. 232 of 265
List of Proposals* Note on Disaggregation: All indicators should be disaggregated by sex, age, residence (U/R) and other characteristics, as relevant and possible.Target 15.8 By 2020, introduce measures to prevent the introduction and significantly reduce the impact of invasive alien species on land and water ecosystems and control or eradicate the priority species
Contributor Name Specification Source Entity Tier Priority InterlinkagesSuggested Indicator IUCN ISSG (Indicator under the BIP) Tier I
Indicator 15.8.1 Adoption of national legislation relevant to the prevention or control of invasive alien species ( BAA ) UNEP IUCN ISSG (Indicator under the BIP)
IUCN 2
Indicator 15.8.2 Red List Index for birds showing trends driven by invasive alien species ( BBB ) UNEP [Red List Index for birds showing trends driven by invasive alien species] http://www.birdlife.org/datazone/sowb/casestudy/164 Birdlife (Indicator under the BIP) IUCN 1
Target 15.9 By 2020, integrate ecosystem and biodiversity values into national and local planning, development processes, poverty reduction strategies and accounts Contributor Name Specification Source Entity Tier Priority Interlinkages
Suggested Indicator Tier II
Indicator 15.9.1 National programme on the measurement of values of biodiversity or on the implementation of the SEEA-EEA ( BBB )
Indicator 15.9.2 Number of national development plans and processes integrating biodiversity and ecosystem services values ( BBB )
Target 15.a Mobilize and significantly increase financial resources from all sources to conserve and sustainable use biodiversity and ecosystems Contributor Name Specification Source Entity Tier Priority Interlinkages
Suggested Indicator Official development assistance in support of the CBD OECD (Indicator under the BIP) OECD Tier I Targets 1.a and 15.aIndicator 15.a.1 Official Development Assistance ( BBB )
UNEP OECD (Indicator under the BIP) Targets 1.a and 15.a
IUCN 1
Indicator 15.a.2 National incentive schemes that reward positive contribution to biodiversity and ecosystem services ( BBB )
Contributor Name Specification Source Entity Tier Priority InterlinkagesSuggested Indicator Forestry official development assistance and forestry FDI OECD Tier IIIndicator 15.b.1 Public funding for sustainable forest management ( BBB )
Indicator 15.b.2 Forestry official development assistance and forestry FDI ( BBB )
Adoption of national legislation relevant to the prevention or control of invasive alien species
[Adoption of national legislation relevant to the prevention or control of invasive alien species]
Currently proposed indicator: IUCN supports adoption of this indicator, which is used by the BIP as an indicator towards Aichi Target 9 (http://www.bipindicators.net/iaslegislationadoption).
Currently proposed indicator: The name of this indicator should be adjusted from “Red List Index for birds showing trends driven by invasive alien species” to be [“Red List Index (impacts of invasive alien species)”]. The indicator is used by the BIP as an indicator towards Aichi Target 9 (http://www.bipindicators.net/birdrlitrendsdrivenbyias). Note that this does not need to be restricted to birds: this indicator has been applied to mammals and amphibians too, so delete "for birds" from the title, making this consistent with Indicators 14.5.2,15.5.1, and 15.7.1. We support the inclusion of this indicator as one of the few global metrics illustrating the impact of invasive alien species on native biodiversity.
Data sources: IUCN Red List of Threatened Species (http://www.iucnredlist.org/); specifically for species coded under “8 Invasive & other problematic species, genes & diseases” in the Threats Classification Scheme (http://www.iucnredlist.org/technical-documents/classification-schemes/threats-classification-scheme).
Responsible entities and national availability: IUCN Red List Partnership (http://www.iucnredlist.org/partners/partners-and-technical-support). Available globally since 1980s, and can be disaggregated to national and regional levels (Rodrigues et al. 2014 PLoS ONE 9(11): e113934).
15.5 (and disaggregated versions for other targets)
Number of national development plans and processes integrating biodiversity and ecosystem services values
[ Official development assistance in support of the CBD ( http://www.bipindicators.net/oda ) ]
Currently proposed indicator: IUCN supports adoption of this indicator, which is used by the BIP as an indicator towards Aichi Target 20 (http://www.bipindicators.net/oda).
Target 15.b Mobilize significant resources from all sources and at all levels to finance sustainable forest management and provide adequate incentives to developing countries to advance such management, including for conservation and reforestation
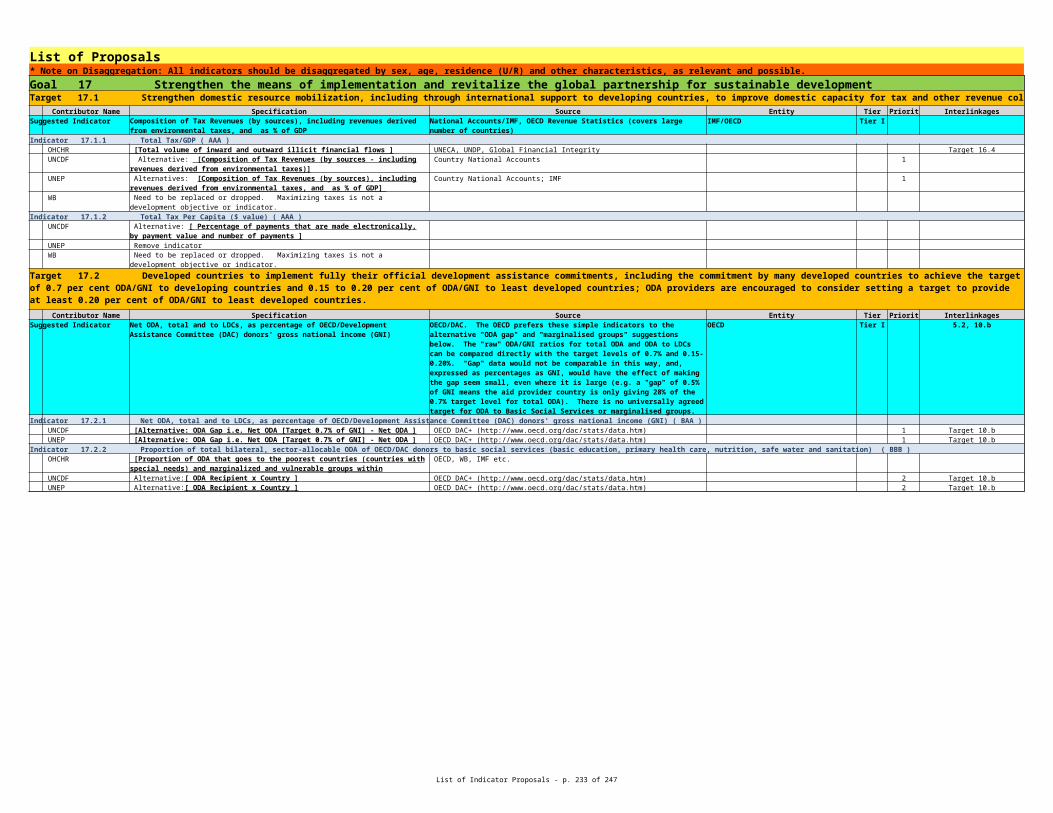
List of Indicator Proposals - p. 233 of 265
List of Proposals* Note on Disaggregation: All indicators should be disaggregated by sex, age, residence (U/R) and other characteristics, as relevant and possible.Target 15.c Enhance global support for efforts to combat poaching and trafficking of protected species, including by increasing the capacity of local communities to pursue sustainable livelihood opportunities
Contributor Name Specification Source Entity Tier Priority InterlinkagesSuggested Indicator Proportion of detected trade in wildlife and wildlife products that is illegal Tier II
Indicator 15.c.1 Ratio of indexed value of total CITES-listed wildlife seizures to indexed value of total CITES wild-sourced export permits issued ( CBB ) UNODC See above under 15.7 See above under 15.7 See above under 15.7 See above under 15.7
Indicator 15.c.2 Extent to which sustainable practices and management by women and men pastoralists, farmers, fishers, forest dwellers on common lands, including national and trans-national mobility, are legally protected and enhanced by policies and regulations ( CBB )
1. The records of the legal trade are collected by the CITES Secretariat and are maintained in a database by the UNEP-World Conservation Monitoring Centre, United Kingdom. All CITES Parties are required to report and data availability is good. 2.The wildlife seizure records are being collected by the CITES Secretariat and the World Customs Organization. UNODC has complied these data in a global database which contains over 125,000 seizure incidents at present. 3.Declared values for imported wildlife products. These are collected by national governments and are maintained in the World WISE database by UNODC.
UNODC (in cooperation with the CITES Secretariat)
See above under 15.7

List of Indicator Proposals - p. 234 of 265
List of Proposals* Note on Disaggregation: All indicators should be disaggregated by sex, age, residence (U/R) and other characteristics, as relevant and possible.
Target 16.1 Significantly reduce all forms of violence and related death rates everywhere Contributor Name Specification Source Entity Tier Priority Interlinkages
Suggested Indicator Tier I/II 5.2
Suggested Indicator Conflict-related deaths per 100,000 people (disaggregated by age, sex and cause) Tier II 16.2, 16.3, 16.4, 16.6
Indicator 16.1.1 Homicide and conflict-related deaths per 100,000 people ( AAA ) OHCHR National crime statistics 5.2, 10.3, 16.1, 16.2
1 16.2, 16.3, 16.4, 16.6
UNICEF
Goal 16 Promote peaceful and inclusive societies for sustainable development, provide access to justice for all and build effective, accountable and inclusive institutions at all levels
Number of victims of intentional homicide by age, sex, mechanism and where possible type of perpetrator, per 100,000 population
Two separate sources exist at country level: a) criminal justice system b) public health/civil registration
UNODC collects and publishes data from criminal justice systems through its annual data collection (UN Crime Trends Survey, UN-CTS); WHO collects and publishes data produced by public health/civil registration. UNODC and WHO are working together to harmonize data and procedures to produce joint UNODC-WHO homicide estimates at country, regional and global level. Considering data collected by both UNODC and WHO, national data on homicide are available for 174 countries (at least one data point after 2009). Time series data on homicide suitable for monitoring are available for 141 countries (at least 3 data points, the most recent for 2011 or later). When national data on homicide are not available, estimates are produced by WHO.
Estimates of conflict related death is collected by the IISS Armed Conflict Database, the UCDP Battle-Related Deaths Dataset, PRIO Battle-Deaths Data and WHO.
Data on conflict-related deaths is collected by the IISS Armed Conflict Database, the UCDP Battle-Related Deaths Dataset, PRIO Battle-Deaths Data and WHO estimates of deaths by cause.
[Violent crime rate (intentional homicide, assault and sexual violence, including attempts) per 100,000 population [proposed due to gender bias of homicide rate]]
Data currently collected by UNODC, but other agencies could participate.
EOSG/RoLU, PBSO, UNDP, UNODC (in consultation with others)
Retain this indicator. Disaggregate by age, sex, region and population group, displacement and migratory status (including statelessness).
This indicator contains two distinct data sources. With regards to intentional homicide, national level data is collected through the criminal justice system and the public health / civil registration. Estimates of conflict related death is collected by the IISS Armed Conflict Database, the UCDP Battle-Related Deaths Dataset, PRIO Battle-Deaths Data and WHO.
UNODC and WHO collect data on intentional homicide for 174 countries. Data on conflict-related deaths is collected by the IISS Armed Conflict Database, the UCDP Battle-Related Deaths Dataset, PRIO Battle-Deaths Data and WHO estimates of deaths by cause.
[ Homicide and conflict-related deaths per 100,000 people (disaggregated by age, sex and cause) ]

List of Indicator Proposals - p. 235 of 265
List of Proposals* Note on Disaggregation: All indicators should be disaggregated by sex, age, residence (U/R) and other characteristics, as relevant and possible.
UNODC [Number of victims of intentional homicide per 100,000 population ] 1
UNWOMEN UN Women calls for this indicator to be disaggregated by sex and age. Indicator 16.1.2 Percentage of the adult population aged 18 and older, subjected to violence within the last 12 months, by type (physical, psychological and/or sexual) ( BAA )
OHCHR Victimisation surveys 5.2, 10.3, 16.1, 16.2
Crime victimisation surveys. 2
UNODC Victimisation surveys 2 16.2
UNWOMEN UN Women calls for this indicator to be disaggregated by sex and age. GlobalMigrationWG 10.7; 11.5
3
Two separate sources exist at country level: a) criminal justice system b) public health/civil registration
UNODC collects and publishes data from criminal justice systems through its annual data collection (UN Crime Trends Survey, UN-CTS); WHO collects and publishes data produced by public health/civil registration. UNODC and WHO are working together to harmonize data and procedures to produce joint UNODC-WHO homicide estimates at country, regional and global level. Considering data collected by both UNODC and WHO, national data on homicide are available for 174 countries (at least one data point after 2009). Time series data on homicide suitable for monitoring are available for 141 countries (at least 3 data points, the most recent for 2011 or later). When national data on homicide are not available, estimates are produced by WHO.
Target 5.2: intentional homicide data, when properly disaggregated, can be used to
quantify gender-based killings, a very relevant
indicator to monitor violence against women (5.2.1 and
5.2.2)
[Percentage of the population subjected to physical, psychological or sexual violence within the last 12 months [proposed to avoid exclusion of an important group, children, from an indicator which aims to reduce all forms of violence] ]
EOSG/RoLU, PBSO, UNDP, UNODC (in consultation with others)
Retain this indicator. Disaggregate by age, sex, region and population group, displacement and migratory status (including statelessness). Ensure disaggregation by type of violence.
UNODC (on selected data also WHO, UNICEF, UN Women and the International Crime Victimization Survey (ICVS)). 72 countries have implemented at least one national victimisation survey since 2009.
16.2.2. The indicator also monitors other targets: 5.2
(women), 10.3 (hate crimes), 16.2 (children).
[Percentage of individuals who experienced violence within the last 12 months, by type (physical and sexual) ]
UNODC collects data on prevalence respectively of sexual assault and physical assault through the annual data collection UN-CTS. In UNODC data repository, prevalence data on sexual assault are available for 25 countries. According to a recent review conducted at global level, 72 countries have implemented at least one national victimisation survey after 2009
["Percentage of refugees and IDPs who have found a durable solution"] See full specification in attached meta-data word file"
administrative data maintained by host countries (ministries and agencies in charge of adjudication of refugee status, immigration authorities in charge of refugee resettlement, interior ministries in charge of issuing work and residents permits and naturalization procedures)
Members of the Global Migration Group. Existing reporting: UNHCR (Statistical Yearbook, online Population Database), IOM (Displacement Tracking Matrix); IDMC (annual reports on displacement)
EOSG/RoLU, PBSO, UNDP, UNODC (in consultation with others)
[Proportion of people that feel safe walking alone around the area where they live.] Disaggregate by age, sex, region and population group.
Crime victimisation surveys. In addition, the Harmonized Module on Peace and Security in the Strategy for the Harmonization of Statistics in Africa (SHaSA) already collects data on this indicator, disaggregating between perceptions of safety at night and in the daytime, perceptions of safety whilst walking compared to being at home, perceptions of safety on public transport, etc.
Potential for collection by the International Crime Victimization Survey (ICVS)
The indicator also monitors other targets: 5.2 (women), 10.2 (non-discrimination),
10.3 (hate crimes), 16.2 (children).

List of Indicator Proposals - p. 236 of 265
List of Proposals* Note on Disaggregation: All indicators should be disaggregated by sex, age, residence (U/R) and other characteristics, as relevant and possible.Target 16.2 End abuse, exploitations, trafficking and all forms of violence against and torture of children
Contributor Name Specification Source Entity Tier Priority InterlinkagesSuggested Indicator Tier II
Suggested Indicator National governments/Field studies Tier I Target 5.2
Indicator 16.2.1 Percentage of young adults aged 18-24 years who have experienced violence by age 18, by type (physical, psychological and/or sexual) ( BBA ) 1
UNICEF 1
UNICEF 1
UNODC Victimisation surveys 2 16.1.1
UNWOMEN UN Women calls for this indicator to be disaggregated by sex. Indicator 16.2.2 Number of victims of human trafficking per 100,000 people ( CAA )
OHCHR Multiple data sources - see attached metadata 5.2, 8.7, 16.1, 16.2, 16.4
2
UNODC National governments/Field studies 1 Target 5.2
UNWOMEN UN Women calls for this indicator to be disaggregated by sex and age. GlobalMigrationWG See full specification in attached meta-data word file 1 10.7; 16.2
Disaggregate by age, sex, region and population group. Global Migration Group 3
UNFPA ?? UNODC
Percentage of children aged 1-14 years who experienced any physical punishment by caregivers in the past month
Household surveys such as MICS that have been collecting data on this indicator in low- and middle-income countries since 2005.
UNICEF. Fully comparable data are available for some 60 low- and middle-income countries
16.1.2. The indicator also monitors other targets: 5.2
(women), 10.3 (hate crimes).
Number of detected and non-detected victims of human trafficking per 100,000; by sex, age and form of exploitation
UNODC, Data on the number of detected victims of TIP is available for over 130 countries
EOSG/RoLU, PBSO, UNDP, UNODC (in consultation with others)
Replace with ["Percentage of children aged 1-14 years who experienced any physical punishment by caregivers in the past month"]
Household surveys such as MICS that have been collecting data on this indicator in low- and middle-income countries since 2005.
UNICEF. Fully comparable data is available for some 60 low- and middle-income countries.
16.1.2. The indicator also monitors other targets: 5.2
(women), 10.3 (hate crimes).
[Percentage of young women and men aged 18-24 years who experienced sexual violence by age 18]
Household surveys, including DHS that have been collecting data on this indicator in low- and middle-income countries since the late 1990s.
UNICEF. Fully comparable data are available for some 50 low- and middle-income countries
[Percentage of children aged 1-14 years who experienced any physical punishment by caregivers in the past month ]
Household surveys such as MICS that have been collecting data on this indicator in low- and middle-income countries since 2005.
UNICEF. Fully comparable data are available for some 60 low- and middle-income countries
[ Percentage of young adults aged 18-24 years subject to violence by age 18, by type (physical and sexual)]
UNODC collects data on prevalence of physical and sexual assault (see indicator 16.1.2), the suggested indicator 16.2.1 should be newly collected.
[Reported number of victims of trafficking (within and across countries), slavery, exploitation and forced labour ]
EOSG/RoLU, PBSO, UNDP, UNODC (in consultation with others)
Replace with "[Percentage of young women and men aged 18-24 years who experienced sexual violence by age 18"]
Household surveys, including DHS that have been collecting data on this indicator in low- and middle-income countries since the late 1990s.
UNICEF. Fully comparable data is available for some 50 low- and middle-income countries.
16.2.2. The indicator also monitors other targets: 5.2
(women), 10.3 (hate crimes).
[Number of detected and non-detected victims of human trafficking per 100,000; by sex, age and form of exploitation]
UNODC, Data on the number of detected victims of TIP is available for over 130 countries
Administrative statistics from the criminal justice system (courts, police, etc.); disaggregate by migratory status. Current data sources include the UNODC Global Report on Trafficking in Persons, the U.S. Department of State's Trafficking in Persons Report; IOM Trafficked Migrants Assistance Database
Ministries of Justice/Interior, Global Migration Group
EOSG/RoLU, PBSO, UNDP, UNODC (in consultation with others)
Administrative data from the criminal justice system. Current global data sources include the UNODC Global Report on Trafficking Persons, the U.S. Department of State's Trafficking in Persons Report; IOM Trafficked Migrants Assistance Database.
This indicator also monitors target 5.2 (women), 8.7
(worst forms of child labour and forced labour), 10.7
(migration), 16.1 (violence), 16.4 (organized crime).
Alternative suggestion could be: [Number of reported victims of human trafficking as per the Palermo Protocol, to help address possible underreporting]. (UNODC)

List of Indicator Proposals - p. 237 of 265
List of Proposals* Note on Disaggregation: All indicators should be disaggregated by sex, age, residence (U/R) and other characteristics, as relevant and possible.Target 16.3 Promote the rule of law at the national and international levels and ensure equal access to justice for all
Contributor Name Specification Source Entity Tier Priority InterlinkagesSuggested Indicator Victimisation surveys Tier II 16.a
Suggested Indicator Unsentenced detainees as percentage of overall prison population Prison administration Tier II
Indicator 16.3.1 Percentage of people who have experienced a dispute, reporting access to an adequate dispute resolution mechanism ( CBB ) Household surveys; data is available for 107 countries World Bank (prospective) 1 16.6, 16.b
UNODC Victimisation surveys 2 16.a
UNWOMEN
WB Household surveys World Bank (prospective); 107 1 16.6; 16.b
Indicator 16.3.2 Percentage of total detainees who have been held in detention for more than 12 months while awaiting sentencing or a final disposition of their case ( BAA ) OHCHR [Average period of pre-trial detention] Administrative data 16.3, 16.6, 16.10
2
UNODC [Unsentenced detainees as percentage of overall prison population] Prison administration 1 16.6
UNWOMEN UN Women calls for this indicator to be disaggregated by sex and age.
Percentage of victims of violence in the previous 12 months who reported their victimization to competent authorities or other officially recognized conflict resolution mechanisms (also called crime reporting rate)
UNODC collects data on crime reporting rate through the annual data collection UN-CTS. Data on crime reporting rates are currently available for approx. 35 countries.
UNODC collects data on prisons through its annual data collection (UN-CTS). Data on unsentenced and total detainees from the UN-CTS are available from 114 countries. The country coverage can improve if other sources (NGOs) are included (data for additional 70 countries are available, bringing the total to 184 countries).
EOSG/RoLU, PBSO, UNDP, UNODC (in consultation with others)
Replace with ["Proportion of those who have experienced a dispute in the past 12 months and who have accessed a fair formal, informal, alternative or traditional dispute mechanism."] Whether a mechanism is \fair" is measured as reported by persons experiencing dispute, with a focus on the process of dispute resolution and not the outcome. Experience has shown respondents are able to separate outcome from the fairness of the process itself. Disaggregate by age, sex, region and population group. Ensure disaggregation by type of mechanism."
[Percentage of victims of violence in the previous 12 months who reported their victimization to competent authorities or other officially recognized conflict resolution mechanisms (also called crime reporting rate).]
UNODC collects data on crime reporting rate through the annual data collection UN-CTS. Data on crime reporting rates are currently available for approx. 35 countries.
UN Women calls for this indicator to be disaggregated by sex, location, income and other context specific factors.
[Proportion of those who have experienced a dispute in the past 12 months and who have accessed a fair formal, informal, alternative or traditional dispute mechanism]
EOSG/RoLU, PBSO, UNDP, UNODC (in consultation with others)
Replace with \[Unsentenced detainees as percentage of overall prison population."] Disaggregate by age, sex, region and population group. This indicator, with a focus on an important aspect of the criminal justice system, is complementary to the first indicator."
UNODC collects data through its annual data collection (UN Survey of Crime Trends and the Operations of Criminal Justice Systems, UN-CTS). UN-CTS includes data for 114 countries. This coverage could increase to 184 countries if other sources (research institutions and NGOs) are included.
UNODC, United Nations Survey of Crime Trends and the Operations of Criminal Justice Systems mandated by the UN General Assembly (UN-CTS).
This indicator monitors target 16.6 (effective
institutions) and 16.10 (fundamental freedoms)
UNODC collects data on prisons through its annual data collection (UN-CTS). Data on unsentenced and total detainees from the UN-CTS are available from 114 countries. The country coverage can improve if other sources (NGOs) are included (data for additional 70 countries are available, bringing the total to 184 countries).

List of Indicator Proposals - p. 238 of 265
List of Proposals* Note on Disaggregation: All indicators should be disaggregated by sex, age, residence (U/R) and other characteristics, as relevant and possible.Target 16.4 By 2030, significantly reduce illicit financial and arms flows, strengthen the recovery and return of stolen assets and combat all forms of organized crime
Contributor Name Specification Source Entity Tier Priority InterlinkagesSuggested Indicator Total value of inward and outward illicit financial flows (in current US$). http://www.gfintegrity.org/issues/data-by-country/ Tier II
Suggested Indicator Tier III
Indicator 16.4.1 Total volume of inward and outward illicit financial flows ( CBB ) http://www.gfintegrity.org/issues/data-by-country/ 1
WB
2 16.1, 16.2, 16.3, 16.6
Perhaps the IMF should be responsible. The FfD draft text of 6 May 2015 "invite[s] the United Nations, IMF and the World Bank in collaboration with regional organizations, to publish official estimates of their volume and breakdown". GFI publishes data for 151 countries."
Target 16.5 (illicit financial flows include monies
received through corruption). Target 8.3 (development-oriented policies). Target 17.1 (illicit financial flows
includes tax avoidance and tax evasion, which reduces
domestic tax revenues)
Percentage of seized and collected firearms that are recorded and traced, in accordance with international standards and legal instruments
UNODC has been mandated by the Conference of the Parties to the United Nations Convention Against Transnational Organized Crime to collect indicators related to firearm trafficking including the one proposed here.
EOSG/RoLU, PBSO, UNDP, UNODC (in consultation with others)
Replace with \[Total value of inward and outward illicit financial flows (in current US$)."] The indicator covers various aspects of this target, including revenues emanating from illicit arms sales and organized crime. The UN Economic Commission for Africa, UNDP, Global Financial Integrity and others have produced global country-by-country estimates for illicit financial flows. See separate Technical information on methodologies. "
Perhaps the IMF should be responsible. The FfD draft text of 6 May 2015 "invite[s] the United Nations, IMF and the World Bank in collaboration with regional organizations, to publish official estimates of their volume and breakdown". GFI publishes data for 151 countries."
Target 16.5 (illicit financial flows include monies received through corruption). Target 8.3 (development-oriented policies). Target 17.1 (illicit financial flows includes tax avoidance and tax evasion, which reduces domestic tax
revenues)
Additional indicators could be: [(1) Criminal investigations and prosecutions focusing on combatting corruption, tax evasion, criminal networks and money laundering; by country (number of cases); and (2) Freezing, confiscation/recovery and return of proceeds of crime (with details on key crimes), by country (US$). ]
Sources for these indicators are: FATF - Financial Action Task Force and its affiliates; UNCAC Conference of State Parties; Country data; OECD/Global Forum data (bribery, tax, asset recovery and development).
EOSG/RoLU, PBSO, UNDP, UNODC (in consultation with others)
[Percentage of small arms marked and recorded at the time of import in accordance with international standards.] Compliance with international standards (see "sources and data collection" below for further definition) will require a state to mark and record actual numbers of arms imported into the country. This is an important indicator that contributes effectively to measuring the reduction in illicit arms flows. The international standards include those agreed to by all UN Member States in the International Tracing Instrument and required of States party to the UN Firearms Protocol.
1. International standards on import marking: <U+0095> International Instrument to Enable States to Identify and Trace, in a Timely and Reliable Manner, Illicit Small Arms and Light Weapons (Article 8.b) (Note: Politically-binding agreement applicable to all UN Member States; also known as the International Tracing Instrument). <U+0095> Firearms Protocol supplementing the UN Convention Against Transnational Organized Crime (Article 8.1.b) (Note: Legally binding agreement applicable only to States Parties). <U+0095> International Small Arms Control Standards (ISACS) Module 05.30, "Marking and Recordkeeping" (Note: ISACS, developed by the UN, synthesizes the import marking standards contained in the above two instruments). 2. Data on whether States conduct import marking <U+0095> Biennial national reports on States' implementation of the International Tracing Instrument (Note: States have been reporting on their implementation of the ITI since it was negotiated in 2005. As such, data can be collected by means of an already existing reporting mechanism). <U+0095> Monitoring of States' implementation of the Firearms Protocol. "
UN Office for Disarmament Affairs (UNODA) (Note: UNODA is the repository for national reports on implementation of the International Tracing Instrument, including on import marking). UN Institute for Disarmament Research (UNIDIR) (Note: UNIDIR has conducted analyses of States' implementation of the International Tracing Instrument, including on import marking). For implementation of the Firearms Protocol: UNODC

List of Indicator Proposals - p. 239 of 265
List of Proposals* Note on Disaggregation: All indicators should be disaggregated by sex, age, residence (U/R) and other characteristics, as relevant and possible.
UNODC 1Percentage of seized and collected firearms that are recorded and traced, in accordance with international standards and legal instruments
UNODC has been mandated by the Conference of the Parties to the United Nations Convention Against Transnational Organized Crime to collect indicators related to firearm trafficking including the one proposed here.
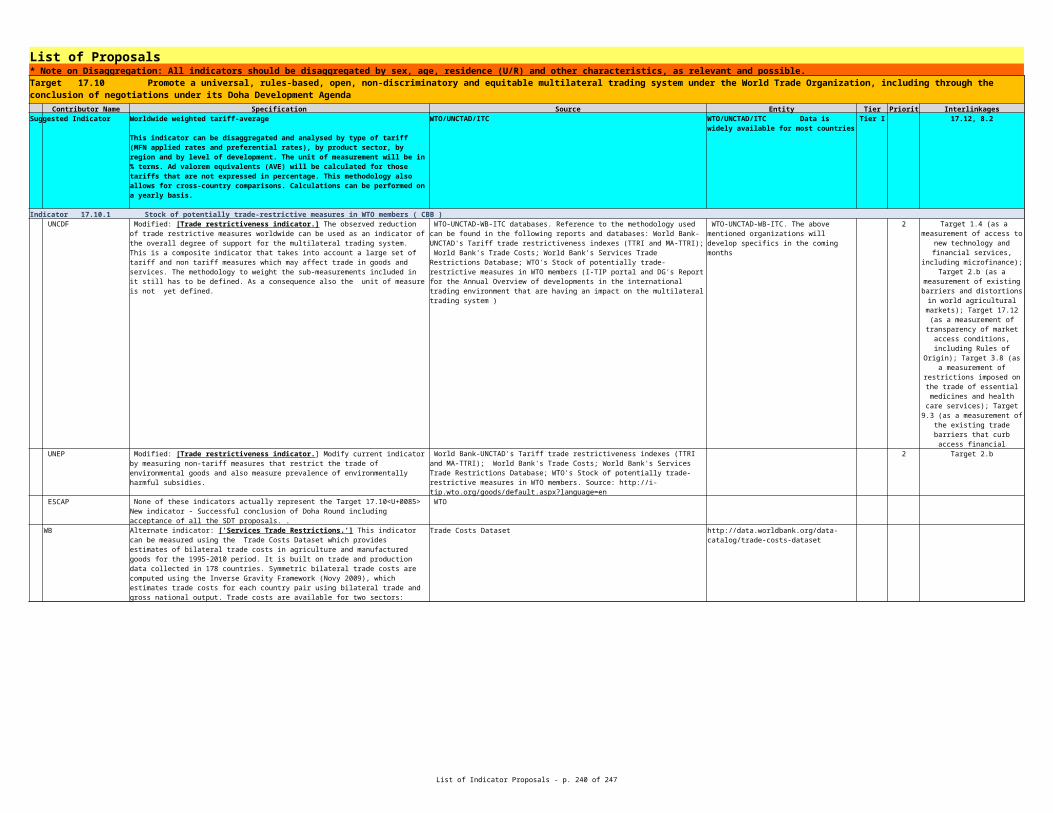
List of Indicator Proposals - p. 240 of 265
List of Proposals* Note on Disaggregation: All indicators should be disaggregated by sex, age, residence (U/R) and other characteristics, as relevant and possible.Target 16.5 Substantially reduce corruption and bribery in all their forms
Contributor Name Specification Source Entity Tier Priority InterlinkagesSuggested Indicator Tier II
Indicator 16.5.1 Percentage of population who paid a bribe to a public official, or were asked for a bribe by these public officials, during the last 12 months ( CBB ) 1
UNODC Household corruption surveys or victimisation surveys with module on bribery 1
Indicator 16.5.2 Percentage of businesses that paid a bribe to a public official, or were asked for a bribe by these public officials, during the last 12 months ( CBB ) UNODC 2
Percentage of persons who had at least one contact with a public official, who paid a bribe to a public official, or were asked for a bribe by these public officials, during the last 12 months. Disaggregate by age, sex, region and population group. This concept of bribery prevalence makes clear that it has to be measured amongst those who had contact with a public official.
Household corruption surveys and victimisation surveys with a module on bribery. At least 72 countries have implemented at least one national victimisation survey after 2009. In addition, 9 African countries have already implemented or are in the process of implementing a victimisation survey module as part of the Strategy for Harmonisation of Statistics for Africa (SHaSA).
UNODC collects prevalence data on bribery from surveys through the annual United Nations Survey of Crime Trends and the Operations of Criminal Justice Systems mandated by the UN General Assembly (UN-CTS).
This indicator is proposed to monitor the following
targets: 1.4 (access to basic services), 1a (resource
mobilization), 10.b (ODA), 16.3 (rule of law), 16.6
(accountable institutions), 16.10 (protection of
fundamental freedoms), 17.1 (domestic resource
mobilization).
EOSG/RoLU, PBSO, UNDP, UNODC (in consultation with others)
Replace with ["Percentage of persons who had at least one contact with a public official, who paid a bribe to a public official, or were asked for a bribe by these public officials, during the last 12 months."] Disaggregate by age, sex, region and population group. This concept of bribery prevalence makes clear that it has to be measured amongst those who had contact with a public official."
Household corruption surveys and victimisation surveys with a module on bribery. At least 72 countries have implemented at least one national victimisation survey after 2009. In addition, 9 African countries have already implemented or are in the process of implementing a victimisation survey module as part of the Strategy for Harmonisation of Statistics for Africa (SHaSA).
UNODC collects prevalence data on bribery from surveys through the annual United Nations Survey of Crime Trends and the Operations of Criminal Justice Systems mandated by the UN General Assembly (UN-CTS).
This indicator is proposed to monitor the following targets: 1.4 (access to basic services),
1a (resource mobilization), 10.b (ODA), 16.3 (rule of law),
16.6 (accountable institutions), 16.10
(protection of fundamental freedoms), 17.1 (domestic
resource mobilization).
[ Number of persons who paid a bribe to a public official, or were asked for a bribe by these public officials, during the last 12 months as a percentage of persons who had at least one contact with a public official in the same period (also called bribery prevalence) ]
UNODC collects data on bribery prevalence through the annual data collection UN-CTS. Taking into account replies to UN-CTS and other bribery prevalence data produced by national statistical offices, no less than 20 countries have bribery prevalence data officially produced. This number does not include data derived from corruption surveys produced by NGOs, research institutions and others.
16.3: bribery prevalence is relevant to monitor rule of
law. Moreover, bribery prevalence among justice/law enforcement officials is used to monitor access to justice
EOSG/RoLU, PBSO, UNDP, UNODC (in consultation with others)
Replace with ["Percentage of businesses who had at least one contact with a public official, who paid a bribe to a public official, or were asked for a bribe by these public officials, during the last 12 months."] This concept of bribery prevalence makes clear that it has to be measured amongst those businesses who had contact with a public official."
Business corruption surveys or business victimisation surveys with module on bribery.
This indicator is proposed to monitor the following targets:
1a (resource mobilization), 8.3 (promotion of private
enterprise, 10.b (ODA), 12.2 (sustainable development of natural resources), 16.3 (rule
of law), 16.6 (accountable institutions), 16.10
(protection of fundamental freedoms), 17.1 (domestic
resource mobilization).

List of Indicator Proposals - p. 241 of 265
List of Proposals* Note on Disaggregation: All indicators should be disaggregated by sex, age, residence (U/R) and other characteristics, as relevant and possible.
UNODC 2 16.3 [Number of businesses that paid a bribe to a public official, or were asked for a bribe by these public officials, during the last 12 months as a percentage of all businesses who had at least one contact with a public official in the same period ]
Business corruption surveys or business victimisation surveys with module on bribery
Business bribery surveys have been carried out in a number of countries around the world and could be replicated in other countries. UNODC provides advice and technical support to interested countries.

List of Indicator Proposals - p. 242 of 265
List of Proposals* Note on Disaggregation: All indicators should be disaggregated by sex, age, residence (U/R) and other characteristics, as relevant and possible.Target 16.6 Develop effective, accountable and transparent institutions at all levels
Contributor Name Specification Source Entity Tier Priority InterlinkagesSuggested Indicator Primary government expenditures as a percentage of original approved budget Tier I
Suggested Indicator Review Mechanism of the United Nations Convention against Corruption 16.5
Indicator 16.6.1 Actual primary expenditures per sector and revenues as a percentage of the original approved budget of the government ( BBB ) 1
UNODC Review Mechanism of the United Nations Convention against Corruption 1 16.5
WB PEFA -www.pefa.org
OECD OECD 2 16.5, 16.7
Indicator 16.6.2 Proportion of population satisfied with the quality of public services, disaggregated by service ( BAA ) UNDP 2
UNWOMEN UN Women calls for this indicator to be disaggregated by sex.
Data for 149 countries (collected on 398+ occasions) available at www.pefa.org.
PEFA Secretariat (World Bank); 149 countries
This indicator is also relevant for targets: 1.3 (social
protection), 3.8 (health coverage), 4.1 (education), 17.1 (domestic resources),
17.9 (capacity building), 17.13 (macroeconomic
stability).
Percentage of recommendations to strengthen national anti-corruption frameworks (institutional and legislative) implemented, as identified through the UNCAC Implementation Review Mechanism.
All 175+ States Party to the UNCAC are subject to a periodic review in the UNCAC Review Mechanism. To date, with well over 90 reviews finalised and another 30 in advanced stages.
EOSG/RoLU, PBSO, UNDP, UNODC (in consultation with others)
Replace with [\Primary government expenditures as a percentage of original approved budget"]. This indicator can be based on the Public Expenditure and Financial Accountability (PEFA) Program (PEFA PI-2). PEFA PI-2 considers (i) the variation between approved budget and final expenditure for the year for each major function (comparable to a sector) (ii) variation in expenditure from the original budget by economic classification and (iii) the average amount charged to the contingency reserve over the last 3 years. "
Data for 149 countries (collected on 398+ occasions) available at www.pefa.org. PEFA Secretariat (World Bank); 149 countries
This indicator is also relevant for targets: 1.3 (social
protection), 3.8 (health coverage), 4.1 (education), 17.1 (domestic resources),
17.9 (capacity building), 17.13 (macroeconomic stability).
[ Percentage of recommendations to strengthen national anti-corruption frameworks (institutional and legislative) implemented, as identified through the UNCAC Implementation Review Mechanism. ]
All 175+ States Party to the UNCAC are subject to a periodic review in the UNCAC Review Mechanism. To date, with well over 90 reviews finalised and another 30 in advanced stages.
[Composition of expenditure outturn compared to original approved budget (PEFA P1-2) ]
PEFA Secretariat (World Bank); 149 countries
[Placeholder for indicators under development: (1) Trust in institutions (focus on share of people trusting the judicial system) ; (2) Generalised trust (share of people trusting others]
The OECD Guidelines on Measuring Trust will be completed by the end of 2016. See http://www.oecd.org/statistics/measuring-well-being-and-progress.htm
EOSG/RoLU, PBSO, UNDP, UNODC (in consultation with others)
Replace with ["proportion of population satisfied with their last experience of public services"]. Ensure disaggregation by service. This outcome indicator focusses on the effectiveness aspect of the target, and indirectly on the accountability aspect, drawing on population sample-surveys. This indicator seeks to cover effectiveness via population sample-surveys, in which it is a well-precedented question. It also covers accountability indirectly, in that service provision must be responsive to the needs of the population. An element of experience is also included by referring to respondent's satisfaction with their own most recent experience of public services. The results may be triangulated with public-services access or quality indicators for other goals based on administrative data, eg. water and sanitation, education, health etc. It can be buttressed with results from expert assessments on experience or satisfaction with, and quality of, public services.
The data as currently collected by perception surveys such as the World Value Survey, Gallup, Afrobarometer and the other Barometers, and various NSOs, is globally or regionally comparable. The general methodology is well-precedented among NSOs in developed and developing countries. Regional Barometers (eg. 19 countries in Africa in 2014 amongst 36 in total since the Afrobarometer process started, 10 Arab states in the Arabbarometer, 18 Latin American states in the Latinobarometer, 13 Asian states with three surveys and a further five with at least one survey each). The World Values Survey asks respondents in 60 countries (for the 6th Wave, 2010-2014) about confidence in institutions including the armed forces, the police, the courts, government and parliament. See supplementary material by UNDP.
16.a., 16.3., 116.6, 16.9 and all other targets with access
to basic services such as health, education etc. (1.4
(access to basic services), 3.8 (health care), 4.1, 4.2, 4a (education), 7.1 (energy),
10.2 (social inclusion), 11.1 (housing).

List of Indicator Proposals - p. 243 of 265
List of Proposals* Note on Disaggregation: All indicators should be disaggregated by sex, age, residence (U/R) and other characteristics, as relevant and possible.Target 16.7 Ensure responsive, inclusive, participatory and representative decision-making at all levels
Contributor Name Specification Source Entity Tier Priority InterlinkagesSuggested Indicator UN Women, OHCHR, IPU. Tier II Target 5.5.
Suggested Indicator UNFPA COAR database UNFPA Tier III
Indicator 16.7.1 Diversity in representation in key decision-making bodies (legislature, executive, and judiciary) ( BBA ) OHCHR Administrative data On women, UN Women. 1 5.5, 10.2, 16.7
UN Women, OHCHR, IPU. 1 Target 5.5.
UNFPA 1
Indicator 16.7.2 Percentage of population who believe decision-making at all levels is inclusive and responsive ( CBB ) IPU, IDEA. 2 16.6
UNWOMEN UN Women calls for this indicator to be disaggregated by sex and age. UNFPA UNFPA COAR database UNFPA
3 16.3
Proportions of positions (by age, sex, disability and population groups) in public institutions (national and local legislatures, public service, and judiciary) compared to national distributions.
National administrative sources. Global Barometer Study: http://www.jdsurvey.net/gbs/gbs.jsp , World Values Survey: http://www.worldvaluessurvey.org/wvs.jsp , Gallup World Poll: http://www.gallup.com/services/170945/world-poll.aspx , See SHaSA Harmonised Module on Democratic Governance, in the supplementary materials.
Proportion of countries that address young people's multisectoral needs with their national development plans and poverty reduction strategies
[Proportion of public service positions held by women and members of target groups ]
EOSG/RoLU, PBSO, UNDP, UNODC (in consultation with others)
Replace with ["Proportions of positions (by sex, disability and population groups) in public institutions (national and local legislatures, public service, and judiciary) compared to national distributions."] This indicator focuses on the representativeness aspect of the target, but the presence of diversity also conduces to inclusivity and responsiveness of decision-making. It is also easy to understand and communicate. Disaggregation by sex and disability are most immediately feasible, and region of origin could be specified. Ethnicity would be defined at the country level , and could include ethnic or religious groups, indigenous populations, etc. One particular disaggregation compares with Goal 5.5, namely local government by sex. [Comparison to national distributions may require affirmative action in some settings to ensure that certain populations are effectively included.]
The data was to be collected from national administrative information. Global Barometer Study: http://www.jdsurvey.net/gbs/gbs.jsp , World Values Survey: http://www.worldvaluessurvey.org/wvs.jsp , Gallup World Poll: http://www.gallup.com/services/170945/world-poll.aspx , See SHaSA Harmonised Module on Democratic Governance, in the supplementary materials.
[Diversity in representation in key decision-making bodies (legislature, executive, and judiciary).] Disaggregation by sex, age, region and other prohibited grounds of discrimination.
EOSG/RoLU, PBSO, UNDP, UNODC (in consultation with others)
"Replace with ["Turnout as a share of voting-age population in national elections."] This outcome indicator focusses on the inclusion, participation and representation aspects of the target, and indirectly on the responsiveness aspect, drawing on administrative data from government sources, buttressed by expert collation of comparable data across different countries. This indicator seeks to measure increases in inclusion, participation and representation in terms of turn-out of eligible voters in elections. At country level, disaggregation will be possible as a matter of course by geographical area. More sophisticated systems may be required for disaggregation by sex and other characteristics whilst preserving anonymity."
Data on turn-out relative to eligibility/voting-age population will be collected routinely by national authorities, including electoral bodies (registration of voters), national registration entities (birth registration, national identity, social security entitlement, etc.). Turn-out will be tabulated at the time of election based on votes tallied by the electoral authorities. In addition, international organisations such as the International Institute for Democracy and Electoral Assistance (IDEA) maintains detailed tables on turn-out and registration at multiple levels for all countries of the world. This indicator is efficient for cross-country comparison, assuming comparability of different levels of elections - eg. Presidential, Parliamentary, local, etc. IDEA maintains databases at all levels. http://www.idea.int/vt/viewdata.cfm#""
Alt. sugg: [Proportion of countries that address young people's multisectoral needs within their National Development Plans and poverty reduction strategies ]
EOSG/RoLU, PBSO, UNDP, UNODC (in consultation with others)
[Extent to which legislature conducts public hearings during budget cycle.] This indicator offers a precisely definable specification in a key domain of citizen participation in decision-making. The level referred to would be categorized, or else could be treated as a yes/no treaty indicator. Support for public participation in budgeting has been affirmed by the High Level Principles on Fiscal Transparency issued by the Global Initiative for Fiscal Transparency (GIFT) and endorsed by UN General Assembly Resolution 67/218. The IMF included public participation as an indicator in its revised Fiscal Transparency Code, as did the OECD in its Principles of Budgetary Governance.
The International Budget Partnership surveyed public participation in the budget process in 100 countries for the Open Budget Survey 2012 and 102 countries for the 2015 Survey (being released on September 9th 2015). The evidence from the 2012 survey shows, for example, that in 28 countries (developed and developing) the public is offered opportunities to testify during legislative budget hearings on the macroeconomic and fiscal framework presented in the budget. http://internationalbudget.org/what-we-do/open-budget-survey/

List of Indicator Proposals - p. 244 of 265
List of Proposals* Note on Disaggregation: All indicators should be disaggregated by sex, age, residence (U/R) and other characteristics, as relevant and possible.Target 16.8 Broaden and strengthen the participation of developing countries in the institutions of global governance
Contributor Name Specification Source Entity Tier Priority InterlinkagesSuggested Indicator Administrative data of international organizations. Tier I
Indicator 16.8.1 Percentage of voting rights in international organizations of developing countries ( CBB ) Administrative data of international organizations 1
Percentage of members or voting rights of developing countries in international organizations.
United Nations/DESA. Data would be available for all international organizations.
Target 10.6 (which focuses on global international economic and financial
institutions). Target 16.3 (rule of law at international level). Target 16.7 (which
focuses on inclusive, participatory and
representative decision-making AT ALL LEVELs).
Target 17.10 (non-discriminatory and equitable multilateral trading system).
EOSG/RoLU, PBSO, UNDP, UNODC (in consultation with others)
Rephrase: ["Percentage of members or voting rights of developing countries in international organizations."] Representation and participation of developing countries in international organizations, including international financial institutions, is often below their relative weight in the world. This indicator would measure the representativeness of developing countries in international organizations. This indicator would be easily measurable by way of data collected by international organizations. The indicator would require a list of international organizations that would be included in the calculation. The indicator could be calculated by taking the simple average of the international organizations on the list. The phrase "global governance" in the target would suggest that the list of international organizations should be limited to organizations with a global mandate. This is a global indicator, not a national indicator. National Statistical Offices need not be involved. The rating CBB from the survey is, therefore, odd, especially the C rating because the data on membership and voting rights is readily available. "
United Nations/DESA. Data would be available for all international organizations.
Target 10.6 (which focuses on global international economic and financial
institutions). Target 16.3 (rule of law at international level). Target 16.7 (which
focuses on inclusive, participatory and
representative decision-making AT ALL LEVELs).
Target 17.10 (non-discriminatory and equitable multilateral trading system).

List of Indicator Proposals - p. 245 of 265
List of Proposals* Note on Disaggregation: All indicators should be disaggregated by sex, age, residence (U/R) and other characteristics, as relevant and possible.Target 16.9 By 2030, provide legal identity for all, including birth registration
Contributor Name Specification Source Entity Tier Priority InterlinkagesSuggested Indicator Percentage of children under 5 whose births have been registered with civil authority Household surveys and vital registration systems. UNICEF, WHO, WB, UNSD, UNFPA Tier I
Indicator 16.9.1 Percentage of children under 5 whose births have been registered with civil authority ( AAA ) Household surveys such as MICS and vital registration systems. 1
UNICEF Household surveys such as MICS and vital registration systems. 1
UNWOMEN UN Women calls for this indicator to be disaggregated by sex. WB
GlobalMigrationWG NB! Disaggregate by migratory status UNFPA UNICEF, WHO, World Bank and Regional Economic Commissions databases
EOSG/RoLU, PBSO, UNDP, UNODC (in consultation with others)
Retain this indicator. Disaggregate by age, sex, region and population group, displacement and migratory status (including statelessness).
UNICEF. Rationale: Unisex maintains a global database on the issue since 2003. Comparable data are available for more than 160 countries
This indicator also relates to target 4.1 and 4.2.
[Percentage of children under 5 whose births have been registered with civil authority ]
UNICEF. Rationale: Unisex maintains a global database on the issue since 2003. Comparable data are available for more than 160 countries
The proposed indicator 16.9.1 - Percentage of children under 5 whose births have been registered with civil authority - is not in line with the Global CRVS investment plan which the World Bank developed in consultation with several agencies and countries last year. http://www.worldbank.org/en/topic/health/publication/global-civil-registration-vital-statistics-scaling-up-investment . We propose [Percentage of children under 1 whose births have been registered with civil authority which is in line with national laws/guidelines. ]The UN Principles and Recommendations for a Vital Statistics System states that birth registration should be "immediate" (where defined, this is usually 7-30 days); up to 12 months is viewed as "late registration" and beyond 12 months is "delayed registration." Many countries are using this to define their own laws. Measurement of implementation should be consistent with this.
[Percentage of children under 1 whose births have been registered with civil authority]
UNICEF, WHO, World Bank, UNSD and UNFPA

List of Indicator Proposals - p. 246 of 265
List of Proposals* Note on Disaggregation: All indicators should be disaggregated by sex, age, residence (U/R) and other characteristics, as relevant and possible.Target 16.10 Ensure public access to information and protect fundamental freedoms, in accordance with national legislation and international agreements
Contributor Name Specification Source Entity Tier Priority InterlinkagesSuggested Indicator Tier I
Indicator 16.10.1 Percentage of actual government budget, procurement, revenues and natural resource concessions that are publicly available and easily accessible ( BBA )
UNESCO 1
WB [Public access to key fiscal information (PEFA PI-9) ] PEFA -www.pefa.org
Number of verified cases of killing, kidnapping, enforced disappearance, arbitrary detention and torture of journalists, associated media personnel, trade unionists and human rights advocates in the previous 12 months
This indicator collates data from multiple sources, including National Human Rights Institutions, national non-governmental organisations, associations of journalists, trades unions, ILO, and international non-governmental organisations. Information on the number of violations committed against human rights defenders will be compiled annually by OHCHR from these data sources and further data collected through individual complaints to human rights treaty bodies, and Special Procedures of the Human Rights Council, including the Special Rapporteurs on human rights defenders, on freedom of opinion and expression, torture, the Working Group on Enforced or Involuntary Disappearances, and the Working Group on Arbitrary Detention. Additional data from OHCHR field offices and UN Country Teams will also be included. These data will be verified, cross-checked to ensure no duplication, and compiled in line with the agreed international definitions outlined above. Information on the number of journalists killed are compiled annually by UNESCO from data collected through multi-sourced research, including press reports, information from monitoring groups, direct reports, and information from UNESCO field offices and other UN bodies. Reports of killings compiled by UNESCO are then transmitted for clarification on the status of judicial investigation to Member States and categorized into the following: 1) no information received so far; 2) on-going; 3) resolved; 4) killed in cross-fire; and 5) others. This information can be found at the annual report by the UNESCO Director-General on 'The Safety of Journalists and the Danger of Impunity'.
OHCHR, UNESCO, ILO, ITUC, IFJ. Availability: Information from ILO on all ILO member states (185); from ITUC on all United Nations member states; and from IFJ (International Federation of Journalists) on 134 countries.
This indicator is proposed to monitor the following
targets: 5.2 (violence against women), 16.1 (violence and deaths), 16.3 (rule of law),
16.6 (accountable institutions), 16.10
(protection of fundamental freedoms).
EOSG/RoLU, PBSO, UNDP, UNODC (in consultation with others)
Replace with ["Percentage of government revenues, procurement and natural resource concessions that are publicly available and easily accessible in open data format"]. This indicator can be based on Indicator I-9 of Public Expenditure and Financial Accountability (PEFA), \Public access to key fiscal information", which identifies the budget proposal, enacted budget, in-year execution reports and audited annual financial report as things that are basic requirements for public access - which covers the entire life-cycle of the budget documents comprehensively. It also identifies external audit reports as documents that should be made available. Where they exist, the audit reports would address matters relating to the reliability of procurement and natural resource concessions, and any other matters affecting the management and use of public resources. Ideally, public access would conform with the "open data format". The "Open Definition" [http://opendefinition.org/] sets out principles that define "openness" in relation to data and content. It makes precise the meaning of "open" in the terms "open data" and "open content" and thereby ensures quality and encourages compatibility between different pools of open material. It can be summed up in the statement that " 'open' means anyone can freely access, use, modify and share for any purpose (subject, at most, to requirements that preserve provenance and openness)". In the UK, for example, guidelines encourage government data producers to publish documents in "file formats that reflect the nature of the information they contain, and the uses to which they will likely be put" [https://www.gov.uk/service-manual/user-centred-design/choosing-appropriate-formats.html]. "
Data for 149 countries (collected on 398+ occasions) available at www.pefa.org. PEFA Secretariat (World Bank); 149 countries
Also related to targets 16.3 and 16.6
UNESCO proposes to adjust this indicator and reword it to: \[Number of countries that have adopted and implemented constitutional, statutory and/or policy guarantees for public access to information (yes or no)"] Disaggregations: none"
Media regulators (including self-regulatory media associations); Academic and research institutions; Media support NGOs (national and international).
UNESCO-UIS (data currently available for 56 countries) and UNESCO Communications Sector (see metadata for more information)
PEFA Secretariat (World Bank); 149 countries

List of Indicator Proposals - p. 247 of 265
List of Proposals* Note on Disaggregation: All indicators should be disaggregated by sex, age, residence (U/R) and other characteristics, as relevant and possible.Indicator 16.10.2 Number of journalists, associated media personnel and human rights advocates killed, kidnapped, disappeared, detained or tortured in the last 12 months ( CBB )
ILO/UNESCO ILO/ITUC for trade unions. Media reports. 8.8
ITU
OHCHR Multiple data sources - see attached metadata OHCHR, UNESCO 1 5.2, 16.1, 16.3, 16.6, 16.10
UNESCO UNESCO Communications Sector 2
UNWOMEN UN Women calls for this indicator to be disaggregated by sex.
Alternative text: [Number of journalists, associated media personnel, trade unionists and human rights advocates killed, kidnapped, disappeared, detained or tortured in the last 12 months]
Responsible entities: ILO, ITUC, IFJ. Availability: Information from ILO on all ILO member states (185); from ITUC on all United Nations member states; and from IFJ (International Federation of Journalists) on 134 countries.
Proposed alternative indicator: [Proportion of individuals using the Internet.] Data for this indicator are collected by NSOs, through household surveys . Between 2011-2014 data for this indicator exist for 100 countries, for at least one year. For countries that do not collect data for this indicator through household surveys, ITU estimates the data, based on subscription data. In total, ITU has data for this indicator for 200 economies, and on a yearly basis.
ITU has data for this indicator for 200 economies, and on a yearly basis.
1.4, 2c, 5b, 9c, 10.3, 12.8, 16.10, 16.6, 16.7, 17.6, 17.8
[Number of verified cases of killing, enforced disappearance, arbitrary detention, assault and torture of journalists, trade unionists or human rights defenders]
EOSG/RoLU, PBSO, UNDP, UNODC (in consultation with others)
Replace with ["Number of verified cases of killing, kidnapping, enforced disappearance, arbitrary detention and torture of journalists, associated media personnel, trade unionists and human rights advocates in the previous 12 months"]. Disaggregate by sex and population group. The indicator is calculated as the total number of reported cases of killing, disappearance, arbitrary detention, assault and torture of journalists, trade unionists or human rights defenders during the reporting period which are verified by an independent entity .
This indicator collates data from multiple sources, including National Human Rights Institutions, national non-governmental organisations, associations of journalists, trades unions, ILO, and international non-governmental organisations. Information on the number of violations committed against human rights defenders will be compiled annually by OHCHR from these data sources and further data collected through individual complaints to human rights treaty bodies, and Special Procedures of the Human Rights Council, including the Special Rapporteurs on human rights defenders, on freedom of opinion and expression, torture, the Working Group on Enforced or Involuntary Disappearances, and the Working Group on Arbitrary Detention. Additional data from OHCHR field offices and UN Country Teams will also be included. These data will be verified, cross-checked to ensure no duplication, and compiled in line with the agreed international definitions outlined above. Information on the number of journalists killed are compiled annually by UNESCO from data collected through multi-sourced research, including press reports, information from monitoring groups, direct reports, and information from UNESCO field offices and other UN bodies. Reports of killings compiled by UNESCO are then transmitted for clarification on the status of judicial investigation to Member States and categorized into the following: 1) no information received so far; 2) on-going; 3) resolved; 4) killed in cross-fire; and 5) others. This information can be found at the annual report by the UNESCO Director-General on 'The Safety of Journalists and the Danger of Impunity'.
OHCHR, UNESCO, ILO, ITUC, IFJ. Availability: Information from ILO on all ILO member states (185); from ITUC on all United Nations member states; and from IFJ (International Federation of Journalists) on 134 countries.
This indicator is proposed to monitor the following targets: 5.2 (violence against women),
16.1 (violence and deaths), 16.3 (rule of law), 16.6
(accountable institutions), 16.10 (protection of
fundamental freedoms).
UNESCO proposes to adjust this indicator and reword it to: ["Number of countries promoting fundamental freedoms through ensuring the protection of journalists and combatting impunity for attacks on them (yes or no)"] Disaggregations: none
UNESCO World Trends on Freedom of Expression UNESCO's Journalist Safety Indicators Universal Periodic Review (UPR) of the Human Rights Council (with UNESCO input)

List of Indicator Proposals - p. 248 of 265
List of Proposals* Note on Disaggregation: All indicators should be disaggregated by sex, age, residence (U/R) and other characteristics, as relevant and possible.
Tier I
UNESCO National library surveys IFLA and UNESCO-UIS 3
[Numbers of violations of fundamental freedoms which impact on public access to information, and percentage of judicial cases resolved. (disaggregated by targeted group (journalists, associated media personnel, human rights defenders, trade unionists and human rights advocates))].
This indicator collates data from multiple sources, including National Human Rights Institutions, national non-governmental organisations, associations of journalists, trades unions, ILO, and international non-governmental organisations. Information on the number of violations committed against human rights defenders will be compiled annually by OHCHR from these data sources and further data collected through individual complaints to human rights treaty bodies, and Special Procedures of the Human Rights Council, including the Special Rapporteurs on human rights defenders, on freedom of opinion and expression, torture, the Working Group on Enforced or Involuntary Disappearances, and the Working Group on Arbitrary Detention. Additional data from OHCHR field offices and UN Country Teams will also be included. These data will be verified, cross-checked to ensure no duplication, and compiled in line with the agreed international definitions outlined above. Information on the number of journalists killed are compiled annually by UNESCO from data collected through multi-sourced research, including press reports, information from monitoring groups, direct reports, and information from UNESCO field offices and other UN bodies. Reports of killings compiled by UNESCO are then transmitted for clarification on the status of judicial investigation to Member States and categorized into the following: 1) no information received so far; 2) on-going; 3) resolved; 4) killed in cross-fire; and 5) others. This information can be found at the annual report by the UNESCO Director-General on 'The Safety of Journalists and the Danger of Impunity'.
OHCHR, UNESCO, ILO, ITUC, IFJ. Availability: Information from ILO on all ILO member states (185); from ITUC on all United Nations member states; and from IFJ (International Federation of Journalists) on 134 countries. UNESCO reports on safety of journalists and impunity
This indicator is proposed to monitor the following targets: 5.2 (violence against women),
16.1 (violence and deaths), 16.3 (rule of law), 16.6
(accountable institutions), 16.10 (protection of
fundamental freedoms).
[ Number of library service points per 1,000 inhabitants,] where a service point can be public, school and academic, but excluding special and research libraries. Disaggregations: none

List of Indicator Proposals - p. 249 of 265
List of Proposals* Note on Disaggregation: All indicators should be disaggregated by sex, age, residence (U/R) and other characteristics, as relevant and possible.
Contributor Name Specification Source Entity Tier Priority InterlinkagesSuggested Indicator Tier II
Indicator 16.a.1 Percentage of requests for international cooperation (law enforcement cooperation, mutual legal assistance and extraditions) that were met during the reporting year ( BBB ) 1
UNODC Victimisation surveys 1 16.3.1
Indicator 16.a.2 Existence of independent national human rights institutions (NHRIs) in compliance with the Paris Principles ( BBB ) OHCHR See attached metadata 10.3, 16a, 16b
2
UNODC 1 16.4
Target 16.a Strengthen relevant national institutions, including through international cooperation, for building capacity at all levels, in particular in developing countries, to prevent violence and combat terrorism and crime
Percentage of victims who report physical and/or sexual crime to law enforcement agencies during past 12 months Disaggregated by age, sex, region and population group
Crime victimisation surveys. At least 72 countries have implemented at least one national victimisation survey after 2009. In addition, 9 African countries have already implemented or are in the process of implementing a victimisation survey module as part of the Strategy for Harmonisation of Statistics for Africa (SHaSA).
UNODC, United Nations Survey of Crime Trends and the Operations of Criminal Justice Systems mandated by the UN General Assembly (UN-CTS).
This indicator is proposed to monitor the following
targets: 5.2 (violence against women), 16.1 (violence and deaths), 16.3 (rule of law),
16.6 (accountable institutions), 16.10
(protection of fundamental freedoms).
EOSG/RoLU, PBSO, UNDP, UNODC (in consultation with others)
Replace with ["Percentage of victims who report physical and/or sexual crime to law enforcement agencies during past 12 months."] Disaggregate by age, sex, region and population group.
Crime victimisation surveys. At least 72 countries have implemented at least one national victimisation survey after 2009. In addition, 9 African countries have already implemented or are in the process of implementing a victimisation survey module as part of the Strategy for Harmonisation of Statistics for Africa (SHaSA).
UNODC, United Nations Survey of Crime Trends and the Operations of Criminal Justice Systems mandated by the UN General Assembly (UN-CTS).
This indicator is proposed to monitor the following targets: 5.2 (violence against women),
16.1 (violence and deaths), 16.3 (rule of law), 16.6
(accountable institutions), 16.10 (protection of
fundamental freedoms).
[Percentage of crime victims who report their victimisation to public authorities (also called crime reporting rate)]
UNODC collects data on crime reporting rate through the annual data collection UN-CTS. Data on crime reporting rates are currently available for approx. 35 countries.
OHCHR, International Coordinating Committee of National Human Rights Institutions
OHCHR, International Coordinating Committee of National Human Rights Institutions
EOSG/RoLU, PBSO, UNDP, UNODC (in consultation with others)
Replace with ["Percentage of requests for international cooperation (mutual legal assistance and extraditions) that were met during the reporting year."] The concept of "mutual legal assistance" refers to various types of formal legal assistance given by one State to another State to support the requesting State in the criminal justice process. The concept of "extradition" refers to the surrender of an alleged or convicted criminal from one State to another state. Both concepts respond to the growing need for international cooperation in criminal matters at a time when criminal activities increasingly cross national borders."
Data can be collected through a module of the UN Survey of Crime Trends and the Operations of Criminal Justice Systems (UN-CTS). Data was available on MLA for 30 countries and on extradition for 35 countries. Universal coverage is considered feasible.
UNODC (prospective), United Nations Survey of Crime Trends and the Operations of Criminal Justice Systems mandated by the UN General Assembly (UN-CTS).
This indicator is proposed to monitor the following targets: 5.2 (violence against women),
16.1 (violence and deaths), 16.3 (rule of law), 16.6
(accountable institutions), 16.10 (protection of
fundamental freedoms).
[Percentage of requests for international cooperation (mutual legal assistance and extraditions) during the reporting year that were granted]
Administrative records on Mutual Legal Assistance and extraditions (requests, granted, refused)
Data have been collected in an ad-hoc module of the 2013 UN-CTS on MLA requests (30 countries) and granted (13) as well as on extradition requests (35 countries) and granted (24), demonstrating the availability of data in comparable formats.

List of Indicator Proposals - p. 250 of 265
List of Proposals* Note on Disaggregation: All indicators should be disaggregated by sex, age, residence (U/R) and other characteristics, as relevant and possible.Target 16.b Promote and enforce non-discriminatory laws and policies for sustainable development
Contributor Name Specification Source Entity Tier Priority InterlinkagesSuggested Indicator Tier II
Indicator 16.b.1 Proportion of the population reporting and perceiving to be discriminated against directly and/or indirectly, and hate crimes ( CBB ) OHCHR Survey 1 10.2, 10.3, 16.3, 16b
1
UNODC
UNWOMEN
Indicator 16.b.2 Proportion of the population satisfied with the quality of public services, disaggregated by service ( BBB ) 2
Percentage of population reporting having personally felt discriminated against or harassed within the last 12 months on the basis of a ground of discrimination prohibited under international human rights law. Disaggregate by age, sex, region and population group
The primary data source is surveys conducted at the national or regional level. In many national contexts, surveys may exclude the homeless or low-income groups without access to telephones. Face-to-face surveys often exclude non-urban populations or members of linguistic minorities. There is evidence to suggest that the most marginalised populations are less likely to respond to surveys, but this effect is reduced by ensuring their participation in the preparation of the survey.
Data for this indicator are collected in an increasing number of countries. At the regional level, the EU Fundamental Rights Agency has collected the data for 27 EU Member States. Relevant data is also collected in Eurobarometer and Afrobarometer surveys, and this question could easily be added.
This indicator is proposed to monitor the following
targets: 10.2 (inclusions), 10.3 and 10b
(discrimination), 16.3 (rule of law), 16.6 (accountable
institutions), 16.10 (protection of fundamental
freedoms),
[Percentage of population reporting having personally felt discriminated against or harassed within the last 12 months on the basis of a ground of discrimination prohibited under international human rights law]
Data available at regional level, e.g. EU Fundamental Rights Agency collects for all 28 EU Member States. No current global collector.
EOSG/RoLU, PBSO, UNDP, UNODC (in consultation with others)
Replace with ["Percentage of population reporting having personally felt discriminated against or harassed within the last 12 months on the basis of a ground of discrimination prohibited under international human rights law"]. The indicator is calculated as the percentage of persons reporting having personally felt discriminated against or harassed within the last 12 months on the basis of a ground of discrimination prohibited under international human rights law. This will be calculated using the full survey results, with techniques of imputation, estimation and data weighting to ensure a representative sample and data reliability. Disaggregate by age, sex, region and population group."
The primary data source is surveys conducted at the national or regional level. In many national contexts, surveys may exclude the homeless or low-income groups without access to telephones. Face-to-face surveys often exclude non-urban populations or members of linguistic minorities. There is evidence to suggest that the most marginalised populations are less likely to respond to surveys, but this effect is reduced by ensuring their participation in the preparation of the survey.
Data for this indicator are collected in an increasing number of countries. At the regional level, the EU Fundamental Rights Agency has collected the data for 27 EU Member States. Relevant data is also collected in Eurobarometer and Afrobarometer surveys, and this question could easily be added.
This indicator is proposed to monitor the following targets:
10.2 (inclusions), 10.3 and 10b (discrimination), 16.3
(rule of law), 16.6 (accountable institutions),
16.10 (protection of fundamental freedoms),
[Proportion of population who report experiences of discrimination in the previous 12 months]
UN Women calls for this indicator to be disaggregated by sex, age and other context specific factors.
EOSG/RoLU, PBSO, UNDP, UNODC (in consultation with others)
Replace with \[Existence of independent national human rights institutions (NHRIs) in compliance with the Paris Principles"] (previously 16.a.2). This indicator measures the global continual efforts of countries in setting up independent national institutions, through international cooperation, to promote inclusive, peaceful and accountable societies. An Independent NHRI is an institution with 'A level' accreditation status as benchmarked against the United Nations Paris Principles. The process of accreditation is conducted through peer review by the Sub-Committee on Accreditation (SCA) of the ICC. The indicator is computed as the accreditation classification, namely A, B or C of the NHRI. See supplementary information."
The main source of data on the indicator is administrative records of the Sub-Committee on Accreditation reports of the ICC. OHCHR compiles the data into a global directory of NHRI status accreditation updated every six months, after the Sub-committee on Accreditation submits its report. This information can be accessed on a continuous basis, including through maps.
International Coordinating Committee of National Institutions (ICC) and OHCHR are the agencies responsible for compiling these indicators at the international level.
16.6 (accountable institutions)

List of Indicator Proposals - p. 251 of 265
List of Proposals* Note on Disaggregation: All indicators should be disaggregated by sex, age, residence (U/R) and other characteristics, as relevant and possible.Goal 17 Strengthen the means of implementation and revitalize the global partnership for sustainable development Target 17.1 Strengthen domestic resource mobilization, including through international support to developing countries, to improve domestic capacity for tax and other revenue collection
Contributor Name Specification Source Entity Tier Priority InterlinkagesSuggested Indicator IMF/OECD Tier I
Indicator 17.1.1 Total Tax/GDP ( AAA ) OHCHR [Total volume of inward and outward illicit financial flows ] UNECA, UNDP, Global Financial Integrity Target 16.4 UNCDF Country National Accounts 1
UNEP Country National Accounts; IMF 1
WB
Indicator 17.1.2 Total Tax Per Capita ($ value) ( AAA ) UNCDF
UNEP Remove indicator WB
Contributor Name Specification Source Entity Tier Priority InterlinkagesSuggested Indicator OECD Tier I 5.2, 10.b
Indicator 17.2.1 Net ODA, total and to LDCs, as percentage of OECD/Development Assistance Committee (DAC) donors' gross national income (GNI) ( BAA ) UNCDF [Alternative: ODA Gap i.e. Net ODA [Target 0.7% of GNI] - Net ODA ][Actual] OECD DAC+ (http://www.oecd.org/dac/stats/data.htm) 1 Target 10.b UNEP [Alternative: ODA Gap i.e. Net ODA [Target 0.7% of GNI] - Net ODA ][Actual] OECD DAC+ (http://www.oecd.org/dac/stats/data.htm) 1 Target 10.b
Indicator 17.2.2 Proportion of total bilateral, sector-allocable ODA of OECD/DAC donors to basic social services (basic education, primary health care, nutrition, safe water and sanitation) ( BBB ) OHCHR OECD, WB, IMF etc.
UNCDF OECD DAC+ (http://www.oecd.org/dac/stats/data.htm) 2 Target 10.b UNEP OECD DAC+ (http://www.oecd.org/dac/stats/data.htm) 2 Target 10.b
Composition of Tax Revenues (by sources), including revenues derived from environmental taxes, and as % of GDP
National Accounts/IMF, OECD Revenue Statistics (covers large number of countries)
Alternative: [Composition of Tax Revenues (by sources - including revenues derived from environmental taxes)]
Alternatives: [Composition of Tax Revenues (by sources), including revenues derived from environmental taxes, and as % of GDP]
Need to be replaced or dropped. Maximizing taxes is not a development objective or indicator.
Alternative: [ Percentage of payments that are made electronically, by payment value and number of payments ]
Need to be replaced or dropped. Maximizing taxes is not a development objective or indicator.
Target 17.2 Developed countries to implement fully their official development assistance commitments, including the commitment by many developed countries to achieve the target of 0.7 per cent ODA/GNI to developing countries and 0.15 to 0.20 per cent of ODA/GNI to least developed countries; ODA providers are encouraged to consider setting a target to provide at least 0.20 per cent of ODA/GNI to least developed countries.
Net ODA, total and to LDCs, as percentage of OECD/Development Assistance Committee (DAC) donors' gross national income (GNI)
OECD/DAC. The OECD prefers these simple indicators to the alternative "ODA gap" and "marginalised groups" suggestions below. The "raw" ODA/GNI ratios for total ODA and ODA to LDCs can be compared directly with the target levels of 0.7% and 0.15-0.20%. "Gap" data would not be comparable in this way, and, expressed as percentages as GNI, would have the effect of making the gap seem small, even where it is large (e.g. a "gap" of 0.5% of GNI means the aid provider country is only giving 28% of the 0.7% target level for total ODA). There is no universally agreed target for ODA to Basic Social Services or marginalised groups.
[Proportion of ODA that goes to the poorest countries (countries with special needs) and marginalized and vulnerable groups within countries].
Alternative:[ ODA Recipient x Country ] Alternative:[ ODA Recipient x Country ]

List of Indicator Proposals - p. 252 of 265
List of Proposals* Note on Disaggregation: All indicators should be disaggregated by sex, age, residence (U/R) and other characteristics, as relevant and possible.Target 17.3 Mobilize additional financial resources for developing countries from multiple sources
Contributor Name Specification Source Entity Tier Priority InterlinkagesSuggested Indicator Total Capital Inflow (TCI) combined sources from WB; IMF; OECD and others IMF/WB Tier I/III 1.a, 10.b
Indicator 17.3.1 Cost of remittances ( BBB ) OHCHR [Total Capital Inflow (TCI) ] combined sources from WB; IMF; OECD and others UNCDF 1 Target 1.a and Target 10.b
UNEP 1 Target 1.a and 10.b
OECD 1
Indicator 17.3.2 Cost of remittances in the top tier of high-cost corridors ( CBB ) UNCDF World Bank Remittance Prices Worldwide Database 2 Target 10.c
UNEP World Bank Remittance Prices Worldwide Database 2 Target 10.c
Contributor Name Specification Source Entity Tier Priority InterlinkagesSuggested Indicator Debt service as a percentage of exports of goods and services IMF-World Bank IMF-World Bank Tier IIndicator 17.4.1 Total number of countries that have reached their Heavily Indebted Poor Countries Initiative (HIPC) decision points and number that have reached their HIPC completion points (cumulative) ( CBB )
OHCHR IMF
UNCDF IMF-World Bank 1 UNEP IMF-World Bank 1
WB
Indicator 17.4.2 Debt relief committed under HIPC initiative ( CBB ) UNCDF IMF-World Bank/WTO/UNCTAD 2
UNEP IMF-World Bank/WTO/UNCTAD 2
Alternative: [Total Capital Inflow (TCI)] No single measure currently exists. As a proxy, Total Financial Liabilities in National Sector Accounts might be used. Propose to develop a new conceptual measure that would incorporate Domestic Public sector investment; Domestic Private Sector investment, FDI, Foreign Portfolio Investment; Import of capital goods; International Bank Loans; International Remittances; Sovereign Wealth Funds; Specialised Funds and other funds e.g. Capital Market Bonds etc.
Alternative: [Total Capital Inflow (TCI) ] No single measure currently exists. As a proxy, Total Financial Liabilities in National Sector Accounts might be used. Propose to develop a new conceptual measure that would incorporate Domestic Public sector investment; Domestic Private Sector investment, FDI, Foreign Portfolio Investment; Import of capital goods; International Bank Loans; International Remittances; Sovereign Wealth Funds; Specialised Funds and other funds e.g. Capital Market Bonds etc.
Alternative: [Total Official Support for Sustainable Development (TOSSD).] This would cover the total flow of official resources for development, with modules planned to also capture private flows for development that are mobilised by public schemes such as guarantees, mezzanine finance, and equity stakes. It would thus better reflect the intent to focus on mobilisation than a measure of the total flow, which will respond to many influences other than official policy action. Data should be available by sector, enabling TOSSD to also be used to monitor flows to the sector targets listed in column H.
OECD/DAC Measure already agreed in principle by 2014 High Level Meeting of OECD Development Assistance Committee. Precise specifications under discussion. See http://www.oecd.org/dac/DACHLM%202014%20Background%20paper%20Towards%20more%20inclusive%20measurement%20and%20monitoring%20of%20development%20finance%20%20Total%20Official%20support%20for%20Sustainable%20Development.pdf
1.a, 7.a, 9.a, 10.b, 11.c, 13.a, 15.a, 15.b
Alternative: [Percentage of remittances spent on transfer costs] World Bank - Data is available for 226 \country corridors\"
Alternative: [Percentage of remittances spent on transfer costs] Target 17.4 Assist developing countries in attaining long-term debt sustainability through coordinated policies aimed at fostering debt financing, debt relief and debt restructuring, as appropriate, and address the external debt of highly indebted poor countries to reduce debt distress
[Number of countries assessed by the IMF as being: In/at high risk/moderate risk of debt distress ]
Alternative: [Debt service as a percentage of exports of goods and services ] ALTERNATIVE: [Debt service as a percentage of exports of goods and services]
Indicator should read: ["Proportion of eligible countries that have reached their Heavily Indebted Poor Countries Initiative (HIPC) decision points and number that have reached their HIPC completion points (cumulative)."] The absolute number of countries in need of debt relief is not an objective per se.
Alternative: [International reserves (net of annual interest payments on the debt) expressed in months of imports]
ALTERNATIVE: [International reserves (net of annual interest payments on the debt) expressed in months of imports ]

List of Indicator Proposals - p. 253 of 265
List of Proposals* Note on Disaggregation: All indicators should be disaggregated by sex, age, residence (U/R) and other characteristics, as relevant and possible.Target 17.5 Adopt and implement investment promotion regimes for least developed countries
Contributor Name Specification Source Entity Tier Priority InterlinkagesSuggested Indicator UNCTAD Investment Policy Monitor (can be supplemented by other sources) UNCTAD and other sources Tier II 17.15
Indicator 17.5.1 Adoption/Implementation of sustainable development orientated targets by new or existing investment promotion agencies ( CBB ) UNCDF Remove indicator Target 17.15 UNEP Remove indicator
Indicator 17.5.2 Number of policy changes in investment regimes incorporating sustainable development objectives ( BBB ) UNCDF UNCTAD Investment Policy Monitor (can be supplemented by other sources) 1 Target 17.15
UNEP UNCTAD Investment Policy Monitor (can be supplemented by other sources) 1 Target 17.15
Contributor Name Specification Source Entity Tier Priority InterlinkagesSuggested Indicator WIPO WIPO Tier I
Indicator 17.6.1 Access to existing patent information (creation of a patent database) ( BBA ) UNCDF World Intellectual Property Indicators http://www.wipo.intipstats/en/wipi/ WIPO 1
UNEP WIPO 1
ESCAP WIPO/National IPR offices WIPO 1
Indicator 17.6.2 Number of exchanges - Exchange of scientists and technological staff ( CBB ) ITU 8.2, 9.1, 9.c
UNCDF 2 8.2, 9.1, 9.c
UNEP Remove indicator ESCAP New - X% of the scientists should be exchanged every year. 2
Number of national & investment policy reforms adopted that incorporate sustainable development objectives or safeguards x country
Modified: [Number of national & investment policy reforms adopted that incorporate sustainable development objectives or safeguards x country ]
Modified: [Number of national & investment policy reforms adopted that incorporate sustainable development objectives or safeguards x country ]
Target 17.6 Enhance North-South, South-South and triangular regional and international cooperation on and access to science, technology and innovation and enhance knowledge sharing on mutually agreed terms, including through improved coordination among existing mechanisms, in particular at the United Nations level, and through a global technology facilitation mechanism.
Access to patent information (WIPO Patent Database) and use of the international IP system
Alternative: [Access to patent information (WIPO Patent Database) and use of the international IP system]
Alternative: [Percentage increase in jointly filed (international) patents and percentage increase in global revenue from technology licensing/royalties (Royalty & license fees receipts, % total trade).]
New - [All countries should have IPR offices and 100% of the traditional knowledge available should be posted online. ]
Proposed alternative indicator: [Fixed Internet broadband subscriptions broken down by speed.]
Data are collected by national regulatory authorities or Information and Communication Technology Ministries, who collect the data from Internet service providers. By 2014, data were available for about 80 economies, from developed and developing regions, and covering all key global regions. Data on the proportion of fixed-broadband subscription (not broken down by speed) exist for almost all economies in the world and ITU publishes data on this indicator yearly.
ITU collects and reports on data for this indicator annually. By 2014, data were available for about 80 economies, from developed and developing regions, and covering all key global regions. Data on the proportion of fixed-broadband subscription (not broken down by speed) exist for almost all economies in the world and ITU publishes data on this indicator yearly.
Proposed alternative indicator: [Fixed Internet broadband subscriptions broken down by speed.]
This indicator is based on an internationally agreed definition and methodology, which have been developed under the coordination of ITU, through its Expert Groups and following an extensive consultation process with countries. It is also a core indicator of the Partnership on Measuring ICT for Development's Core List of Indicators, which has been endorsed by the UN Statistical Commission (last time in 2014). ITU collects data for this indicator through an annual questionnaire from national regulatory authorities or Information and Communication Technology Ministries, who collect the data from Internet service providers. By 2014, data were available for about 80 economies, from developed and developing regions, and covering all key global regions. Data on the proportion of fixed-broadband subscription exist for almost all economies in the world. ITU publishes data on this indicator yearly.
ITU collects and reports on data for this indicator annually. Data are published in December of every year, for the end of the previous year.

List of Indicator Proposals - p. 254 of 265
List of Proposals* Note on Disaggregation: All indicators should be disaggregated by sex, age, residence (U/R) and other characteristics, as relevant and possible.
Contributor Name Specification Source Entity Tier Priority InterlinkagesSuggested Indicator Average applied tariffs imposed on environmental Goods WTO/UNCTAD/ITC WTO/UNCTAD/ITC Tier IIndicator 17.7.1 Total STEM Investment/GDP ( CBB )
UNCDF WTO/UNCTAD/ITC 1 UNEP WTO/UNCTAD/ITC 1 ESCAP
Indicator 17.7.2 Total STEM per capita ($ value) ( CBB ) UNCDF Remove indicator UNEP 2 Targets: 9.4, 9.a, 9.b
Target 17.7 Promote the development, transfer, dissemination and diffusion of environmentally sound technologies to developing countries on favourable terms, including on concessional and preferential terms, as mutually agreed
Alternative: [Average applied tariffs imposed on environmental Goods] Alternative: [Average applied tariffs imposed on environmental Goods] Alternate indicator - [Enhanced trade and investment flows by X% in climate-friendly/environmental goods, services and technologies for sustainable consumption and production and enhanced supply chains ]
ALTERNATIVE: [Total amount of approved funding for developing countries to promote the development, transfer, dissemination and diffusion of environmentally sound technologies on favourable terms, including on concessional and preferential terms, as mutually agreed.]
Various international, multilateral development banks, financial mechanisms and regional financial institutions including Multilateral Fund of the Montreal Protocol, GEF, Green Climate Fund, CDM, World Bank, Development Finance Institutions (DFIs), International Financial Institutions (IFIs), African Development Bank, Asian Development Bank etc.
Various international, multilateral development banks, financial mechanisms and regional financial institutions including Multilateral Fund of the Montreal Protocol, GEF, Green Climate Fund, CDM, World Bank, Development Finance Institutions (DFIs), International Financial Institutions (IFIs), African Development Bank, Asian Development Bank etc.

List of Indicator Proposals - p. 255 of 265
List of Proposals* Note on Disaggregation: All indicators should be disaggregated by sex, age, residence (U/R) and other characteristics, as relevant and possible.
Contributor Name Specification Source Entity Tier Priority InterlinkagesSuggested Indicator Proportion of individuals using the Internet. ITU-Household Surveys. Data available for 100 countries, others are estimated ITU Tier I
Indicator 17.8.1 Internet penetration ( AAA ) ITU
UNCDF 1
UNEP 1
UNESCO 1 UPU UPU existing data; ITU existing data; UNCTAD existing data 1
WB UNCTAD, ITU UNCTAD, ITU 1
ESCAP UNCTAD
Target 17.8 Fully operationalize the technology bank and science, technology and innovation capacity-building mechanism for least developed countries by 2017 and enhance the use of enabling technology, in particular information and communications technology
1.4, 2c, 5b, 9c, 10.3, 12.8, 16.6, 16.7, 16.10, 17.6, 17.8,
Correct indicator name: [Proportion of individuals using the Internet]. Data for this indicator are collected from NSOs, through household surveys. Between 2011-2014 official data (collected through a survey) for this indicator exist for 100 countries, for at least one year. For countries that do not collect data for this indicator through official household surveys, ITU estimates the data, based on subscription data. In total, ITU has data on the proportion of individuals using the Internet for 200 economies, and on a yearly basis.
ITU collects and reports on data for this indicator annually. Between 2011-2014 official data (collected through a survey) for this indicator exist for 100 countries, for at least one year. For countries that do not collect data for this indicator through official household surveys, ITU estimates the data, based on subscription data. In total, ITU has data on the proportion of individuals using the Internet for 200 economies, and on a yearly basis.
1.4, 2c, 5b, 9c, 10.3, 12.8, 16.6, 16.7, 16.10, 17.6, 17.8,
Correct indicator name: [Proportion of individuals using the Internet.] This indicator is based on an internationally agreed definition and methodology, which have been developed under the coordination of ITU, through its Expert Groups and following an extensive consultation process with countries. It is also an MDG indicator (for Target 8F) and part of the Partnership on Measuring ICT for Development's Core List of Indicators, which has been endorsed by the UN Statistical Commission (last time in 2014). Data for this indicator are collected through official household surveys by an increasing number of countries. Between 2011-2014 official data (collected through a survey) for this indicator exist for 100 countries, for at least one year. For countries that do not collect data for this indicator through official household surveys, ITU estimates the data, based on subscription data. In total, ITU has data on the proportion of individuals using the Internet for 200 economies, and on a yearly basis.
ITU collects and reports on data for this indicator annually. Data are published in June of every year, for the end the previous year.
1.4, 2c, 5b, 9c, 10.3, 12.8, 16.6, 16.7, 16.10, 17.6, 17.8,
Modified: [ICT penetration in terms of equality of access, quality, and affordability] UNCTAD & ITU - Already core Indicator for Partnership on Measuring ICT for Development
The UPU proposes that this indicator could interact with an indicator of actual use of the Internet on top of the access criteria (as measured by Internet penetration). Ideally, the indicator could be replaced by: [proportion of households with broadband Internet] * proportion of households ordering online.
UPU - big data on international e-commerce available for most countries on a real-time basis (trough consolidated tracking systems data including possibility of estimating the number of households ordering online) with real-time data potentially back to 1999 for international tonnage, volumes and with a progressive coverage of all countries by 2012 and onwards. Generalization of the capture of the value of goods (e-commerce related customs declarations) from 2016-17 onwards. On-going study of e-commerce parcels as proxy for internet penetration and use with UNSD Comtrade and UN Global Pulse.
[Proportion of businesses using the internet, Proportion of Individuals using the internet]
1.4, 5.b, 8.3, 8.10, 9.1, 9.3, 9.c, 10.3, 11.1, 16.7, 17.6
New - [X % of technologies that have been transferred to LDCs and developing countries.]

List of Indicator Proposals - p. 256 of 265
List of Proposals* Note on Disaggregation: All indicators should be disaggregated by sex, age, residence (U/R) and other characteristics, as relevant and possible.Indicator 17.8.2 Quality of internet access (bandwidth) ( BAA )
ITU 9a
UNCDF 2 9.a.
UNEP 2
UNESCO 2 UPU 2 WB [Fixed broadband subscriptions, broken down by speed] Existing, collected by ITU ITU 2 8.2 UNESCO ICT surveys, library surveys 3 16.10, 9c, 5b
Correct indicator name: [International Internet bandwidth per inhabitant ] Data are produced by national regulatory authorities or Information and Communication Technology Ministries, who collect the data from Internet Service Providers and/or wholesale Internet connectivity providers. For countries that do not provide the information, ITU estimates the indicator based on information provided by operators/ISPs, and based on subscription data. By 2014, data were available for about 200 economies.
ITU collects and reports on data for this indicator annually. By 2014, data were available for about 200 economies.
Correct indicator name: [International Internet bandwidth per inhabitant ] This indicator is based on an internationally agreed definition and methodology, which have been developed under the coordination of ITU, through its Expert Groups and following an extensive consultation process with countries. It is also a core indicator of the Partnership on Measuring ICT for Development's Core List of Indicators, which has been endorsed by the UN Statistical Commission (last time in 2014). ITU collects data for these indicators through an annual questionnaire sent to national regulatory authorities or Information and Communication Technology Ministries, who collect the data from Internet Service Providers and/or wholesale Internet connectivity providers . For countries that do not provide the information, ITU estimates the indicator based on information provided by operators/ISPs, and based on subscription data. By 2014, data were available for about 200 economies.
ITU collects and reports on data for this indicator annually. Data are published in June of every year, for the end of the previous year.
Alternative: [Individuals with ICT Skills] \ITU - Already core Indicator for Partnership on Measuring ICT for Development"
[Percentage of public libraries with broadband Internet access] Disaggregations: none
IFLA, along with partners in the library community and ICTD community, such as the Alliance for Affordable Internet (A4AI) could help with collection

List of Indicator Proposals - p. 257 of 265
List of Proposals* Note on Disaggregation: All indicators should be disaggregated by sex, age, residence (U/R) and other characteristics, as relevant and possible.
Contributor Name Specification Source Entity Tier Priority InterlinkagesSuggested Indicator Tier III 9.4, 9.a, 9.b
Indicator 17.9.1 Number (share) of national plans to implement SDGs approved by governments by end of 2016 compared to by 2020. ( BBB ) UNCDF 1
UNEP 1
Indicator 17.9.2 Substantial increase in capacity built through south-south cooperation ( CBB ) UNCDF 2
UNEP 2
ESCAP Not quantifiable unless a number of CB activity is fixed for each country
Target 17.9 Enhance international support for implementing effective and targeted capacity-building in developing countries to support national plans to implement all the sustainable development goals, including through North-South, South-South and triangular cooperation
The dollar value of financial and technical assistance, including through North-South, South-South, and triangular cooperation, committed to developing countries' designing and implementing a holistic policy mix that aim at sustainable development in three dimensions (including elements such as reducing inequality within a country and governance).
Various international, multilateral development banks, financial mechanisms and regional financial institutions including Multilateral Fund of the Montreal Protocol, GEF, Green Climate Fund, CDM, World Bank, Development Finance Institutions (DFIs), International Financial Institutions (IFIs), African Development Bank, Asian Development Bank etc.
Various international, multilateral development banks, financial mechanisms and regional financial institutions including Multilateral Fund of the Montreal Protocol, GEF, Green Climate Fund, CDM, World Bank, Development Finance Institutions (DFIs), International Financial Institutions (IFIs), African Development Bank, Asian Development Bank etc.
Alternative: [Percent of indicators in national development plans and strategies that prioritize sustainable development ]
Alternative: [Percent of indicators in national development plans and strategies that prioritize sustainable development ]
Alternative: [The dollar value of financial and technical assistance, including through North-South, South-South, and triangular cooperation, committed to developing countries' designing and implementing a holistic policy mix that aim at sustainable development in three dimensions (including elements such as reducing inequality within a country and governance).]
Alternative: [The dollar value of financial and technical assistance, including through North-South, South-South, and triangular cooperation, committed to developing countries' designing and implementing a holistic policy mix that aim at sustainable development in three dimensions (including elements such as reducing inequality within a country and governance).]

List of Indicator Proposals - p. 258 of 265
List of Proposals* Note on Disaggregation: All indicators should be disaggregated by sex, age, residence (U/R) and other characteristics, as relevant and possible.
Contributor Name Specification Source Entity Tier Priority InterlinkagesSuggested Indicator WTO/UNCTAD/ITC Tier I 17.12, 8.2
Indicator 17.10.1 Stock of potentially trade-restrictive measures in WTO members ( CBB ) UNCDF 2
UNEP 2 Target 2.b
ESCAP WTO
WB Trade Costs Dataset
Target 17.10 Promote a universal, rules-based, open, non-discriminatory and equitable multilateral trading system under the World Trade Organization, including through the conclusion of negotiations under its Doha Development Agenda
Worldwide weighted tariff-average
This indicator can be disaggregated and analysed by type of tariff (MFN applied rates and preferential rates), by product sector, by region and by level of development. The unit of measurement will be in % terms. Ad valorem equivalents (AVE) will be calculated for those tariffs that are not expressed in percentage. This methodology also allows for cross-country comparisons. Calculations can be performed on a yearly basis.
These calculations are already part of the MDG Gap task force report.
WTO/UNCTAD/ITC Data is widely available for most countries
Modified: [Trade restrictiveness indicator.] The observed reduction of trade restrictive measures worldwide can be used as an indicator of the overall degree of support for the multilateral trading system. This is a composite indicator that takes into account a large set of tariff and non tariff measures which may affect trade in goods and services. The methodology to weight the sub-measurements included in it still has to be defined. As a consequence also the unit of measure is not yet defined.
WTO-UNCTAD-WB-ITC databases. Reference to the methodology used can be found in the following reports and databases: World Bank-UNCTAD's Tariff trade restrictiveness indexes (TTRI and MA-TTRI); World Bank's Trade Costs; World Bank's Services Trade Restrictions Database; WTO's Stock of potentially trade-restrictive measures in WTO members (I-TIP portal and DG's Report for the Annual Overview of developments in the international trading environment that are having an impact on the multilateral trading system )
WTO-UNCTAD-WB-ITC. The above mentioned organizations will develop specifics in the coming months
Target 1.4 (as a measurement of access to
new technology and financial services, including
microfinance); Target 2.b (as a measurement of existing barriers and distortions in
world agricultural markets); Target 17.12 (as a measurement of
transparency of market access conditions, including
Rules of Origin); Target 3.8 (as a measurement of restrictions
imposed on the trade of essential medicines and
health care services); Target 9.3 (as a measurement of the
existing trade barriers that curb access financial services)
Modified: [Trade restrictiveness indicator.] Modify current indicator by measuring non-tariff measures that restrict the trade of environmental goods and also measure prevalence of environmentally harmful subsidies.
World Bank-UNCTAD's Tariff trade restrictiveness indexes (TTRI and MA-TTRI); World Bank's Trade Costs; World Bank's Services Trade Restrictions Database; WTO's Stock of potentially trade-restrictive measures in WTO members. Source: http://i-tip.wto.org/goods/default.aspx?language=en
None of these indicators actually represent the Target 17.10<U+0085> New indicator - Successful conclusion of Doha Round including acceptance of all the SDT proposals. .
Alternate indicator: ['Services Trade Restrictions.'] This indicator can be measured using the Trade Costs Dataset which provides estimates of bilateral trade costs in agriculture and manufactured goods for the 1995-2010 period. It is built on trade and production data collected in 178 countries. Symmetric bilateral trade costs are computed using the Inverse Gravity Framework (Novy 2009), which estimates trade costs for each country pair using bilateral trade and gross national output. Trade costs are available for two sectors: trade in manufactured goods, and agriculture.
http://data.worldbank.org/data-catalog/trade-costs-dataset

List of Indicator Proposals - p. 259 of 265
List of Proposals* Note on Disaggregation: All indicators should be disaggregated by sex, age, residence (U/R) and other characteristics, as relevant and possible.Indicator 17.10.2 Worldwide weighted tariff-average: a. MFN applied and preferential, b. Applied to Devd/Dvg/LDCs, c. Applied by Devd/Dvg/LDCs, and d. By main sectors ( CBB )
UNCDF WTO-UNCTAD-ITC 1
UNEP 1
ESCAP Delete this indicator as it does not reflect the target. WTO Target 17.11 Significantly increase the exports of developing countries, in particular with a view to doubling the least developed countries' share of global exports by 2020
Contributor Name Specification Source Entity Tier Priority InterlinkagesSuggested Indicator WTO/UNCTAD/ITC Tier I 2.3, 8.2
UNCDF WTO-UNCTAD-ITC 1
UNEP
\Modified: Worldwide weighted tariff-average. The average level of customs tariff rates applied worldwide can be used as an indicator of the degree of success achieved by multilateral negotiations. This indicator can be disaggregated and analysed by type of tariff (MFN applied rates and preferential rates), by product sector, by region and by level of development. The unit of measurement will be in % terms. Ad valorem equivalents (AVE) will be calculated for those tariffs that are not expressed in percentage. This methodology also allows for cross-country comparisons. Calculations can be performed on a yearly basis. To further refine the quality of the information, additional sub-measurements could be calculated including: a) Tariff peaks (i.e. % of tariffs on some products that are considerably higher than usual, defined as above 15 per cent) and b) Tariff escalation (i.e. wherein a country applies a higher tariff rate to products at the later stages of production). These calculations are already part of the MDG Gap task force report (see the report for further information on the methodology at http://www.un.org/en/development/desa/policy/mdg_gap/mdg_gap2014/2014GAP_FULL_EN.pdf)."
WTO-UNCTAD-ITC databases. Concerning the feasibility rating, data is already available.
target 17.12 (to measure the degree of implementation of
duty-free and quota-free market access). target 8.2 (as
the reduction of tariff escalation levels will promote the production of high-value
added products)
Worldwide weighted tariff-average by type (MFN applied and preferential), by sector (incl. tariff peaks and tariff escalation) and by level of development.
WTO-UNCTAD-ITC databases. These indicators are already part of the MDG Gap task force report.
Developing country’s and LDCs' exports (by partner group and key sectors), including services.
WTO/UNCTAD/ITC Data is widely available for most countries
Indicator 17.11.1 Monitoring the evolution of developing countries export by partner group and key sectors. Such as: a) Exports of high technological content as proportion of total exports, b) Labour-intensive exports as proportion of total exports (pro-poor exports), and c) Export diversification (by product; by market destination) ( BBB ) \Modified: [Developing country's and LDCs' exports (by partner group and key
sectors), including services.] Can be calculated on a yearly basis. The unit of measurement could be in % (developing countries' and LDCs share of global exports) or alternatively in value (i.e. USD '000). Otherwise, out of the same data, 2 clear indicators could be calculated to measure the target, i.e.: (1) least developed countries' share of global exports (in % terms), (2) exports of developing countries (in value terms). The 2 indicators can be calculated on a yearly basis. Similar calculations are already part of the MDG Gap task force report. For reference purposes see http://www.un.org/en/development/desa/policy/mdg_gap/mdg_gap2014/2014GAP_FULL_EN.pdf . To further refine the quality of the information, additional sub-measurement could be calculated including a) Exports of high technological content as proportion of total exports, b) Labour-intensive exports as proportion of total exports (pro-poor exports), and c) Export diversification (by product; by market destination).The indicator will not include export of oil and arms."
WTO-UNCTAD-ITC databases. Concerning the feasibility rating, data is already available.
Target 8.2 (as a measurement of
diversification, technological upgrading and innovation); Target 2.3 (to measure the increase of productivity of small scale food producers
and the enhanced opportunities to access
market and value addition segments)
Modified: [Monitoring the evolution of country's export by partner group and key sectors, including services. Include as one of the sectors analysed: exports of native biodiversity products, biotrade, sustainability certified products, and environmental goods. ]
WTO-UNCTAD-ITC databases. These indicators are already part of the MDG Gap task force report. Source: national statistics.

List of Indicator Proposals - p. 260 of 265
List of Proposals* Note on Disaggregation: All indicators should be disaggregated by sex, age, residence (U/R) and other characteristics, as relevant and possible.
UPU 1
WB 2 10.a-17.10
OECD OECD, see www.oecd.org/trade/valueadded 2
Indicator 17.11.2 Value of non-oil exports from LDCs that are derived from sustainable management of natural resources ( CBB ) UNCDF
UNEP Also consider measuring the proportion of exports that are considered raw materials. Source: COMTRADE
UPU 2 ESCAP
The UPU proposes that this indicator could be complemented by an indicator on the development of international e-commerce. Such complementary indicator could be: Volumes and values of e-commerce related imports and exports of goods, by country, by product (UNSD Comtrade HS classification for international trade) and for each bilateral flow for any country-pair. At a latter stage, the above mentioned international e-commerce statistics could also be provided by the size of the firm (in order to monitor e-commerce related exports and imports by micro, small and medium-size enterprises).
UPU existing data; UNSD Comtrade existing data; UNCTAD existing data; WTO and ITC existing data.
UPU - big data on international e-commerce available for most countries on a real-time basis (trough consolidated tracking systems data) with real-time data potentially back to 1999 for international tonnage, volumes and with a progressive coverage of all countries by 2012 and onwards. Generalization of the capture of the value of goods (e-commerce related customs declarations) from 2016-17 onwards. On-going study of e-commerce parcels as proxy for international trade with UNSD Comtrade and UN Global Pulse.
Additional indicator - 'Services Trade Restrictions.' The Services Trade Restrictions Database covers 103 countries that represent all regions and income groups of the world. For each country, five major services sectors are covered that encompass a total of 19 subsectorsEach subsector in turn covers the most relevant modes of supplying the respective services, yielding overall 34 country-subsector-mode combinations:Mode 1: financial services, transportation and professional servicesMode 3: all subsectorsMode 4: professional services. The Eight WTO Ministerial Conference in 2011 adopted a waiver, enabling WTO members to provide preferential treatment to services and service suppliers of LDCs. The services sector has become a key driver of growth and development, accounting for 47 percent of all LDCs' overall GDP in 2011. However compared with the value of world services trade, LDC services trade is still marginal. Hence, over the coming years, the waiver can provide significant opportunities to further enhance the growth of service sectors in LDCs
World Bank, Available fromhttp://iresearch.worldbank.org/servicetrade/aboutData.htm
World Bank. Data available for up to 103 countrieshttp://iresearch.worldbank.org/servicetrade/aboutData.htm
Additional and eventually alternative indicator: [Domestic value-added in a country's exports.] Compared to the gross figure for export receipts, this will be a superior indicator of the benefit that countries derive from their exports.
The OECD's Trade in Value Added initiative already contains data for 61 countries, with plans to expand it towards comprehensive global coverage.
Remove indicator. There is not enough information available to define and quantify the amount of exports deriving from the sustainable management of natural resources
New- [new products and new markets to be generated by X% in LDC exports]

List of Indicator Proposals - p. 261 of 265
List of Proposals* Note on Disaggregation: All indicators should be disaggregated by sex, age, residence (U/R) and other characteristics, as relevant and possible.
Contributor Name Specification Source Entity Tier Priority InterlinkagesSuggested Indicator Average tariffs faced by developing countries and LDCs by key sectors WTO/UNCTAD/ITC WTO/UNCTAD/ITC Tier I 2.3, 17.10Indicator 17.12.1 Average tariffs faced by developing countries and LDCs by key sectors ( BBB )
UNCDF WTO-UNCTAD-ITC 1
UNEP 1
ESCAP WTO/Commtrade WTO/National governments 1
Indicator 17.12.2 Preferences utilization by developing and least developed countries on their export to developed countries ( CBB ) UNCDF WTO-UNCTAD-ITC 2
UNEP 2
ESCAP WTO/Commtrade WTO/National governments 2
Target 17.12 Realize timely implementation of duty-free and quota-free market access on a lasting basis for all least developed countries, consistent with World Trade Organization decisions, including by ensuring that preferential rules of origin applicable to imports from least developed countries are transparent and simple, and contribute to facilitating market access
Same indicator. The unit of measurement will be in % terms. Ad valorem equivalents (AVE) will be calculated for those tariffs that are not expressed in percentage. This methodology also allows for cross-country comparisons. Calculations can be performed on an yearly basis. This indicator is already part of the MDG Gap task force report. For reference purposes see http://www.un.org/en/development/desa/policy/mdg_gap/mdg_gap2014/2014GAP_FULL_EN.pdf
WTO-UNCTAD-ITC databases. Concerning the feasibility rating, data is already available.
target 17.10; Target 2.3 (to measure the improvement in
the access of markets and opportunities for value
addition)
Include proportion of total imports from developing countries and least developed countries admitted duty free and quota free (DFQF), giving a better measure of concession utilization than average tariff
WTO-UNCTAD-ITC databases. These indicators are already part of the MDG Gap task force report. Source: COMTRADE and WTO databases
DFQF is not for the developing countries. The indicator given is not correct. New Indicator proposed - [Full implementation of DFQF by giving market access on 97% of the products by developed countries.]
"Same indicator. Preference utilization can be defined as a proportion between the value of imports that exporters/importers claim for preferential tariff treatment under a specific trade agreement and the total value of imports eligible for the preferential tariff under the above mentioned agreement. The unit of measurement will be in % (i.e. percentage of imports sourced under preferential treatment). The rate of utilization of preferences can be a good proxy to measure the impact of obstacles (e.g. specific requirements as rules of origin, lack of transparency) over the effective use of such preferences (e.g. Duty Free Quota Free for LDCs). The calculation of this indicator might not be possible on a yearly basis. Refer to the following paper (and other related research) for more information on the methodology https://www.wto.org/ENGLISH/res_e/reser_e/ersd201212_e.pdf"
WTO-UNCTAD-ITC databases. For the time being, data is available only for the leading developed country importers and is retrieved from Eurostat, USITC and data provided to the WTO Secretariat by governments""
target 10.a (to measure the actions taken in order to facilitate utilization of preferences granted by
developed countries in order to increase trading
opportunities for developing countries)
Same indicator. Include average tariffs imposed on agricultural products and products of native biodiversity, from developing and least developed countries.
The rate of utilization of preferences can be a good proxy to measure the impact of obstacles (e.g. the rules of origin) over effective use of such preferences (e.g. DFQF for LDCs) that will increase LDCs' exports. Data is available for the leading importers. Source: COMTRADE and WTO databases
New- [X% of exports from LDCs to developed countries should be covered under preferences. Y% of new products to be exported under the DFQF preferences to developed countries. ]

List of Indicator Proposals - p. 262 of 265
List of Proposals* Note on Disaggregation: All indicators should be disaggregated by sex, age, residence (U/R) and other characteristics, as relevant and possible.Target 17.13 Enhance global macroeconomic stability, including through policy coordination and policy coherence
Contributor Name Specification Source Entity Tier Priority InterlinkagesSuggested Indicator GDP National Accounts/IMF/DESA WB/UNSD Tier I Targets in Goal 8Indicator 17.13.1 GDP ( AAA )
UNCDF Target 17.9
UNEP Target 17.9
WB
Indicator 17.13.2 Current account surplus and deficit/GDP ( AAA ) UNCDF Remove indicator UNEP Remove indicator
Alternative: [Macro-Economic Dashboard (annual)] - A suite or dashboard of indicators are proposed that attempt to capture the levels of key economic indicators, and by extension, their volatility (these are not exhaustive and could be further supplemented): GDP; Current account surplus and deficit/GDP; Capital flows, inwards and outwards; Net international investment position/GDP; Current account surplus and deficit/GDP; Terms of trade; Export market shares ($) ; Nominal unit labour cost; Functional distribution of labour and capital/GDP; Minimum wage, average wage and wage dispersion; Inequality Measure; Real effective exchange rates based on CPI deflators; Interest rates (including spread);Private sector debt level and change; Short term and long-term debt level of official reserves and reserves in banks; Private sector credit/GDP; Prices of food and energy; General government revenues, expenditure and debt/GDP; Employment and unemployment (%, composition, length of term); General price changes (CPI).
Key macro-economic indicators are readily available, so this dashboard will place no additional burden on countries (see EU Macro-Economic Scoreboard as an example).
\Alternative: [Macro-Economic Dashboard (annual)]. A suite or dashboard of indicators are proposed that attempt to capture the levels of key economic indicators, and by extension, their volatility (these are not exhaustive and could be further supplemented): GDP; Current account surplus and deficit/GDP; Capital flows, inwards and outwards; Net international investment position/GDP; Current account surplus and deficit/GDP; Terms of trade; Export market shares ($) ; Nominal unit labour cost; Functional distribution of labour and capital/GDP; Minimum wage, average wage and wage dispersion; Inequality Measure; Real effective exchange rates based on CPI deflators; Interest rates (including spread);Private sector debt level and change; Short term and long-term debt level of official reserves and reserves in banks; Private sector credit/GDP; Prices of food and energy; General government revenues, expenditure and debt/GDP; Employment and unemployment (%, composition, length of term); General price changes (CPI)."
Key macro-economic indicators are readily available, so this dashboard will place no additional burden on countries (see EU Macro-Economic Scoreboard as an example).
Target 17.13 (enhance global stability) is laudable, but the proposed indicators GDP and CAD deficits don't measure it. Suggest to substitute with measures of variability/dispersion.

List of Indicator Proposals - p. 263 of 265
List of Proposals* Note on Disaggregation: All indicators should be disaggregated by sex, age, residence (U/R) and other characteristics, as relevant and possible.Target 17.14 Enhance policy coherence for sustainable development
Contributor Name Specification Source Entity Tier Priority InterlinkagesSuggested Indicator OHCHR, UNEP, other agencies OHCHR, UNEP Tier I
Indicator 17.14.1 Number of countries that have ratified and implemented relevant international instruments under the IMO (safety, security, environmental protection, civil liability and compensation and insurance) ( BBB ) ILO NORMLEX (Information System on International Labour Standards of the ILO).
OHCHR OHCHR OHCHR 1
UNCDF 1
UNEP
Indicator 17.14.2 Number of countries with multi-sectoral and multi-stakeholder coordination mechanisms in place for a coordinated implementation of chemicals and wastes conventions and frameworks ( BBB ) UNCDF Remove indicator
Target 17.15 Respect each country's policy space and leadership to establish and implement policies for poverty eradication and sustainable development Contributor Name Specification Source Entity Tier Priority Interlinkages
Suggested Indicator Numbers of constraints that are embodied in ODA or loan agreements, IIAs. RTAs etc. UNCTAD Tier II
Indicator 17.15.1 Number of countries signing on for sharing of fiscal information ( CBB ) UNCDF OECD DAC+ (ODA); UNCTAD (IIAs + RTAs) 1
UNEP OECD DAC+ (ODA) , UNCTAD (IIAs + RTAs) 1
Indicator 17.15.2 Automatic transfer of financial information ( CBB ) UNCDF Remove indicator UNEP Remove indicator
Contributor Name Specification Source Entity Tier Priority InterlinkagesSuggested Indicator UNDP Tier II
Indicator 17.16.1 Changes in the number of multi-stakeholder partnerships participants active in developing countries ( CBB ) UNCDF 1
UNEP 1
Indicator 17.16.2 Classification and trajectory of the above in terms of: a) Nature of partnership, b) Region: Global, regional, c) Objectives: Sharing technology, expertise etc. and d) Country type (where partnership is active) ( CBB ) UNCDF Remove indicator UNEP Remove indicator
Number of countries that have ratified and implemented relevant international instruments including environmental, human rights, and labour instruments
Alternative text: [Number of countries that have ratified and implemented relevant international instruments under the ILO and the IMO (safety, security, environmental protection, civil liability and compensation and insurance)]
Responsible entity: ILO. Availability: Information on all ILO member states (185), of which 66 ratified the Maritime Labour Convention of 2006.
[Number of countries that have ratified and implemented relevant international instruments including environmental, human rights, and labour instruments)]
Modified: [Number of countries that have ratified and implemented relevant international instruments including environmental, human rights, and labour instruments ]
Data, maps and metadata is available http://indicators.ohchr.org to monitor the number of countries that have ratified and implemented relevant international human rights instruments. On environmental instruments, data is available on both INFORMEA (http://www.informea.org/) for monitoring, ratification, and UNEPLive (www.unep.org/uneplive) for monitoring.
OHCHR and UNEP (number of countries depends on the instrument but it is usually more than 150)
Modified: [Number of countries that have ratified and implemented relevant international instruments including environmental, human rights, and labour instruments]
Data, maps and metadata is available http://indicators.ohchr.org to monitor the number of countries that have ratified and implemented relevant international human rights instruments. On environmental instruments, data is available on both INFORMEA (http://www.informea.org/) for monitoring ratification, and UNEPLive (www.unep.org/uneplive) for monitoring implementation drawing upon the information available through Secretariats of individual agreements and instruments.
OHCHR and UNEP and ILO (number of countries depends on the instrument but is usually more than 150)
OECD DAC+ (ODA)UNCTAD (IIAs + RTAs)
Alternative: [Numbers of constraints that are embodied in ODA or loan agreements, IIAs. RTAs etc.]
Alternative: [Numbers of constraints that are embodied in ODA or loan agreements, IIAs. RTAs etc. ]
Target 17.16 Enhance the global partnership for sustainable development, complemented by multi-stakeholder partnerships that mobilize and share knowledge, expertise, technology and financial resources, to support the achievement of the sustainable development goals in all countries, in particular developing countries
Indicator 7 from Global Partnership Monitoring Exercise: Mutual accountability among development co-operation actors is strengthened through inclusive reviews
OECD-UNDP Table A.7. Global Partnership Website: http://www.effectivecooperation.org/
Alternative: [Indicator 7 from Global Partnership Monitoring Exercise: Mutual accountability among development co-operation actors is strengthened through inclusive reviews ]
OECD-UNDP Table A.7. Global Partnership Website: http://www.effectivecooperation.org/
Alternative: [Indicator 7 from Global Partnership Monitoring Exercise: Mutual accountability among development co-operation actors is strengthened through inclusive reviews ]
OECD-UNDP Table A.7. Global Partnership Website: http://www.effectivecooperation.org/

List of Indicator Proposals - p. 264 of 265
List of Proposals* Note on Disaggregation: All indicators should be disaggregated by sex, age, residence (U/R) and other characteristics, as relevant and possible.Target 17.17 Encourage and promote effective public, public-private and civil society partnerships, building on the experience and resourcing strategies of partnerships
Contributor Name Specification Source Entity Tier Priority InterlinkagesSuggested Indicator Amount of US$ committed to public-private partnerships World Bank World Bank Tier IIIIndicator 17.17.1 Number of PPP projects ( BBB )
UNCDF National Accounts (Government Financial Sector Accounts) UNEP National Accounts (Government Financial Sector Accounts) WB
Indicator 17.17.2 Number of PPP projects implemented by developing countries ( BBB ) UNCDF UNCTAD World Investment Report (2014, Table IV-2) UNEP UNCTAD World Investment Report (2014, Table IV-2)
Contributor Name Specification Source Entity Tier Priority InterlinkagesSuggested Indicator UNFPA, UNDESA, UNDP Tier I All targets
Indicator 17.18.1 Number of countries that have national statistical legislation (that [a] enshrine statistical independence; [b]mandate data collection; and [c] secure access to national administrative data) ( AAA ) UNCDF UNFPA, UNDESA, UNDP 1 All targets
UNEP
UNFPA UNFPA, UNDESA, UNDP 1 all targets
Indicator 17.18.2 Number of countries that have formal institutional arrangements for the coordination of the compilation of official statistics (at international, national and regional level) ( AAA ) UNCDF Global statistical monitoring systems associated with the different data types UN DESA, World Bank, UNFPA, UNICEF 2
UNEP
Alternative: [Ratio of stock of Public/Public-Private investment. ] Alternative: [Ratio of stock of Public/Public-Private investment. ] We would like a clarification on the definition of Public-Private partnerships. The definition that the PPP CCSA is using is \Any long-term contractual arrangement between a public entity or authority and a private entity, for providing a public asset or service, in which the private party bears significant risk and management responsibility." This is important to know to understand if the data collected for indicators 17.17 will be aligned with the information we at the World Bank are currently collecting and if we can contribute to it. Also, a relevant indicator is[ amount of US$ committed]: Number of projects is important but the impact maybe more associated to the size of those PPPs and the share of the Private sector. Number of projects only provides partial information on the evolution of the PPPs. Under the PPI database, we collect information on US$ committed to PPP projects in the infrastructure sector that could be used. Finally, Time to account: PPPs have a project cycle so it is not obvious at what time we should account for it. The WBG PPI database includes PPP projects that have reached financial closure."
It would be important to understand what will be the data sources for these indicators. As you may know, we are already collecting data on indicator 17.17.2 for the infrastructure sector in our Private Participation in Infrastructure (PPI) database. Here the link http://ppi.worldbank.org/
Alternative: ['SDG Investment Gap' and 'Private Sector Potential' ] Alternative: ['SDG Investment Gap' and 'Private Sector Potential' ]
Target 17.18 By 2020, enhance capacity-building support to developing countries, including for least developed countries and small island developing States, to increase significantly the availability of high-quality, timely and reliable data disaggregated by income, gender, age, race, ethnicity, migratory status, disability, geographic location and other characteristics relevant in national contexts
Proportion of sustainable development indicators with full disaggregation produced at the national level.
MDG/SDG reporting databases (UNDESA and UNDP) plus baseline assessment in 2015 by UNFPA.
Alternative: [Proportion of sustainable development indicators with full disaggregation produced at the national level.]
MDG/SDG reporting databases (UNDESA and UNDP) plus baseline assessment in 2015 by UNFPA.
Alternative: [Proportion of national sustainable development strategies that utilize essential data on the current and future characteristics of the population across the points of disaggregation defined in target 17.18 ]
International Conference on Population and Development (ICPD) monitoring mechanism, guidelines for review to be updated to match this indicator
["Proportion of sustainable development indicators with full disaggregation produced at national level"]. The ability of National Statistical Offices and other bodies within countries to report on the diversity of SDG indicators is itself a measure of capacity, particularly when we think about the eventual complexity of the indicator framework as well as the points of disaggregation. Right now, a number of the existing indicators are calculated or modelled at global level, and the purpose of this indicator is to measure the shift in that calculation process to the national level.
MDG/SDG reporting databases (UNDESA and UNDP) plus baseline assessment in 2015 by UNFPA.
Alternative: [Proportion of countries that regularly collect essential data on the population]
All targets with population-based indicators
Alternative: [Proportion of countries that regularly collect essential data on the population]
Global statistical monitoring systems associated with the different data types, including those housed in the UN Statistical Division, World Bank, UNFPA OpenData platform, UNICEF, etc.

List of Indicator Proposals - p. 265 of 265
List of Proposals* Note on Disaggregation: All indicators should be disaggregated by sex, age, residence (U/R) and other characteristics, as relevant and possible.
UNFPA Global statistical monitoring systems associated with the different data types UNDESA, World Bank, UNFPA, UNICEF 2
Contributor Name Specification Source Entity Tier Priority InterlinkagesSuggested Indicator Tier II
Suggested Indicator Inclusive Wealth Index http://inclusivewealthindex.org/#the-world-wants-to-know-how-its-doing UNEP Tier I 8.1
Indicator 17.19.1 Index of Sustainable Economic Welfare (Nordhaus/Tobin) ( BBB ) UNCDF Compiled by UNEP 1 UNEP http://inclusivewealthindex.org/#the-world-wants-to-know-how-its-doing Compiled by UNEP - 140 1 8.1
Indicator 17.19.2 Gross National Happiness ( CBB ) UNCDF 2
UNEP 2
[Proportion of countries that regularly collect essential data on the population]* *Essential data on the population is defined as data generated by: Census – regularly defined as every five to 10 years and in line with internationally agreed guidelines. Civil registration and vital statistics – regularly defined as births, deaths and civil status registered and reported continually as relevant for national context. Surveys – regularly defined as every three to five years: demographic and health surveys (DHS or MICS), labour force surveys, living standards surveys, household income and expenditure surveys
all targets with population-based indicators
Target 17.19 By 2030, build on existing initiatives to develop measurements of progress on sustainable development that complement gross domestic product, and support statistical capacity-building in developing countries
Financial and other resources made available to strengthen the statistical capacity in developing countries
Alternative: [Inclusive Wealth Index] Alternative: [Inclusive Wealth Index]
Alternative: [Financial and other resources made available to strengthen the statistical capacity in developing countries]
Alternative: [Financial and other resources made available to strengthen the statistical capacity in developing countries]