Xin Chao Vietnam - kisvn.vn
4
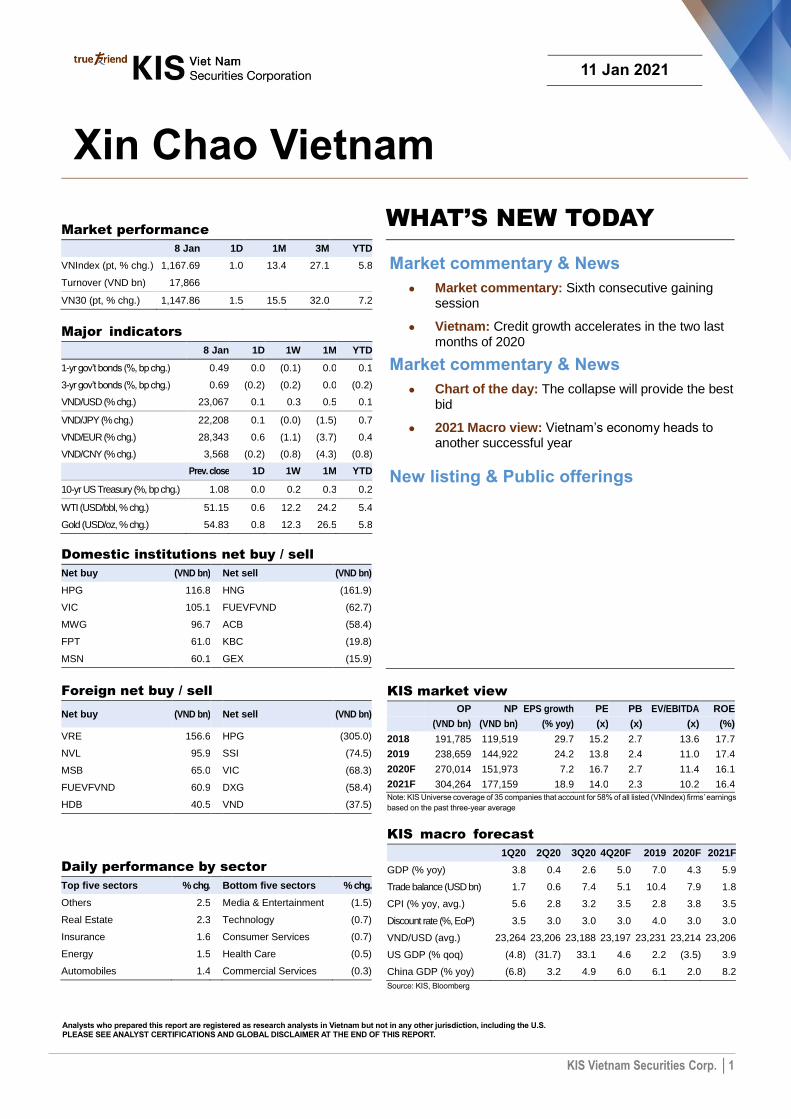
KIS Vietnam Securities Corp. │1 Xin Chao Vietnam WHAT’S NEW TODAY Market commentary & News ● Market commentary: Sixth consecutive gaining session ● Vietnam: Credit growth accelerates in the two last months of 2020 Market commentary & News ● Chart of the day: The collapse will provide the best bid ● 2021 Macro view: Vietnam’s economy heads to another successful year New listing & Public offerings Analysts who prepared this report are registered as research analysts in Vietnam but not in any other jurisdiction, including the U.S. PLEASE SEE ANALYST CERTIFICATIONS AND GLOBAL DISCLAIMER AT THE END OF THIS REPORT. 11 Jan 2021 Market performance 8 Jan 1D 1M 3M YTD VNIndex (pt, % chg.) 1,167.69 1.0 13.4 27.1 5.8 Turnover (VND bn) 17,866 VN30 (pt, % chg.) 1,147.86 1.5 15.5 32.0 7.2 Major indicators 8 Jan 1D 1W 1M YTD 1- yr gov’t bonds (%, bp chg.) 0.49 0.0 (0.1) 0.0 0.1 3- yr gov’t bonds (%, bp chg.) 0.69 (0.2) (0.2) 0.0 (0.2) VND/USD (% chg.) 23,067 0.1 0.3 0.5 0.1 VND/JPY (% chg.) 22,208 0.1 (0.0) (1.5) 0.7 VND/EUR (% chg.) 28,343 0.6 (1.1) (3.7) 0.4 VND/CNY (% chg.) 3,568 (0.2) (0.8) (4.3) (0.8) Prev. close 1D 1W 1M YTD 10-yr US Treasury (%, bp chg.) 1.08 0.0 0.2 0.3 0.2 WTI (USD/bbl, % chg.) 51.15 0.6 12.2 24.2 5.4 Gold (USD/oz, % chg.) 54.83 0.8 12.3 26.5 5.8 Domestic institutions net buy / sell Net buy (VND bn) Net sell (VND bn) HPG 116.8 HNG (161.9) VIC 105.1 FUEVFVND (62.7) MWG 96.7 ACB (58.4) FPT 61.0 KBC (19.8) MSN 60.1 GEX (15.9) Foreign net buy / sell Net buy (VND bn) Net sell (VND bn) VRE 156.6 HPG (305.0) NVL 95.9 SSI (74.5) MSB 65.0 VIC (68.3) FUEVFVND 60.9 DXG (58.4) HDB 40.5 VND (37.5) Daily performance by sector Top five sectors % chg. Bottom five sectors % chg. Others 2.5 Media & Entertainment (1.5) Real Estate 2.3 Technology (0.7) Insurance 1.6 Consumer Services (0.7) Energy 1.5 Health Care (0.5) Automobiles 1.4 Commercial Services (0.3) KIS market view OP NP EPS growth PE PB EV/EBITDA ROE (VND bn) (VND bn) (% yoy) (x) (x) (x) (%) 2018 191,785 119,519 29.7 15.2 2.7 13.6 17.7 2019 238,659 144,922 24.2 13.8 2.4 11.0 17.4 2020F 270,014 151,973 7.2 16.7 2.7 11.4 16.1 2021F 304,264 177,159 18.9 14.0 2.3 10.2 16.4 Note: KIS Universe coverage of 35 companies that account for 58% of all listed (VNIndex) firms’ earnings based on the past three-year average KIS macro forecast 1Q20 2Q20 3Q20 4Q20F 2019 2020F 2021F GDP (% yoy) 3.8 0.4 2.6 5.0 7.0 4.3 5.9 Trade balance (USD bn) 1.7 0.6 7.4 5.1 10.4 7.9 1.8 CPI (% yoy, avg.) 5.6 2.8 3.2 3.5 2.8 3.8 3.5 Discount rate (%, EoP) 3.5 3.0 3.0 3.0 4.0 3.0 3.0 VND/USD (avg.) 23,264 23,206 23,188 23,197 23,231 23,214 23,206 US GDP (% qoq) (4.8) (31.7) 33.1 4.6 2.2 (3.5) 3.9 China GDP (% yoy) (6.8) 3.2 4.9 6.0 6.1 2.0 8.2 Source: KIS, Bloomberg
Transcript of Xin Chao Vietnam - kisvn.vn
KIS Vietnam Securities Corp. │1
Xin Chao Vietnam
WHAT’S NEW TODAY
Market commentary & News
● Market commentary: Sixth consecutive gaining session
● Vietnam: Credit growth accelerates in the two last months of 2020
Market commentary & News
● Chart of the day: The collapse will provide the best bid
● 2021 Macro view: Vietnam’s economy heads to another successful year
New listing & Public offerings
Analysts who prepared this report are registered as research analysts in Vietnam but not in any other jurisdiction, including the U.S. PLEASE SEE ANALYST CERTIFICATIONS AND GLOBAL DISCLAIMER AT THE END OF THIS REPORT.
11 Jan 2021
Market performance
8 Jan 1D 1M 3M YTD
VNIndex (pt, % chg.) 1,167.69 1.0 13.4 27.1 5.8
Turnover (VND bn) 17,866
VN30 (pt, % chg.) 1,147.86 1.5 15.5 32.0 7.2
Major indicators
8 Jan 1D 1W 1M YTD
1-yr gov’t bonds (%, bp chg.) 0.49 0.0 (0.1) 0.0 0.1
3-yr gov’t bonds (%, bp chg.) 0.69 (0.2) (0.2) 0.0 (0.2)
VND/USD (% chg.) 23,067 0.1 0.3 0.5 0.1
VND/JPY (% chg.) 22,208 0.1 (0.0) (1.5) 0.7
VND/EUR (% chg.) 28,343 0.6 (1.1) (3.7) 0.4
VND/CNY (% chg.) 3,568 (0.2) (0.8) (4.3) (0.8)
Prev. close 1D 1W 1M YTD
10-yr US Treasury (%, bp chg.) 1.08 0.0 0.2 0.3 0.2
WTI (USD/bbl, % chg.) 51.15 0.6 12.2 24.2 5.4
Gold (USD/oz, % chg.) 54.83 0.8 12.3 26.5 5.8
Domestic institutions net buy / sell
Net buy (VND bn) Net sell (VND bn)
HPG 116.8 HNG (161.9)
VIC 105.1 FUEVFVND (62.7)
MWG 96.7 ACB (58.4)
FPT 61.0 KBC (19.8)
MSN 60.1 GEX (15.9)
Foreign net buy / sell
Net buy (VND bn) Net sell (VND bn)
VRE 156.6 HPG (305.0)
NVL 95.9 SSI (74.5)
MSB 65.0 VIC (68.3)
FUEVFVND 60.9 DXG (58.4)
HDB 40.5 VND (37.5)
Daily performance by sector
Top five sectors % chg. Bottom five sectors % chg.
Others 2.5 Media & Entertainment (1.5)
Real Estate 2.3 Technology (0.7)
Insurance 1.6 Consumer Services (0.7)
Energy 1.5 Health Care (0.5)
Automobiles 1.4 Commercial Services (0.3)
KIS market view
OP NP EPS growth PE PB EV/EBITDA ROE
(VND bn) (VND bn) (% yoy) (x) (x) (x) (%)
2018 191,785 119,519 29.7 15.2 2.7 13.6 17.7
2019 238,659 144,922 24.2 13.8 2.4 11.0 17.4
2020F 270,014 151,973 7.2 16.7 2.7 11.4 16.1
2021F 304,264 177,159 18.9 14.0 2.3 10.2 16.4
Note: KIS Universe coverage of 35 companies that account for 58% of all listed (VNIndex) firms’ earnings
based on the past three-year average
KIS macro forecast
1Q20 2Q20 3Q20 4Q20F 2019 2020F 2021F
GDP (% yoy) 3.8 0.4 2.6 5.0 7.0 4.3 5.9
Trade balance (USD bn) 1.7 0.6 7.4 5.1 10.4 7.9 1.8
CPI (% yoy, avg.) 5.6 2.8 3.2 3.5 2.8 3.8 3.5
Discount rate (%, EoP) 3.5 3.0 3.0 3.0 4.0 3.0 3.0
VND/USD (avg.) 23,264 23,206 23,188 23,197 23,231 23,214 23,206
US GDP (% qoq) (4.8) (31.7) 33.1 4.6 2.2 (3.5) 3.9
China GDP (% yoy) (6.8) 3.2 4.9 6.0 6.1 2.0 8.2
Source: KIS, Bloomberg
KIS Vietnam Securities Corp. │2
Xin Chao Vietnam
Market commentary & News
Market commentary Hieu Tran [email protected]
Sixth consecutive gaining session
Vietnam stock market continued to go up amid the rebound of the global financial market. While the U.S. Congress has certified
Joe Biden as the 46th president of the United States.
At the close, the VNIndex gained 0.97% to close at 1,167 pts. Meanwhile, trading volume increased to 808 million shares or
VND17,865bn.
Real Estate was the market leader thanks to VIC (+1.5%), VHM (+1.7%), VRE (+4.7%), NVL (+6.2%), SCR (+2.0%), and TCH
(+6.9%).
Some Energy stocks namely PVT (+1.7%), PVD (+4.8%), PVS (+2.0%), BSR (+7.5%), PLX (+1.1%), and OIL (+4.2%)
outperformed the broad market.
Moreover, some constituents of the VN30Index, namely STB (+5.1%), TCB (+3.2%), MBB (+2.7%), and SBT (+2.6%), jumped
more than 2%.
In contrast, VCB (-2.1%), BID (-0.8%), SSI (-0.7%), POW (-0.4%), CTG (-0.4%), and HPG (-0.1%) closed in red territory.
The bullish market is intact in the short term as the VNIndex records a sixth consecutive gaining session. Therefore, traders
should hold their long position and focus on leading stocks.
Breaking news
Vietnam: Credit growth accelerates in the two last months of 2020
Although the lending activity remained sluggish most of the time in 2020 under COVID-19 unfavorable business conditions,
November and December see it booming as the economic activity is normalizing faster than anticipated under a well-controlled
pandemic situation. According to the SBV’s Deputy Governor Dao Minh Tu, by the end of 2020, the total credit is rocketing by
12.13% YTD compared to just 10.14% YTD as of 21st December, which means the lending amount increased by more than
VND160tn just in 10 days before the New Year. (SBV)
Macro & strategy
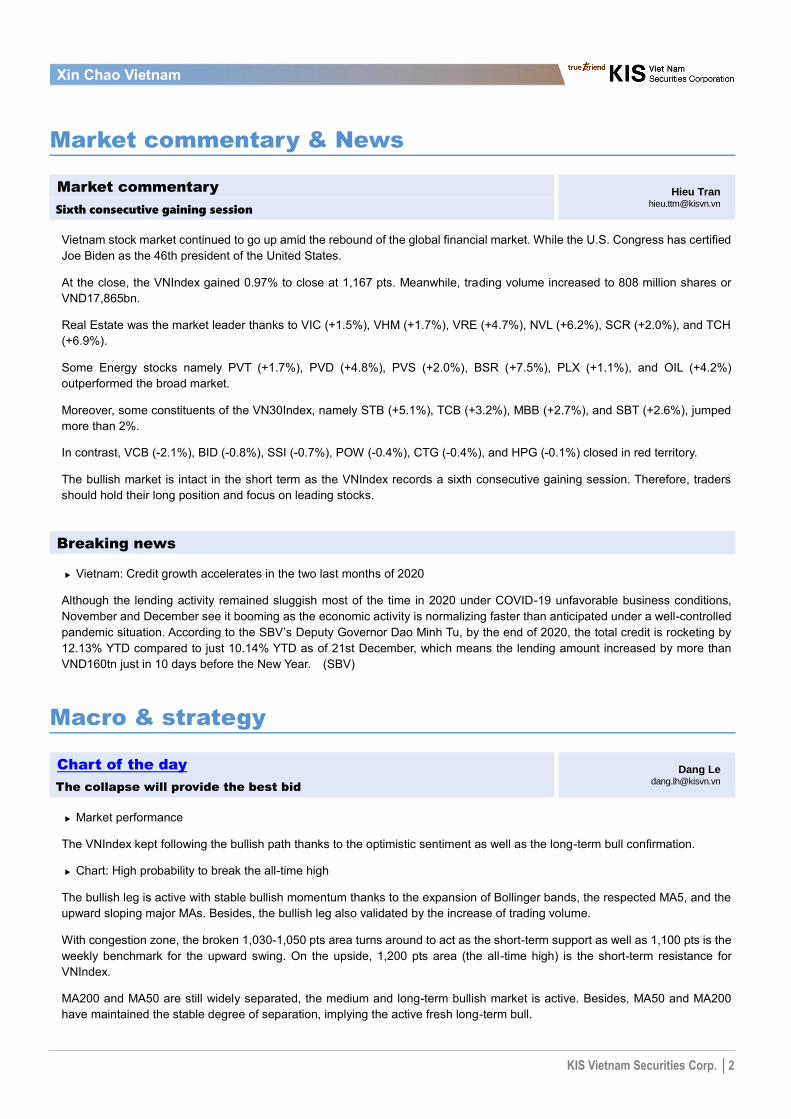
Chart of the day Dang Le [email protected]
The collapse will provide the best bid
Market performance
The VNIndex kept following the bullish path thanks to the optimistic sentiment as well as the long-term bull confirmation.
Chart: High probability to break the all-time high
The bullish leg is active with stable bullish momentum thanks to the expansion of Bollinger bands, the respected MA5, and the
upward sloping major MAs. Besides, the bullish leg also validated by the increase of trading volume.
With congestion zone, the broken 1,030-1,050 pts area turns around to act as the short-term support as well as 1,100 pts is the
weekly benchmark for the upward swing. On the upside, 1,200 pts area (the all-time high) is the short-term resistance for
VNIndex.
MA200 and MA50 are still widely separated, the medium and long-term bullish market is active. Besides, MA50 and MA200
have maintained the stable degree of separation, implying the active fresh long-term bull.
KIS Vietnam Securities Corp. │3
Xin Chao Vietnam
Price shock could occur at 1,200 pts area but all ships will follow the tide.
Technical strategy: Prepare for the best bid
As mentioned above, there is the fresh long-term bull but it will be paused at 1,200 pts area. Thus, investors should hold the
current positions and increase the proportion on leading stocks at the buy zone (1,040-1,080 pts) when the collapse occurs.
2021 Macro view Y Nguyen [email protected]
Vietnam’s economy heads to another successful year
Domestic output to accelerate
Vietnam’s real gross domestic product (GDP) recorded an impressive acceleration in 2020Q4, resulting in a whole-year growth
rate higher than all market expectations. According to the latest GSO’s estimate, Vietnam’s economy increased by 4.48% %YoY
in 4Q20, 1.78 percent point-higher than 3Q20. Consequently, 2020’s real GDP growth posted 2.91% YoY, outperforming
estimates setting by major international economic institutions such as IMF (1.60%), World Bank (2.80%), ADB (1.80%). In the
favor of the promising fiscal spending plan, FTA participations, and vaccine development, we predict that the real domestic
output to grow by 6.36% in 2021.
Strong tailwinds for FDI in 2021
In 4Q20, registered FDI recovered significantly to the third-largest level in 2.5 years. FDI disbursement even peaked at an all-
time high, at about USD6.2bn in 4Q20. The ongoing global production shift opens up a great opportunity for Vietnam FDI in
2021, and this trend is already taking place.
IIP heads to strong performance in 2021
Sustainability in industrial growth was the main point in December as most industries stayed in growth territory except for the
electronics industry. Looking forward to 1H21, thanks to a very low production base in 1H20, we expect the industrial growth to
see a rapid pace.
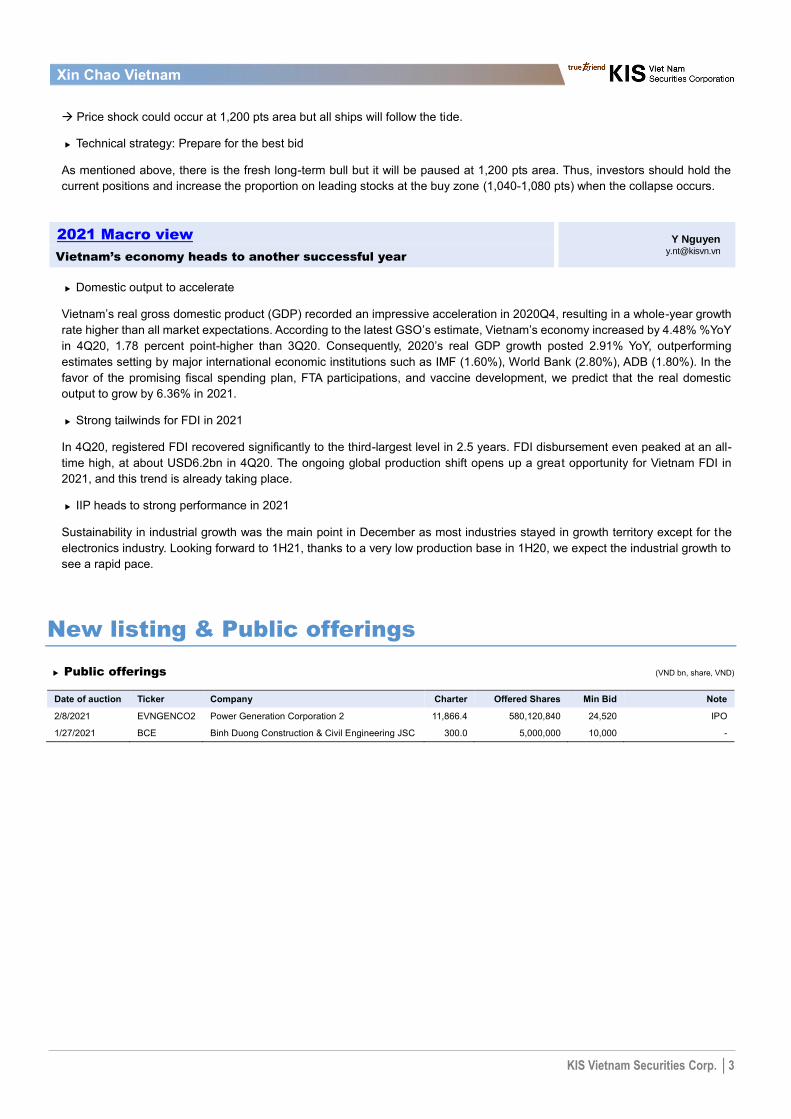
New listing & Public offerings
Public offerings (VND bn, share, VND)
Date of auction Ticker Company Charter Offered Shares Min Bid Note
2/8/2021 EVNGENCO2 Power Generation Corporation 2 11,866.4 580,120,840 24,520 IPO
1/27/2021 BCE Binh Duong Construction & Civil Engineering JSC 300.0 5,000,000 10,000 -
KIS Vietnam Securities Corp. │4
Xin Chao Vietnam
■ Guide to KIS Vietnam Securities Corp. stock ratings based on 12-month forward performance BUY: Expected total return will be 15% or more Hold: Expected total return will be between -5% and 15% Sell: Expected total return will be -5% or less KIS Vietnam Securities Corp. does not offer target prices for stocks with Hold or Sell ratings.
■ Guide to KIS Vietnam Securities Corp. sector ratings for the next 12 months
Overweight: Recommend increasing the sector’s weighting in the portfolio compared to its respective weighting in the VNIndex based on market capitalization.
Neutral: Recommend maintaining the sector’s weighting in the portfolio in line with its respective weighting in the VNIndex based on market capitalization. Underweight: Recommend reducing the sector’s weighting in the portfolio compared to its respective weighting in the VNIndex based on market
capitalization.
■ Analyst Certification I/We, as the research analyst/analysts who prepared this report, do hereby certify that the views expressed in this research report accurately reflect my/our personal views about the subject securities and issuers discussed in this report. I/We do hereby also certify that no part of my/our compensation was, is, or will be directly or indirectly related to the specific recommendations or views contained in this research report.
Global Disclaimer
■ General
This research report and marketing materials for Vietnamese securities are originally prepared and issued by the Research Center of KIS Vietnam Securities Corp., an organization licensed with the State Securities Commission of Vietnam. The analyst(s) who participated in preparing and issuing this research report and marketing materials is/are licensed and regulated by the State Securities Commission of Vietnam in Vietnam only. This report and marketing materials are copyrighted and may not be copied, redistributed, forwarded or altered in any way without the consent of KIS Vietnam Securities Corp.. This research report and marketing materials are for information purposes only. They are not and should not be construed as an offer or solicitation of an offer to purchase or sell any securities or other financial instruments or to participate in any trading strategy. This research report and marketing materials do not provide individually tailored investment advice. This research report and marketing materials do not take into account individual investor circumstances, objectives or needs, and are not intended as recommendations of particular securities, financial instruments or strategies to any particular investor. The securities and other financial instruments discussed in this research report and marketing materials may not be suitable for all investors. The recipient of this research report and marketing materials must make their own independent decisions regarding any securities or financial instruments mentioned herein and investors should seek the advice of a financial adviser. KIS Vietnam Securities Corp. does not undertake that investors will obtain any profits, nor will it share with investors any investment profits. KIS Vietnam Securities Corp., its affiliates, or their affiliates and directors, officers, employees or agents of each of them disclaim any and all responsibility or liability whatsoever for any loss (director consequential) or damage arising out of the use of all or any part of this report or its contents or otherwise arising in connection therewith. Information and opinions contained herein are subject to change without notice and may differ or be contrary to opinions expressed by other business areas or KIS Vietnam Securities Corp. The final investment decision is based on the client’s judgment, and this research report and marketing materials cannot be used as evidence in any legal dispute related to investment decisions.
■ Country-specific disclaimer
United States: This report is distributed in the U.S. by Korea Investment & Securities America, Inc., a member of FINRA/SIPC, and is only intended for major U.S. institutional investors as defined in Rule 15a-6(a)(2) under the U.S. Securities Exchange Act of 1934. All U.S. persons that receive this document by their acceptance thereof represent and warrant that they are a major U.S. institutional investor and have not received this report under any express or implied understanding that they will direct commission income to Korea Investment & Securities, Co., Ltd. or its affiliates.Pursuant to Rule 15a-6(a)(3), any U.S. recipient of this document wishing to effect a transaction in any securities discussed herein should contact and place orders with Korea Investment & Securities America, Inc., which accepts responsibility for the contents of this report in the U.S.The securities described in this report may not have been registered under the U.S. Securities Act of 1933, as amended, and, in such case, may not be offered or sold in the U.S. or to U.S. person absent registration or an applicable exemption from the registration requirement. United Kingdom: This report is not an invitation nor is it intended to be an inducement to engage in investment activity for the purpose of section 21 of the Financial Services and Markets Act 2000 of the United Kingdom ("FSMA"). To the extent that this report does constitute such an invitation or inducement, it is directed only at (i) persons who are investment professionals within the meaning of Article 19(5) of the Financial Services and Markets Act 2000 (Financial Promotion) Order 2005 (as amended) of the United Kingdom (the "Financial Promotion Order"); (ii) persons who fall within Articles 49(2)(a) to (d) ("high net worth companies, unincorporated associations etc.") of the Financial Promotion Order; and (iii) any other persons to whom this report can, for the purposes of section 21 of FSMA, otherwise lawfully be made (all such persons together being referred to as "relevant persons"). Any investment or investment activity to which this report relates is available only to relevant persons and will be engaged in only with relevant persons. Persons who are not relevant persons must not act or rely on this report.
Hong Kong: This research report and marketing materials may be distributed in Hong Kong to institutional clients by Korea Investment & Securities Asia Limited (KISA), a Hong Kong representative subsidiary of Korea Investment & Securities Co., Ltd., and may not otherwise be distributed to any other party. KISA provides equity sales service to institutional clients in Hong Kong for Korean securities under its sole discretion, and is thus solely responsible for provision of the aforementioned equity selling activities in Hong Kong. All requests by and correspondence with Hong Kong investors involving securities discussed in this report and marketing materials must be effected through KISA, which is registered with The Securities & Futures Commission (SFC) of Hong Kong. Korea Investment & Securities Co., Ltd. is not a registered financial institution under Hong Kong’s SFC. Singapore: This report is provided pursuant to the financial advisory licensing exemption under Regulation 27(1)(e) of the Financial Advisers Regulation of Singapore and accordingly may only be provided to persons in Singapore who are "institutional investors" as defined in Section 4A of the Securities and Futures Act, Chapter 289 of Singapore. This report is intended only for the person to whom Korea Investment & Securities Co., Ltd. has provided this report and such person may not send, forward or transmit in any way this report or any copy of this report to any other person. Please contact Korea Investment & Securities Singapore Pte Ltd in respect of any matters arising from, or in connection with, the analysis or report (Contact Number: 65 6501 5600). Copyright ⓒ 2021 KIS Vietnam Securities Corp.. All rights reserved. No part of this report may be reproduced or distributed in any manner without permission of KIS Vietnam Securities Corp..