XIANG ZHU - University of Georgia
124
SUBCELLULAR PROTEOMIC ANALYSIS USING GELC-MS/MS APPROACH by XIANG ZHU (Under the Direction of Ron Orlando) ABSTRACT Mass spectrometry (MS) has become a widely used analytical technique to study the proteome of complex biological matrices. In this research, the gel based proteomic approach (GeLC-MS) was developed and applied to solve biological problems in different organisms such as Trypanosoma cruzi (T. cruzi) and embryonic stem cells. A membrane proteomic analysis of the protozoan parasite T. cruzi was performed. Using two individual membrane enrichment preparations, a total of 551 protein groups got identified from around 80 LC-MS/MS runs. Both two preparation strategies were effectively enriching some respective membrane proteins. The identified membrane proteins accounted for almost 40% of the protein identifications within the whole proteome, which shows great enrichment compared to regular global analyses which only have about 5%. The most attractive result for us is the identification of 87 trans-sialidases, 9 mucin associated surface protein (MASP), 3 mucins, and 2 GP63 proteins. These GPI anchored surface proteins are involved in parasite survival and cell invasions, thus could become potential vaccine targets. A comprehensive proteome analysis of T. cruzi intracellular amastigotes was introduced. Subcellular organelle and membrane enriched fractions as well as cytosol soluble fractions were individually obtained and analyzed using GeLC-MS/MS approach. In addition to matching the
Transcript of XIANG ZHU - University of Georgia
SUBCELLULAR PROTEOMIC ANALYSIS USING GELC-MS/MS APPROACH
by
XIANG ZHU
(Under the Direction of Ron Orlando)
ABSTRACT
Mass spectrometry (MS) has become a widely used analytical technique to study the
proteome of complex biological matrices. In this research, the gel based proteomic approach
(GeLC-MS) was developed and applied to solve biological problems in different organisms such
as Trypanosoma cruzi (T. cruzi) and embryonic stem cells.
A membrane proteomic analysis of the protozoan parasite T. cruzi was performed. Using
two individual membrane enrichment preparations, a total of 551 protein groups got identified
from around 80 LC-MS/MS runs. Both two preparation strategies were effectively enriching
some respective membrane proteins. The identified membrane proteins accounted for almost
40% of the protein identifications within the whole proteome, which shows great enrichment
compared to regular global analyses which only have about 5%. The most attractive result for us
is the identification of 87 trans-sialidases, 9 mucin associated surface protein (MASP), 3 mucins,
and 2 GP63 proteins. These GPI anchored surface proteins are involved in parasite survival and
cell invasions, thus could become potential vaccine targets.
A comprehensive proteome analysis of T. cruzi intracellular amastigotes was introduced.
Subcellular organelle and membrane enriched fractions as well as cytosol soluble fractions were
individually obtained and analyzed using GeLC-MS/MS approach. In addition to matching the

MS/MS spectra to the annotated proteome database, we performed a whole genome search in
order to identify additional genes potentially missed in the annotation of the T. cruzi genome. We
also utilized a hybrid identification tool (ByOnic) for the identification of unanticipated
mutations caused by different T. cruzi strains.
We also report here the application of GeLC-MS approach to resolve some protein
isoforms’ identification including trans-sialidases, GP63, etc in T. cruzi. Additionally this
technique was utilized to analyze the mouse embryonic stem cell proteome and focused on
looking for some potential protein degradation products. Our identification data has shown that
this approach is efficient and helpful for discovering the protein degradation process, which
plays essential roles in biological cellular functions and activities.
INDEX WORDS: Mass spectrometry, Proteomics, Membrane, GeLC-MS, Protein isoform,
Degradation, Trypanosoma cruzi, Embryonic stem cell

SUBCELLULAR PROTEOMIC ANALYSIS USING GELC-MS/MS APPROACH
by
XIANG ZHU
B.S., University of Science and Technology of China, China, 2003
A Dissertation Submitted to the Graduate Faculty of The University of Georgia in Partial
Fulfillment of the Requirements for the Degree
DOCTOR OF PHILOSOPHY
ATHENS, GEORGIA
2011

© 2011
Xiang Zhu
All Rights Reserved

SUBCELLULAR PROTEOMIC ANALYSIS USING GELC-MS/MS APPROACH
by
XIANG ZHU
Major Professor: Ron Orlando
Committee: Lance Wells
Joshua Sharp
Electronic Version Approved:
Maureen Grasso
Dean of the Graduate School
The University of Georgia
December 2011

iv
DEDICATION
This dissertation is dedicated to my grandfather, Leting Zhu, my parents, Weihan Zhu and
Xiulan Zhou, my wife, Liling Zeng, and my daughter, Julia Zhu for their unconditional love and
support.

v
ACKNOWLEDGEMENTS
First and foremost, I would like to thank my advisor, Dr. Ron Orlando, for his guidance,
patience, encouragement and kind support during these years, as well as for providing me with
excellent experiences and facilities. I feel fortunate and enjoyable to study and conduct research
under his guidance.
I would also like to thank my committee members Dr. Lance Wells and Dr. Joshua Sharp,
for their insightful and helpful discussions on my thesis.
My sincerest gratitude is also expressed to all the individuals who I have had the honor of
working with on my projects: Dr. James Atwood, Brent Weatherly, Dr. Rick Tarleton, Dr. Todd
Minning, Dr. Marshall Bern, Dr. Matt Bechard and Dr. Stephen Dalton. My appreciation also
goes to all past and present members of the Orlando group for their collaboration and help.
Finally, I would like to thank my entire family and friends for their support.
vi
TABLE OF CONTENTS
Page
ACKNOWLEDGEMENTS .............................................................................................................v
CHAPTER
1 INTRODUCTION .........................................................................................................1
2 LITERATURE REVIEW ..............................................................................................5
3 MEMBRANE PROTEOMIC ANALYSIS OF THE PROTOZOAN PARASITE
TRYPANOSOMA CRUZI .............................................................................................22
4 SUBCELLULAR PROTEOMICS OF TRYPANOSOMA CRUZI INTRACELLULAR
AMASTIGOTE............................................................................................................45
5 RESOLVING PROTEIN ISOFORMS IN PROTOZOAN PARASITE
TRYPANOSOMA CRUZI USING GELC-MS/MS APPROACH ................................72
6 GELC-MS/MS ANALYSIS ON EMBRYONIC STEM CELL PROTEIN
DEGRADATION ........................................................................................................96
7 CONCLUSIONS........................................................................................................115
1
CHAPTER 1
INTRODUCTION
Mass spectrometry (MS) is a widely used analytical technique to determine molecular
mass of unknown compounds by measuring the mass-to-charge ratios (m/z) of molecular ions.
For a long time, this technique is mostly limited in the small molecules area and characterization
of biological large molecules is not desirable.1 The main reason is because the traditional
methods such as electron ionization (EI) and chemical ionization (CI) can not vaporize those
molecules without fragmenting them. The invention of soft ionization methods such as Matrix
Assisted Laser Desorption Ionization (MALDI)2 and Electrospray Ionization (ESI)
3 facilitate the
application of analyzing large molecules with MS.
Analogous to genomics which is the study of gene, proteomics is described as the large-
scale study of proteins expressed in complex matrices, such as cells, tissues, serum, etc.4,5
MS
based proteomics is widely used for protein identification, post-translation modification (PTM)
determination and quantitative analysis. Compared to mRNA analysis, proteomics is a more
accurate analytical method to reveal the real gene product expressions. This is because for many
organisms such as T. cruzi, the control of gene expression happens post-transcriptionally and the
mRNA is not always translated to proteins.6,7
The correlation between mRNA and protein levels
is becoming very poor. Herein, we applied the gel based proteomics method to investigate the
proteome of different organisms such as T. cruzi and embryonic stem cells.
In chapter 3, we performed a membrane proteomic analysis of the protozoan parasite T.
cruzi. The membrane fractions were enriched using three different preparations: sucrose cushion
2
method, detergent resistant preparation and the combination of sucrose and detergent. Our
analysis has identified an essential number of membrane proteins including those
immunodominant trans-sialidase and mucin proteins. Identified membrane proteins also show
various distributions among the preparation methods. The methods developed in this study have
been extensively applied in all the other projects.
In chapter 4, we focused our study on subcellular proteomics of intracellular amastigote
which is one of the T. cruzi mammalian stages. In the protein identification data processing,
besides matching the MS/MS spectra to the annotated proteome database, we also performed the
whole DNA search in order to identify additional genes potentially missed in the T. cruzi genome
sequencing annotations. We also utilize a hybrid identification tool (ByOnic) that can perform a
wildcard-database search strategy for the identification of unanticipated modifications and
potential mutations.8 The aim of this work was to find much more interesting gene products that
are normally expressed at low levels and less investigated before. The results derived from this
proteome analysis will largely expand the current datasets of the T. cruzi proteome and help us
better understand the parasite’s system biology.
For T. cruzi, at least 30% of this parasite’s genome is composed of multi-copy gene
families. These protein isoforms usually contain very similar sequences with some shared
peptides and regular shotgun proteomics experiments like MudPIT can't differentiate them well.
In chapter 5, we demonstrated how the GeLC-MS approach is utilized to resolve protein
isoforms based on combining shotgun proteomic results with molecular weight information and
protein grouping. Similar methods were also selected to evaluate some protein degradation
process in an embryonic stem cell system, described in chapter 6. More comprehensive studies

3
on the ES cell protein degradation products and related pathways could make valuable
contribution to the development of stem cell differentiation researches.
4
REFERENCES
(1) Domon, B.; Aebersold, R. Science 2006, 312, 212.
(2) Karas, M.; Hillenkamp, F. Anal Chem 1988, 60, 2299.
(3) Fenn, J. B.; Mann, M.; Meng, C. K.; Wong, S. F.; Whitehouse, C. M. Science
1989, 246, 64.
(4) Blackstock, W. P.; Weir, M. P. Trends Biotechnol 1999, 17, 121.
(5) Anderson, N. L.; Anderson, N. G. Electrophoresis 1998, 19, 1853.
(6) Dhingra, V.; Gupta, M.; Andacht, T.; Fu, Z. F. Int J Pharm 2005, 299, 1.
(7) Paba, J.; Ricart, C. A.; Fontes, W.; Santana, J. M.; Teixeira, A. R.; Marchese, J.;
Williamson, B.; Hunt, T.; Karger, B. L.; Sousa, M. V. J Proteome Res 2004, 3, 517.
(8) Bern, M.; Cai, Y.; Goldberg, D. Anal Chem 2007, 79, 1393.
5
CHAPTER 2
LITERATURE REVIEW
2.1 Mass Spectrometry
Mass spectrometry (MS) is a powerful analytical tool to determine molecular mass of
unknowns by measuring the mass-to-charge ratios (m/z) of gas phase molecular ions. A typical
mass spectrometer contains three major components: ion source, mass analyzer and detector. The
first step in MS analysis is to generate the gas phase analyte molecular ions. The main traditional
methods are electron ionization (EI) and chemical ionization (CI), which are commonly used for
volatile small molecules. The large, nonvolative and thermally unstable analytes such as proteins
and peptides can not be effectively vaporized without fragmentation, thus making these two
methods not applicable to analyze biomolecules. The breakthrough for structural analysis of
large biomolecules using MS occurred in 1980's with the invention of matrix-assisted laser
desorption/ionization (MALDI)1 and electrospray ionization (ESI).
2
Matrix Assisted Laser Desorption/Ionization (MALDI)
In 1985, MALDI was firstly termed by Franz Hillenkamp, Michael Karas and their
colleagues.1 They found that with a pulsed 266 nm laser, the amino acids could be easily ionized.
The breakthrough of this technique came in 1987 when Koichi Tanaka and his co-workers of
Shimadzu Corp applied this soft method to ionize a 35KDa protein with the proper laser
wavelength and matrix.3 For sample preparation, the analyte was firstly mixed with matrix
molecules. The matrix compounds are usually having low molecular weight, acidic and can
absorb the laser irradiation at applied wavelength.4,5
Matrix molecules protect the analytes from
6
strong laser irradiation and transfer part of the charge to them, causing the analyte co-
evaporation and ionization. Most of the molecular ions produced through MALDI are singly
charged.
Electrospray Ionization (ESI)
Another soft ionization technique developed for large biomolecules is electrospray
ionization (ESI), introduced by John Bennett Fenn and coworkers.2 In this technique, a strong
electric field is imposed on a liquid containing the analyte flowing through a capillary. At the
end of spray tip, highly charged droplets were produced due to charge accumulation. The liquid
changes the shape to a "Taylor cone", which can hold more charges than a sphere.6-8
With the
evaporation of solvents, the droplet size is shrunk and become unstable due to high charge
density. After it reaches the Rayleigh limit, the droplets are broken apart and form Coulomb
fission. There are several advantages for ESI in the application of MS. First, this ionization
method can produce multiply charged ions, making high molecular weight ions possible to be
detected at relatively low mass-to-charge ratio range. Secondly, ESI can be easily coupled to on-
line high performance liquid chromatography (HPLC) system or electrophoresis.9,10
Mass Analyzers
Mass spectrometers usually consist of three major components: an ion source, a mass
analyzer and an ion detector. Among them the mass analyzer plays critical roles for separating
ions based on their m/z ratios through electric or magnetic field. There are several different types
of mass analyzers; most widely used are quadrupole, time-of-flight (TOF), ion trap and Fourier
transform ion cyclotron resonance (FTICR). Each mass analyzer has its own advantages and
limitations. Choosing proper mass analyzer in different projects should be based on the
7
individual application purpose. In the following paragraphs, we will briefly discuss the working
mechanisms for some commonly used mass analyzers.
Quadrupole Mass Analyzer
This type of mass analyzer is composed of four parallel cylindrical rods. Opposite rod
pair is connected electrically. Fixed direct current (DC) and alternating radio frequency (RF)
potentials are applied to these pair of rods, generating the oscillating electric field. During
analysis, the Ions move between the four parallel rods. Only ions with a selected m/z value will
have a stable trajectory in the oscillating electric field. Those ions can pass through the
quadrupole and successfully reach the detector for a given RF/DC ratio. Other unstable ions will
collide with the rods and get disappeared. The mass spectrum is generated by continuously
altering the RF and DC voltages to scan a range of m/z values. The quadrupole has a mass
accuracy of 0.1~1Da and unit mass resolution.11
The sensitivity of this mass analyzer is in
moderate range. One of the most popular instruments using quadrupole as mass analyzer is triple
quadrupole spectrometer (QQQ).12
In this instrument, the first quadrupole Q1 is used as a mass
filter to select parent ions. Q2 has the function of collision cell and fragment ions using collision
induced dissociation (CID). The third Q3 quadrupole is applied to filter fragment ions. The major
scan modes and application for this instrument is the capability of performing precursor ion scan,
neutral loss scan and multiple reaction monitoring (MRM) scan.
Time-of-Flight (TOF) Mass Analyzer
In TOF mass spectrometer, the ion's m/z value is determined by measuring the flight
time. Ions are accelerated by a fixed strength of electric field (2-25 kV). During acceleration, all
the ions travel through the same distance by the same force, thus they obtain the same kinetic
energy. The ions were selected following the equation (zU=KE=1
/2
m/v2 ), where U is the

8
strength of the electric field and contains constant. The velocity of an ion is inversely
proportional to the square-root of its m/z value. Therefore, larger m/z ions need more time to fly.
Typical TOF instruments can have a mass accuracy in the tens of ppm. The sensitivity of this
mass spectrometer is very high because all ions are transmitted to the detector. The traditional
TOF has a low resolution, which is only around 500 units.13
In recent years, there are two major
techniques largely increase the TOF's resolution. The first one is "Delayed Extraction".14
In this
method, the applied accelerating voltage is postponed some short time delay after the laser pulse.
Ions with greater initial kinetic energy have a higher velocity and are closer to the extraction
electrode before the accelerating voltage is applied. After a certain time, the delayed extraction
pulse is added to compensate for the spread in kinetic energies. Finally, the ions with the same
m/z will reach the detector at the same time. The resolution can also be improved by a
reflectron.15,16
The reflectron is an electrostatic field which reflects the ions towards the detector.
The ions with higher initial kinetic energy penetrate deeper into the electrostatic reflectron and
spend a longer time to reach the detector. On the other hand, lower kinetic ions of the same m/z
will flight a shorter distance. Finally, ions of same m/z will arrive the detector at the same time.
Besides that, reflectron increases the flight path length in a given length of flight tube. Current
TOF instrument applying these techniques can achieve a resolving power of more than 10,000.
Quadrupole Ion Trap Mass Analyzer
Quadrupole ion trap is the three dimensional analogue of a quadrupole mass analyzer.
This device contains three electrodes with hyperbolic surfaces: two endcap electrode and one
ring electrode. DC and main RF electric fields are applied on the electrodes to trap the ions. By
adjusting the RF and DC voltage at the electrodes, ions can be excited, become unstable and
ejected out for detection when their resonance frequency matches the resonance applied to the

9
trap.17
The mass spectrum can be obtained by scanning the fields at which ions are ejected from
the trap to the detector. Ion traps are typically very sensitive since they accumulate the ions in the
trap before doing mass separation. The other advantage of ion trap is the availability of doing
multi-stage tandem mass spectrometry by operating sequential analysis in time. However
traditional ion trap has limited resolution, low ion-trapping capacity, and space-charge effects
due to limited size. The development of linear ion trap analyzer (LTQ) has provided a higher
trapping capacity by using two dimensional quadrupole field instead of a 3D field. The mass
accuracy, sensitivity and resolution are all largely improved with this new technique.18-20
Fourier Transform Ion Cyclotron Resonance (FTICR)
A very high mass accuracy and resolution can be achieved by FTICR. FTICR mass
spectrometers use high magnetic fields under ultra-high vacuum to trap the ions and cyclotron
resonance to excite and detect ions.21
The extremely high mass accuracy makes FTICR trustable
to determine the molecular composition based on accurate mass since most elements have mass
defects.22
Combination of LTQ and FTICR are able to perform the isolation and fragmentation of
ions outside FT. In this way, the precursor ion mass is scan with high accurate FTMS, but the
fragment ion masses can be acquired using the fast ion trap scan.23
The limitation of FTICR scan
is the relatively lower sensitivity due to the slow scan rate. Another drawback is the significant
high cost of the instrument and maintenance.
2.2 Proteomics
Analogous to genomics which is the study of gene, proteomics is described as the large-
scale study of proteins expressed in complex matrices, such as cells, tissues, serum, etc.24,25
Besides protein sequence identification, proteomics is also targeted at other areas such as post-
translational modification (PTM) determination, modification site mapping, quantitative analysis
10
of protein expression, protein-protein and protein-carbohydrate interactions etc. The major tools
used in proteomic analysis are the combination of mass spectrometry, advanced separation
techniques and bioinformatic data processing methodologies. In general, there are two primary
strategies used in MS-based proteomics: top-down and bottom-up proteomics.26
For top-down
proteomics, the intact protein is directly fragmented in the gas-phase followed by MS analysis. In
bottom-up proteomics, the protein mixtures undergo proteolytic digestion into peptides prior to
being analyzed by MS.
Top-down Proteomics
In top-down proteomics approach intact proteins are ionized and subjected to gas phase
fragmentation in the mass spectrometer. The major advantages of top-down proteomics are the
high protein sequence coverage and the possibility to detect all PTMs.27
In addition, it doesn't
require the protein digestion step which is time-consuming. This technique also has some
limitations compared to bottom-up proteomics. First, the top-down approach can't obtain
satisfied results of intact proteins larger than 50 kDa. Second, the analysis of intact proteins
generally requires FTICR to provide high resolution and mass accuracy measurements, and the
cost is very expensive. Third, the protein dissociation mechanism is still not well understood and
corresponding powerful bioinformatic tools are quite limited.28,29
For large scale high-throughput
proteomics, top-down approach may not be a good choice at current status.30
Bottom-up Proteomics
Bottom-up proteomics is the most widely used analytical approach to perform large scale
proteome identification and quantitation. In this method, the protein analytes are firstly
proteolytic digested into peptides which are further analyzed by MS. The obtained peptide
information is then assembled into protein sequences for identification purpose. Generally, there
11
are two approaches for bottom-up protein identification: peptide mass fingerprinting (PMF) and
tandem mass spectrometry (MS/MS).31
MALDI-TOF is usually utilized for PMF analysis. In this method, a list of experimental
peptide mass is generated from mass spectrum of the peptide mixture. The measured masses are
then compared with the in-silico theoretical peptide masses from the protein database. The
results are statistically analyzed to make the proper identification. Typical PMF requires less
complex protein mixtures, so separation of the protein mixtures before analysis is essential. The
most commonly used technique is two dimensional gel electrophoresis (2DGE) where proteins
are separated in one dimension by their isoelectric point and molecular weight in the second
dimension.32-34
The second approach in bottom-up proteomics is using tandem mass spectrometry. This
is also the one we choose in our proteomic analysis. The prominent feature of this method is the
ability of elucidating the peptide sequence by fragment ions. The most common method of
fragmentation is called collision induced dissociation (CID). Selected precursor ions are collided
with inert gas such as helium or nitrogen to generate fragment ions. Fragmentation of the peptide
occurs at three locations on the backbone. After fragmentation, if the charge is retained on the N-
terminal part of the peptide, the ion is named as a, b, or c fragment ion. Ions containing C-
terminal fragments are then defined as x, y, z ions. Regular tryptic digested peptides with CID
fragmentation mostly result in b and y ions. MS/MS based bottom-up proteomics is usually
applied to study a complex biological system which requires effective fractionation separations.
This is achieved mainly through two approaches: gel-free and gel-based analyses.
Gel-free Approach

12
Gel-free approach or sometimes referred as shotgun proteomics is a method that utilizes
peptide separation before MS/MS analysis.35,36
The protein mixtures are directly in-solution
digested, the resulting tryptic peptides are further separated by multi-dimensional high
performance liquid chromatography and analyzed by ESI-MS/MS.37
The multi-dimensional
peptide separation can be varied based on different physicochemical properties.38
For example,
reverse phase liquid chromatography (RPLC) is the most popular one, which separates peptides
by hydrophobicity. Strong cation exchange (SCX) is known to separate peptides by charge and
size exclusion chromatography (SEC) is based on molecular size difference. Moreover, the
orthogonal combination of two or more coupled chromatographic approaches has been applied to
separate complex peptide mixtures. Multidimensional protein identification technology
(MudPIT)39
is one of the most famous gel-free proteomic technique, where SCX functions as the
first dimensional separation and RPLC provide the second separation before introduced into MS.
In recent years, this promising technique has been widely used in many applications and proven
to extensively increase the dynamic range of identifications.40-42
Gel-based Approach (GeLC-MS)
In bottom-up proteomics, reducing the sample complexity is an important factor for
detecting larger dynamic range of products. Compared to gel-free technique that performs all the
separation at peptide level, the GeLC approach43-47
we introduced here initially separates the
proteins by 1D gel electrophoresis. Proteins in the excised gel bands are then subsequently
reduced, alkylated, and in gel digested. Generated peptides were extracted and separated through
an on-line RPLC system before analyzed by MS/MS. There are several advantages using this
strategy. First, the separation at protein level can isolate some low abundant proteins from the
high abundant ones. This significantly increase the dynamic range of the analysis and helpful to
13
identify new gene products. Second, the gel based method is highly compatible with detergent
and denature agents. This is particularly important for samples that have poor solubility during
gel-free analysis. Most of the salts, which interfere with ESI mass spectrometry, are also easily
washed out from the gel matrix. Third, gels can be stored for quite a long time without changing
the analysis results. In addition, we have shown in our analysis that the GeLC-MS approach can
facilitate to resolve protein isoforms and detect possible protein degradation process. However it
still has some limitations in this technique, for example the relatively poor peptide yield, the risk
of contaminating analytes with keratins or other contaminants in the gel processing steps and
lower reproducibility compared to gel-free approach.
Data Analysis
Assigning hundreds of thousands of MS/MS spectra to peptide sequences is another
important step in high-throughput bottom-up proteomics. This task is usually fulfilled by
bioinformatic data analysis strategies. The most commonly used method is through database
searching programs, such as SEQUEST, Mascot and X!Tandem.48-50
These programs compare
the experimental spectra (both parent ion mass and MS/MS spectrum) with the in-silico
predicted spectra of peptides from the protein database. A score (Xcorr value for SEQUEST and
Mowse score for Mascot) is then assigned for candidate peptides to represent the similarity
between the experimental and the theoretical data, and therefore becomes the primary
discriminating factor for separating correct from false positive identifications. Although these
methods are powerful for general peptide mapping, they still have limitations in the identification
of modified peptides. Allowing multiple modifications in database search will largely slow down
the running process, and it can't effectively identify the unexpectedly modified peptides. De novo
sequencing based programs such as PEAKS, DenovoX, etc can better handle the unexpected

14
modification problem.51
It is also almost the only way to identify unknown species which don't
have public protein databases. While this technique usually requires more complete
fragmentation information and better spectrum qualities, thus less sensitive for unmodified
peptides than database searching. Nowadays, some hybrid approaches combine small amount of
de novo sequencing and database searching. Those strategies are applied to provide a more
sensitive searching and having the ability to resolve unexpected modifications and mutations as
well. In our trypanosoma cruzi intracellular amastigote study (chapter 4), we utilize one of these
approaches ByOnic52
to search PTMs and mutations.
Subcellular Proteomics
One of the major challenges in proteomics is to achieve comprehensive analysis and
applicable of detecting low abundant proteins. Most eukaryote cells express a large number of
genes, for example the number of expressed genes in a mammalian cell can be more than
10,000.53
Because of this, a lot of low abundant genes are inevitably hidden by those high
abundant proteins. In regular whole cell proteomic analysis, it's impossible to detect the entire
proteome, and the identification are more focused on those high abundant expressed genes.
However, a lot of low abundant proteins are expressed in specific subcellular localizations
although they only exist in low copy numbers. Thus a combination of organelle subcelluar
enrichment and proteomics becomes essential for comprehensive analysis, especially with a
purpose of detecting particularly low abundant organelle proteins.54,55
The most commonly used
and effective subcellular fractionation method is through differential centrifugation. The working
mechanism of this technique is based on the different density of various organelles. The
fractionation can be achieved either through centrifugation with different speed or density
gradient centrifugation.56,57
Both methods can generate several fractions enriched with specific
15
organelles. According to the density from light to heavy, those fractions are mainly contained
with 1) nucleus; 2) heavy mitochondria, cytoskeletal networks; 3) light mitochondria,
peroxisomes and lysosomes; 4) endoplasmic reticulum (ER) and endosomes; 5) golgi apparatus,
microsomes and plasma membranes; 6) cytosol. There are several other techniques besides
centrifugation are often applied for fractionation enrichment. For example, free-flow
electrophoresis can be used to isolate plasma membrane vesicles, detergent-resistant membranes,
and mitochondria based on electrical charge effects.54
Ligand affinity for immunoisolation has
been applied to purify synaptic vesicles and caveolae, etc.58-61
Among all the subcellular organelle fractions, the cell surface membranes have attracted
the most interest in proteomic studies. It consists of lipid bilayer with membrane embedded and
associated proteins. The major role of the membranes is to provide a physical barrier between the
cell and its environment. The membrane proteins carry out many important biological functions
and get involved in a variety of cellular processes, including cell-cell interactions, ion
transportation, and signal transduction, etc. Membrane proteins also have great potential in drug
discovery. Currently, almost 70% of all known pharmaceutical drug targets are with membrane
proteins.62
There is also growing interest in the use of disease specific cell surface proteins as the
target of therapeutic monoclonal antibodies. The membrane proteins are usually categorized into
several different ones. Integral membrane proteins are amphipathic and permanently attached to
the membrane. Without the assistance of detergent, they are not easily released from the lipid
bilayer. Peripheral membrane or membrane associated proteins are temporarily attached either to
the lipid bilayer or to integral proteins by non-covalent interactions. The loosely bound
interaction can be broken by high pH or high salt solutions. Another important membrane protein
on the cell surface is glycosylphosphatidylinositol (GPI)-anchored proteins. They are attached to

16
the cell surface through a glycolipid linker. The regions containing them are defined as "lipid
rafts".63-65
Although proteomics has gained numerous progresses in the analysis of soluble
proteins in recent years, studies of membrane proteins have been largely lagged behind.66,67
This
is mainly because 1) membrane proteins are usually in low abundance; 2) their hydrophobic
domains make the protein solubilization process difficult; 3) the detergent and denature agents
used for solubilization interfere with digestion and MS analysis. In recent years, improved
subcellular fractionation and enrichments as well as refined solubilization, modern MS
techniques have facilitated the membrane proteomic studies.68-72
The first large scale membrane
proteomics was conducted by Yate's group.40
In their research, an enriched yeast membrane
fraction is analyzed by MudPIT technique. 131 integral membrane proteins were identified, with
three or more predicted transmembrane domains from the 1,484 total identified yeast proteins.
Various membrane proteomic analyses have been performed in other different organisms to
understand specific biological questions.
In chapter 3 and 4, we are going to introduce our investigation of subcellular and
membrane proteome of trypanosoma cruzi, in which those membrane proteins play critical roles
for parasite invasion and survival from host immune response.

17
REFERENCES
(1) Karas, M.; Hillenkamp, F. Anal Chem 1988, 60, 2299.
(2) Fenn, J. B.; Mann, M.; Meng, C. K.; Wong, S. F.; Whitehouse, C. M. Science
1989, 246, 64.
(3) Tanaka, K.; Waki, H.; Ido, Y.; Akita, S.; Yoshida, Y.; Yoshida, T.; Matsuo, T.
Rapid Communications in Mass Spectrometry 1988, 2, 151.
(4) Beavis, R. C.; Chait, B. T. Rapid Commun Mass Spectrom 1989, 3, 432.
(5) Beavis, R. C.; Chait, B. T. Rapid Commun Mass Spectrom 1989, 3, 436.
(6) Smith, R. D.; Loo, J. A.; Edmonds, C. G.; Barinaga, C. J.; Udseth, H. R. Anal
Chem 1990, 62, 882.
(7) Wilm, M.; Mann, M. Anal Chem 1996, 68, 1.
(8) Taylor, G. Proceedings of the Royal Society A: Mathematical, Physical and
Engineering Sciences 1964, 280, 383.
(9) Huang, L.; Riggin, R. M. Anal Chem 2000, 72, 3539.
(10) Blakley, C. R.; Carmody, J. C.; Vestal, M. L. Clin Chem 1980, 26, 1467.
(11) Gygi, S. P.; Aebersold, R. Curr Opin Chem Biol 2000, 4, 489.
(12) Yost, R. A.; Boyd, R. K. Methods Enzymol 1990, 193, 154.
(13) Cotter, R. J. Biomed Environ Mass Spectrom 1989, 18, 513.
(14) Brown, R. S.; Lennon, J. J. Analytical Chemistry 1995, 67, 1998.
(15) Fancher, C. A.; Woods, A. S.; Cotter, R. J. J Mass Spectrom 2000, 35, 157.
(16) Kaufmann, R.; Chaurand, P.; Kirsch, D.; Spengler, B. Rapid Commun Mass
Spectrom 1996, 10, 1199.
(17) Stafford, G., Jr. J Am Soc Mass Spectrom 2002, 13, 589.

18
(18) Hager, J. W.; Le Blanc, J. C. J Chromatogr A 2003, 1020, 3.
(19) Schwartz, J. C.; Senko, M. W.; Syka, J. E. J Am Soc Mass Spectrom 2002, 13,
659.
(20) Mayya, V.; Rezaul, K.; Cong, Y. S.; Han, D. Mol Cell Proteomics 2005, 4, 214.
(21) Comisarow, M. B.; Marshall, A. G. J Mass Spectrom 1996, 31, 581.
(22) Hernandez, H.; Niehauser, S.; Boltz, S. A.; Gawandi, V.; Phillips, R. S.; Amster,
I. J. Anal Chem 2006, 78, 3417.
(23) Bogdanov, B.; Smith, R. D. Mass Spectrom Rev 2005, 24, 168.
(24) Pandey, A.; Mann, M. Nature 2000, 405, 837.
(25) Blackstock, W. P.; Weir, M. P. Trends Biotechnol 1999, 17, 121.
(26) Chait, B. T. Science 2006, 314, 65.
(27) Forbes, A. J.; Patrie, S. M.; Taylor, G. K.; Kim, Y. B.; Jiang, L.; Kelleher, N. L.
Proc Natl Acad Sci U S A 2004, 101, 2678.
(28) Taylor, G. K.; Kim, Y. B.; Forbes, A. J.; Meng, F.; McCarthy, R.; Kelleher, N. L.
Anal Chem 2003, 75, 4081.
(29) Zamdborg, L.; LeDuc, R. D.; Glowacz, K. J.; Kim, Y. B.; Viswanathan, V.;
Spaulding, I. T.; Early, B. P.; Bluhm, E. J.; Babai, S.; Kelleher, N. L. Nucleic Acids Res 2007,
35, W701.
(30) Reid, G. E.; McLuckey, S. A. J Mass Spectrom 2002, 37, 663.
(31) Han, X.; Aslanian, A.; Yates, J. R., 3rd Curr Opin Chem Biol 2008, 12, 483.
(32) Henzel, W. J.; Billeci, T. M.; Stults, J. T.; Wong, S. C.; Grimley, C.; Watanabe,
C. Proc Natl Acad Sci U S A 1993, 90, 5011.
(33) Roepstorff, P. EXS 2000, 88, 81.
19
(34) Pappin, D. J. Methods Mol Biol 2003, 211, 211.
(35) Yates, J. R., 3rd; Link, A. J.; Schieltz, D. Methods Mol Biol 2000, 146, 17.
(36) Link, A. J.; Eng, J.; Schieltz, D. M.; Carmack, E.; Mize, G. J.; Morris, D. R.;
Garvik, B. M.; Yates, J. R., 3rd Nat Biotechnol 1999, 17, 676.
(37) Hunt, D. F.; Yates, J. R., 3rd; Shabanowitz, J.; Winston, S.; Hauer, C. R. Proc
Natl Acad Sci U S A 1986, 83, 6233.
(38) Giddings, J. C. Anal Chem 1984, 56, 1258A.
(39) Schirmer, E. C.; Yates, J. R., 3rd; Gerace, L. Discov Med 2003, 3, 38.
(40) Washburn, M. P.; Wolters, D.; Yates, J. R., 3rd Nat Biotechnol 2001, 19, 242.
(41) Florens, L.; Washburn, M. P. Methods Mol Biol 2006, 328, 159.
(42) Wolters, D. A.; Washburn, M. P.; Yates, J. R., 3rd Anal Chem 2001, 73, 5683.
(43) Shevchenko, A.; Tomas, H.; Havlis, J.; Olsen, J. V.; Mann, M. Nat Protoc 2006,
1, 2856.
(44) Yang, Y.; Thannhauser, T. W.; Li, L.; Zhang, S. Electrophoresis 2007, 28, 2080.
(45) Zhu, W.; Venable, J.; Giometti, C. S.; Khare, T.; Tollaksen, S.; Ahrendt, A. J.;
Yates, J. R., 3rd Electrophoresis 2005, 26, 4495.
(46) Shevchenko, A.; Loboda, A.; Ens, W.; Schraven, B.; Standing, K. G.
Electrophoresis 2001, 22, 1194.
(47) Shevchenko, A.; Wilm, M.; Vorm, O.; Mann, M. Anal Chem 1996, 68, 850.
(48) Eng, J. K.; McCormack, A. L.; Yates, J. R. Journal of the American Society for
Mass Spectrometry 1994, 5, 976.
(49) Perkins, D. N.; Pappin, D. J.; Creasy, D. M.; Cottrell, J. S. Electrophoresis 1999,
20, 3551.

20
(50) Craig, R.; Beavis, R. C. Bioinformatics 2004, 20, 1466.
(51) Ma, B.; Zhang, K.; Hendrie, C.; Liang, C.; Li, M.; Doherty-Kirby, A.; Lajoie, G.
Rapid Commun Mass Spectrom 2003, 17, 2337.
(52) Bern, M.; Cai, Y.; Goldberg, D. Anal Chem 2007, 79, 1393.
(53) Rabilloud, T. Proteomics 2002, 2, 3.
(54) Pasquali, C.; Fialka, I.; Huber, L. A. J Chromatogr B Biomed Sci Appl 1999, 722,
89.
(55) Taylor, S. W.; Fahy, E.; Ghosh, S. S. Trends Biotechnol 2003, 21, 82.
(56) Goo, Y. A.; Yi, E. C.; Baliga, N. S.; Tao, W. A.; Pan, M.; Aebersold, R.;
Goodlett, D. R.; Hood, L.; Ng, W. V. Mol Cell Proteomics 2003, 2, 506.
(57) Klein, C.; Garcia-Rizo, C.; Bisle, B.; Scheffer, B.; Zischka, H.; Pfeiffer, F.;
Siedler, F.; Oesterhelt, D. Proteomics 2005, 5, 180.
(58) Burre, J.; Beckhaus, T.; Schagger, H.; Corvey, C.; Hofmann, S.; Karas, M.;
Zimmermann, H.; Volknandt, W. Proteomics 2006, 6, 6250.
(59) Morciano, M.; Burre, J.; Corvey, C.; Karas, M.; Zimmermann, H.; Volknandt, W.
J Neurochem 2005, 95, 1732.
(60) Sprenger, R. R.; Fontijn, R. D.; van Marle, J.; Pannekoek, H.; Horrevoets, A. J.
Biochem J 2006, 400, 401.
(61) Ostrom, R. S.; Insel, P. A. Methods Mol Biol 2006, 332, 181.
(62) Hopkins, A. L.; Groom, C. R. Nat Rev Drug Discov 2002, 1, 727.
(63) Fullekrug, J.; Simons, K. Ann N Y Acad Sci 2004, 1014, 164.
(64) Li, N.; Shaw, A. R.; Zhang, N.; Mak, A.; Li, L. Proteomics 2004, 4, 3156.
21
(65) Blonder, J.; Hale, M. L.; Lucas, D. A.; Schaefer, C. F.; Yu, L. R.; Conrads, T. P.;
Issaq, H. J.; Stiles, B. G.; Veenstra, T. D. Electrophoresis 2004, 25, 1307.
(66) Rabilloud, T. Electrophoresis 2009, 30 Suppl 1, S174.
(67) Santoni, V.; Molloy, M.; Rabilloud, T. Electrophoresis 2000, 21, 1054.
(68) Rolland, N.; Ferro, M.; Seigneurin-Berny, D.; Garin, J.; Douce, R.; Joyard, J.
Photosynth Res 2003, 78, 205.
(69) Ferro, M.; Salvi, D.; Riviere-Rolland, H.; Vermat, T.; Seigneurin-Berny, D.;
Grunwald, D.; Garin, J.; Joyard, J.; Rolland, N. Proc Natl Acad Sci U S A 2002, 99, 11487.
(70) Ferro, M.; Seigneurin-Berny, D.; Rolland, N.; Chapel, A.; Salvi, D.; Garin, J.;
Joyard, J. Electrophoresis 2000, 21, 3517.
(71) Carboni, L.; Piubelli, C.; Righetti, P. G.; Jansson, B.; Domenici, E.
Electrophoresis 2002, 23, 4132.
(72) Henningsen, R.; Gale, B. L.; Straub, K. M.; DeNagel, D. C. Proteomics 2002, 2,
1479.
22
CHAPTER 3
MEMBRANE PROTEOMIC ANALYSIS OF THE PROTOZOAN PARASITE
TRYPANOSOMA CRUZI1
______________________________________________________________________ 1 Xiang Zhu, Brent Weatherly, Marshall Bern, James A. Atwood III, T.A. Minning, R.L.
Tarleton, Ron Orlando. To be submitted to Journal of Proteome Research.
23
ABSTRACT
The protozoan parasite Trypanosoma cruzi (T. cruzi) is the causative agent of Chagas’ disease,
which affects 16-18 million people and kills an estimated 50,000 people annually in Latin
American countries. The T. cruzi cell surface membrane proteins including trans-sialidase,
mucin-associated surface proteins (MASP) and gp63 proteins play important roles for parasite’s
host cell entry and immune escape. The trans-sialidase epitopes are also proven to dominate the
CD8+ T-cell response and thus are potential vaccine candidates. While these T. cruzi membrane
proteins are of critical importance, there were limited proteomic studies specifically targeting
them. Herein, the membrane enriched fractions were isolated from T. cruzi CL-Brenner strain
trypomastigotes using two protocols and characterized using bottom-up proteomics
methodology. There were a total of 551 protein groups identified from ~80 MS/MS runs. Both
preparation strategies were effectively enriching some respective membrane proteins. The most
attractive result for us is the identification of 87 trans-sialidases, 9 mucin associated surface
protein (MASP), 3 mucins, and 2 GP63 proteins. These GPI anchored surface proteins are
involved in parasite survival and cell invasions, thus could become potential vaccine targets.
24
INTRODUCTION
The protozoan parasite Trypanosoma cruzi (T. cruzi) is the causative agent of Chagas’ disease,
which is a chronic illness causing congestive heart failure and sudden death in the world. It
affects 16-18 million people and kills an estimated 50,000 people annually in Latin American
countries.1-3
Right now this disease has also been spread out in the U.S and at least 50,000 to
100,000 people are infected as well. More than 8 billion $ were lost regarding to the Chagas’
disease each year.4 T. cruzi has a complex life cycle, with four different life stages cycling
between the mammalian host and insect vectors. Metacyclic trypomastigotes are infective forms
living in the hindgut of the insect vectors such as triatomine bugs. The infection is initiated when
the blood-feeding insect vectors deposit their feces containing metacyclic trypomastigotes onto
the wounded mammalian skins. After they enter the infected cells around the wound, metacyclic
trypomastigotes differentiate into the amastigotes that reside in the host cell cytoplasm. After
many times of binary fission, a large number of amastigotes are produced in the host cells. Then
these amastigotes transform to the other infective flagellated trypomastigotes, which burst out
from the host cells and circulate in the blood stream to invade other cells throughout the human
bodies. Some of the trypomastigotes are ingested by the insect vectors during their blood meal
and differentiated into epimastigotes. The epimastigotes replicate in the vector midgut and
finally convert into metacyclic trypomastigotes thus finishing the life cycle. Currently diagnosis
of T. cruzi infection is very difficult and treatment is limited to chemotherapeutics, which are
highly toxic and exhibit many dangerous side effects, no effective vaccines have been developed
yet.
Membrane proteins that coat the parasite surfaces usually play very important roles in host cell
entry and immune evasion. Proteomic studies on these membrane proteins will help understand
25
the nature of parasites invasion and survival mechanisms and could explore the way for vaccine
development. In recent years several membrane proteomic studies have been done on some
parasite organisms causing important diseases. For example Sanders studied the raft-like
membranes of mature Plasmodium falciparum, a major protozoan parasite causing human
malaria.5 In Braschi’s recent paper, proteomic analysis was utilized to study surface membranes
of the blood fluke Schistosoma mansoni, which induce Schistosomiasis disease.6,7
Trypanosoma
brucei, the other dangerous trypanosoma parasite causing trypanosomiasis (or sleeping sickness)
in Africa has also been investigated using proteomic methods for their surface membranes by
Bridges and several other groups.8-10
Although with the significant importance, there have been
very limited proteomic studies specifically targeting these membrane protein expressions in T.
cruzi.11
Previous proteomic studies on T. cruzi were more focused on whole cell analysis and
comparative protein expressions on four developmental stages. Those global proteomic analyses
inevitably missed a large number of membrane proteins since the soluble proteins are dominated
in the identifications because of their relatively high abundance. While as we mentioned above,
with the increasing urgent need for development of vaccines and biomedical therapeutics, the
proteomic study of surface membrane proteome should attract much more concerns. In fact this
area has been underrepresented and lagged behind. Compared to the soluble proteins, membrane
proteins are usually of low abundance, high hydrophobicity and basic isoelectric points, thus
making the isolation and identification to be a challenging task.
In this research, we focused on the enrichment of membrane protein preparation and identify the
membrane proteins using bottom-up proteomics methodologies. We described two preparation
methods to enrich the membrane fractions from the whole cell lysates. The first method is based
on the sucrose cushion theory. Using sucrose cushion many soluble proteins and cytoskeleton
26
proteins are depleted, hence largely enrich the membrane fractions. In parallel the most
important surface membrane proteins such as trans-sialidase and mucins are known to be
glycosylphosphatidylinositol (GPI) anchored proteins. Previous results have shown these GPI
anchored proteins are enriched in cholesterol and sphingolipid lipid rafts membrane domains,
which are resistant to the non-ionic detergent at low temperatures.12-14
We adopted this idea and
introduced triton X-100 in the cellular lysates during preparation in order to isolate more GPI
anchored proteins like trans-sialidase, etc. The prepared membrane fractions were separated
using 1D-SDS-PAGE gel followed by in gel digestion. Generated peptides were then separated
by reverse phase liquid chromatography and analyzed by tandem mass spectrometry on both a
linear ion trap (LTQ) and hybrid linear ion trap Fourier transform (LTQ-FT) mass spectrometers.
Peak lists were searched using Mascot algorithm and protein identifications were selected below
a 1% peptide false discovery rate using the ProValT algorithm.15
Our analysis has identified an
essential number of membrane proteins including those immunodominant trans-sialidase and
mucin proteins. Identified membrane proteins also show various distributions between the two
preparation methods as expected.
MATERIALS AND METHODS
Parasite Preparation and Cell Lysis
The CL-Brenner lab strain of trypomastigotes were grown in monolayers of Vero cells (ATCC
no. CCL-81) in RPMI supplemented with 5% horse serum as previously described.16
Emergent
trypomastigotes were harvested daily and examined by light microscopy to determine the
percentages of trypomastigotes. The parasite cells (5 x 10⁸) were harvested by centrifugation at
3,000 x g for 15 min at room temperature, washed three times with ice-cold PBS buffer, and
subjected to fractionation.

27
Membrane Preparation using Sucrose Cushion
Approximately 5 x 10⁸ T. cruzi trypomastigote cells were suspended in 3 mL of ice-cold lysis
buffer (10 mM HEPES, 1 mM EDTA, pH 7.2) containing protease inhibitors. After 15 min
incubation at 4 C, cells were homogenized by 25 strokes of a 7 mL Dounce homogenizer. An
equal amount of sucrose buffer (10 mM HEPES, 1 mM EDTA, 500 mM sucrose, pH 7.2) was
added with additional 25 strokes of homogenizer. Cellular debris and unbroken cells were
removed as pellets after centrifugation at 6,000 g for 15 min at 4 C. The supernatant was
collected and centrifuged at 150,000 g for 1 hour at 4 C. Supernatant was removed and the crude
pellet membrane was incubated in 100 mM sodium carbonate solution (pH 11.3) for 15 min at
4 C. After incubation, the membrane pellet was collected by centrifuging at 150,000 g for 1 hour
at 4 C.
Lipid Raft Membrane Preparation using Non-ionic Detergent
Approximately 5 x 10⁸ T. cruzi trypomastigote cells were suspended in 3 mL of ice-cold lysis
buffer (10 mM HEPES, 1 mM EDTA, pH 7.2) containing protease inhibitors. An equal volume
of 1% (w/v) Triton X-100 solution was mixed with the lysis buffer. After 50 strokes of
homogenizer, the homogenate was centrifuged for 15 min at 6,000 g at 4 C, pelleting the cellular
debris and unbroken cells. The supernatant was collected and centrifuged at 150,000 g for 1 hour
at 4 C. Crude membrane pellet was resuspended with 1% (w/v) Triton X-100 solution at 4 C and
incubated for 30 min. Mixed solution was centrifuged at 150,000 g for 1 hour at 4 C. The
supernatant was removed completely, leaving the pellet for gel separation.
1-D Gel Electrophoresis and in-gel Digestion
Crude membrane pellets from both preparations were resuspended in 20 l Laemmli buffer
(Sigma-Aldrich) and boiled at 80 C for 15 min. Solublized proteins were separated by 1-D SDS-
28
PAGE using NuPAGE 4-12% Bis-Tris (Invitrogen) gradient gels at 150 V for 2 hours. Gel lanes
from both preparations were washed twice in ddH2O for 15 min and then cut into ~20 slices.
Proteins were reduced by incubating the gel bands in 10 mM DTT/100 mM Ambic (ammonium
bicarbonate) solution at 56 C for 1 h. Then the proteins were carboxyamidomethylated with 55
mM iodoacetamide/100 mM Ambic for 1 h at room temperature in the dark. Enzymatic digestion
were performed by adding sequencing grade porcine trypsin (1:50, Promega, Madison, WI) and
incubated at 37 C overnight. The tryptic peptides were extracted three times with 200 l of
ACN/water (1:1) solution. Combined extracts were completely dried in speed vacuum,
resuspended in 50 l of 0.1% formic acid and then stored at -20 C, before analysis by MS.
LC-MS/MS Analysis
The resulting peptides were analyzed on both LTQ and LTQ-FT interfaced directly to an Agilent
1100 quaternary pump (Agilent Technologies, Palo Alto, CA). The mobile phase A and B were
H2O/0.1% formic acid and ACN/0.1% formic acid, respectively. The digested peptides were
pressure loaded for 1 h onto a PicoFrit 11 cm x 50 m column (New Objective, Woburn, MA)
packed with 8 cm length, 5 m diameter C18 beads. The peptides were desalted for 10 min with
0.1% formic acid in water and then were eluted from the C18 column into the mass
spectrometers during a 90 min linear gradient from 5 to 60% B at a flow rate of 200 nl/min. Top
9 abundant precursor ions were selected to be fragmented acquiring MS/MS spectra from each
full MS scan with a repeat count of 1and repeat duration of 5 s. Dynamic exclusion was enabled
for 200 s. In full mass scan, LTQ was set as centroid mode and LTQ-FT was in profile mode. For
the MS/MS scan both were in centroid mode. Generated Raw tandem mass spectra were
converted into mzXML format and then into PKL format using ReAdW followed by
29
mzMXL2Other.17
The peak lists were then searched using Mascot 1.9 (Matrix Science, Boston,
MA).
Database Search and Validation
Two databases were built for mascot search. Firstly search was against the normal sequence
database consisting of 23,095 T. cruzi protein sequences provided by Trypanosoma cruzi
Sequencing Consortium (TSK-TSC). A random database was constructed by reversing the
sequence in the normal database and was used to establish accurate scoring thresholds or normal
database protein identification. The Parameters are listed below. Only fully tryptic peptide
matches were considered with 4 maximum missed cleavages. Fixed modification was set as
carbamidomethyl due to carboxyamidomethylation (+57 Da) and variable modification was
chosen as oxidation (+16 Da) when the peptide contained Methionine. For LTQ the peptide
tolerance was 1000 ppm and average experimental mass value was adopted. LTQ-FT’s peptide
tolerance was 50 ppm and the mass value was chosen as monoisotopic. MS/MS tolerances for
both instruments were 0.6 Da. Peptide matches were extracted from the normal and random
database search results. Statistical validation of protein identification using clustered peptides
was based on an in-house developed software program ProValT, as implemented in ProteoIQ
(BioInquire, LLC, Athens, GA)
Annotations
TMHMM 2.018
was used to predict the transmembrane spanning domains. Subcellular
localization of membrane proteins were annotated by Gene Ontology and confirmed with
literature references.
RESULTS AND DISCUSSION
Membrane Protein Preparation

30
The CL-Brenner lab strain of trypomastigote life stage was utilized for this study. The reason we
chose trypomastigote instead of other developmental stages was because it is the infective form
that invade host cells and verified to express more surface membrane proteins that play important
roles in immune responses.19
Since current T. cruzi genome20
database is constructed using CL-
Brenner strain, so in order to get more accurate and comprehensive identification results for
membrane proteome, we did our study with this lab strain. In our initial strategy for enriching the
membrane fractions, we utilized the well-known sucrose cushion method. Previous studies in our
group have shown that cytoskeletal proteins such as alpha tubulin, beta tubulin and some other
soluble proteins like heat shock proteins usually dominate the identification from the whole cell
analysis. Compared to these proteins most membrane proteins are in low abundance and also
either embedded in or attached to the lipid bilayer membranes making them difficult to be
isolated and detected. The sucrose cushion has been shown to be a simple and effective way for
membrane enrichment. Sucrose solution density varies from different concentrations, so at
certain concentrations the whole packed membrane fractions can be pelleted down using ultra-
centrifugation while leaving the smaller soluble proteins remained in the solution. To enrich
further the integral membrane proteins and GPI anchored proteins, the crude membrane pellets
were treated with high pH carbonate solution, which removed some loosely bounded membrane
associated proteins. In our analysis, identification of trans-sialidase and several other surface
membrane proteins will attract more of our interest since they are widely presented on the
parasite surface and claimed to be potential targets for vaccine development. Unlike integral
membrane proteins spanning across lipid bilayers, they are attached to the plasma membrane via
a C-terminal glycosylphosphatidylinositol (GPI) anchor. Recent studies indicated that those GPI
anchored proteins usually reside on some specific membrane domains, which are called “lipid
31
rafts”.10,14,21-25
The rafts are mainly composed of sphingolipid and cholesterol. Sphingolipid
contains long, largely saturated acyl chains allowing them to pack tightly together and form a
liquid-ordered state. This rigid tight domain structure has been found to be resistant to some non-
ionic detergent such as Triton X-100 at low temperatures. While membranes besides the “lipid
raft” regions will be disrupted by the detergent and release the embedded proteins. Based on this
information, we introduced Triton X-100 in our second preparation at 4 C trying to enrich and
observe more GPI anchored proteins like trans-sialidase and mucins, etc. Proteins from both
method fractions were separated by 1-D SDS-PAGE gel electrophoresis. After separation the gel
lanes were sliced into small fractions for each and then these fractions were subjected to in-gel
trypsin digestion. We applied two mass spectrometers to analyze the tryptic peptides. LTQ ion
trap was first used since it has very high sensitivity thus could identify some low abundant
membrane proteins. We also ran all of our samples in LTQ-FT, which offers very high mass
accuracy and resolution. Some weak identification from LTQ got believed to be true with the
additional spectra confirmation by LTQ-FT. To reduce the possibility of false positive
identification, we searched the data against both normal and random database and set the protein
false discovery rate (FDR) as 1% during clustering peptides.
Protein Identification
There were total of 551 protein groups identified at a maximum 1% protein FDR. Among them
419 protein groups were identified in the sucrose cushion preparation and the detergent
preparation resulted in the identification of 398 protein groups with 266 shared proteins. Besides
319 soluble proteins and 22 microtubular proteins we found quite amount of membrane proteins
in our identification results including 69 integral membrane proteins, 40 membrane associated
proteins and 101 GPI anchored proteins. Thus the combined membrane fractions account for
32
38% within the whole identification, which shows great enrichment compared to all previous
global analysis. Viewing from the top 40 protein groups, although some regular high abundant
proteins like beta tubulin, alpha tubulin and heat shock protein 70 (HSP70) were still present, but
there were 14 membrane proteins including 13 trans-sialidase and 1 ATPase beta subunit were
identified. Among them trans-sialidase (8114.t00003) is the third most abundant protein, and
trans-sialidases (7202.t00003, 5412.t00001, 8498.t00001) are respectively identified as the 8th,
9th, 10th top abundant proteins. While in Atwood’s whole trypomastigote proteome study, the
most abundant trans-sialidase is only ranked as No 284, and there were only 8 trans-sialidase
proteins among the top 400 groups. These comparisons clearly indicate after membrane
extraction, the membrane proteins especially the GPI anchored membrane proteins got largely
enriched and some of the very low abundant membrane proteins could now be detected under
current conditions. This enrichment is also supported by the fact that several high abundant
cytosolic soluble proteins identified in the whole trypomastigote proteome were highly depleted
in our preparation methods. Those absent proteins include the 9th most abundant protein
NADH:flavin oxidoreductase/NADH oxidase, the 12th most abundant protein tyrosine
aminotransferase, the 13th top protein glutamate dehydrogenase and other 8 proteins in top 30
identifications in the trypomastigote proteome.
Membrane Protein Identification and Distribution
Among the total 551 proteins, 210 of them were membrane proteins. Classified by sub-cellular
localization (Figure 3.1) 101 membrane proteins were annotated as GPI anchored proteins, which
include 87 trans-sialidase, 9 mucin associated surface protein (MASP), 2 gp63 protein, and 3
mucins proteins. According to the literature searches, the mucins have never been identified
using proteomics method before although in the T. cruzi genome the mucins family ie encoded
33
by a large number of genes and pseudogenes. The reason for this is because these proteins are all
highly glycosylated and the post-translational modifications complicated the detection in the
proteome. In our membrane preparation these immunodominant surface proteins almost all
double the number of identification compared to the whole cell analysis. Besides these GPI
anchored proteins, there were another 17 protein groups annotated as plasma membrane proteins.
Most of them are P type ATPase with the function as ATP binding and ion channels. The
membrane proteins identified in the organelles are mainly localized within the mitochondria (23
proteins), endoplasmic reticulum (ER) (5 proteins), golgi (14 proteins), nucleus (4 proteins) and
some others (12 proteins). For example ADP/ATP carrier protein 1 is an integral mitochondria
membrane protein mediating the exchange of ADP for ATP generated in the mitochondrial
matrix. Oligosaccharyl transferase is found as the ER membrane protein that plays important role
for transferring Glc3Man9GlcNAc2 from dolichol to nascent protein. There were 34 hypothetic
protein also thought as integral membrane proteins since they contained transmembrane
spanning domains predicted using TMHMM 2.0. Table 3.1 shows the transmembrane domain of
all identified integral membrane proteins.
Distribution of Membrane Proteins in Two Methods
As we described two different methods were used to enrich the membrane fractions. Sucrose
method with carbonate washing should produce more membrane proteins while the Triton X-100
treated method was expected to identify more GPI anchored proteins. This trend could be
verified from our identification results. Using the sucrose cushion method, we were able to
identify 128 membrane proteins while the detergent resistant protocol for isolation of lipid raft
associated proteins (GPI anchored) yielded 81 membrane protein identifications. While the
sucrose cushion resulted in higher membrane proteome coverage, the detergent resistant method
34
resulted in a significant enrichment of GPI anchored cell surface proteins; noted by an almost 5
fold increase in the spectral counts for identified GPI anchored proteins trans-sialidases (Figure
3.2). One of the key factors for sucrose method enrichment is that sucrose cushion can highly
deplete the largely abundant cytoskeletal proteins like beta tubulin and alpha tubulin. These two
proteins were only ranked as 13th and 25th according to the sucrose method protein score. But
they could not be removed only using the detergent treated method and they became the most
two abundant protein groups with a 25 fold (beta tubulin) and 21 fold (alpha tubulin) spectra
counts increase. Glyceraldehyde 3-phosphate dehydrogenase could be considered as another
indicator for the abundance change of cytoskeletal proteins. This cytosolic glycolytic enzyme has
been reported as expression on some different cell surface, which seems unlikely for most
cytosolic proteins. This is because it could bind to the cytoskeletal microtubules. So when we
deplete the cytoskeletal proteins using sucrose cushion method this cytosleletal-associated
glycolytic protein also got removed. On the other hand the non-ionic detergent treatment could
not deplete it. Reflected on the identification result, using detergent method glyceraldehyde 3-
phosphate dehydrogenase ranked as the 20th, while it dropped to the 410th at sucrose cushion
method. Depletion of the highly expressed cytoskeletal proteins increases the possibility to
identify many low abundant membrane proteins, so the number of identified membrane proteins
using the sucrose cushion method is much more than detergent method. Meanwhile the relative
abundance of each membrane protein can be compared using spectra counts. The membrane
protein spectra counts especially the GPI anchored ones got a lot of difference between these two
preparation methods. As we expected the detergent resistant GPI anchored proteins got more
enriched with the treatment of Triton X-100. The possible reason is that some major expressed
GPI anchored proteins were still remained on the lipid raft when some others got cleaved by the

35
parasite expressed enzyme phosphatidylinositol phospholipase C (PI-PLC) during cell culture
and preparation. The cleaved GPI anchored proteins will be together removed with some integral
membrane proteins under detergent treatment. As a result this process enriched the major GPI
anchored proteins which got more spectra counts for identification but also reduce the number of
identification for whole membrane proteins.
Important Protein Families
T. cruzi trypomastigote is the life stage that circulates in the host blood stream and performs the
cell invasion function. During this process the host immune system will respond to them
immediately and rely on some antigen-specific T cells and antibodies to kill the pathogens. One
of the major strategies for T. cruzi to escape the host immune response is that they can express
several large members of surface antigen proteins. Trans-sialidase is one of the most important
surface protein families for T. cruzi. This large protein family is encoded by more than 1300
genes. T. cruzi is unable to synthesize sialic acid itself so it relies on trans-sialidase to transfer
the sialic acid from host sialoglycoconjugates onto terminal galactose residues on its surface
mucin molecules. The sialiation of surface glycoproteins prevents complement activation and
increases the infectivity. Thus the trans-sialidase genes are critical for parasite survival and
potentially to be the vaccine target. Recent studies have reported that only a small set of trans-
sialidase proteins possess enzymatic activity. Expressing together with those effective trans-
sialidase enzymes the large number of non-enzymatic family members could deflect the immune
response from the real enzymatic targets and counteract the T cell responses by providing their
altered peptides. Within the significant importance, while the identification of these protein
families is always difficult and challenging because typically proteins from the same family have
similar structure, function and peptide sequence. For example many identified trans-sialidase
36
shared some high frequently identified peptides like FAGVGGGALWPVSQQGQNQR,
HQWQPIYGSTPVTPTGSWETGK and LLGLSYDEK, etc. Because of these very similar
expression and shared sequences, it’s difficult to differentiate between them unless we find out
some unique peptides. In our identification we identified 87 trans-sialidase and among them
there are 43 defined as unique ones because they have the unique peptides only expressed in one
protein and not in all other 86 trans-sialidases. In our proteomic identification, some trans-
sialidase protein could even be recognized with 6 or 7 unique peptides. Although several of them
only get one unique peptide, while they are the unique ones in the whole almost 1300 trans-
sialidase genes from the database so they are certainly uniquely identified with high confidence.
In addition to trans-sialidase protein families, several other membrane proteins such as mucins,
mucin-associated surface proteins (MASPs), and gp63 proteins have also shown to be targets of
CD8+ T cells and thus to be important for study.
26 Mucins are highly O-glycosylated mucin-like
glycoproteins expressed on cell surface through GPI anchor. The dense oligosaccharides coating
can protect the parasite from immune response and is also involved in the host cell invasion
process. Mucin-like glycoprotein (7726.t00002), mucin TcMUCII (5957.t00036 and
7195.t00017) have been identified. To our knowledge, this is the first experimental evidence to
identify these mucin proteins using proteomic methods. At the same time we found 9 mucin
associated surface proteins (MASP). Unlike the trans-sialidase the identification of mucins and
MASP are all belonged to single peptide match and only detected in sucrose method. This result
suggests the true expression level for mucins and MASP may not be as high abundant as trans-
sialidase although their gene families are also large. The other possibility is because the high
dense glycosylation make them undesirable to be detected by regular shotgun proteomics without
deglycosylation steps. Two surface GP63 proteins were also identified in sucrose cushion
37
fraction within one 5 peptide matches (7158.t00002) and the other single peptide match
(7383.t00011). Besides these immunodominant surface membrane proteins, the enzymes that
participate the mucins O-glycosylation pathways are another important membrane protein groups
for T. cruzi, which are UDP-Gal or UDP-GlcNAc-dependent glycosyltransferase. In T. cruzi the
glycosyltransferase transfer the N-acetylglucosamine (GlcNAc) from an UDP-GlcNAc precursor
molecule to the Thr/Ser residues in the mucins protein core. While in other vertebrate mucins,
transfer of the N-acetylgalactosamine (GalNAc) is often found. Because of the complexity of the
mucins familiy in structure and sequence, the parasite needs multiple GlcNAc-transferase to get
involved in the O-glycosylation pathways. There were totally six protein groups identified from
this family.
CONCLUSION
Cell surface membrane proteins play critical roles for T. cruzi host cell invasion mechanisms.
Previous proteomic studies didn't provide enough information for these important genes due to
the sample preparation strategies. In this study, we provided two membrane enrichment
methodologies and applied gel based bottom-up proteomics to analyze the membrane proteome
of the mammalian stage, trypomastigote. Compared to previous whole cell analysis, large
amount of membrane proteins have been identified. 210 out of 551 identifications are membrane
proteins, including several important immunodominant gene families: 87 trans-sialidase, 9 mucin
associated surface protein (MASP), 2 gp63 protein, and 3 mucins proteins. The two enrichment
methods can also provide effective functions. The sucrose cushion yielded more integral
membrane proteins, while the detergent resistant method was proven to be more efficient for
some GPI anchored proteins. Those membrane enrichment methods were successfully applied
for followed studies shown in Chapter 4 and 5.
38
REFERENCES
(1) Morel, C. M. Mem Inst Oswaldo Cruz 1999, 94 Suppl 1, 3.
(2) World Health Organ Tech Rep Ser 1991, 811, 1.
(3) Cubillos-Garzon, L. A.; Casas, J. P.; Morillo, C. A.; Bautista, L. E. Am Heart J
2004, 147, 412.
(4) Moncayo, A. World Health Stat Q 1992, 45, 276.
(5) Sanders, P. R.; Gilson, P. R.; Cantin, G. T.; Greenbaum, D. C.; Nebl, T.; Carucci,
D. J.; McConville, M. J.; Schofield, L.; Hodder, A. N.; Yates, J. R., 3rd; Crabb, B. S. J Biol
Chem 2005, 280, 40169.
(6) Braschi, S.; Borges, W. C.; Wilson, R. A. Mem Inst Oswaldo Cruz 2006, 101
Suppl 1, 205.
(7) Braschi, S.; Curwen, R. S.; Ashton, P. D.; Verjovski-Almeida, S.; Wilson, A.
Proteomics 2006, 6, 1471.
(8) Bridges, D. J.; Pitt, A. R.; Hanrahan, O.; Brennan, K.; Voorheis, H. P.; Herzyk,
P.; de Koning, H. P.; Burchmore, R. J. Proteomics 2008, 8, 83.
(9) Acestor, N.; Panigrahi, A. K.; Ogata, Y.; Anupama, A.; Stuart, K. D. Proteomics
2009, 9, 5497.
(10) Mehlert, A.; Ferguson, M. A. Glycoconj J 2009, 26, 915.
(11) Cordero, E. M.; Nakayasu, E. S.; Gentil, L. G.; Yoshida, N.; Almeida, I. C.; da
Silveira, J. F. J Proteome Res 2009, 8, 3642.
(12) Simons, K.; Ikonen, E. Nature 1997, 387, 569.
(13) Pike, L. J. Biochem J 2004, 378, 281.
(14) Pike, L. J. J Lipid Res 2003, 44, 655.

39
(15) Weatherly, D. B.; Atwood, J. A., 3rd; Minning, T. A.; Cavola, C.; Tarleton, R. L.;
Orlando, R. Mol Cell Proteomics 2005, 4, 762.
(16) Piras, R.; Piras, M. M.; Henriquez, D. Mol Biochem Parasitol 1982, 6, 83.
(17) Pedrioli, P. G.; Eng, J. K.; Hubley, R.; Vogelzang, M.; Deutsch, E. W.; Raught,
B.; Pratt, B.; Nilsson, E.; Angeletti, R. H.; Apweiler, R.; Cheung, K.; Costello, C. E.;
Hermjakob, H.; Huang, S.; Julian, R. K.; Kapp, E.; McComb, M. E.; Oliver, S. G.; Omenn, G.;
Paton, N. W.; Simpson, R.; Smith, R.; Taylor, C. F.; Zhu, W.; Aebersold, R. Nat Biotechnol
2004, 22, 1459.
(18) Krogh, A.; Larsson, B.; von Heijne, G.; Sonnhammer, E. L. J Mol Biol 2001, 305,
567.
(19) Atwood, J. A., 3rd; Weatherly, D. B.; Minning, T. A.; Bundy, B.; Cavola, C.;
Opperdoes, F. R.; Orlando, R.; Tarleton, R. L. Science 2005, 309, 473.
(20) El-Sayed, N. M.; Myler, P. J.; Bartholomeu, D. C.; Nilsson, D.; Aggarwal, G.;
Tran, A. N.; Ghedin, E.; Worthey, E. A.; Delcher, A. L.; Blandin, G.; Westenberger, S. J.; Caler,
E.; Cerqueira, G. C.; Branche, C.; Haas, B.; Anupama, A.; Arner, E.; Aslund, L.; Attipoe, P.;
Bontempi, E.; Bringaud, F.; Burton, P.; Cadag, E.; Campbell, D. A.; Carrington, M.; Crabtree, J.;
Darban, H.; da Silveira, J. F.; de Jong, P.; Edwards, K.; Englund, P. T.; Fazelina, G.; Feldblyum,
T.; Ferella, M.; Frasch, A. C.; Gull, K.; Horn, D.; Hou, L.; Huang, Y.; Kindlund, E.; Klingbeil,
M.; Kluge, S.; Koo, H.; Lacerda, D.; Levin, M. J.; Lorenzi, H.; Louie, T.; Machado, C. R.;
McCulloch, R.; McKenna, A.; Mizuno, Y.; Mottram, J. C.; Nelson, S.; Ochaya, S.; Osoegawa,
K.; Pai, G.; Parsons, M.; Pentony, M.; Pettersson, U.; Pop, M.; Ramirez, J. L.; Rinta, J.;
Robertson, L.; Salzberg, S. L.; Sanchez, D. O.; Seyler, A.; Sharma, R.; Shetty, J.; Simpson, A. J.;
Sisk, E.; Tammi, M. T.; Tarleton, R.; Teixeira, S.; Van Aken, S.; Vogt, C.; Ward, P. N.;
40
Wickstead, B.; Wortman, J.; White, O.; Fraser, C. M.; Stuart, K. D.; Andersson, B. Science 2005,
309, 409.
(21) Sharom, F. J.; Radeva, G. Subcell Biochem 2004, 37, 285.
(22) Sanders, P. R.; Cantin, G. T.; Greenbaum, D. C.; Gilson, P. R.; Nebl, T.; Moritz,
R. L.; Yates, J. R., 3rd; Hodder, A. N.; Crabb, B. S. Mol Biochem Parasitol 2007, 154, 148.
(23) Guther, M. L.; Beattie, K.; Lamont, D. J.; James, J.; Prescott, A. R.; Ferguson, M.
A. Eukaryot Cell 2009, 8, 1407.
(24) von Haller, P. D.; Donohoe, S.; Goodlett, D. R.; Aebersold, R.; Watts, J. D.
Proteomics 2001, 1, 1010.
(25) Pike, L. J.; Han, X.; Chung, K. N.; Gross, R. W. Biochemistry 2002, 41, 2075.
(26) Martin, D. L.; Weatherly, D. B.; Laucella, S. A.; Cabinian, M. A.; Crim, M. T.;
Sullivan, S.; Heiges, M.; Craven, S. H.; Rosenberg, C. S.; Collins, M. H.; Sette, A.; Postan, M.;
Tarleton, R. L. PLoS Pathog 2006, 2, e77.

41
Table 3.1. Identified proteins with transmembrane spanning domains (TMSD), the proteins were
ranked by their relative abundance. The numbers of TMSD were predicted by TMHMM 2.018
Gene ID Gene Name
Number
of
TMSD
Tc00.1047053511289.70
ADP,ATP carrier protein 1, mitochondrial precursor,
putative [8647.t00007] 3
Tc00.1047053506211.160
ADP,ATP carrier protein 1, mitochondrial precursor,
putative [6853.t00016] 3
Tc00.1047053508461.570 Gim5A protein, putative [7739.t00057] 1
Tc00.1047053503829.80 hypothetical protein, conserved [4773.t00008] 4
Tc00.1047053505163.80 oligosaccharyl transferase subunit, putative [5150.t00008] 8
Tc00.1047053509551.30
mitochondrial phosphate transporter, putative
[5738.t00003] 1
Tc00.1047053508045.70 hypothetical protein, conserved [7579.t00007] 4
Tc00.1047053509167.80 hypothetical protein, conserved [8022.t00008] 2
Tc00.1047053508319.30 hypothetical protein, conserved [7683.t00003] 1
Tc00.1047053506295.130 prohibitin, putative [6889.t00013] 1
Tc00.1047053505763.19 P-type H+-ATPase, putative [6697.t00002] 3
Tc00.1047053507811.60
vesicle-associated membrane protein, putative
[7479.t00006] 1
Tc00.1047053508767.10 surface protein TolT [7864.t00001] 1
Tc00.1047053510773.20
vacuolar-type proton translocating pyrophosphatase 1,
putative [8493.t00002] 16
Tc00.1047053506297.240
pretranslocation protein, alpha subunit, putative
[6890.t00024] 9
Tc00.1047053506581.10
dolichyl-phosphate beta-D-mannosyltransferase precursor,
putative [7007.t00001] 1
Tc00.1047053509777.130 hypothetical protein, conserved [8200.t00013] 1
Tc00.1047053510729.160 hypothetical protein, conserved [8476.t00016] 1
Tc00.1047053509601.70
vacuolar proton translocating ATPase subunit A, putative
[8148.t00007] 6
Tc00.1047053508153.230 hypothetical protein, conserved [7617.t00023] 4
Tc00.1047053511309.70 hypothetical protein, conserved [8655.t00007] 1
Tc00.1047053506401.170 vacuolar-type Ca2+-ATPase, putative [6930.t00017] 8
Tc00.1047053511517.37 reticulon domain protein, putative [6139.t00023] 3
Tc00.1047053509671.90
COP-coated vesicle membrane protein gp25L precursor,
putative [8166.t00009] 2
Tc00.1047053506727.50 hypothetical protein, conserved [7070.t00005] 2
Tc00.1047053508175.70 lanosterol synthase, putative [7625.t00007] 1
Tc00.1047053506725.20 hypothetical protein, conserved [7069.t00002] 2
Tc00.1047053506971.20 surface protease GP63, putative [7158.t00002] 1
Tc00.1047053506489.30 hypothetical protein, conserved [6967.t00003] 2
Tc00.1047053504029.70 hypothetical protein, conserved [4873.t00007] 3

42
Tc00.1047053509601.110 hypothetical protein, conserved [8148.t00011] 11
Tc00.1047053506925.530 ABC transporter, putative [7143.t00053] 3
Tc00.1047053509777.70
calcium-translocating P-type ATPase, putative
[8200.t00007] 3
Tc00.1047053503687.30 hypothetical protein, conserved [4702.t00003] 2
Tc00.1047053507611.280 cytochrome c oxidase subunit IX, putative [7402.t00028] 1
Tc00.1047053508817.130 carbonic anhydrase-like protein, putative [7883.t00013] 1
Tc00.1047053511517.120 hypothetical protein, conserved [6139.t00012] 2
Tc00.1047053429257.20 fatty acid desaturase, putative [1807.t00002] 5
Tc00.1047053504109.200
retrotransposon hot spot (RHS) protein, putative
[4913.t00020] 2
Tc00.1047053506295.70 hypothetical protein, conserved [6889.t00007] 1
Tc00.1047053511287.170 hypothetical protein, conserved [6090.t00017] 1
Tc00.1047053471901.20 SNARE protein, putative [3923.t00002] 1
Tc00.1047053509157.60
1-acyl-sn-glycerol-3-phosphate acyltransferase, putative
[8017.t00006] 1
Tc00.1047053507795.50 syntaxin, putative [7473.t00005] 1
Tc00.1047053506401.130 hypothetical protein, conserved [6930.t00013] 1
Tc00.1047053510659.250 phospholipase A2-like protein, putative [8457.t00025] 2
Tc00.1047053509099.89 hypothetical protein, conserved [7998.t00019] 4
Tc00.1047053503865.30 hypothetical protein, conserved [4791.t00003] 1
Tc00.1047053506355.20 receptor-type adenylate cyclase, putative [6911.t00002] 1
Tc00.1047053508813.80 hypothetical protein, conserved [7881.t00008] 1
Tc00.1047053510431.230 hypothetical protein, conserved [8387.t00023] 1
Tc00.1047053503543.20 hypothetical protein, conserved [4630.t00002] 2
Tc00.1047053504109.180 hypothetical protein, conserved [4913.t00018] 1
Tc00.1047053508173.84 hypothetical protein, conserved [7624.t00030] 5
Tc00.1047053507559.110 surface protease GP63, putative [7383.t00011] 3
Tc00.1047053405737.14 hypothetical protein [511.t00003] 1
Tc00.1047053506275.50 Golgi SNARE protein-like, putative [6881.t00005] 1
Tc00.1047053440363.19 hypothetical protein, conserved [2418.t00002] 4
Tc00.1047053507895.100
hypothetical protein, conserved (pseudogene)
[7517.t00010]|TRUNCATED PRODUCT 1
Tc00.1047053509429.59 hypothetical protein, conserved [8096.t00033] 2
Tc00.1047053506885.320 hypothetical protein, conserved [7127.t00032] 3
Tc00.1047053508059.40 syntaxin, putative [5539.t00004] 1
Tc00.1047053503511.10 hypothetical protein, conserved [4614.t00001] 1
Tc00.1047053507465.10 receptor-type adenylate cyclase, putative [7348.t00001] 2
Tc00.1047053506999.90 reiske iron-sulfur protein precursor, putative [7167.t00009] 1
Tc00.1047053507765.149 hypothetical protein, conserved [7462.t00015] 1
Tc00.1047053504235.9 hypothetical protein, conserved [4976.t00001] 3
Tc00.1047053508707.190 hypothetical protein, conserved [7839.t00019] 2
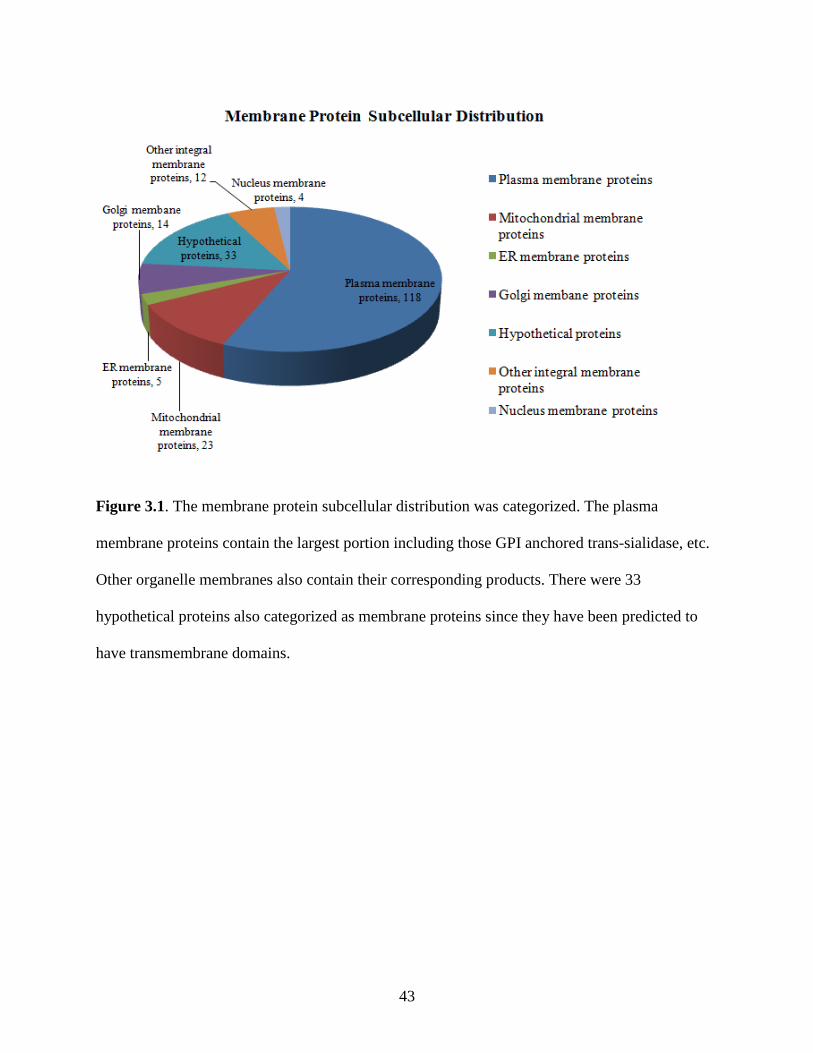
43
Figure 3.1. The membrane protein subcellular distribution was categorized. The plasma
membrane proteins contain the largest portion including those GPI anchored trans-sialidase, etc.
Other organelle membranes also contain their corresponding products. There were 33
hypothetical proteins also categorized as membrane proteins since they have been predicted to
have transmembrane domains.

44
Figure 3.2. The annotated trans-sialidase (TS) distribution was compared within the two
membrane preparation methods. It was shown that the sucrose cushion method has identified
more TS proteins. But for some major TS (close to the left of X-Axis), the spectra count from
detergent resistant method is about 5 times than the one in sucrose method. This indicates some
GPI anchored proteins are more enriched with the detergent resistant preparations.
Annotated TS (Detergent vs. Sucrose)
0
50
100
150
200
250
300
350
400
Tc0
0.1
047053509495.3
0
Tc0
0.1
047053506923.1
0
Tc0
0.1
047053508857.3
0
Tc0
0.1
047053506975.8
0
Tc0
0.1
047053503993.1
0
Tc0
0.1
047053509817.5
0
Tc0
0.1
047053506841.2
0
Tc0
0.1
047053506961.2
5
Tc0
0.1
047053506577.8
0
Tc0
0.1
047053511451.8
0
Tc0
0.1
047053507687.1
0
Tc0
0.1
047053508903.1
0
Tc0
0.1
047053507953.1
00
Tc0
0.1
047053509785.5
0
Tc0
0.1
047053470827.2
0
Tc0
0.1
047053509333.1
0
Tc0
0.1
047053506975.9
0
Tc0
0.1
047053508717.6
0
Tc0
0.1
047053503861.4
0
Tc0
0.1
047053503907.1
0
Tc0
0.1
047053507069.1
60
Tc0
0.1
047053510483.2
10
Tc0
0.1
047053510483.2
50
Tc0
0.1
047053507237.1
0
Tc0
0.1
047053506217.4
0
Tc0
0.1
047053509753.2
70
Tc0
0.1
047053509905.1
70
Tc0
0.1
047053504081.3
90
Tc0
0.1
047053506911.3
0
Tc0
0.1
047053506813.1
90
Tc0
0.1
047053511771.4
0
Tc0
0.1
047053511839.4
0
Tc0
0.1
047053511643.4
0
Tc0
0.1
047053424171.1
0
Annotated TS
detergent Spectral Count
sucrose Spectral Count
45
CHAPTER 4
SUBCELLULAR PROTEOMICS OF TRYPANOSOMA CRUZI INTRACELLULAR
AMASTIGOTE1
______________________________________________________________________ 1 Xiang Zhu, Brent Weatherly, Marshall Bern, James A. Atwood III, T.A. Minning, R.L.
Tarleton, Ron Orlando. To be submitted to Journal of Proteome Research.
46
ABSTRACT
The protozoan parasite Trypanosoma cruzi (T. cruzi) is the etiologic agent of Chagas’ disease,
which is a chronic illness causing congestive heart failure and sudden death. Among the
parasite’s four life stages, amastigote is a replicative stage which resides in the infected host cells
and is a primary target of the host immune-response. Due to the difficulty of isolation and
purification, very few proteomic analyses have been performed on the intracellular amastigotes.
This results in a lack of understanding concerning the parasite’s invasion and survival
mechanism, along with delaying the development of potential vaccines and drugs. Here we
introduce our recent comprehensive proteome analysis of T. cruzi intracellular amastigotes.
Subcellular organelle and membrane enriched fractions as well as cytosol soluble fractions were
individually obtained and analyzed using GeLC-MS/MS approach. In addition to matching the
MS/MS spectra to the annotated proteome database, we performed a whole genome search in
order to identify additional genes potentially missed in the annotation of the T. cruzi genome. We
also utilized a hybrid identification tool (ByOnic) for the identification of unanticipated
mutations caused by different T. cruzi strains. Our results have given us many newly identified
gene products; a lot of them are from ORFs and mutation search. Further, our analysis has
provided valuable information for T. cruzi proteome and help us better understand the parasite’s
biology.

47
INTRODUCTION
The protozoan kinetoplastid parasite Trypanosoma cruzi (T. cruzi) is the causative agent of
Chagas’ disease, which is a chronic illness causing congestive heart failure and sudden death in
the world. It affects 16-18 million people and kills an estimated 50,000 people annually in Latin
American countries.1-3
T. cruzi has a complex life cycle, with four different life stages
transmitting between the mammalian hosts and insect vectors. Metacyclic trypomastigotes are
infective forms that develop in the hindgut of the insect vectors such as triatomine bugs. The
infection is initiated when the blood-feeding insect vectors deposit their feces containing
metacyclic trypomastigotes onto the wounded mammalian skins. After they invade the host cells
around the wound, metacyclic trypomastigotes differentiate into the replicative aflagellated
amastigotes which reside in the host cell cytoplasm. After many rounds of binary fission, large
quantities of amastigotes are produced in the host cells. Later on these amastigotes transform to
the other infective flagellated trypomastigotes, which burst out from the host cells and circulate
in the blood stream to infect other cells throughout the mammalian bodies. Some of the
trypomastigotes are ingested by the insect vectors during their blood meal and converted into
epimastigotes. The epimastigotes replicate in the vector midgut and finally differentiate into
metacyclic trypomastigote thus finishing the life cycle.
The genome sequencing of T. cruzi has been completed recently using a hybrid CL Brenner
strain.4 However like other trypanosomatid parasites, T. cruzi usually regulates the gene
expression mostly post-transcriptionally, which results in the poor correlation between mRNA
and protein levels.5,6
Consequently proteomics becomes attractive for exploring the differential
gene expression through various life stages and to find out novel gene products especially some
potential drug targets and vaccine candidates.
48
Recently several studies targeting the T. cruzi proteome have been reported.7-19
Based on these
studies, many important functional proteins and some stage specific markers have been
identified; however most of these studies were performing the analysis using the whole cell
lysates without any enrichment. These approaches inevitably missed a lot of low abundant gene
products, some of which may play important functional roles for parasite infection and survival.
At the same time we found most of these proteomic studies were focused on those relatively
easily obtained stages such as epimastigotes and trypomastigotes. Researches on another
important human stage amastigotes are quite limitied due to the difficult isolation and
purification steps. Although many valuable information obtained from this stage could be highly
related to the parasite intracellular survival and host cell invasion, only a few papers reported the
proteome of amastigotes, and all of them are obtaining the cells by inducing the trypomastigotes
under low pH conditions which mimic the intracellular environment of amastigote forms.15,17,18
Since it’s not the real amastigote, so it may not express all important protein groups as the
intracullar one does. So current proteome datasets of amastigotes are quite insufficient, more
comprehensive analysis need to be carried out to discover previously underestimated gene
products.
In this paper we are going to report the subcellular fractionated proteomic analysis of the
important amastigote life stage. Unlike all previous experiments, we used the intracellular
amastigotes released from infected vero cells and analyzed the protein expression using enriched
subcellular organelle and membrane preparations. In the protein identification data processing,
besides matching the MS/MS spectra to the annotated proteome database, we also performed the
whole DNA database search in order to identify additional genes potentially missed in the T.
cruzi genome sequencing annotations. We also utilized a hybrid identification tool (ByOnic)20
49
that can perform a wildcard-database search strategy for the identification of unanticipated
modifications and potential mutations. This is very important because the T. cruzi strain we are
investigating is a native strain isolated in Brazil, while the genome sequencing of this organism
was performed on the laboratory CL-Brenner strain.4 Consequently, we anticipate that many of
the genes will differ by multiple point mutations and amino acid substitutions. We expect that
these will limit the utility of traditional database search routines, and thus we incorporated the
wild-card search strategy (ByOnic) into our dataflow in addition to traditional database
searching. The aim of this work was to find much more interesting gene products that are
normally expressed at low levels and less investigated before. The results derived from this
proteome analysis will largely expand the current datasets of the T. cruzi proteome and help us
better understand the parasite’s system biology.
MATERIALS AND METHODS
Cell Culture
Monolayers of vero cells (ATCC no. CCL-81) in RPMI supplemented with 5% horse serum
were infected with Brazil strain T. cruzi trypomastigotes as previously described.21
Extracellular
trypomastigotes were washed from the flasks every other day. After 7 days post infection
cultures were examined by light microscopy to determine the percentages of extracellular
amastigotes and trypomastigotes. When the extracellular parasites were greater than 95%,
amastigotes parasites were harvested by centrifugation at 300 x g for 10 min at room
temperature. Amastigotes in the supernatants from the first spin were then pelleted by
centrifugation at 3,000 x g for 15 min at room temperature, and washed three times with ice-cold
PBS.
Plasma Membrane Preparation using Sucrose Cushion

50
Plasma membrane proteins were firstly enriched using the sucrose cushion method as previously
described with minor modifications.22
The T. cruzi intracellular amastigote cells were suspended
in 3 mL of ice-cold lysis buffer (10 mM HEPES, 1 mM EDTA, pH 7.2) containing Roche
protease inhibitor cocktail. After 15 min incubation at 4 C, cells were homogenized by 25
strokes of a 7 mL Dounce homogenizer. An equal amount of sucrose buffer (10 mM HEPES, 1
mM EDTA, 500 mM sucrose, pH 7.2) was added with additional 25 strokes of homogenizer.
Cellular debris and unbroken cells were removed as pellets after centrifugation at 6,000 x g for
15 min at 4 C. The supernatant was collected and centrifuged at 150,000 x g for 1 hour at 4 C.
Supernatant was removed and the crude pellet membrane was incubated in 100 mM sodium
carbonate solution (pH 11.3) for 15 min at 4 C. After incubation, the membrane pellet was
collected by centrifuging at 150,000 x g for 1 hour at 4 C. The supernatant was desalted through
dialysis (1000 MWCO), dried out under vacuum and collected for analysis also.
Lipid Raft Membrane Preparation using Non-ionic Detergent
Surface membrane proteins especially some GPI anchored proteins were also enriched using
detergent resistant preparations.23,24
Amastigote cells were suspended in 3 mL of ice-cold lysis
buffer (10 mM HEPES, 1 mM EDTA, 250 mM sucrose, pH 7.2) containing Roche protease
inhibitor cocktail. An equal volume of 1% (w/v) Triton X-100 solution was mixed with the lysis
buffer. After 50 strokes of homogenizer, the homogenate was centrifuged for 15 min at 6,000 x g
at 4 C, pelleting the cellular debris and unbroken cells. The supernatant was collected and
centrifuged at 150,000 x g for 1 hour at 4 C. Crude membrane pellet was resuspended with 1%
(w/v) Triton X-100 solution at 4 C and incubated for 30 min. Mixed solution was centrifuged at
150,000 x g for 1 hour at 4 C. The supernatant was removed completely and the pellet was
incubated in 100 mM sodium carbonate solution (pH 11.3) for 15 min at 4 C. After incubation,
51
the membrane pellet was collected by centrifuging at 150,000 x g for 1 hour at 4 C. The
supernatant was desalted through dialysis (1000 MWCO), dried out under vacuum and collected
for further analysis.
Subcellular Organelle Fractions Enrichment
Subcellular fractionation was performed to enrich other organelles. Briefly the amastigote cells
were suspended in 4ml of ice-cold Mannitol Lysis Buffer (400 mM Mannitol, 10mM KCl, 2mM
EDTA, 1 mM phenylmethanesulphonyl fluoride, 20 mM HEPES/KOH, pH 7.6) containing
Roche protease inhibitor cocktail. After 15 min incubation at 4 C, cells were homogenized by 25
strokes of a 7 mL Dounce homogenizer. Cellular debris and unbroken cells were removed as
pellets after centrifugation at 100 x g for 5 min at 4 C. The supernatant was centrifuged at
16,000 x g for 30 min at 4 C. Resulting pellets were collected as organelle enriched fractions and
supernatant was further centrifuged at 105,000 x g for 60 min at 4 C, final supernatant was
collected as cytosol fractions.
1-D Gel Electrophoresis and in-gel Digestion
All dried six fractions (two membrane fractions, two membrane washes, organelle fraction and
cytosol fraction) were resuspended in 20 l Laemmli buffer (Sigma-Aldrich) and boiled at 80 C
for 15 min. Solublized proteins were separated by 1-D SDS-PAGE using NuPAGE 4-12% Bis-
Tris (Invitrogen) gradient gels at 150 V for 2 hours. Gel lanes were washed twice in ddH2O for
15 min and then cut into 20 to 30 slices. Proteins were reduced by incubating the gel bands in 10
mM DTT/100 mM Ambic (ammonium bicarbonate) solution at 56 C for 1 h. Then the proteins
were carboxyamidomethylated with 55 mM iodoacetamide/100 mM Ambic for 1 h at room
temperature in the dark. Enzymatic digestion was performed by adding sequencing grade porcine
trypsin (1:50, Promega, Madison, WI) and incubated at 37 C overnight. The tryptic peptides
52
were extracted three times with 200 l of ACN/water (1:1) solution. Combined extracts were
completely dried in speed vacuum, resuspended in 50 l of 0.1% formic acid and then stored at -
20 C, before analysis by MS.
LC-MS/MS Analysis
The peptide samples obtained from proteolytic digestion were analyzed on an Agilent 1100
capillary LC (Palo Alto, CA) interfaced directly to a LTQ linear ion trap mass spectrometer
(Thermo Fisher, San Jose, CA). Mobile phases A and B were H2O-0.1% formic acid and
acetonitrile-0.1% formic acid, respectively. The peptide samples were loaded for 50 min using
positive N2 pressure on a PicoFrit 8-cm by 50-μm column (New Objective, Woburn, MA)
packed with 5-μm-diameter C18 beads. Peptides were eluted from the column into the mass
spectrometer during a 90 min linear gradient from 5 to 60% of total solution composed of mobile
phase B at a flow rate of 200 nl min−1
. The instrument was set to acquire MS/MS spectra on the
nine most abundant precursor ions from each MS scan with a repeat count of 1 and repeat
duration of 5 s. Dynamic exclusion was enabled for 200 s. Raw tandem mass spectra were
converted into the mzXML format and then into peak lists using ReAdW software followed by
mzMXL2Other software.25
The peak lists were then searched using Mascot 2.2 (Matrix Science,
Boston, MA).
Database Searching and Protein Identification
As the first step of our data processing, a non-redundant target database was created through
combining the 11100 annotated sequences obtained from the tritrypdb
(http://tritrypdb.org/tritrypdb/) and NCBI (www.ncbi.nlm.nih.gov/). A decoy database was then
constructed by reversing the sequences in the normal database. Searches were performed against
the normal and decoy databases using the following parameters: fully tryptic enzymatic cleavage
53
with two possible missed cleavages, peptide tolerance of 800 ppm, fragment ion tolerance of 0.6
Da. Fixed modification was set as carbamidomethyl due to carboxyamidomethylation of cysteine
residues (+57 Da). Statistically significant proteins from both searches were determined at a 1%
protein false discovery rate (FDR) using the ProValT algorithm, as implemented in ProteoIQ
(BioInquire, LLC, Athens, GA).26
A subset fasta database (Database 1) was created containing
the above validated proteins passing the 1% FDR. Meanwhile, all the peak lists were searched
against the whole six-frame DNA sequences using Mascot with same parameters. Acquired data
were loaded into ProteoIQ as the target match, previously generated protein database search
result was chosen as the non-target match. Additional peptide matches were acquired only if the
target search score is higher than the non-target match score. These peptides were then clustered
to the open reading frames (ORFs). The two databases (Database 1 and ORFs database) were
combined and used to perform a wild card search using ByOnic to select unanticipated
modifications and find possible mutations. The mass tolerance parameters were the same as
Mascot search. Modifications were selected as carbamidomethyl due to
carboxyamidomethylation of cysteine residues (+57 Da), oxidation of methionine residues (+16
Da), deamidation of asparagine residues (+1 Da), Gln to Pyro-Glu (-17 Da), Glu to Pyro-Glu (-
18 Da) and any one SNP (single nucleotide polymorphism) mutation per peptide. To further
validate the identified ORFs, modified and mutated peptides, a final fasta database was
constructed combining the initially annotated sequences, the ORFs identifications from the
whole genome search, the ByOnic identified mutated sequences and 100,000 randomly
generated sequences. All the MS/MS spectra were searched again using this database with 1)
fully tryptic enzymatic cleavage and fixed modification (+57 Da) alone. 2) Fully tryptic
enzymatic cleavage, fixed modification (+57 Da), and variable modifications using oxidation of

54
methionine residues (+16 Da), deamidation of asparagine residues (+1 Da), Gln to Pyro-Glu (-17
Da) and Glu to Pyro-Glu (-18 Da). 3) Semi-tryptic enzymatic cleavage and fixed modification
(+57 Da). All the resulting search data were combined and validated using ProteoIQ. For
unmodified and fixed modified peptides (+57 Da), the numbers of random matches were
controlled below 1%, the mascot ion score thresholds for identification of a protein with 3 or
more peptides was ≥28, with 2 peptides ≥33, and a single peptide match was calculated as ≥57.
For variable modifications and semi-tryptic peptide matches, the thresholds were set even higher
to reduce false positive identifications. The minimum mascot ion score for variable modified
peptides was selected as 60 and the one for semi-tryptic peptides was set as 65.
RESULTS
Subcellular Organelle and Membrane Enrichment
In this study, we performed a subcellular fractionation analysis of the intracellular amastigotes to
identify proteins majorly enriched in organelles and plasma membranes fractions. The
differential centrifugation method was utilized for organelle enrichment after cell lysis. Through
this procedure, some heavy organelles such as mitochondria and ER enriched fractions were
obtained in the pellet of 16,000 x g. After high speed centrifugation at 105,000 x g, the
supernatant was kept as cytosol fraction. Plasma membranes as well as the Golgi apparatus were
collected using two methods (sucrose cushion and detergent resistant preparation) adopted from
another study we did recently. In order to fully investigate the subproteome, the plasma
membrane soluble fractions (supernatant from 150,000 x g centrifugation in sodium carbonate
wash solution) were also analyzed, which was claimed to contain the loosely bound membrane
associated proteins. All the six fractions were separated by 1-D SDS-PAGE gel electrophoresis
(Figure 4.1). It was indicated from the gel image that the organelle and membrane fractions
55
contained more proteins than the membrane wash and cytosol fractions. The gel lanes were
sliced into 20-30 fractions and then those fractions were subjected to in-gel trypsin digestion. All
the individual fractions were analyzed through on-line LC-MS/MS using LTQ ion trap.
Proteome Data Analysis
There were a total of 2490 proteins within 890 protein groups got identified by 50526 MS/MS
spectra in all preparation fractions. Among them the organelle enriched fractions yielded the
largest number of identifications; in the membrane and cytosol fractions we also found a
significant number of proteins. We saw relatively small number of identifications in the
membrane wash solutions and this indicated there were not many loosely bound membrane
associated proteins recovered in our preparations. The relative distribution of identified proteins
among all fractions was shown in Figure 4.2.
In order to maximize our identification data sets, we performed the database searching within
multiple steps. Initially all the MS/MS spectra were searched against a combined target database
of the annotated T. cruzi sequences with Mascot and only allowed the fixed modification of
carbamidomethyl (+57 Da). The decoy database search was performed later on and the validation
of the proteins were based on max 1% protein false discovery rate (FDR) using the ProValT
algorithm, as implemented in ProteoIQ (BioInquire, LLC, Athens, GA). There were a total of
2055 proteins (697 protein groups) got validated. A subset protein fasta database (Database 1)
was created using these proteins for later on searching and validation. Since our goal of this
project is to identify more of the potential interesting gene products which have been under-
discovered before, so exploring the novel protein coding regions is also very important. As a
result, in the second step a whole genome open reading frames (ORFs) analysis was performed
using the Mascot search engine focused on detecting proteins that are not in the annotated

56
databases. In order to reduce the numbers of random sequence matches of this whole genome
search, the mascot results from the annotated protein database search were chosen as the non-
target search during ProteoIQ processing. In this way, if a MS/MS spectrum was matching to
both genome search and protein database search, it was kept for further validation on the premise
that the genome database searching Mascot score is higher than the protein database searching
score. Consequently, only unique peptides identified by spectra that failed to match proteins in
the annotated sequences were clustered to the ORFs, and the new proteins were annotated after
the search. Finally, each annotation and the MS/MS spectra matching to the new genes were
manually verified, yielding 639 new candidate proteins as our ORFs database. Besides the ORFs
peptide identification, we also performed a wildcard-database search strategy for the
identification of unanticipated modifications and potential mutations with ByOnic, which is a
hybrid tool of de novo sequencing and database search. The reason we are doing this is because
there are several different kinds of lab strains for T. cruzi, such as Y, CL Brenner, Brazil,
Tulahuen, etc. In this experiment, we were using the native Brazil strain, while the T. cruzi
genome was performed on the laboratory CL-Brenner strain. Consequently, many of the genes
could differ by multiple point mutations and amino acid substitutions. These mutations will
change both the peptide parent ion mass and most of the fragment ion peaks, usually with an
unanticipated position. ByOnic can well handle the mutation search with any one-letter amino
acid change, thus it recovered a lot of “correct MS/MS identification spectra” which have been
thrown away during the regular Mascot search. A new subset of mutation database was created
containing these identified mutated proteins. There were total of 362 mutated protein candidates
obtained from the spectra and kept for further validation. Finally, the additional subset databases
(ORFs+Mutation) were combined with the annotated sequences and another 100K totally
57
random sequences were added together to generate our final database. All the MS/MS spectra
were searched again using this database in the following order of 1) tryptic with fixed
modifications, 2) tryptic with variable modifications and 3) semitryptic with fixed modifications
to validate the newly identified ORFs, modified and mutated peptides. Finally, each annotation
and the MS/MS spectra matching to the new genes were manually verified, yielding 2061
annotated proteins, 105 new ORFs identification (containing 78 unannotated trans-sialidase) and
314 mutated proteins. There were only 10 out of 100,000 random sequences picked up in our list,
indicating the data selection was very stringent.
DISCUSSION
To date, most of the T. cruzi proteomic studies have been focused on the insect epimastigote
stage and blood-form trypomastigote stage. There are only three papers15,17,18
reported on the
amasitogte proteome using the whole cell analysis without subcellular enrichment; and those
amastigotes were obtained by inducing the trypomastigotes in acidic medium in-vitro. The real
intracellular amastigote stage has never been investigated for its protein expression, although
some important targets of immune responses might come from this life form.27
Amastigote
specific antigens, such as amastigote surface protein (ASP)-2, amastigote surface protein-3 and
amastigote cytoplasmic antigen were identified in our experiment. These genes are preferentially
expressed in the intracellular amastigotes stages and are the targets of T. cruzi specific T cell
responses. It has been shown that peptides from ASP proteins are involved in the class I MHC
presentation pathway and activate CD8+ T cell responses. In recent mouse model research, the
vaccination experiments with a plasmid encoding an ASP-2 generated specific CD4+ Th1 and
CD8+ Tc1 immune responses and increased the survival rate of the mice against a fatal T. cruzi
infection to 65%.28
Further studies have shown that similar protective immunity could not be
58
achieved by immunization with a plasmid encoding trypomastigote-specific trans-sialidase
antigens.29
This has indicated that compared to other life stages, antigens identified in the
intracellular amastigotes are more important and expected to be the targets for host immune
responses and potentially become better vaccine candidates.
Better understanding of the intracellular amastigote especially the organelle/membrane
subproteome will facilitate the development of vaccination protocols. In our analysis, the
enrichment of organelle and membranes were proven to be quite effective with the evidence of
many newly identified low abundant gene products. T. cruzi is unable to synthesize sialic acid
itself so it relies on trans-sialidase to transfer the sialic acid from host sialoglycoconjugates onto
terminal galactose residues on its surface mucin molecules. The sialiation of surface
glycoproteins will both prevent complement activation and increase the infectivity. Trans-
sialidases are the major plasma membrane proteins on T. cruzi cell surface. Although there are
more than 1300 trans-sialidase genes in the whole T. cruzi genome, only a few of them got
identified in previous studies. For amastigote stages, this number is claimed to be even lower
compared to trypomastigotes. Herein we identified 307 trans-sialidase genes in 58 protein
groups, which increased the identification numbers a lot. In previous amastigote studies, there
were only 78 trans-sialidase (15 protein groups) detected in Atwood’s whole cell analysis.17
There was no evidence of the trans-sialidase identification in Paba’s studies.15,18
Some other
proteins such as ATPase, GP63, surface protein TolT, etc also got enriched in the membrane
fractions. Lysosomal/endosomal membrane protein p67 (Tc00.1047053510825.30) is a
lysosomal membrane protein and enoyl-CoA hydratase (Tc00.1047053508153.130) is expressed
in the mitochondrion, both of them were not detected in amastigotes before and now have been
experimentally confirmed of their expression in our identification list, majorly found in the

59
organelle preparation fraction. There were another 22 proteins annotated as “pseudogenes” got
identified, such as Tc00.1047053511237.30 (proline oxidase, pseudogene),
Tc00.1047053506923.10 (trans-sialidase, pseudogene) etc. Our data has suggested those are not
pseudogenes and confirmed them as real proteins.
Besides the subcellular enrichment, our data processing approaches also contributed a lot to the
additional new gene products identification, specifically on the non-annotated genes.
Tc00.1047053507089.170_m153 is an example of the mutated protein identification. Through
ByOnic database searching, peptide YNWLLNEMVLTR was identified by tandem mass spectra
and there were no protein sequences in the original database matching this peptide. But
hypothetical protein Tc00.1047053507089.170 contains a peptide YNWLLNEMILTR which
only has one amino acid difference. So we proposed there was a mutation occurred on this
peptide and the corresponding mutated protein was annotated as
Tc00.1047053507089.170_m153 (367 I—V). We put 367 I--V in the sequence annotation
indicating the amino acid mutation from I to V at sequence site 367. The m153 is just the
ordering number in our mutated protein list.
Overall, among the total 2490 identified proteins (890 protein groups), 337 of them were never
detected before in any life stages, which accounts for 14%. As for the amastigote stage, there
were 481 proteins thought to be new identification and this is around 19% within the whole list.
During classification for those mutated proteins, if their corresponding non-mutated genes
already have the mass spec evidence, then we don’t count them as new identification. For
example, ATPase beta subunit (Tc00.1047053509233.180_m53) has a unique mutated peptide
AVLVYGQMNEPPGAR, which has never been detected before. But Tc00.1047053509233.180
was shown to be previously identified in other studies.7 So we consider this protein has been
60
discovered before and not new even with novel peptide identification due to our mutation search.
While, as for the phosphoinositide-binding protein (Tc00.1047053510657.30_m307), we noticed
that the original non-mutated one Tc00.1047053510657.30 has no proof of mass spec
identification. In this case, this mutated protein was assigned to the new identification list and of
course the reason causing it to be discovered is because we performed the ByOnic wild card
mutation search and successfully identified a mutated peptide LESELAGLEER. The mutation
search also increased the peptide coverage a lot, making some of the previously ambiguous
identifications to the confident ones. Without mutation search, retrotransposon hot spot (RHS)
protein (Tc00.1047053508589.30) will only have one matched peptide GGLTEWFSSHGK with
a mascot score of 48. In our 1% protein FDR calculation, the min score for one peptide match
was allowed as 57, thus it was excluded from our list. But adding the identification of mutated
peptide YSAASNIVDIVDGFSGR and will help us to keep this identification since the min
mascot score for two peptides was defined as 33. In this way, many other initially “discarded
proteins” were dragged back into our identification list, which largely improved the coverage.
Functional Classification of the Identified Proteins
Most of the identified proteins were classified and assigned functions using literature searching
and Database for Annotation Visualization and Integrated Discovery (DAVID)30
software
according to the Gene Ontology hierarchy. As shown in Figure 4.3, a variety of functional
annotations have been assigned, indicating our identification dataset contains an in-depth
distribution of the functional proteins. One major category of the classified functions is the
nucleotide binding. There are a total of 111 protein groups involved in this function such as RNA
binding proteins and GTP binding nuclear protein etc. Another relatively abundant distribution
group is involved in translation biological process, which contains 50 proteins. Most of them are
61
ribosomal proteins and elongation factors. Besides that, there are some other proteins involved in
the metabolism pathways. It was thought the fatty acid catabolism is more abundant in
amastigotes and provides the nutrients for corresponding energy metabolism. We have found a
number of enzymes involved in the fatty acid metabolism pathways such as fatty acyl CoA
syntetase, acyl-CoA dehydrogenase, enoyl-CoA hydratase/isomerase, 3-ketoacyl-CoA thiolase,
etc. Additionally, we identified a lot of cell surface proteins participating host cell invasion and
their escape from our immune system. Trans-sialidase and GP63 protein families are the major
ones in this category. Besides the T cell antigens such as trans-sialidases, we also firstly
identified a major human B-cell immunodominant antigen Tc40 like protein
(Tc00.1047053506659.10). This antigen has been discovered by a lot of patients’ serum samples
with Chagas’ disease. The most important aspect of this antigen is that Tc40 does not contain
tandemly repeated amino acid sequences. This feature makes it standing out from many other T.
cruzi antigens having tandem repeating units because previous studies have suggested that the
immune response to parasite repeating antigens cannot protect the host since it hides more
important epitopes from the host’s immune response.31
There were another 210 proteins
identified as hypothetical proteins with unknown function. Most of them were conserved from
other organisms. However, there were a few of them not annotated as "conserved", which means
they are unique sequences to T. cruzi. Hypothetical proteins Tc00.1047053511725.80,
Tc00.1047053511003.60, etc are the examples of them. These hypothetical proteins in our
identification lists could be further studied for their functional and localization discovery in other
biological researches.
Subcellular Distribution of the Identified Proteins
62
The subcellular distribution of the identified proteins were also investigated using DAVID linked
with Gene Ontology hierarchy and literature reviews (Figure 4.4). Besides hypothetical and
unknown proteins, cytoplasm proteins are the most abundant populations among all groups,
accounting for 19% of the total identification. The plasma membrane proteins account for 9%,
including trans-sialidase, GP63, ATPases and several other important protein families.
Mitochondrial proteins were identified as another abundant group in our subcellular
identifications with a percentage of 7%. ADP, ATP carrier proteins, Malate dehydrogenase,
enoyl-CoA hydratase etc are all from this organelle. We also have 6% proteins in the ER and
Golgi subcellular organelle fractions. For example, UDP-Gal or UDP-GlcNAc-dependent
glycosyltransferase is one of the glycosyltransferase proteins localized in Golgi apparatus and
catalyzes the addition of the monosaccharide group from a UTP-sugar to a small receptor
molecule. Calreticulin is an ER resident protein and functionalized as Ca2+ binding chaperones.
In general, the subcellular localization distribution indicates the enrichment strategies are
efficient since in regular whole cell analysis, the total membrane proteins only account for
around 3%.
CONCLUSION
Subcellular organelle and membrane proteomic analyses were successfully used to identify the T.
cruzi intracellular amastigotes proteome. In order to recover identifications outside the annotated
genes, the whole genome search and ByOnic mutation search were also performed. These data
processing methods largely increased our identification data sets and recovered many "good
MS/MS spectrum" not selected in the "annotated database searching". Totally, there were 2490
proteins within 890 protein groups observed in our experiment. 14% of them were never detected
in any life stages of T. cruzi and 19% of the identified proteins were not shown in previous
63
amastigote proteome data. The new identification sets contained many important cell surface
membrane proteins such as trans-sialidase, GP63, etc. Some other identified proteins involved in
the metabolism pathways indicated the amastigotes living conditions and energy source. This is
the first proteomic analysis of T. cruzi intracellular amastigote stage and could be potentially
contributed to the understanding of this parasite system biology and future vaccine selections.

64
REFERENCES
(1) World Health Organ Tech Rep Ser 2002, 905, i.
(2) Cubillos-Garzon, L. A.; Casas, J. P.; Morillo, C. A.; Bautista, L. E. Am Heart J
2004, 147, 412.
(3) Moncayo, A. World Health Stat Q 1992, 45, 276.
(4) El-Sayed, N. M.; Myler, P. J.; Bartholomeu, D. C.; Nilsson, D.; Aggarwal, G.;
Tran, A. N.; Ghedin, E.; Worthey, E. A.; Delcher, A. L.; Blandin, G.; Westenberger, S. J.; Caler,
E.; Cerqueira, G. C.; Branche, C.; Haas, B.; Anupama, A.; Arner, E.; Aslund, L.; Attipoe, P.;
Bontempi, E.; Bringaud, F.; Burton, P.; Cadag, E.; Campbell, D. A.; Carrington, M.; Crabtree, J.;
Darban, H.; da Silveira, J. F.; de Jong, P.; Edwards, K.; Englund, P. T.; Fazelina, G.; Feldblyum,
T.; Ferella, M.; Frasch, A. C.; Gull, K.; Horn, D.; Hou, L.; Huang, Y.; Kindlund, E.; Klingbeil,
M.; Kluge, S.; Koo, H.; Lacerda, D.; Levin, M. J.; Lorenzi, H.; Louie, T.; Machado, C. R.;
McCulloch, R.; McKenna, A.; Mizuno, Y.; Mottram, J. C.; Nelson, S.; Ochaya, S.; Osoegawa,
K.; Pai, G.; Parsons, M.; Pentony, M.; Pettersson, U.; Pop, M.; Ramirez, J. L.; Rinta, J.;
Robertson, L.; Salzberg, S. L.; Sanchez, D. O.; Seyler, A.; Sharma, R.; Shetty, J.; Simpson, A. J.;
Sisk, E.; Tammi, M. T.; Tarleton, R.; Teixeira, S.; Van Aken, S.; Vogt, C.; Ward, P. N.;
Wickstead, B.; Wortman, J.; White, O.; Fraser, C. M.; Stuart, K. D.; Andersson, B. Science 2005,
309, 409.
(5) Tomas, A. M.; Kelly, J. M. Mol Biochem Parasitol 1996, 76, 91.
(6) Rodriguez, F.; Ramirez, J. L.; Rangel-Aldao, R. Biol Res 1993, 26, 35.
(7) Sant'Anna, C.; Nakayasu, E. S.; Pereira, M. G.; Lourenco, D.; de Souza, W.;
Almeida, I. C.; Cunha, E. S. N. L. Proteomics 2009, 9, 1782.
65
(8) Nakayasu, E. S.; Gaynor, M. R.; Sobreira, T. J.; Ross, J. A.; Almeida, I. C.
Proteomics 2009, 9, 3489.
(9) Cordero, E. M.; Nakayasu, E. S.; Gentil, L. G.; Yoshida, N.; Almeida, I. C.; da
Silveira, J. F. J Proteome Res 2009, 8, 3642.
(10) Ayub, M. J.; Atwood, J.; Nuccio, A.; Tarleton, R.; Levin, M. J. Biochem Biophys
Res Commun 2009, 382, 30.
(11) Ferella, M.; Nilsson, D.; Darban, H.; Rodrigues, C.; Bontempi, E. J.; Docampo,
R.; Andersson, B. Proteomics 2008, 8, 2735.
(12) Souza, R. A.; Henriques, C.; Alves-Ferreira, M.; Mendonca-Lima, L.; Degrave,
W. M. Anal Biochem 2007, 365, 144.
(13) Parodi-Talice, A.; Monteiro-Goes, V.; Arrambide, N.; Avila, A. R.; Duran, R.;
Correa, A.; Dallagiovanna, B.; Cayota, A.; Krieger, M.; Goldenberg, S.; Robello, C. J Mass
Spectrom 2007, 42, 1422.
(14) Atwood, J. A., 3rd; Minning, T.; Ludolf, F.; Nuccio, A.; Weatherly, D. B.;
Alvarez-Manilla, G.; Tarleton, R.; Orlando, R. J Proteome Res 2006, 5, 3376.
(15) Paba, J.; Santana, J. M.; Teixeira, A. R.; Fontes, W.; Sousa, M. V.; Ricart, C. A.
Proteomics 2004, 4, 1052.
(16) Magalhaes, A. D.; Charneau, S.; Paba, J.; Guercio, R. A.; Teixeira, A. R.;
Santana, J. M.; Sousa, M. V.; Ricart, C. A. Proteome Sci 2008, 6, 24.
(17) Atwood, J. A., 3rd; Weatherly, D. B.; Minning, T. A.; Bundy, B.; Cavola, C.;
Opperdoes, F. R.; Orlando, R.; Tarleton, R. L. Science 2005, 309, 473.
(18) Paba, J.; Ricart, C. A.; Fontes, W.; Santana, J. M.; Teixeira, A. R.; Marchese, J.;
Williamson, B.; Hunt, T.; Karger, B. L.; Sousa, M. V. J Proteome Res 2004, 3, 517.

66
(19) Parodi-Talice, A.; Duran, R.; Arrambide, N.; Prieto, V.; Pineyro, M. D.; Pritsch,
O.; Cayota, A.; Cervenansky, C.; Robello, C. Int J Parasitol 2004, 34, 881.
(20) Bern, M.; Cai, Y.; Goldberg, D. Anal Chem 2007, 79, 1393.
(21) Piras, R.; Piras, M. M.; Henriquez, D. Mol Biochem Parasitol 1982, 6, 83.
(22) Seyfried, N. T.; Huysentruyt, L. C.; Atwood, J. A., 3rd; Xia, Q.; Seyfried, T. N.;
Orlando, R. Cancer Lett 2008, 263, 243.
(23) Sanders, P. R.; Gilson, P. R.; Cantin, G. T.; Greenbaum, D. C.; Nebl, T.; Carucci,
D. J.; McConville, M. J.; Schofield, L.; Hodder, A. N.; Yates, J. R., 3rd; Crabb, B. S. J Biol
Chem 2005, 280, 40169.
(24) Radeva, G.; Sharom, F. J. Biochem J 2004, 380, 219.
(25) Pedrioli, P. G.; Eng, J. K.; Hubley, R.; Vogelzang, M.; Deutsch, E. W.; Raught,
B.; Pratt, B.; Nilsson, E.; Angeletti, R. H.; Apweiler, R.; Cheung, K.; Costello, C. E.;
Hermjakob, H.; Huang, S.; Julian, R. K.; Kapp, E.; McComb, M. E.; Oliver, S. G.; Omenn, G.;
Paton, N. W.; Simpson, R.; Smith, R.; Taylor, C. F.; Zhu, W.; Aebersold, R. Nat Biotechnol
2004, 22, 1459.
(26) Weatherly, D. B.; Atwood, J. A., 3rd; Minning, T. A.; Cavola, C.; Tarleton, R. L.;
Orlando, R. Mol Cell Proteomics 2005, 4, 762.
(27) Low, H. P.; Santos, M. A.; Wizel, B.; Tarleton, R. L. J Immunol 1998, 160, 1817.
(28) Vasconcelos, J. R.; Hiyane, M. I.; Marinho, C. R.; Claser, C.; Machado, A. M.;
Gazzinelli, R. T.; Bruna-Romero, O.; Alvarez, J. M.; Boscardin, S. B.; Rodrigues, M. M. Hum
Gene Ther 2004, 15, 878.
(29) Silveira, E. L.; Claser, C.; Haolla, F. A.; Zanella, L. G.; Rodrigues, M. M. Clin
Vaccine Immunol 2008, 15, 1292.
67
(30) Dennis, G., Jr.; Sherman, B. T.; Hosack, D. A.; Yang, J.; Gao, W.; Lane, H. C.;
Lempicki, R. A. Genome Biol 2003, 4, P3.
(31) Lesenechal, M.; Becquart, L.; Lacoux, X.; Ladaviere, L.; Baida, R. C.; Paranhos-
Baccala, G.; da Silveira, J. F. Clin Diagn Lab Immunol 2005, 12, 329.

68
Figure 4.1. Coomassie blue stained 1-D SDS-PAGE analysis of the subcellular organelle and
membrane fractions. Molecular weight of standard protein markers are given on the left side of
the gel (lane 1). Lan2 is the membrane fraction from sucrose cushion and lane 3 is the
corresponding membrane wash fraction. Lane 4 is the membrane fraction from detergent
resistant preparation and lane 5 is the membrane wash from that method. Lane 6 is the organelle
fraction and the cytosol fraction is shown in lane 7. All the six sample lanes were later on cut
into 20-30 slices for LC-MS/MS analysis.
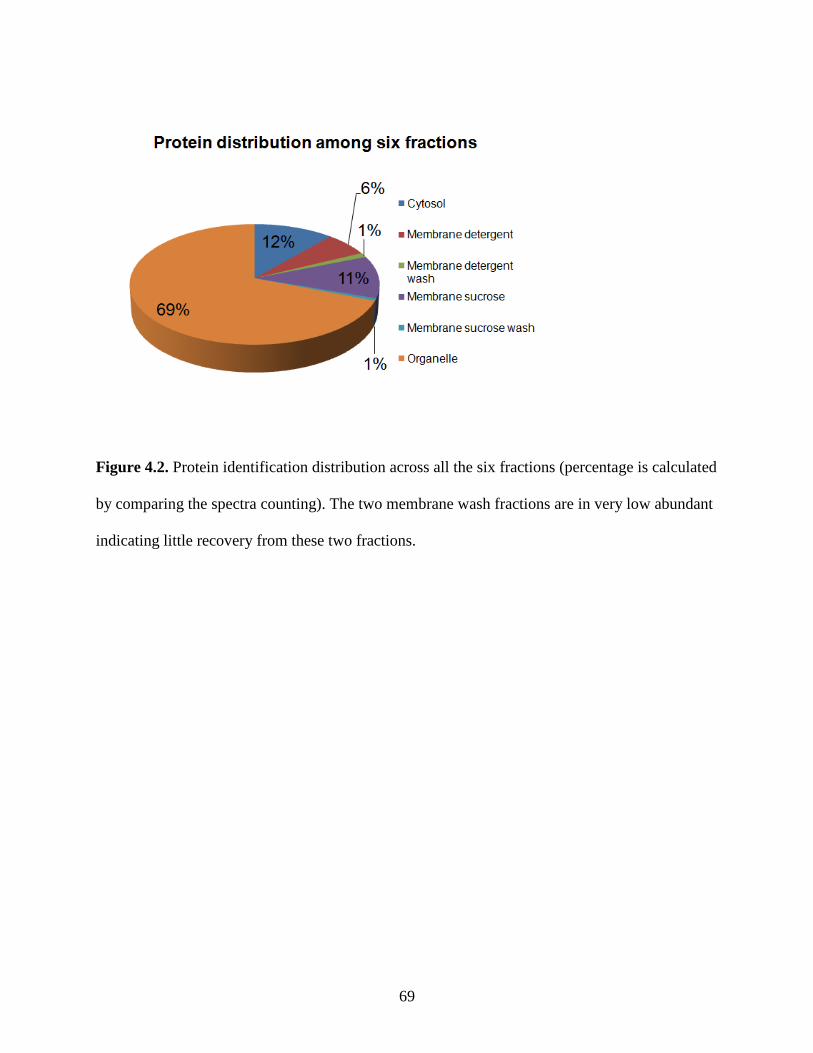
69
Figure 4.2. Protein identification distribution across all the six fractions (percentage is calculated
by comparing the spectra counting). The two membrane wash fractions are in very low abundant
indicating little recovery from these two fractions.
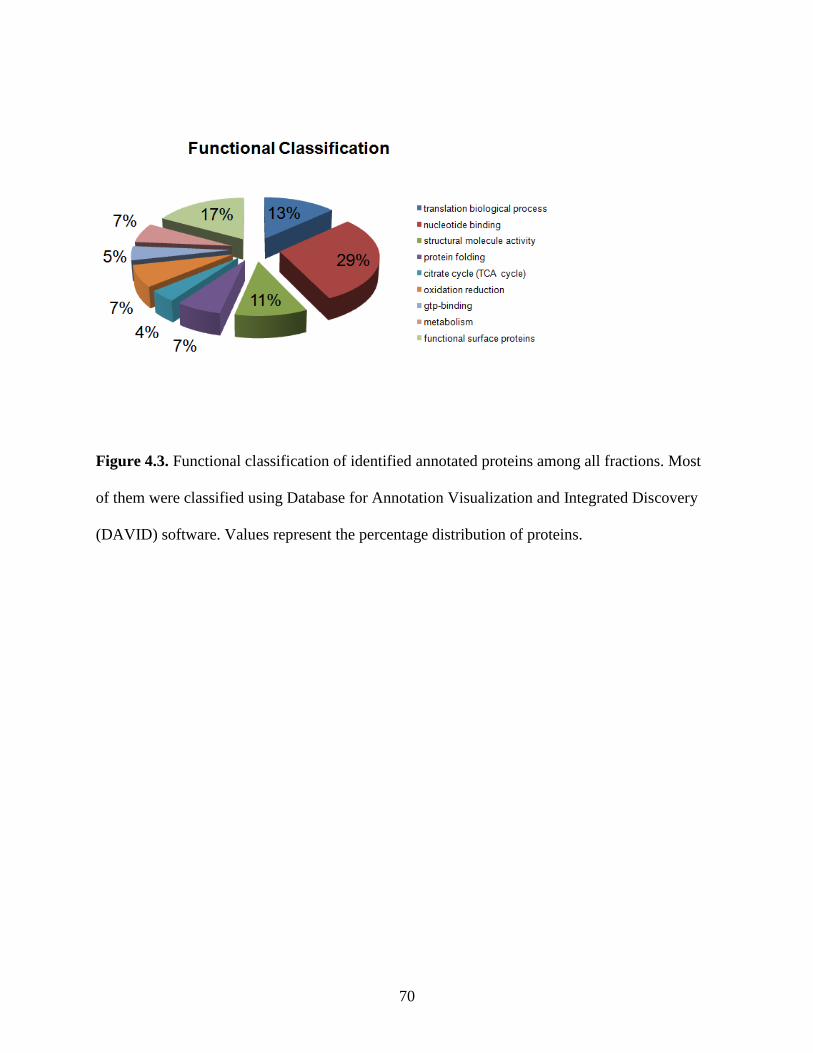
70
Figure 4.3. Functional classification of identified annotated proteins among all fractions. Most
of them were classified using Database for Annotation Visualization and Integrated Discovery
(DAVID) software. Values represent the percentage distribution of proteins.
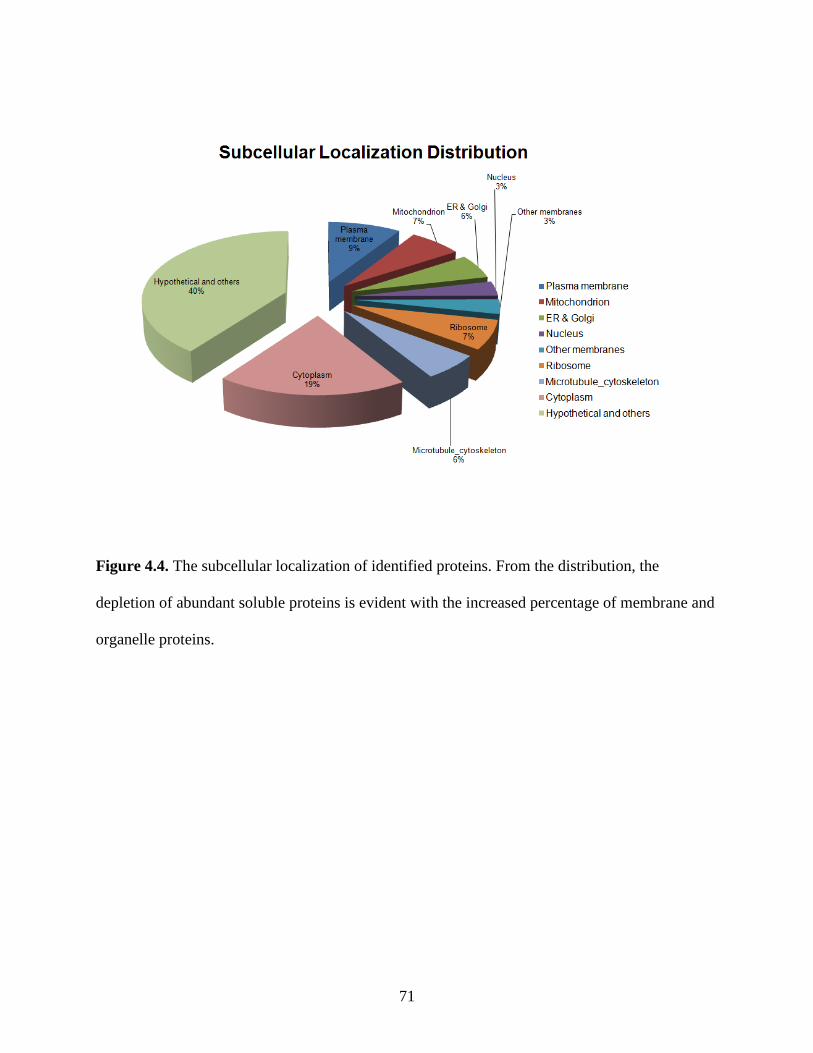
71
Figure 4.4. The subcellular localization of identified proteins. From the distribution, the
depletion of abundant soluble proteins is evident with the increased percentage of membrane and
organelle proteins.
72
CHAPTER 5
RESOLVING PROTEIN ISOFORMS IN PROTOZOAN PARASITE TRYPANOSOMA CRUZI
USING GELC-MS/MS APPROACH1
______________________________________________________________________ 1 Xiang Zhu, James A. Atwood III, Brent Weatherly, T.A. Minning, R.L. Tarleton, Ron Orlando.
To be submitted to Journal of Proteome Research.
73
ABSTRACT
The protozoan parasite Trypanosoma cruzi is the etiologic agent of Chagas’ disease. Recent
completion of the genome sequencing has indicated over 30% of its genome is comprised of
multiple gene families especially some surface membrane genes. The protein isoforms from
these families usually have similar sequences and redundant functions. This result increases the
difficulty for the high-throughput proteomic studies. In regular bottom-up proteomics
experiments, identified peptides must be mapped to protein sequences for reporting of protein
identifications. However, differentiating between protein isoforms is complicated by the fact that
peptides are analyzed rather than intact proteins. Thus if a peptide is shared between two
proteins, without additional information, it is impossible to distinguish which protein is actually
expressed or if both proteins are expressed. Herein we report the application of GeLC-MS/MS
approach to analyze the Trypanosoma cruzi membrane proteome. Overall, we identified 1029
protein groups from the membrane enriched fractions. The GeLC approach also helps us
effectively resolve some protein isoforms’ identification including trans-sialidases, GP63, etc
which are potential vaccine candidates for Chagas’ disease.
74
INTRODUCTION
Approximate 18 million people in Latin American countries are infected with Trypanosoma
cruzi (T. cruzi) which is the causative agent of Chagas disease.1 The infection usually has the
consequence of heart rhythm abnormalities causing sudden death. Each year more than 50,000
people are died from Chagas disease.1,2
The T. cruzi life cycle stages are developed between
reduviid insect vectors and mammalian hosts. Epimastigotes reside in the vector midgut and they
can replicate and differentiate into metacyclic trypomastigotes, which are the infective forms
transmitted to mammalian hosts. The metacyclic trypomastigotes enter various host cells and
differentiate into amastigote forms which replicate through binary fission. These intracellular
amastigotes transform to trypomastigotes that are circulated in the blood stream and invade other
cells in the body. The cycle is continued when some of these trypomastigotes are ingested by the
insect vectors during their blood meal. The trypomastigotes finally undergo differentiation into
epimastigotes in the insect vector’s midgut. Currently there are no effective vaccines available
for this disease and the treatments have been restricted to highly toxic chemotherapeutic agents,
which have been proven unsatisfactory for the chronic stage of the disease and exhibit dangerous
side effects.3 Recent studies have shown that some functional proteins involved in the parasite
invasion and survival mechanism within the mammalian hosts could become potential vaccine
candidates and drug targets.3-6
Therefore comprehensive system biology studies become essential
for discovery of these targets. The T. cruzi genome sequencing has been completed recently
using a hybrid CL Brenner strain.7 However like other trypanosomatid parasites (T. brucei and
L.major), T. cruzi regulates their gene expression mostly post-transcriptionally, which results in
the poor correlation between mRNA and protein levels. Consequently directly exploring the

75
organism proteome becomes very important for discovering various gene products through
differential life stages.8-10
Shotgun proteomics especially MudPIT is one of the most popular approaches used for
comprehensive proteome discovery.11,12
It usually uses SCX and RPLC as a combination of the
peptides separation and detects the separated fractions by tandem mass spectrometry. The
advantage of the shotgun proteomics approach is the better digestion efficiency and protein
coverage for global proteome.13
In 2005, Atwood used this multidimensional LC-MS/MS
approach to identify 2784 proteins from all the four developmental stages; this is by far the most
comprehensive T. cruzi proteome identification datasets.8 While one of the problems in
interpreting the results of shotgun proteomics experiments is the difficult distinguishment of
protein isoforms from the identified peptides. This case becomes particularly important for T.
cruzi because at least 30% of this parasite’s genome is composed of multi-copy gene families.7,8
The largest gene families include some cell surface proteins such as trans-sialidase, mucins,
mucin-associated surface proteins (MASPs), and the surface glycoprotein gp63 protease. These
gene products especially the trans-sialidase members are major targets of host cell immune
responses, thus could become potential vaccine candidates.4,5,14-16
At the same time the largely
expressed variable trans-sialidase isoforms could play important roles for their immune
evasion.15
Finding out which trans-sialidases are probably expressed on cell surface is important
for the vaccine development. So selecting proper ways to resolve these protein families’
identification is important but also challenging because these protein isoforms usually contain
very similar sequences with some shared peptides. Without additional information, we can only
assign these shared peptides to certain protein groups and it is impossible to decide which
specific protein or several proteins in this group are truly identified.
76
With the aim of resolving complex protein isoforms’ identification in T. cruzi, we recently
performed a membrane proteomic analysis on T. cruzi CL-Brenner lab strain of trypomastigote
life stage using the GeLC-MS/MS approach.17
In this organism, many important protein families
are cell surface proteins, thus enrichment of the plasma membrane fractions is necessary.7,8
The
reason we choose trypomastigotes instead of other developmental stages is because this stage has
been verified to express relatively the largest number of surface membrane protein families such
as trans-sialidases, etc and it is the infective form present in the host blood stream and interacts
with the host’s immune system.8,18
The desirable GeLC-MS/MS approach is favored over
MudPIT shotgun proteomics by improved membrane proteins solubility, less complex mixtures,
and the availability to link identified peptides with corresponding proteins.17,19
These advantages
could help us identify and differentiate some previously unresolved protein isoforms through
combining the protein molecular weight information, unique peptides, and ways of protein
grouping.
MATERIALS AND METHODS
Parasite Preparation
The CL-Brenner lab strain of trypomastigotes were grown in monolayers of Vero cells (ATCC
no. CCL-81) in RPMI supplemented with 5% horse serum as previously described.20
Emergent
trypomastigotes were harvested daily and examined by light microscopy to determine the
percentages of trypomastigotes. The parasite cells (5 x 10⁸) were harvested by centrifugation at
3,000 x g for 15 min at room temperature, washed three times with ice-cold PBS buffer, and
subjected to fractionation.
Membrane Enrichment

77
Membrane proteins were enriched using the sucrose cushion method as previously described
with minor modifications.21
Briefly cells were suspended in 3 mL of ice-cold lysis buffer (10
mM HEPES, 1 mM EDTA, pH 7.2) containing protease inhibitors and then homogenized by 25
strokes of a 7 mL Dounce homogenizer. An equal amount of sucrose buffer (10 mM HEPES,
1mM EDTA, 500 mM sucrose, pH 7.2) was added with additional 25 strokes of homogenizer.
The samples were centrifuged at 6,000 x g for 10 min at 4 C to pellet cellular debris. The
supernatant was collected and centrifuged at 150,000 x g for 1 hour at 4 C. Supernatant was
removed and the crude pellet membrane was incubated in 100 mM sodium carbonate solution
(pH 11.3) for 15 min at 4 C. After incubation, the membrane pellet was collected by centrifuging
at 150,000 x g for 1 hour at 4 C. Additional wash was performed by incubating the membrane
pellet in same ice-cold lysis buffer containing 1% Triton X-100.
1-D Gel Electrophoresis and in-gel Digestion
Crude membrane pellet was resuspended in 20 l Laemmli buffer (Sigma-Aldrich) and boiled at
80 C for 15 min. Solublized proteins were separated by 1-D SDS-PAGE using NuPAGE 4-12%
Bis-Tris (Invitrogen) gradient gels at 150 V for 2 hours. Gel lanes were washed twice in ddH2O
for 15 min and then cut into 30 slices. Proteins were reduced by incubating the gel bands in 10
mM DTT/100 mM Ambic (ammonium bicarbonate) solution at 56 C for 1 h. Then the proteins
were carboxyamidomethylated with 55 mM iodoacetamide/100 mM Ambic for 1 h at room
temperature in the dark. Enzymatic digestion was performed by adding sequencing grade porcine
trypsin (1:50, Promega, Madison, WI) and incubated at 37 C overnight. The tryptic peptides
were extracted three times with 200 l of ACN/water (1:1) solution. Combined extracts were
completely dried in speed vacuum, resuspended in 50 l of 0.1% formic acid and then stored at -
20 C, before analysis by MS.
78
LC-MS/MS Analysis
The peptide samples obtained from proteolytic digestion were analyzed on an Agilent 1100
capillary LC (Palo Alto, CA) interfaced directly to a LTQ linear ion trap mass spectrometer
(Thermo Fisher, San Jose, CA). Mobile phases A and B were H2O-0.1% formic acid and
acetonitrile-0.1% formic acid, respectively. The peptide samples were loaded for 50 min using
positive N2 pressure on a PicoFrit 8-cm by 50-μm column (New Objective, Woburn, MA)
packed with 5-μm-diameter C18 beads. Peptides were eluted from the column into the mass
spectrometer during a 90 min linear gradient from 5 to 60% of total solution composed of mobile
phase B at a flow rate of 200 nl min−1
. The instrument was set to acquire MS/MS spectra on the
nine most abundant precursor ions from each MS scan with a repeat count of 1 and repeat
duration of 5 s. Dynamic exclusion was enabled for 200 s. Raw tandem mass spectra were
converted into the mzXML format and then into peak lists using ReAdW software followed by
mzMXL2Other software.22
The peak lists were then searched using Mascot 2.2 (Matrix Science,
Boston, MA) and X!Tandem (version 2.2) softwares.
Database Searching and Protein Identification
A target database was created using the 42288 annotated sequences obtained from the National
Center for Biotechnology Information (www.ncbi.nih.gov). A decoy database (decoy) was then
constructed by reversing the sequences in the normal database. Searches were performed against
the normal and decoy databases using the following parameters: fully tryptic enzymatic cleavage
with two possible missed cleavages, peptide tolerance of 800 ppm, fragment ion tolerance of 0.6
Da. Fixed modification was set as carbamidomethyl due to carboxyamidomethylation of cysteine
residues (+57 Da) and variable modifications were chosen as oxidation of methionine residues
(+16 Da), deamidation of asparagine residues (+1 Da), Gln to Pyro-Glu (-17 Da) and Glu to
79
Pyro-Glu (-18 Da). Statistically significant proteins from both searches were determined at a 1%
protein false discovery rate (FDR) using the ProValT algorithm, as implemented in ProteoIQ
(BioInquire, LLC, Athens, GA). 23
In ProteoIQ, database search results were grouped according
to gel bands. This allowed protein within groups to be resolved based on comparing
experimental and theoretical molecular weights in our GeLCMS approach.
RESULTS AND DISCUSSION
Membrane Protein Preparation
T. cruzi cell surface membrane proteins account for the largest portion of protein families within
the whole genome. In order to resolve the problem of protein families’ identification, we have to
effectively perform a membrane proteomics of T. cruzi; in the meanwhile, the membrane
proteins coated on the parasite surfaces usually play very important roles in host cell entry and
immune evasion. Proteomic studies on these protein families could help us understand the nature
of parasites invasion and survival mechanisms and explore the way for vaccine and drug
development. Although with the significant importance, there have been limited proteomic
studies specifically targeting these membrane protein expressions in T. cruzi24,25
, especially on
the mammalian trypomastigote and amastigote stages.26
Most previous proteomic studies on T.
cruzi were more focused on easily prepared insect stage epimastigote24,25,27
and used whole cell
analysis without any enrichment.8,10,18,28-30
Those global proteomic analyses inevitably missed a
large number of membrane proteins since the cytoplasm soluble proteins dominated the
identifications because of their relatively high abundance. Our lab’s previous results also indicate
the epimastigote proteome expresses less surface membrane proteins than trypomastigote stage.8
Compared to the soluble proteins, membrane proteins are usually of low abundance, high
hydrophobicity and basic isoelectric points, thus making the isolation and identification to be a

80
challenging task. In our strategy for enriching the membrane fractions, we utilized the commonly
used sucrose cushion method to reduce the amount of highly abundant cytosol proteins and
cytoskeletal proteins, such as alpha tubulin, beta tubulin, etc. Meanwhile, identification of trans-
sialidase and several other surface membrane proteins would attract more of our interest since
they are the largest protein families presented on the parasite surface and proposed to be
potential targets for vaccine development. Unlike normal embedded integral membrane proteins,
they are linked to the plasma membrane via a C-terminal glycosylphosphatidylinositol (GPI)
anchor. Recent studies have shown that those GPI anchored proteins usually reside on some
specific membrane domains, which are called “lipid rafts”. The rafts are mainly composed of
sphingolipid and cholesterol. Sphingolipid contains long, largely saturated acyl chains allowing
them to pack tightly together and form a liquid-ordered state.31-34
This rigid tight structure has
been claimed to be resistant to some non-ionic detergent such as Triton X-100 at low
temperatures. Upon treatment with Triton X-100 at 4 C, Membranes other than the “lipid raft”
regions will be disrupted and release the embedded proteins. Based on this information, we
introduced Triton X-100 in our preparation at 4 C trying to enrich and observe more GPI
anchored proteins like trans-sialidase and mucins, etc. Enriched membrane protein fractions were
analyzed using GeLC-MS/MS approach for isoforms’ identification. Briefly the membrane
pellets were first dissolved using Laemmli buffer that contain 4% SDS and then separated by 1-
D SDS-PAGE gel electrophoresis (Figure 5.1). After separation, the gel lanes were sliced into 30
fractions and then those fractions were subjected to in-gel trypsin digestion. All the individual
fractions were analyzed through on-line LC-MS/MS using LTQ ion trap. Resulting spectra were
searched against both Mascot and X!Tandem followed by validation using ProteoIQ at maximum
1% FDR.
81
Protein Identification
There were total 1029 protein groups containing 4996 total proteins identified at a maximum 1%
protein false discovery rate. The combination search engine of Mascot and X!Tandem seems to
be very useful since each one of them can have some uniquely identified high confident peptides.
Together with other jointly identified peptides, this combination searching approach has
effectively increased the protein coverage, which is very helpful for our protein isoforms’
differentiation. For example the trans-sialidase protein AAP80764.1 was identified by 28
peptides using Mascot and 27 peptides using X!Tandem, among which 25 peptides are shared.
Our cell surface membrane enrichment strategy looks efficient with the identification of 57 trans-
sialidase protein groups and several other surface membrane proteins such as GP63, TolT and
MASP etc, which shows great enrichment compared to all previous global analysis. Viewing
from the top 50 protein groups, although some regular high abundant proteins like beta tubulin,
alpha tubulin and heat shock protein were still present, but there were around 8 membrane
proteins including 5 trans-sialidases identified. In the list, the top one trans-sialidase is the tenth
most abundant protein, and there were other two trans-sialidases detected in the top 20 abundant
proteins. While in Atwood’s whole cell trypomastigote proteome study, the most abundant trans-
sialidase was only ranked as No 284, and there were only 8 trans-sialidase proteins among the
top 400 groups.8 These comparisons apparently indicate after membrane extraction, the
membrane proteins especially the GPI anchored cell surface proteins were largely enriched and
some of the very low abundant membrane proteins previously ignored could now be detected.
This enrichment is also supported by the fact that several high abundant cytosolic soluble
proteins in the whole cell trypomastigote proteome were highly depleted in our preparation
method and could be barely identified in our experiment. Those proteins include the 9th most

82
abundant protein NADH:flavin oxidoreductase/NADH oxidase, the 22th most abundant protein
thiol-dependent reductase, and several other proteins in top 50 identifications in Atwood’s
trypomastigote proteome.8
Resolving the Important Protein Families
T. cruzi trypomastigote is the life stage that circulates in the host blood stream and performs the
cell invasion function. During this process the host immune system will respond to them
immediately and rely on some antigen-specific T cells and antibodies to kill the pathogens. One
of the major strategies for T. cruzi to escape the host immune response is that they can express
several large members of surface antigen proteins. Trans-sialidase is one of the most important
surface protein families for T. cruzi. This large protein family is encoded by more than 1300
genes. T. cruzi is unable to synthesize sialic acid itself so it relies on trans-sialidase to transfer
the sialic acid from host sialoglycoconjugates onto terminal galactose residues on its surface
mucin molecules. The sialiation of surface glycoproteins will both prevent complement
activation and increase the infectivity. Thus the trans-sialidase proteins are critical for parasite
survival and potentially to be the vaccine target. However, among those hundreds of trans-
sialidases, only a small number of them have enzymatic activity. Expressing together with those
active trans-sialidase enzymes, the large number of non-enzymatic family members could deflect
the immune response from the real targets and mislead the T cell responses by offering their
altered peptides. Several other immunodominant genes also express large number of isoforms on
the cell surface. The second largest family is MASP with close to 1300 genes, Mucins have 817
gene products and GP63 gets around 403 genes. Besides these surface membrane proteins, genes
like retrotransposon hot spot (RHS) protein, heat shock proteins, ribosomal proteins, etc also
have large number of members in their gene families (Table 5.1). Within the significant

83
importance, while the identification of these protein families is always difficult and challenging
task because typically proteins from the same family have very similar structure, function and
peptide sequence. For example in our case, many identified trans-sialidases shared some high
frequently detected peptides like FAGVGGGALWPVSQQGQNQR,
HQWQPIYGSTPVTPTGSWETGK and LLGLSYDEK, etc. Without additional information, we
can only assign the above shared peptides to the same protein group and it is hard to decide
which specific protein or several proteins are correctly identified. This could explain although we
had 57 identified trans-sialidase groups, within these groups there were total 612 trans-sialidase
genes. The first straightforward way we used to differentiate these protein isoforms among
different groups was to find out some specific unique peptides. Taking trans-sialidase as
example, in our identification we identified 57 trans-sialidase and among them there were 28
defined as unique ones because they have the unique peptides only expressed in one protein
group and not in all other 56 trans-sialidase groups. Trans-sialidase EAN94054.1 has shared
peptides GMSADGCSDPSVVEWK and VKEVLATWK with several other trans-sialidases such
as EAN88146.1, EAN89851.1, and AAG32026.1 etc, but the peptide DTTGDETVSSLR is not
belonged to any of those trans-sialidase sequences, thus it can be uniquely assigned to trans-
sialidase EAN94054.1 group. Using this way, we can differentiate some protein isoforms even
they share some peptides. In our proteomic identification, several trans-sialidase proteins could
even be recognized with 5or 6 unique peptides. Although some of them only got one unique
peptide, while that peptide makes it become the unique one in the whole 1300 trans-sialidase
genes from the database so those proteins were believed to be identified with high confidence
even having only one peptide evidence. In addition to trans-sialidase protein families, we also
detected several other important membrane protein groups such as surface protein TolT, MASP,
84
and gp63 proteins with their respective unique peptides. Unlike the trans-sialidase the
identification numbers of these cell surface proteins were relatively lower especially for MASP
we only found one. This result suggested the true expression level for these proteins might not be
as high abundant as trans-sialidases although their gene families are also large. The other
possibility is because the high dense glycosylation makes them undesirable to be detected by
regular LC-MS/MS approach.
GeLCMS Approach to Resolve Protein Isoforms’ Identification
Proteins having unique peptides can be categorized into different protein groups, while within
the same protein group; some of these peptides will become shared. The protein that accounted
for all the peptides within a protein group was thought as “TOP Protein”, if more than one
proteins had all peptides in the group, the one with higher sequence coverage was considered as
“TOP”. Protein assignments listed as “OTHER Protein” contained a subset of peptides that were
observed in the “TOP” identification but could not be distinguished as unique proteins because
of shared peptide representation. This was particularly common for large gene families. The
largest trans-sialidase protein group in our list even contains 89 members, the “TOP Protein” has
4 peptides and considered as the most significant one in this group. However, it does not mean
all the others in the group were not identified, it just simply means that the peptides identified for
them don’t allow them to be distinguished from others in the group and they have less sequence
coverage than the “TOP Protein”. It is difficult to know whether several or all of the members in
a protein group are expressed or not unless we find some other useful information to differentiate
them. Herein we utilized the GeLC-MS/MS approach trying to resolve the protein isoforms’
identification problem by combining protein molecular weight information and protein grouping
in ProteoIQ’s data clustering validation. In our experiments, the gel lane was manually cut into
85
30 bands from top to bottom and named from band01 (top band) to band30 (bottom band), each
band was performed in-gel tryptic digestion and analyzed using LC-MS/MS. Those generated
band fraction spectrum files were searched individually against both Mascot and X!Tandem. In
ProteoIQ validation and clustering process, the database search results were grouped according
to gel band; in such way we could not only find out which proteins those identified peptides
belong to, but also get the idea of the real molecular weight range for the proteins digested to
those identified peptides. Compared to those unresolved protein’s theoretical molecular weight,
we can then be aware of which protein is more likely to be expressed. The 25% trimmed average
mass of all identified proteins in one gel band was chosen to show the protein mass distribution
for the 30 gel slices. As shown in Figure 5.2 the general trend of the protein molecular weight on
the gel was desirable. In general the average protein mass got smaller for lower gel bands, which
was in agreement with the actual gel electrophoresis experiment. Some of the unexpected points
were due to protein aggregation, complex formation, undetected PTMs and degradation during
the preparation. Especially, some small proteins such as histones, tubulins etc were very easy to
form complex, which made them also be detected in most high molecular weight gel bands.
Since protein groups having unique peptides can be clearly distinguished by each other, we first
validate the feasibility of our GeLC approach on those protein groups as a template. Heat shock
protein EAN99073.1 (MW 84K) and EAN86069.1 (MW 38K) are both belong to heat shock
protein families that are involved in protein folding and intracellular trafficking functions. We
identified three peptides with the sequence of DTELSFCTPQVCER, EELAENLGTIAGSGSK
and QLLDIVACSLYTEK which are shared by these two proteins. At the same time we found
five unique peptides (FISGAYDSPMFR, LHYVVDAPLSIR, MVENVPEPTADK,
SDIDYPLVSLEEYR, YNFHFNPK) for EAN99073.1 and two unique ones
86
(ELQSAASGAQAAEK, GYLWESDGTGTFK) for EAN86069.1. The unique peptides of
EAN99073.1 were generated from gel band 12-13 which contained most of the proteins having
an approximate MW range of 70K-80K, which was in agreement with the MW of 84k for heat
shock protein EAN99073.1. As for the other heat shock protein EAN86069.1, its unique peptide
ELQSAASGAQAAEK was obtained from gel band 28 which falls into the protein MW range of
30K-40K. It gave us the evidence this peptide was coming from the 38K heat shock protein.
Additionally because it is unique to EAN86069.1, it excludes the possibility of protein
degradation from other proteins. This has verified the feasibility of our GeLC-MS/MS approach.
Although these two protein isoforms contain similar sequences, we can still differentiate them
with the molecular weight information (Figure 5.3). We also applied this processing method for
our concerned trans-sialidase proteins. Trans-sialidase protein EAN87032.1 (MW 50K) and
EAN96545.1 (MW 108K) share the identified peptide VYESVDMGK, while we also identified
several unique peptides for both of them. And most of these unique peptides were falling into the
proper MW range on the gel. In Gel band 8 with an approximate MW range of 90K-100K we
found peptide GTDIITATIGSK which is the unique sequence of EAN96545.1. Unique peptide
LLIVTSGSVIPQLLR was identified to EAN87032.1, and the source file of this peptide was
shown in band 17 which majorly contained 50K-60K proteins.
After we have established that the molecular weight information on the gel can be applied in the
protein isoform’s differentiation, we could then use this processing method to resolve some
protein isoforms without proper unique peptides. For example Peptides LLVRPLDGPLVVPR,
GRPVVGVINYNPR, GIEGGPPMLPPMRNPAAPGGR and CPLFSDVCLTMLK were
identified to a GP63 protein group. In this group, protein EAN84769.1 contains all these peptides
and has the best sequence coverage thus ranked as “TOP Protein”. Besides this one, there are
87
several “Other Proteins” in this group we also believe their expression according to our
GeLCMS information. For instance, two small GP63 proteins EAN84143.1 and EAN81541.1
have protein MW for 37K and 30K, most of the MS/MS spectra for identified peptides
LLVRPLDGPLVVPR and GRPVVGVINYNPR were obtained from gel band 21 and 22 with a
proper MW range of 40K-50K range. Furthermore, these two peptides are part of the sequence
from those two proteins. This has suggested these “Other proteins” within this single group in
our assignment are also likely to be expressed. Similar examples were also found for some other
protein groups. Trans-sialidase AAP80764.1 (MW 95K) was assigned as “TOP Protein” and it
contains 30 peptides, most of which were obtained from band 7 and 8. In this group
EAN86623.1 (MW 36K) got 2 peptides from band 26 and 1 peptide from band 23 which all
indicated this protein being most likely expressed as well. While for another small trans-sialidase
EAN82031.1 (MW 22K) in this group, all its identified peptides were coming from band 7-9,
which couldn’t make us believe this protein to be really detected in our experiment.
CONCLUSION
In conclusion, we demonstrated a GeLC-MS/MS approach to resolve protein isoforms based on
combining shotgun proteomic results with molecular weight information and protein grouping. A
membrane proteomic study of T. cruzi trypomastigotes provided a unique set of large protein
family members to assess the feasibility of this approach. The ability of resolving these
important surface membrane protein families provides us the useful information about the
identification for some potential vaccine targets. We anticipate that this approach will find
applicability in the proteomic analyses of other organisms and will assist in resolving protein
groups arising from redundant database entries.
88
REFERENCES
(1) World Health Organ Tech Rep Ser 2002, 905, i.
(2) Cubillos-Garzon, L. A.; Casas, J. P.; Morillo, C. A.; Bautista, L. E. Am Heart J
2004, 147, 412.
(3) Urbina, J. A. Curr Pharm Des 2002, 8, 287.
(4) Costa, F.; Franchin, G.; Pereira-Chioccola, V. L.; Ribeirao, M.; Schenkman, S.;
Rodrigues, M. M. Vaccine 1998, 16, 768.
(5) Wizel, B.; Garg, N.; Tarleton, R. L. Infect Immun 1998, 66, 5073.
(6) Planelles, L.; Thomas, M. C.; Alonso, C.; Lopez, M. C. Infect Immun 2001, 69,
6558.
(7) El-Sayed, N. M.; Myler, P. J.; Bartholomeu, D. C.; Nilsson, D.; Aggarwal, G.;
Tran, A. N.; Ghedin, E.; Worthey, E. A.; Delcher, A. L.; Blandin, G.; Westenberger, S. J.; Caler,
E.; Cerqueira, G. C.; Branche, C.; Haas, B.; Anupama, A.; Arner, E.; Aslund, L.; Attipoe, P.;
Bontempi, E.; Bringaud, F.; Burton, P.; Cadag, E.; Campbell, D. A.; Carrington, M.; Crabtree, J.;
Darban, H.; da Silveira, J. F.; de Jong, P.; Edwards, K.; Englund, P. T.; Fazelina, G.; Feldblyum,
T.; Ferella, M.; Frasch, A. C.; Gull, K.; Horn, D.; Hou, L.; Huang, Y.; Kindlund, E.; Klingbeil,
M.; Kluge, S.; Koo, H.; Lacerda, D.; Levin, M. J.; Lorenzi, H.; Louie, T.; Machado, C. R.;
McCulloch, R.; McKenna, A.; Mizuno, Y.; Mottram, J. C.; Nelson, S.; Ochaya, S.; Osoegawa,
K.; Pai, G.; Parsons, M.; Pentony, M.; Pettersson, U.; Pop, M.; Ramirez, J. L.; Rinta, J.;
Robertson, L.; Salzberg, S. L.; Sanchez, D. O.; Seyler, A.; Sharma, R.; Shetty, J.; Simpson, A. J.;
Sisk, E.; Tammi, M. T.; Tarleton, R.; Teixeira, S.; Van Aken, S.; Vogt, C.; Ward, P. N.;
Wickstead, B.; Wortman, J.; White, O.; Fraser, C. M.; Stuart, K. D.; Andersson, B. Science 2005,
309, 409.
89
(8) Atwood, J. A., 3rd; Weatherly, D. B.; Minning, T. A.; Bundy, B.; Cavola, C.;
Opperdoes, F. R.; Orlando, R.; Tarleton, R. L. Science 2005, 309, 473.
(9) Cuervo, P.; Domont, G. B.; De Jesus, J. B. J Proteomics, 73, 845.
(10) Paba, J.; Santana, J. M.; Teixeira, A. R.; Fontes, W.; Sousa, M. V.; Ricart, C. A.
Proteomics 2004, 4, 1052.
(11) Link, A. J.; Eng, J.; Schieltz, D. M.; Carmack, E.; Mize, G. J.; Morris, D. R.;
Garvik, B. M.; Yates, J. R., 3rd Nat Biotechnol 1999, 17, 676.
(12) Wolters, D. A.; Washburn, M. P.; Yates, J. R., 3rd Anal Chem 2001, 73, 5683.
(13) Yates, J. R., 3rd J Mass Spectrom 1998, 33, 1.
(14) Fralish, B. H.; Tarleton, R. L. Vaccine 2003, 21, 3070.
(15) Frasch, A. C. Parasitol Today 2000, 16, 282.
(16) Martin, D. L.; Weatherly, D. B.; Laucella, S. A.; Cabinian, M. A.; Crim, M. T.;
Sullivan, S.; Heiges, M.; Craven, S. H.; Rosenberg, C. S.; Collins, M. H.; Sette, A.; Postan, M.;
Tarleton, R. L. PLoS Pathog 2006, 2, e77.
(17) Schirle, M.; Heurtier, M. A.; Kuster, B. Mol Cell Proteomics 2003, 2, 1297.
(18) Paba, J.; Ricart, C. A.; Fontes, W.; Santana, J. M.; Teixeira, A. R.; Marchese, J.;
Williamson, B.; Hunt, T.; Karger, B. L.; Sousa, M. V. J Proteome Res 2004, 3, 517.
(19) Shevchenko, A.; Wilm, M.; Vorm, O.; Mann, M. Anal Chem 1996, 68, 850.
(20) Piras, R.; Piras, M. M.; Henriquez, D. Mol Biochem Parasitol 1982, 6, 83.
(21) Seyfried, N. T.; Huysentruyt, L. C.; Atwood, J. A., 3rd; Xia, Q.; Seyfried, T. N.;
Orlando, R. Cancer Lett 2008, 263, 243.
(22) Pedrioli, P. G.; Eng, J. K.; Hubley, R.; Vogelzang, M.; Deutsch, E. W.; Raught,
B.; Pratt, B.; Nilsson, E.; Angeletti, R. H.; Apweiler, R.; Cheung, K.; Costello, C. E.;
90
Hermjakob, H.; Huang, S.; Julian, R. K.; Kapp, E.; McComb, M. E.; Oliver, S. G.; Omenn, G.;
Paton, N. W.; Simpson, R.; Smith, R.; Taylor, C. F.; Zhu, W.; Aebersold, R. Nat Biotechnol
2004, 22, 1459.
(23) Weatherly, D. B.; Atwood, J. A., 3rd; Minning, T. A.; Cavola, C.; Tarleton, R. L.;
Orlando, R. Mol Cell Proteomics 2005, 4, 762.
(24) Cordero, E. M.; Nakayasu, E. S.; Gentil, L. G.; Yoshida, N.; Almeida, I. C.; da
Silveira, J. F. J Proteome Res 2009, 8, 3642.
(25) Ferella, M.; Nilsson, D.; Darban, H.; Rodrigues, C.; Bontempi, E. J.; Docampo,
R.; Andersson, B. Proteomics 2008.
(26) Atwood, J. A., 3rd; Minning, T.; Ludolf, F.; Nuccio, A.; Weatherly, D. B.;
Alvarez-Manilla, G.; Tarleton, R.; Orlando, R. J Proteome Res 2006, 5, 3376.
(27) Sant'Anna, C.; Nakayasu, E. S.; Pereira, M. G.; Lourenco, D.; de Souza, W.;
Almeida, I. C.; Cunha, E. S. N. L. Proteomics 2009, 9, 1782.
(28) Parodi-Talice, A.; Duran, R.; Arrambide, N.; Prieto, V.; Pineyro, M. D.; Pritsch,
O.; Cayota, A.; Cervenansky, C.; Robello, C. Int J Parasitol 2004, 34, 881.
(29) Sodre, C. L.; Chapeaurouge, A. D.; Kalume, D. E.; de Mendonca Lima, L.;
Perales, J.; Fernandes, O. Arch Microbiol 2009, 191, 177.
(30) Parodi-Talice, A.; Monteiro-Goes, V.; Arrambide, N.; Avila, A. R.; Duran, R.;
Correa, A.; Dallagiovanna, B.; Cayota, A.; Krieger, M.; Goldenberg, S.; Robello, C. J Mass
Spectrom 2007, 42, 1422.
(31) Simons, K.; Ikonen, E. Nature 1997, 387, 569.
(32) Foster, L. J.; De Hoog, C. L.; Mann, M. Proc Natl Acad Sci U S A 2003, 100,
5813.

91
(33) Pike, L. J. J Lipid Res 2003, 44, 655.
(34) Pike, L. J. Biochem J 2004, 378, 281.

92
Table 5.1. Identified large gene families in the membrane preparation
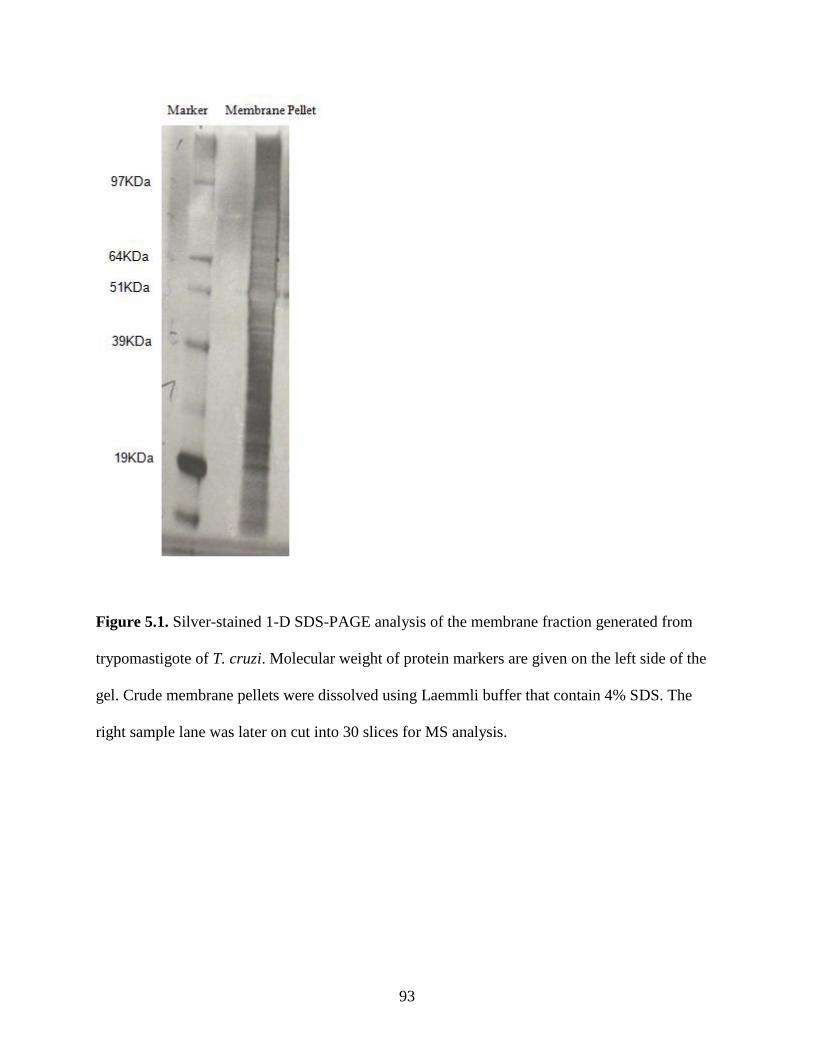
93
Figure 5.1. Silver-stained 1-D SDS-PAGE analysis of the membrane fraction generated from
trypomastigote of T. cruzi. Molecular weight of protein markers are given on the left side of the
gel. Crude membrane pellets were dissolved using Laemmli buffer that contain 4% SDS. The
right sample lane was later on cut into 30 slices for MS analysis.
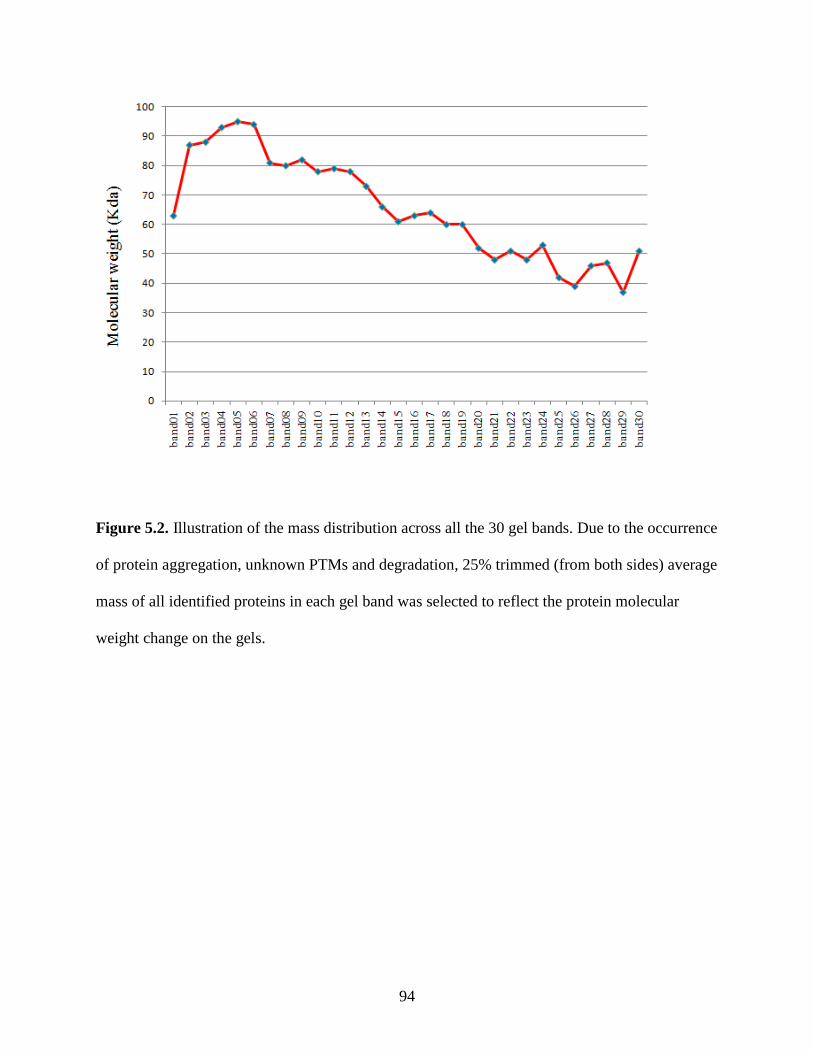
94
Figure 5.2. Illustration of the mass distribution across all the 30 gel bands. Due to the occurrence
of protein aggregation, unknown PTMs and degradation, 25% trimmed (from both sides) average
mass of all identified proteins in each gel band was selected to reflect the protein molecular
weight change on the gels.
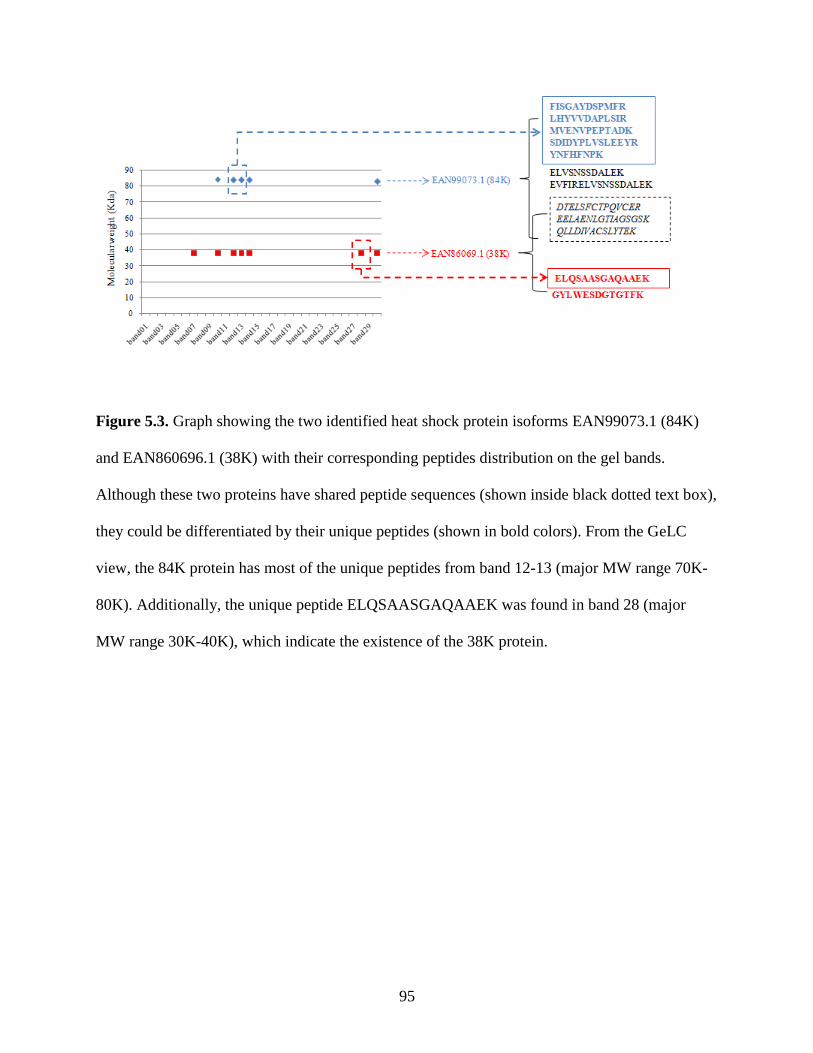
95
Figure 5.3. Graph showing the two identified heat shock protein isoforms EAN99073.1 (84K)
and EAN860696.1 (38K) with their corresponding peptides distribution on the gel bands.
Although these two proteins have shared peptide sequences (shown inside black dotted text box),
they could be differentiated by their unique peptides (shown in bold colors). From the GeLC
view, the 84K protein has most of the unique peptides from band 12-13 (major MW range 70K-
80K). Additionally, the unique peptide ELQSAASGAQAAEK was found in band 28 (major
MW range 30K-40K), which indicate the existence of the 38K protein.
96
CHAPTER 6
GELC-MS/MS ANALYSIS ON EMBRYONIC STEM CELL PROTEIN DEGRADATION1
_____________________________________________________________________ 1 Xiang Zhu, Matt Bechard, Stephen Dalton, Ron Orlando. To be submitted to Journal of
Biomolecular Techniques.

97
ABSTRACT
1D In-gel tryptic digestion followed by LC-MS/MS analysis known as GeLC-MS/MS is a
technically simple but powerful approach for proteomic analysis. Here we report the application
of GeLC-MS/MS technique to analyze the mouse embryonic stem cell proteome and focus on
looking for some potential protein degradation products. Our identification data has shown that
this approach is efficient and helpful for discovering the protein degradation process, which
plays essential roles in biological cellular functions and activities.
98
INTRODUCTION
GeLC-MS/MS approach has been proven to be a powerful and efficient technique to analyze
complex protein mixtures.1,2
It is a combination of 1D gel electrophoresis protein separation and
on-line LC-MS/MS analysis of in-gel digested peptides for protein identification. Compared to
the gel-free shotgun proteomic methods such as MudPIT3,4
, this technique provides several
important advantages. First, slicing the gel lane into 20-30 small bands separates the protein
mixtures into narrow molecular weight range, which significantly increase the dynamic depth of
the analysis. Because the generated in-gel digested peptides from each gel band are analyzed
separately, some of the low abundant proteins could also be identified as long as their molecular
weight is not close to the high abundant proteins in the complex protein mixture. While for gel-
free digestion, tryptic peptides from the high abundant proteins could be detected across most of
the fractions, making some low abundant ones ignored. Second, for most mass spectrometry
experiments especially ESI, detergents and buffer salts always make negative effects and it's not
very easy to remove them during gel-free preparation. The situation could be even worse with
the membrane proteins since they have to get dissolved in certain concentration of the detergent
before digestion. On the other hand, higher concentration of the detergent will deactivate the
trypsin, thus making the analysis results unsatisfied. The gel based approach will easily wash out
the detergents and salts before digestion, making the analysis especially the membrane proteome
identification more high-throughput.5
Another important feature of the GeLC-MS/MS technique is that it can not only identify the
peptides from the MS/MS spectra, but also track the original gel bands for these peptides on the
gel lane. Combining the results of both spectra identification and corresponding molecular
weight range, we can explore some more detailed information about our identified proteins and

99
better understand the system biological process. For example, protein isoforms usually contain
very similar sequences with some shared peptides. If there are no unique peptides, MudPIT
shotgun proteomics can only assign these shared peptides to certain protein groups and it is
impossible to decide which specific protein or several proteins in this group might be truly
identified. However, GeLC-MS/MS technique can tell us the real molecular weight range for the
proteins digested to those identified peptides. Compared to the protein’s theoretical molecular
weight, we can then be aware of which protein in the family is more likely to be expressed. The
other potential application for GeLC-MS/MS proteomic approach is that we can utilize this
method to look for some possible protein degradation products. Protein degradation especially
the proteasomal degradation pathway has attracted many interests these years.6-9
One of the most
important degradation pathway identified in recent years is the discovery of the ubiquitin
proteasome system (UPS) which regulates the degradation of intracellular proteins in
eukaryotes.6,8,10-12
The UPS mediated protein degradation is associated with a number of
biological processes such as intracellular signaling, cell division, gene transcription etc. More
importantly, the aberrations in the degradation pathways are often associated with many human
diseases such as cystic fibrosis, emphysema, Alzheimer disease, and Parkinson disease etc.13-21
Effective targeting and control of the degradation pathways could bring the potential new
treatment method to these diseases. Recently, the ubiquitin mediated protein degradation process
has also been studied in the embryonic stem cell system.22,23
Embryonic stem (ES) cells are the
pluripotent stem cells derived from the early embryos.24-26
They are capable of self-renewal and
differentiating into any types of adult cells.27-29
Because of the pluripotency and self-renewal
capability, ES cells have been proposed to be the ideal system for regenerative medicine and
tissue replacement. In order to apply the ES cells into treatment of the diseases and medical

100
tissue transplantation, studies on factors regulating the cell differentiation is critically important.
Octamer-binding transcription factor 4 (OCT4) is an essential transcription factor for regulating
stem cell differentiation process.30-34
Researchers have found that certain E3 ubiquitin-protein
ligase can interact with OCT4 and regulate degradation of OCT4 through the 26S
proteasome.22,23
These findings indicate using OCT4 ubiquitin ligase-targeting drugs may be
applicable to direct the stem cell differentiation. System biology using genomic and proteomic
approaches could largely contribute to the understanding of the protein degradation process. In
this paper, the GeLC-MS/MS technique was utilized as a simple and efficient method to evaluate
some protein degradation process in an embryonic stem cell system. The identified peptides from
all gel bands were first matched to their derived proteins. Then the theoretical molecular weight
of these proteins was compared with the actual molecular weight range on the 1D gel. When the
protein is expressed on a gel band with a much lower molecular weight than the theoretical one,
it could be a potential evidence for the protein degradation. Our method revealed a number of
protein degradation products which are not desirable to be identified in gel-free shotgun
proteomic approach.
MATERIALS AND METHODS
Cell Culture and Sample Preparation
R1 ES cells were cultured in the absence of feeders on tissue culture grade plastic-ware pre-
coated with 0.1% gelatin-phosphate buffered saline (PBS), as described previously.25,35
ES cell
culture medium consisted of Dulbecco's Modified Eagle Medium (DMEM, Gibco BRL)
supplemented with 10% foetal calf serum (FCS, Commonwealth Serum Laboratories), 1 mM L-
glutamine, 0.1 mM 2-mercaptoethanol, 100 U/ml penicillin, 100 U/ml streptomycin and 1000
U/ml recombinant human LIF (ESGRO) at 37°C under 10% CO2. Protein samples were prepared
101
as previously described with minor modifications.36
Briefly cells were suspended in 3 mL of ice-
cold lysis buffer (10 mM HEPES, 1 mM EDTA, pH 7.2) containing protease inhibitors and then
homogenized by 25 strokes of a 7 mL Dounce homogenizer. An equal amount of sucrose buffer
(10 mM HEPES, 1mM EDTA, 500 mM sucrose, pH 7.2) was added with additional 25 strokes of
homogenizer. The samples were centrifuged at 6,000 x g for 10 min at 4 C to pellet cellular
debris. The supernatant was collected and centrifuged at 150,000 x g for 1 hour at 4 C. Protein
pellets were collected and stored at -80°C for further preparation.
1-D Gel Electrophoresis and in-gel Digestion
Protein pellet was resuspended in 20 l Laemmli buffer (Sigma-Aldrich) and boiled at 80 C for
15 min. Solublized proteins were separated by 1-D SDS-PAGE using NuPAGE 4-12% Bis-Tris
(Invitrogen) gradient gels at 150 V for 2 hours. Gel lanes were washed twice in ddH2O for 15
min and then cut into 25 slices. Proteins were reduced by incubating the gel bands in 10 mM
DTT/100 mM ammonium bicarbonate (Ambic) solution at 56 C for 1 h. Then the proteins were
carboxyamidomethylated with 55 mM iodoacetamide/100 mM Ambic for 1 h at room
temperature in the dark. Enzymatic digestion was performed by adding sequencing grade porcine
trypsin (1:50, Promega, Madison, WI) and incubated at 37 C overnight. The tryptic peptides
were extracted three times with 200 l of ACN/water (1:1) solution. Combined extracts were
completely dried in speed vacuum, resuspended in 50 l of 0.1% formic acid and then stored at -
20 C, before analysis by MS.
LC-MS/MS Analysis
The peptide samples obtained from proteolytic digestion were analyzed on an Agilent 1100
capillary LC (Palo Alto, CA) interfaced directly to a LTQ linear ion trap mass spectrometer
(Thermo Fisher, San Jose, CA). Mobile phases A and B were H2O-0.1% formic acid and
102
acetonitrile-0.1% formic acid, respectively. Peptides were eluted from the C18 column into the
mass spectrometer during a 60 min linear gradient from 5 to 60% mobile phase B at a flow rate
of 4 l/min. The instrument was set to acquire MS/MS spectra on the nine most abundant
precursor ions from each MS scan with a repeat count of 1 and repeat duration of 5 s. Dynamic
exclusion was enabled for 200 s. Generated raw tandem mass spectra were converted into the
mzXML format and then into peak lists using ReAdW software followed by mzMXL2Other
software.37
The peak lists were then searched using Mascot 2.2 (Matrix Science, Boston, MA).
Database Searching and Protein Identification
A target database was created using the 56729 annotated sequences obtained from the mouse
protein database in International Protein Index (IPI, version 3.68, European Bioinformatics
Institute, www.ebi.ac.uk/IPI/). A decoy database (decoy) was then constructed by reversing the
sequences in the normal database. Searches were performed against the normal and decoy
databases using the following parameters: fully tryptic enzymatic cleavage with two possible
missed cleavages, peptide tolerance of 1000 ppm, fragment ion tolerance of 0.6 Da. Fixed
modification was set as carbamidomethyl due to carboxyamidomethylation of cysteine residues
(+57 Da) and variable modifications were chosen as oxidation of methionine residues (+16 Da)
and deamidation of asparagine residues (+1 Da). Statistically significant proteins from both
searches were determined at a ≤1% protein false discovery rate (FDR) using the ProValT
algorithm, as implemented in ProteoIQ (BioInquire, LLC, Athens, GA).38
In ProteoIQ, database
search results were grouped according to gel bands. This allowed protein identifiaction
expression pattern to be viewed easily on individual gel band in our GeLC-MS/MS approach.
RESULTS AND DISCUSSION
Proteome Analysis based on GeLC-MS/MS Strategy

103
Around 1 x 10⁶
embryonic stem cells (ES) from the R1 mouse stem cell line were analyzed as a
model for protein expression and potential protein degradation studies in evaluation of our
GeLC-MS/MS technique. A simple 1D SDS PAGE gel separation was performed prior to mass
spectrometry analysis (Figure 6.1). The gel lane was equally cut into 25 gel bands and those
fractions were subjected to in-gel trypsin digestion. Peptide mixtures in each individual fraction
were further separated through a RPLC chromatography and analyzed using MS/MS technique
by LTQ for spectrum identification. To validate the confidence in peptide spectrum
identification, tandem mass spectra were searched against a target and reversed mouse database
using the Mascot search algorithm. Results from the Mascot search were then processed using
ProteoIQ to cluster non-redundant peptides from all fractions to protein identification at a ≤1%
false discovery rate (FDR). Proteins were further grouped according to homology of identified
peptides. For each homology group, the protein that accounted for all the peptides within a
protein group was thought as “TOP Protein”, if more than one proteins had all peptides in the
group, the one with higher sequence coverage was considered as “TOP”. Protein assignments
listed as “OTHER Protein” contained a subset of peptides that were observed in the “TOP”
identification but could not be distinguished as unique proteins because of shared peptide
representation. Overall, our analysis resulted in a total identification of 781 proteins (202 protein
groups) from the embryonic stem cells. Some of the gene products were claimed to be ES-
specific genes according to a recent comparative study on transcriptional profiling of mouse
embryonic, hematopoietic and neural stem cells.39,40
For example, mago-nashi homolog
(IPI00132692.2) is a nucleus protein involved in mRNA splicing and participates in the
nonsense-mediated decay (NMD) pathway. This gene was detected only in embryonic stem cells
but not available in other types of the stem cells and was defined as ES-specific gene.39,40
Solute

104
carrier family 2 (IPI00134191.3) is another important ES-specific gene found in our experiment.
It's located mostly in cell membrane and has a basic function of glucose transportation. Defects
in this gene can cause the blood-brain barrier glucose transport defect disease.41
Some other ES-
specific genes detected in our experiment include Catenin alpha-1 (IPI00112963.1),
CCAAT/enhancer-binding protein (IPI00752710.1), and Nidogen-2 (IPI129903.1), etc. The
GeLC-MS/MS approach has shown here a diverse range of the identified gene products in terms
of the protein size. The smallest identified protein in our analysis is a mitochondrial membrane
protein ATP synthase subunit E (IPI00111770.7), which only has a molecular weight of 8K Da.
While ataxia telangiectasia and rad3 related protein (IPI00123119.4) which is also known as a
serine/threonine protein kinase has a molecular weight up to 300K Da. From the ProteoIQ
generated 2D virtual gel (Figure 6.2), we can also see that the theoretical isoelectric point was
distributed through 4.11 (Heat shock protein 90K Da alpha, IPI00830977.2) to 12.65 (6K Da
protein, IPI00831580.1) across all the identified proteins. The large dynamic range of the
characterized proteins was also proved by the identification of a number of membrane proteins.
Searching with TMHMM 2.0, our data has shown that 14% of the identified proteins had at least
one trans-membrane domain and 47 proteins were verified to contain more than one trans-
membrane domain. Protein cationic amino acid transporter 5 (IPI00346772.7) even got 13 such
domains in the whole sequence. Under gel-free conditions, these proteins are very hard to be
dissolved and efficiently digested, hence will become more difficult for identification.
GeLCMS Approach to Reveal Possible Protein Degradation Process
Many cellular processes are associated with protein degradation specifically through the
ubiquitin-proteasome pathway, which is controlled with some highly specific enzymes including
the ubiquitin-activating enzyme E1, ubiquitin-conjugating enzyme E2 and E3 ubiquitin-protein

105
ligase. The E3 ubiquitin ligase plays a crucial role in the degradation process since it has the
function of targeting specific protein substrates for degradation by the 26S proteasome complex.
Recent study has shown that some E3 ubiquitin ligase may regulate the OCT4 protein expression
level in ES cells, which will further affect the stem cell differentiation.22
Utilizing the GeLC-
MS/MS approach, this type of ubiquitin ligase (IPI00118376.1) was successfully detected in our
experiment and it could be used as a reference to indicate the existence of protein degradation
process in the embryonic stem cells. Besides the diverse protein identification, the GeLC-
MS/MS technique also offered an easy way to reveal some protein degradation products.
Initially, the gel lane was approximately equally cut into 25 bands from top to bottom and named
from band01 (top band) to band25 (bottom band). Protein mixtures in each band were digested
and resulting peptides were analyzed using LC-MS/MS. Those generated band fraction spectrum
files were searched individually against Mascot. In ProteoIQ validation and clustering process,
the database search results were grouped according to gel band; in such way we could not only
find out which proteins those identified peptides belong to, but also have the idea of the real
molecular weight range for the proteins digested to those identified peptides. From comparison,
we could then be aware of which protein might get involved in the degradation process if it
showed a significantly lower molecular weight from the gel than the theoretical molecular
weight. In order to reflect the actual protein mass distribution over the total 25 gel slices, we
calculated the 25% trimmed average mass of all identified proteins in each gel band and used
them to see the molecular weight pattern on the gel. The reason for using 25% trimmed average
was because it could give a more statistically satisfied estimate of central tendency since the
protein degradation, post translational modifications were being considered. Some experimental
contamination and mistakes were also inevitable, which made this statistical measurement more
106
acceptable. As shown in Figure 6.3 the general trend of the protein molecular weight on the gel
was desirable. For the first 19 bands on the gel lane, the average protein mass was generally
decreasing from top to the bottom, which was in agreement with the actual gel electrophoresis
experiment. The last few bands' molecular weight were observed in a reverse trend and indicated
some proteins in these low molecular weight gel bands actually had a relatively higher molecular
weight thus made the average mass of the corresponding band increased. This could be explained
that some of the degradation products were expressed in these fractions. Serum albumin
(IPI00131695.3) is one of the abundant proteins identified in our experiment. The major function
of this protein is to regulate the colloidal osmotic pressure of blood. Degradation of the serum
albumin protein was observed in tumor-bearing mice so studies on this protein's degradation
could have essential medical significance.42
We have identified several peptides of this protein
from gel band 7 and 8, which contained most of the proteins having an approximate MW range
of 50K-70K. In general, this is in agreement with the theoretical MW of 69K Da of serum
albumin protein. At the same time, there were some other serum albumin peptides detected in
lower gel bands, such as band 21, 22 which felled into the protein MW range of 30K-40K Da.
Identification of this protein in two different MW range was most likely caused by the protein
degradation. Figure 6.4 showed the MS/MS spectra of the identified peptide
LGEYGFQNAILVR from gel band 22 as an example, this peptide is more close to the C-
terminal region which indicates a possible C-terminal protein degradation product of serum
albumin. The region specific degradation detection by GeLC-MS/MS could be used as a
reference for some further detailed degradation studies, such as using antibodies to target specific
region of the protein. Ataxia telangiectasia and rad3 related protein (IPI00123119.4) is an
enzyme that activates cell cycle checkpoints and responds to DNA damage. It is the largest

107
protein identified in our list with a MW of 300K Da. Peptides matching to this protein were all
observed in band 19 and 20, which should be enriched with 30K-40K Da proteins. This
observation should also indicate that this identified protein was from the degraded products. The
explanation of not finding the non-degradation products is probably due to the relative low
expression of this gene in our preparation. Hypothetical protein LOC239673 (IPI00222228.5)
gave another example for the detection of protein degradation products. This hypothetical protein
has a MW of 58K Da and was identified by three different peptides in our GeLC-MS/MS
method. Peptide LALDIEIATYR and SLNLDSIIAEVK were both detected in band 5, 6 which
should contain this 58K Da protein in full sequence. They were also shown to be expressed in
low MW bands like 19, 22 etc which belong to the degraded products. While the other peptide
FLEQQNKVLETK was only found in small MW gel bands such as 18, 20 so this peptide could
come from the degradation part of this protein as well. Some of the MS/MS spectra examples of
these two proteins' degradation peptides were also shown in Figure 6.4.
CONCLUSION
In summary, we have demonstrated the utility of GeLC-MS/MS technique for the proteomic
analysis of embryonic stem cells and the application as a simple approach to identify the protein
degradation products. Compared to 2D gel and gel-free MudPIT method, this technique requires
less separation, facilitates the overall process and increases the dynamic range of the identified
protein mixtures. More importantly, combining the proteomic identification and MW
information of protein expression on the gel make this technique able to reveal some protein
degradation process, which is not feasible in gel-free shotgun proteomics. More comprehensive
studies on the ES cell protein degradation products and related pathways could make valuable
contribution to the development of stem cell differentiation researches.
108
REFERENCES
(1) Shevchenko, A.; Wilm, M.; Vorm, O.; Mann, M. Anal Chem 1996, 68, 850-8.
(2) Shevchenko, A.; Tomas, H.; Havlis, J.; Olsen, J. V.; Mann, M. Nat Protoc 2006,
1, 2856-60.
(3) Link, A. J.; Eng, J.; Schieltz, D. M.; Carmack, E.; Mize, G. J.; Morris, D. R.;
Garvik, B. M.; Yates, J. R., 3rd Nat Biotechnol 1999, 17, 676-82.
(4) Wolters, D. A.; Washburn, M. P.; Yates, J. R., 3rd Anal Chem 2001, 73, 5683-90.
(5) Wilm, M.; Shevchenko, A.; Houthaeve, T.; Breit, S.; Schweigerer, L.; Fotsis, T.;
Mann, M. Nature 1996, 379, 466-9.
(6) Ciechanover, A. EMBO J 1998, 17, 7151-60.
(7) Conaway, R. C.; Brower, C. S.; Conaway, J. W. Science 2002, 296, 1254-8.
(8) Glickman, M. H.; Ciechanover, A. Physiol Rev 2002, 82, 373-428.
(9) Mayer, R. J. Nat Rev Mol Cell Biol 2000, 1, 145-8.
(10) Goldberg, A. L. Neuron 2005, 45, 339-44.
(11) Naujokat, C.; Hoffmann, S. Lab Invest 2002, 82, 965-80.
(12) Wilkinson, K. D. Cell 2004, 119, 741-5.
(13) Chen, Y.; Bellamy, W. P.; Seabra, M. C.; Field, M. C.; Ali, B. R. Hum Mol Genet
2005, 14, 2559-69.
(14) Chiba, T.; Tanaka, K. Rinsho Shinkeigaku 2005, 45, 976-8.
(15) Goldberg, A. L. Nature 2003, 426, 895-9.
(16) Kostova, Z.; Wolf, D. H. EMBO J 2003, 22, 2309-17.
(17) McCracken, A. A.; Brodsky, J. L. Bioessays 2003, 25, 868-77.
(18) Reinstein, E.; Ciechanover, A. Ann Intern Med 2006, 145, 676-84.
109
(19) Tanaka, K.; Suzuki, T.; Chiba, T.; Shimura, H.; Hattori, N.; Mizuno, Y. J Mol
Med 2001, 79, 482-94.
(20) Tanaka, K.; Suzuki, T.; Hattori, N.; Mizuno, Y. Biochim Biophys Acta 2004,
1695, 235-47.
(21) Ciechanover, A.; Brundin, P. Neuron 2003, 40, 427-46.
(22) Xu, H.; Wang, W.; Li, C.; Yu, H.; Yang, A.; Wang, B.; Jin, Y. Cell Res 2009, 19,
561-73.
(23) Xu, H. M.; Liao, B.; Zhang, Q. J.; Wang, B. B.; Li, H.; Zhong, X. M.; Sheng, H.
Z.; Zhao, Y. X.; Zhao, Y. M.; Jin, Y. J Biol Chem 2004, 279, 23495-503.
(24) Martin, G. R. Proc Natl Acad Sci U S A 1981, 78, 7634-8.
(25) Nagy, A.; Rossant, J.; Nagy, R.; Abramow-Newerly, W.; Roder, J. C. Proc Natl
Acad Sci U S A 1993, 90, 8424-8.
(26) Evans, M. J.; Kaufman, M. H. Nature 1981, 292, 154-6.
(27) Keller, G. Genes Dev 2005, 19, 1129-55.
(28) Reubinoff, B. E.; Pera, M. F.; Fong, C. Y.; Trounson, A.; Bongso, A. Nat
Biotechnol 2000, 18, 399-404.
(29) Rathjen, J.; Rathjen, P. D. Curr Opin Genet Dev 2001, 11, 587-94.
(30) Scholer, H. R.; Dressler, G. R.; Balling, R.; Rohdewohld, H.; Gruss, P. EMBO J
1990, 9, 2185-95.
(31) Rosner, M. H.; Vigano, M. A.; Ozato, K.; Timmons, P. M.; Poirier, F.; Rigby, P.
W.; Staudt, L. M. Nature 1990, 345, 686-92.
(32) Okamoto, K.; Okazawa, H.; Okuda, A.; Sakai, M.; Muramatsu, M.; Hamada, H.
Cell 1990, 60, 461-72.
110
(33) Niwa, H.; Miyazaki, J.; Smith, A. G. Nat Genet 2000, 24, 372-6.
(34) Nichols, J.; Zevnik, B.; Anastassiadis, K.; Niwa, H.; Klewe-Nebenius, D.;
Chambers, I.; Scholer, H.; Smith, A. Cell 1998, 95, 379-91.
(35) Rathjen, J.; Lake, J. A.; Bettess, M. D.; Washington, J. M.; Chapman, G.;
Rathjen, P. D. J Cell Sci 1999, 112 ( Pt 5), 601-12.
(36) Seyfried, N. T.; Huysentruyt, L. C.; Atwood, J. A., 3rd; Xia, Q.; Seyfried, T. N.;
Orlando, R. Cancer Lett 2008, 263, 243-52.
(37) Pedrioli, P. G.; Eng, J. K.; Hubley, R.; Vogelzang, M.; Deutsch, E. W.; Raught,
B.; Pratt, B.; Nilsson, E.; Angeletti, R. H.; Apweiler, R.; Cheung, K.; Costello, C. E.;
Hermjakob, H.; Huang, S.; Julian, R. K.; Kapp, E.; McComb, M. E.; Oliver, S. G.; Omenn, G.;
Paton, N. W.; Simpson, R.; Smith, R.; Taylor, C. F.; Zhu, W.; Aebersold, R. Nat Biotechnol
2004, 22, 1459-66.
(38) Weatherly, D. B.; Atwood, J. A., 3rd; Minning, T. A.; Cavola, C.; Tarleton, R. L.;
Orlando, R. Mol Cell Proteomics 2005, 4, 762-72.
(39) Nagano, K.; Taoka, M.; Yamauchi, Y.; Itagaki, C.; Shinkawa, T.; Nunomura, K.;
Okamura, N.; Takahashi, N.; Izumi, T.; Isobe, T. Proteomics 2005, 5, 1346-61.
(40) Ramalho-Santos, M.; Yoon, S.; Matsuzaki, Y.; Mulligan, R. C.; Melton, D. A.
Science 2002, 298, 597-600.
(41) Hediger, M. A.; Romero, M. F.; Peng, J. B.; Rolfs, A.; Takanaga, H.; Bruford, E.
A. Pflugers Arch 2004, 447, 465-8.
(42) Andersson, C.; Iresjo, B. M.; Lundholm, K. J Surg Res 1991, 50, 156-62.
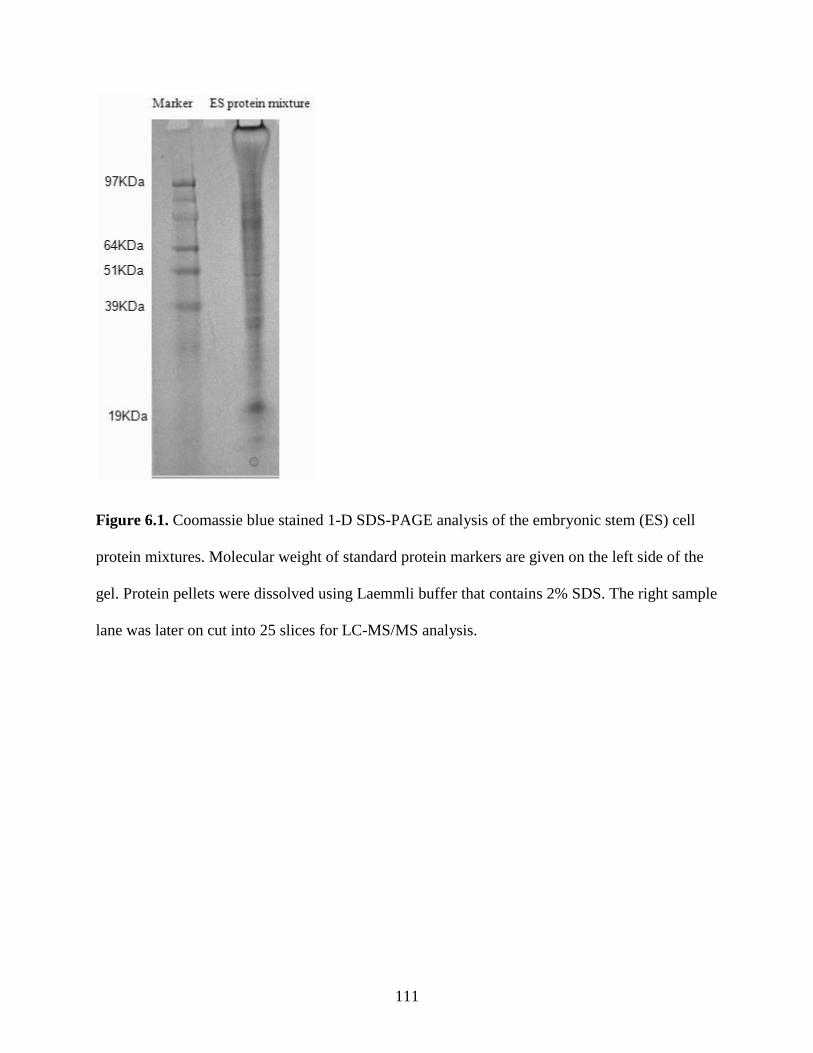
111
Figure 6.1. Coomassie blue stained 1-D SDS-PAGE analysis of the embryonic stem (ES) cell
protein mixtures. Molecular weight of standard protein markers are given on the left side of the
gel. Protein pellets were dissolved using Laemmli buffer that contains 2% SDS. The right sample
lane was later on cut into 25 slices for LC-MS/MS analysis.
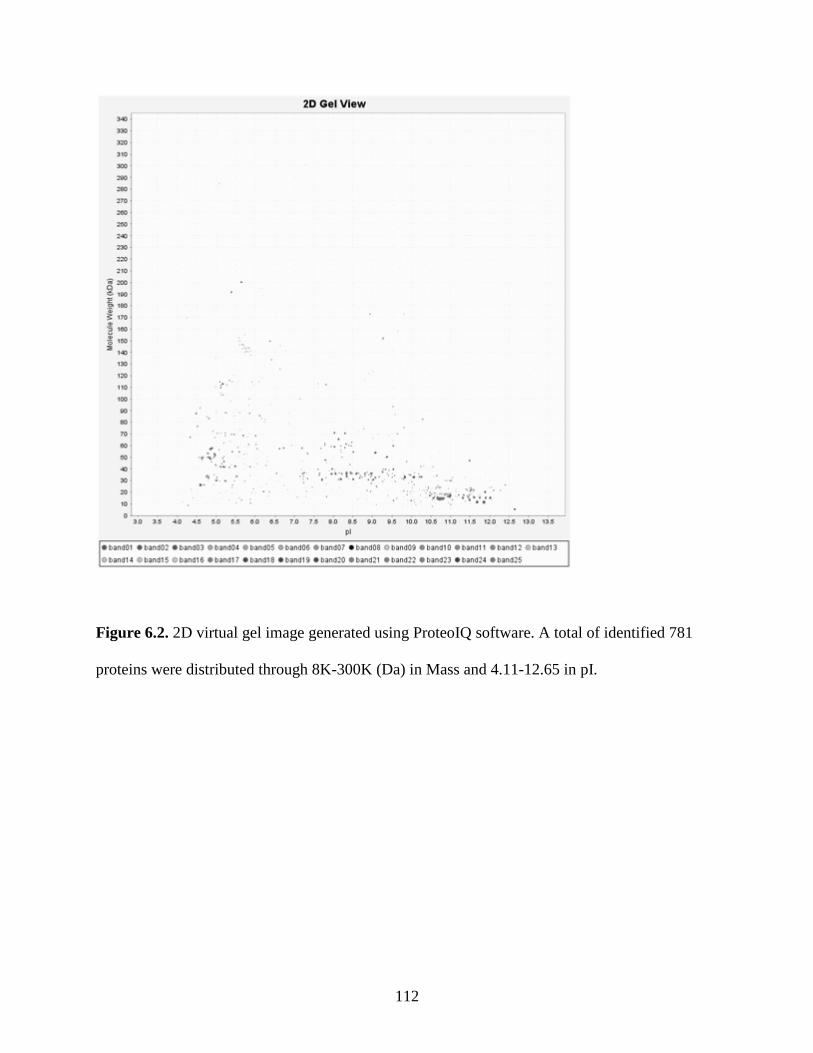
112
Figure 6.2. 2D virtual gel image generated using ProteoIQ software. A total of identified 781
proteins were distributed through 8K-300K (Da) in Mass and 4.11-12.65 in pI.

113
Figure 6.3. Mass distribution across all the 25 gel bands. Due to the consideration of protein
aggregation, unknown PTMs, degradation and possible contaminants, 25% trimmed (from both
sides) average mass of all identified proteins in each individual gel band was selected to reflect
the protein molecular weight change on the gels.
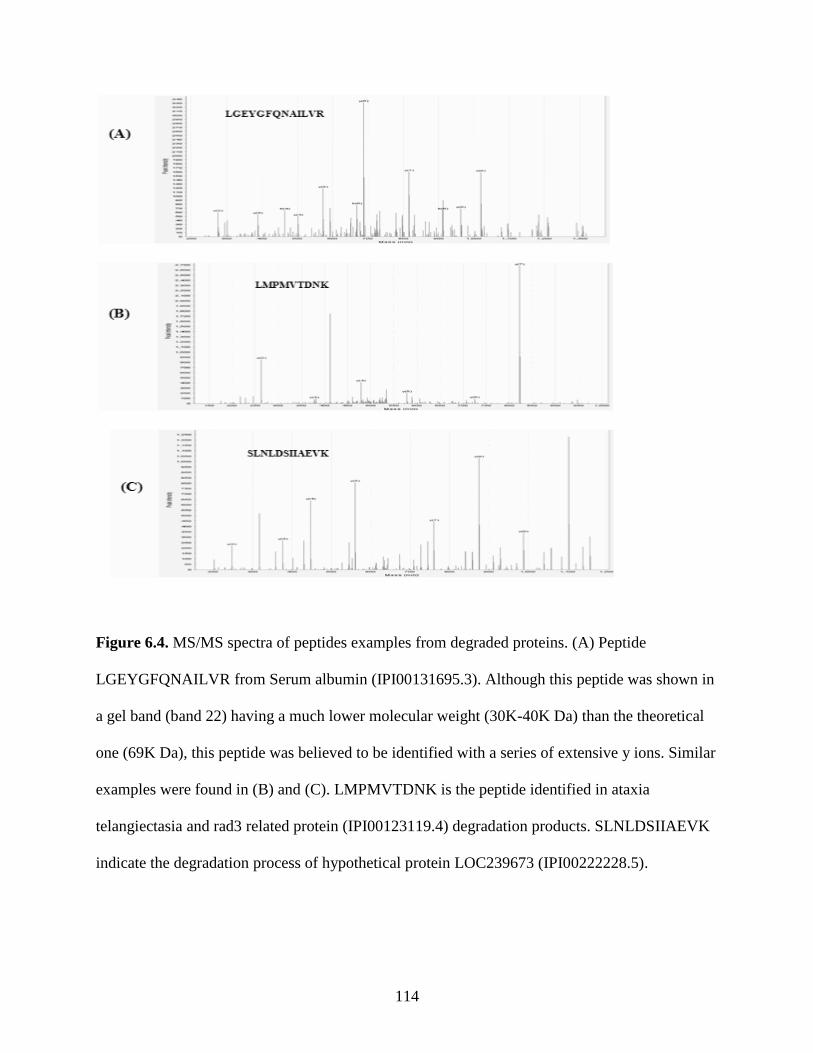
114
Figure 6.4. MS/MS spectra of peptides examples from degraded proteins. (A) Peptide
LGEYGFQNAILVR from Serum albumin (IPI00131695.3). Although this peptide was shown in
a gel band (band 22) having a much lower molecular weight (30K-40K Da) than the theoretical
one (69K Da), this peptide was believed to be identified with a series of extensive y ions. Similar
examples were found in (B) and (C). LMPMVTDNK is the peptide identified in ataxia
telangiectasia and rad3 related protein (IPI00123119.4) degradation products. SLNLDSIIAEVK
indicate the degradation process of hypothetical protein LOC239673 (IPI00222228.5).
115
CHAPTER 7
CONCLUSIONS
The overall purpose of this work was to develop and apply methods for comprehensive
proteomic analysis with the goal to identify low abundant gene products and resolve protein
isoforms and degradation products.
Chapter 3: The membrane subproteome of T. cruzi was investigated using two different
methods. There were a total of 551 protein groups identified, 38% of which are membrane
proteins. Among them, some important cell surface genes were verified for their expression, such
as trans-sialidase, MASP, Mucins, GP63, etc. These GPI anchored surface proteins are involved
in parasite survival and cell invasions and are studied as potential vaccine targets. Both
membrane preparation methods were proven to be efficient. The sucrose cushion method
depleted more soluble proteins, while the detergent resistant method seemed to enrich more GPI
anchored proteins. A combination of these two methods was applied for further membrane
enrichment (project in Chapter 5).
Chapter 4: The membrane and organelle enrichment method was applied to analyze the T.
cruzi intracellular amastigote proteome. In order to recover identifications other than the
annotated genes, the whole genome ORFs search and ByOnic mutation search were also
performed. There were total of 2490 proteins within 890 protein groups identified in this
experiment. 14% of them were never detected in all four life stages of T. cruzi and 19% of the
identified proteins were not shown in previous amastigote proteome data. The data processing
method of incorporating ORFs and mutation search largely increased the identification coverage.
116
This is the first proteomic analysis of T. cruzi intracellular amastigote stage and novel protein
identifications could be potentially contributed to the knowledge of this parasite system biology
and future vaccine selections.
Chapter 5: We report that GeLC-MS/MS technique can be effectively applied to
differentiate protein isoforms, which is particularly important for T. cruzi. We identified 1029
protein groups from the plasma membrane enriched fractions. The identification includes some
important gene products participating the parasite invasion and survival process. While most of
those genes are expressed as protein families, which are difficult to be differentiated. The GeLC-
MS/MS approach not only provides a dynamic range of identification, but also contributes to
differentiate some previously unresolved protein isoforms through combining the molecular
weight information, unique peptides, and methods of protein grouping.
Chapter 6: The GeLC-MS/MS approach was also utilized to evaluate some protein
degradation process in an embryonic stem cell system. The identified peptides from all gel slices
were first clustered to their derived proteins. Then the theoretical molecular weight of these
proteins was compared with the actual molecular weight range calculated from the 1D gel. When
the protein is discovered on a gel band with a much lower molecular weight than the theoretical
one, it could be thought as a potential evidence for the protein degradation. Further studies on the
ES cell protein degradation products and pathways could make valuable contribution to the stem
cell differentiation researches.