XANES Measurements and - CARScars9.uchicago.edu/xafs_school/APS_2005/Bare_XANES.pdf · XANES...
51
EXAFS Data Collection and Analysis Course, APS, July 26-29, 2005 © 2005 UOP LLC All Rights Reserved Page 1 XANES Measurements and Interpretation Simon R. Bare UOP LLC, Des Plaines, IL [email protected]
Transcript of XANES Measurements and - CARScars9.uchicago.edu/xafs_school/APS_2005/Bare_XANES.pdf · XANES...

EXAFS Data Collection and Analysis Course, APS, July 26-29, 2005 © 2005 UOP LLC All Rights Reserved
Page 1
XANES Measurements and Interpretation
Simon R. Bare
UOP LLC, Des Plaines, IL

EXAFS Data Collection and Analysis Course, APS, July 26-29, 2005 © 2005 UOP LLC All Rights Reserved
Page 2
Acronyms
XANES
• X-ray Absorption Near Edge Structure
NEXAFS
• Near-Edge X-ray Absorption Fine Structure
The two acronyms should be interchangeable but over the years NEXAFS has become terminology for “low Z” elements - C, N, O...

EXAFS Data Collection and Analysis Course, APS, July 26-29, 2005 © 2005 UOP LLC All Rights Reserved
Page 3
What Is XANES?
AB
SO
RP
TIO
N
214002120021000208002060020400202002000019800
PHOTON ENERGY (eV)
XANESEXAFS
X-ray absorption spectrum of molybdenum metal from 19.8 to 21.5 keV
• XANES is region of x-ray absorption spectrum within ~50eV of the absorption edge.

EXAFS Data Collection and Analysis Course, APS, July 26-29, 2005 © 2005 UOP LLC All Rights Reserved
Page 4
What Is XANES?
-20 0 20 40 60 80 100 120Photon Energy (E-E0)
0
1
Nor
mal
ized
Abs
orpt
ion
(X-ray absorption spectrum of Ti K-edge of Ba2TiO4)
XANES= Pre-edge + Edge + XANES

EXAFS Data Collection and Analysis Course, APS, July 26-29, 2005 © 2005 UOP LLC All Rights Reserved
Page 5
W L3-edge XANES of tungsate, [WO4]2-
“White line”
• In years past x-ray absorption spectra were taken with use of photographic plates.
• Absorption edges appeared as unexposed bands on the plate (developed in negative), or “white lines”.
• Very prominent for L-edges of transition metals in high oxidation states.

EXAFS Data Collection and Analysis Course, APS, July 26-29, 2005 © 2005 UOP LLC All Rights Reserved
Page 6
Number of “XANES” Publications
0
100
200
300
400
500
600
Num
ber o
f Pub
licat
ions
1993 1995 1997 1999 2001 2003 2005
Year
• On average ~500 publications per year in SciFinder!

EXAFS Data Collection and Analysis Course, APS, July 26-29, 2005 © 2005 UOP LLC All Rights Reserved
Page 7
Representative Publications (2005)• Interactions of uranium with bacteria and kaolinite clay. Chemical
Geology (2005), 220(3-4), 237-243.• Synthesis, structure, spectroscopy and redox chemistry of square-planar
nickel(II) complexes with tetradentate o-phenylenedioxamidates and related ligands. Dalton Transactions (2005), (15), 2516-2526.
• In situ investigations of structure-activity relationships of a Cu/ZrO2catalyst for the steam reforming of methanol. Journal of Catalysis (2005), 233(2), 297-307.
• Variations in atmospheric sulphate recorded in stalagmites by synchrotron micro-XRF and XANES analyses. Earth and Planetary Science Letters (2005), 235(3-4), 729-740.
• Crystal-Quasicrystal Local Structural Transition in Al-Cu-Fe. JETP Letters (2005), 81(9), 479-483.
• Protective Action of Vanadate at Defected Areas of Organic Coatings on Zinc. Journal of the Electrochemical Society (2005), 152(7), B220-B227.

EXAFS Data Collection and Analysis Course, APS, July 26-29, 2005 © 2005 UOP LLC All Rights Reserved
Page 8
Ba2TiO4
K2TiSi3O9
Why Are We Interested In XANES? Local Coordination Environment
Both Ti4+
Ba2TiO4
K2TiSi3O9
• Ti K-edge XANES shows dramatic dependence on the local coordination chemistry.

EXAFS Data Collection and Analysis Course, APS, July 26-29, 2005 © 2005 UOP LLC All Rights Reserved
Page 9
Why Are We Interested In XANES? Oxidation State
MnO Mn2O3 MnO2
4.0
3.5
3.0
2.5
2.0
Mn
vale
nce
6552655065486546
Mn K-edge Energy, eV
• Many edges of many elements show significant edge shifts (binding energy shifts) with oxidation state.
• First observation was by Berengren for phosphorus in 1920*!*See “A history of X-ray absorption fine structure”, R. Stumm von Bordwehr, Ann. Phys. Fr. 14 (1989) 377-466)

EXAFS Data Collection and Analysis Course, APS, July 26-29, 2005 © 2005 UOP LLC All Rights Reserved
Page 10
What Is XANES and Why Are We Interested?XANES is strongly sensitive to the chemistry (formal oxidation state and geometry) of the absorbing atom.
Region Transitions Information Content
Pre-edge Features caused byelectronic transitions toempty bound states.Transition probabilitycontrolled by dipolarselection rules.
Local geometry around absorbing atom.Dependence on oxidation state and bondingcharacteristics (chemical shift).
Edge Defines ionizationthreshold to continuumstates.
Dependence on oxidation state (chemicalshift), main edge shifts to higher energy withincreased oxidation state. (As much as 5 eVper one unit change).
XANES Features dominated bymultiple-scatteringresonances of thephotoelectrons ejected atlow kinetic energy. Largescattering cross section.
Atomic position of neighbors: interatomicdistances and bond angles. Multiplescattering dominates but ab initiocalculations providing accessible insight (e.g.FEFF8).

EXAFS Data Collection and Analysis Course, APS, July 26-29, 2005 © 2005 UOP LLC All Rights Reserved
Page 11
XANES Transitions• XANES directly probes the angular momentum of the
unoccupied electronic states: these may be bound or unbound, discrete or broad, atomic or molecular.
• Dipole selection rules apply*: ∆l = ±1, ∆j = ±1, ∆s = 0.
• Primary transition will be:
• s → p for K (1s core electron) and L1 (2s core electron initial state) edges
• p → d for L2 (2p½) and L3 (2p3/2) edges
• But…..final state usually not atomic-like and may have mixing (hybridization) with other orbitals. This is often the interesting part of the XANES!
* Some transitions are true quadrupolar transitions. These are usually very weak.

EXAFS Data Collection and Analysis Course, APS, July 26-29, 2005 © 2005 UOP LLC All Rights Reserved
Page 12
XANES Interpretation• The EXAFS equation breaks down at low-k, which complicates
XANES interpretation.
• We do not have a simple equation for XANES.
XANES can be described qualitatively (and nearly quantitatively) in terms of:
coordination chemistry regular, distorted octahedral, tetrahedral…
molecular orbitals p-d hybridization, crystal field theory
band structure the density of available occupied electronic states
multiple scattering multiple bounces of the photoelectron
• These chemical and physical interpretations are all related:
What electronic states can the photoelectron fill?

EXAFS Data Collection and Analysis Course, APS, July 26-29, 2005 © 2005 UOP LLC All Rights Reserved
Page 13
Advantages of XANES vs. EXAFS• Spectra simpler to measure than EXAFS: features intense, concentrated
in small energy region.
• Weak temperature dependence (Debye-Waller), so spectra can be recorded at reaction temperature (in situ):
• Exp(-2k2σ2) = exp(-2(0.5)2 x 0.005) ~ 1• Faster to measure than full spectrum: <msec demonstrated.
• Sensitive to chemical information: valence, charge transfer.
• Probes unoccupied electronic states: important in chemistry.
• Often used as simple “fingerprint” to identify presence of a particular chemical species.
• Beamlines with micro-probe capabilities can also scan energy and obtain XANES spectra with elemental distribution.

EXAFS Data Collection and Analysis Course, APS, July 26-29, 2005 © 2005 UOP LLC All Rights Reserved
Page 14
XANES Analysis: Oxidation StateSulfur
• Sulfur K-edge XANES used to identify and quantify the form of sulfur in heavy petroleum, coals, soils etc.
• 11 eV edge shift from S2- to S6+.
• Spectra of S in similar environments similar: thiophene, benzothiophene.
• Can be used as fingerprint.
Reference: George and Gorbaty, J. Am. Chem. Soc. 101 (1979) 3182

EXAFS Data Collection and Analysis Course, APS, July 26-29, 2005 © 2005 UOP LLC All Rights Reserved
Page 15
XANES Analysis: Oxidation StateSulfur
12
10
8
6
4
2
0
Nor
mal
ized
Abs
orpt
ion
2.4902.4852.4802.4752.4702.465
Photon Energy, keV
Sulfide Thiophene Sulfoxide Sulfone Sulfate
2,479.0
2,476.4
2,473.0
2,471.22,470.6
Dodecyl sulfide, thiophene, tetramethylene sulfoxide, tetramethylene sulfone, sulfate(aq)
Sulfur type Formal oxidation state
Sulfide 2- Thiophene 1+ Sulfoxide 2+ Sulfone 4+ Sulfate 6+

EXAFS Data Collection and Analysis Course, APS, July 26-29, 2005 © 2005 UOP LLC All Rights Reserved
Page 16
XANES Analysis: Oxidation StateMany, many examples in the literature…...
Mo K-edgeV K-edge
Ref: Cramer et al., JACS, 98 (1976) 1287
Ref: Wong et al., Phys Rev. B 30 (1984) 5596
Re L3-edge
10.5345
10.535
10.5355
10.536
10.5365
10.537
10.5375
10.538
10.5385
10.539
0 2 4 6 8
Re Oxidation State
Re
L3 e
dge
Ener
gy (k
eV)

EXAFS Data Collection and Analysis Course, APS, July 26-29, 2005 © 2005 UOP LLC All Rights Reserved
Page 17
XANES Analysis: Oxidation State
1.0
2.0
3.0
4.0
5.0
6.0
0.0
10 20 30 400 M
o av
erag
e va
lenc
e Mo K edge, (eV)
MoO2
MoO3
Mo4O11
Mo8O23
Mo18O52
Mo5O14
Mo
0.5
1.0
19.95 20 20.05 20.1 20.15
Nor
mal
ized
abs
orpt
ion
Photon energy, (keV)
1.0
2.0
3.0
19.95 20 20.05 20.1 20.15
Nor
mal
ized
abs
orpt
ion
Photon energy, (keV)
MoO2
MoO3
Mo4O11
Mo8O23
Mo18O52
Mo5O14
Mo K-edge XANES of Mo oxides
• Linear fit of Mo valence with K-edge position only obtained using a feature above the absorption edge!
T. Ressler et al. J. Cat 210 (2002) 67

EXAFS Data Collection and Analysis Course, APS, July 26-29, 2005 © 2005 UOP LLC All Rights Reserved
Page 18
Metal K-edge XANES
• Intense edge absorption due to dipole allowed s → p transition (∆l = ±1).
• Weaker pre-edge feature results from mixing of 3d-4p orbitals of suitable symmetry (or from quadrupolar allowed transition – ~2 orders magnitude weaker).

EXAFS Data Collection and Analysis Course, APS, July 26-29, 2005 © 2005 UOP LLC All Rights Reserved
Page 19
s→ d
Molybdenum Oxides
(NH4)6Mo7O24
Octahedral coordination
Na2MoO4
Tetrahedral coordination
Mo K-edge XANES
• Both nominally +6 oxidation state, but different XANES spectra.
• Edge shift – different degree of covalency of the Mo.
• Pre-edge peak much larger for tetrahedral coordination.

EXAFS Data Collection and Analysis Course, APS, July 26-29, 2005 © 2005 UOP LLC All Rights Reserved
Page 20
Transition Metal K-edge Pre-edge Peaks
Pure octahedral case
Centro-symmetric: no p-d mixing allowed; only quadrupolar transitions – very low intensity
Distortion from octahedral
p-d mixing allowed: dipole transition in pre-edge – increasingly larger intensity.
Pure tetrahedral
Largest pre-edge intensity.

EXAFS Data Collection and Analysis Course, APS, July 26-29, 2005 © 2005 UOP LLC All Rights Reserved
Page 21
-20 -10 0 10 20 30 40 50
Photon Energy (E-E0) eV
0.0
0.5
1.0
1.5N
orm
aliz
ed A
bsor
ptio
n
Ti_refs1.axg
Ti K-edge XANES: Reference Compounds
E0 = 4966.0 eV
Anatase - 6 coordinate
Fresnoite -5 coordinate
Barium orthotitanate -4 coordinate
1s → 3d
• Symmetry around absorbing atom strongly affects pre-edge transition: ability to differentiate 4, 5, 6-fold coordination.
Local Site Symmetry in Ti-containing Compounds
Anatase
3d split by mixing with O2p into t2g and eglike orbitals.
3rd peak is quadrupolar in nature

EXAFS Data Collection and Analysis Course, APS, July 26-29, 2005 © 2005 UOP LLC All Rights Reserved
Page 22
4969 4970 4971 4972
Absolute Position (eV)
0.0
0.2
0.4
0.6
0.8
1.0
Nor
mal
ized
Hei
ght
[4]
[5]
[6]
Ba2TiO4
This data
Farges dataJDF-L1
This dataFarges data
Anatase
Ti umbite
• Correlation between absolute position and peak height of pre-edge peak: all 4-fold, 5-fold and 6-fold coordinated Ti compounds fall into separate domains.
• Ability to distinguish Ti coordination from pre-edge peak information.
Local Site Symmetry in Ti-containing Compounds
Reference: Farges et al., Geochim. Cosmochim. 60 (1996) 3023

EXAFS Data Collection and Analysis Course, APS, July 26-29, 2005 © 2005 UOP LLC All Rights Reserved
Page 23
XANES of 3d Transition Metals: Coordination
• For Td symmetry 1s to 3d pre-edge peak sharp and intense from Ti→Mn, decreases Fe →Cu, absent for Zn.
• Decrease in intensity due to progressive filling of the 3d band.
• Oh symmetry shows only a small pre-edge peak throughout series.
Td Oh
Ref: Lytle et al. Phys. Rev. B 37 (1988) 1550.

EXAFS Data Collection and Analysis Course, APS, July 26-29, 2005 © 2005 UOP LLC All Rights Reserved
Page 24
Ligand-Metal Binding from Ligand K-edge XANES
• Provides direct experimental measurement of the ligand 3p character in the highest occupied molecular orbital (HOMO).
• Allows study of “spectator” ligand effects.

EXAFS Data Collection and Analysis Course, APS, July 26-29, 2005 © 2005 UOP LLC All Rights Reserved
Page 25
Ligand-Metal Binding: Cl K-edge XANES
2.5
2.0
1.5
1.0
0.5
0.0
Nor
mal
ized
Abs
orpt
ion
287028602850284028302820
Photon Energy, eV
K2PtCl6, Potass ium hexachloroplatinum(IV ) chloride
Pt(NH3)Cl4, c is-diamminetetrachlorplatinum(IV )
Pt(NH3)Cl4, trans-diamminetetrachlorplatinum(IV )
PtCl2, Platinum(II) chloride
Pt(NH3)2Cl2, trans-diamminechloroplatinum(II) chloride
Pt(NH3)2Cl2, c is -diamminechloroplatinum(II) chloride
Pt4+ Pt2+
K2PtCl6
Pt(NH3)4Cl2
Nor
mal
ized
Abs
orpt
ion
287028602850284028302820
Photon Energy, eV
K2PtCl6
Pt(NH3)4Cl2
Nor
mal
ized
Abs
orpt
ion
287028602850284028302820
Photon Energy, eV
• Position of the ligand pre-edge peak depends primarily on the d manifold energy (M oxidation state). Those compounds with d-band closest to the Cl 3p energy have strongest M-Cl bonding, and highest covalency.
• In Pt(NH3)3Cl2 there is no direct M-Cl bonding: Cl is a “spectator” ligand – so no pre-edge peak.

EXAFS Data Collection and Analysis Course, APS, July 26-29, 2005 © 2005 UOP LLC All Rights Reserved
Page 26
“White line” Intensity of 4d Metals
• Transition from 2p3/2 to 4d states.
• Absence of peak for Ag: 4d states almost completely occupied (d10).
• For others Pd (d9)<Rh (d7)<Ru (d6)<Mo (d5), corresponding to increase in number of unoccupied 4d states on the atoms.
L3 edge XANES for 4d metals
• Linear correlation between white line area and number of 4d-holes for Mo to Ag

EXAFS Data Collection and Analysis Course, APS, July 26-29, 2005 © 2005 UOP LLC All Rights Reserved
Page 27
“White Line” Intensity: OxidesRe L3-edge - Transition from 2p3/2 to 5d states.
Re metal (Re0) - 5d5
ReO2 (Re4+) - 5d1
NH4ReO4 (Re7+) - 5d0
• Intensity of Re L3 white line probes Re LDOS*Spectra aligned in energy

EXAFS Data Collection and Analysis Course, APS, July 26-29, 2005 © 2005 UOP LLC All Rights Reserved
Page 28
Metals & Oxides
• Overall shape of spectrum also different.
Au2O3 Au metal
Au L3-edge XANESWhite line
reflects holes in d-band
No white line

EXAFS Data Collection and Analysis Course, APS, July 26-29, 2005 © 2005 UOP LLC All Rights Reserved
Page 29
XANES Peak Fitting in Athena
• Useful for quantification of areas, etc.
© Athena copyright 2004-005 Bruce Ravel

EXAFS Data Collection and Analysis Course, APS, July 26-29, 2005 © 2005 UOP LLC All Rights Reserved
Page 30
“White Lines”: large change in absorption coefficient
• Step height linear with concentration from 100-10,000 ppm S - but relative white line intensity constant only for <2000 ppm.
• Important if using a “reference” spectrum for fitting or fingerprinting.
10
8
6
4
2
0
Nor
mal
ized
Abs
orpt
ion
2.4902.4852.4802.4752.470
Photon Energy, keV
96 ppm 368 ppm 942 ppm 1840 ppm 3740 ppm 9000 ppm
0.06
0.05
0.04
0.03
0.02
0.01
0.00
Abs
orpt
ion
Ste
p H
eigh
t
1000080006000400020000
Wt ppm Sulfur as Sulfate
11
10
9
8
7
White line intensity
Sulfur K-edge XANES of sulfate(aq)

EXAFS Data Collection and Analysis Course, APS, July 26-29, 2005 © 2005 UOP LLC All Rights Reserved
Page 31
Caution about use of absolute intensity of “white line”
Pickering et al. Biochem 40 92001) 8138
Solid sulfur, S8
• Calculation of sulfur K-edge XANES (2.47 keV) for different spherical particles of sulfur.
• Severe distortion of the spectrum for particles 1 µm radius! One absorption length is ~ 2 µm.
Quotation from a recent publication on sulfur XANES:
“Due to their relatively high sulfur concentrations, all standards were powdered and sieved to particles sizes ≤10µm in diameter to minimize self-absorption effects at the sulfur K-edge”

EXAFS Data Collection and Analysis Course, APS, July 26-29, 2005 © 2005 UOP LLC All Rights Reserved
Page 32
L3
L2
• Significant difference in L3 and L2 edge XANES: 2p to 5d transitions.
•Pt 5d3/2 filled, so no white line.L2 shifted to align with L3 edge.
EF5d5/2
5d3/2
L3 L2
2p1/22p3/2
•Same l=2 final density of states but because of selection rule, ∆j = ±1, different total quantum number probed.
•Only j=3/2 probed by L2-edge, both j = 3/2 and j =5/2 probed by L3-edge.
Pt L3 and L2 Edge XANES

EXAFS Data Collection and Analysis Course, APS, July 26-29, 2005 © 2005 UOP LLC All Rights Reserved
Page 33
• Transition is 2p to 5d: Pt d-band full, so “no” intensity at edge.• PtGe intermetallics: charge transfer from d-band of Pt to Ge, resulting in
significant intensity at edge.• Use as signature of Pt-Ge intermetallic formation.
-30 -20 -10 0 10 20 30 40
Photon Energy (E-E0) eV
0.0
0.2
0.4
0.6
0.8
1.0
1.2
1.4
Nor
mal
ized
Abs
orpt
ion
Platinum L2-edge XANES: PtxGey Intermetallics
Pt
Pt3Ge2
Pt3Ge2
Pt3Ge
XANES to Probe Charge Transfer in Alloys
Increasing %Ge content PtGe2

EXAFS Data Collection and Analysis Course, APS, July 26-29, 2005 © 2005 UOP LLC All Rights Reserved
Page 34
Effect of Adsorbed Hydrogen on Pt L3 XANES
• White-line intensity decreases and spectra broaden to higher energies as H is added.
• Difference signal typically leads to broad structure ~8 eV above absorption edge.
• Several different interpretations in the literature.
0.05
0.00
Abs
orpt
ion
40200-20
Photon Energy (E-E0), eV
Diff
eren
ce
40200-20Photon Energy, E-E0, eV
Increasing H coverage10-15Å Pt clusters supported on Al2O3

EXAFS Data Collection and Analysis Course, APS, July 26-29, 2005 © 2005 UOP LLC All Rights Reserved
Page 35
Experimental in situ/operando cells
for XAFS experiments used by
UOP

EXAFS Data Collection and Analysis Course, APS, July 26-29, 2005 © 2005 UOP LLC All Rights Reserved
Page 36
0.0
1.0
2.0
3.0
4.0
0.0
10.54
10.56
10.58
20
40
60
80
Y
X
Z
Photon Energy, keV
Nor
mal
ized
Abs
o rpt
ion
RT
500ºC
Time Evolution of XANES: Kinetics
Reduction in H2
Reduced Re
Oxidized Re
500
100
80
60
40
20
Perc
ent R
e2O
7 rem
aini
ng
500400300200100
Temperature, ºC
Re
Al2O3
Al2O3
Re-O = 1.72Å
Re-Al = 3.05Å
Re7+In situ temperature programmed reduction of Re2O7/Al2O3

EXAFS Data Collection and Analysis Course, APS, July 26-29, 2005 © 2005 UOP LLC All Rights Reserved
Page 37
0.5
1.0
1.5
2.0
2.5
3.0
3.5
5.46
5.47
5.48
5.49
5.5
20
40
60
80
Y
X
Z
Time Evolution of XANES: KineticsTPR-XANES showing reduction of vanadium as catalyst is heated in H2 to 500ºC
Heat in H2 flow
Vanadium K-edge XANES
RT
500 º C
80 sec/scan

EXAFS Data Collection and Analysis Course, APS, July 26-29, 2005 © 2005 UOP LLC All Rights Reserved
Page 38
Q-XANES & D-XANESQuick XANES
• Slew monochromator continuously to obtain a XANES spectrum in few seconds (10-ID).
• All modes of detection.
Dispersive XANES
• Polychromatic beam dispersed onto linear detector.
• XANES spectrum in msec.
• Transmission only.
• Need extremely uniform samples.

EXAFS Data Collection and Analysis Course, APS, July 26-29, 2005 © 2005 UOP LLC All Rights Reserved
Page 39
Micro-XANES• Use special optics to focus x-ray beam to <1µm diameter.
• Combined with x-ray microprobe: elemental composition maps and oxidation state/local coordination.
• Applications:– Speciation of metals in soils, sediments and organisms
– Grazing incidence studies of cations and anions on surfaces
– Time-resolved studies of reactions on surfaces and interfaces
– High temperature studies (trace elements in melts)
– Oxidation states of planetary material
– High pressure phases (diamond anvil cell)

EXAFS Data Collection and Analysis Course, APS, July 26-29, 2005 © 2005 UOP LLC All Rights Reserved
Page 40
Analysis of Mixtures
• XANES useful technique to quantitatively determine composition of a mixture of species.
• Useful for following time evolution of species during a chemical reaction.
• Two most common methods:
– Least squares linear combination fitting
– Principal component analysis

EXAFS Data Collection and Analysis Course, APS, July 26-29, 2005 © 2005 UOP LLC All Rights Reserved
Page 41
Least Squares Linear Combination Fitting
• Use a linear combination of spectra of various reference samples.
• Allows quantification of species in multiple-component mixture from their fingerprint in the XANES region.
• Use a least-squares algorithm to refine the sum of a given number of reference spectra to an experimental spectrum.
• Simple method, easy to implement.
• Must have good quality spectra of the reference compounds recorded under similar conditions – energy alignment is critical.

EXAFS Data Collection and Analysis Course, APS, July 26-29, 2005 © 2005 UOP LLC All Rights Reserved
Page 42
Linear Combination Fitting in Athena
© Athena copyright 2004-005 Bruce Ravel
EXAFS Data Collection and Analysis Course, APS, July 26-29, 2005 © 2005 UOP LLC All Rights Reserved
Page 43
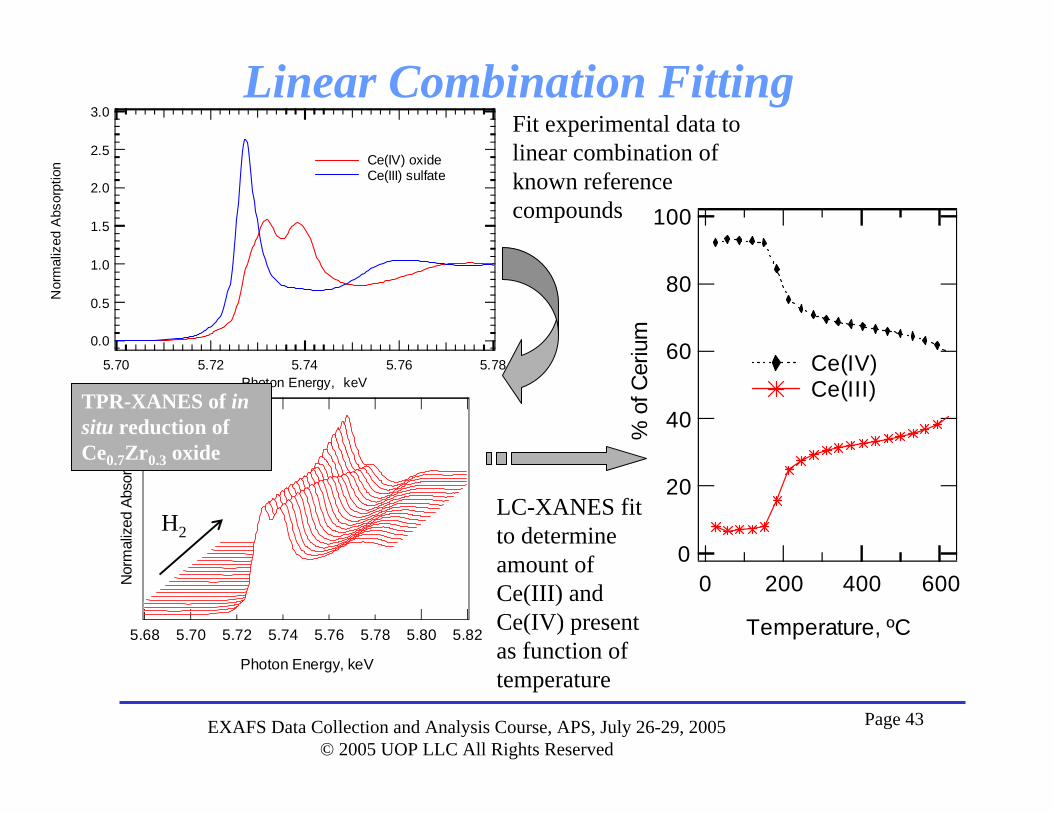
Linear Combination Fitting
100
80
60
40
20
0
% o
f Cer
ium
6004002000
Temperature, ºC
Ce(IV) Ce(III)
Nor
mal
ized
Abs
orpt
ion
5.825.805.785.765.745.725.705.68
Photon Energy, keV
Fit experimental data to linear combination of known reference compounds
LC-XANES fit to determine amount of Ce(III) and Ce(IV) present as function of temperature
3.0
2.5
2.0
1.5
1.0
0.5
0.0
Nor
mal
ized
Abs
orpt
ion
5.785.765.745.725.70Photon Energy, keV
Ce(IV) oxide Ce(III) sulfate
TPR-XANES of in situ reduction of Ce0.7Zr0.3 oxide
H2

EXAFS Data Collection and Analysis Course, APS, July 26-29, 2005 © 2005 UOP LLC All Rights Reserved
Page 44
Linear Combination Fitting
2.0
1.5
1.0
0.5
0.0
Nor
mal
ized
Inte
nsity
8.408.388.368.348.32
Photon Energy, keV
Effect of sulfiding
Ni K-edge XANES of in situ sulfiding of a Ni/Al2O3 catalyst
LC-XANES fit to determine amount of oxidized and sulfided Ni present as function of temperature/time
0.8
0.6
0.4
0.2
0.0
Rel
ativ
e Am
ount
of N
i Sul
fide
400300200100
Temperature, °C

EXAFS Data Collection and Analysis Course, APS, July 26-29, 2005 © 2005 UOP LLC All Rights Reserved
Page 45
Quantification Using Reference Compounds
• Need to be cautious about collecting XANES data of bulk reference compounds in fluorescence – will get incorrect answer in quantitative fitting!
Re L3-edge XANES spectrum of bulk (NH4)ReO4
White line of spectrum collected in fluorescence severely attenuated.

EXAFS Data Collection and Analysis Course, APS, July 26-29, 2005 © 2005 UOP LLC All Rights Reserved
Page 46
Principal Component Analysis
• Used since 1970’s in other chemical spectroscopy†. First published reference in XANES 1992*.
• Traditional approach: choose pure model standard, fit edges to these standards, but…
• How many standards are needed?
• How do we know models are reasonable?
• If you have wrong group of standards…there is no way to get the correct answer...
†Factor Analysis in Chemistry, 2nd Ed. John Wiley & Sons, NY, 1991
*Determination of molybdenum surface environment of molybdenum/titania catalysts by EXAFS, XANES and PCA. Mikrochimica Acta 109 (1992) 281.

EXAFS Data Collection and Analysis Course, APS, July 26-29, 2005 © 2005 UOP LLC All Rights Reserved
Page 47
Principal Component Analysis• PCA estimates number of distinct species in a series of spectra.
• Use as a first stage of analysis.
• Based on linear algebra - each spectrum represented as a vector.
• Goal is to find number of components that can reproduce the experimental spectra to within experimental (statistical) error.
• No a priori assumptions on number/type of components.
• Several examples now in literature in XANES spectroscopy*.*”Principal component analysis approach for modeling sulfur K-XANES spectra in humic acids”, S. Beauchemin et al., Soil. Sci. Soc.Am.J., 66 (2002) 83.
“Quantitative speciation of Mn-bearing particulates emitted from autos burning mcp-Mn gasolines using XANES spectroscopy”, T. Ressler et al., Environ. Sci. Technol., 34 (2000) 950.
“EXAFS and principal component analysis: a new shell game”, S. Wasserman et al., J. Synch. Rad., 6 (1999) 284.
“The kinetic significance of V5+ in n-butane oxidation catalyzed by vanadium phosphates”, G.W. Coulston et al., Science, 275 (1997) 191
“XANES-TPR study of Cu-Pd bimetallic catalysts: application of factor analysis”, M.Fernandez-Garcia et al., J. Phys. Chem 99 (1995) 12565.

EXAFS Data Collection and Analysis Course, APS, July 26-29, 2005 © 2005 UOP LLC All Rights Reserved
Page 48
Potential pitfalls and drawbacks of PCA
• Principal components not equal to chemical species.
• Constant ratio of two (chemical) components.
• Temperature increase during measurement.• Additional information required to transform abstract
results in meaningful speciation (either references or concentrations).
• But: Powerful method to reduce ambiguity in qualitative and quantitative analysis of a series of XAS spectra (“model-free”).

EXAFS Data Collection and Analysis Course, APS, July 26-29, 2005 © 2005 UOP LLC All Rights Reserved
Page 49
Feff8.1 and XANES
• Dramatic progress in past decade both in theory and ab initio calculations.
• Significant progress has been made in understanding XANES.
• Quantitative theory central to quantitative interpretation of XAFS spectra in terms of local geometric and electronic structure.
• For “experts” only at this time.

EXAFS Data Collection and Analysis Course, APS, July 26-29, 2005 © 2005 UOP LLC All Rights Reserved
Page 50
Feff8.1 and XANES: Pt L-edgesFeff reproduces differences in
white line at Pt L3,2-edges Pt L3-edge XANES as function of Pt cluster size

EXAFS Data Collection and Analysis Course, APS, July 26-29, 2005 © 2005 UOP LLC All Rights Reserved
Page 51
SummaryXANES is a much larger signal than EXAFS
XANES can be done at lower concentrations, and less-than-perfect sample conditions.
XANES is easier to crudely interpret than EXAFS
For many systems, the XANES analysis based on linear combinations of known spectra from “model compounds” is sufficient.
More sophisticated linear-algebra techniques, such as principal component analysis can be applied to XANES spectra.
XANES is harder to fully interpret than EXAFS
The exact physical and chemical interpretation of all spectral features is still difficult to do accurately, precisely, and reliably.
This situation is improving…..