
XANES and Raman spectrometry on glasses and crystals in ...neuville/CAS2.pdfXANES and Raman...
1
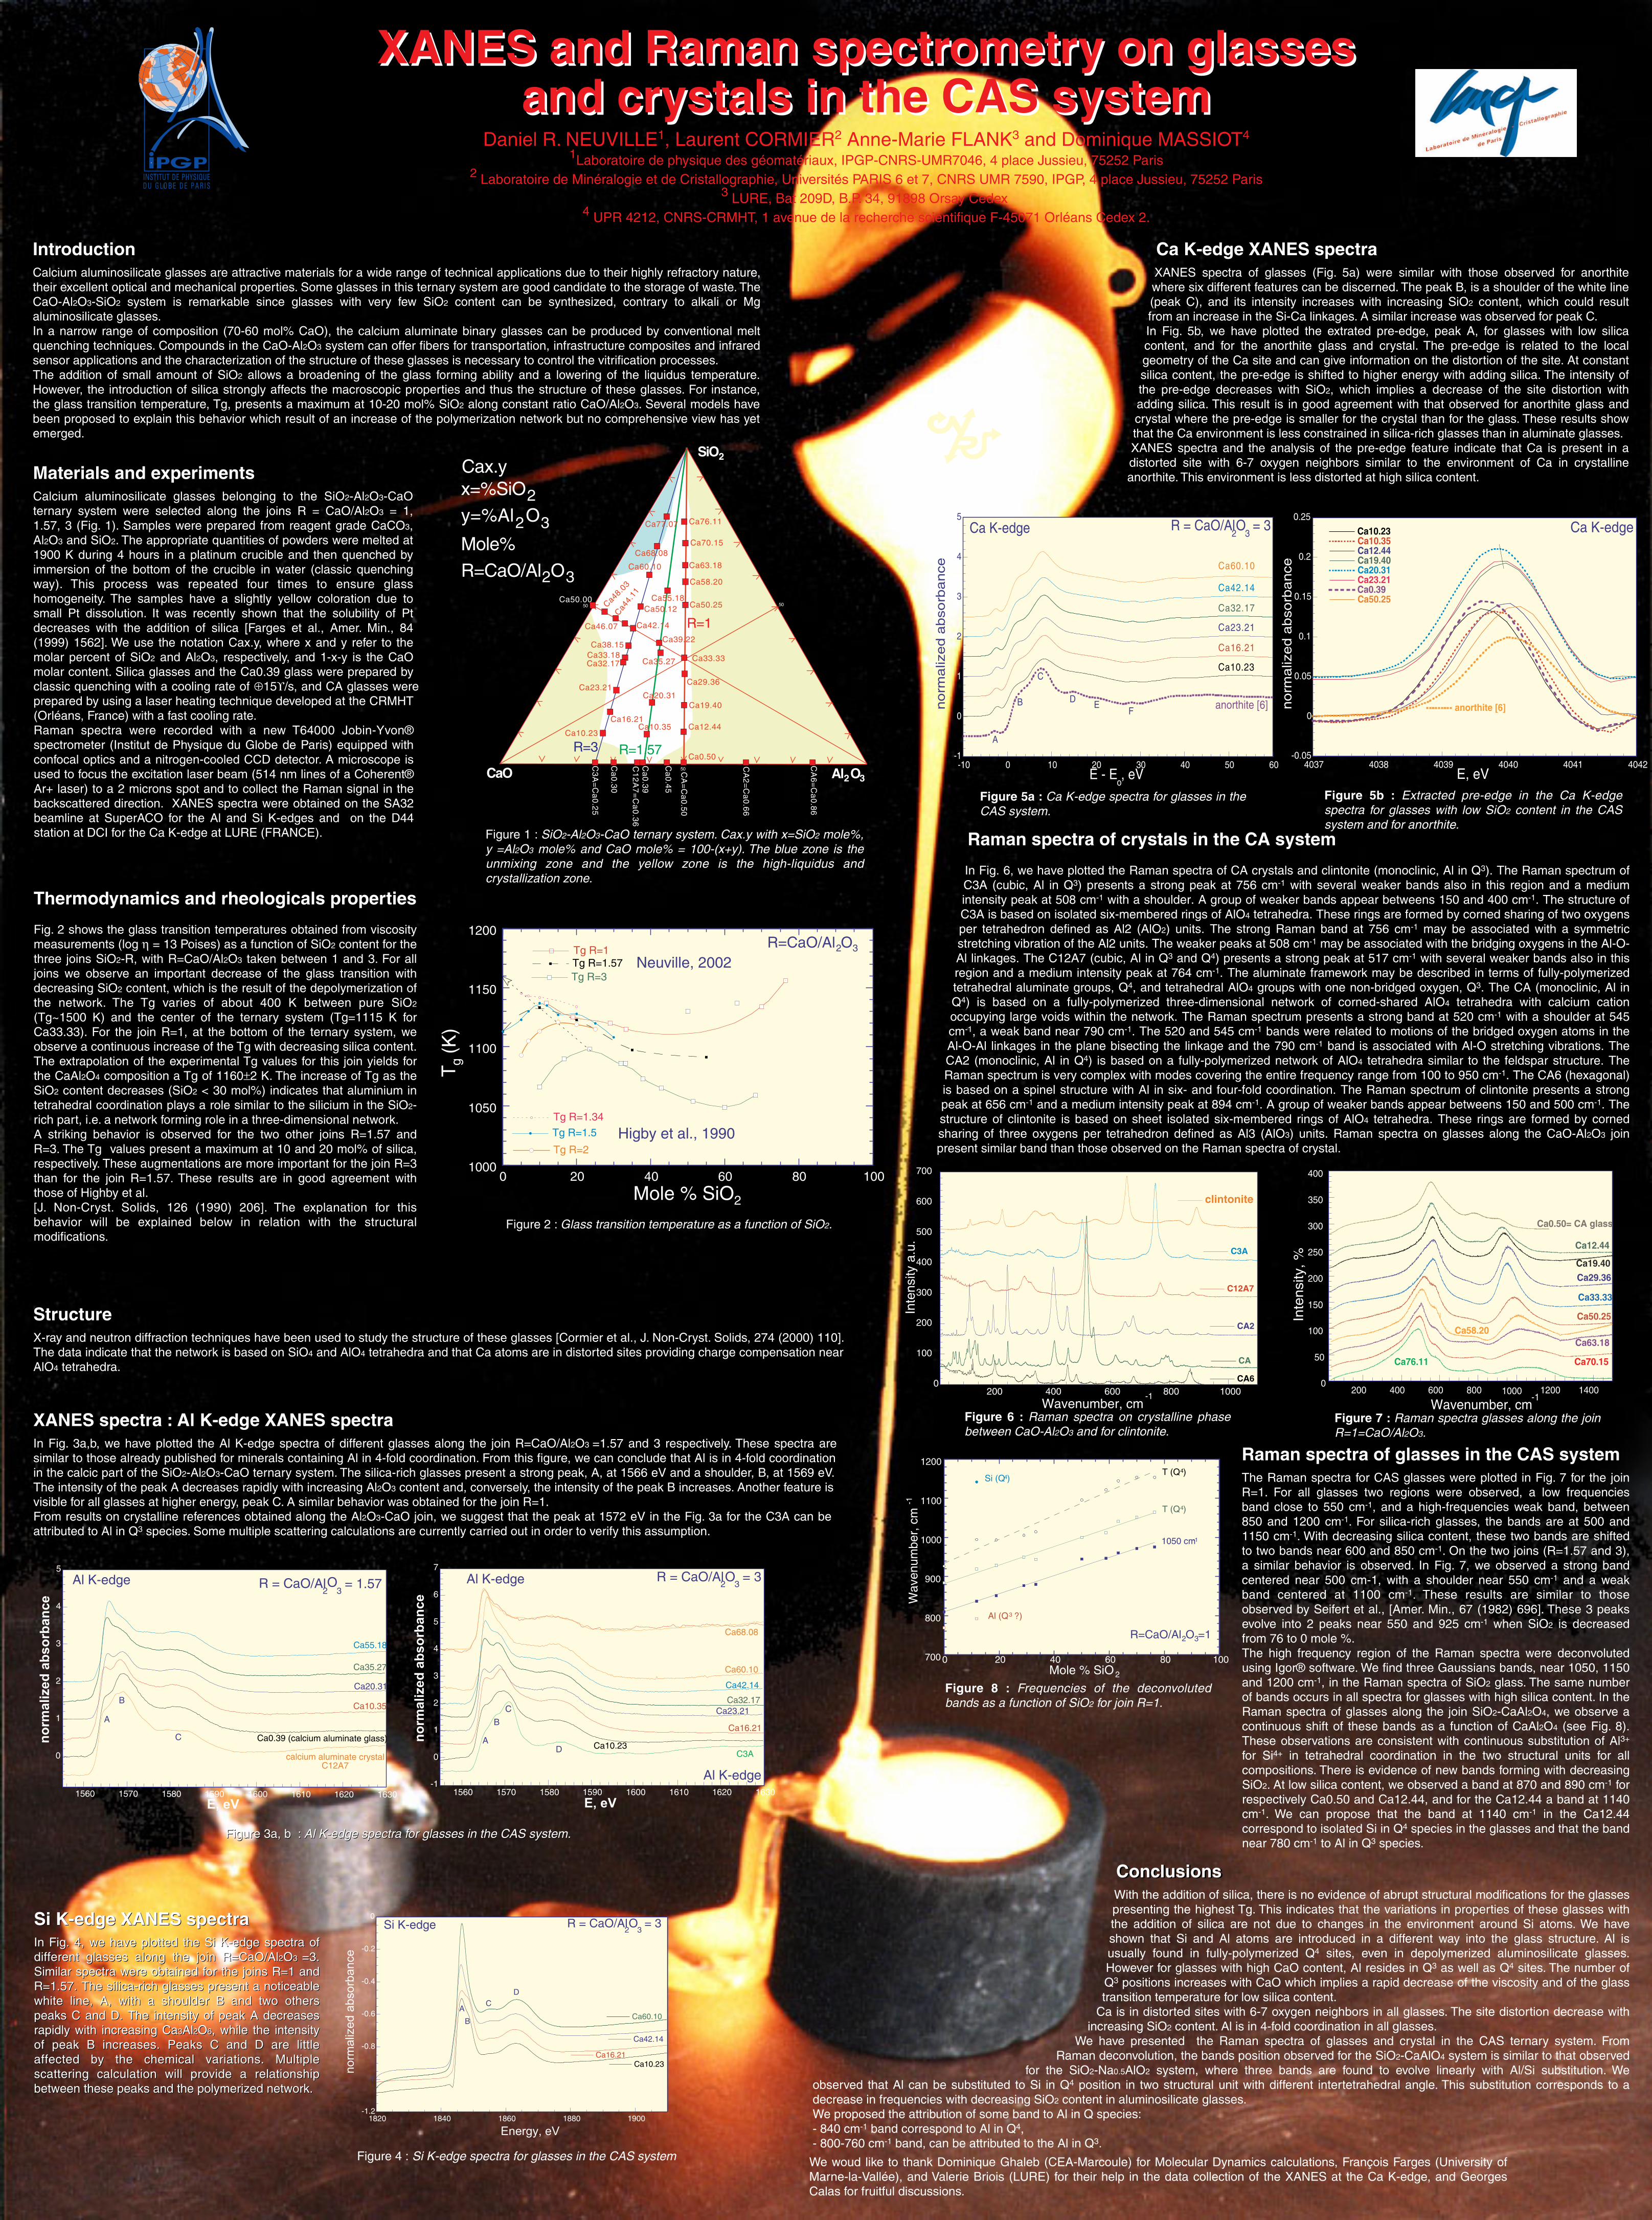
XANES and Raman spectrometry on glasses and crystals in the CAS system Introduction Materials and experiments Structure Thermodynamics and rheologicals properties Raman spectra of crystals in the CA system Raman spectra of glasses in the CAS system Conclusions XANES spectra : Al K-edge XANES spectra Ca K-edge XANES spectra XANES and Raman spectrometry on glasses and crystals in the CAS system Daniel R. NEUVILLE 1 , Laurent CORMIER 2 Anne-Marie FLANK 3 and Dominique MASSIOT 4 1 Laboratoire de physique des géomatériaux, IPGP-CNRS-UMR7046, 4 place Jussieu, 75252 Paris 2 Laboratoire de Minéralogie et de Cristallographie, Universités PARIS 6 et 7, CNRS UMR 7590, IPGP, 4 place Jussieu, 75252 Paris 3 LURE, Bat 209D, B.P. 34, 91898 Orsay Cedex 4 UPR 4212, CNRS-CRMHT, 1 avenue de la recherche scientifique F-45071 Orléans Cedex 2. Introduction Calcium aluminosilicate glasses are attractive materials for a wide range of technical applications due to their highly refractory nature, their excellent optical and mechanical properties. Some glasses in this ternary system are good candidate to the storage of waste. The CaO-Al2O3-SiO2 system is remarkable since glasses with very few SiO2 content can be synthesized, contrary to alkali or Mg aluminosilicate glasses. In a narrow range of composition (70-60 mol% CaO), the calcium aluminate binary glasses can be produced by conventional melt quenching techniques. Compounds in the CaO-Al2O3 system can offer fibers for transportation, infrastructure composites and infrared sensor applications and the characterization of the structure of these glasses is necessary to control the vitrification processes. The addition of small amount of SiO2 allows a broadening of the glass forming ability and a lowering of the liquidus temperature. However, the introduction of silica strongly affects the macroscopic properties and thus the structure of these glasses. For instance, the glass transition temperature, Tg, presents a maximum at 10-20 mol% SiO2 along constant ratio CaO/Al2O3. Several models have been proposed to explain this behavior which result of an increase of the polymerization network but no comprehensive view has yet emerged. Materials and experiments Calcium aluminosilicate glasses belonging to the SiO2-Al2O3-CaO ternary system were selected along the joins R = CaO/Al2O3 = 1, 1.57, 3 (Fig. 1). Samples were prepared from reagent grade CaCO3, Al2O3 and SiO2. The appropriate quantities of powders were melted at 1900 K during 4 hours in a platinum crucible and then quenched by immersion of the bottom of the crucible in water (classic quenching way). This process was repeated four times to ensure glass homogeneity. The samples have a slightly yellow coloration due to small Pt dissolution. It was recently shown that the solubility of Pt decreases with the addition of silica [Farges et al., Amer. Min., 84 (1999) 1562]. We use the notation Cax.y, where x and y refer to the molar percent of SiO2 and Al2O3, respectively, and 1-x-y is the CaO molar content. Silica glasses and the Ca0.39 glass were prepared by classic quenching with a cooling rate of ≈15°/s, and CA glasses were prepared by using a laser heating technique developed at the CRMHT (Orléans, France) with a fast cooling rate. Raman spectra were recorded with a new T64000 Jobin-Yvon® spectrometer (Institut de Physique du Globe de Paris) equipped with confocal optics and a nitrogen-cooled CCD detector. A microscope is used to focus the excitation laser beam (514 nm lines of a Coherent® Ar+ laser) to a 2 microns spot and to collect the Raman signal in the backscattered direction. XANES spectra were obtained on the SA32 beamline at SuperACO for the Al and Si K-edges and on the D44 station at DCI for the Ca K-edge at LURE (FRANCE). Thermodynamics and rheologicals properties Fig. 2 shows the glass transition temperatures obtained from viscosity measurements (log h = 13 Poises) as a function of SiO2 content for the three joins SiO2-R, with R=CaO/Al2O3 taken between 1 and 3. For all joins we observe an important decrease of the glass transition with decreasing SiO2 content, which is the result of the depolymerization of the network. The Tg varies of about 400 K between pure SiO2 (Tg~1500 K) and the center of the ternary system (Tg=1115 K for Ca33.33). For the join R=1, at the bottom of the ternary system, we observe a continuous increase of the Tg with decreasing silica content. The extrapolation of the experimental Tg values for this join yields for the CaAl2O4 composition a Tg of 1160±2 K. The increase of Tg as the SiO2 content decreases (SiO2 < 30 mol%) indicates that aluminium in tetrahedral coordination plays a role similar to the silicium in the SiO2- rich part, i.e. a network forming role in a three-dimensional network. A striking behavior is observed for the two other joins R=1.57 and R=3. The Tg values present a maximum at 10 and 20 mol% of silica, respectively. These augmentations are more important for the join R=3 than for the join R=1.57. These results are in good agreement with those of Highby et al. [J. Non-Cryst. Solids, 126 (1990) 206]. The explanation for this behavior will be explained below in relation with the structural modifications. Structure X-ray and neutron diffraction techniques have been used to study the structure of these glasses [Cormier et al., J. Non-Cryst. Solids, 274 (2000) 110]. The data indicate that the network is based on SiO4 and AlO4 tetrahedra and that Ca atoms are in distorted sites providing charge compensation near AlO4 tetrahedra. XANES spectra : Al K-edge XANES spectra In Fig. 3a,b, we have plotted the Al K-edge spectra of different glasses along the join R=CaO/Al2O3 =1.57 and 3 respectively. These spectra are similar to those already published for minerals containing Al in 4-fold coordination. From this figure, we can conclude that Al is in 4-fold coordination in the calcic part of the SiO2-Al2O3-CaO ternary system. The silica-rich glasses present a strong peak, A, at 1566 eV and a shoulder, B, at 1569 eV. The intensity of the peak A decreases rapidly with increasing Al2O3 content and, conversely, the intensity of the peak B increases. Another feature is visible for all glasses at higher energy, peak C. A similar behavior was obtained for the join R=1. From results on crystalline references obtained along the Al2O3-CaO join, we suggest that the peak at 1572 eV in the Fig. 3a for the C3A can be attributed to Al in Q 3 species. Some multiple scattering calculations are currently carried out in order to verify this assumption. Si K-edge XANES spectra In Fig. 4, we have plotted the Si K-edge spectra of different glasses along the join R=CaO/Al2O3 =3. Similar spectra were obtained for the joins R=1 and R=1.57. The silica-rich glasses present a noticeable white line, A, with a shoulder B and two others peaks C and D. The intensity of peak A decreases rapidly with increasing Ca3Al2O6, while the intensity of peak B increases. Peaks C and D are little affected by the chemical variations. Multiple scattering calculation will provide a relationship between these peaks and the polymerized network. Si K-edge XANES spectra In Fig. 4, we have plotted the Si K-edge spectra of different glasses along the join R=CaO/Al2O3 =3. Similar spectra were obtained for the joins R=1 and R=1.57. The silica-rich glasses present a noticeable white line, A, with a shoulder B and two others peaks C and D. The intensity of peak A decreases rapidly with increasing Ca3Al2O6, while the intensity of peak B increases. Peaks C and D are little affected by the chemical variations. Multiple scattering calculation will provide a relationship between these peaks and the polymerized network. Figure 3a, b : Al K-edge spectra for glasses in the CAS system. Figure 3a, b : Al K-edge spectra for glasses in the CAS system. Figure 4 : Si K-edge spectra for glasses in the CAS system Raman spectra of crystals in the CA system In Fig. 6, we have plotted the Raman spectra of CA crystals and clintonite (monoclinic, Al in Q 3 ). The Raman spectrum of C3A (cubic, Al in Q 3 ) presents a strong peak at 756 cm -1 with several weaker bands also in this region and a medium intensity peak at 508 cm -1 with a shoulder. A group of weaker bands appear betweens 150 and 400 cm -1 . The structure of C3A is based on isolated six-membered rings of AlO4 tetrahedra. These rings are formed by corned sharing of two oxygens per tetrahedron defined as Al2 (AlO2) units. The strong Raman band at 756 cm -1 may be associated with a symmetric stretching vibration of the Al2 units. The weaker peaks at 508 cm -1 may be associated with the bridging oxygens in the Al-O- Al linkages. The C12A7 (cubic, Al in Q 3 and Q 4 ) presents a strong peak at 517 cm -1 with several weaker bands also in this region and a medium intensity peak at 764 cm -1 . The aluminate framework may be described in terms of fully-polymerized tetrahedral aluminate groups, Q 4 , and tetrahedral AlO4 groups with one non-bridged oxygen, Q 3 . The CA (monoclinic, Al in Q 4 ) is based on a fully-polymerized three-dimensional network of corned-shared AlO4 tetrahedra with calcium cation occupying large voids within the network. The Raman spectrum presents a strong band at 520 cm -1 with a shoulder at 545 cm -1 , a weak band near 790 cm -1 . The 520 and 545 cm -1 bands were related to motions of the bridged oxygen atoms in the Al-O-Al linkages in the plane bisecting the linkage and the 790 cm -1 band is associated with Al-O stretching vibrations. The CA2 (monoclinic, Al in Q 4 ) is based on a fully-polymerized network of AlO4 tetrahedra similar to the feldspar structure. The Raman spectrum is very complex with modes covering the entire frequency range from 100 to 950 cm -1 . The CA6 (hexagonal) is based on a spinel structure with Al in six- and four-fold coordination. The Raman spectrum of clintonite presents a strong peak at 656 cm -1 and a medium intensity peak at 894 cm -1 . A group of weaker bands appear betweens 150 and 500 cm -1 . The structure of clintonite is based on sheet isolated six-membered rings of AlO4 tetrahedra. These rings are formed by corned sharing of three oxygens per tetrahedron defined as Al3 (AlO3) units. Raman spectra on glasses along the CaO-Al2O3 join present similar band than those observed on the Raman spectra of crystal. Raman spectra of glasses in the CAS system The Raman spectra for CAS glasses were plotted in Fig. 7 for the join R=1. For all glasses two regions were observed, a low frequencies band close to 550 cm -1 , and a high-frequencies weak band, between 850 and 1200 cm -1 . For silica-rich glasses, the bands are at 500 and 1150 cm -1 . With decreasing silica content, these two bands are shifted to two bands near 600 and 850 cm -1 . On the two joins (R=1.57 and 3), a similar behavior is observed. In Fig. 7, we observed a strong band centered near 500 cm-1, with a shoulder near 550 cm -1 and a weak band centered at 1100 cm -1 . These results are similar to those observed by Seifert et al., [Amer. Min., 67 (1982) 696]. These 3 peaks evolve into 2 peaks near 550 and 925 cm -1 when SiO2 is decreased from 76 to 0 mole %. The high frequency region of the Raman spectra were deconvoluted using Igor® software. We find three Gaussians bands, near 1050, 1150 and 1200 cm -1 , in the Raman spectra of SiO2 glass. The same number of bands occurs in all spectra for glasses with high silica content. In the Raman spectra of glasses along the join SiO2-CaAl2O4, we observe a continuous shift of these bands as a function of CaAl2O4 (see Fig. 8). These observations are consistent with continuous substitution of Al 3+ for Si 4+ in tetrahedral coordination in the two structural units for all compositions. There is evidence of new bands forming with decreasing SiO2. At low silica content, we observed a band at 870 and 890 cm -1 for respectively Ca0.50 and Ca12.44, and for the Ca12.44 a band at 1140 cm -1 . We can propose that the band at 1140 cm -1 in the Ca12.44 correspond to isolated Si in Q 4 species in the glasses and that the band near 780 cm -1 to Al in Q 3 species. We woud like to thank Dominique Ghaleb (CEA-Marcoule) for Molecular Dynamics calculations, François Farges (University of Marne-la-Vallée), and Valerie Briois (LURE) for their help in the data collection of the XANES at the Ca K-edge, and Georges Calas for fruitful discussions. Ca K-edge XANES spectra XANES spectra of glasses (Fig. 5a) were similar with those observed for anorthite where six different features can be discerned. The peak B, is a shoulder of the white line (peak C), and its intensity increases with increasing SiO2 content, which could result from an increase in the Si-Ca linkages. A similar increase was observed for peak C. In Fig. 5b, we have plotted the extrated pre-edge, peak A, for glasses with low silica content, and for the anorthite glass and crystal. The pre-edge is related to the local geometry of the Ca site and can give information on the distortion of the site. At constant silica content, the pre-edge is shifted to higher energy with adding silica. The intensity of the pre-edge decreases with SiO2, which implies a decrease of the site distortion with adding silica. This result is in good agreement with that observed for anorthite glass and crystal where the pre-edge is smaller for the crystal than for the glass. These results show that the Ca environment is less constrained in silica-rich glasses than in aluminate glasses. XANES spectra and the analysis of the pre-edge feature indicate that Ca is present in a distorted site with 6-7 oxygen neighbors similar to the environment of Ca in crystalline anorthite. This environment is less distorted at high silica content. Figure 1 : SiO2-Al2O3-CaO ternary system. Cax.y with x=SiO2 mole%, y =Al2O3 mole% and CaO mole% = 100-(x+y). The blue zone is the unmixing zone and the yellow zone is the high-liquidus and crystallization zone. Figure 2 : Glass transition temperature as a function of SiO2. Figure 5a : Ca K-edge spectra for glasses in the CAS system. Figure 5b : Extracted pre-edge in the Ca K-edge spectra for glasses with low SiO2 content in the CAS system and for anorthite. Figure 6 : Raman spectra on crystalline phase between CaO-Al2O3 and for clintonite. Figure 7 : Raman spectra glasses along the join R=1=CaO/Al2O3. Figure 8 : Frequencies of the deconvoluted bands as a function of SiO2 for join R=1. 0 1 2 3 4 5 1560 1570 1580 1590 1600 1610 1620 1630 normalized absorbance E, eV Al K-edge R = CaO/Al 2 O 3 = 1.57 Ca0.39 (calcium aluminate glass) A B C calcium aluminate crystal C12A7 Ca55.18 Ca35.27 Ca20.31 Ca10.35 -1 0 1 2 3 4 5 6 7 1560 1570 1580 1590 1600 1610 1620 1630 normalized absorbance E, eV R = CaO/Al 2 O 3 = 3 Al K-edge A B C D Ca60.10 Ca42.14 Ca32.17 Ca23.21 Ca16.21 Ca10.23 C3A Ca68.08 -1.2 -1 -0.8 -0.6 -0.4 -0.2 0 1820 1840 1860 1880 1900 Ca10.23 Ca16.21 Ca42.14 Ca60.10 normalized absorbance Energy, eV Si K-edge A B C D R = CaO/Al 2 O 3 = 3 1000 1050 1100 1150 1200 Tg R=1 Tg R=3 Tg R=1.57 Tg R=1.34 Tg R=1.5 Tg R=2 0 20 40 60 80 100 Mole % SiO 2 T g (K) R=CaO/Al 2 O 3 Neuville, 2002 Higby et al., 1990 Cax.y x=%SiO 2 y=%Al 2 O 3 Mole% SiO 2 Al 2 O 3 CaO Ca63.18 Ca50.25 Ca58.20 Ca70.15 Ca33.33 Ca29.36 Ca19.40 Ca76.11 Ca77.07 Ca68.08 Ca60.10 Ca55.18 Ca50.12 Ca50.00 Ca48.03 Ca44.11 Ca46.07 Ca42.14 Ca39.22 Ca33.18 Ca32.17 Ca38.15 Ca35.27 Ca23.21 Ca20.31 Ca12.44 Ca10.35 Ca16.21 Ca10.23 Ca0.50 50 50 50 Ca0.39 Ca0.45 Ca0.30 C3A=Ca0.25 C12A7=Ca0.36 CA=Ca0.50 CA2=Ca0.66 CA6=Ca0.86 -1 0 1 2 3 4 5 -10 0 10 20 30 40 50 60 normalized absorbance E - E o , eV Ca K-edge Ca10.23 Ca16.21 Ca23.21 Ca32.17 Ca42.14 Ca60.10 R = CaO/Al 2 O 3 = 3 anorthite [6] A B C D E F -0.05 0 0.05 0.1 0.15 0.2 0.25 4037 4038 4039 4040 4041 4042 Ca10.23 Ca10.35 Ca12.44 Ca19.40 Ca20.31 Ca23.21 Ca0.39 Ca50.25 anorthite [6] normalized absorbance E, eV Ca K-edge 0 100 200 300 400 500 600 700 200 400 600 800 1000 CA6 C12A7 CA2 CA C3A clintonite Intensity a.u. Wavenumber, cm -1 0 50 100 150 200 250 300 350 400 200 400 600 800 1000 1200 1400 Intensity, % Wavenumber, cm -1 Ca12.44 Ca19.40 Ca29.36 Ca33.33 Ca50.25 Ca58.20 Ca63.18 Ca70.15 Ca76.11 Ca0.50= CA glass 700 800 900 1000 1100 1200 0 20 40 60 80 100 Mole % SiO 2 Wavenumber, cm -1 R=CaO/Al 2 O 3 =1 Si (Q 4 ) T (Q 4 ) T (Q 4 ) 1050 cm -1 Al (Q 3 ?) Al K-edge R=CaO/Al O 2 3 R=1 R=1.57 R=3 Conclusions With the addition of silica, there is no evidence of abrupt structural modifications for the glasses presenting the highest Tg. This indicates that the variations in properties of these glasses with the addition of silica are not due to changes in the environment around Si atoms. We have shown that Si and Al atoms are introduced in a different way into the glass structure. Al is usually found in fully-polymerized Q 4 sites, even in depolymerized aluminosilicate glasses. However for glasses with high CaO content, Al resides in Q 3 as well as Q 4 sites. The number of Q 3 positions increases with CaO which implies a rapid decrease of the viscosity and of the glass transition temperature for low silica content. Ca is in distorted sites with 6-7 oxygen neighbors in all glasses. The site distortion decrease with increasing SiO2 content. Al is in 4-fold coordination in all glasses. We have presented the Raman spectra of glasses and crystal in the CAS ternary system. From Raman deconvolution, the bands position observed for the SiO2-CaAlO4 system is similar to that observed for the SiO2-Na0.5AlO2 system, where three bands are found to evolve linearly with Al/Si substitution. We observed that Al can be substituted to Si in Q 4 position in two structural unit with different intertetrahedral angle. This substitution corresponds to a decrease in frequencies with decreasing SiO2 content in aluminosilicate glasses. We proposed the attribution of some band to Al in Q species: - 840 cm -1 band correspond to Al in Q 4 , - 800-760 cm -1 band, can be attributed to the Al in Q 3 .
Transcript of XANES and Raman spectrometry on glasses and crystals in ...neuville/CAS2.pdfXANES and Raman...
XANES and Raman spectrometry on glassesand crystals in the CAS system
Introduction
Materials and experiments
Structure
Thermodynamics and rheologicals properties
Raman spectra of crystals in the CA system
Raman spectra of glasses in the CAS system
Conclusions
XANES spectra : Al K-edge XANES spectra
Ca K-edge XANES spectra
XANES and Raman spectrometry on glassesand crystals in the CAS system
Daniel R. NEUVILLE1, Laurent CORMIER2 Anne-Marie FLANK3 and Dominique MASSIOT4
1Laboratoire de physique des géomatériaux, IPGP-CNRS-UMR7046, 4 place Jussieu, 75252 Paris2 Laboratoire de Minéralogie et de Cristallographie, Universités PARIS 6 et 7, CNRS UMR 7590, IPGP, 4 place Jussieu, 75252 Paris
3 LURE, Bat 209D, B.P. 34, 91898 Orsay Cedex 4 UPR 4212, CNRS-CRMHT, 1 avenue de la recherche scientifique F-45071 Orléans Cedex 2.
IntroductionCalcium aluminosilicate glasses are attractive materials for a wide range of technical applications due to their highly refractory nature, their excellent optical and mechanical properties. Some glasses in this ternary system are good candidate to the storage of waste. The CaO-Al2O3-SiO2 system is remarkable since glasses with very few SiO2 content can be synthesized, contrary to alkali or Mg aluminosilicate glasses. In a narrow range of composition (70-60 mol% CaO), the calcium aluminate binary glasses can be produced by conventional melt quenching techniques. Compounds in the CaO-Al2O3 system can offer fibers for transportation, infrastructure composites and infrared sensor applications and the characterization of the structure of these glasses is necessary to control the vitrification processes.The addition of small amount of SiO2 allows a broadening of the glass forming ability and a lowering of the liquidus temperature. However, the introduction of silica strongly affects the macroscopic properties and thus the structure of these glasses. For instance, the glass transition temperature, Tg, presents a maximum at 10-20 mol% SiO2 along constant ratio CaO/Al2O3. Several models have been proposed to explain this behavior which result of an increase of the polymerization network but no comprehensive view has yet emerged.
Materials and experiments Calcium aluminosilicate glasses belonging to the SiO2-Al2O3-CaO ternary system were selected along the joins R = CaO/Al2O3 = 1, 1.57, 3 (Fig. 1). Samples were prepared from reagent grade CaCO3, Al2O3 and SiO2. The appropriate quantities of powders were melted at 1900 K during 4 hours in a platinum crucible and then quenched by immersion of the bottom of the crucible in water (classic quenching way). This process was repeated four times to ensure glass homogeneity. The samples have a slightly yellow coloration due to small Pt dissolution. It was recently shown that the solubility of Pt decreases with the addition of silica [Farges et al., Amer. Min., 84 (1999) 1562]. We use the notation Cax.y, where x and y refer to the molar percent of SiO2 and Al2O3, respectively, and 1-x-y is the CaO molar content. Silica glasses and the Ca0.39 glass were prepared by classic quenching with a cooling rate of ≈15°/s, and CA glasses were prepared by using a laser heating technique developed at the CRMHT (Orléans, France) with a fast cooling rate.Raman spectra were recorded with a new T64000 Jobin-Yvon® spectrometer (Institut de Physique du Globe de Paris) equipped with confocal optics and a nitrogen-cooled CCD detector. A microscope is used to focus the excitation laser beam (514 nm lines of a Coherent® Ar+ laser) to a 2 microns spot and to collect the Raman signal in the backscattered direction. XANES spectra were obtained on the SA32 beamline at SuperACO for the Al and Si K-edges and on the D44 station at DCI for the Ca K-edge at LURE (FRANCE).
Thermodynamics and rheologicals properties
Fig. 2 shows the glass transition temperatures obtained from viscosity measurements (log h = 13 Poises) as a function of SiO2 content for the three joins SiO2-R, with R=CaO/Al2O3 taken between 1 and 3. For all joins we observe an important decrease of the glass transition with decreasing SiO2 content, which is the result of the depolymerization of the network. The Tg varies of about 400 K between pure SiO2 (Tg~1500 K) and the center of the ternary system (Tg=1115 K for Ca33.33). For the join R=1, at the bottom of the ternary system, we observe a continuous increase of the Tg with decreasing silica content. The extrapolation of the experimental Tg values for this join yields for the CaAl2O4 composition a Tg of 1160±2 K. The increase of Tg as the SiO2 content decreases (SiO2 < 30 mol%) indicates that aluminium in tetrahedral coordination plays a role similar to the silicium in the SiO2-rich part, i.e. a network forming role in a three-dimensional network.A striking behavior is observed for the two other joins R=1.57 and R=3. The Tg values present a maximum at 10 and 20 mol% of silica, respectively. These augmentations are more important for the join R=3 than for the join R=1.57. These results are in good agreement with those of Highby et al.[J. Non-Cryst. Solids, 126 (1990) 206]. The explanation for this behavior will be explained below in relation with the structural modifications.
Structure X-ray and neutron diffraction techniques have been used to study the structure of these glasses [Cormier et al., J. Non-Cryst. Solids, 274 (2000) 110]. The data indicate that the network is based on SiO4 and AlO4 tetrahedra and that Ca atoms are in distorted sites providing charge compensation near AlO4 tetrahedra.
XANES spectra : Al K-edge XANES spectraIn Fig. 3a,b, we have plotted the Al K-edge spectra of different glasses along the join R=CaO/Al2O3 =1.57 and 3 respectively. These spectra are similar to those already published for minerals containing Al in 4-fold coordination. From this figure, we can conclude that Al is in 4-fold coordination in the calcic part of the SiO2-Al2O3-CaO ternary system. The silica-rich glasses present a strong peak, A, at 1566 eV and a shoulder, B, at 1569 eV. The intensity of the peak A decreases rapidly with increasing Al2O3 content and, conversely, the intensity of the peak B increases. Another feature is visible for all glasses at higher energy, peak C. A similar behavior was obtained for the join R=1.From results on crystalline references obtained along the Al2O3-CaO join, we suggest that the peak at 1572 eV in the Fig. 3a for the C3A can be attributed to Al in Q3 species. Some multiple scattering calculations are currently carried out in order to verify this assumption.
Si K-edge XANES spectraIn Fig. 4, we have plotted the Si K-edge spectra of different glasses along the join R=CaO/Al2O3 =3. Similar spectra were obtained for the joins R=1 and R=1.57. The silica-rich glasses present a noticeable white line, A, with a shoulder B and two others peaks C and D. The intensity of peak A decreases rapidly with increasing Ca3Al2O6, while the intensity of peak B increases. Peaks C and D are little affected by the chemical variations. Multiple scattering calculation will provide a relationship between these peaks and the polymerized network.
Si K-edge XANES spectraIn Fig. 4, we have plotted the Si K-edge spectra of different glasses along the join R=CaO/Al2O3 =3. Similar spectra were obtained for the joins R=1 and R=1.57. The silica-rich glasses present a noticeable white line, A, with a shoulder B and two others peaks C and D. The intensity of peak A decreases rapidly with increasing Ca3Al2O6, while the intensity of peak B increases. Peaks C and D are little affected by the chemical variations. Multiple scattering calculation will provide a relationship between these peaks and the polymerized network.
Figure 3a, b : Al K-edge spectra for glasses in the CAS system.Figure 3a, b : Al K-edge spectra for glasses in the CAS system.
Figure 4 : Si K-edge spectra for glasses in the CAS system
Raman spectra of crystals in the CA system
In Fig. 6, we have plotted the Raman spectra of CA crystals and clintonite (monoclinic, Al in Q3). The Raman spectrum of C3A (cubic, Al in Q3) presents a strong peak at 756 cm-1 with several weaker bands also in this region and a medium intensity peak at 508 cm-1 with a shoulder. A group of weaker bands appear betweens 150 and 400 cm-1. The structure of C3A is based on isolated six-membered rings of AlO4 tetrahedra. These rings are formed by corned sharing of two oxygens per tetrahedron defined as Al2 (AlO2) units. The strong Raman band at 756 cm-1 may be associated with a symmetric stretching vibration of the Al2 units. The weaker peaks at 508 cm-1 may be associated with the bridging oxygens in the Al-O-Al linkages. The C12A7 (cubic, Al in Q3 and Q4) presents a strong peak at 517 cm-1 with several weaker bands also in this region and a medium intensity peak at 764 cm-1. The aluminate framework may be described in terms of fully-polymerized tetrahedral aluminate groups, Q4, and tetrahedral AlO4 groups with one non-bridged oxygen, Q3. The CA (monoclinic, Al in Q4) is based on a fully-polymerized three-dimensional network of corned-shared AlO4 tetrahedra with calcium cation occupying large voids within the network. The Raman spectrum presents a strong band at 520 cm-1 with a shoulder at 545 cm-1, a weak band near 790 cm-1. The 520 and 545 cm-1 bands were related to motions of the bridged oxygen atoms in the Al-O-Al linkages in the plane bisecting the linkage and the 790 cm-1 band is associated with Al-O stretching vibrations. The CA2 (monoclinic, Al in Q4) is based on a fully-polymerized network of AlO4 tetrahedra similar to the feldspar structure. The Raman spectrum is very complex with modes covering the entire frequency range from 100 to 950 cm-1. The CA6 (hexagonal) is based on a spinel structure with Al in six- and four-fold coordination. The Raman spectrum of clintonite presents a strong peak at 656 cm-1 and a medium intensity peak at 894 cm-1. A group of weaker bands appear betweens 150 and 500 cm-1. The structure of clintonite is based on sheet isolated six-membered rings of AlO4 tetrahedra. These rings are formed by corned sharing of three oxygens per tetrahedron defined as Al3 (AlO3) units. Raman spectra on glasses along the CaO-Al2O3 join present similar band than those observed on the Raman spectra of crystal.
Raman spectra of glasses in the CAS systemThe Raman spectra for CAS glasses were plotted in Fig. 7 for the join R=1. For all glasses two regions were observed, a low frequencies band close to 550 cm-1, and a high-frequencies weak band, between 850 and 1200 cm-1. For silica-rich glasses, the bands are at 500 and 1150 cm-1. With decreasing silica content, these two bands are shifted to two bands near 600 and 850 cm-1. On the two joins (R=1.57 and 3), a similar behavior is observed. In Fig. 7, we observed a strong band centered near 500 cm-1, with a shoulder near 550 cm-1 and a weak band centered at 1100 cm-1. These results are similar to those observed by Seifert et al., [Amer. Min., 67 (1982) 696]. These 3 peaks evolve into 2 peaks near 550 and 925 cm-1 when SiO2 is decreased from 76 to 0 mole %. The high frequency region of the Raman spectra were deconvoluted using Igor® software. We find three Gaussians bands, near 1050, 1150 and 1200 cm-1, in the Raman spectra of SiO2 glass. The same number of bands occurs in all spectra for glasses with high silica content. In the Raman spectra of glasses along the join SiO2-CaAl2O4, we observe a continuous shift of these bands as a function of CaAl2O4 (see Fig. 8). These observations are consistent with continuous substitution of Al3+ for Si4+ in tetrahedral coordination in the two structural units for all compositions. There is evidence of new bands forming with decreasing SiO2. At low silica content, we observed a band at 870 and 890 cm-1 for respectively Ca0.50 and Ca12.44, and for the Ca12.44 a band at 1140 cm-1. We can propose that the band at 1140 cm-1 in the Ca12.44 correspond to isolated Si in Q4 species in the glasses and that the band near 780 cm-1 to Al in Q3 species.
We woud like to thank Dominique Ghaleb (CEA-Marcoule) for Molecular Dynamics calculations, François Farges (University of Marne-la-Vallée), and Valerie Briois (LURE) for their help in the data collection of the XANES at the Ca K-edge, and Georges Calas for fruitful discussions.
Ca K-edge XANES spectraXANES spectra of glasses (Fig. 5a) were similar with those observed for anorthite where six different features can be discerned. The peak B, is a shoulder of the white line (peak C), and its intensity increases with increasing SiO2 content, which could result from an increase in the Si-Ca linkages. A similar increase was observed for peak C. In Fig. 5b, we have plotted the extrated pre-edge, peak A, for glasses with low silica content, and for the anorthite glass and crystal. The pre-edge is related to the local geometry of the Ca site and can give information on the distortion of the site. At constant silica content, the pre-edge is shifted to higher energy with adding silica. The intensity of the pre-edge decreases with SiO2, which implies a decrease of the site distortion with adding silica. This result is in good agreement with that observed for anorthite glass and crystal where the pre-edge is smaller for the crystal than for the glass. These results show that the Ca environment is less constrained in silica-rich glasses than in aluminate glasses. XANES spectra and the analysis of the pre-edge feature indicate that Ca is present in a distorted site with 6-7 oxygen neighbors similar to the environment of Ca in crystalline anorthite. This environment is less distorted at high silica content.
Figure 1 : SiO2-Al2O3-CaO ternary system. Cax.y with x=SiO2 mole%, y =Al2O3 mole% and CaO mole% = 100-(x+y). The blue zone is the unmixing zone and the yellow zone is the high-liquidus and crystallization zone.
Figure 2 : Glass transition temperature as a function of SiO2.
Figure 5a : Ca K-edge spectra for glasses in the CAS system.
Figure 5b : Extracted pre-edge in the Ca K-edge spectra for glasses with low SiO2 content in the CAS system and for anorthite.
Figure 6 : Raman spectra on crystalline phase between CaO-Al2O3 and for clintonite.
Figure 7 : Raman spectra glasses along the join R=1=CaO/Al2O3.
Figure 8 : Frequencies of the deconvoluted bands as a function of SiO2 for join R=1.
0
1
2
3
4
5
1560 1570 1580 1590 1600 1610 1620 1630
no
rmal
ized
ab
sorb
ance
E, eV
Al K-edge R = CaO/Al2O
3 = 1.57
Ca0.39 (calcium aluminate glass)
A
B
C
calcium aluminate crystalC12A7
Ca55.18
Ca35.27
Ca20.31
Ca10.35
-1
0
1
2
3
4
5
6
7
1560 1570 1580 1590 1600 1610 1620 1630
no
rmal
ized
ab
sorb
ance
E, eV
R = CaO/Al2O
3 = 3
Al K-edge
A
B
C
D
Ca60.10
Ca42.14
Ca32.17Ca23.21
Ca16.21
Ca10.23C3A
Ca68.08
-1.2
-1
-0.8
-0.6
-0.4
-0.2
0
1820 1840 1860 1880 1900
Ca10.23Ca16.21
Ca42.14
Ca60.10
norm
aliz
ed a
bsor
banc
e
Energy, eV
Si K-edge
A
B
CD
R = CaO/Al2O
3 = 3
1000
1050
1100
1150
1200
Tg R=1
Tg R=3Tg R=1.57
Tg R=1.34
Tg R=1.5
Tg R=2
0 20 40 60 80 100
Mole % SiO2
Tg
(K)
R=CaO/Al2O3
Neuville, 2002
Higby et al., 1990
Cax.yx=%SiO2y=%Al2O3Mole%
SiO2
Al2O3CaO
Ca63.18
Ca50.25
Ca58.20
Ca70.15
Ca33.33
Ca29.36
Ca19.40
Ca76.11Ca77.07
Ca68.08
Ca60.10
Ca55.18Ca50.12
Ca50.00Ca48.0
3
Ca4
4.11
Ca46.07 Ca42.14
Ca39.22
Ca33.18Ca32.17
Ca38.15
Ca35.27
Ca23.21Ca20.31
Ca12.44Ca10.35Ca16.21
Ca10.23
Ca0.50
5050
50
Ca
0.3
9
Ca
0.4
5
Ca
0.3
0
C3
A=
Ca
0.2
5
C1
2A
7=
Ca
0.3
6
CA
=C
a0
.50
CA
2=
Ca
0.6
6
CA
6=
Ca
0.8
6
-1
0
1
2
3
4
5
-10 0 10 20 30 40 50 60
norm
aliz
ed a
bso
rbance
E - Eo, eV
Ca K-edge
Ca10.23
Ca16.21
Ca23.21
Ca32.17
Ca42.14
Ca60.10
R = CaO/Al2O
3 = 3
anorthite [6]
A
B
C
DE
F
-0.05
0
0.05
0.1
0.15
0.2
0.25
4037 4038 4039 4040 4041 4042
Ca10.23Ca10.35Ca12.44Ca19.40Ca20.31Ca23.21Ca0.39Ca50.25
anorthite [6]no
rma
lize
d a
bso
rba
nce
E, eV
Ca K-edge
0
100
200
300
400
500
600
700
200 400 600 800 1000CA6
C12A7
CA2
CA
C3A
clintonite
Inte
nsity
a.u
.
Wavenumber, cm-1
0
50
100
150
200
250
300
350
400
200 400 600 800 1000 1200 1400
Inte
nsi
ty,
%
Wavenumber, cm-1
Ca12.44
Ca19.40
Ca29.36
Ca33.33
Ca50.25Ca58.20
Ca63.18
Ca70.15Ca76.11
Ca0.50= CA glass
700
800
900
1000
1100
1200
0 20 40 60 80 100Mole % SiO2
Wav
enum
ber,
cm
-1
R=CaO/Al2O3=1
Si (Q4)T (Q4)
T (Q4)
1050 cm-1
Al (Q3 ?)
Al K-edge
R=CaO/Al O2 3
R=1
R=1.57R=3
ConclusionsWith the addition of silica, there is no evidence of abrupt structural modifications for the glasses presenting the highest Tg. This indicates that the variations in properties of these glasses with the addition of silica are not due to changes in the environment around Si atoms. We have shown that Si and Al atoms are introduced in a different way into the glass structure. Al is usually found in fully-polymerized Q4 sites, even in depolymerized aluminosilicate glasses. However for glasses with high CaO content, Al resides in Q3 as well as Q4 sites. The number of Q3 positions increases with CaO which implies a rapid decrease of the viscosity and of the glass transition temperature for low silica content.
Ca is in distorted sites with 6-7 oxygen neighbors in all glasses. The site distortion decrease with increasing SiO2 content. Al is in 4-fold coordination in all glasses.
We have presented the Raman spectra of glasses and crystal in the CAS ternary system. From Raman deconvolution, the bands position observed for the SiO2-CaAlO4 system is similar to that observed
for the SiO2-Na0.5AlO2 system, where three bands are found to evolve linearly with Al/Si substitution. We observed that Al can be substituted to Si in Q4 position in two structural unit with different intertetrahedral angle. This substitution corresponds to a decrease in frequencies with decreasing SiO2 content in aluminosilicate glasses. We proposed the attribution of some band to Al in Q species:- 840 cm-1 band correspond to Al in Q4,- 800-760 cm-1 band, can be attributed to the Al in Q3.


![An investigation of the feasibility of applying Raman ...s258347728.onlinehome.fr/cv/publi/SAA6290.pdf · Raman spectra of such pigments and such glasses[15]. In this case, the colouring](https://static.fdocuments.in/doc/165x107/6061ab2fbf99d90b1d0efe42/an-investigation-of-the-feasibility-of-applying-raman-raman-spectra-of-such.jpg)