X-Trace: A Pervasive Network Tracing Frameworkframework called X-Trace. A user or operator invokes...
14
X-Trace: A Pervasive Network Tracing Framework Rodrigo Fonseca George Porter Randy H. Katz Scott Shenker Ion Stoica Computer Science Division Univ. of California, Berkeley Berkeley, Calif. 94720-1776 {rfonseca,gporter,katz,shenker,istoica}@cs.berkeley.edu http://xtrace.cs.berkeley.edu Abstract Modern Internet systems often combine different ap- plications (e.g., DNS, web, and database), span differ- ent administrative domains, and function in the context of network mechanisms like tunnels, VPNs, NATs, and overlays. Diagnosing these complex systems is a daunt- ing challenge. Although many diagnostic tools exist, they are typically designed for a specific layer (e.g., tracer- oute) or application, and there is currently no tool for reconstructing a comprehensive view of service behav- ior. In this paper we propose X-Trace, a tracing frame- work that provides such a comprehensive view for sys- tems that adopt it. We have implemented X-Trace in sev- eral protocols and software systems, and we discuss how it works in three deployed scenarios: DNS resolution, a three-tiered photo-hosting website, and a service ac- cessed through an overlay network. 1 Introduction Internet services are built out of distributed components (e.g., load balancer, web server, backend database), make use of sophisticated network mechanisms (e.g., VPNs, NATs, overlays, tunnels), and can span multiple admin- istrative domains (e.g., the client’s web proxy and the server’s load balancer). When these complex systems misbehave, it is often quite difficult to diagnose the source of the problem. As an example, consider the infrastructure serving Wikipedia [27]. As of June 2006, they had servers spread across 3 sites, comprising 33 web caches chosen via DNS round-robin assignments, 4 load balancers, 105 web servers, and 14 database servers. A user’s request transits a cache server, and may also transit a load bal- ancer, a web server, and a database. Caching is done at each of these levels. Now suppose a user updates a page on Wikipedia, and fails to see her updates upon reloading the page. It is difficult to identify which cache, at which level, is returning stale data. Even if logs are kept, there is no common mechanism to determine which logs to ex- amine, or to correlate entries across multiple logs. It may also not be possible for administrators to reproduce the problem, since their requests would most likely take a different path through the system. Diagnostic tools do exist, but many of them are lim- ited to a particular protocol. For instance, traceroute is useful for locating IP connectivity problems, but can’t reveal proxy or DNS failures. Similarly, there are numer- ous alarm and monitoring suites for HTTP, but they can- not diagnose routing problems. While these tools are un- doubtedly useful, they are also typically unable to diag- nose subtle interactions between protocols or provide a comprehensive view of the system’s behavior. To this end, we have developed an integrated tracing framework called X-Trace. A user or operator invokes X-Trace when initiating an application task (e.g., a web request), by inserting X-Trace metadata with a task iden- tifier in the resulting request. This metadata is then prop- agated down to lower layers through protocol interfaces (which may need to be modified to carry X-Trace meta- data), and also along all recursive requests that result from the original task. This is what makes X-Trace com- prehensive; it tags all network operations resulting from a particular task with the same task identifier. We call the set of network operations connected with an initial task the resulting task tree. Constructing the task tree requires understanding the causal paths in network protocols. While in general this may be difficult, in most of the situations we have consid- ered so far this is relatively straightforward: for example, a recursive DNS query is clearly causally linked to the incoming request. X-Trace requires that network proto- cols be modified to propagate the X-Trace metadata into all actions causally related to the original task. This in- volves both understanding calls to lower-level protocols (e.g., HTTP invoking TCP) and initiating forwarded or recursive requests. X-Trace-enabled devices log the relevant information connected with each tagged network operation, which can then be reported back. The trace information associ- ated with a task tree gives the user or operator a compre- hensive view of what network operations were executed as part of a task. To illustrate, Figure 1 shows an exam- ple of the task tree involved in a simple HTTP request NSDI ’07: 4th USENIX Symposium on Networked Systems Design & Implementation USENIX Association 271
Transcript of X-Trace: A Pervasive Network Tracing Frameworkframework called X-Trace. A user or operator invokes...

X-Trace: A Pervasive Network Tracing FrameworkRodrigo Fonseca George Porter Randy H. Katz Scott Shenker Ion Stoica
Computer Science DivisionUniv. of California, BerkeleyBerkeley, Calif. 94720-1776
{rfonseca,gporter,katz,shenker,istoica}@cs.berkeley.eduhttp://xtrace.cs.berkeley.edu
AbstractModern Internet systems often combine different ap-
plications (e.g., DNS, web, and database), span differ-ent administrative domains, and function in the contextof network mechanisms like tunnels, VPNs, NATs, andoverlays. Diagnosing these complex systems is a daunt-ing challenge. Although many diagnostic tools exist, theyare typically designed for a specific layer (e.g., tracer-oute) or application, and there is currently no tool forreconstructing a comprehensive view of service behav-ior. In this paper we propose X-Trace, a tracing frame-work that provides such a comprehensive view for sys-tems that adopt it. We have implemented X-Trace in sev-eral protocols and software systems, and we discuss howit works in three deployed scenarios: DNS resolution,a three-tiered photo-hosting website, and a service ac-cessed through an overlay network.
1 IntroductionInternet services are built out of distributed components(e.g., load balancer, web server, backend database), makeuse of sophisticated network mechanisms (e.g., VPNs,NATs, overlays, tunnels), and can span multiple admin-istrative domains (e.g., the client’s web proxy and theserver’s load balancer). When these complex systemsmisbehave, it is often quite difficult to diagnose thesource of the problem.
As an example, consider the infrastructure servingWikipedia [27]. As of June 2006, they had servers spreadacross 3 sites, comprising 33 web caches chosen viaDNS round-robin assignments, 4 load balancers, 105web servers, and 14 database servers. A user’s requesttransits a cache server, and may also transit a load bal-ancer, a web server, and a database. Caching is done ateach of these levels. Now suppose a user updates a pageon Wikipedia, and fails to see her updates upon reloadingthe page. It is difficult to identify which cache, at whichlevel, is returning stale data. Even if logs are kept, thereis no common mechanism to determine which logs to ex-amine, or to correlate entries across multiple logs. It mayalso not be possible for administrators to reproduce the
problem, since their requests would most likely take adifferent path through the system.
Diagnostic tools do exist, but many of them are lim-ited to a particular protocol. For instance, tracerouteis useful for locating IP connectivity problems, but can’treveal proxy or DNS failures. Similarly, there are numer-ous alarm and monitoring suites for HTTP, but they can-not diagnose routing problems. While these tools are un-doubtedly useful, they are also typically unable to diag-nose subtle interactions between protocols or provide acomprehensive view of the system’s behavior.
To this end, we have developed an integrated tracingframework called X-Trace. A user or operator invokesX-Trace when initiating an application task (e.g., a webrequest), by inserting X-Trace metadata with a task iden-tifier in the resulting request. This metadata is then prop-agated down to lower layers through protocol interfaces(which may need to be modified to carry X-Trace meta-data), and also along all recursive requests that resultfrom the original task. This is what makes X-Trace com-prehensive; it tags all network operations resulting froma particular task with the same task identifier. We call theset of network operations connected with an initial taskthe resulting task tree.
Constructing the task tree requires understanding thecausal paths in network protocols. While in general thismay be difficult, in most of the situations we have consid-ered so far this is relatively straightforward: for example,a recursive DNS query is clearly causally linked to theincoming request. X-Trace requires that network proto-cols be modified to propagate the X-Trace metadata intoall actions causally related to the original task. This in-volves both understanding calls to lower-level protocols(e.g., HTTP invoking TCP) and initiating forwarded orrecursive requests.
X-Trace-enabled devices log the relevant informationconnected with each tagged network operation, whichcan then be reported back. The trace information associ-ated with a task tree gives the user or operator a compre-hensive view of what network operations were executedas part of a task. To illustrate, Figure 1 shows an exam-ple of the task tree involved in a simple HTTP request
NSDI ’07: 4th USENIX Symposium on Networked Systems Design & ImplementationUSENIX Association 271

IPIP
Router
IP
RouterIP
TCP 1
Start
TCP 1
End
IPIP
RouterIP
TCP 2
Start
TCP 2
End
HTTP
Client
HTTP
Proxy
HTTP
Server
Figure 1: A proxied HTTP request and the logical causalrelations among network elements visited.
through a proxy, showing the causal relations betweenoperations in the HTTP, TCP, and IP layers. X-Trace tasktrees are runtime traces of a task execution, and so longas individual components are integrated into the frame-work, there is no need for prior configuration of their de-pendencies.
Diagnosing problems often requires tracing a taskacross different administrative domains (which we willcall ADs). ADs may not wish to reveal internal informa-tion to each other, or to end users. Accordingly, X-Traceincorporates a clean separation between the client (useror operator) that invokes X-Trace, and the recipient ofthe trace information. For instance, when an end user no-tices a problem and invokes X-Trace, the trace informa-tion from her home network is delivered to her locally,the trace information from her ISP is delivered to the ISPsupport center, and the trace information from the website she was accessing is sent to the web site operator.Each of these parties can then deal with the informationas they see fit; sharing it with others, keeping it private, oreven not collecting it at all. The fact that X-Trace givesthem a common identifier for the task enables them tocooperate effectively if they so choose.
Realistically, we know all layers in the stack and dif-ferent ADs will not deploy X-Trace-enabled protocolsand devices simultaneously. However, individual proto-cols, applications, or ADs can benefit immediately fromX-Trace if they support it. If a particular protocol orapplication gets instrumented alone, one gets horizontalslices of the task tree, which are useful for developers andusers. If an AD alone deploys it on multiple layers withinits network, it gets to internally visualize the portion ofthe task tree that happened inside of its domain. In ad-dition, there is a “network effect” for adoption: as moreprotocols and networks integrate into the framework, X-Trace offers a common framework for their sharing ofthis information, increasing the value for all parties.
There has been much prior work on the study of appli-cation behavior, network monitoring, and request track-ing. We discuss this related work in detail in Section7 and only note here that the main differentiating as-pect of X-Trace is its focus on tracing multiple applica-tions, at different network layers, and across administra-tive boundaries. Section 4 highlights these features in thecontext of three specific examples. However, X-Trace is
applicable to a wide variety of other protocols, such asSIP, RPC, and email.
While we feel that X-Trace provides a valuable ser-vice, it certainly has significant limitations. They are dis-cussed in detail in Section 6, but we note them brieflyhere. First, implementing X-Trace requires modificationsto clients, servers, and network devices; protocols thatcan’t already do so must be altered to carry X-Tracemetadata, and their implementations must log the rele-vant trace information. While these changes are concep-tually simple, in practice retrofitting X-Trace into exist-ing applications is a process of varying difficulty; ourexperiences in this regard ranged from trivial to quitechallenging. Second, when X-Trace is only partially de-ployed, the ability to trace those parts of the networkis impaired, sometimes entirely. Third, lost trace reportscan limit reconstruction of the request tree and can leadto false positives in diagnosing faults (i.e., the lack oftrace data may be interpreted as a failure). Fourth, ourenforcing a tree structure on the set of network oper-ations related to a particular task means that there aresome request topologies that we cannot capture. For ex-ample, X-Trace is not able to naturally capture requeststhat rendezvous at a node where they are merged into asingle request. It isn’t clear, for instance, what should beconsidered causally-related in a routing protocol.
Because X-Trace only records paths that were taken, itis not a tool to assert global invariants about all possiblepaths. There are many problems for which X-Trace willnot determine the cause, but will rather show the effect.While not an introspective debugger, it will point out thecomponents involved in the operation, guiding the use ofother tools to verify the cause. Examples of these casesare state corruptions that would cause a router to mis-route packets, or an overloaded CPU that would cause amessage to be dropped.
The rest of the paper is structured as follows. In Sec-tion 2, we describe the model and architecture of X-Trace. In Section 3, we describe our implementation ofthe X-Trace architecture. Section 4 describes three de-ployments of X-Trace and pinpoint six network errorconditions. Section 5 discusses other uses of the sys-tem. In Section 6, we discuss the limitations of and se-curity considerations raised by X-Trace. In Section 7, wediscuss at length how X-Trace relates to previous work.Lastly, we conclude in Section 8.
2 Design Principles and Architecture
2.1 Design Principles
A key function of X-Trace is to reconstruct the task treeof all sub-operations making up the task. We now con-sider three principles that guided our design:
NSDI ’07: 4th USENIX Symposium on Networked Systems Design & Implementation USENIX Association272

IP EndpointIP
RouterIP Endpoint
TCP 1Start
TCP 1End
HTTP
Client…
A- -ID:1
X-Trace Metadata
TCP 2
Start
IP Packet
ZYID:1
X-Trace Metadata …
… BAID:1
X-Trace Metadata
TaskID
ParentID
OpID
EdgeType
pushNext() pushNext()
pushNext()
pushDown()
pushDown()
pushDown()
IP Packet
YXID:1
X-Trace MetadataXMID:1
X-Trace Metadata
MAID:1
X-Trace Metadata
HTTP GET
BAID:1
X-Trace Metadata
TCP Control Frame
NMID:1
X-Trace MetadataQCID:1
X-Trace Metadata
HTTP GET
CBID:1
X-Trace Metadata
Legend:HTTP
Proxy
pushNext()
pushNext()
Causal Relation
X-Trace propagation
Figure 2: Propagation of X-Trace metadata in the example in Figure 1. Causal edges in the task tree are captured bythe ParentID, OpID, and EdgeType fields. The TaskID remains the same for all the operations that comprise the task.
1. The trace request should be sent in-band, rather thanin a separate probe message.
The first principle highlights our desire to probe whathappens on the actual datapath we want to diagnose. Out-of-band probes might not end up following the same pathas the original datapath. It follows that we need to addmetadata to the same datapath that we want to trace. InX-Trace this metadata contains an identifier common toall operations in a task tree, which is added to messagesand propagated by devices along the entire path.
2. The collected trace data should be sent out-of-band,decoupled from the original datapath.
This principle relates to gathering of trace informa-tion. If we appended trace information to the metadataencoded in the datapath, then we might lose this infor-mation in the event of network failure. Also, this wouldincrease the overhead of messages. Obtaining trace dataduring periods of failure is especially important to thiswork. It follows that we need an out-of-band, orthogonalmechanism to record and collect trace data. Addition-ally, by decoupling trace reporting from the datapath, welessen the impact of X-Trace on the datapath’s latency.
3. The entity that requests tracing is decoupled fromthe entity that receives the trace reports.
As we discuss in §2.3 below, separating the user whoinserts the X-Trace metadata in the datapath from thedestination of the trace reports generated by componentsalong the path allows for flexible disclosure policies ofthe trace information for each AD. Each AD keeps con-trol of the information, while the common identifier al-lows them to cooperate in solving problems if necessary.
X-Trace places the minimal necessary mechanismwithin the network, while still providing enough infor-mation to reconstruct the path. The data itself is not
kept in the network path, but rather reported to specificplaces determined by ADs. The X-Trace metadata con-tains enough information for ADs to communicate traceinformation back to the user if it so chooses.
2.2 X-Trace Metadata
In the following section, we describe the format andstructure of the tracing metadata introduced by our sys-tem, as well as the way that metadata is propagatedthrough applications.
Format and structure X-Trace metadata is the infor-mation placed into each layer to support the X-Traceframework. It is inserted into a network task by the client,if it is X-Trace capable. For legacy clients, devices in thenetwork can add them. Network operators can insert X-Trace metadata for operations traversing their AD.
Within that metadata is a task identifier, whichuniquely identifies each network task. This identifiershould be unique among all of the reports accessed byan X-Trace user. X-Trace metadata is carried by the ex-tension, option, or annotation fields within each networkprotocol. Examples of such fields are IP options, TCPoptions, and HTTP headers. It is replicated across layers,ensuring that devices on the path can access it withouthaving to violate layering.
The metadata contains an optional field, TreeInfo, usedby nodes to record causal relations between operations.It consists of a three-tuple: (ParentID, OpID, EdgeType).ParentID and OpID encode edges in the task tree. TheEdgeType field indicates the type of that edge: either con-necting two adjacent nodes at the same layer, or betweena node at one layer with a node at a lower layer. The Par-entID and OpID fields should be unique with respect toone task identifier. We describe how network devices ma-nipulate these fields below. An optional destination field
NSDI ’07: 4th USENIX Symposium on Networked Systems Design & ImplementationUSENIX Association 273

is used to send trace data to interested parties. This is de-scribed in detail in below, and its security implicationsare addressed in Section 6.
Figure 2 shows in full detail the contents and the prop-agation of X-Trace metadata (described in the next sec-tion) in part of the task tree from Figure 1. In particu-lar, the successive values of the ParentID, OpID, and Ed-geType fields allow the complete task tree to be recon-structed for this TaskID.
Propagation: pushDown() and pushNext() De-vices and network elements on the path are respon-sible for propagating the X-Trace metadata along thepath using two simple primitives: pushDown() andpushNext(). These primitives have the goal of ensur-ing that X-Trace metadata stays with the datapath. Theymanipulate the TreeInfo field of the X-Trace metadata, asshown in Table 1, recording the causal relations betweenoperations in the path. The table shows how the fields inthe current X-Trace metadata are mapped into the nextmetadata, for both primitives. The unique() functionreturns an identifier that is unique in the context of oneTaskID.
The pushDown() primitive is responsible for copy-ing X-Trace metadata from one layer to the layer be-low it. In Figure 2, all of the vertical arrows representpushDown() operations. In this case, the HTTP proxyhas to call pushDown() to copy the metadata into thenewly generated TCP 2 connection. Likewise, the TCPprocess in the proxy has to call pushDown() to copythis metadata down to the new IP path. Note that we donot make any a priori assumptions as to the number or or-dering of layers in a protocol exchange: pushDown()works recursively, with each layer only naturally inter-acting with the layer immediately below.pushNext() is a primitive used by nodes on the
datapath to propagate X-Trace metadata to the nexthop in the same layer. In Figure 2, the HTTP proxycreates a new HTTP connection to the server. It callspushNext(), which copies the metadata into the head-ers of that new connection, and captures the causal linkbetween the two. All horizontal edges in the figure arepushNext() operations at their respective layers.
Since the X-Trace metadata is embedded into the mes-sages at each layer, propagation happens at the same timeas the messages are sent. In particular, if messages arestored for later forwarding, as is the case with email mes-sages [10], the causal relations will still be preserved andrecorded properly.
2.3 Task Tree Reconstruction
Collecting trace data with reports When a node seesX-Trace metadata in a message at its particular layer,it generates a report, which is later used to reconstruct
TreeInfo operations
pushNext()next.parentID ⇐ current.opIDnext.opID ⇐ unique()next.type ⇐ NEXT
pushDown()next.parentID ⇐ current.opIDnext.opID ⇐ unique()next.type ⇐ DOWN
Table 1: Effect of both propagation primitives map-ping a current X-Trace metadata to a next metadata.unique() returns an ID unique within one task.
the datapath. This report generation operation is separatefrom propagating X-Trace metadata, and is specific to thetree reconstruction aspect of our application.
Reports contain a local timestamp, the TaskID they re-fer to, and information that is specific to the node sendingthe report. Devices only report information accessible attheir own network layer. For example, an HTTP cachemay report on the URI and cookie of the request, andthe action taken upon receiving the request. It can alsoadd systems information such as the server load at thetime. IP routers, on the other hand, report informationcontained in the IP headers of packets, such as source anddestination addresses, and can add other relevant perfor-mance information such as current queue lengths.
The reports generated by devices within one AD arekept under the control of that AD, according to its pol-icy. That policy could be to store all the reports in localstorage, such as a database. The AD can use this store ofreports to diagnose and analyze flows transiting its net-work. Section 4.2 shows how a web hosting site uses lo-cally generated and stored reports to diagnose faults inits components.
The X-Trace metadata has an optional Destinationfield. If present, this field signals that a user (locatedat that destination) is interested in receiving the tracedata as well. This user might be the client, or it couldbe any delegated report server. This indirection is use-ful for users behind NATs, since they are not addressablefrom the Internet. The AD uses its policy to respond tothis request. The simplest policy is for each device to justsend reports directly to the indicated destination, whichwould collect them and reconstruct the task tree. Thismay not be desirable, though, because AD’s in generalwill want to control who has access to what granular-ity of data. One possible mechanism that uses indirec-tion works as follows. The AD still collects all reportslocally in a private database. It then sends a special re-port to the user, containing a pointer to the report data.The pointer could be the URL of a page containing thetrace data. This gives each AD control of the visibilityof the trace information, by requiring users authenticate
NSDI ’07: 4th USENIX Symposium on Networked Systems Design & Implementation USENIX Association274

AD A
AD B
Local report
databaseData Traffic
Wide-area X-Trace Reports
Local X-Trace Reports
X-Trace Annotated Traffic
(report dest = R)
R: report server
S: sender
Local report
database
Figure 3: An example of wide-area reporting. The clientembeds X-Trace metadata with a message, setting the re-port destination to R. Different ISPs collect reports lo-cally, and send pointers to R so that the client can laterrequest the detailed reports.
themselves when they fetch the data. The AD can makeuse of this authentication information when choosing thelevel of detail of the report information returned to theuser. We describe this usage in more detail in Section 3.Note that all the information needed to get a report to auser is kept in the X-Trace metadata, meaning that nodesin the network do not need to keep any per-flow state toissue reports.
Figure 3 shows a sender S who sets the destinationfor reports as being the report server R. ADs A and Bsend pointer reports to R, and either the client or R itselffetches these reports later. A special case is when the userof X-Trace is in the same AD as the devices generatingreports, such as network operators performing internaltroubleshooting. X-Trace metadata gets added at the ADingress points. The network operators go directly to thelocal report databases, and there is no need to use thedestination field in the metadata.
Offline reconstruction of the task tree Task tree re-construction is an offline process performed by the userthat reconstructs the request path of the data connection.After the user collects reports from the reporting infras-tructure, they examine them to reconstitute the requesttree. Each of the reports is treated as a directed edge, ei-ther a “down” edge or a “next” edge, corresponding topushDown() and pushNext() operation. After re-constructing the tree, the client can examine the nodesand paths that the request took. For transitory errors, thistree serves as a permanent record of the conditions thatexisted at the time of the connection. Additionally, anyperformance data included by the devices in the reportscan be used to correlate failures in the datapath with de-vices that may be under-performing due to overload.
The reconstructed tree is the end product of the tracingprocess, and can be stored, associated with trouble ticketsystems, or used by operators as a record of individual
Flags
TaskI
D
Paren
tID
OpID
EdgeTyp
e
Type
Addre
ss
Optio
ns
TreeInfo Destination
Figure 4: The X-Trace metadata and its fields. Shadedfields are optional.
failure events for reliability engineering programs.
3 ImplementationIn this section we describe how we implemented the ar-chitecture described above. We discuss the representa-tion of the X-Trace metadata and its propagation, a lo-cal reporting infrastructure, and a prototype for inter-ADreporting, as well as a simple procedure to reconstruct atask tree from a series of reports. We present some micro-benchmarks, and close the section with a discussion ofissues that arise when integrating X-Trace into new andexisting protocols and applications.
3.1 Identifier format and semantics
Figure 4 shows the format with which we encode the X-Trace metadata. It consists of two required fields, andthree optional ones:
Flags: The flags field contains bits that specify whichof the three optional components of the X-Trace meta-data are present: TreeInfo, Destination, and Options.
TaskID: Our design supports 4, 8, 12, or 20 byte in-teger fields to represent the TaskID. The TaskID must beunique within 1) a window of time, and 2) a reporting do-main. The window of time must be long enough so thatno two tasks that overlap in time share the same ID.
TreeInfo: (Optional) The TreeInfo field holds threesubfields: ParentID, OpID, and EdgeType. ParentID andOpID are each 4 bytes long. These IDs must be uniquewithin the context of a single task ID. We implement theunique() function as a random number generator. TheEdgeType field is implemented as one byte, with onlytwo values currently encoded: NEXT and DOWN.
Destination: (Optional) X-Trace metadata can option-ally contain a destination, which is a network address thatX-Trace reports should be sent to, as described in Sec-tion 2.3. The Destination field consists of two portions,a type, and an address. Currently implemented types areshown in Table 2.
Options: (Optional) To accommodate future exten-sions to the X-Trace identifier format, we include an op-tions mechanism. The Options block, if present, consists
NSDI ’07: 4th USENIX Symposium on Networked Systems Design & ImplementationUSENIX Association 275

Type Protocol Destination
Explicit
UDP IPv4:portTCP IPv4:portI3 I3 idXMLRPC OpenDHT key
ImplicitLocal ConfiguredProxy Configured
Table 2: Types of X-Trace report destinations.
Application 1
libxtrreport XTR Report
Daemon
udp
tcp
i3
local
openDHT
Application 2
libxtrreport
xtrd proxy
Wide-area
X-Trace aware node
Neighbor XTR
Report Daemon
X-Trace ID embedded report destination
Administrator configured report destination
Figure 5: X-Trace reporting architecture.
of one or more individual options. Each consists of atype, a length, and then a variable length payload.
3.2 Reporting infrastructure
Report format A report is an ASCII message consist-ing of a header section followed by a body section. Thefirst line of the header identifies the layer issuing the re-port. The rest of the headers are specified as key-valuepairs, similar to headers in RFC 822 [10]. The body ofthe report is free-form, and the content is set by the de-vice issuing the report and other operator policy.
Reporting libraries and agents Included with X-Trace is libxtrreport, a reference implementationof a client library that can be linked into applications forissuing reports. This library is very thin, and simply re-lays reports to a locally running daemon process.
The report daemon (see Figure 5) uses a UDP socketto listen for reports from the libxtrreport library.A thread listens for these reports, and places them on aqueue. Another thread pulls reports off this queue, andsends them to the appropriate handler module. Thesemodules, which run in separate threads, can forward thereport to another report server, send it to a service likeOpenDHT [21], or send it to any of the other destina-tions listed in Table 2. For local destinations, we makeuse of a Postgres SQL database for report storage.
We also implemented a packet sniffing application thatcan send reports on behalf of services and applicationsthat cannot be modified to include libxtrreport.
This application snoops network traffic using thelibpcap library, sending reports for any protocols thatit supports. Currently, this application supports the IP andTCP protocols. Network switches can make use of portmirroring to mirror traffic to this agent.
Inter-AS reporting We implemented a special case ofInter-AS reporting in the web hosting scenario describedin Section 4.2. The front end webservers included twoHTTP headers in the response sent back to the client.The first contains a URL for collecting trace informa-tion about the request. The second is the X-Trace taskidentifier associated with the network operation. This isincluded to simplify handling at the client, as well as forenvironments in which the X-Trace metadata was addedby the frontend webservers. We wrote a Firefox exten-sion that reads these HTTP headers, and provides theuser with a visual indicator that the page they are vis-iting is “X-Trace enabled”, as well as a button they canclick to fetch the trace data from the provided URL.
3.3 Offline tree reconstruction
Our implementation of the task tree reconstruction isquite simple, and can serve as the foundation for other,more complex, visualizations. We initially start by build-ing a graph, G, consisting of the node represented bythe first report. For each additional report we receive,we look for its parent (given by its IDparent field) in thetree. If this new node’s edge type is NEXT, we attach thenode on the same level as the parent. If the node type isDOWN, we attach the node at the level below the parent.
3.4 Performance
We tested the performance of the metadata propagationand the reporting aspects of our reference implementa-tion of X-Trace. For the propagation, we measured the la-tency of pushNext(). This operation is blocking, andif implemented in a router, would have to be performedon a per-packet basis on the forwarding path.
We implemented pushNext() in the C language andtested it on a 64-bit Intel Pentium 4 CPU running at 3.2GHz. We applied pushNext() to 576-byte packets,and found the average time required to be 0.71µs. Takenin isolation, this processor could apply the operation toover 1.4 million packets per second. In fact, hardwareimplementations could be much faster.
To test the performance of the reporting infrastruc-ture, we used the Apache web benchmarking tool, ab,against two otherwise identical Apache websites: onewith reporting turned on and one without. The reportstore in this test was a separate Postgres database. Of the10,000 requests we issued to the site, none of the reportswere dropped by the reporting infrastructure. The regular
NSDI ’07: 4th USENIX Symposium on Networked Systems Design & Implementation USENIX Association276

server sustained 764 requests/sec, with a mean latency of1.309 ms. The X-Trace enabled server sustained 647 re-quests/sec, with mean latency of 1.544 ms, which showsa 15% decrease in total system throughput.
3.5 Providing Support for X-Trace
Adding X-Trace support to protocols and applications in-volves three steps: (i) adding X-Trace metadata to mes-sages exchanged, (ii) adding logic to propagate the X-Trace metadata within the implementation, followingcausal paths, and (iii) optionally adding calls to gener-ate reports at interesting points of the message flow.
(i) Metadata To support X-Trace, a layer or applica-tion must embed X-Trace metadata in the messages itexchanges with peers. The difficulty of this for existingprotocols depends on their specification. For example, itis simple for HTTP, because its specification [11] allowsfor extension headers, and dictates that unknown exten-sions be forwarded unmodified to next hops by proxies.Other protocols like SIP [22], e-mail [10], IP, TCP, and I3share this characteristic. For protocols without an exten-sion mechanism, one has to resort to either changing theprotocol or overloading some existing functionality. Inthe implementation of Chord that comes with I3 we hadto create a new type of message. Table 3 gives details onadding metadata to these and some other protocols.
(ii) Propagation Applications must support two as-pects of X-Trace identifier propagation: (a) carry-ing X-Trace metadata between incoming and outgo-ing messages, and (b) manipulating the metadata withpushDown() and pushNext() operations to cor-rectly record the causal relations. We implemented sup-port in C/C++, Java, and PHP for easily manipulating X-Trace metadata, including performing the pushDown()and pushNext(), such that few lines of code need tobe added to perform (b), once (a) is in place.
In our experience, we found that capturing the causalconnections within the application presented the high-est variability in difficulty, as it requires understandinghow received messages relate to outgoing messages, andmay require following long chains of calls within theimplementation. If the implementation associates a con-text data structure with the processing of a message, itmay be easy to add X-Trace metadata to the data type,which gets carried with the processing flow automati-cally. Apache and I3 fall into this category. Other imple-mentation structures require more work, as in the case ofChord: we had to create a parallel path of functions withan extra X-Trace metadata parameter following the callpath from receiving the message until sending it. Instru-menting concurrency libraries and runtime environmentsmay ease or automate this propagation [9, 20, 8]. We arecurrently adding X-Trace support for libasync [17].
Original Forwarding Code
forwardMessage(msg)
dest = nextHop(msg)
lowerLayer.send(msg,dest)
With added X-Trace Propagation
forwardMessage(msg)
dest = nextHop(msg)
xtr = msg.getXTraceMetadata()/* Propagate to the next hop */
msg.setXTraceMetadata(xtr.pushNext())/* Propagate to the lower layer */
lowerLayer.setXTraceMetadata(xtr.pushDown())
lowerLayer.send(msg,dest)
Figure 6: Pseudo-code highlighting changes for captur-ing causal relations with X-Trace
The pseudo-code shown in Figure 6 shows a typicalexample of the calls that are needed for full identifierpropagation in the forwarding function of an application.We assume that the message abstract data type providesmethods for getting and setting X-Trace metadata in themessage, and that the lower layer also provides an API toset the X-Trace metadata for its messages. This exampleis patterned on the code we implemented in the applica-tions and protocols we modified.
(iii) Integrating Reporting The remaining task is toget network elements – devices, protocol stacks, and ap-plications – to issue reports of interesting events. Forhardware devices like routers and appliances, one needsto modify the software running on the control processor.However, using the feature of port mirroring in switches,a network administrator can insert nodes that would re-port on traffic seen without slowing down the data path.The routers would still have to do the propagation, butnot bother to call reporting functions. For software im-plementations, it is straightforward to integrate the re-porting library, which is similar to adding a logging sub-system to the application.
4 X-Trace Usage Scenarios
In this section, we describe several scenarios where X-Trace could be used to help identify faults. We discussthree examples in detail–a simple web request and ac-companying recursive DNS queries, a web hosting site,and an overlay network. We deployed these exampleswithin one AD, and thus do not make use of the wide-area reporting mechanism. We follow these exampleswith a description of other scenarios.
NSDI ’07: 4th USENIX Symposium on Networked Systems Design & ImplementationUSENIX Association 277

Table 3: Support for adding metadata to some protocols. We have implementations for the protocols in italics.Protocol Metadata CommentHTTP, SIP, Email Extension Header Out-of-the box support for propagation. The only change is for causal relations.IP IP Option Automatic propagation. Dropped by some ASs, wide-area support varies [12].TCP TCP Option One-hop protocol, no next hop propagation. Linux kernel changes are needed.I3 I3 Option Support for options, but had to add handling code.Chorda No support Mirrored augmented call path for new X-Trace data message.DNS EDNS0 OPT-RR The EDNS0 [26] extension to DNS allows metadata to be added to messages.SQL SQL Comment Possible to encode X-Trace metatada within a SQL comment.UDP, Ethernet No support Must change protocol or use shim layer.
aThe Chord implementation bundled with the I3 distribution.
Browser
10.0.62.14343
00000000.C4C28B4F.next
URL: www.cs.berkeley.xtrace
/index.html
Browser
10.0.62.143
C4C28B4F.E8269F38.down
Lookup: www.cs.berkeley.xtrace
DNS Authoritative
10.0.62.223
8CFECDB5.A6BE651A.next
Delegate: xtrace.
Browser
10.0.62.143
C4C28B4F.00EDB8D3.down
HTTP-get: http://10.0.132.232
/index.html
DNS Recursor
10.0.62.222
E8269F38.8CFECDB5.next
Query: www.cs.berkeley.xtrace.
DNS Authoritative
10.0.62.224
8CFECDB5.0CD2FD05.next
Delegate: berkeley.xtrace.
DNS Authoritative
10.0.62.225
8CFECDB5.0481D249.next
Delegate:cs.berkeley.xtrace.
DNS Authoritative
10.0.62.226
8CFECDB5.F8655C76.next
Answer: 10.0.132.232
Apache
www.cs.berkeley.xtrace
00EDB8D3.B2852391.next
URL: /index.html
Figure 7: The complete HTTP and recursive DNS treerecovered by the X-Trace tool
4.1 Web request and recursive DNS queries
Overview The first scenario that we consider is thatof requesting a web page from a server. Figure 7 showsthe tree corresponding to a simple web request. The userstarts by typing a URL into her browser, in this casehttp://www.cs.berkeley.xtrace/index.html. The browser’shost first looks up the provided hostname using a nearbyDNS resolver, which returns the IP address of that host(10.0.132.232). If the resolver does not have the re-quested address in its cache, it will recursively contactother DNS servers until a match is found. It can then is-sue the HTTP request to the resolved IP address.
Tracing each of these “subtasks” is a challenge: HTTPrequests could be forwarded through proxies or caches,masking their ultimate destination. DNS requests are re-cursive in nature, are cached at intermediate servers, andspan different administrative domains. This can easilylead to misconfigurations and inconsistent views.
X-Trace support We added support for X-Trace tothe DNS protocol by using the EDNS0 [26] extensionmechanism. This backwards-compatible mechanism al-lows metadata to be associated with DNS messages, andis increasingly supported in the wide area. We modifieda DNS client library, an authoritative DNS server, as wellas a recursive DNS resolver to support X-Trace metadatapropagation and reporting.
We deployed this software in our local testbed, and
created a parallel top-level domain (.xtrace). Figure 7shows the final tree. In this example, the task hastwo subtasks, indicated by pushDown(): resolvingthe name, and fetching the page. A Java-based webbrowser issues the query to the DNS client library,which encapsulates the X-Trace metadata (after callingpushNext()) in an EDNS0 field of the query. Thisquery is forwarded to the resolver on 10.0.62.222, whichrecursively looks up the address in other, authoritativenameservers, after calling pushNext() at each stepof the recursion. Lastly, each of our authoritative name-servers issues reports when they receive queries with X-Trace/EDNS0 records in them. When the name resolu-tion is complete, the browser issues an X-Trace enabledHTTP query (after calling pushNext()).
Fault isolation An X-Trace enabled DNS might un-cover several faults that are difficult to diagnose today.At each step of the recursive resolution described above,servers cache entries to reduce load on the top-levelservers. A misconfigured or buggy nameserver mightcache these entries longer than it should. If a server’sIP address changes, these out-of-date servers might re-turn erroneous results. A trace like that in Figure 7 wouldpinpoint the server responsible for the faulty data.
Faults could occur in the HTTP portion of the task aswell. We describe the application of X-Trace to web traf-fic in the following section.
4.2 A web hosting site
Overview The second scenario that we consider is aweb hosting service that allows users to post and sharephotographs. We deployed an open-source photo appli-cation in our network on an IBM Bladecenter. The front-end webserver host Apache and PHP. The photos, meta-data, and comments are stored in a Postgres database.Also included are a cache and load-balancer. The photosite has attracted approximately 200 visitors a day for aperiod of two months.
For this site to support X-Trace, we implemented a re-porting module for Apache, and one for Postgres. To sup-port legacy web clients, we implemented an “X-Traceheaders” module that inserted X-Trace headers into re-
NSDI ’07: 4th USENIX Symposium on Networked Systems Design & Implementation USENIX Association278

quests from the legacy clients.X-Trace can be invoked by either end users or by the
operator. End users can invoke X-Trace in two ways: byusing an X-Trace-enabled web browser, or an X-Trace-equipped web page. We implemented an X-Trace toolbarfor the Firefox web browser that puts X-Trace metadatain requests. We also implemented a Javascript/PHP li-brary that added a feature to selected webpages in thesite that let the user report problems via an HTML form.These reports were internally coupled with the X-Tracemetadata of the user’s request, enabling the network op-erator to match their complaint with a trace of their ses-sion. This is a powerful mechanism to detect semanticfaults that would appear normal from the web site’s per-spective, such as stale pages or logic errors in a wellformed response. This is not necessary for all faults,since many requests might generate anomalous task treesthat can be analyzed with methods such as Pinpoint [9].
Tracing a request through the scenario The clientapplication (i.e., Firefox with our X-Trace extension) cre-ates a new X-Trace metadata and initializes its TreeInfofields. It issues an annotated request to the front-endcache. This cache issues a report based on fields in the re-quest and the X-Trace metadata. It calls pushNext()on the metadata, and forwards it on, possibly to othermiddleboxes such as load balancers that might also beon the path. When the Apache process on the front-endtier receives the request, it issues a report that includesthe URL, status code, and time of the request.
The PHP-based photo software creates SQL state-ments to retrieve images and metadata from the back-end database. We modified this code to retrieve the X-Trace metadata from the array of HTTP headers and callpushNext() on it. The new metadata is propagated tothe database by enclosing it in a SQL comment (i.e., /*X-Trace:023A2E... */). The query is sent to thedatabase, which looks for embedded X-Trace metadata.It calls xtr report()with the query as the payload ofthe report. When the webserver sends the response backto the client, it adds two headers to the response: one hasthe X-Trace metadata (in case it was generated by thewebserver), and the other has a URL that the client canaccess to examine the trace of the request.
If any additional requests are generated because of thatresponse (e.g., for images), the Firefox extension will usethe same TaskID. For clients that don’t support X-Trace,then each request (including images) will be consideredindependent.
Using X-Trace In this section we introduce severalfaults into the photo hosting site. These are based on first-hand experience that we had with our deployed system.
The first fault we consider is that of a malfunction-ing PHP script on the front-end web servers. From the
Apachextrace.cs.berkeley.edu
04E9E92A.C1B25697.next2006-09-26 13:23:42.801007
URL: /faults/query.php
Apacheweb1
C1B25697.72CBD74A.next2006-09-26 13:23:42.8085
URL: /faults/query.php
notifyProblem.cgi
C1B25697.72CBD74A.next2006-09-26 13:23:46.82021
<Problem Report>
Figure 8: A request fault, annotated with user input
Chord Ring
I3 Overlay Network
IP Network
Sender
Middlebox
Receiver
Figure 9: X-Trace on an I3 overlay scenario. A client anda server communicate over I3. Shown are the Chord net-work on top of which the I3 servers communicate, andthe underlying IP network.
user’s point of view, this could either be a fault in thePHP script, or a fault in the database. Examining Figure 8shows immediately that the fault is the former–there areno reports from the database, pinpointing the problem tothe PHP script. Figure 8 shows a square node that rep-resents a problem report issued by the user, using thePHP/Javascript web problem reporting tool. In additionto triggering an alarm for the operator, the report nodeindicates which page caused the problem, in this case,/faults/query.php, located on web1.
Next, based on the Wikipedia example, we imple-mented a web cache that inadvertently returns stale im-ages from its cache. Diagnosis in this case is simple. Therequest trace will include nodes up to and including thecache, but will not include the origin server.
The last fault we consider in this scenario is that ofa malfunctioning web load balancer, which sends trafficto a server that doesn’t contain the appropriate content.When users request pages from the site, they will some-times get the pages they wanted, while other times theywill get 404 File Not Found errors. In both cases,the load balancer issues a report with the request URL.Successful requests also include reports from the work-ing web server and backend database, while unsuccessfulrequests only include a report from the web server.
4.3 An overlay network
The third scenario we look at in some detail is an over-lay network. Overlay networks are routing infrastruc-tures that create communication paths by stitching to-
NSDI ’07: 4th USENIX Symposium on Networked Systems Design & ImplementationUSENIX Association 279

gether more than one end-to-end path on top of the un-derlying IP network. Overlays have been built to providemulticast [13], reliability [2], telephony [22], and datastorage [25] services. It is difficult to understand the be-havior and diagnose faults in these systems, as there areno tools or common frameworks to allow tracing of dataconnections through them.
In our example, we use the I3 overlay network [24].For our purposes, it suffices to say that I3 provides aclean way to implement service composition, by inter-posing middleboxes on the communication path. The im-plementation of I3 we used runs on top of the ChordDHT [25], which provides efficient routing to flat identi-fiers and is an overlay network on its own.
We added X-Trace metadata to the I3 and Chordprotocols, code to perform the pushNext() andpushDown() propagation operations, as well as callsto the X-Trace reporting library. The scenario topologyis shown in Figure 9, and consists, at the highest layer,of a very simple protocol involving a sender, a receiver,and a middlebox interposed in the path by the sender.We used a toy protocol we called SNP – Simple NumberProtocol – that is simply sending a number to the otherparty. The middlebox adds 10000 to any number it re-ceives and forwards the request on, but it could also be,say, an HTTP proxy or a video transcoder. SNP also car-ries X-Trace metadata in its header. Each segment of thepath in the SNP layer corresponds to a complete I3 path.Each I3 path, in turn, is formed by a combination of IPand Chord paths. Finally, each Chord path is formed bya combination of IP paths.
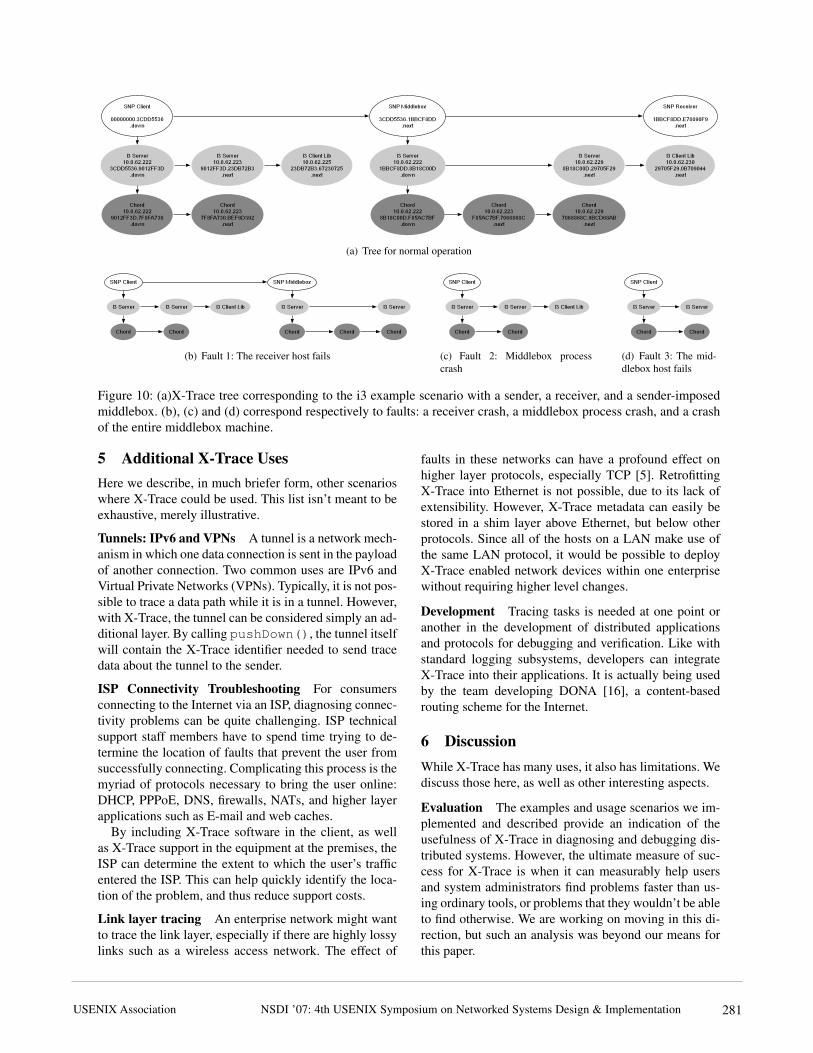
Tracing a message through the scenario In Fig-ure 10(a) we show the reconstructed tree of operationsgiven by X-Trace in a sample run of the scenario. Thistree was generated from X-Trace reports by the visual-ization tool we developed. We deployed an I3 networkconsisting of 3 machines, each of which was also Chordnode. The SNP client, receiver, and middlebox are onseparate machines. We omit the IP report messages: allIP paths are one hop, since the machines were all on aswitched LAN.
The SNP client sends a message to the the SNP re-ceiver (see Figure 10), and it interposes the SNP middle-box on the path. The following is a detailed look at thetransmission of a message in this scenario.
The SNP client creates a message, chooses a TaskIDand includes X-Trace metadata in the SNP header. Itchooses the I3 identifier stack (IDmiddlebox, IDserver) asthe destination (an identifier stack is simply a source-routed path in I3). The client calls pushDown(),copying the metadata into the I3 layer. Two morepushDown() operations copy it into the Chord andIP layers. The message is sent to the first I3 server, in
this case at address 10.0.62.222. That server receivesthe message, and as it goes up the network stack, eachlayer generates and sends a report. The I3 server routesa message to the middlebox’s I3 identifier, stored in theserver 10.0.62.223. The I3 layer has a mapping betweenIDmiddlebox and the IP address 10.0.62.225. This messageis delivered over IP to the I3 Client Library on that node,and then to the SNP Middlebox process.
The middlebox receives the message and processesit, sending a report from each of its layers. It removesits I3 address from the identifier stack, leaving only theaddress of the server, IDserver. Like the client, it callspushNext() on the identifier, and then pushDown()twice to propagate that ID to the Chord and IP layers.The next Chord node in the path, 10.0.62.223, receivesthe message and calls pushNext(). It sends a report,and then since there is no I3 layer, it simply forwards themessage on. This process continues for the next I3 server,and finally the message is received by the receiver. At thereceiver, we see a report from the I3 client library, andfrom the SNP application.
Using X-Trace In Figures 10(b), (c), and (d) we in-jected different types of faults and show how the result-ing X-Trace tree detected them. We failed different com-ponents of the system that prevented the receiver fromreceiving the message. Normally it would be difficult orimpossible for the sender to differentiate between thesefaults.
Fault 1: The receiver host fails In Figure 10(b) wesimulated a crash in the receiver. I3 expires the pointer tothe receiver machine after a timeout, and the result is thatthe message gets to the last I3 server before the receiver,but there is no report from either the SNP Receiver or I3Client library at the receiver machine.
Fault 2: The middlebox process fails In Figure 10(c)we simulated a bug in the middlebox that made it crashupon receiving a specific payload and prevented it fromforwarding the message. We see here that there is a reportfrom the I3 Client library in the third I3 report node, butno report from the SNP middlebox or from any part of thetree after that. This indicates that the node was function-ing at the time the message arrived. However, the lackof a report from the middlebox, coupled with no reportsthereafter, points to the middlebox as the failure.
Fault 3: The middlebox host fails Finally, in Fig-ure 10(d), we completely crashed the middlebox process.I3 expired the pointer to the machine, and we see themessage stop at the last I3 server before the middlebox.The lack of any reports from the middlebox node, as wellas no reports after the tree indicate that the entire nodehas failed.
NSDI ’07: 4th USENIX Symposium on Networked Systems Design & Implementation USENIX Association280
SNP Client
00000000.3CDD5536
.down
SNP Middlebox
3CDD5536.1BBCF8DD
.next
I3 Server
10.0.62.222
3CDD5536.9012FF3D
.down
SNP Receiver
1BBCF8DD.E78090F9
.next
I3 Server
10.0.62.222
1BBCF8DD.8B18C00D
.down
I3 Server
10.0.62.229
8B18C00D.29705F29
.next
I3 Client Lib
10.0.62.230
29705F29.0B709044
.next
Chord
10.0.62.222
9012FF3D.7F8FA730
.down
I3 Server
10.0.62.223
9012FF3D.23DB72B3
.next
Chord
10.0.62.223
7F8FA730.BEF6D392
.next
I3 Client Lib
10.0.62.225
23DB72B3.67230725
.next
Chord
10.0.62.229
7068868C.9BCD68AB
.next
Chord
10.0.62.223
F85AC7BF.7068868C
.next
Chord
10.0.62.222
8B18C00D.F85AC7BF
.down
(a) Tree for normal operation
SNP Client SNP Middlebox
I3 Server I3 Server I3 Server
Chord
I3 Server
Chord
I3 Client Lib
ChordChordChord
(b) Fault 1: The receiver host fails
SNP Client
I3 Server
Chord
I3 Server
Chord
I3 Client Lib
(c) Fault 2: Middlebox processcrash
SNP Client
I3 Server
Chord
I3 Server
Chord
(d) Fault 3: The mid-dlebox host fails
Figure 10: (a)X-Trace tree corresponding to the i3 example scenario with a sender, a receiver, and a sender-imposedmiddlebox. (b), (c) and (d) correspond respectively to faults: a receiver crash, a middlebox process crash, and a crashof the entire middlebox machine.
5 Additional X-Trace UsesHere we describe, in much briefer form, other scenarioswhere X-Trace could be used. This list isn’t meant to beexhaustive, merely illustrative.
Tunnels: IPv6 and VPNs A tunnel is a network mech-anism in which one data connection is sent in the payloadof another connection. Two common uses are IPv6 andVirtual Private Networks (VPNs). Typically, it is not pos-sible to trace a data path while it is in a tunnel. However,with X-Trace, the tunnel can be considered simply an ad-ditional layer. By calling pushDown(), the tunnel itselfwill contain the X-Trace identifier needed to send tracedata about the tunnel to the sender.
ISP Connectivity Troubleshooting For consumersconnecting to the Internet via an ISP, diagnosing connec-tivity problems can be quite challenging. ISP technicalsupport staff members have to spend time trying to de-termine the location of faults that prevent the user fromsuccessfully connecting. Complicating this process is themyriad of protocols necessary to bring the user online:DHCP, PPPoE, DNS, firewalls, NATs, and higher layerapplications such as E-mail and web caches.
By including X-Trace software in the client, as wellas X-Trace support in the equipment at the premises, theISP can determine the extent to which the user’s trafficentered the ISP. This can help quickly identify the loca-tion of the problem, and thus reduce support costs.
Link layer tracing An enterprise network might wantto trace the link layer, especially if there are highly lossylinks such as a wireless access network. The effect of
faults in these networks can have a profound effect onhigher layer protocols, especially TCP [5]. RetrofittingX-Trace into Ethernet is not possible, due to its lack ofextensibility. However, X-Trace metadata can easily bestored in a shim layer above Ethernet, but below otherprotocols. Since all of the hosts on a LAN make use ofthe same LAN protocol, it would be possible to deployX-Trace enabled network devices within one enterprisewithout requiring higher level changes.
Development Tracing tasks is needed at one point oranother in the development of distributed applicationsand protocols for debugging and verification. Like withstandard logging subsystems, developers can integrateX-Trace into their applications. It is actually being usedby the team developing DONA [16], a content-basedrouting scheme for the Internet.
6 DiscussionWhile X-Trace has many uses, it also has limitations. Wediscuss those here, as well as other interesting aspects.
Evaluation The examples and usage scenarios we im-plemented and described provide an indication of theusefulness of X-Trace in diagnosing and debugging dis-tributed systems. However, the ultimate measure of suc-cess for X-Trace is when it can measurably help usersand system administrators find problems faster than us-ing ordinary tools, or problems that they wouldn’t be ableto find otherwise. We are working on moving in this di-rection, but such an analysis was beyond our means forthis paper.
NSDI ’07: 4th USENIX Symposium on Networked Systems Design & ImplementationUSENIX Association 281

Report loss If the reporting infrastructure loses any re-ports, the effect to the graph will be the deletion of nodesand edges represented by that report. This might make itimpossible to reconstruct the causal connections. In thesecases, the reports sharing a common task identifier couldbe ordered temporally. Although not as descriptive, thislinear graph might still pinpoint certain faults.
Managing report traffic The structure and complex-ity of an application’s task trees have a strong bearing onthe amount of report traffic generated by X-Trace nodes.We mention three mechanisms that can limit the volumeof this traffic. Sampling can limit the number of requeststhat are tagged with X-Trace metadata to a rate speci-fied by policy. A low sampling rate is ideal for “always-on” tracing used to get a picture of the behavior of thenetwork. Differently from independent sampling at eachnode, using X-Trace, each “sample” is a complete tasktree. Since X-Trace reports are delivered out-of-band,they can be batched and compressed before transmission.Within our network we have observed a 10x compressionfactor for X-Trace generated reports. Finally, scoping canbe used to limit report generation to certain network lay-ers, devices, or parts of the network. Layers such as IPgenerate many reports per request, since reports are gen-erated on a per-packet basis. By limiting the scope ofreports to those layers above IP, a smaller volume of re-ports is generated. Of course, if a fault is suspected at thenetwork layer, the scope of reports could be widened toinclude IP packets of interest (say, from a client or subnetexperiencing the observed problem). Currently, supportfor scoping is statically configured into the reporting in-frastructure. Improving this support is considered futurework.
Non-tree request structures The X-Trace metadatadescribed in this work assumes that requests follow a treestructure. For the protocols and environments we con-sidered, this assumption generally holds. However, othertypes of requests may not be captured. Examples are quo-rum protocols, or a controller which sends jobs to manyworking nodes and waits for all to complete. We are cur-rently looking at extending the TreeInfo field to accom-modate this.
Partial deployment Thus far, our discussion has fo-cused on a comprehensive deployment of X-Tracethroughout the network. However, even when X-Traceis partially deployed within one particular application ornetwork layer, it still provides useful tracing benefits. Forexample, by integrating X-Trace into the I3 and Chordoverlay networks, users of those system can track themapping of I3 messages to Chord nodes. Alternatively,the developer of a middleware system could use X-Traceto follow requests from one node to another. In this spirit,researchers developing the DONA [16] project are mak-
ing use of X-Trace to aid in the development of their newrouting protocol.
Secondly, specific ADs can deploy X-Trace withintheir networks without requiring any cooperation or sup-port from other ADs. For example, a service providercould deploy X-Trace at strategic points within their dat-acenter. This provides the service provider with the tasktree within their network. We see the adoption of X-Tracefollowing this partial deployment strategy.
Security Considerations It is important to discuss thepotential for attacking the X-Trace infrastructure, as wellas using that infrastructure to attack others.
First, one could mount an attack against an infrastruc-ture that implements X-Trace by sending an inordinateamount of traffic with X-Trace metadata requesting re-ports. We argue that propagating metadata on its own isunlikely to become a bottleneck in this situation. Gener-ating reports, however, could become a significant sourceof load. A simple defense is for each device to rate-limitthe generation of reports. Still, malicious clients couldget more than their fair share of the reporting bandwidth.If this becomes a problem, and filtering specific sourcesof reports becomes an issue, providers might start requir-ing capabilities in the options part of X-Trace metadatato issue reports.
Another possible attack with the reporting infrastruc-ture is for a malicious user to send packets with X-Trace metadata, with the destination for reports set asanother user. In the worst case, many network devicesand hosts would send reports towards the attacked user.While this attack is possible, it will not have an exponen-tial growth effect on the attacker’s power, as legitimatereporting nodes will not place X-Trace metadata into X-Trace reports. Most important, however, is that we donot expect a large traffic of wide-area reports: as we de-scribe in Section 2.3, we expect ADs to generate veryfew wire-area reports with pointers to detailed, indepen-dent stores for local reports within each AD. Lastly, thisproblem is more prevalent when the destination for re-ports are IP addresses. Using wire-area destinations likeI3 or OpenDHT leverages these systems’ denial of ser-vice prevention features. X-Trace keeps control of reportgeneration rate and visibility with each report provider,which allows for defense mechanisms to be put in place.
7 Related WorkA number of tools focus on monitoring network sta-tus, aggregating data from many devices and layers. X-Trace differs from these tools in that it traces, across de-vices and layers, the actual paths taken by data messages,rather than trying to get snapshots of the network in-frastructure as a whole. One such tool is traceroute,which traces IP network paths. SNMP [7] is a protocol
NSDI ’07: 4th USENIX Symposium on Networked Systems Design & Implementation USENIX Association282

that lets operators inspect instrumentation data from net-work devices such as packet counts and error conditions.HP Openview is an example of an enterprise-wide net-work management tool that makes use of SNMP data.Openview can coordinate views at different granulari-ties, as well as coordinate network policy changes. CiscoSystems’ Netflows [18] also provides device instrumen-tation, although at a finer granularity than SNMP.
Splunk [23] is a commercial solution that collects andindexes all logs of an IT installation, allowing adminis-trators to interactively search these logs in a flexible way.With knowledge of common log formats it is usually pos-sible to follow tasks through the logs with hints such asIP addresses, user names, and timestamps. However, thisapproach is unlikely to work across organizations, and isnot guaranteed to have the relevant causal connections.Properly propagated X-Trace metadata added to logs cangreatly enhance the search power of such a tool.
Hussain et al. [14] present a system for performinghigh-speed network traces at a large scale. The purposeof their work is to collect the data, process it accord-ing to anonymization policies, and make it available formultiple users. That work focuses on traffic in the net-work, and not on capturing causal connections betweenrequests at different layers. Kompella et al. [15] presenta service for collecting “cross-layer information”. Thefocus of that work is on collecting control path state atdifferent layers. Using the information their system col-lects, one could identify how failures at one layer impactother layers. X-Trace differs from that work in that werequire widening the APIs at each layer, and focus on thedatapath, rather than the control path.
The Application Response Measurement (ARM) [3]project annotates transactional protocols in corporate en-terprises with identifiers. Devices in that system recordstart and end times for transactions, which can be rec-onciled offline. ARM targets the application layer, andits focus is to diagnose performance problems in nestedtransactions.
Pinpoint [9] detects faults in large, distributed sys-tems. The authors modified J2EE middleware to cap-ture the paths that component-based Java systems tookthrough that middleware. They can mine collections ofthese paths to infer which components are responsible forcausing faults. Our work focuses on recovering the tasktrees associated with multi-layer protocols, rather thanthe analysis of those recovered paths.
Aguilera et al., in [1], find anomalous behavior in dis-tributed systems by treating each component as a blackbox, and inferring the operation paths by only lookingat message traces. They present heuristics to recoverthe path given the timing relations among messages. Afollow-up work, Pip [20] is an infrastructure for com-paring actual and expected behavior of distributed sys-
tems by reasoning about paths through the application.They record paths by propagating path identifiers be-tween components, and can specify recognizers for pathsthat deal with system communication structure, timing,resource consumption. Pip is targeted at a single dis-tributed application, under the same AD, and does notcapture cross-layer correlations. X-Trace is complemen-tary to Pip in this sense. We believe that some of Pip’sanalysis can be performed on X-Trace’s task trees.
Magpie [6] is a toolchain that works with events gen-erated by operating system, middleware, and applicationinstrumentation, correlates them, and produces represen-tations of paths through a system by inferring causal re-lations from a total ordering of events. Instead of uniqueidentifiers, Magpie relies on experts with deep knowl-edge about the system to construct a schema of how tocorrelate events in different components. Like X-Trace,they correlate lower level events with a higher level task,but focus mostly on a single system or on distributed sys-tems that are highly instrumented in a compatible way.
The recent work in the AND and Constellationprojects [4], defines the Leslie Graph as the graph rep-resenting the dependencies a distributed system’s com-ponents. They use inference techniques to unobtrusivelyfind correlations in traffic entering and leaving each nodeor service, and combine these findings in a network-widegraph. This graph is similar to, but different from our tasktrees: X-Trace produces deterministic traces of individ-ual task executions, that are useful for examining theirindividual characteristics. In our ongoing work, we arelooking into aggregating several task trees to determineaggregate behavior and dependencies.
Finally, Causeway [8] and SDI [19] provide mecha-nisms for automating metadata propagation within op-erating system and application structures, and could beused in some scenarios to ease X-Trace metadaa propa-gation.
8 Conclusions
Internet applications are becoming increasingly dis-tributed and complex, taking advantage of new protocollayers and middlebox functionality. Current network di-agnostic tools only focus on one particular protocol layer,and the insights they provide on the application cannot beshared between the user, service, and network operators.We propose X-Trace, a cross-layer, cross-applicationtracing framework designed to reconstruct the user’s tasktree. This framework enables X-Trace enabled nodes toencode causal connections necessary for rebuilding thistree. The trace data generated by X-Trace is published toa reporting infrastructure, ensuring that different partiescan access it in a way that respects the visibility require-ments of network and service operators.
NSDI ’07: 4th USENIX Symposium on Networked Systems Design & ImplementationUSENIX Association 283

We deployed and evaluated X-Trace in two concretescenarios: a web hosting site and an overlay network. Wefound that with X-Trace, we were able to quickly iden-tify the location of six injected faults. These faults werechosen because they are difficult to detect using currentdiagnostic tools.
The data generated by X-Trace instrumented sys-tems can serve as the basis for more sophisticated anal-ysis than the simple visualization and fault detectionshown here. Using this data for new and existing algo-rithms [9, 20] is the object of our ongoing work. Giventhat the provider of reports ultimately controls how muchdata is generated, we are also investigating strategies topush filters on what to report as close to the sources ofdata as possible. For example, an AD could push a filterto all of its reporting daemons to not send reports on theIP layer.
AcknowledgmentsWe would like to thank our shepherd, Brad Karp, theanonymous NSDI reviewers, as well as Gautam Autekar,Matthew Caesar, Teemu Koponen, Armando Fox, JeffMogul, Sylvia Ratnasamy, Sean Rhea, Dick Sites, NinaTaft, and James Zhang for all the insightful commentsand discussions.
This work was supported by NSF Grant CNS-0526016(“NeTS-NBD: Collaborative Research: Intelligent andAdaptive Networking for the Next Generation Internet”),the California MICRO Program (“06-146: EnhancedNetworking Dependability via Programmable NetworkElements”), and with matching industrial support fromHewlett-Packard, Microsoft, and Sun Microsystems.
References[1] AGUILERA, M. K., MOGUL, J. C., WIENER, J. L., REYNOLDS,
P., AND MUTHITACHAROEN, A. Performance debugging fordistributed systems of black boxes. In Proc. SOSP ’03 (NewYork, NY, USA, 2003), ACM Press.
[2] ANDERSEN, D., BALAKRISHNAN, H., KAASHOEK, F., ANDMORRIS, R. Resilient overlay networks. In SOSP ’01: Pro-ceedings of the eighteenth ACM symposium on Operating systemsprinciples (New York, NY, USA, 2001), ACM Press.
[3] Application Response Measurement, http://www.opengroup.-org/tech/management/arm/.
[4] BAHL, P., BARHAM, P., BLACK, R., CHANDRA, R., GOLD-SZMIDT, M., ISAACS, R., KANDULA, S., LI, L., MAC-CORMICK, J., MALTZ, D. A., MORTIER, R., WAWRZONIAK,M., AND ZHANG, M. Discovering dependencies for networkmanagement. In Proc. V HotNets Workshop (Nov. 2006).
[5] BALAKRISHNAN, H., PADMANABHAN, V. N., SESHAN, S.,AND KATZ, R. H. A comparison of mechanisms for improv-ing tcp performance over wireless links. In Proc. SIGCOMM ’96(New York, NY, USA, 1996), ACM Press, pp. 256–269.
[6] BARHAM, P., DONNELLY, A., ISAACS, R., AND MORTIER, R.Using Magpie for Request Extraction and Workload Modeling.In Proc. USENIX OSDI (2004).
[7] CASE, J. D., FEDOR, M., SCHOFFSTALL, M. L., AND DAVIN,C. RFC 1157: Simple network management protocol (SNMP),May 1990.
[8] CHANDA, A., ELMELEEGY, K., COX, A. L., ANDZWAENEPOEL, W. Causeway: System support for control-ling and analyzing the execution of multi-tier applications. InProc. Middleware 2005 (November 2005), pp. 42–59.
[9] CHEN, M., KICIMAN, E., FRATKIN, E., BREWER, E., ANDFOX, A. Pinpoint: Problem Determination in Large, Dynamic,Internet Services. In Proc. International Conference on Depend-able Systems and Networks (2002).
[10] CROCKER, D. RFC 822: Standard for the format of ARPA Inter-net text messages, Aug. 1982.
[11] FIELDING, R., GETTYS, J., MOGUL, J., FRYSTYK, H., MAS-INTER, L., LEACH, P., AND BERNERS-LEE, T. HypertextTransfer Protocol – HTTP/1.1. RFC 2616 (Draft Standard), June1999. Updated by RFC 2817.
[12] FONSECA, R., PORTER, G., KATZ, R. H., SHENKER, S., ANDSTOICA, I. IP options are not an option. Tech. Rep. UCB/EECS-2005-24, EECS Department, UC Berkeley, December 9 2005.
[13] HUA CHU, Y., RAO, S. G., SESHAN, S., AND ZHANG, H. Acase for end system multicast. IEEE Journal on Selected Areasin Communication (JSAC) 20, 8 (2002).
[14] HUSSAIN, A., BARTLETT, G., PRYADKIN, Y., HEIDEMANN, J.,PAPADOPOULOS, C., AND BANNISTER, J. Experiences with acontinuous network tracing infrastructure. In Proc. MineNet ’05(New York, NY, USA, 2005), ACM Press.
[15] KOMPELLA, R. R., GREENBERG, A., REXFORD, J., SNOEREN,A. C., AND YATES, J. Cross-layer visibility as a service. In Proc.IV HotNets Workshop (November 2005).
[16] KOPONEN, T., CHAWLA, M., CHUN, B.-G., ERMOLINSKIY,A., KIM, K. H., SHENKER, S., AND STOICA, I. A Data-Oriented (and Beyond) Network Architecture. In submission.
[17] MAZIERES, D. A toolkit for user-level file systems. In USENIXConference (June 2001).
[18] Cisco NetFlow Services and Applications White Paper,http://www.cisco.com/go/netflow.
[19] REUMANN, J., AND SHIN, K. G. Stateful distributed interposi-tion. ACM Trans. Comput. Syst. 22, 1 (2004), 1–48.
[20] REYNOLDS, P., KILLIAN, C., WIENER, J., MOGUL, J., SHAH,M., AND VAHDAT, A. Pip: Detecting the Unexpected in Dis-tributed Systems. In Proc. USENIX NSDI (May 2006).
[21] RHEA, S., GODFREY, B., KARP, B., KUBIATOWICZ, J.,RATNASAMY, S., SHENKER, S., STOICA, I., AND YU, H.OpenDHT: a public DHT service and its uses. In Proc. SIG-COMM ’05 (New York, NY, USA, 2005), ACM Press, pp. 73–84.
[22] ROSENBERG, J., SCHULZRINNE, H., CAMARILLO, G., JOHN-STON, A., PETERSON, J., SPARKS, R., HANDLEY, M., ANDSCHOOLER, E. SIP: Session Initiation Protocol. RFC 3261 (Pro-posed Standard), June 2002.
[23] Splunk, http://www.splunk.com.[24] STOICA, I., ADKINS, D., ZHUANG, S., SHENKER, S., AND
SURANA, S. Internet indirection infrastructure. In Proc. SIG-COMM ’02 (New York, NY, USA, 2002), ACM Press, pp. 73–86.
[25] STOICA, I., MORRIS, R., KARGER, D., KAASHOEK, M. F.,AND BALAKRISHNAN, H. Chord: A scalable peer-to-peerlookup service for internet applications. In Proc. SIGCOMM ’01(New York, NY, USA, 2001), ACM Press, pp. 149–160.
[26] VIXIE, P. Extension Mechanisms for DSN (EDNS0). RFC 2671,Aug. 1999.
[27] Wikipedia Infrastructure, http://meta.wikimedia.org/wiki-/wikimedia servers.
NSDI ’07: 4th USENIX Symposium on Networked Systems Design & Implementation USENIX Association284