x ROBERT BRUNI HIGHLIGHTS: KARL NIEHAUSimages3.loopnet.com/d2/8jyfyj8b9HYr2wkrPWddp05j_sY... · LOS...
11
LOS ANGELES, 4200 W PICO BLVD EXECUTIVE SUMMARY x ROBERT BRUNI KARL NIEHAUS (310) 480-5541 • Over 66,000 Cars/day on Signalized Corner of Crenshaw/Pico (310) 880-7900 • Extremely Dense Location - Over 562,000 Population within 3 Miles [email protected] • 246 Feet of Corner Frontage www.CREI.biz • Zoning LAC4 & TOC Tier 3 01450751 - RE License • High Walking Traffic - 79 Walk Score 00986763 - RE License • 5 Bus Stops on Corner of Crenshaw/Pico DEMOGRAPHICS: The population within a 1 mile radius was estimated at over 53,000 as well as over 562,000 within a 3 mile radius, and this population is expected to grow at 3.06% annually. The average household income was estimated at approximately $62,000 within a 3 mile radius. OFFERING SUMMARY: 4200 W. Pico offers an investor excellent exposure on a signalized corner with over 66,000 cars/day. The property is located in a high pedestrian location (Walk Score of 79) and is located in front of 5 bus stops. The zoning of LAC4 and TOC Tier 3 allows a tenant significant retail construction advantages. The property has easy access to 3 Freeways (10, 110 & 101). Insert property picture. Make both pictures as large as possible, yet still asthetically pleasing SALES PRICE: $3,800,000 - 12,601 SF Lot $301.56/SF HIGHLIGHTS: Information contained herein has been obtained from sources deemed to be reliable. However, no warranties can be assumed for its accuracy.
Transcript of x ROBERT BRUNI HIGHLIGHTS: KARL NIEHAUSimages3.loopnet.com/d2/8jyfyj8b9HYr2wkrPWddp05j_sY... · LOS...

LOS ANGELES, 4200 W PICO BLVD
EXECUTIVE SUMMARY
x ROBERT BRUNIKARL NIEHAUS(310) 480-5541 • Over 66,000 Cars/day on Signalized Corner of Crenshaw/Pico(310) 880-7900 • Extremely Dense Location - Over 562,000 Population within 3 [email protected] • 246 Feet of Corner Frontagewww.CREI.biz • Zoning LAC4 & TOC Tier 301450751 - RE License • High Walking Traffic - 79 Walk Score00986763 - RE License • 5 Bus Stops on Corner of Crenshaw/Pico
DEMOGRAPHICS: The population within a 1 mile radius was estimated at over 53,000 as well as over 562,000 within a 3 mile radius, and this population is expected to grow at 3.06% annually. The average household income was estimated at approximately $62,000 within a 3 mile radius.
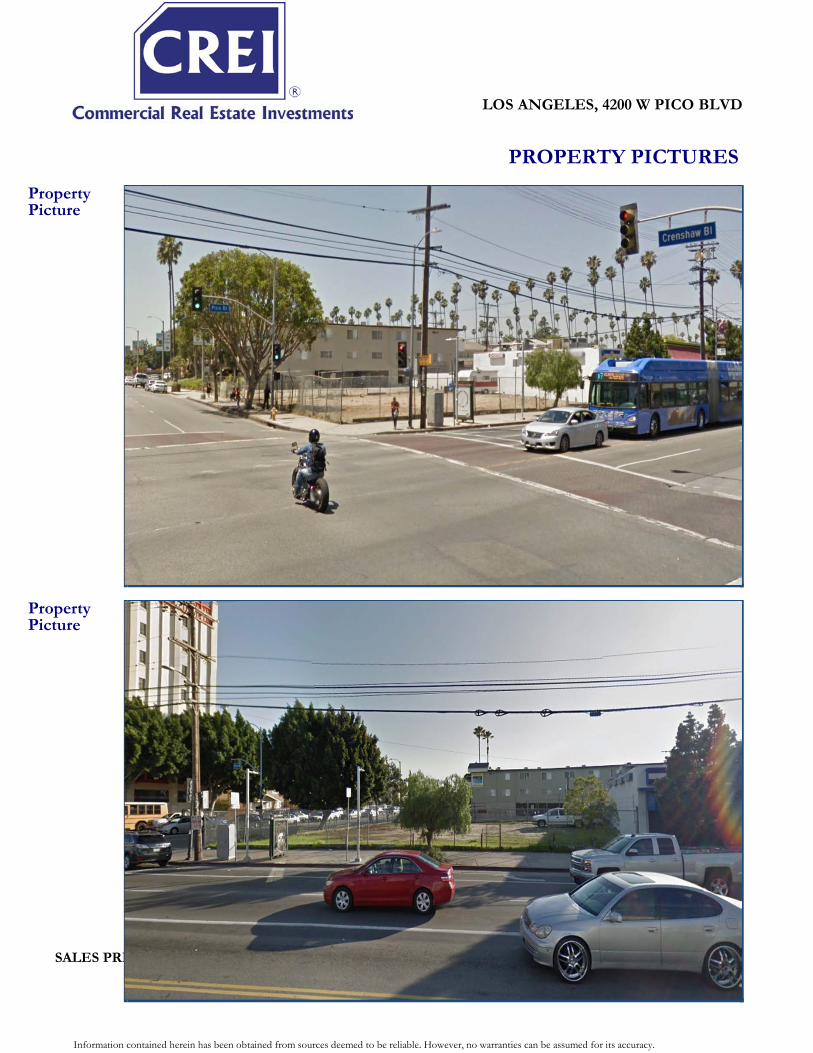
OFFERING SUMMARY: 4200 W. Pico offers an investor excellent exposure on a signalized corner with over 66,000 cars/day. The property is located in a high pedestrian location (Walk Score of 79) and is located in front of 5 bus stops. The zoning of LAC4 and TOC Tier 3 allows a tenant significant retail construction advantages. The property has easy access to 3 Freeways (10, 110 & 101).
Insert property picture. Make both pictures as large as possible, yet still asthetically pleasing
SALES PRICE: $3,800,000 - 12,601 SF Lot $301.56/SF
HIGHLIGHTS:
Information contained herein has been obtained from sources deemed to be reliable. However, no warranties can be assumed for its accuracy.
LOS ANGELES, 4200 W PICO BLVD
PROPERTY PICTURES
SALES PRI
PropertyPicture
PropertyPicture
Insert property picture #2
Insert property picture
Information contained herein has been obtained from sources deemed to be reliable. However, no warranties can be assumed for its accuracy.

LOS ANGELES, 4200 W PICO BLVD
PROPERTY PICTURES
Aerial Map
Insert aerial map (lalife.com). Bird's Eye View
Insert local area map (lalife.com) - large enough to see local highways and major streets
Local AreaMap
Information contained herein has been obtained from sources deemed to be reliable. However, no warranties can be assumed for its accuracy.

LOS ANGELES, 4200 W PICO BLVD
WALK SCORE
Walk Score Map (WalkScore.com)
Walk Score Nearby Tenant List (WalkScore.com)
Walk ScorePicture
Walk ScoreSummary
Information contained herein has been obtained from sources deemed to be reliable. However, no warranties can be assumed for its accuracy.

LOS ANGELES, 4200 W PICO BLVD
PROPERTY PICTURES
Insert zoning picture (Zimas.com)
ZoningPicture
Information contained herein has been obtained from sources deemed to be reliable. However, no warranties can be assumed for its accuracy.

LOS ANGELES, 4200 W PICO BLVD
DEMOGRAPHICS
Radius 1 Mile 3 Mile 5 Mile
Population:2022 Projection 53,435 579,639 1,363,0042017 Estimate 52,182 562,437 1,320,9572010 Census 51,342 534,334 1,246,039Growth 2017-2022 2.40% 3.06% 3.18%Growth 2010-2017 1.64% 5.26% 6.01%2017 Population Hispanic Origin 26,294 278,844 617,232
2017 Population by Race:White 27,741 328,648 854,707Black 10,476 97,534 206,564Am. Indian & Alaskan 1,072 10,319 24,391Asian 11,293 109,080 193,141Hawaiian & Pacific Island 133 1,262 2,927Other 1,467 15,594 39,228
U.S. Armed Forces: 0 63 237Households:2022 Projection 17,629 212,710 523,1952017 Estimate 17,247 206,639 507,4922010 Census 1714100.00% 19775900.00% 48163600.00%Growth 2017 - 2022 2.21% 2.94% 3.09%Growth 2010 - 2017 0 0 0Owner Occupied 4,756 40,188 113,330
Renter Occupied $12,491 $166,451 $394,162 2017 Avg Household Income $67,149 $62,284 $69,562 2017 Med Household Income $43,306 $39,554 $43,254
2017 Households by Household Inc:<$25,000 4,873 66,258 157,280$25,000 - $50,000 4,971 57,885 124,381$50,000 - $75,000 2,650 30,226 74,752$75,000 - $100,000 1,626 17,722 47,532$100,000 - $125,000 840 11,118 31,517$125,000 - $150,000 597 6,426 18,212$150,000 - $200,000 753 7,365 21,592
Information contained herein has been obtained from sources deemed to be reliable. However, no warranties can be assumed for its accuracy.

LOS ANGELES, 4200 W PICO BLVD
DEMOGRAPHICS
TypeRadius 1 Mile 3 Mile 5 Mile 1 Mile 3 Mile 5 Mile 1 Mile 3 Mile 5 Mile
Total Businesses 1,347 24,011 80,049 11,890 207,732 719,116 9 9 9Retail 200 3,244 12,258 1,142 21,499 78,699 6 7 6Wholesale 52 620 4,111 201 4,561 21,890 4 7 5Hospitality & Food Service 98 1,756 5,156 868 21,153 79,255 9 12 15Leasing 68 1,392 3,966 302 6,672 29,254 4 5 7
Finance & Insurance 79 1,504 4,298 1,642 15,398 42,112 21 10 10Information 22 880 2,628 155 18,222 51,681 7 21 20
Services 130 3,409 12,769 685 17,334 85,457 5 5 7Management of Companies 0 23 87 0 431 2,213 0 19 25Assistance 194 4,458 15,538 1,161 30,425 112,936 6 7 7Education Services 40 752 1,604 1,251 17,226 39,525 31 23 25Sales 0 140 620 0 5,162 31,376 0 37 51Recreation 24 479 1,647 179 5,655 21,492 7 12 13Utilities 1 1 9 5 5 2,074 5 5 230
Management 47 954 2,714 270 16,689 30,014 6 17 11Construction 95 1,010 2,615 566 5,503 15,389 6 5 6Manufacturing 44 569 2,585 248 4,157 22,322 6 7 9Agriculture, Mining, Fishing 0 7 38 0 37 170 0 5 4Other Services 253 2,813 7,406 3,215 17,603 53,257 13 6 7
# Businesses # Employees # Emp/Bus
Information contained herein has been obtained from sources deemed to be reliable. However, no warranties can be assumed for its accuracy.

LOS ANGELES, 4200 W PICO BLVD
DEMOGRAPHICS
SPENDINGRadius 1 Mile 3 Mile 5 Mile 1 Mile 3 Mile 5 MileTotal Specified Consumer Spending ($)
405,235 4,393,496 11,379,049 455,439 4,964,600 12,874,176Apparel:
Total Apparel 27,232 298,986 735,369 29,416 325,198 802,736Women's Apparel 10,620 115,964 288,087 11,420 125,098 311,838Men's Apparel 5,813 63,493 160,624 6,265 68,710 174,051Girl's Apparel 2,060 22,705 54,230 2,274 25,619 61,789Boy's Apparel 1,416 15,636 37,140 1,563 17,667 42,434Infant Apparel 1,266 14,679 35,327 1,383 16,029 38,733Footwear 6,058 66,509 159,961 6,512 72,074 173,892
Entertainment, Hobbies & Pets:Total Entertainment,
Hobbies & Pets27,889 312,761 837,979 29,376 331,512 890,562
Entertainment 6,698 69,193 178,518 7,067 73,571 190,334Audio & Visual Equipment/Service
13,181 152,395 396,646 13,864 161,200 420,743Reading Materials 1,437 16,624 47,420 1,533 17,726 50,293Pets, Toys, Hobbies 6,574 74,549 215,395 6,912 79,015 229,191Personal Items 26,451 287,326 777,228 29,369 321,806 869,193
Food & Alcohol:Total Food & Alcohol 120,648 1,357,772 3,425,682 134,917 1,527,662 3,861,249Food at Home 70,766 784,893 1,922,410 79,474 888,797 2,180,707Food Away From Home 42,980 491,003 1,278,940 48,104 551,849 1,441,590Alcoholic Beverages 6,903 81,876 224,332 7,338 87,016 238,952
Household:Total Household 54,929 570,116 1,544,767 58,936 613,998 1,666,341House Maintenance & Repair
6,553 55,390 159,199 6,986 59,126 170,472Household Equipment & Furnishings
22,119 244,572 649,716 23,115 256,992 684,253Household Operations 19,318 201,153 539,307 21,354 223,054 598,152Housing Costs 6,940 69,001 196,546 7,481 74,826 213,465
Transportation and Maintenance:Total Transportation and
Maintenance100,118 1,055,819 2,686,043 118,837 1,260,001 3,213,314
Vehicle Purchases 35,814 349,716 898,478 40,668 397,200 1,025,422Vehicle Expenses 3,873 44,122 118,771 4,514 51,695 139,582Gasoline 34,832 381,499 947,821 44,783 493,541 1,230,220Transportation 12,111 133,402 342,081 14,066 155,403 399,415Automotive Repair & Maintenance
13,489 147,080 378,892 14,807 162,161 418,675Health Care:
Total Health Care 19,652 211,260 555,839 22,975 249,543 654,749Medical Services 11,310 122,148 324,449 13,100 142,739 378,874Prescription Drugs 6,243 66,387 173,011 7,421 80,020 207,259Medical Supplies 2,099 22,725 58,379 2,454 26,785 68,616
20222017
Information contained herein has been obtained from sources deemed to be reliable. However, no warranties can be assumed for its accuracy.

LOS ANGELES, 4200 W PICO BLVD
DEMOGRAPHICS
Collection Street Cross Street Dist/Dir Volume Year from Type
W Pico Blvd Crenshaw Blvd 0.03 E 28,420 2016 0 MPSI...W Pico Blvd S Victoria Ave 0.02 W 23,695 2014 0 MPSI...W Pico Blvd Crenshaw Blvd 0.04 W 23,056 2016 0.07 MPSI...W Pico Blvd S Victoria Ave 0.04 E 27,312 2016 0.08 MPSI...Crenshaw Blvd W Pico Blvd 0.10 NE 38,017 2016 0.09 MPSI...W Pico Blvd S Windsor Blvd 0.01 E 25,552 2016 0.17 MPSI...S Windsor Blvd Victoria Park Dr 0.02 SW 581 2016 0 MPSI...Venice Blvd Crenshaw Blvd 0.03 SE 34,623 2015 0 Converted...Crenshaw Blvd W Pico Blvd 0.20 SW 30,110 2016 0.22 MPSI...Venice Blvd S Bronson Ave 0.03 SE 29,872 2015 0.22 Converted...
Information contained herein has been obtained from sources deemed to be reliable. However, no warranties can be assumed for its accuracy.

Apartment Development: Mixed Use Project 4200 W. Pico BlvdProposed Apartment Building: Units SF/Unit Parking/Unit
14% Lo Mod Units - Very Low Income Units 6 x 550 SF 3,300 SF 0.00Singles/1 Bedrooms x 0 SF 1.002 Bedrooms 25 x 900 SF 22,500 SF 2.003 Bedrooms 13 x 1,200 SF 15,600 SF 2.003 Bedroom + Den x 0 SF 2.00Retail 8,500 SF 8,500 SF 3 per 1,000 SF
Total Units 44 Total New Building Size 49,900 SF
Parking:For a 44 Unit Building, Parking Spaces Required 102 = 30,450 SF GarageParking Spaces Available (Less on Grade Construction) 2,836 SF
Thus 27,614 SF Additional Garage Needed300 SF/Parking Space (Parking Space SF includes all Driveways & Parking Spaces)
Property Income: Rent/SF $/Unit $/Month6 Lo Mod Units - Very Low Income Units $1.18 /per Unit 648 3,888 0 Singles/1 Bedrooms /per Unit - - 25 2 Bedrooms $2.40 /per Unit 2,160 54,000 13 3 Bedrooms $2.40 /per Unit 2,880 37,440 0 3 Bedroom + Den /per Unit - -
Apartment Annual Gross Income 1,143,936 Operating Expenses Paid by Landlord (377,499)
Retail Income 3.75 /SF all Retail $31,875 382,500 5% Vacancy Reserve (76,322)
1,072,615 NOI
70% of Completed Project Value to be new Permanent LoanPermanent Loan to replace Construction Loan (Total Development & Construction Financing Costs): 16,101,148
30 Year Amortization with interest rate of 1.00% over Prime Rate 4.75% (1,127,543) Yrly MortgageYrly Cash on Cash Return if Held for Income -1.51% (54,928) Yrly Cash Flow
Principle Reduction Return in 1st Yr if Held for Income 5.45% 207,129 Principle ReductionTotal Investor Capital Return 3.94% 152,202 Total Return
Sale Price of Completed Project: Based on 4.50% Cap 23,835,896 $541,725 $/Unit
3.0 % Broker Compensation from Sales Price (715,077) 0.5 % Closing/Legal Costs (from Sales Price) (119,179)
Total Net Sales 23,001,640
Development Costs: Price/sf Price/Unit Building Hard Costs (including Contractor Fees) (8,732,500)$ 175 198,466 Soft Costs (1,746,500) 35 39,693 Closings/Legal Costs (1% of Land Price) (38,000) 864 On Grade Garage Hard Costs 2,836 SF Garage (141,780) 50 3,222 2 Story Garage Hard Costs 27,614 SF Garage (2,071,079) 75 47,070 Contingency Factor (5% of Construction Costs) (549,168) 12,481 Total Development Costs (13,279,028) 266 Land Price (bought all cash) Cost/Buildable Unit $86,364 (3,800,000) 285 (Land/sf)
Total Development & Land Cost: (17,079,028)$ Total Finance Cost @ Prime rate+interest only of 2.00% over Prime Rate 4.75% (1,152,834) 6.75% IO Loan
Total Development & Construction Financing Costs: (18,231,862) Total Project (with Land) is Investor Capital 80% Construction Financed 14,585,490$
Profit as % of Investor Capital: 130.8% Profit as % on Total Cost: 26.2%Profit from Sale of Project 4,769,777$
33%
If H
eld
for
In
com
e:
3,646,372
80%
20%
Information contained herin has been obtained from sources deemed to be reliable. however, no warranties can be assumed for its accuracy

Apartment Development: Mixed Use Project 4200 W. Pico Blvd
Site ParametersZoning: C4-2D-O-CPIO, TOC Tier 3Approx Lot Area: (Length x Width) including half of alley 96 Feet x 138 Feet =
FAR 3.75 thus, FAR allows for max Building of 49,964 SF
Height & Setback LimitationsSide Yard Set Back 7 Feet Deduct half from each sideFront Yard Set Back 5 FeetHighway Dedication Set Back 0 FeetBack Yard Set Back 5 FeetMax Height 75 Feet
Building Dimensions (Lot Less Set Backs)Buildable Lot Width 131 FeetBuildable Lot Length 86 Feet
Approx Buildable Lot Area: (Length x Width) 86 Feet x 131 Feet =
Deducted for Common Areas, Stairways, etc 44,967 SF Approx Building Size from max Building size 49,964 SFallowed per SF of Buildable Lot for Zoning: C4-2D-O-CPIO, TOC Tier 3Therefore 57 Max # Buildable Units400 SF
13,324 SF
11,336 SF
10%
Information contained herin has been obtained from sources deemed to be reliable. however, no warranties can be assumed for its accuracy