X-RAY/ULTRAVIOLET OBSERVING CAMPAIGN OF THE …
16
University of Nebraska - Lincoln University of Nebraska - Lincoln DigitalCommons@University of Nebraska - Lincoln DigitalCommons@University of Nebraska - Lincoln Faculty Publications, Department of Physics and Astronomy Research Papers in Physics and Astronomy 4-10-2005 X-RAY/ULTRAVIOLET OBSERVING CAMPAIGN OF THE X-RAY/ULTRAVIOLET OBSERVING CAMPAIGN OF THE MARKARIAN 279 ACTIVE GALACTIC NUCLEUS OUTFLOW: A MARKARIAN 279 ACTIVE GALACTIC NUCLEUS OUTFLOW: A GLOBAL-FITTING ANALYSIS OF THE ULTRAVIOLET ABSORPTION GLOBAL-FITTING ANALYSIS OF THE ULTRAVIOLET ABSORPTION Jack R. Gabel University of Colorado, [email protected] Nahum Arav University of Colorado, Boulder, [email protected] Jelle S. Kaastra SRON National Institute for Space Research, [email protected] Gerard A. Kriss Space Telescope Science Institute, Baltimore, MD, [email protected] Ehud Behar Department of Physics, Technion, Haifa, Israel, [email protected] See next page for additional authors Follow this and additional works at: https://digitalcommons.unl.edu/physicsfacpub Part of the Physics Commons Gabel, Jack R.; Arav, Nahum; Kaastra, Jelle S.; Kriss, Gerard A.; Behar, Ehud; Costantini, Elisa; Gaskell, C. Martin; Korista, Kirk T.; Laor, Ari; Paerels, Frits; Proga, Daniel; Kim-Quijano, Jessica; Sako, Masao; Scott, Jennifer E.; and Steenbrugge, Katrien C., "X-RAY/ULTRAVIOLET OBSERVING CAMPAIGN OF THE MARKARIAN 279 ACTIVE GALACTIC NUCLEUS OUTFLOW: A GLOBAL-FITTING ANALYSIS OF THE ULTRAVIOLET ABSORPTION" (2005). Faculty Publications, Department of Physics and Astronomy. 7. https://digitalcommons.unl.edu/physicsfacpub/7 This Article is brought to you for free and open access by the Research Papers in Physics and Astronomy at DigitalCommons@University of Nebraska - Lincoln. It has been accepted for inclusion in Faculty Publications, Department of Physics and Astronomy by an authorized administrator of DigitalCommons@University of Nebraska - Lincoln.
Transcript of X-RAY/ULTRAVIOLET OBSERVING CAMPAIGN OF THE …

University of Nebraska - Lincoln University of Nebraska - Lincoln
DigitalCommons@University of Nebraska - Lincoln DigitalCommons@University of Nebraska - Lincoln
Faculty Publications, Department of Physics and Astronomy Research Papers in Physics and Astronomy
4-10-2005
X-RAY/ULTRAVIOLET OBSERVING CAMPAIGN OF THE X-RAY/ULTRAVIOLET OBSERVING CAMPAIGN OF THE
MARKARIAN 279 ACTIVE GALACTIC NUCLEUS OUTFLOW: A MARKARIAN 279 ACTIVE GALACTIC NUCLEUS OUTFLOW: A
GLOBAL-FITTING ANALYSIS OF THE ULTRAVIOLET ABSORPTION GLOBAL-FITTING ANALYSIS OF THE ULTRAVIOLET ABSORPTION
Jack R. Gabel University of Colorado, [email protected]
Nahum Arav University of Colorado, Boulder, [email protected]
Jelle S. Kaastra SRON National Institute for Space Research, [email protected]
Gerard A. Kriss Space Telescope Science Institute, Baltimore, MD, [email protected]
Ehud Behar Department of Physics, Technion, Haifa, Israel, [email protected]
See next page for additional authors Follow this and additional works at: https://digitalcommons.unl.edu/physicsfacpub
Part of the Physics Commons
Gabel, Jack R.; Arav, Nahum; Kaastra, Jelle S.; Kriss, Gerard A.; Behar, Ehud; Costantini, Elisa; Gaskell, C. Martin; Korista, Kirk T.; Laor, Ari; Paerels, Frits; Proga, Daniel; Kim-Quijano, Jessica; Sako, Masao; Scott, Jennifer E.; and Steenbrugge, Katrien C., "X-RAY/ULTRAVIOLET OBSERVING CAMPAIGN OF THE MARKARIAN 279 ACTIVE GALACTIC NUCLEUS OUTFLOW: A GLOBAL-FITTING ANALYSIS OF THE ULTRAVIOLET ABSORPTION" (2005). Faculty Publications, Department of Physics and Astronomy. 7. https://digitalcommons.unl.edu/physicsfacpub/7
This Article is brought to you for free and open access by the Research Papers in Physics and Astronomy at DigitalCommons@University of Nebraska - Lincoln. It has been accepted for inclusion in Faculty Publications, Department of Physics and Astronomy by an authorized administrator of DigitalCommons@University of Nebraska - Lincoln.

Authors Authors Jack R. Gabel, Nahum Arav, Jelle S. Kaastra, Gerard A. Kriss, Ehud Behar, Elisa Costantini, C. Martin Gaskell, Kirk T. Korista, Ari Laor, Frits Paerels, Daniel Proga, Jessica Kim-Quijano, Masao Sako, Jennifer E. Scott, and Katrien C. Steenbrugge
This article is available at DigitalCommons@University of Nebraska - Lincoln: https://digitalcommons.unl.edu/physicsfacpub/7

X-RAY/ULTRAVIOLET OBSERVING CAMPAIGN OF THE MARKARIAN 279ACTIVE GALACTIC NUCLEUS OUTFLOW: A GLOBAL-FITTING
ANALYSIS OF THE ULTRAVIOLET ABSORPTION1
Jack R. Gabel,2Nahum Arav,
2Jelle S. Kaastra,
3Gerard A. Kriss,
4,5Ehud Behar,
6
Elisa Costantini,3,7
C. Martin Gaskell,8Kirk T. Korista,
9Ari Laor,
6
Frits Paerels,10
Daniel Proga,11
Jessica Kim Quijano,4Masao Sako,
12
Jennifer E. Scott,4and Katrien C. Steenbrugge
3
Receivved 2004 September 14; accepted 2004 December 21
ABSTRACT
We present an analysis of the intrinsic UVabsorption in the Seyfert 1 galaxyMrk 279 based on simultaneous longobservations with the Hubble Space Telescope (41 ks) and the Far Ultraviolet Spectroscopic Explorer (91 ks). Toextract the line-of-sight covering factors and ionic column densities, we separately fit two groups of absorptionlines: the Lyman series and the CNO lithium-like doublets. For the CNO doublets we assume that all three ionsshare the same covering factors. The fitting method applied here overcomes some limitations of the traditionalmethod using individual doublet pairs; it allows for the treatment of more complex, physically realistic scenarios forthe absorption-emission geometry and eliminates systematic errors that we show are introduced by spectral noise.We derive velocity-dependent solutions based on two models of geometrical covering: a single covering factor forall background emission sources, and separate covering factors for the continuum and emission lines. Althoughboth models give good statistical fits to the observed absorption, we favor the model with two covering factorsbecause (1) the best-fit covering factors for both emission sources are similar for the independent Lyman series andCNO doublet fits; (2) the fits are consistent with full coverage of the continuum source and partial coverage of theemission lines by the absorbers, as expected from the relative sizes of the nuclear emission components; and (3) itprovides a natural explanation for variability in the Ly� absorption detected in an earlier epoch. We also explorephysical and geometrical constraints on the outflow from these results.
Subject headinggs: galaxies: active — galaxies: individual (Markarian 279) — galaxies: Seyfert —ultraviolet: galaxies
1. INTRODUCTION
Mass outflow, seen as blueshifted absorption in UVand X-rayspectra, is an important component of active galactic nuclei(AGNs; see recent review in Crenshaw et al. 2003). This ‘‘in-trinsic absorption’’ is ubiquitous in nearby AGNs, appearing inover half of Seyfert 1 galaxies having high-quality UV spectraobtainedwith theHubble Space Telescope (HST; Crenshaw et al.1999) and the Far Ultraviolet Spectroscopic Explorer (FUSE;Kriss 2002). Spectra from the Advanced Satellite for Cosmologyand Astrophysics (ASCA) identified X-ray ‘‘warm absorbers,’’seen as absorption edges, in a similar percentage of objects(Reynolds 1997; George et al. 1998). Large total ejected masseshave been inferred for these outflows, exceeding the accretionrate of the central black hole in some cases, indicating that mass
outflow plays an important role in the overall energetics inAGNs (e.g., Reynolds 1997). Recent studies have recognizedand explored the potential effect of outflows on all scales of theAGN environment, from feeding the central supermassive blackhole inAGNs (Blandford&Begelman 1999, 2004) to influencingthe evolution of the host galaxy (Silk & Rees 1998; Scannapieco& Oh 2004) and the metallicity of the intergalactic medium(Cavaliere et al. 2002).
Measured ionic column densities provide the basis for inter-pretation of the physical nature of AGN outflows. Detailed UVspectral studies over the past decade have shown that measure-ments of these crucial parameters are often not straightforward.Analyses of absorption doublets and multiplets have revealedthat the absorbers typically only partially occult the backgroundemission sources. Without proper treatment of this effect, the col-umn densities could be severely in error (e.g., Wampler et al.1993; Barlow & Sargent 1997; Hamann et al. 1997). Additional1 Based on observations made with the NASA/ESA Hubble Space Tele-
scope and the NASA-CNES-CSA Far Ultraviolet Spectroscopic Explorer, andobtained at the Space Telescope Science Institute, which is operated by the As-sociation of Universities for Research in Astronomy, Inc., under NASA contractNAS5-26555.
2 Center for Astrophysics and SpaceAstronomy, University of Colorado, 389UCB, Boulder, CO 80309-0389; [email protected], [email protected].
3 SRON National Institute for Space Research, Sorbonnelaan 2, 3584 CAUtrecht, Netherlands; [email protected], [email protected], [email protected].
4 Space Telescope Science Institute, 3700 San Martin Drive, Baltimore,MD 21218; [email protected], [email protected], [email protected].
5 Center for Astrophysical Sciences, Department of Physics and Astronomy,Johns Hopkins University, Baltimore, MD 21218.
6 Department of Physics, Technion, Haifa 32000, Israel; [email protected], [email protected].
7 Astronomical Institute, University of Utrecht, P.O. Box 80-000, 3508 TAUtrecht, Netherlands.
8 Department of Physics and Astronomy, University of Nebraska, Lincoln,NE 68588-0111; [email protected].
9 Department of Physics, Western Michigan University, Kalamazoo, MI49008; [email protected].
10 Columbia Astrophysics Laboratory, 550 West 120th Street, New York,NY 10027; [email protected].
11 JILA, University of Colorado, Campus Box 440, Boulder, CO 80309;[email protected].
12 Theoretical Astrophysics and Space Radiation Laboratory, CaliforniaInstitute of Technology, MC 130-33, Pasadena, CA 91125; [email protected].
85
The Astrophysical Journal, 623:85–98, 2005 April 10
# 2005. The American Astronomical Society. All rights reserved. Printed in U.S.A.

complications that could affect column density measurementsare different covering factors for different background emissionsources (Ganguly et al. 1999; Gabel et al. 2003), velocity-dependent covering factors (e.g., Arav et al. 1999), and inhomo-geneous distributions of absorbing material (de Kool et al. 2002).
Many recent investigations of AGN outflows have focusedon intensive multiwavelength observations of Seyfert 1 galaxies.Seyferts are well suited for these studies because they includethe brightest AGNs in the UVand X-ray. The X-ray spectra con-tain the imprint of the bulk of the outflow’s mass, which can nowbe deblended into individual absorption lines with the high-resolution capabilities of the Chandra X-Ray Observatory andXMM-Newton, allowing detailed study. The high-quality UVspectra available with HST and FUSE provide a complementary,precise probe of the complex absorption troughs. Because of therelatively narrow absorption in Seyfert outflows, the importantUV doublets and multiplets are typically unblended, allowingmeasurements of these key diagnostic lines.
We have undertaken an intensive multiwavelength observingcampaign with HST/STIS, FUSE, and Chandra to study theintrinsic absorption in the Seyfert 1 galaxy Mrk 279. Mrk 279was selected for this study because of its UVand X-ray bright-ness and the rich absorption spectrum in both bands, includingunblended and well-resolved UV doublets (see Scott et al. 2004,hereafter SK04). In addition, it has minimal contamination byGalactic absorption and a relatively weak contribution from anarrow emission line region (NLR), both of which can com-plicate measurements of the absorption properties. As part of aseries of papers devoted to this campaign, we present here adetailed study of the UV absorption in the combined STIS andFUSE spectra. We develop a new approach for measuring thecovering factors and column densities in the absorbers, makingfull use of the high-quality far-UV spectrum. These measure-ments provide the foundation for subsequent analysis and in-terpretation of the mass outflow in Mrk 279 and provide novelgeometric constraints. In other papers, we present inhomoge-neous models of the UV absorption (Arav et al. 2005), densitydiagnostics based onO vK-shell X-ray lines (Kaastra et al. 2004),and full analysis of the X-ray spectrum (E. Costantini et al. 2005,in preparation). In future papers, we will present photoionizationmodels of the UVandX-ray absorption and analysis of absorptionvariability. In the next section, we describe the HST and FUSEobservations and present an overview of the absorption spectrum;in x 3 we review the standard doublet technique for measuringintrinsic absorption and, together with the Appendix, discuss im-portant limitations of this method; the formalism of our fittingmethod and results forMrk 279 are described in x 4; in x 5 the fitsare interpreted and implications for physical constraints on theoutflow are explored; finally, a summary is presented in x 6.
2. OBSERVATIONS AND THE INTRINSICABSORPTION SPECTRUM
2.1. Simultaneous HST/STIS and FUSEObservations of Mrk 279
The nucleus of Mrk 279 was observed for a total of 41 ks(16 orbits) with the SpaceTelescope ImagingSpectrograph (STIS)on board HST in 2003 May 13–18 and for 91 ks with FUSE in2003 May 12–14. The STIS observation used the E140M grat-ing, which covers 1150–1730 8, and was obtained through the0B2 ; 0B2 aperture. The spectrum was processed with CALSTISversion 2.16, which removes the background light from eachechelle order using the scattered light model from Lindler &Bowers (2000). Low residual fluxes in the cores of saturated
Galactic lines indicate accurate removal of scattered light: typ-ical fluxes in the cores are�< 2.5% of the local unabsorbed con-tinuum flux levels, andmean fluxes averaged over the absorptioncores are < 3% of the noise in the troughs. The final spectrumwas sampled in 0.012–0.017 8 bins, thereby preserving the�6.5 km s�1 kinematic resolution of STIS/E140M.We found that the standard pipeline processing did not
yield a fully calibrated spectrum because of two effects: (1) theechelle ripple structure, because of the characteristic efficiencyof the detector along each order, is not completely removed (seeHeap & Brown 1997), and (2) the sensitivity of the MAMA de-tectors has degraded with time, and the change has not beenincorporated in the pipeline for the echelle gratings. In order tocorrect for these effects in the Mrk 279 spectrum, we used mul-tiple spectra of the white dwarf spectrophotometric standard,BD +28�4122, one of which was taken close in time to our ob-servation. First, a composite stellar spectrum of BD +28�4122composed of FOS and STIS data (Bohlin et al. 2001) was usedto flux-calibrate a 1997 STIS spectrum of BD +28�4122 that doesnot exhibit the echelle ripple structure. This flux-calibrated spec-trum was then used to correct a STIS spectrum of BD +28
�4122,
taken on 2003 May 3 with the same grating and aperture as ourMrk 279 observation andwhich does show the same ripple struc-ture seen in the Mrk 279 spectrum. These two corrections wereperformed by dividing the fiducial spectrum for each step by thecomparison spectrum, fitting a polynomial to the result, and thenmultiplying the comparison spectrum by that polynomial. Weused the polynomials from the second step described above tocorrect the spectrum of Mrk 279. To obtain a smooth correctionfor each order in the Mrk 279 spectrum, we applied averagesof the polynomials corresponding to the four adjacent orders.Although we were able to remove most of the echelle ripplestructure in this way, some lower amplitude residual curvatureremains in some orders. However, the intrinsic absorption fea-tures measured in this study are well corrected.The FUSE spectrum, obtained through the 3000 ; 3000 aper-
ture, covers 905–11878. The spectrum was processed with thecurrent standard calibration pipeline, CALFUSE version 2.2.3.The eight individual spectra obtained with FUSE, from the com-bination of four mirror/grating channels and two detectors, wereco-added for all exposures. Mean residual fluxes measured in thecores of saturated Galactic lines are consistent with zero withinthe noise (i.e., standard deviation of the fluxes) in the troughs ofthese lines, indicating accurate background removal. The spec-trum was resampled into �0.02–0.03 8 bins to increase thesignal-to-noise ratio (S/N) and preserve the full resolution ofFUSE, which is nominally �20 km s�1.To place the FUSE and STIS spectra on the proper wave-
length scale, we followed the procedure described in SK04. Thecentroids of prominent, unblended Galactic interstellar ab-sorption lines were measured and used as fiducials in compar-ing to the Galactic 21 cm H i line in the line of sight to Mrk 279(Wakker et al. 2001). The lines measured in the STIS spectrumare consistent with the 21 cm H i line within the measurementuncertainties and thus required no correction. The FUSE spec-trum showed substantial shifts relative to the adopted standard.Because of nonlinear offsets in the wavelength scale, local shiftswere measured and applied individually to each spectral regioncontaining intrinsic absorption features.To normalize the absorption, we fitted the total intrinsic (i.e.,
unabsorbed) AGN emission in the FUSE and STIS spectra overeach intrinsic absorption feature. This was done empirically byfitting cubic splines to unabsorbed spectral regions adjacent tothe features, at intervals of �5 8. We also derived models for
GABEL ET AL.86 Vol. 623

the individual contributions of the different emission sources(continuum and emission lines), since they are required for ouranalysis. For the continuum source, we fitted a single power law( fk / k��) to the observed flux at two widely separated wave-lengths that are relatively uncontaminated with absorption orline emission features, k ¼ 955 and 1500 8. After first correct-ing for Galactic extinction [using the extinction law of Cardelliet al. 1989, with E(B� V ) ¼ 0:016], we found a best-fit spectralindex � ¼ 1:6. This power-law model matches the few otherline-free regions of the UV spectrum, i.e., k �1150 1180, 1330,and 1390 8, to within a few percent. Thus, for the emission-linemodel, we simply subtracted the continuum power-law modelfrom the empirical fit to the total emission.
2.2. The Far-UV Absorption Spectrum
The full far-UV spectrum from our FUSE and STIS obser-vations is shown in Figure 1. The active nucleus inMrk 279 wasin a relatively high flux state during this epoch; the UV contin-uum flux was similar to a 2000 January FUSE observation, and�7 times stronger than in FUSE and STIS spectra obtained in2002 May. Full treatment of these earlier observations is givenin SK04. Qualitatively, the intrinsic absorption spectrum in ournew observations is similar to the earlier epochs (although someimportant variations were detected that will be the subject of alater study). Here we give a brief overview and refer the readerto SK04 for a more thorough phenomenological discussion ofthe absorption.
Absorption from a range of ions is detected around thesystemic velocity of the host galaxy, between v ¼ �600 and+150 km s�1; we adopt the redshift for Mrk 279 from SK04, z ¼0:0305 � 0:0003. Normalized absorption profiles for some ofthe prominent lines are shown in Figure 2. The absorption isseen to be resolved into multiple distinct kinematic componentsat the resolution of STIS E140M and FUSE, revealing strikingdifferences in the kinematic structure of different ions. Low-ionization species appear in several narrow components (seeSi iii in Fig. 2, but also Si ii, C ii, C iii, and N iii in SK04, Figs. 7–14). However, the more highly ionized O vi, N v, and C iv
doublets, which are the primary UV signatures of intrinsic ab-sorption in AGNs, are much broader and have different centroidvelocities. The Lyman lines exhibit the kinematic structure ofthe low-ionization components but also appear in the lower out-flow velocity region coinciding with the high-ionization lines,v � �300 to �200 km s�1.
We adopt the component numbering system from SK04,which was based on the kinematic structure in Ly�. In Figure 2dotted vertical lines mark the centroids of the components inSK04 that exhibit narrow absorption structure in low-ionizationspecies in the current spectrum but that have no correspondingstructure in the high-ionization CNO doublets. Centroids of thecomponents seen in the high-ionization lines are identified withdashed lines; we have added component 2c to the SK04 systembased on structure in the C iv and N v profiles. Measured cen-troid radial velocities and widths of the components are listed inTable 1. The differences in ionization and kinematic structurebetween these two groups of components strongly suggest thatthey are physically distinct. On the basis of their ionization, nar-row widths, distinct centroid velocities, and (in component 4)low density implied by the stringent upper limit on the C ii col-umn density in the excited fine-structure level, SK04 concludedthat at least some of the low-ionization components are not as-sociated with the AGN outflow. Instead, they posited that theyare associated with gas located at relatively large distances fromthe nucleus—perhaps from an interaction with the companion
galaxy MCG +12-13-024, or high-velocity clouds associatedwith the host galaxy of Mrk 279 or, in the case of component 1,in the interstellar medium of the host galaxy.
In this study, we restrict our attention to the bona fide intrinsicabsorption, i.e., that presumed to be directly associated with anoutflow from the AGN. We take this to include all absorptionfrom the broad O vi, N v, and C iv doublets; Figure 2 shows thatany absorption associated with the narrow low-ionization com-ponents will at most only effect the outer wings of the outflowcomponents in these lines. Conversely, Figure 2 shows thatLyman line absorption from the low-ionization components isstrong and heavily blended with the intrinsic absorption com-ponents; thus, we limit our analysis of H i to the uncontaminatedregion, v � �300 to �200 km s�1.
3. THE DOUBLET METHOD: OVERVIEWAND LIMITATIONS
We present here a brief review of the standard technique formeasuring UVabsorption in AGN outflows and describe somelimitations of this method to highlight the motivation for ourmethod of analysis. In earlier studies of intrinsic absorption, thered members of doublet pairs were often found to be deeperthan expected relative to the blue lines, based on their intrinsic2:1 optical depth ratios. In many cases this was interpreted asdue to partial coverage of the background nuclear emission bythe absorbing gas, e.g., Wampler et al. (1993), Barlow& Sargent(1997), and Hamann et al. (1997) (other possibilities are scat-tering from an extended region and emission from an extendedsource unrelated to the central engine of the AGN; Cohen et al.1995; Goodrich & Miller 1995; Kraemer et al. 2001). If partialcoverage is not accounted for, the absorption ionic column den-sities can be severely underestimated, which will dramaticallyaffect the interpretation of the outflow. The expression for the ob-served absorption that includes the effects of the line-of-sightcovering factor (C ) and optical depth (�) is
I(v) ¼ 1� C(v)½ �þC(v)e�� (v); ð1Þ
where I is the normalized flux and all quantities are written asa function of radial velocity v. Since the optical depths of theUV doublet pairs are in the simple 2:1 ratio, equation (1) can besolved for the covering factor and optical depths of each doublet
Fig. 1.—Full far-UV spectrum of the active nucleus in Mrk 279 from theFUSE and HST/STIS spectra obtained in 2003 May. Emission lines are labeledabove the spectrum. The data were heavily binned for clarity in presentation.
FITTING INTRINSIC UVABSORPTION IN MRK 279 87No. 1, 2005

(Barlow & Sargent 1997; Hamann et al. 1997). The resultingexpressions, which we refer to as the doublet solution, are
C ¼ I 2r � 2 Ir þ 1
Ib � 2 Ir þ 1; ð2Þ
�r ¼ � lnIr � Ib
1� Ir
� �; ð3Þ
where the r and b subscripts identify the red and blue membersof the doublet, and the equation for � was derived by Arav et al.(2002). These expressions can be evaluated for unblended (i.e.,
sufficiently narrow) absorption doublets with members that areindividually resolved, and derived as a function of radial ve-locity. While this has provided a revolutionary advance in thestudy of intrinsic AGN absorption, there are some key limita-tions to this method, described below.
3.1. Multicomponent Nature of the Background Emission
An implicit assumption in the doublet solution is that the ab-sorption is imprinted on a uniform, homogeneous backgroundemission source, since it allows for the solution of only a singleC and � . However, the AGN emission is composed of multiple,
Fig. 2.—Normalized absorption profiles from 2003 May STIS and FUSE spectra. The spectra are plotted as a function of radial velocity with respect to the systemicredshift of the host galaxy. The centroid velocities of kinematic components associated with the AGN outflow are identified with dashed vertical lines. Componentsidentifying low-ionization absorbers likely unrelated to the outflow (see text) are shown with dotted lines. The difference in kinematic structure is evident in comparingthe high-ionization CNO doublets with Si iii. The Ly� profile is not plotted at v < �400 km s�1 because of contamination with Galactic absorption at these velocities.
GABEL ET AL.88 Vol. 623

physically distinct sources, i.e., a continuum source and emission-line regions (including multiple kinematic components), whichhave different sizes, morphologies, and flux distributions. Thus,in cases where the absorber only partially occults the total back-ground emission, the distinct sources would be expected to havedifferent line-of-sight covering factors, in general. This possibil-ity was first explored by Ganguly et al. (1999) for the continuumsource and broad emission line region (BLR) and was demon-strated in the intrinsic absorption systems by Ganguly et al.,Gabel et al. (2003), Hall et al. (2003), and SK04.
To account for multiple discrete background emission sources,equation (1) can be expanded to give the normalized flux of thejth line:
Ij ¼X
iR i
j C ije
�� j þ1�C ij
� �h i; ð4Þ
where the ith individual emission source contributes a fractionRij ¼ Fi
j=P
i (Fij ) to the total intrinsic flux and has covering fac-
torC ij. The effective covering factor for each line is the weighted
combination of individual covering factors and can be written
Cj ¼X
iC i
j Rij: ð5Þ
These are expansions of the expressions given in Ganguly et al.(1999) to include an arbitrary number of emission sources.
The multicomponent nature of the background emission hasseveral important implications for the analysis of AGN outflows:
1. From equation (5) it can be seen that lines of the same ioncould have different effective covering factors, which may in-troduce an error into the doublet equation. This happens whenthe underlying emission fluxes differ from the spectral positionof one line to the other and is illustrated in the N v doublet ab-sorption shown in Figure 3. Here the emission line flux un-derlying the blue member is �15% greater than under the redline, while the continuum flux under the two lines is identical.The magnitude of this error depends on the slopes of the fluxdistributions between the doublet lines and differences in indi-vidual covering factors of the distinct emission sources. Gangulyet al. (1999) showed that this effect is typically small when con-sidering the continuum/BLR distinction, because of the gradualslope of the BLR; however, if the doublet lines are near saturation,it could have a very large effect since small flux differences cor-
respond to large optical depth differences in these cases. Also, anunderlying narrow emission line component could have a pro-nounced effect on the solution (Arav et al. 2002; Kraemer et al.2002; Gabel et al. 2004).
2. Without separation of the covering factors of the distinctsources, covering factors derived from a doublet pair cannot beapplied to measure column densities of other lines. This is ev-ident in Figure 3; clearly the effective covering factor derivedfor N v is not applicable to Ly� if the individual continuum andemission-line covering factors differ since Ly� has much moreunderlying line flux. Similarly, Ly�, plotted in the bottom panelin Figure 3, will not generally have the same effective coveringfactor as Ly�, because of the different emission-line contribu-tions under each line. However, if the individual covering fac-tors are known, effective covering factors can be constructed forany line using equation (5). This is important for measuringsinglet lines or contaminated multiplets that have no indepen-dent measure of the covering factor.
3. Finally, the doublet solution misses potentially important,unique constraints on the absorption and emission geometry.For example, combined with estimates of the sizes of the in-dividual sources derived from other techniques, the individualcovering factors constrain the size of the absorber (e.g., Gabelet al. 2003) and the relative location of the different emission
TABLE 1
Kinematics of Absorption Components in Markarian 279
Component
Velocitya
(km s�1)
FWHM
(km s�1)
1................................................................ 85 40
2................................................................ �265 50
2a.............................................................. �290 30
2b.............................................................. �325 30
2c.............................................................. �355 65
3................................................................ �390 20
4................................................................ �460 20
4a.............................................................. �490 65
5................................................................ �550 30
Note.—Measurements for components 2, 2a, 2c, and 4a are from theN v k1242 line; components 1, 2b, 3, 4, and 5 are from Si iii and C iii.
a Radial velocity relative to the systemic redshift adopted for Mrk279, z ¼ 0:305.
Fig. 3.—Spectrum of Ly�–N v (top) and Ly�–O vi (bottom), illustratingcomplexities in treating covering factors in intrinsic absorption measurements.The continuum flux level, plotted as dashed lines, is essentially identical foreach pair of lines, while the emission-line fluxes underlying each line differgreatly. This has important implications for the relative effective covering fac-tors. In addition, the nature of the BLR emission underlying these lines is com-plex: Ly� absorption lies on the high-velocity blue wing of O vi, while N v
absorption has a contribution from the red wing of the Ly� BLR.
FITTING INTRINSIC UVABSORPTION IN MRK 279 89No. 1, 2005

components and absorber as projected on the plane of the sky.The individual covering factors can also serve as a unique probeof more detailed geometry of the background emission. Con-sider for example the O vi–Ly� spectrum shown in Figure 3.The O vi doublet absorbs its own emission-line flux at the blue-shifted velocity of the outflow (vBLR ��600 to �200 km s�1),while the Ly� absorber sits primarily on the high-velocity bluewing of the O vi BLR at vBLR � �2200 km s�1. The Ly� lineemission is relatively weak. Similarly, there is a contributionfrom the extreme red wing of the Ly�BLR profile under the N v
absorption. Constraints on the emission-line covering factorsfor these lines could be used to probe the kinematic-geometricstructure of the BLR; the absorber can thus serve as a filter toview and explore the background AGN sources.
3.2. Systematic Errors in the C and � Solutions
Another limitation is that the doublet method always gives asolution, but it is often difficult to gauge its accuracy due to thenonlinear dependency of the solution on measurement errors.To explore this, we have generated synthetic absorption profilesthat include random fluctuations simulating spectral noise, andwe have calculated C and � using the doublet equations. Illus-trative results are shown in the Appendix, whereas a completequantitative treatment will be presented in a later paper. We findthat there are systematic errors in the solutions that can givemisleading results. These errors are not random about the actualvalue but rather systematically underestimate the actual cover-ing factor, as seen in the Appendix; the discrepancy in the solu-tion increases with weaker absorption doublets and decreasedS/N. In addition, Ganguly et al. (1999) demonstrated that the fi-nite instrumental line-spread function can lead to further sys-tematic errors in the doublet solution.
4. OPTIMIZATION FITTING OF THE INTRINSICABSORPTION: LYMAN SERIES AND CNO
DOUBLET GLOBAL LINE FITS
Motivated by the limitations of the traditional doublet methoddescribed above, we introduce here a different approach for mea-suring intrinsic absorption. The underlying principle is to increasethe number of lines that are simultaneously fitted in order to(1) explore additional parameters contributing to the formation ofobserved absorption troughs and (2) overconstrain the set of equa-tions. This allows for the treatment of more complex, physicallyrealistic scenarios of the absorption-emission geometry. By min-imizing errors to simultaneous fits of multiple lines, noise in thespectrum will generally be smoothed out, in contrast to the erraticbehavior of the doublet solution demonstrated in x 3.2 and theAppendix.
4.1. Formalism
Our fitting algorithm employs the Levenberg-Marquardt non-linear least-squares minimization technique to solve equation (4)for specified absorption parameters (Ci
j , �j).13 It is similar in
principle to that used in SK04 to analyze the Lyman lines inearlier spectra ofMrk 279. Given a total of n observed absorptionlines (Ij) as constraints, up to n�1 parameters can be modeled.No a priori assumptions are made about the kinematic distri-bution of the covering factors and optical depths of the absorb-ing material (e.g., Gaussian); indeed, one goal is to solve forthe velocity-dependent absorption parameters to constrain the
kinematic-geometric structure of the mass outflow. Thus, wederive fits to the absorption equations for each velocity bin. Thisalso avoids errors in the solutions resulting from averaging overvariable profiles. The algorithm minimizes the �2 function, witheach data point appropriately weighted by the 1 � errors, whichare a combination of spectral noise and estimated uncertaintiesin fitting the intrinsic underlying fluxes. For the latter, the con-tinuum flux uncertainties were determined from the residualsbetween the power-law model and the line-free regions of thespectrum. We estimated uncertainties in the emission-line fluxesby testing different empirical fits over the absorption features,finding the range that gave what we deemed reasonable line-profile shapes.The key requirement in employing this technique is to link
multiple absorption lines for simultaneous fitting. There are twogeneral ways to do this:
1. Lines from the same energy level.—The most straight-forward way is to fit all available lines arising from the sameionic energy level, thereby eliminating uncertainties in ionic abun-dances or level populations. If the relative underlying fluxes fromdistinct emission sources differs between the lines, the individ-ual covering factors of those emission sources can be derived. Inthe subsequent analysis, we fit all of the uncontaminated Lymanseries lines in Mrk 279. These lines are ideal because they span avery large range in optical depth and have significantly differentamounts of underlying emission-line flux (see Gabel et al. 2003).In addition, the full set of lines is accessible in low-redshiftAGNs with combined FUSE and STIS spectra. We note that theFe iiUVmultiplets, which appear in a small fraction of AGN ab-sorbers (de Kool et al. 2001; Kraemer et al. 2001), are anotherpromising set of lines for this analysis.2. Global-fitting approach.—The second approach involves
linking lines fromdifferent ions (or any group of lines arising fromdifferent levels) by placing physically motivated constraints ontheir absorption parameters. In our analysis ofMrk 279 below, wefit the six combined lines of the O vi, N v, and C iv doublets by as-suming that they share the same covering factors. Another po-tential application of this method is to link the absorption for agiven line in spectra from different epochs via assumptions aboutthe relative values of the absorption parameters between epochs(e.g., assuming that the covering factors did not change). The va-lidity of the assumptions used to link the equations can then betested by the result of the fit.
4.2. Covering Factor and Optical Depth Solutions for Mrk 279
For the intrinsic absorption in Mrk 279, we independentlyfitted the two groups of lines described above: the Lyman serieslines and the combined CNO doublets, i.e., a global fit. For eachset of lines, we tested two different models of the absorptioncovering factor. In model A, a single covering factor was as-sumed to describe all lines; i.e., no distinction was made be-tween the different emission sources. In model B, independentcovering factors for the continuum source and emission lines,Cc and Cl, were assumed. In this case, the general expressionsin equations (4) and (5) reduce to those in Ganguly et al. (1999).For the Lyman lines, the solvable range is limited to�300 km
s�1P v P�200 km s�1 because of blending with the narrow,low-ionization components in the high-velocity region of theoutflow (see x 2.2). This is due to the failure of equation (4) wheremultiple absorption components with different covering factorscontribute in the same velocity bin; there is no straightforwardway to disentangle how the different absorbers overlap as pro-jected against the background emission sources. Figure 2 shows
13 Using software provided by C. Markwardt, http://cow.physics.wisc.edu/~craigm/idl /idl.html, which is based on the MINPACK-1 optimization soft-ware of J. More available at http://www.netlib.org.
GABEL ET AL.90 Vol. 623

that Ly�, Ly�, and Ly� give the best constraints for the Lymanseries analysis, exhibiting clean, well-defined absorption profilesat relatively high S/N. Weak absorption in Ly� is also present incomponent 2, while Ly� is contaminated with Galactic H2 ab-sorption and thus omitted from the fitting. Ly is not detected incomponents 2–2a within the limits of the spectral noise; thus, toreduce the effect of noise on the solution, we set the normalizedflux to unity for this line. All lines of higher order than Ly wereomitted from the analysis since they exhibit no intrinsic absorp-tion and provide no additional constraints. Thus, there are fivelines as constraints to fit the two and three free parameters for theLyman solution in models A and B, respectively.
For the global fitting of the O vi , N v, and C iv doublets, theabsorption equations were linked by assuming that their cov-ering factors are equal (separately for the continuum and emis-sion lines in model B). The optical depth of each ion is a freeparameter. As described in x 2.2 and seen in Figure 2, these linesare not strongly contaminated by the narrow, low-ionization ab-sorption that dominates the Lyman lines; at most, there is onlyweak contamination in the wings of the broad, intrinsic absorp-tion features by these low-ionization systems.
Best-fits to the covering factors and optical depths (or equiv-alently, column densities) for both line groups are shown inFigure 4 (model A) and Figure 5 (model B). In all cases, theparameter space search for the covering factors was restricted tothe physically meaningful range 0 � C i � 1. The plotted error
bars represent the formal 1 � statistical errors in the best-fit pa-rameters. Specifically, these correspond to values giving��2 ¼1 and were computed from the diagonal elements of the co-variance matrix for the optimal fit (Bevington 1969, pp. 242–245). For cases where the covering factor solution is a boundaryvalue (0, 1), e.g., much of the Cc solution for the CNO doubletsin model B, no covariance matrix elements are computed for thatparameter since it is not a minimum in the solution. For thesecases, we estimated uncertainties by deriving solutions for mod-els keeping the parameter fixed, and finding the value giving��2 ¼ 1 from the best-fit solution at the boundary value. To en-sure that the computations did not erroneously stop at local min-ima, we generated solutions using different starting points for theparameter search space; identical results were found in all cases.The fitted profiles, derived by inserting the best-fit solutions intoequation (4), for both models (model A in blue, model B in red)are compared with the observed normalized absorption profilesin Figure 6.
4.3. Errors and Uncertainties
There are some possible errors in this fitting that should bementioned. First, the emission lines are treated as all arising froma single component. Line emission from distinct kinematic com-ponents, i.e., broad-, intermediate-, and narrow-line regions, thatare covered by different fractions by the absorbers could intro-duce an error into the solution (although the narrow-line region
Fig. 4.—Best-fit covering factor and column density/optical depth solutions from �2 minimization for the single covering factor geometric model (model A).Top panels show C solutions, solved independently for the Lyman series (left panels) and combined CNO doublets (right panels). Bottom panels show the H i col-umn density and C iv (dashed histogram), N v (dotted histogram), and O vi (solid histogram) optical depth solutions. The contaminated, and thus unreliable, region ofH i absorption is plotted with dotted histograms.
FITTING INTRINSIC UVABSORPTION IN MRK 279 91No. 1, 2005

in Mrk 279 is relatively weak). Also, there are cases where ab-sorption features sit on the BLR emission from different linesand thus sample different velocities of the BLR profile (i.e., Ly�and N v, described in x 3.1 and shown in Fig. 3). This couldintroduce an error into the solution if there are spatial inhomo-geneities in the BLR gas as a function of velocity. Second, thearea on the sky sampled by the FUSE aperture is 4 orders ofmagnitude greater than the STIS aperture. While this has noconsequences for the continuum and BLR emission, which areunresolved and much smaller than the 0B2 STIS aperture, anyextended emission might effect the solutions. This could includescattering of nuclear emission by an extended scatterer (e.g.,Kraemer et al. 2001) or extended O vi NLR emission. Finally,we have assumed that the absorption optical depth of each line(� j) is uniform across the lateral extent of the emission sourcesand thus that the absorber is completely homogeneous (seede Kool et al. 2002). Models departing from this assumption arepresented in Arav et al. (2005).
5. DISCUSSION AND INTERPRETATION
5.1. Favored Absorption Model: Independent Continuumand Emission-Line Covering Factors
Figure 6 shows that both geometric models are able to matchthe intrinsic absorption features well at most outflow velocities,indicating that the solutions for thesemodels and parameters aredegenerate over much of the profiles. There are some regionsthat are fitted somewhat better by model B, particularly C iv inthe low-velocity outflow component. However, there is addi-
tional, stronger evidence that supports the two covering factormodel for the outflow, as outlined below.
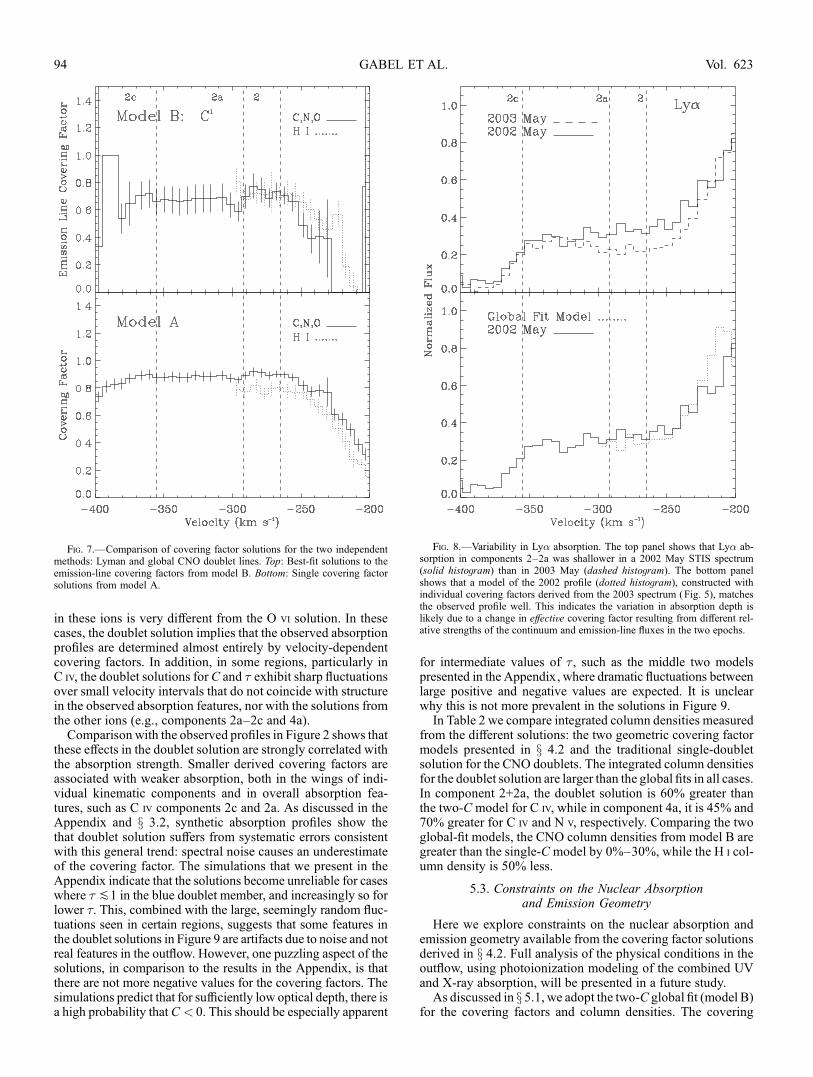
1. Consistent covering factor solutions from the independentLyman line and global CNO doublet fittingmethods.—Figure 5shows that both the Lyman and global CNO doublet best-fitsolutions are consistent with full coverage of the continuumsource over most of the velocity range with a valid Lyman solu-tion. Further, the independent solutions for the two groups oflines are plotted together in Figure 7 for a direct comparison;the emission-line covering factor profiles computed in model Bare shown in the top panel and the single covering factors de-rived in model A are shown in the bottom panel. The H i andCNO Cl fits are nearly identical over most of the core region ofthe absorption, with C l � 0:7 (although in the wing of the ab-sorption, v > �250 km s�1, the solutions diverge somewhat).In contrast, the Lyman method solution in model A is system-atically less than the global doublet solution by about 0.1–0.15at all velocities.2. Consistency with the emission source sizes.—The con-
tinuum and emission-line covering factor solutions in model Bare also physically consistent with our understanding of thesizes of those emission sources. Reverberation mapping studiesof AGNs have shown that the BLR is substantially larger thanthe ionizing continuum source. These studies measure the BLRto be several to tens of light-days across (e.g., Peterson et al.1998; Kaspi et al. 2000), while the UV continuum source islikely at least an order of magnitude smaller in size, and pos-sibly much smaller (e.g., Laor & Netzer 1989; Proga 2003).
Fig. 5.—Same as Fig. 4, but for the two covering factor geometric model (model B). Continuum covering factors are plotted in black and emission-line coveringfactors in red.
GABEL ET AL.92 Vol. 623

Thus, the solution of a fully covered continuum source andpartial coverage of the emission lines is consistent with the nu-clear emission geometry. The fact that this result was arrived atseparately with the independent Lyman and global CNO fits iscompelling.
3. Variability in Ly� absorption.—In Figure 8 the normal-ized Ly� profile from our observation is compared with theSTIS spectrum obtained a year earlier, showing that the absorp-tion was shallower in the previous epoch by �0.15 in normal-ized flux units. This variability is not due to a lower H i columndensity; the strength of Ly� in a contemporaneous FUSE ob-servation indicates that Ly� was saturated in the earlier epoch(SK04), as it is in the 2003 spectrum, and hence the profiles inboth epochs simply delineate the unocculted flux. Thus, a changein covering factor must be responsible for the observed variabil-ity. Noting that the emission line–to–continuum flux ratio wasgreater in the 2002 spectrum than in 2003, we tested whether thedifference in covering factor of the respective sources couldexplain the variability. To this end, we constructed a syntheticabsorption profile for Ly� in the 2002 epoch based on the resultsfrom our analysis of the 2003 spectrum. Specifically, we set Cc ¼1 at all velocities and solved for Cl in the 2003 Ly� profile. Theobserved continuum and emission-line fluxes in the 2002 spec-trum were then weighted by these covering factors according toequation (4). The resulting model profile, shown in the bottompanel of Figure 8,matches the observed absorption verywell. Thisprovides a natural explanation for the variability in the Ly� ab-
sorption profile: the covering factors of each source individuallyremain the same, but a change in the effective covering factor oc-curs because of different relative strengths of the distinct back-ground emission components.
5.2. Comparison of Solutions from Different Methods
The covering factor and optical depth solutions for C iv, N v,and O vi from the two-C global fit (model B) are compared withthe single-doublet solutions (eqs. [2] and [3]) in Figure 9. Theglobal-fit effective covering factors are weighted combinationsof the individual covering factors shown in Figure 5, derivedusing equation (5). In Figure 9, solid red lines show C profilesfor the short-wavelength members of each doublet and dottedlines show results for the long-wavelength lines; they are nearlyidentical in all cases, indicating negligible errors in the doubletsolution due to different contributions from underlying line emis-sion (see item 1 in x 3.1).
Figure 9 shows that the solutions from the two methods differsignificantly in some regions, with important implications forthe kinematic-geometric and ionization structure in the outflow.For example, the doublet covering factor solution, plotted inblack, exhibits much more velocity dependence than the globalfit. This is seen, for example, in the wings of C iv and N v incomponent 4a and the red wing of component 2, where C de-creases strongly in the wings, while the optical depth profilesshow little or no relation to the absorption trough structurewhen compared with Figure 2. Further, the kinematic structure
Fig. 6.—Best-fit intrinsic absorption profiles for the Lyman lines (left) and CNO doublets (right) from the two geometric models. The normalized observedspectrum is plotted in black, model A profiles are in blue, and model B profiles in red. The model profiles were derived from the best-fit covering factors and columndensities shown in Figs. 3 and 4 using eq. (4). The contaminated region of the Lyman line fit (Figs. 3 and 4, dotted lines) is not plotted.
FITTING INTRINSIC UVABSORPTION IN MRK 279 93No. 1, 2005
in these ions is very different from the O vi solution. In thesecases, the doublet solution implies that the observed absorptionprofiles are determined almost entirely by velocity-dependentcovering factors. In addition, in some regions, particularly inC iv, the doublet solutions for C and � exhibit sharp fluctuationsover small velocity intervals that do not coincide with structurein the observed absorption features, nor with the solutions fromthe other ions (e.g., components 2a–2c and 4a).
Comparison with the observed profiles in Figure 2 shows thatthese effects in the doublet solution are strongly correlated withthe absorption strength. Smaller derived covering factors areassociated with weaker absorption, both in the wings of indi-vidual kinematic components and in overall absorption fea-tures, such as C iv components 2c and 2a. As discussed in theAppendix and x 3.2, synthetic absorption profiles show thethat doublet solution suffers from systematic errors consistentwith this general trend: spectral noise causes an underestimateof the covering factor. The simulations that we present in theAppendix indicate that the solutions become unreliable for caseswhere � P1 in the blue doublet member, and increasingly so forlower �. This, combined with the large, seemingly random fluc-tuations seen in certain regions, suggests that some features inthe doublet solutions in Figure 9 are artifacts due to noise and notreal features in the outflow. However, one puzzling aspect of thesolutions, in comparison to the results in the Appendix, is thatthere are not more negative values for the covering factors. Thesimulations predict that for sufficiently low optical depth, there isa high probability that C < 0. This should be especially apparent
for intermediate values of � , such as the middle two modelspresented in the Appendix, where dramatic fluctuations betweenlarge positive and negative values are expected. It is unclearwhy this is not more prevalent in the solutions in Figure 9.In Table 2 we compare integrated column densities measured
from the different solutions: the two geometric covering factormodels presented in x 4.2 and the traditional single-doubletsolution for the CNO doublets. The integrated column densitiesfor the doublet solution are larger than the global fits in all cases.In component 2+2a, the doublet solution is 60% greater thanthe two-C model for C iv, while in component 4a, it is 45% and70% greater for C iv and N v, respectively. Comparing the twoglobal-fit models, the CNO column densities from model B aregreater than the single-C model by 0%–30%, while the H i col-umn density is 50% less.
5.3. Constraints on the Nuclear Absorptionand Emission Geometry
Here we explore constraints on the nuclear absorption andemission geometry available from the covering factor solutionsderived in x 4.2. Full analysis of the physical conditions in theoutflow, using photoionization modeling of the combined UVand X-ray absorption, will be presented in a future study.As discussed in x 5.1, we adopt the two-C global fit (model B)
for the covering factors and column densities. The covering
Fig. 7.—Comparison of covering factor solutions for the two independentmethods: Lyman and global CNO doublet lines. Top: Best-fit solutions to theemission-line covering factors from model B. Bottom: Single covering factorsolutions from model A.
Fig. 8.—Variability in Ly� absorption. The top panel shows that Ly� ab-sorption in components 2–2a was shallower in a 2002 May STIS spectrum(solid histogram) than in 2003 May (dashed histogram). The bottom panelshows that a model of the 2002 profile (dotted histogram), constructed withindividual covering factors derived from the 2003 spectrum (Fig. 5), matchesthe observed profile well. This indicates the variation in absorption depth islikely due to a change in effective covering factor resulting from different rel-ative strengths of the continuum and emission-line fluxes in the two epochs.
GABEL ET AL.94 Vol. 623

factor solutions in Figure 5 are consistent with the UV contin-uum source being fully in our sight line through the absorber,for all kinematic components, while the emission lines are onlypartially so. This constrains the relative line-of-sight geome-try of the absorbers and nuclear emission sources and places alower limit on the transverse size of the outflow. Monitoring oftime lags between BLR and continuum variations in Mrk 279by Maoz et al. (1990) gives the size of the BLR, RBLR ¼12 lt-days. Thus, the projected size of the UVabsorbers on the planeof the sky, against the AGN emission, is at least (Cl)1=2 ; RBLR,or �10 lt-days in the cores of the absorption components, andpossibly decreasing in the wings.
An additional probe of the nuclear geometry is possible becausethe Ly� absorption lies on the high-velocity blue wing of the O vi
BLR profile, at vBLR � �2200 km s�1, as discussed in x 3.1 andillustrated in Figure 3. Thus, it samples different BLR kinematicsthanmost other absorption lines, which absorb BLR velocities co-inciding with the absorption outflow velocities (vBLR � �300 kms�1). Therefore, comparison of the Ly� emission-line cover-ing factor and those associated with other lines serves as a probeof the kinematic-spatial structure of the BLR. The potential ef-fect of complex velocity-dependent structure in the BLR onthe absorption covering factors was explored in Srianand &Shankaranarayanan (1999). Since we assumed a priori that all
Fig. 9.—Comparison of covering factor and optical depth solutions derived with the global-fitting (red ) and single-doublet (black) methods. Left panels:Covering factors from the global-fitting method are the effective values derived by weighting the individual covering factors in model B by their respective fluxes.The short-wavelength doublet members are plotted with solid red lines and the long-wavelength members with dotted lines. Right panels: Optical depths for thelong-wavelength lines of the doublets.
TABLE 2
Integrated Ionic Column Densities
Model A: 1-C Fit Model B: 2-C Fit Doublet Method Full Coveragea
Ion 2+2ab 4ab 2+2a 4a 2+2a 4a 2+2a 4a
C iv....................... 1.6 0.9 2.1 1.1 3.3 1.6c 1.5 0.9
N v ....................... >6.6 2.1 >6.6 2.1 >8.1 3.6 4.7 2.0
O vi ...................... >14 >13 >14 >13 >14 >13 9.8 9.5
H i ........................ 7.5 . . . 5.0 . . . . . . . . . 4.4d . . .
Notes.—All column densities in units of 1014 cm�2; for doublets, measurements are for the red member; lowerlimits are quoted for lines with regions having � � 3.
a C ¼ 1 assumed everywhere.b Component 2+2a, v ¼ �230 to �315 km s�1; component 4a, v ¼ �435 to �535 km s�1.c Integrated over limited range due to infinities in solution.d Using Ly� line.
FITTING INTRINSIC UVABSORPTION IN MRK 279 95No. 1, 2005

lines share the same individual covering factors in the Lyman se-ries fit in x 4.2, a legitimate comparison requires obtaining inde-pendent constraints on the covering factor of the O vi BLR bluewing by the Ly� absorber. This comes straightforwardly from theobserved Ly� absorption line, since Ly� has no underlying lineemission. Using the result that Cc ¼ 1, the intrinsic optical depthratio for Ly� :Ly�, and the observed Ly� profile, the absorptionprofile for Ly� can be derived as a function of Cl from equa-tion (4). Some illustrative results are shown in Figure 10. Thisshows, for example, that both an unocculted and fully occultedhigh-velocity O vi BLR are ruled out by the data. We find thatvalues in the range 0:5PCl P 0:8 are required to fit the majorityof the Ly� absorption in components 2–2a. This is similar to theemission-line covering factor derived from the global fit to theCNO doublets (Fig. 5, right). In addition, the Ly� Cl profile canbe derived independently for comparison with Ly�, in a mannersimilar to that for Ly� (i.e., using Cc ¼1, the observed Ly� pro-file, and the Ly� :Ly� � ratio). The result is identical to the so-lution to the combined Lyman lines in components 2–2a shown inFigure 5 (left) within uncertainties. Therefore, the absorption cov-ering factor of the O viBLR emission at vBLR � �2200 km s�1 issimilar to Cl at lower emission-line velocities (by the CNO dou-blets and Ly�). These results may provide constraints for modelsof the BLR, e.g., testing disk versus spherical geometries andoutflow versus rotational kinematics for the BLR.
6. SUMMARY
We have presented a study of the intrinsic UV absorption inthe Seyfert 1 galaxy Mrk 279 from an analysis of combinedlong observations with HST/STIS and FUSE. These spectrawere obtained simultaneously in 2003 May as part of an inten-sive multiwavelength observing campaign.
We present a review of the standard technique for measuringintrinsic UV absorption parameters based on individual doubletpairs, showing some key limitations of this method: (1) It cannottreat multiple background emission sources. This introduces a po-tential error in the solution and misses important geometric con-straints on the outflow. (2) Using synthetic absorption profiles, weshow that it systematically underestimates the covering factor (andoverestimates �) in response to spectral noise. The discrepancy inthe solution is shown tobe stronglydependent on absorption strength.To measure the UV absorption parameters in Mrk 279, we
independently fitted two groups of lines: the Lyman series linesand the combined CNO lithium-like doublets. The doublet fit-ting involved a global-fitting approach, which assumes that thesame covering factors apply to all ions. By increasing the num-ber of lines that are simultaneously fitted, more complex andphysically realistic models of the absorption-emission geome-try can be explored. Solutions for two different geometricalmodels, one assuming a single covering factor for all backgroundemission and the other assuming separate covering factors for thecontinuum and emission lines, both give good statistical fits to theobserved absorption. However, several lines of evidence supportthe model with two covering factors: (1) the independently fittedLyman lines and CNO doublets give similar solutions to the cov-ering factors of both emission sources; (2) the fits are consistentwith absorbers that fully occult the continuum source and partiallycover the emission lines, consistent with the relative sizes of theemission sources; and (3) observed variability in the Ly� absorp-tion depth can be explained naturally by this model as a change ineffective covering factor resulting from a change in the relativestrengths of the emission components.Comparison of the traditional solutions based on individual
doublets and the global-fit solutions shows that the former ex-hibits much stronger velocity dependence. This is seen as de-creases in covering factor in the wings of individual kinematiccomponents, and as peculiar fluctuations in both � and C inother regions of relatively weak absorption. In light of the sys-tematic errors shown to be inherent in the individual-doubletsolution, we conclude that some of these effects are likely arti-facts of the solution and should be interpreted with caution.The covering factor solutions from our global fit constrains
the relative line-of-sight geometry of the absorbers and nuclearemission sources. The derived emission-line covering factor,combinedwith the size of the BLR, constrains the projected sizeof the absorber to bek10 lt-days. We utilize the coverage of thehigh-velocity O vi BLR by the Ly� absorber to explore kine-matic structure in the BLR; we find no evidence for dependenceof the absorber’s BLR covering factor on the BLR velocity.
Support for this work was provided by NASA through grantsHST-AR-9536, HST-GO-9688, and NAG5-12867 and throughChandra grant 04700532. C. M. G. acknowledges supportfrom NSF through grant AST 03-07912. We thank D. Lindlerand J. Valenti for their assistance in correcting the STIS spec-trum and C. Markwardt for making his software publicly avail-able. We also thank the referee P. Hall for comments that helpedclarify and improve this study.
APPENDIX
Here we address how the expressions for the covering factor and optical depth from the doublet solution (eqs. [2] and [3]) dependon noise in the spectrum. We have generated synthetic absorption profiles for doublet pairs that include random fluctuations tosimulate spectral noise.We derive theC and � solutions for these synthetic profiles to determine any trends in the solution as a functionof noise level and absorption strength.
Fig. 10.—Constraints on the covering factor of the high blueshifted velocityO vi BLR by the Ly� absorber. The observed normalized Ly� profile (black) iscompared with models derived for three values of emission-line covering factor(red ). Models were derived using the observed Ly� absorption, as described inthe text. Models with an unocculted (dashed line) and fully occulted (dottedline) BLR are ruled out. An emission-line covering factor of 0.7 (solid line),consistent with the global fits, matches most of the observed profile well.
GABEL ET AL.96 Vol. 623

Our synthetic profiles were derived in the following way. The optical depth profiles were assumed to be Gaussian, parameterized bythe width (�) and peak optical depth in the core of the blue line (�max ). The ‘‘true’’ normalized absorption profiles for the lines are thenderived from equation (1), with the covering factors set at a constant value across the profile for each doublet pair, and �(v)r ¼ �(v)b=2at all velocities. Thus, we have assumed in effect a single background emission source to avoid the complications described in x 3.1.For comparison with our study of Mrk 279, we have set the velocity resolution of our synthetic profiles to that of the STIS E140Mgrating, and the absorption width (� ¼ 50 km s�1) to be approximately consistent with intrinsic absorption components 2–2c. Tosimulate spectral noise, we generated a normally distributed random number associated with each velocity bin in the synthetic spectra.The noise level was normalized by selecting the desired S/N in the unabsorbed continuum and then weighting the noise by flux level,S=N(v) / I (v)1=2, according to Poisson statistics.
We generated profiles for a range of S/N, C (real), and �max. Here we give some brief illustrative results, while reserving a fullanalysis for a later study. The left panels in Figure 11 show synthetic profiles for doublet pairs with �max ¼ 2, 1, 0.5, and 0.25. In allcases, C ¼ 0:8 and the noise level was normalized to be 3% in the continuum. The middle two columns show the correspondingcovering factor and optical depth profiles derived directly from equations (2) and (3), with the actual values marked with dashed linesfor comparison. Errors in the doublet solution are immediately apparent. The covering factors are systematically underestimated, andthe magnitude of error is strongly dependent on absorption strength. This is seen both in the lower covering factors derived in the coresof features with lower �max (means and standard deviations measured over the central 150 km s�1 are printed in each plot) and in thedecrease in C computed in the wings of each profile.
These systematic errors are due to nonlinear effects in the doublet equations. This is seen most clearly by comparing the numerator,N ¼ (Ir �1)2, and denominator, D ¼ Ib � 2Ir þ 1, in the expression for the covering factor (eq. [2]). The right panels of Figure 11show the values ofD andN/C (in red), which would be identical in each velocity bin for infinite S/N. Because of the forms ofN andD,these quantities have very different dependences on noise; �N/N becomes much smaller than �D/D for weak absorption and, at
Fig. 11.—Systematic errors in the doublet solution resulting from spectral noise. Left panels show synthetic normalized doublet profiles ( long-wavelengthmembers in red) with simulated noise for a range of absorption strengths. The peak � in the blue doublet member is given at the top of each panel. The second andthird columns show the C and � profiles, respectively, derived from the doublet solution (eq. [3]); means and standard deviations (sd) measured for C in the central150 km s�1 are printed. The actual constant covering factor, C ¼ 0:8, and Gaussian � profiles are shown with dashed lines for comparison. Right panels show thevalue of the numerator (N ) of the doublet equation divided by C (red ) and the denominator (D, black). Because of the nonlinear form of N, N/C drops below thenoise level in D for low � and thus biases the solution to underestimates of C. The discrepancy increases for weaker absorption.
FITTING INTRINSIC UVABSORPTION IN MRK 279 97No. 1, 2005

sufficiently small � , N is less than the noise level ofD. As N decreases relative to the noise inD for weaker absorption, the probabilitythat 0 � D � N=C becomes vanishingly small and the average value of N/D becomes increasingly small.
These errors could have pronounced effects on the interpretation of the outflow. Each solution that underestimates C overestimates� . Thus, ionic column densities are systematically overestimated, with increasing relative discrepancies in weaker doublets, leading toerrors in determining the ionization structure and total gas in the absorber via photoionization models. In addition, the errors incovering factor solutions will effect geometric inferences. For example, because of the high-ionization state of AGN outflows, lowerionization species appearing in UV spectra are generally weaker. Thus, the increasing discrepancy in weaker absorption doublets maylead to the misinterpretation of ionic-dependent covering factors. Also, weaker absorption in the wings of an absorption feature couldlead to apparent velocity-dependent covering factors that are instead due to optical depth variations, or it could at least exaggerate theeffect of velocity-dependent coverage.
REFERENCES
Arav, N., Becker, R. H., Laurent-Muehleisen, S. A., Gregg, M. D., White, R. L.,Brotherton, M. S., & de Kool, M. 1999, ApJ, 524, 566
Arav, N., Kaastra, J., Kriss, G. A., Korista, K. T., Gabel, J., & Proga, D. 2005,ApJ, 620, 665
Arav, N., Korista, K. T., & de Kool, M. 2002, ApJ, 566, 699Barlow, T. A., & Sargent, W. L. W. 1997, AJ, 113, 136Bevington, P. R. 1969, Data Reduction and Error Analysis for the PhysicalSciences (New York: McGraw-Hill)
Blandford, R. D., & Begelman, M. C. 1999, MNRAS, 303, L1———. 2004, MNRAS, 349, 68Bohlin, R. C., Dickinson, M. E., & Calzetti, D. 2001, AJ, 122, 2118Cardelli, J. A., Clayton, G. C., & Mathis, J. S. 1989, ApJ, 345, 245Cavaliere, A., Lapi, A., & Menci, N. 2002, ApJ, 581, L1Cohen, M. H., Ogle, P. M., Tran, H. D., Vermeulen, R. C., Miller, J. S.,Goodrich, R. W., & Martel, A. R. 1995, ApJ, 448, L77
Crenshaw, D. M., Kraemer, S. B., Boggess, A., Maran, S. P., Mushotzky, R. F.,& Wu, C.-C. 1999, ApJ, 516, 750
Crenshaw, D. M., Kraemer, S. B., & George, I. M. 2003, ARA&A, 41, 117de Kool, M., Arav, N., Becker, R., Laurent-Muehleisen, S. A., White, R. L.,Price, T., & Gregg, M. D. 2001, ApJ, 548, 609
de Kool, M., Korista, K. T., & Arav, N. 2002, ApJ, 580, 54Gabel, J. R., Kraemer, S. B., & Crenshaw, D. M. 2004, in ASP Conf. Ser. 311,AGN Physics with the Sloan Digital Sky Survey, ed. G. T. Richards & P. B.Hall (San Francisco: ASP), 239
Gabel, J. R., et al. 2003, ApJ, 583, 178Ganguly, R., Eracleous, M., Charlton, J. C., & Churchill, C. W. 1999, AJ, 117,2594
George, I. M., Turner, T. J., Netzer, H., Nandra, K., Mushotzky, R. F., &Yaqoob, T. 1998, ApJS, 114, 73
Goodrich, R. W., & Miller, J. S. 1995, ApJ, 448, L73
Hall, P. B., Hutsemekers, D., Anderson, S. F., Brinkmann, J., Fan, X.,Schneider, D. P., & York, D. G. 2003, ApJ, 593, 189
Hamann, F., Barlow, T. A., Junkkarinen, V., & Burbidge, E. M. 1997, ApJ,478, 80
Heap, S. R., & Brown, T. M. 1997, in The 1997 HST Calibration Workshopwith a New Generation of Instruments, ed. S. Casertano (Baltimore: STScI),114
Kaastra, J. S., et al. 2004, A&A, 428, 57Kaspi, S., Smith, P. S., Netzer, H., Maoz, D., Jannuzi, B. T., & Giveon, U.2000, ApJ, 533, 631
Kraemer, S. B., Crenshaw, D. M., George, I. M., Netzer, H., Turner, T. J., &Gabel, J. R. 2002, ApJ, 577, 98
Kraemer, S. B., et al. 2001, ApJ, 551, 671Kriss, G. A. 2002, in ASP Conf. Ser. 255, Mass Outflow in Active GalacticNuclei: New Perspectives, ed. D. M. Crenshaw, S. B. Kraemer, & I. M.George (San Francisco: ASP), 69
Laor, A., & Netzer, H. 1989, MNRAS, 238, 897Lindler, D., & Bowers, C. 2000, BAAS, 32, 1418Maoz, D., et al. 1990, ApJ, 351, 75Peterson, B. M., Wanders, I., Bertram, R., Hunley, J. F., Pogge, R. W., &Wagner, R. M. 1998, ApJ, 501, 82
Proga, D. 2003, ApJ, 585, 406Reynolds, C. S. 1997, MNRAS, 286, 513Scannapieco, E., & Oh, S. P. 2004, ApJ, 608, 62Scott, J. E., et al. 2004, ApJS, 152, 1 (SK04)Silk, J., & Rees, M. J. 1998, A&A, 331, L1Srianand, R., & Shankaranarayanan, S. 1999, ApJ, 518, 672Wakker, B. P., Kalberla, P. M. W., van Woerden, H., de Boer, K. S., & Putman,M. E. 2001, ApJS, 136, 537
Wampler, E. J., Bergeron, J., & Petitjean, P. 1993, A&A, 273, 15
GABEL ET AL.98