X-ray Point Source Population of the Region Southeast …€¦ · X-ray Point Source Population of...
1
X-ray Point Source Population of the Region Southeast of 30 Doradus in the LMC We present the initial results of an X-ray point source population survey of a ~7 deg 2 region southeast of 30 Doradus in the Large Magellanic Cloud (LMC) using archival XMM-Newton data. We have retrieved and reduced relevant data from the XSA to characterize the X-ray emission from each of the detected point sources. We will determine candidate counterparts to the X-ray sources using primarily optical, UV and IR catalogues. In addition we will assess and remove the contribution of contaminating extragalactic Active Galactic Nuclei (AGN) to the detected population, as well as likely fore- ground Galactic sources, to obtain a purely LMC sample. Our ultimate goal is to construct an X-ray Luminosity Function for the X-ray binaries (XRBs) in this region of the LMC to compare to the results of a galaxy scale XRB population simulation code. which, along with the known stellar population from optical studies, will allow us to determine the likely evolutionary history of this region of the LMC and compare it to other regions of this galaxy. P. J. Kavanagh 1 , M. Sasaki 1 1 - Insitut für Astronomie und Astrophysik, Kepler Center for Astro and Particle Physics, Universität Tübingen, Tübingen, Germany Abstract Introduction The Large Magellanic Cloud (LMC) is a vitally important labora- tory for astrophysical research. Due to its location in the sky, its small relatively small distance (48 kpc, Macri et al. 2006), small inclination and low obscuration, the stellar content of the entire LMC can be resolved in multiple wavelength regimes. These multiwavelength data can be used to investigate the physical properties of the detected X-ray sources allowing classification of the X-ray emitting source population. Thus, the global properties of the source classes can be investigated in the galaxy as a whole. Such an analysis of a nearby and complete population is important for the understanding of the unresolved X-ray emission of more distant galaxies as well as the understanding of the population of the Milky Way. Past studies of the LMC X-ray population have been performed with several X-ray observatories including Einstein (Long et al. 1981, Wang et al. 1991), Exosat (Jones et al. 1985, Pakull et al. 1985, Pietsch et al. 1989) and ROSAT (Haberl & Pietsch 1999, Sasaki et al. 2000), which have incrementally increased the total number of X-ray sources in the direction of the LMC to ~1000 by the end of the ROSAT era. Due to the small FOV of both the Chandra and XMM-Newton observatories in relation to the LMC, a survey of the entire galaxy has yet to be performed with either of these instruments. Because of this, Chandra and XMM-Newton X- ray population studies focus on sub-regions of the LMC (see Shtyk- ovskiy & Gilfanov 2005, for example). We present the initial results of the analysis of the region southeast of and including 30 Doradus which has been relatively well ob- served with XMM-Newton. This region hosts the most active star forming region in the local group (30 Doradus), several known X- ray binaries, pulsars, supernova remnants, stellar clusters, super- bubbles and a supergiant shell making it one of the most interesting regions in the LMC. Figure 1: MCELS 1 colour image of the LMC with red corresponding to H , green to SII and blue to OIII. Also shown are the XMM-Newton observation FOVs plotted on the MCELS close-up image of the 30 Dor region. Figure 2: Combined false colour image of the XMM-Newton observations. Red corre- sponds to the 0.3-1 keV energy range, green to 1-2 keV and blue to 2-8 keV. PN count rates were calculated for each of the detected sources taking into account the variation in exposure across the FOVs. Hardness Ratios (HRs) were also calculated, de- fined as: HR1 = M - S HR2 = H - M M + S H + M with S, M and H corresponding to the count rates in the 0.3-1 keV, 1-2 keV and 2-8 keV energy bands, respectively. We separated the detected sources based on their SIMBAD counter- parts to create one HR diagram for sources with multiwavelength counterparts and another for sources with either no counterparts or only previous X-ray counterparts (see Figure 3). To indicate the location of detected source spectral characteristics in HR parameter space we have generated absorbed power law and absorbed thermal plasma (APEC) HR grids using the PIMMS 3 tool, which are also included in Figure 3. We note that these two examples are insuffi- cient to describe the spectra of all of our detected sources (with some requiring more advanced models), so the grids should only be con- sidered as a guide. To reduce clutter in each plot we only include the sources with HR1 and HR2 errors < 0.25. Post supernova objects are distributed as expected in the HR dia- gram. Both SNRs are located in the ‘soft’ region of the diagram, with the PWNe location indicated moderately hard spectra and the HMXB location indicating a hard spectrum. Stellar counterparts are located throughout the diagram. However, we note that it is unclear as to whether these counterparts are truly the source of the X-ray emission (and not some unknown back- ground sources) given the lack of information on spectral types, etc., in the SIMBAD database. Only after a more detailed analysis can we verify these as counterparts. Email: [email protected] Data Reduction & Analysis The observational datasets retrieved from the XSA and are listed in Table 1 with the FOVs of the XMM-Newton observations plotted over the MCELS 1 LMC image in Figure 1. We reduced each of the datasets using SAS 10.0.0, filtering for peri- ods of high particle background. We created OoT and exposure cor- rected images in the 0.3-1 keV, 1-2 keV and 2-8 keV to produce the false colour X-ray image of the region, shown in Figure 2. Source detection was performed using the SAS task emo- saicproc to achieve the maximum possible detection sensitivity in the overlapping regions of the exposures. False detections due to stray light and sources due to obvious diffuse emission structures were removed after visual screening. In the preliminary analysis presented here we only consider the source statistics from the PN camera. Merging of MOS and PN source data for each observation, spectral analysis and variability analysis between observations will be performed in due course. As a precursor to the more rigorous multiwavelength source identi- fication to be performed, we cross-correlated our X-ray catalogue with the SIMBAD 2 astronomical database. Figure 3: XMM-Newton PN HR plots. Top - sources with multiwavelength SIMBAD counterparts. Bottom - sources with either no counterparts or previously identified X- ray sources of unknown type. Object classes are indicated in each of the plots with HMXB = High Mass X-ray Binary, SNR = Supernova Remnant, PWN = Pulsar Wind Nebula. The black and red grids represent absorbed power law and absorbed thermal plasma models of varying spectral parameters (indicated in the plots), respectively. The clusters of high mass stars are located in two groups, with one group suffering from higher foreground absorption (HR1 > 0). This is because of the presence of Wolf Rayet (WR) stars in these clus- ters, whose dominant X-ray emission (likely due to colliding wind binaries in these cases given their moderate spectral hardness) suf- fer from increased absorption due to their dense stellar winds. The majority of the brightest sources in the PN data are of an un- known nature. Given the location of many of the unknown sources on the absorbed power law grid (1.5 < < 2.5, Ishibashi & Cour- voisier 2010, and references therein) it is likely that some are background AGN. However, many are also located in similar re- gions as those sources with multiwavelength counterparts. Only after a more complete source identification analysis can we begin to discern the source classes for this sample. Table 1: XMM-Newton Observation Datasets Obs. ID Exp. time Obs. ID Exp. time (ks) (ks) 0112900101 7 0023940401 40 0104660301 27 0144530101 133 0083250101 41 0201030201 12 0113000401 48 0201030101 12 0094410101 12 0201030301 12 0094410201 12 0402000201 25 0094410701 12 0406840301 111 0113020201 38 0506220101 119 0094410401 12 0556350101 102 0094411101 13 0601200101 92 0094411401 12 References Haberl & Pietsch 1999, A&AS,139,277 Pakull et al. 1985,SSRv, 40,379 Ishibashi & Courvoisier 2010, A&A, Sasaki et al. 2000, A&AS,143,391 512,58 Shtykovskiy & Gilfanov 2005, Long et al. 1981, ApJ,248,925 A&A, 431, 597 Macri et al. 2006 ApJ,652,133 Wang et al. 1991, ApJ,374,475 Acknowledgements This research is funded by the Deutsche Forschungsgemeinschaft through the Emmy Noether Research Grant SA 2131/1 1 - The MCELS data are provided by R.C. Smith, P.F. Winkler, and S.D. Points. The MCELS project has been supported in part by NSF grants AST-9540747 and AST-0307613, and through the generous support of the Dean B. McLaughlin Fund at the University of Michigan. The National Optical As- tronomy Observatory is operated by the Association of Universities for Research in Astronomy Inc. (AURA), under a cooperative agreement with the National Science Foundation. 2 - This research has made use of the SIMBAD data base operated at CDS, Strasbourg, France. 3 - Found at http://heasarc.nasa.gov/docs/software/tools/pimms.html NH=1e20 NH=1e21 NH=1e22 Г=3 Г=4 Г=2 Г=1 NH=1e20 NH=1e21 NH=1e22 kT=0.5 keV kT=1.5 keV kT=2.5 keV kT=3.5 keV No counterpart X-ray counterpart NH=1e20 NH=1e21 NH=1e22 Г=3 Г=4 Г=2 Г=1 NH=1e20 NH=1e21 NH=1e22 kT=0.5 keV kT=1.5 keV kT=2.5 keV kT=3.5 keV cand. foreground source cand. LMC stellar source cluster of high mass stars HMXB PWN SNR Summary We have presented here the initial stages of an X-ray point source population study of the region southeast of and including 30 Dora- dus in the LMC using archival XMM-Newton data. We have de- tected several hundred sources in the region, many of which are bright enough to allow detailed spectral and temporal analysis to be performed. Preliminary source identification was carried out by cross-correlation with the SIMBAD database, identifying many sources including SNRs, PWNe and HMXBs. Thus far we have only considered the source statistics from the PN data. As the analysis progresses, merging of MOS and PN source data for each observation, photometric, spectral and temporal analysis for each source will be performed, as well as much more rigorous source identification using multiwavelength catalogues. AIT
Transcript of X-ray Point Source Population of the Region Southeast …€¦ · X-ray Point Source Population of...
X-ray Point Source Population of the Region Southeast of 30 Doradus in the LMC
We present the initial results of an X-ray point source population survey of a ~7 deg2 region southeast of 30 Doradus in the Large Magellanic Cloud (LMC) using archival XMM-Newton data. We have retrieved and reduced relevant data from the XSA to characterize the X-ray emission from each of the detected point sources. We will determine candidate counterparts to the X-ray sources using primarily optical, UV and IR catalogues. In addition we will assess and remove the contribution of contaminating extragalactic Active Galactic Nuclei (AGN) to the detected population, as well as likely fore-ground Galactic sources, to obtain a purely LMC sample. Our ultimate goal is to construct an X-ray Luminosity Function for the X-ray binaries (XRBs) in this region of the LMC to compare to the results of a galaxy scale XRB population simulation code. which, along with the known stellar population from optical studies, will allow us to determine the likely evolutionary history of this region of the LMC and compare it to other regions of this galaxy.
P. J. Kavanagh1, M. Sasaki1
1 - Insitut für Astronomie und Astrophysik, Kepler Center for Astro and Particle Physics, Universität Tübingen, Tübingen, Germany
Abstract
Introduction
The Large Magellanic Cloud (LMC) is a vitally important labora-tory for astrophysical research. Due to its location in the sky, its small relatively small distance (48 kpc, Macri et al. 2006), small inclination and low obscuration, the stellar content of the entire LMC can be resolved in multiple wavelength regimes.
These multiwavelength data can be used to investigate the physical properties of the detected X-ray sources allowing classification of the X-ray emitting source population. Thus, the global properties of the source classes can be investigated in the galaxy as a whole. Such an analysis of a nearby and complete population is important for the understanding of the unresolved X-ray emission of more distant galaxies as well as the understanding of the population of the Milky Way.
Past studies of the LMC X-ray population have been performed with several X-ray observatories including Einstein (Long et al. 1981, Wang et al. 1991), Exosat (Jones et al. 1985, Pakull et al. 1985, Pietsch et al. 1989) and ROSAT (Haberl & Pietsch 1999, Sasaki et al. 2000), which have incrementally increased the total number of X-ray sources in the direction of the LMC to ~1000 by the end of the ROSAT era. Due to the small FOV of both the Chandra and XMM-Newton observatories in relation to the LMC, a survey of the entire galaxy has yet to be performed with either of these instruments. Because of this, Chandra and XMM-Newton X-ray population studies focus on sub-regions of the LMC (see Shtyk-ovskiy & Gilfanov 2005, for example).
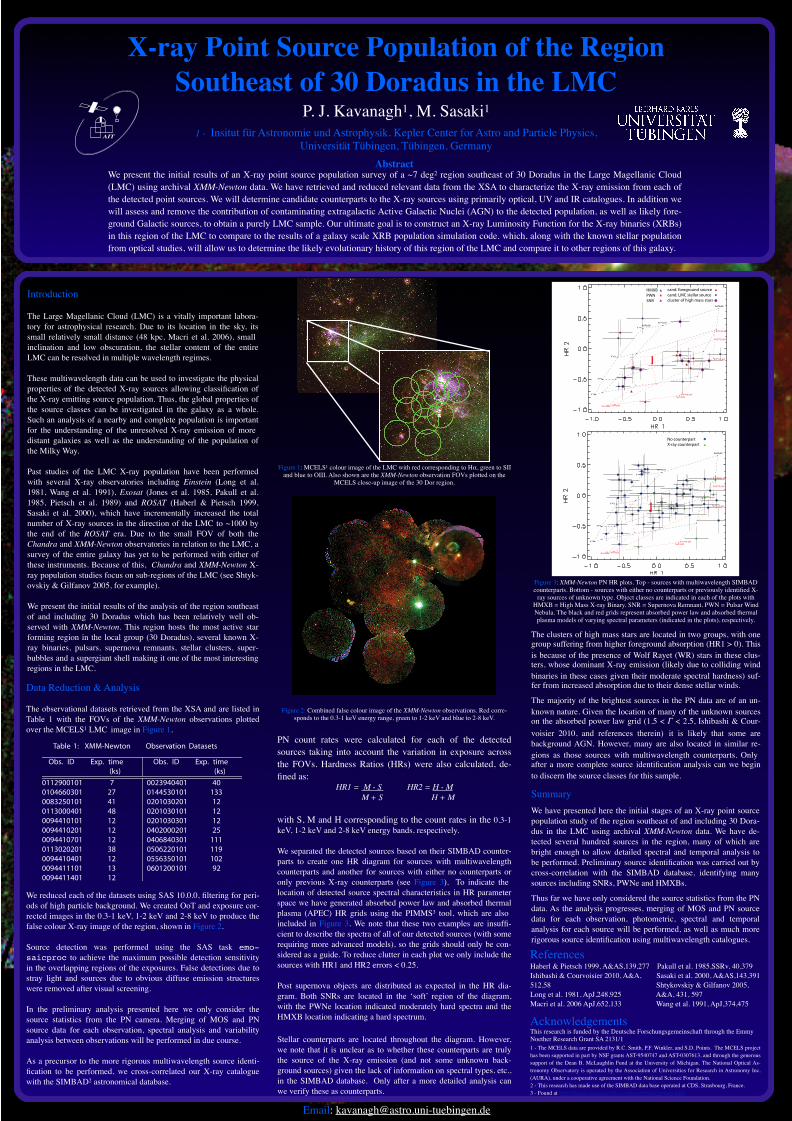
We present the initial results of the analysis of the region southeast of and including 30 Doradus which has been relatively well ob-served with XMM-Newton. This region hosts the most active star forming region in the local group (30 Doradus), several known X-ray binaries, pulsars, supernova remnants, stellar clusters, super-bubbles and a supergiant shell making it one of the most interesting regions in the LMC.
Figure 1: MCELS1 colour image of the LMC with red corresponding to H , green to SII and blue to OIII. Also shown are the XMM-Newton observation FOVs plotted on the
MCELS close-up image of the 30 Dor region.
Figure 2: Combined false colour image of the XMM-Newton observations. Red corre-sponds to the 0.3-1 keV energy range, green to 1-2 keV and blue to 2-8 keV.
PN count rates were calculated for each of the detected sources taking into account the variation in exposure across the FOVs. Hardness Ratios (HRs) were also calculated, de-fined as:
HR1 = M - S HR2 = H - M M + S H + M
with S, M and H corresponding to the count rates in the 0.3-1 keV, 1-2 keV and 2-8 keV energy bands, respectively.
We separated the detected sources based on their SIMBAD counter-parts to create one HR diagram for sources with multiwavelength counterparts and another for sources with either no counterparts or only previous X-ray counterparts (see Figure 3). To indicate the location of detected source spectral characteristics in HR parameter space we have generated absorbed power law and absorbed thermal plasma (APEC) HR grids using the PIMMS3 tool, which are also included in Figure 3. We note that these two examples are insuffi-cient to describe the spectra of all of our detected sources (with some requiring more advanced models), so the grids should only be con-sidered as a guide. To reduce clutter in each plot we only include the sources with HR1 and HR2 errors < 0.25.
Post supernova objects are distributed as expected in the HR dia-gram. Both SNRs are located in the ‘soft’ region of the diagram, with the PWNe location indicated moderately hard spectra and the HMXB location indicating a hard spectrum.
Stellar counterparts are located throughout the diagram. However, we note that it is unclear as to whether these counterparts are truly the source of the X-ray emission (and not some unknown back-ground sources) given the lack of information on spectral types, etc., in the SIMBAD database. Only after a more detailed analysis can we verify these as counterparts.
Email: [email protected]
Data Reduction & Analysis
The observational datasets retrieved from the XSA and are listed in Table 1 with the FOVs of the XMM-Newton observations plotted over the MCELS1 LMC image in Figure 1.
We reduced each of the datasets using SAS 10.0.0, filtering for peri-ods of high particle background. We created OoT and exposure cor-rected images in the 0.3-1 keV, 1-2 keV and 2-8 keV to produce the false colour X-ray image of the region, shown in Figure 2.
Source detection was performed using the SAS task emo-saicproc to achieve the maximum possible detection sensitivity in the overlapping regions of the exposures. False detections due to stray light and sources due to obvious diffuse emission structures were removed after visual screening.
In the preliminary analysis presented here we only consider the source statistics from the PN camera. Merging of MOS and PN source data for each observation, spectral analysis and variability analysis between observations will be performed in due course.
As a precursor to the more rigorous multiwavelength source identi-fication to be performed, we cross-correlated our X-ray catalogue with the SIMBAD2 astronomical database.
Figure 3: XMM-Newton PN HR plots. Top - sources with multiwavelength SIMBAD counterparts. Bottom - sources with either no counterparts or previously identified X-
ray sources of unknown type. Object classes are indicated in each of the plots with HMXB = High Mass X-ray Binary, SNR = Supernova Remnant, PWN = Pulsar Wind Nebula. The black and red grids represent absorbed power law and absorbed thermal plasma models of varying spectral parameters (indicated in the plots), respectively.
The clusters of high mass stars are located in two groups, with one group suffering from higher foreground absorption (HR1 > 0). This is because of the presence of Wolf Rayet (WR) stars in these clus-ters, whose dominant X-ray emission (likely due to colliding wind binaries in these cases given their moderate spectral hardness) suf-fer from increased absorption due to their dense stellar winds.
The majority of the brightest sources in the PN data are of an un-known nature. Given the location of many of the unknown sources on the absorbed power law grid (1.5 < < 2.5, Ishibashi & Cour-voisier 2010, and references therein) it is likely that some are background AGN. However, many are also located in similar re-gions as those sources with multiwavelength counterparts. Only after a more complete source identification analysis can we begin to discern the source classes for this sample.
Table 1: XMM-Newton Observation Datasets
Obs. ID Exp. time Obs. ID Exp. time(ks) (ks)
0112900101 7 0023940401 400104660301 27 0144530101 1330083250101 41 0201030201 120113000401 48 0201030101 120094410101 12 0201030301 120094410201 12 0402000201 250094410701 12 0406840301 1110113020201 38 0506220101 1190094410401 12 0556350101 1020094411101 13 0601200101 920094411401 12
ReferencesHaberl & Pietsch 1999, A&AS,139,277 Pakull et al. 1985,SSRv, 40,379Ishibashi & Courvoisier 2010, A&A, Sasaki et al. 2000, A&AS,143,391512,58 Shtykovskiy & Gilfanov 2005,Long et al. 1981, ApJ,248,925 A&A, 431, 597Macri et al. 2006 ApJ,652,133 Wang et al. 1991, ApJ,374,475
AcknowledgementsThis research is funded by the Deutsche Forschungsgemeinschaft through the Emmy Noether Research Grant SA 2131/11 - The MCELS data are provided by R.C. Smith, P.F. Winkler, and S.D. Points. The MCELS project has been supported in part by NSF grants AST-9540747 and AST-0307613, and through the generous support of the Dean B. McLaughlin Fund at the University of Michigan. The National Optical As-tronomy Observatory is operated by the Association of Universities for Research in Astronomy Inc. (AURA), under a cooperative agreement with the National Science Foundation.2 - This research has made use of the SIMBAD data base operated at CDS, Strasbourg, France.3 - Found at http://heasarc.nasa.gov/docs/software/tools/pimms.html
NH=1e20NH=1e21
NH=1e22
Г=3
Г=4
Г=2
Г=1
NH=1e20 NH=1e21
NH=1e22kT=0.5 keV
kT=1.5 keV
kT=2.5 keV
kT=3.5 keV
No counterpartX-ray counterpart
NH=1e20NH=1e21
NH=1e22
Г=3
Г=4
Г=2
Г=1
NH=1e20 NH=1e21
NH=1e22kT=0.5 keV
kT=1.5 keV
kT=2.5 keV
kT=3.5 keV
cand. foreground sourcecand. LMC stellar sourcecluster of high mass stars
HMXBPWNSNR
SummaryWe have presented here the initial stages of an X-ray point source population study of the region southeast of and including 30 Dora-dus in the LMC using archival XMM-Newton data. We have de-tected several hundred sources in the region, many of which are bright enough to allow detailed spectral and temporal analysis to be performed. Preliminary source identification was carried out by cross-correlation with the SIMBAD database, identifying many sources including SNRs, PWNe and HMXBs.
Thus far we have only considered the source statistics from the PN data. As the analysis progresses, merging of MOS and PN source data for each observation, photometric, spectral and temporal analysis for each source will be performed, as well as much more rigorous source identification using multiwavelength catalogues.
AIT