X-ray magnetic circular dichroism study of the magnetic anisotropy...
8
PHYSICAL REVIEW B 91, 165111 (2015) X-ray magnetic circular dichroism study of the magnetic anisotropy on TbMnO 3 V. Cuartero, 1 , * S. Lafuerza, 1 G. Sub´ ıas, 2 J. Garc´ ıa, 2 E. Schierle, 3 J. Blasco, 2 and J. Herrero-Albillos 2, 4 1 ESRF-The European Synchrotron, 71, Avenue des Martyrs, Grenoble, France 2 Departamento de F´ ısica de la Materia Condensada, Instituto de Ciencia de Materiales de Arag´ on, CSIC-Universidad de Zaragoza, C/Pedro Cerbuna 12, 50009 Zaragoza, Spain 3 Helmholtz Zentrum Berlin Mat & Energie, D-12489 Berlin, Germany 4 Centro Universitario de la Defensa, Carretera de Huesca s/n, 50090 Zaragoza, Spain (Received 23 December 2014; revised manuscript received 9 March 2015; published 7 April 2015) The magnetic anisotropy of TbMnO 3 was explored by means of polarized x-ray absorption spectroscopy and x-ray magnetic circular dichroism (XMCD) measurements at the Mn L 2,3 and Tb M 4,5 edges as a function of temperature and magnetic-field intensity. The selective magnetometry measurements were compared with the macroscopic magnetic properties on single crystals. XMCD measurements at the Tb M 4,5 edge as a function of the magnetic field reproduces quite well the macroscopic magnetic anisotropy at low temperatures with the Tb moments staying confined along their Ising axis within the ab plane, whereas a weak XMCD signal is observed at the Mn L 2,3 edge. These results point out that Tb 3+ single-ion anisotropy is the only responsible for the magnetic anisotropy on this multiferroic compound at high magnetic fields. Moreover, we found Mn L 2,3 XMCD measurements show that the cycloidal antiferromagnetic order is almost unaffected by the applied magnetic field at low temperatures under an applied magnetic field. Therefore, we discuss that this strong Ising nature of Tb 3+ ions, through a magnetocrystalline coupling mediated by the oxygen atoms, must play an important role in the field-induced electric polarization flop and therefore in the magnetoelectric coupling on TbMnO 3 . DOI: 10.1103/PhysRevB.91.165111 PACS number(s): 75.25.−j, 75.30.Gw, 75.47.Lx, 75.85.+t I. INTRODUCTION Rare-earth- (R-) transition-metal (TM) oxides show a great variety of intriguing phenomena originating from the coupling between the two spin subsystems [1]. Multiferroicity and magnetoelectric coupling are among them [2,3]. However, the combination of a magnetic ordered ground state together with ferroelectricity (FE) is not trivial [4,2], and many attempts have been made in past years to explain the occurrence of these two phenomena in the same phase. In the case of type-II multiferroics [5] where FE is driven by a noncollinear mag- netic ordering of the TM sublattice, the inversion symmetry breaking is due to the anisotropic exchange interaction also known as the Dzyaloshinskii-Moriya interaction [6], which promotes a net electric polarization. The electric polarization is then given by P ∼ λ so r ij × ( S i × S j ), where S i,j refers to the magnetic moment of the two first neighbors i , j , separated by a distance r ij , and λ SO is the spin-orbit coupling constant from which it is inferred that electric and magnetic properties are completely coupled. This is the case for TbMnO 3 , an orthorhombic perovskite (space group Pbnm) where a sinusoidal-wave-type ordering of the Mn 3+ spins, lying along b axis, order antiferromagnetically along the c axis (so-called A y -type order). This type of spin order has an onset at T N,Mn ≈ 41 K. Upon cooling in zero fields a second magnetic transition into a spiral phase occurs at about 28 K, with the cycloidal spin structure oriented on the bc plane and consequently the onset of spontaneous electric polarization parallel to the c axis. The antiferromagnetic ordering of Tb spins arises at T N,Tb ≈ 7K [7,8]. However, several spectroscopy experiments point out that the magnetic coupling between Mn and Tb, that is present even above T N,Tb , * Corresponding author: [email protected] plays the main role in the appearance of multiferroicity and magnetoelectric coupling [9–14]. Moreover, in an applied magnetic field a more complex behavior is found, and magnetic fields can control the direction of electric polarization [15]. Results showed a spin-flop transition of Mn moments, contained on the bc plane at zero field (and Pc), into a configuration lying on the ab plane for Ha or Hb (then Pa)[8]. Besides that, the macroscopic magnetic response of TbMnO 3 is highly anisotropic depending on the direction of the applied external magnetic field with respect to the crystallographic axis [16], a being the easy magnetization axis and c the hard magnetic axis. For instance, at 9 T and 5 K, the values of the magnetization are M a = 6.5, M b = 3.7, and M c = 1.1 μ B /f .u. (where f.u. represents formula unit), whereas 4μ B per ion are expected for a saturated Mn 3+ lattice (3d 4 , 5 D 0 ground state) and 9μ B is the theoretical magnetic moment per ion for a fully polarized Tb 3+ sublattice (4f 8 , 7 F 6 ground state). In addition, below 7 K, the application of an external magnetic field leads to metamagnetic transitions of the Tb 3+ moments. In particular, a field parallel to the b axis induces a commensurate long-range ordering of Tb of type C x F y [17]. In order to disentangle the magnetic contributions respon- sible for the macroscopic magnetic anisotropic behavior under applied magnetic fields on TbMnO 3 , we have investigated the differentiated role of Mn and Tb ions by soft x-ray absorption spectroscopy (XAS) and x-ray magnetic circular dichroism (XMCD) at Tb M 4,5 and Mn L 2,3 edges as a function of temperature and the intensity and direction of the applied magnetic field. We recall here that TbMnO 3 is a strong insulating sample at low temperatures suffering from sample charging, which limits the applicability of the most practiced total electron yield (TEY) detection method. Therefore, we have also performed XMCD measurements in either total fluorescence yield (TFY) or reflection modes [18]. Moreover, 1098-0121/2015/91(16)/165111(8) 165111-1 ©2015 American Physical Society
Transcript of X-ray magnetic circular dichroism study of the magnetic anisotropy...

PHYSICAL REVIEW B 91, 165111 (2015)
X-ray magnetic circular dichroism study of the magnetic anisotropy on TbMnO3
V. Cuartero,1,* S. Lafuerza,1 G. Subıas,2 J. Garcıa,2 E. Schierle,3 J. Blasco,2 and J. Herrero-Albillos2,4
1ESRF-The European Synchrotron, 71, Avenue des Martyrs, Grenoble, France2Departamento de Fısica de la Materia Condensada, Instituto de Ciencia de Materiales de Aragon,
CSIC-Universidad de Zaragoza, C/Pedro Cerbuna 12, 50009 Zaragoza, Spain3Helmholtz Zentrum Berlin Mat & Energie, D-12489 Berlin, Germany
4Centro Universitario de la Defensa, Carretera de Huesca s/n, 50090 Zaragoza, Spain(Received 23 December 2014; revised manuscript received 9 March 2015; published 7 April 2015)
The magnetic anisotropy of TbMnO3 was explored by means of polarized x-ray absorption spectroscopy andx-ray magnetic circular dichroism (XMCD) measurements at the Mn L2,3 and Tb M4,5 edges as a function oftemperature and magnetic-field intensity. The selective magnetometry measurements were compared with themacroscopic magnetic properties on single crystals. XMCD measurements at the Tb M4,5 edge as a function ofthe magnetic field reproduces quite well the macroscopic magnetic anisotropy at low temperatures with the Tbmoments staying confined along their Ising axis within the ab plane, whereas a weak XMCD signal is observedat the Mn L2,3 edge. These results point out that Tb3+ single-ion anisotropy is the only responsible for themagnetic anisotropy on this multiferroic compound at high magnetic fields. Moreover, we found Mn L2,3 XMCDmeasurements show that the cycloidal antiferromagnetic order is almost unaffected by the applied magnetic fieldat low temperatures under an applied magnetic field. Therefore, we discuss that this strong Ising nature of Tb3+
ions, through a magnetocrystalline coupling mediated by the oxygen atoms, must play an important role in thefield-induced electric polarization flop and therefore in the magnetoelectric coupling on TbMnO3.
DOI: 10.1103/PhysRevB.91.165111 PACS number(s): 75.25.−j, 75.30.Gw, 75.47.Lx, 75.85.+t
I. INTRODUCTION
Rare-earth- (R-) transition-metal (TM) oxides show a greatvariety of intriguing phenomena originating from the couplingbetween the two spin subsystems [1]. Multiferroicity andmagnetoelectric coupling are among them [2,3]. However, thecombination of a magnetic ordered ground state together withferroelectricity (FE) is not trivial [4,2], and many attemptshave been made in past years to explain the occurrence ofthese two phenomena in the same phase. In the case of type-IImultiferroics [5] where FE is driven by a noncollinear mag-netic ordering of the TM sublattice, the inversion symmetrybreaking is due to the anisotropic exchange interaction alsoknown as the Dzyaloshinskii-Moriya interaction [6], whichpromotes a net electric polarization. The electric polarizationis then given by �P ∼ λso�rij × (�Si × �Sj ), where �Si,j refers tothe magnetic moment of the two first neighbors i, j , separatedby a distance �rij , and λSO is the spin-orbit coupling constantfrom which it is inferred that electric and magnetic propertiesare completely coupled.
This is the case for TbMnO3, an orthorhombic perovskite(space group Pbnm) where a sinusoidal-wave-type ordering ofthe Mn3+ spins, lying along b axis, order antiferromagneticallyalong the c axis (so-called Ay-type order). This type of spinorder has an onset at TN,Mn ≈ 41 K. Upon cooling in zerofields a second magnetic transition into a spiral phase occursat about 28 K, with the cycloidal spin structure oriented on thebc plane and consequently the onset of spontaneous electricpolarization parallel to the c axis. The antiferromagneticordering of Tb spins arises at TN,Tb ≈ 7 K [7,8]. However,several spectroscopy experiments point out that the magneticcoupling between Mn and Tb, that is present even above TN,Tb,
*Corresponding author: [email protected]
plays the main role in the appearance of multiferroicity andmagnetoelectric coupling [9–14]. Moreover, in an appliedmagnetic field a more complex behavior is found, andmagnetic fields can control the direction of electric polarization[15]. Results showed a spin-flop transition of Mn moments,contained on the bc plane at zero field (and P�c), into aconfiguration lying on the ab plane for H‖a or H‖b (thenP‖a) [8]. Besides that, the macroscopic magnetic responseof TbMnO3 is highly anisotropic depending on the directionof the applied external magnetic field with respect to thecrystallographic axis [16], a being the easy magnetizationaxis and c the hard magnetic axis. For instance, at 9 T and5 K, the values of the magnetization are Ma = 6.5, Mb = 3.7,and Mc = 1.1 μB/f.u. (where f.u. represents formula unit),whereas 4μB per ion are expected for a saturated Mn3+ lattice(3d4, 5D0 ground state) and 9μB is the theoretical magneticmoment per ion for a fully polarized Tb3+ sublattice (4f 8, 7F6
ground state). In addition, below 7 K, the application of anexternal magnetic field leads to metamagnetic transitions ofthe Tb3+ moments. In particular, a field parallel to the b axisinduces a commensurate long-range ordering of Tb of typeCxFy [17].
In order to disentangle the magnetic contributions respon-sible for the macroscopic magnetic anisotropic behavior underapplied magnetic fields on TbMnO3, we have investigated thedifferentiated role of Mn and Tb ions by soft x-ray absorptionspectroscopy (XAS) and x-ray magnetic circular dichroism(XMCD) at Tb M4,5 and Mn L2,3 edges as a function oftemperature and the intensity and direction of the appliedmagnetic field. We recall here that TbMnO3 is a stronginsulating sample at low temperatures suffering from samplecharging, which limits the applicability of the most practicedtotal electron yield (TEY) detection method. Therefore, wehave also performed XMCD measurements in either totalfluorescence yield (TFY) or reflection modes [18]. Moreover,
1098-0121/2015/91(16)/165111(8) 165111-1 ©2015 American Physical Society

V. CUARTERO et al. PHYSICAL REVIEW B 91, 165111 (2015)
as the studied samples are thick single crystals, XAS spectrameasured in TFY must be corrected for self-absorption aswill be addressed here. From this thorough study, it can beconcluded that Tb magnetism dominates the observed strongmagnetocrystalline anisotropy in TbMnO3 (Mn contributionsare at least a factor of 6 smaller). Consequently the differentfield-dependent behaviors of the magnetization along the threecrystallographic axes reflect the Ising nature of the Tb3+moments that is brought in by the combination of spin-orbitcoupling with the low-symmetry environment of the Tb sitesin the Pbnm structure. Moreover, this strong Ising characterof Tb in TbMnO3 is also playing an important role in theelectric polarization flop from the c to the a axis under appliedmagnetic fields.
II. EXPERIMENTAL DETAILS
TbMnO3 polycrystalline samples were prepared by the ce-ramic method: Stoichiometric amounts of Tb4O7 and MnCO3
were mixed, ground, and heated up at 1000 °C during 12 h asthe first step. The resulting powder was pressed into pelletsand sintered at 1200 °C during 24 h in air. As the last step, thesamples were repressed into pellets and sintered at 1400 °Cunder Ar atmosphere during 48 h. X-ray diffraction patternswere collected with a Rigaku D/max-B diffractometer witha copper rotating anode and a graphite monochromator inorder to select the Cu Kα wavelength (λ = 1.5418 A). Thepatterns were in agreement with a single phase orthorhombicperovskite, space group Pbnm, and the samples were thenused as the feed and seed rods for the single-crystal growth.TbMnO3 single crystals were grown by the floating-zonemethod using a homemade furnace with two semiellipticalmirrors [19]. The feed and seed rods were rotating in oppositedirections at ±20 rpm, and the growth speed was 8 mm/h. Thegrowth was carried out under an Ar atmosphere, and a boule of7 cm was obtained. Three crystals were cut so that their faceswere perpendicular to the a, b, and c crystallographic axes.
The macroscopic magnetization measurements as a func-tion of temperature and applied magnetic field up to 60 kOewere performed with a commercial physical property mea-surement system (PPMS) from Quantum Design using thevibrating sample magnetometry configuration [17].
Soft x-ray spectroscopy measurements were performedat the high-field diffractometer of the UE46-PGM1 (wherePGM represents a plane grating monochromator) beamlineat the BESSY-II synchrotron (Helmholtz-Zentrum, Berlin,Germany). XAS and XMCD measurements at the Tb M4,5
edges (from 1220 to 1290 eV) and the Mn L2,3 edges (from635 to 665 eV) were carried out from 100 K down to 5 Kwith an applied magnetic field up to 6 T oriented along thethree different crystallographic axes. XMCD spectra wereobtained as the difference between two absorption spectrameasured with opposite x-ray beam helicity (right μ+ and leftμ− circular polarizations, XMCD = μ+ − μ−) and a fixedmagnetic-field direction. The dichroic signals are normalizedto the maximum intensity of the averaged XAS spectrumobtained by merging (μ+ + μ−)/2 and will be representedas a percentage of the XAS signal. The helicity of the x-raybeam was changed by reversing the phase of the helicalundulator, and the degree of circular polarization was 90%.
FIG. 1. (Color online) Configurations of the detection modesused in the experiment. (a) Reflection geometry where there is asmall angle (�8°) between the direction of the magnetic field and thephoton’s propagation vector. (b) TFY where the fluorescence emittedphotons are detected by a photodiode placed at ∼80° with respectto the incoming photons to reduce Compton scattering. (c) TEYwhere the electron-scattering cascade following the Auger decay ismeasured via the sample drain current.
A PGM was used, and the primary slits were opened in orderto find the best compromise between photon flux and energyresolution (1.2 eV).
Three detection modes were used to carry out the spectro-scopic measurements at the Tb M4,5 edges under ultra-high-vacuum conditions: TFY, reflection, and TEY. Here reflectivityand TFY measurements will be presented, more sensitive to thebulk properties of the system. The corresponding geometricalconfigurations are plotted in Fig. 1. XMCD measurementsin reflection geometry were performed in a cleaved singlecrystal with the [001] surface normal in order to get a cleansurface [Fig. 1(a)]. X rays impinged the sample at a fixedgrazing incidence angle of θ ∼ 6°–8°, and the magnetic fieldwas applied for either H‖a or H‖b allowing magnetizationof the sample parallel to its surface. The outgoing photonswere collected by a photodiode. Simultaneous TFY andTEY detection modes were used for the H�c configurationin a polished single crystal with the [001] surface normalcovered with a graphite mesh to ensure electrical conductivityat low temperatures. A photodiode was placed at about80° with respect to the incident beam as can be seen inFig. 1(b). The self-absorption effects and their correctionwill be discussed in the next section. At the Mn L2,3 edges,only TEY detection was used on a polished single crystalwith the [010] surface normal covered with a graphite mesh[Fig. 1(c)].
III. RESULTS AND DISCUSSION
A. XMCD at the Tb M4,5 edge
The Tb M4,5-edge μ+ and μ− spectra measured in reflectiongeometry with an applied magnetic field H‖a of 5 T at 5 Kare shown in Fig. 2 as well as the XMCD signals withthe applied magnetic field parallel to both [100] and [010]crystallographic directions, following the experimental setupdescribed in Fig. 1(a). The Tb 3d − 4f absorption spectrum
165111-2
X-RAY MAGNETIC CIRCULAR DICHROISM STUDY OF . . . PHYSICAL REVIEW B 91, 165111 (2015)
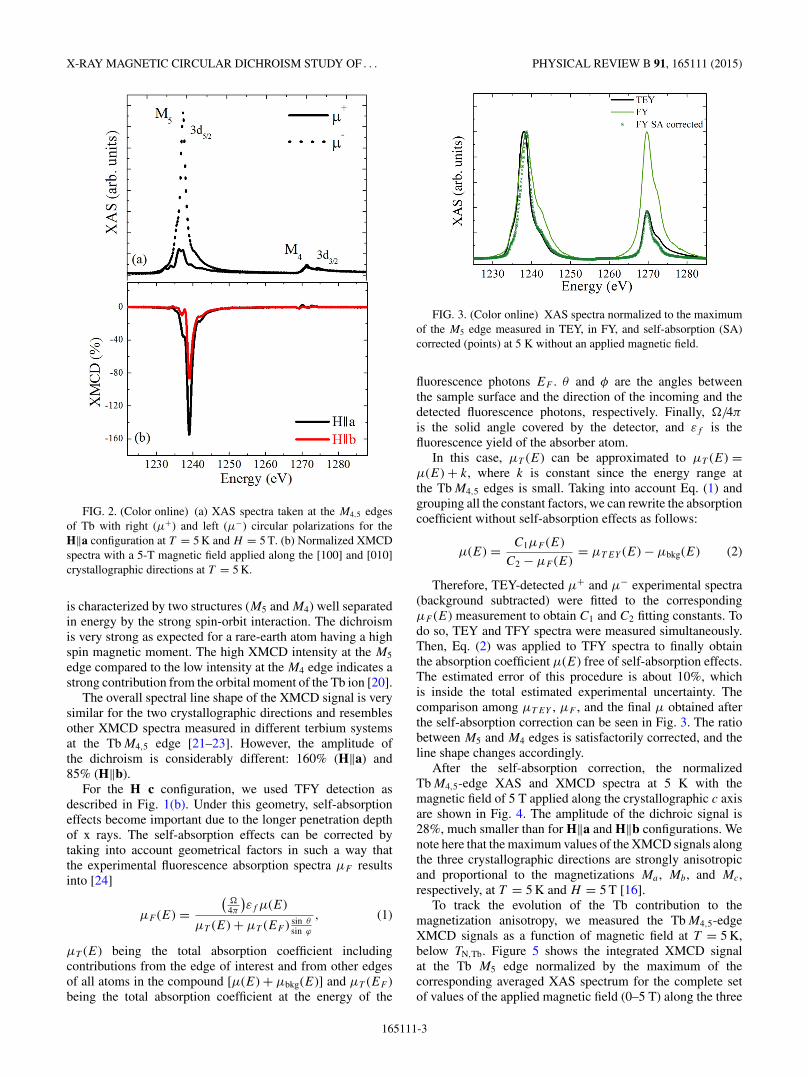
FIG. 2. (Color online) (a) XAS spectra taken at the M4,5 edgesof Tb with right (μ+) and left (μ−) circular polarizations for theH‖a configuration at T = 5 K and H = 5 T. (b) Normalized XMCDspectra with a 5-T magnetic field applied along the [100] and [010]crystallographic directions at T = 5 K.
is characterized by two structures (M5 and M4) well separatedin energy by the strong spin-orbit interaction. The dichroismis very strong as expected for a rare-earth atom having a highspin magnetic moment. The high XMCD intensity at the M5
edge compared to the low intensity at the M4 edge indicates astrong contribution from the orbital moment of the Tb ion [20].
The overall spectral line shape of the XMCD signal is verysimilar for the two crystallographic directions and resemblesother XMCD spectra measured in different terbium systemsat the Tb M4,5 edge [21–23]. However, the amplitude ofthe dichroism is considerably different: 160% (H‖a) and85% (H‖b).
For the H�c configuration, we used TFY detection asdescribed in Fig. 1(b). Under this geometry, self-absorptioneffects become important due to the longer penetration depthof x rays. The self-absorption effects can be corrected bytaking into account geometrical factors in such a way thatthe experimental fluorescence absorption spectra μF resultsinto [24]
μF (E) =(
�4π
)εf μ(E)
μT (E) + μT (EF ) sin θsin ϕ
, (1)
μT (E) being the total absorption coefficient includingcontributions from the edge of interest and from other edgesof all atoms in the compound [μ(E) + μbkg(E)] and μT (EF )being the total absorption coefficient at the energy of the
FIG. 3. (Color online) XAS spectra normalized to the maximumof the M5 edge measured in TEY, in FY, and self-absorption (SA)corrected (points) at 5 K without an applied magnetic field.
fluorescence photons EF . θ and φ are the angles betweenthe sample surface and the direction of the incoming and thedetected fluorescence photons, respectively. Finally, �/4π
is the solid angle covered by the detector, and εf is thefluorescence yield of the absorber atom.
In this case, μT (E) can be approximated to μT (E) =μ(E) + k, where k is constant since the energy range atthe Tb M4,5 edges is small. Taking into account Eq. (1) andgrouping all the constant factors, we can rewrite the absorptioncoefficient without self-absorption effects as follows:
μ(E) = C1μF (E)
C2 − μF (E)= μT EY (E) − μbkg(E) (2)
Therefore, TEY-detected μ+ and μ− experimental spectra(background subtracted) were fitted to the correspondingμF (E) measurement to obtain C1 and C2 fitting constants. Todo so, TEY and TFY spectra were measured simultaneously.Then, Eq. (2) was applied to TFY spectra to finally obtainthe absorption coefficient μ(E) free of self-absorption effects.The estimated error of this procedure is about 10%, whichis inside the total estimated experimental uncertainty. Thecomparison among μT EY , μF , and the final μ obtained afterthe self-absorption correction can be seen in Fig. 3. The ratiobetween M5 and M4 edges is satisfactorily corrected, and theline shape changes accordingly.
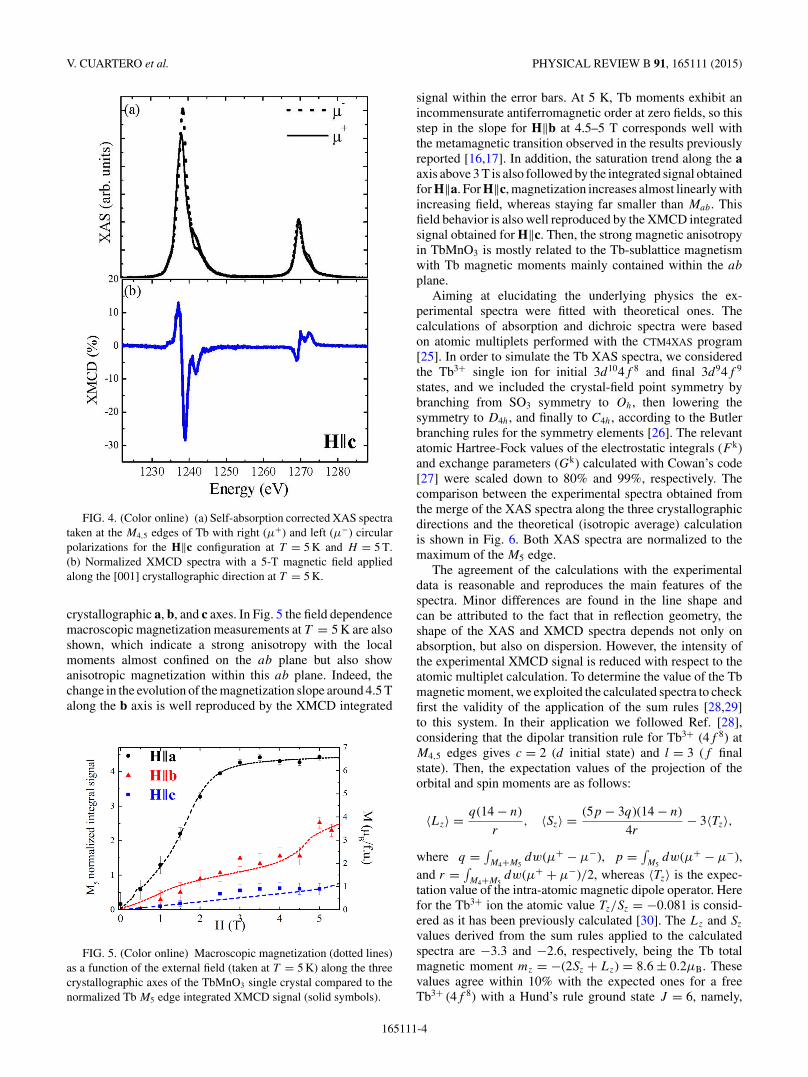
After the self-absorption correction, the normalizedTb M4,5-edge XAS and XMCD spectra at 5 K with themagnetic field of 5 T applied along the crystallographic c axisare shown in Fig. 4. The amplitude of the dichroic signal is28%, much smaller than for H‖a and H‖b configurations. Wenote here that the maximum values of the XMCD signals alongthe three crystallographic directions are strongly anisotropicand proportional to the magnetizations Ma , Mb, and Mc,respectively, at T = 5 K and H = 5 T [16].
To track the evolution of the Tb contribution to themagnetization anisotropy, we measured the Tb M4,5-edgeXMCD signals as a function of magnetic field at T = 5 K,below TN,Tb. Figure 5 shows the integrated XMCD signalat the Tb M5 edge normalized by the maximum of thecorresponding averaged XAS spectrum for the complete setof values of the applied magnetic field (0–5 T) along the three
165111-3
V. CUARTERO et al. PHYSICAL REVIEW B 91, 165111 (2015)
FIG. 4. (Color online) (a) Self-absorption corrected XAS spectrataken at the M4,5 edges of Tb with right (μ+) and left (μ−) circularpolarizations for the H‖c configuration at T = 5 K and H = 5 T.(b) Normalized XMCD spectra with a 5-T magnetic field appliedalong the [001] crystallographic direction at T = 5 K.
crystallographic a, b, and c axes. In Fig. 5 the field dependencemacroscopic magnetization measurements at T = 5 K are alsoshown, which indicate a strong anisotropy with the localmoments almost confined on the ab plane but also showanisotropic magnetization within this ab plane. Indeed, thechange in the evolution of the magnetization slope around 4.5 Talong the b axis is well reproduced by the XMCD integrated
FIG. 5. (Color online) Macroscopic magnetization (dotted lines)as a function of the external field (taken at T = 5 K) along the threecrystallographic axes of the TbMnO3 single crystal compared to thenormalized Tb M5 edge integrated XMCD signal (solid symbols).
signal within the error bars. At 5 K, Tb moments exhibit anincommensurate antiferromagnetic order at zero fields, so thisstep in the slope for H‖b at 4.5–5 T corresponds well withthe metamagnetic transition observed in the results previouslyreported [16,17]. In addition, the saturation trend along the aaxis above 3 T is also followed by the integrated signal obtainedfor H‖a. For H‖c, magnetization increases almost linearly withincreasing field, whereas staying far smaller than Mab. Thisfield behavior is also well reproduced by the XMCD integratedsignal obtained for H‖c. Then, the strong magnetic anisotropyin TbMnO3 is mostly related to the Tb-sublattice magnetismwith Tb magnetic moments mainly contained within the ab
plane.Aiming at elucidating the underlying physics the ex-
perimental spectra were fitted with theoretical ones. Thecalculations of absorption and dichroic spectra were basedon atomic multiplets performed with the CTM4XAS program[25]. In order to simulate the Tb XAS spectra, we consideredthe Tb3+ single ion for initial 3d104f 8 and final 3d94f 9
states, and we included the crystal-field point symmetry bybranching from SO3 symmetry to Oh, then lowering thesymmetry to D4h, and finally to C4h, according to the Butlerbranching rules for the symmetry elements [26]. The relevantatomic Hartree-Fock values of the electrostatic integrals (F k)and exchange parameters (Gk) calculated with Cowan’s code[27] were scaled down to 80% and 99%, respectively. Thecomparison between the experimental spectra obtained fromthe merge of the XAS spectra along the three crystallographicdirections and the theoretical (isotropic average) calculationis shown in Fig. 6. Both XAS spectra are normalized to themaximum of the M5 edge.
The agreement of the calculations with the experimentaldata is reasonable and reproduces the main features of thespectra. Minor differences are found in the line shape andcan be attributed to the fact that in reflection geometry, theshape of the XAS and XMCD spectra depends not only onabsorption, but also on dispersion. However, the intensity ofthe experimental XMCD signal is reduced with respect to theatomic multiplet calculation. To determine the value of the Tbmagnetic moment, we exploited the calculated spectra to checkfirst the validity of the application of the sum rules [28,29]to this system. In their application we followed Ref. [28],considering that the dipolar transition rule for Tb3+ (4f 8) atM4,5 edges gives c = 2 (d initial state) and l = 3 (f finalstate). Then, the expectation values of the projection of theorbital and spin moments are as follows:
〈Lz〉 = q(14 − n)
r, 〈Sz〉 = (5p − 3q)(14 − n)
4r− 3〈Tz〉,
where q = ∫M4+M5
dw(μ+ − μ−), p = ∫M5
dw(μ+ − μ−),and r = ∫
M4+M5dw(μ+ + μ−)/2, whereas 〈Tz〉 is the expec-
tation value of the intra-atomic magnetic dipole operator. Herefor the Tb3+ ion the atomic value Tz/Sz = −0.081 is consid-ered as it has been previously calculated [30]. The Lz and Sz
values derived from the sum rules applied to the calculatedspectra are −3.3 and −2.6, respectively, being the Tb totalmagnetic moment mz = −(2Sz + Lz) = 8.6 ± 0.2μB. Thesevalues agree within 10% with the expected ones for a freeTb3+ (4f 8) with a Hund’s rule ground state J = 6, namely,
165111-4

X-RAY MAGNETIC CIRCULAR DICHROISM STUDY OF . . . PHYSICAL REVIEW B 91, 165111 (2015)
FIG. 6. (Color online) Comparison of experimental (dots) (a)average XAS spectra and (b) average XMCD spectra merged alongthe three crystallographic directions (H〈‖ a+ ‖ b+ ‖ c〉) taken onTbMnO3 cleaved single crystals with the results of multiplet calcu-lations (solid lines). For the experiment, temperature and externalmagnetic field were 5 K and 5 T, respectively.
L = 3, S = 3, and a theoretical saturation moment of 9μB. Wethen applied the sum rules to the experimental spectra mergedalong the three crystallographic directions (〈a + b + c〉) underan applied magnetic field of 5 T. The expectation valuesfor Lz and Sz are −1.6 and −2.5, respectively, giving a Tbmagnetic moment of 5.8μB. The experimental Tb magneticmoment found at 5 T is much smaller than the single-ionsaturation value, but it is close to the merged value of themagnetic moment along the a and b directions (5.6μB), whichcorresponds to the plane where Tb magnetic moments aremostly confined.
This magnetic behavior is in agreement with the strong Isingcharacter of Tb3+ and the four-sublattice model proposed forthe antiferromagnetic state below TN,Tb in various perovskitecompounds [31,32]. Tb3+ (4f 8) is a non-Kramers’ ion being7F6 the lowest-lying free-ion term, but in TbMnO3, similar toTbAlO3 [33], the crystal field of the Tb Wyckoff position4c with point symmetry Cs (subgroup of C4h) splits thisground-state multiplet into 2J + 1 = 13 singlets. As expectedfrom the energy balance between the crystal-field splitting(tenths of meV) and the Zeeman energy splitting at 5 T (meV),the lowest crystal-field level is a quasidoublet that can beapproximated by a linear combination of “pure” |6,±6〉 states,corresponding to the magnetic moment of a free-Tb3+ ion, i.e.,9μB [33]. Besides, the large crystalline anisotropy of Tb3+fixes the magnetic moments of the two inequivalent Tb sitesin Pbnm, related by a mirror reflection on the ac plane, alongtheir respective Ising axes (the anisotropy axis), resulting innoncollinear ordered arrangements within the ab plane[31,32]. On the other hand, at zero external fields and below
FIG. 7. (Color online) Tb magnetic moment configuration pro-jected on the ab plane in TbMnO3 at low temperatures (T = 5 K).(a) H = 0, (b) H > 2.5 T applied along the a axis, (c) 2 T < H < 5 Tapplied along the b axis, and (d) H > 5 T applied along the b axis.
TN,Tb the Tb sublattice shows an incommensurate antiferro-magnetic order [8], whereas for TN,Tb < T < TFE = 27 K bothMn and Tb orderings have been shown to be coupled with thesame wave vector [9–14], and for T > TFE = 27 K, Tb is inthe paramagnetic state. Therefore, in zero field and T > TFE,the magnetic moments α1, α2 and β1, β2 of the four Tbsites in the orthorhombic cell are disordered along the twoIsing directions −φ0 and +φ0, respectively, from the a axiswith no net magnetization [Fig. 7(a)]. The application of amagnetic field parallel to the a or b axis does not align theTb paramagnetic moments in the field direction but alongthe Ising axes of the two inequivalent Tb sites, resultinginto pairs of aligned magnetic moments at an angle φ0 fromthe a axis [Fig. 7(b)] or the b axis [Fig. 7(d)]. However,below TN,Tb the orientation of the Tb moments followingthe applied field competes with the antiferromagnetic order,and consequently metamagnetic changes are manifested as astep behavior in the M(H ) curves. Then, at T < TN,Tb whenH‖a, the flipping of the magnetic moments occurs at lowfields about 1.5 T, whereas if H‖b, two discontinuities areobserved, and a canted antiferromagnetic order is likely tobe stable between 2 and 4.5 T. At a first approximation, wecan consider the simple two-step model for the flipping of Tbmoments along b as for related perovskites. At Hb ∼ 2 T, themagnetic moment of just one of the two inequivalent Tb sitesis aligned along its Ising axis in the field direction [Fig. 7(c)]whereas the second one is aligned at Hb ∼ 4.5 T [Fig. 7(d)][34]. Finally, we would like to note that the magnitude of theTb magnetic moment and the canted angle φ0 deduced fromthe experimental magnetization values, along the a and b axesin high magnetic fields (>5 T) and below TN(Tb), are 8.2μB
165111-5

V. CUARTERO et al. PHYSICAL REVIEW B 91, 165111 (2015)
FIG. 8. (Color online) (a) XAS spectra taken at the L2,3 edge ofMn with right (μ+) and left (μ−) circular polarizations for H‖bconfiguration at T = 5 K and H = 5 T. (b) Normalized XMCDspectra with a 5-T magnetic field applied along the crystallographicb axis at T = 5 K.
and 34°, respectively [17], which justifies that the ground-statequasidoublet (|6,6〉 ± |6,−6〉/√2) does not couple with highercrystal field levels at low temperatures.
B. XMCD at the Mn L2,3 edge
Attention is now paid to the Mn magnetic contribution.Figure 8 shows the XMCD signal using TEY as the detectionmode for H‖b as well as XAS spectra taken at the Mn L2,3
edges with both helicities for the TbMnO3 single crystal withthe [010] surface normal. Temperature and magnetic field were5 K and 5 T, respectively.
The XMCD spectrum at the Mn L2,3 edges shows a negativesignal at the L3 edge and a very weak positive signal at theL2 edge, which indicates that the Mn sublattice is polarizedby the magnetic field at low temperatures and a small netmagnetic moment contribution is induced within the proposedantiferromagnetic cycloidal configuration of the Mn momentson the ab plane [8]. The magnitude of the XMCD signal ismuch smaller (at least a factor of 8) than that reported forthe Tb M4,5 edges (see Fig. 2) and far from the expectedratio between the theoretical magnetic moments for fullysaturated Mn3+ and Tb3+ sublattices. These results indicatethat the small net magnetic moment of the Mn atoms alongthe applied field direction arises from a small canting of theantiferromagnetic Mn moments (cycloidal order). Moreover,
FIG. 9. (Color online) Normalized integrated XMCD intensityas a function of the external field (taken at T = 5 K) along thecrystallographic b axis of the TbMnO3 single crystal. Solid andopen triangles refer to the Mn L3, the Tb M5 integrated, and thenormalized dichroic signals, respectively. The Mn L3 integratedsignal is multiplied by 10 to be better visualized. The dashed linedisplays the reported magnetization measurement (right y axis).
the signs of the Mn and Tb XMCD signals are in agreementwith a parallel alignment of the Mn and Tb sublatticesand parallel to the applied magnetic field, similar to othermanganites [35].
The field dependence of the Mn L3 edge integrated XMCDsignal normalized to the maximum of the correspondingaveraged absorption spectra for H‖b at T = 5 K is shownin Fig. 9. The Mn L3 edge magnetometry curve increasescontinuously with increasing the magnetic field, but themagnetic evolution does not follow the field dependence ofthe Tb moments. Therefore, the different field dependencesof the Mn and Tb sublattice magnetizations point towardsthe decoupling between Tb3+ and Mn3+ net moments underapplied magnetic fields in agreement with neutron-diffractionmeasurements that report on a Tb ferromagnetic orderingunder applied magnetic fields (k = 0) whereas Mn cycloidalantiferromagnetic ordering remains unaltered [10,17].
FIG. 10. (Color online) Macroscopic magnetization under a 5-Tmagnetic field along the b axis as a function of temperature (dottedline) compared with the Tb XMCD M5 (open triangles) and MnXMCD L3 (solid triangles) integrated signals (multiplied by 10 for thesake of comparison) normalized to the maximum of their respectiveaveraged absorption signals.
165111-6

X-RAY MAGNETIC CIRCULAR DICHROISM STUDY OF . . . PHYSICAL REVIEW B 91, 165111 (2015)
Finally, the temperature dependence of both the Mn andthe Tb sublattice magnetizations was measured at H = 5 Tin the temperature range from 5 K up to 100 K for thisH‖b configuration using TEY detection as shown in Fig. 10,compared to the magnetization Mb [intermediate behaviorbetween the easy (a) and the hard (c) magnetization axes]. TheTb M5 integrated XMCD signal follows the same evolutionwith temperature as the macroscopic magnetization, indicatingthe main contribution of Tb magnetic moments to the bulkmagnetization up to temperature values well above theirordering temperature TN,Tb. The Mn L3 integrated XMCDsignal also shows a gradual decrease with increasing thetemperature, which can be ascribed to the decreasing of thenet magnetic moments of the Mn atoms on heating.
IV. CONCLUSIONS
The separated role of Tb and Mn sublattices on the magneticproperties of TbMnO3 under applied magnetic fields has beenstudied by spectroscopic techniques sensitive to f and d states,respectively. At zero field, Tb and Mn magnetic orderingsare coupled below TFE = 28 K [14] and are still correlatedbelow T Tb
N [9,13], different from other manganites whereR = Dy,Ho [34]. Here, reflectivity and TFY measurements ofXMCD have been performed on TbMnO3 and show that theamplitude of the dichroic signals at Tb M4,5 edges reproducethe macroscopic magnetic anisotropy of TbMnO3 as a functionof the magnetic field at low temperatures (5 K). These resultsunivocally demonstrate that the Tb sublattice is the onlyresponsible for the magnetic anisotropy in this compound.In addition, Tb magnetization never reaches saturation, soTb is not simply magnetized along the field direction. Thismagnetic behavior is perfectly explained by considering thestrong Ising character of the Tb3+ ions (J = 6) and the lowlocal symmetry of the nonequivalent Tb sites in the Pbnmstructure. Therefore, Tb moments stay along their Ising axeswithin the ab plane. By contrast, the Mn sublattice showsweak XMCD signals as a result of a small projection alongthe direction of the applied magnetic field along the b axis.Besides that, the small Mn moment has been found to beparallel to the Tb moment, which confirms that Mn momentsare canted following the applied field direction. This resultproves the decoupling between the Tb and the Mn magneticsublattices by the application of an external magnetic fieldin agreement with previous neutron-diffraction measurements[17], which lead to a noncollinear arrangement of the typeCxFy (Bertaut’s notation [36]) of the Tb moments together
with a cycloid magnetic structure of the Mn moments on theab plane when at least 5 T are applied along the b direction.
Finally and according to the differentiated Tb and Mnsublattice contributions to the magnetic response in TbMnO3
under applied magnetic fields, shown by this experimentalpaper, we discuss the role of the Tb3+ single-ion anisotropyin the macroscopic magnetoelectrical response of this system.The observed strong crystalline anisotropy of Tb3+ forces Tbmoments to be mostly confined along their Ising axes on theab plane, and only when applying H along those axes, isthe electric polarization observed to be flopped from the cto the a axis for both H‖a and H‖b configurations. In bothcases the new P orientation (Pa) is parallel to the Tb largestinduced moment (ma) component at high fields. Differently,the application of the magnetic field in the c direction does notinduce any alignment of the Tb moments, and thus the elec-trical polarization remains unaltered [16]. On the other hand,the oriented Mn magnetic moment along the field direction isvery small, so the cycloidal antiferromagnetic ordering of theMn moments is poorly affected by an external magnetic field(Fig. 9) [17]. Moreover, the magnetic coupling between Mnand Tb sublattices under applied magnetic fields is shown to bevery subtle; consequently high fields are needed to flop one ofthe components of the Mn cycloid (and then the P direction).Therefore, under applied magnetic fields magnetocrystallinecoupling originated by Tb magnetic arrangement, instead ofMn3+ anisotropy as sometimes suggested in the literature[37,38], is proposed to play a significant role in the polarizationflop from c to a. In other words, the Tb magnetic order (atHb = 5 T.) should induce a motion of the oxygen atoms, whichtriggers a field-induced transition of the Mn moments into aconfiguration lying on the ab plane together with the flop of thepolarization from the c direction (zero field) to the a direction(high field). To summarize, we show that the contribution fromthe Tb magnetic order to the electric polarization in TbMnO3
cannot be ignored.
ACKNOWLEDGMENTS
The authors are indebted to M. C. Sanchez for the orien-tation of the single crystals. Financial support from the Span-ish MINECO (Projects No. MAT2012-38213-C02-01 andNo. MAT2011-23791) and the Diputacion General de Aragon(CAMRADS) are acknowledged. We also acknowledge theuse of SAI from Universidad de Zaragoza and the BessyII synchrotron facility for beam time allocation and supportduring the experiments.
[1] Y. Tokura and S. Seki, Adv. Mater. (Weinheim, Ger.) 22, 1554(2010).
[2] Y. Tokura, Science 312, 1481 (2006).[3] M. Fiebig, J. Phys. D: Appl. Phys. 38, R123 (2005).[4] N. A. Hill, J. Phys. Chem. B 104, 6694 (2000).[5] D. Khomskii, Phys. 2, 20 (2009).[6] I. A. Sergienko and E. Dagotto, Phys. Rev. B 73, 094434 (2006).[7] R. Kajimoto, H. Yoshizawa, H. Shintani, T. Kimura, and
Y. Tokura, Phys. Rev. B 70, 012401 (2004).
[8] M. Kenzelmann, A. B. Harris, S. Jonas, C. Broholm, J. Schefer,S. B. Kim, C. L. Zhang, S.-W. Cheong, O. P. Vajk, and J. W.Lynn, Phys. Rev. Lett. 95, 087206 (2005).
[9] J. Voigt, J. Persson, J. W. Kim, G. Bihlmayer, and T. Bruckel,Phys. Rev. B 76, 104431 (2007).
[10] N. Aliouane, O. Prokhnenko, R. Feyerherm, M. Mostovoy,J. Strempfer, K. Habicht, K. C. Rule, E. Dudzik, A. U. B. Wolter,A. Maljuk, and D. N. Argyriou, J. Phys.: Condens. Matter 20,434215 (2008).
165111-7

V. CUARTERO et al. PHYSICAL REVIEW B 91, 165111 (2015)
[11] D. Mannix, D. F. McMorrow, R. A. Ewings, A. T. Boothroyd,D. Prabhakaran, Y. Joly, B. Janousova, C. Mazzoli, L.Paolasini, and S. B. Wilkins, Phys. Rev. B 76, 184420(2007).
[12] V. Cuartero, J. Garcıa, G. Subıas, J. Herrero-Martın, J. Blasco,and C. R. Natoli, J. Phys.: Conf. Ser. 430, 012101 (2013).
[13] O. Prokhnenko, R. Feyerherm, M. Mostovoy, N. Aliouane,E. Dudzik, A. U. B. Wolter, A. Maljuk, and D. N. Argyriou,Phys. Rev. Lett. 99, 177206 (2007).
[14] S. B. Wilkins, T. R. Forrest, T. A. W. Beale, S. R. Bland,H. C. Walker, D. Mannix, F. Yakhou, D. Prabhakaran, A. T.Boothroyd, J. P. Hill, P. D. Hatton, and D. F. McMorrow, Phys.Rev. Lett. 103, 207602 (2009).
[15] T. Kimura, T. Goto, H. Shintani, K. Ishizka, T. Arima, andY. Tokura, Nature (London) 426, 55 (2003).
[16] T. Kimura, G. Lawes, T. Goto, Y. Tokura, and A. P. Ramirez,Phys. Rev. B 71, 224425 (2005).
[17] V. Cuartero, J. Blasco, J. A. Rodrıguez-Velamazan, J. Garcıa,G. Subıas, C. Ritter, J. Stankiewicz, and L. Canadillas-Delgado,Phys. Rev. B 86, 104413 (2012).
[18] C.-C. Kao, C. T. Chen, E. D. Johnson, J. B. Hastings, H. J. Lin,G. H. Ho, G. Meigs, J.-M. Brot, S. L Hulbert, Y. U. Idzerda, andC. Vettier, Phys. Rev. B 50, 9599 (1994).
[19] J. Blasco, M. C. Sanchez, J. Garcıa, J. Stankiewicz, andJ. Herrero-Martın, J. Cryst. Growth 310, 3247 (2008).
[20] B. T. Thole, P. Carra, F. Sette, and G. van der Laan, Phys. Rev.Lett. 68, 1943 (1992).
[21] C. Bordel, S. Pizzini, J. Vogel, K. Mackay, J. Voiron, R. M.Galera, A. Fontaine, P. Auric, J. B. Goedkoop, and N. B.Brookes, Phys. Rev. B 56, 8149 (1997).
[22] S. Stepanow, J. Honolka, P. Gambardella, L. Vitali,N. Abdurakhmanova, T.-C. Tseng, S. Rauschenbach, S. L. Tait,V. Sessi, S. Klyatskaya, M. Ruben, and K. Kern, J. Am. Chem.Soc. 132, 11900 (2010).
[23] R. Biagi, J. Fernandez-Rodriguez, M. Gonidec, A. Mirone,V. Corradini, F. Moro, V. De Renzi, U. del Pennino, J. C. Cezar,D. B. Amabilino, and J. Veciana, Phys. Rev. B 82, 224406(2010).
[24] L. Troger, D. Arvanitis, K. Baberschke, H. Michaelis, U. Grimm,and E. Zschech, Phys. Rev. B 46, 3283 (1992).
[25] E. Stavitski and F. M. F. de Groot, Micron 41, 687 (2010).[26] P. H. Butler, Point Group Symmetry Applications (Plenum Press,
New York and London, 1981).[27] R. D. Cowan, The Theory of Atomic Structure and Spectra
(University of California Press, Berkeley, 1981), p. 365.[28] P. Carra, B. T. Thole, M. Altarelli, and X. Wang. Phys. Rev. Lett.
70, 694 (1993).[29] P. Carra, H. Konig, B. T. Thole, and M. Altarelli, Physica B 192,
182 (1993).[30] N. Abe, K. Taniguchi, S. Ohtani, T. Takenobu, Y. Iwasa, and
T. Arima, Phys. Rev. Lett. 99, 227206 (2007).[31] J. Mareschal, J. Sivardiere, G. F. De Vries, and E. F. Bertaut,
J. Appl. Phys. 39, 1364 (1968).[32] S. Quezel F. Techeou, J. Rossat-Mignod, G. Quezel, and
E. Roudaut, Physica B&C 86–88, 916 (1977).[33] J. B. Gruber K. L. Nash, R. M. Yow, D. K. Sardar, U. V. Valiev,
A. A. Uaokov, and G. W. Burdick, J. Lumin. 128, 1271 (2008).[34] L. Holmes, R. Sherwood, and L. G. Van Uitert, J. Appl. Phys.
39, 1373 (1968).[35] M. Sikora, C. Kapusta, D. Zaja, W. Tokarz, K. Attenkofer,
P. Fischer, E. Goering, and G. Schutz, J. Alloys Compd. 328,100 (2001).
[36] E. F. Bertaut, Acta Crystallogr., Sect. A: Cryst. Phys., Diffr.,Theor. Gen. Crystallogr. A 24, 217 (1968).
[37] M. Mochizuki and N. Furukawa, Phys. Rev. B 80, 134416(2009).
[38] H. J. Xiang, S.-H. Wei, M.-H. Whangbo, and J. L. F. Da Silva,Phys. Rev. Lett. 101, 037209 (2008).
165111-8


![Computation of magnetic circular dichroism by ...hanicka.uochb.cas.cz/~bour/pdf/141.pdf · Computation of Magnetic Circular Dichroism by Sum-Over-States Summations Petr Sˇteˇpanek[a,b]](https://static.fdocuments.in/doc/165x107/5f1f241d199f6d32ea57ebac/computation-of-magnetic-circular-dichroism-by-bourpdf141pdf-computation.jpg)