X-Ray Absorption Spectroscopy: A New Structural...
39
X-ray Absorption Spectroscopy: a New Structural Method and Its Applications to Bioinorganic Chemistry STEPHEN P . CRAMER Exxon Research and Engineering Cbmpany Linden. New Jersey KEITH 0 . HODGSON Department of Chemistry. Stan ford University. Stan ford. California CONTENTS 1 . lNTRODU(TT1ON . . . . . . . . . . . ..... 11 . EXPERIMENTALCONSIDERATIONS A . The Synchrotron Radiation X-ray Source . . . 1 . Broad Spectral Bandwidth 2 . High Intensity . . . . . . ...... 3 . Extremely High Collimation B . DataCollection Modes ......... 111 . THEORY .............. A . EXAFS ............. B . EdgeTheory ............ 1V . DATA ANALYSIS . . . . . . . . . . . A . Isolation of EXAFS from the Absorption Spectrum 1 . Choice of Eo .......... 2 . Normalization .......... 3 . Background Subtraction ....... B . Fourier Transform Analysis . . . . . . . C . Curve-Fitting Analysis ......... 1 . Phase Shifts and Distance lnformation . . . 2 . Amplitudes and Numbers of Scatterers . . . 3 . Scatterer Identification . . . . . . . . V . APPLlCATlONS TO BlOlNORGANIC CHEMISTRY . A . Rubredoxin . . . . . . . . . . . . B . Hemoglobin . . . . . . . . . . . . C . Cytochrome P-450 and Chloroperoxidase ... D . Azurin . . . . . . . . . . . . . E . Nitrogenase . . . . . . . . . . . . ....... 2 . . . . . . . 4 ....... 4 ....... 6 ....... 6 8 ....... 8 . . . . . . . 9 ....... 9 ....... 11 . . . . . . . 14 14 ....... 15 . . . . . . . 15 ....... 11 ....... 11 . . . . . . . 19 ....... 19 . . . . . . . 20 . . . . . . . 21 . . . . . . . 22 ....... 24 ....... 26 . . . . . . . 26 . . . . . . . 27 . . . . . . . 28 . . . . . . . Progvess in Inorganic Chemistry; Volume25 Edited by Stephen J. Lippard Copyright © 1979 by John Wiley & Sons, Inc.
Transcript of X-Ray Absorption Spectroscopy: A New Structural...
X-ray Absorption Spectroscopy: a New Structural Method and Its Applications to Bioinorganic Chemistry
STEPHEN P . CRAMER
Exxon Research and Engineering Cbmpany Linden. New Jersey
KEITH 0 . HODGSON
Department of Chemistry. Stan ford University. Stan ford. California
CONTENTS
1 . lNTRODU(TT1ON . . . . . . . . . . . . . . . . 11 . EXPERIMENTALCONSIDERATIONS
A . The Synchrotron Radiation X-ray Source . . . 1 . Broad Spectral Bandwidth 2 . High Intensity . . . . . .
. . . . . .
3 . Extremely High Collimation B . DataCollection Modes . . . . . . . . .
111 . THEORY . . . . . . . . . . . . . . A . EXAFS . . . . . . . . . . . . . B . EdgeTheory . . . . . . . . . . . .
1V . DATA ANALYSIS . . . . . . . . . . . A . Isolation of EXAFS from the Absorption Spectrum
1 . Choice of Eo . . . . . . . . . . 2 . Normalization . . . . . . . . . . 3 . Background Subtraction . . . . . . .
B . Fourier Transform Analysis . . . . . . . C . Curve-Fitting Analysis . . . . . . . . .
1 . Phase Shifts and Distance lnformation . . . 2 . Amplitudes and Numbers of Scatterers . . . 3 . Scatterer Identification . . . . . . . .
V . APPLlCATlONS TO BlOlNORGANIC CHEMISTRY . A . Rubredoxin . . . . . . . . . . . . B . Hemoglobin . . . . . . . . . . . . C . Cytochrome P-450 and Chloroperoxidase . . . D . Azurin . . . . . . . . . . . . . E . Nitrogenase . . . . . . . . . . . .
. . . . . . . 2
. . . . . . . 4
. . . . . . . 4
. . . . . . . 6
. . . . . . . 6 8
. . . . . . . 8
. . . . . . . 9
. . . . . . . 9
. . . . . . . 11
. . . . . . . 14 14
. . . . . . . 15
. . . . . . . 15
. . . . . . . 11
. . . . . . . 11
. . . . . . . 19
. . . . . . . 19
. . . . . . . 20
. . . . . . . 21
. . . . . . . 22
. . . . . . . 24
. . . . . . . 26
. . . . . . . 26
. . . . . . . 27
. . . . . . . 28
. . . . . . .
Progvess in Inorganic Chemistry; Volume 25 Edited by Stephen J. Lippard
Copyright © 1979 by John Wiley & Sons, Inc.

2
VI .
STEPHEN P. CRAMER AND KEITH 0. HODGSON
F. Other Metals in Biological Systems . . . . . . . . . . . . 1. Cytochrome Oxidase . . . . . . . . . . . . . . . 2. Hemocyanin. . . . . . . . . . . . . . . . . . 3. Carbonic Anhydrase . . . . . . . . . . . . . . . 4. Studies of the Binding of Platinum Complexes to DNA . . . . .
CONCLUSIONS AND THE FUTURE . . . . . . . . . . . . 1. Instrumentation . . . . . . . . . . . . . . . . . 2. New Directionsin X-ray Absorption Spectroscopy . . . . . . .
ACKNOWLEDGMENTS . . . . . . . . . . . . . . . . REFERENCES . . . . . . . . . . . . . . . . . . .
31 31 31 32 32 32 33 36 31 38
I. INTRODUCTION
X-ray absorption spectroscopy is a relatively old experimental technique that has been revitalized by technological and theoretical progress during the past several years. The development of a powerful synchrotron radiation source at the Stanford Synchrotron Radiation Laboratory (SSRL) (29) has provided experimenters with x-ray fluxes several orders of magnitude higher than those previously obtainable from conventional x-ray tubes. Furthermore, theoretical understanding of the extended x-ray absorption fme structure (EXAFS) has advanced to the point where reliable structural information can now be extrac- ted from x-ray absorption spectra. The combined effect of these developments has made feasible both the collection and interpretation of data on dilute systems such as metalloproteins. In its applications to bioinorganic chemistry, as well as amorphous materials, catalysts, and surfaces, x-ray absorption spectroscopy has already provided structural information that was inaccessible by conventional methods.
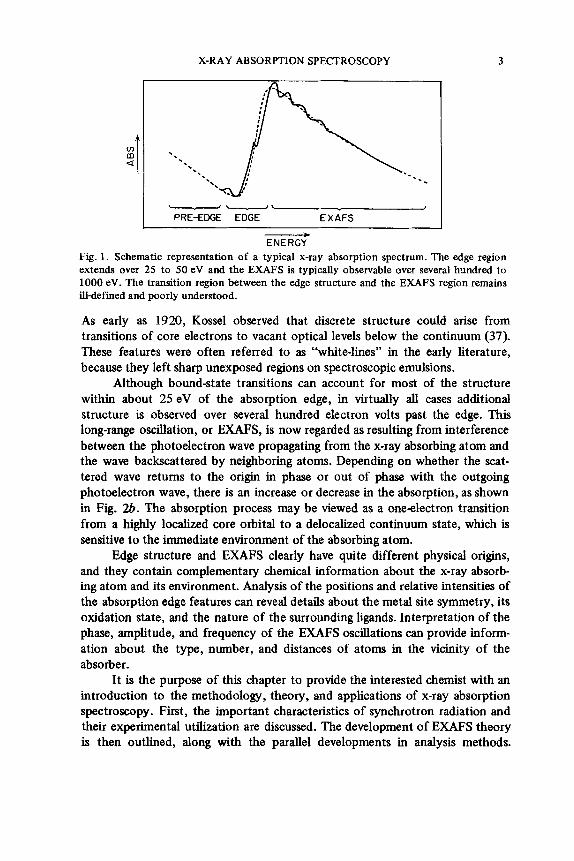
A typical x-ray absorption spectrum (Fig. 1) exhibits decreasing absorp- tion as the photon energy is increased. Superimposed on this smooth back- ground is a sequence of steeply rising discontinuities in the absorption at energies characteristic of each element in the sample. This phenomenon of absorption jumps or “edges” has been known since the work of DeBroglie (59), who first observed the Ag and Br K edges due to AgBr in his photographic emulsions while recording x-ray emission spectra. These abrupt increases in absorption occur whenever the incident photon has just sufficient energy to promote a core electron to unoccupied valence levels or to the continuum. The edges are labeled according to the core electron being promoted; the K edge arises from 1s excitation, L edges arise from 2s or 2p excitation, and so on.
Soon after the discovery of absorption edges, it was observed that the absorption trend both near the edge and beyond it is not smoothly varying; rather, there exists a wealth of fine structure characteristic of the chemical environment of the x-ray absorbing atom. As shown in Figs. 1 and 2a, the structure at energies close to the absorption edge typically consists of a series of approximately Lorentzian lines superimposed on a steeply rising absorption step.
X-RAY ABSORPTION SPECTROSCOPY 3
--\ I
PRE-EDGE EDGE EXAFS - ENERGY
Fig. 1 . Schematic representation of a typical x-ray absorption spectrum. The edge region extends over 25 to 50 eV and the EXAFS is typically observable over several hundred to 1000 eV. The transition region between the edge structure and the EXAFS region remains ill-defined and poorly understood.
As early as 1920, Kossel observed that discrete structure could arise from transitions of core electrons to vacant optical levels below the continuum (37). These features were often referred to as “white-lines’’ in the early literature, because they left sharp unexposed regions on spectroscopic emulsions.
Although bound-state transitions can account for most of the structure within about 25 eV of the absorption edge, in virtually all cases additional structure is observed over several hundred electron volts past the edge. This long-range oscillation, or EXAFS, is now regarded as resulting from interference between the photoelectron wave propagating from the x-ray absorbing atom and the wave backscattered by neighboring atoms. Depending on whether the scat- tered wave returns to the origin in phase or out of phase with the outgoing photoelectron wave, there is an increase or decrease in the absorption, as shown in Fig. 2b. The absorption process may be viewed as a oneelectron transition from a highly localized core orbital to a delocalized continuum state, which is sensitive to the immediate environment of the absorbing atom.
Edge structure and EXAFS clearly have quite different physical origins, and they contain complementary chemical information about the x-ray absorb- ing atom and its environment. Analysis of the positions and relative intensities of the absorption edge features can reveal details about the metal site symmetry, its oxidation state, and the nature of the surrounding ligands. Interpretation of the phase, amplitude, and frequency of the EXAFS oscillations can provide inform- ation about the type, number, and distances of atoms in the vicinity of the absorber.
It is the purpose of this chapter to provide the interested chemist with an introduction to the methodology, theory, and applications of x-ray absorption spectroscopy. First, the important characteristics of synchrotron radiation and their experimental utilization are discussed. The development of EXAFS theory is then outlined, along with the parallel developments in analysis methods.

4 STEPHEN P. CRAMER AND KEITH 0. HODGSON
E-
E -
Continuum 3 d 4 s 4 p 5 p
N ’ N N N (b) Xelectron
Fig. 2. (a) A generalized x-ray absorption edge illustrating how bound-state transitions determine the observed structure. The relative energies and intensities vary substantially with the specific case at hand. (b) The mechanism leading to EXAFS for an iron porphyrin fust shell. The circles denote the photoelectron wave ejected from the iron atom in a porphyrin ring and backscattered from the neighboring nitrogens. On the left, the amplitudes of the outgoing and back- scattered waves add at the iron site, leading to a maximum in the x-ray absorption probability. On the right, the x-ray energy has been decreased, leading to a longer photo- electron wavelength helectron for which the outgoing and backscattered waves interfere destructively at the iron site, with a resulting minimum in the absorption.
Finally, selected applications illustrating the power of this new methodology within the field of bioinorganic chemistry are presented.
11. EXPERIMENTAL CONSIDERATIONS
A. The Synchrotron Radiation X-ray Source
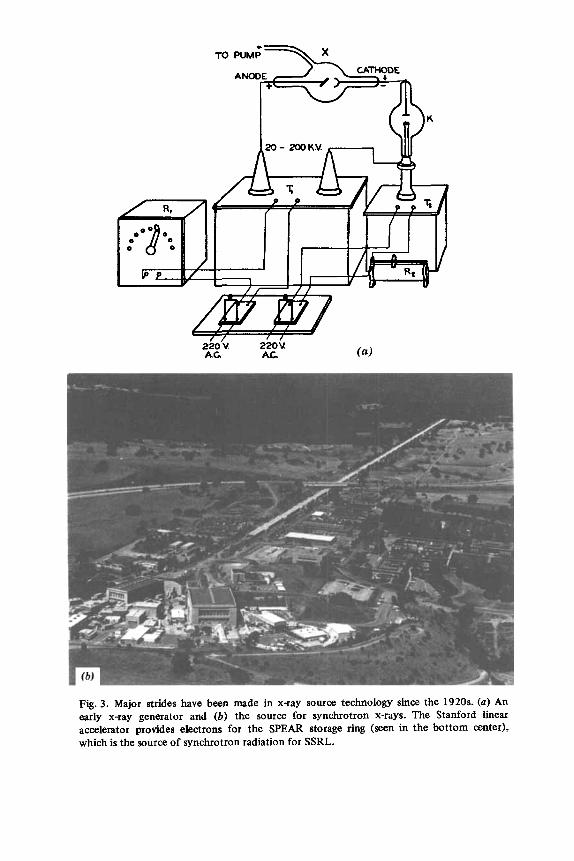
Just as Raman spectroscopy was revitalized and expanded by the advent of the laser, the development of a high-intensity broad-band synchrotron radiation source at SSRL has greatly enhanced the power and scope of x-ray absorption spectroscopy. As shown in Fig. 3, the technology of x-ray production has taken
2mv. 220u AG A I l
Fig. 3. Major strides have been made in x-ray source technology since the 1920s. (a) An early x-ray generator and (b) the source for synchrotron x-rays. The Stanford linear accelerator provides electrons for the SPEAR storage ring (seen in the bottom center), which is the source of synchrotron radiation for SSRL.
6 STEPHEN P. CRAMER AND KEITH 0. HODGSON
great strides since the pioneering days of Compton and Allison. The synchrotron radiation used at SSRL emanates from an electron-positron storage ring (SPEAR) that was developed for high-energy physics experiments in which the counter-rotating beams of electrons and positrons are collided to produce new particles. While the stored electrons or positrons travel around the ring at relativistic speeds, they emit profuse quantities of radiation. The production and properties of this synchrotron radiation have been extensively reviewed (4,29), and thus here we briefly consider only those properties of the radiation that make it valuable for x-ray absorption spectroscopy.
1. Broad Spectral Bandwidth
As shown in Fig. 4, the synchrotron radiation spectrum is a smooth featureless continuum without the emission lines associated with a conventional x-ray tube. The spectrum is characterized by a single parameter, E, , which is given by 2.2E,/R, where E, is the stored electron energy in GeV and R is the bending radius of the machine in meters. Depending on the requirements of the experiment at hand, useful flux is generally available out to about four to five times the critical energy. The broad spectrum means that the absorption edges of numerous elements can be reached with the synchrotron source.
The maximum photon energy obtainable is generally limited by the energies of the stored electrons and the radius of curvature of the magnets used to bend them. At SSRL, the highest electron energies available are around 3.7 GeV, with 10 to 30 mA of current during colliding-beam operation. Currents as high as 300 mA are possible with a single beam of electrons. The lowenergy limit is imposed by the transmission curve of the beryllium window and other carbon foils in the beam transport system.
The combined effect of the source spectrum and the beam-line trans- mission curves is to create a spectroscopic window from roughly 3 to 30 keV for the present x-ray experiments at SSRL. This results in accessibility of K edges from roughly chlorine to silver. The L edges of the elements from molybdenum through the actinides also fall within this energy window. Obviously, when the machine is run at lower electron energies, the higher Z elements are not accessible. Unfortunately, the latter situation has been the case quite often at SSRL, since a wealth of interesting high-energy physics was discovered at electron-beam energies around 2.0 GeV or below.
2. High Intensity
Away from characteristic elemental emission lines, SSRL has three to four orders of magnitude more flux available than is obtainable from bremsstrahlung from the best conventional x-ray sources. Conventional x-ray generators produce fluxes on the order of 1.5 x lo3 photons sec-' in a 1 eV bandwidth at the
X-RAY ABSORPTION SPECTROSCOPY 7
PHOTON ENERGY ( K e V )
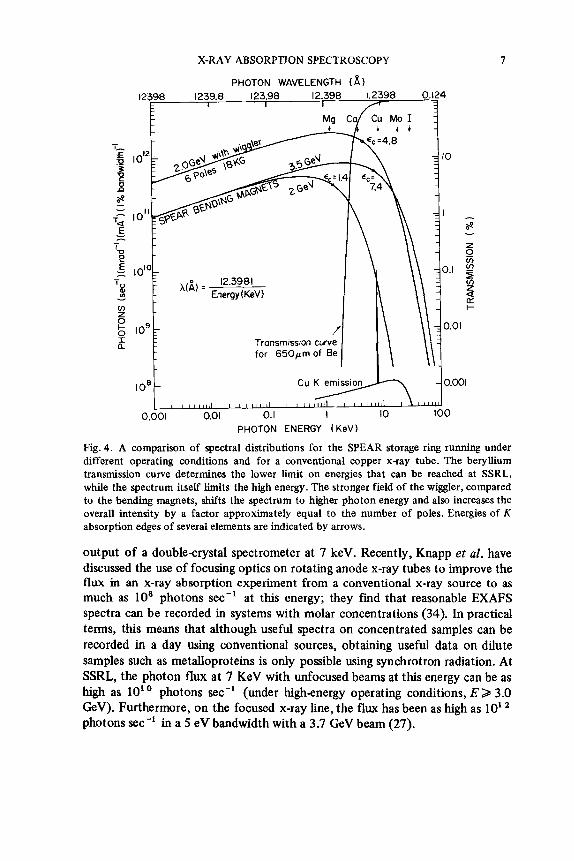
Fig. 4. A comparison of spectral distributions for the SPEAR storage ring running under different operating conditions and for a conventional copper x-ray tube. The beryllium transmission curve determines the lower limit on energies that can be reached at SSRL, while the spectrum itself limits the high energy. The stronger field of the wiggIer, compared to the bending magnets, shifts the spectrum to higher photon energy and also increases the overall intensity by a factor approximately equal to the number of poles. Energies of K absorption edges of several elements are indicated by arrows.
output of a double-crystal spectrometer at 7 keV. Recently, Knapp et al. have discussed the use of focusing optics on rotating anode x-ray tubes to improve the flux in an x-ray absorption experiment from a conventional x-ray source to as much as 10' photons sec-' at this energy; they find that reasonable EXAFS spectra can be recorded in systems with molar concentrations (34). In practical terms, this means that although useful spectra on concentrated samples can be recorded in a day using conventional sources, obtaining useful data on dilute samples such as metalloproteins is only possible using synchrotron radiation. At SSRL, the photon flux at 7 KeV with unfocused beams at this energy can be as high as 10' photons sec-' (under highenergy operating conditions, E 2 3.0 GeV). Furthermore, on the focused x-ray line, the flux has been as high as 10' photons sec-' in a 5 eV bandwidth with a 3.7 GeV beam (27).

8 STEPHEN P. CRAMER AND KEITH 0. HODGSON
3. Extremely High Collimation
Synchrotron radiation is sharply folded forward by relativistic effects into a narrow cone that sweeps around the orbit as the electrons circulate. The vertical angle of emission is given approximately by mc'/Ee (me' is the rest mass energy of the electron). At 2.5 GeV, for example, the opening angle is only 2 x radians. This results in a vertical beam height of about 2 mm at a distance 20m from the source. The net result is that with a flat channel cut crystal monochromator a resolution of 1 to 2 eV is possible at 8.8 keV. This degree of resolution is exceptionally useful for studying absorption edge struc- ture. Other unique properties of synchrotron radiation, such as the pulsed-time structure and high degree of polarization, have less direct impact on the x-ray absorption experiments but offer advantages for other types of spectroscopy.
B. Data-Collection Modes
The basic quantity to be determined in absorption spectroscopy is normally the absorption coefficient p as a function of photon energy E. The absorption coefficient is defined through I =Zoe-cc*, where Zo is the incident flux, I is the transmitted flux, and t is the sample thickness. Since in most cases to date the interesting information has either been the modulation of p or the energy position of various absorption bands, the absolute magnitude of p is rarely measured. What is typically recorded in an x-ray absorption experiment is thus a relative absorbance A', which is relative to the true absorbance A = log Zo/Z. The absorbance measured is usually a relative one, because it is superimposed upon the energydependent baseline of the spectrometer.
In a straightforward absorption experiment (see Fig. 5 ) ionization detect-
SIDE VIEW
I
e- BEAM IN SPEAR
I CHANNELCUT
I0 MONOCHROMATOR CRYSTAL
. . . . . . . . . . TOP VIEW
IF Fig. 5 . Schematic representation of the x-ray absorption data collection system at SSRL. The I , and Z ion chambers provide the standard transmission mode of data collection, while the fluorescence detectors, If, are used in the fluorescence mode. In practice., the output wavelength of the monochromator, sample position, and data acquisition are all controlled by a computer.
X-RAY ABSORPTION SPECTROSCOPY 9
ors are mounted in front of and behind the sample, and the relative absorbance is obtained by taking the log of the ratio of the currents in each detector. Since in the x-ray region virtually all cell windows, solvents, and other elements present in the sample absorb to some extent, the absorbance of the particular element of interest is superimposed on both the spectrometer baseline and the background absorption by all other elements in the path.
An alternative means for obtaining relative values for y is to measure the fluorescence intensity Ip As shown by Jaklevic el al. (32), for thin concentrated samples or thick dilute samples, a fluorescence excitation spectrum, ( I f / Io) versus E, is equivalent to a measurement of y versus E. For dilute systems such as metalloproteins, the fluorescence detection method possesses a distinct signal-to- noise advantage over conventional absorption measurements (32,56). A final elegant method for determining the x-ray absorption is to monitor the Auger electron intensity as a function of photon energy. This technique promises to be particularly useful for EXAFS Studies of adsorbed surface atoms (39).
111. THEORY
A. EXAFS
The quantity known as EXAFS, denoted here by x, is simply the relative modulation of the absorption coefficient y of a particular atom compared to the smooth background absorption coefficient ys, normalized by the absorption coefficient yo that would be observed for the free atom. Thus, as defined in Ref. 61,
- P - P s x=- Pa
Since ys r yo, the EXAFS may alternatively be defined by x = (p - yo)/yo or 02 - ps)/ps. Although early work usually considered the total absorption coef- ficient y as a function of photon energy E, or the modulation x versus E, it is now conventional to plot x versus the photoelectron wave vector k = [(2rn/R2 XE - EO)] ’ 12 , where Ea is the threshold energy for liberation of a photoelectron wave.
The older theoretical work in x-ray absorption spectroscopy has been reviewed by Azaroff and Pease (2,3). One of the earliest theories that attempted to explain the extended fine structure was that of de L. Kronig (17, 18). He proposed that the EXAFS is a density of states effect, caused by the existence of alternatively allowed and forbidden energy bands for propagation of the photo- electron wave through the crystal lattice. This and other similar theories that assume it is the band structure of a crystalline array that causes the EXAFS have been labeled “long-range-order” theories (2,3).
The bulk of theoretical progress in the understanding of EXAFS has come
10 STEPHEN P. CRAMER AND KEITH 0. HODGSON
from a quite different interpretation - that EXAFS results from interference between the outgoing photoelectron wave from the absorbing atom and the backscattered waves from surrounding atoms. Such theories were also developed by Kronig to account for the existence of fine structure in the case of isolated molecules such as C12 (19), and these “short-range-order” theories have evolved through early modifications by Peterson (47), Kostarev (38), Shiraiwa ef d. (54), and Kozlenkov (36). More recent work by Sayers ef al. (5 l), Stem (61), Ashley and Doniach (l), and Lee and Pendry (41) has developed EXAFS theory to the point where the basic physics is no longer in question; rather, attention is focused on developing and elaborating the means needed to calculate the effects.
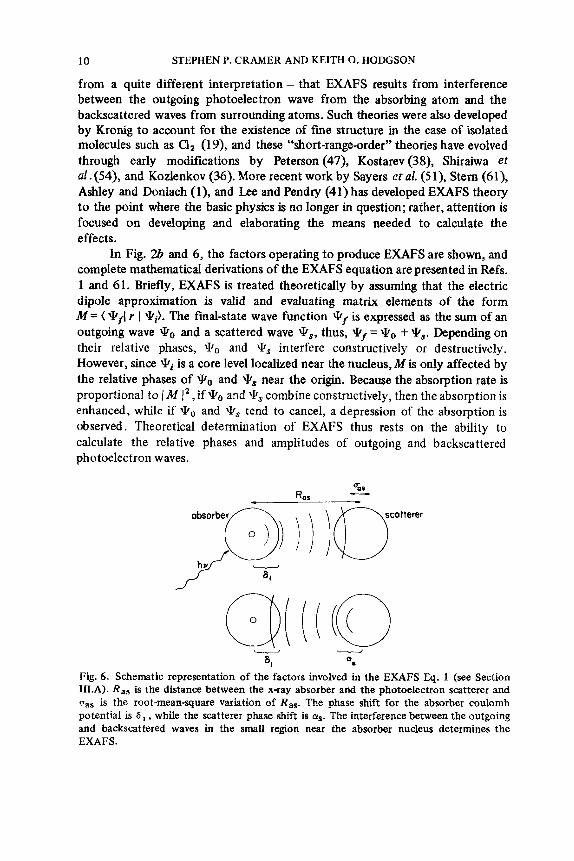
In Fig. 2b and 6, the factors operating to produce EXAFS are shown, and complete mathematical derivations of the EXAFS equation are presented in Refs. 1 and 61. Briefly, EXAFS is treated theoretically by assuming that the electric dipole approximation is valid and evaluating matrix elements of the form M = ( qf( r 1 qi). The final-state wave function qf is expressed as the sum of an outgoing wave \ko and a scattered wave q,, thus, ‘kf = Qo t q,. Depending on their relative phases, 90 and qS interfere constructively or destructively. However, since qi is a core level localized near the nucleus, M is only affected by the relative phases of \ko and qs near the origin. Because the absorption rate is proportional to I M 12, if 90 and 9, combine constructively, then the absorption is enhanced, while if q0 and 9, tend to cancel, a depression of‘ the absorption is observed. Theoretical determination of EXAFS thus rests on the ability to calculate the relative phases and amplitudes of‘ outgoing and backscattered photoelectron waves.
- - 8, Q.
Fig. 6. Schematic representation of the factors involved in the EXAFS Eq. 1 (see Section 1II.A). Ras is the distance between the x-ray absorber and the photoelectron scatterer and uas is the root-meanquare variation of Ras. The phase shift for the absorber coulomb potential is 6, , while the scatterer phase shift is as. The interference between the outgoing and backscattered waves in the small region near the absorber nucleus determines the EXAFS.

X-RAY ABSORPTION SPECTROSCOPY 11
The factors governing these relative phases (see Fig. 6) may be explained as follows. If it is assumed that the outgoing photoelectron wave can be approx- imated as a plane wave, then as it propagates from the absorber to the scatterer and back, it undergoes phase shifts 6 for leaving the absorber, as for reflection from the scatterer, and S again for reentering the potential of the absorber. The phase also changes by 2kR,, because of the distance traveled. Thus the EXAFS oscillates as sin [2kR,, + 26 1 (k) + a,(k)] . The absorber and scatterer phase shifts are often combined to form a total phase shift
The amplitude of the oscillations is inversely related to the square of the distance R,, between the absorber and scatterer, and is directly proportional to the electron backscattering amplitude of the scatterer I f(n, k) I and the number of equivalent scatterers Ns. Finally, if the mean-square variation of R,, is u,,, then the EXAFS is damped by a Debye-Waller-like factor exp(-2u~Jc2). The final expression relating all these quantities is
sin [2kR,, t a,,(k)] (1)
The summation is over all atoms in the vicinity of the absorber. For atoms beyond the first coordination sphere the phase shifts and amplitudes may be modified because of alteration of the photoelectron wave by both elastic and inelastic scattering off intervening atoms (1 5) . It should be noted that the derivation of this expression (1,61) involves a number of approximations that break down at low k values, that is, close to the absorption edge. Therefore, most EXAFS analyses only use the data for k 7 4 A-'.
Thus, in principle, structural information can be obtained about the environment of an x-ray absorber from EXAFS. Each shell of equivalent neighbors gives rise to its own modulation (a damped sine wave). The overall magnitude of the wave is proportional to the number of scatterers in the shell, whde the shape of the envelope is characteristic of the atomic number of the scatterer and the relative motion of' the absorber and the scatterer. The frequency of the wave is determined primarily by the distance between the absorber and the scatterer, while the absolute phase is determined by the absorber and scatterer phase shifts. The various experimental approaches for extracting this structural information from the EXAFS data are elaborated in more detail in Section IV.
B. Edge Theory
In contrast to the oscillatory patterns of EXAFS, edge structure often consists of discrete absorption bands superimposed on the steeply rising con- tinuum absorption. Edge structure is caused by transitions of core electrons to

12 STEPHEN P. CRAMER AND KEITH 0. HODGSON
discrete bound valence levels. The major problems in edge analysis are therefore the assignment of the observed transitions and the interpretation of the tran- sition energies and intensities. The bulk of x-ray absorption edge studies prior to synchrotron radiation studies have been reviewed (60). In contrast to the case of EXAFS, little truly new theoretical work has as yet developed as a result of the synchrotron radiation data.
For K absorption edges, the edge assignments are simplified by the angular momentum selection rule, which results in only l s+np transitions being for- mally “allowed.” This permitted Parratt as early as 1939 to interpret the K absorption edge of argon as the sum of 1s + 4p, 1s + 5 p , . . . , 1s + np tran- sitions superimposed on an arctangent-like continuum absorption (46).
For most transition metal complexes, transitions to states of primarily s or d character are also observed, because of mixing with p character by various mechanisms. Thus, for reasonably ionic complexes, the transition metal K edges may be characterized by a weak Is+& transition, followed by a moderate 1s --* (n + 1)s transition and a very strong 1s -+ (n + 1)p band. Using atomic spectroscopic tables, Shulman et al. assigned these features in a series of‘ transition metal complexes (58).
For highly covalent complexes, a simple analysis in terms of metal s, p, and d orbitals is no longer valid, and a molecular orbital approach must be
I I I I I I I
20000 20020 20040 ENERGY (eV)
Fig. 7. Absorption edge of [Mo,O, ] 6- showing deconvolution of the edge features by curve fitting with three Lorentzians and an arctangent function.
X-RAY ABSORPTION SPECTROSCOPY 13
adopted(24). Any vacant molecular orbital with a significant amount of p character may contribute to the absorption edge features, and extremely comp- licated edge shapes may result. Characteristic edges are observed for tetrahedral complexes, n-acceptor complexes, complexes with metal-ligand double- bonding, and so on (1 1). By fitting the absorption edge with several Lorentzians and an arctangent function, the positions and intensities of edge features may be quantitated. This procedure is illustrated for the molybdenum K absorption edge of [Mo,024] 6- (Fig. 7). In this case the edge structure is adequately described by the superposition of three Lorentzians with the arctangent step. Efforts to correlate these edge features with calculated excited states are in progress.
Apart from assignments of the observed transitions, interpretation of the shifts in position of these features is also important. The general trend is for absorption edge features to move to higher energies as the absorbing atom becomes more positively charged (60). Various authors have explained edge shifts as changes in the binding energy of core electrons, analogous to the effects seen in photoelectron spectroscopy. However, x-ray absorption shifts for molyb- denum compounds can be as much as 10 eV (1 l), while X P S measurements for the same compounds show shifts an order of magnitude smaller (25). Thus, it is more l ie ly that the observed edge shifts correspond primarily to shifts in the
HEMOCYANIN X-RAY ABSORPTION EDGES
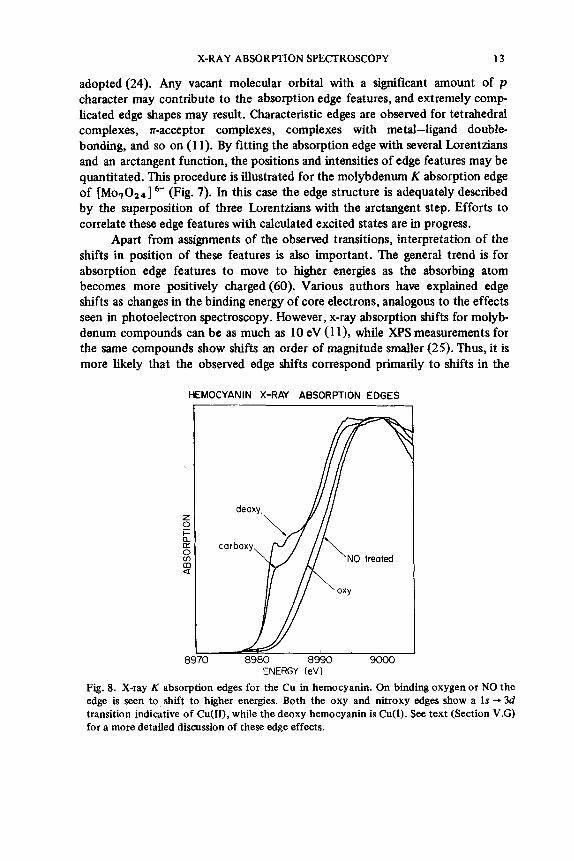
Fig. 8. X-ray K absorption edges for the Cu in hemocyanin. On binding oxygen or NO the edge is seen to shift to higher energies. Both the oxy and nitroxy edges show a 1s + 3d transition indicative of Cu(II), while the deoxy hemocyanin is Cu(1). See text (Section V.G) for a more detailed discussion of these edge effects.

14 STEPHEN P. CRAMER AND KEITH 0. HODGSON
excited state levels rather than to changes in core electron binding energies. The changes in edge shape and position observed upon oxygenation of hemocyanin are shown in Fig. 8. (The implications of these effects are discussed in more detail in Section V.C.)
IV. DATA ANALYSIS
The earliest attempts at the analysis of EXAFS were limited to labeling and compiling the positions of various absorption maxima and minima in photometric traces of the transmission absorption spectrum. An example of such a trace is shown in Fig. 9. In light of the current theory of the EXAFS
G E C A Fig.9. An early x-ray absorption spectrum of copper foil. The spectrum was recorded photographically and then scanned with a densitometer. Wavelength increases to the right and transmission increases vertically, thus resulting in inversion of the spectrum relative to those obtained in modern practice.
phenomenon, considerably more sophisticated data analysis is required, and computer-controlled data collection and manipulation are necessary. A mental readjustment is also required when interpreting EXAFS spectra. Instead of concentrating on peak positions and intensities, one must think in terms of sums of sine waves.
A. Isolation of EXAFS from the Absorption Spectrum
Unlike many other kinds of spectra, the extended fine structure is not unambiguously determined from the absorption spectrum. The quantity desired is x(k) versus k, where x(k) = (p - ps)/po and k= [(2m/h2 )(E --&)I I?. Thus, to define ~ ( k ) ambiguities must be overcome in defining (1) E o , the energy origin
X-RAY ABSORPTION SPECTROSCOPY 15
at which k = 0, (2) p, the absorption coefficient due to the atom and edge of interest, and (3) ps, the “smooth” part of p. The isolated atom absorption po can either be approximated by ps or obtained from tabulated functions. Act- ually, it is pt that is experimentally determined, but as seen from the expression for ~ ( k ) , all the thickness factors cancel out.
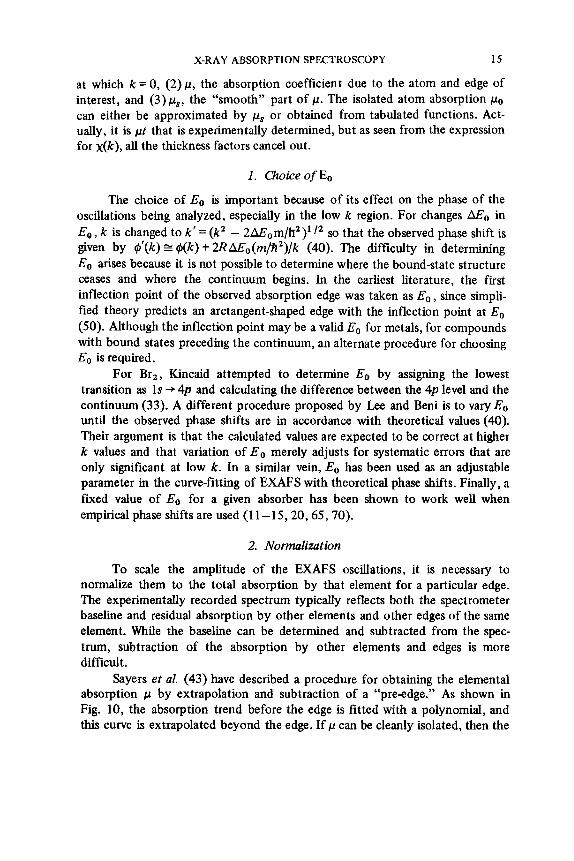
1. Choiceof Eo
The choice of Eo is important because of its effect on the phase of the oscillations being analyzed, especially in the low k region. For changes A E o in E o , k is changed to k’ = (k2 - 2aEOm/h2)’I2 so that the observed phase shift is given by @‘(k) 2 ~ k ) + 2RAE0(mp2)/k (40). The difficulty in determining Eo arises because it is not possible to determine where the bound-state structure ceases and where the continuum begins. In the earliest literature, the first inflection point of the observed absorption edge was taken as Eo , since simpli- fied theory predicts an arctangent-shaped edge with the inflection point at E, (50). Although the inflection point may be a valid Eo for metals, for compounds with bound states preceding the continuum, an alternate procedure for choosing Eo is required.
For Br2, Kincaid attempted to determine Eo by assigning the lowest transition as 1s + 4p and calculating the difference between the 4p level and the continuum (33). A different procedure proposed by Lee and Beni is to vary Eo until the observed phase shifts are in accordance with theoretical values (40). Their argument is that the calculated values are expected to be correct at higher k values and that variation of E o merely adjusts for systematic errors that are only significant at low k. In a similar vein, Eo has been used as an adjustable parameter in the curve-fitting of EXAFS with theoretical phase shifts. Finally, a fmed value of Eo for a given absorber has been shown to work well when empirical phase shifts are used (1 1-15,20,65,70).
2. Normalization
To scale the amplitude of the EXAFS oscillations, it is necessary to normalize them to the total absorption by that element for a particular edge. The experimentally recorded spectrum typically reflects both the spectrometer baseline and residual absorption by other elements and other edges of the same element. While the baseline can be determined and subtracted from the spec- trum, subtraction of the absorption by other elements and edges is more difficult.
Sayers et al. (43) have described a procedure for obtaining the elemental absorption p by extrapolation and subtraction of a “pre-edge.” As shown in Fig. 10, the absorption trend before the edge is fitted with a polynomial, and this curve is extrapolated beyond the edge. If p can be cleanly isolated, then the

16 STEPHEN P. CRAMER AND KEITH 0. HODGSON
Fig. 10. This means for extracting and normalizing the EXAFS, shown using the iron Kedge spectrum of ferrocene as an example. Once the iron component of the absorption has been isolated (left), the amplitude of the oscillations may be normalized using x = Ap/ ps. If p cannot be cleanly isolated over the whole spectrum, measurement of p near the edge is sufficient, since the falloff of pLo with energy is known. These effects are discussed in more detail in Section 1V.A.
observed modulation A p can be normalized with respect to p,, as shown in Fig. 10.
In many cases, especially with dilute samples, this extrapolation procedure works only over a narrow energy range, after which the extrapolated value of &,a& bends off steeply. However, since the energy dependence of p,, can be obtained from tabulated data, it is only necessary to obtain a background subtracted value for p at a single point. Thus, if p can be extracted in the region close to the absorption edge, say at E', then the cubic spline procedure described below can be used to fit the total absorption kot. 'Ihe observed modulation Xobs [which is ptot -pSpline] can then be normalized by dividing by p(E') and amplifying the higher energy values by the tabulated energy dependence of P O :
It should be noted that for most transition metal absorption spectra, the energy dependence of po is rather slight on the range of data with observable
X-RAY ABSORPTION SPECTROSCOPY 17
EXAFS. For the iron K edge, fi falls to about 85% of its original value about 500 eV beyond the edge, and the resulting 15% correction has a relatively minor effect on the EXAFS.
3. Background Subtraction
Subtraction of 1.1~ from 1.1, commonly termed “background subtraction,” is conveniently done by means of a cubic spline routine (20). In this procedure, the absorption spectrum above the edge is divided into several regions, each of which is fit with a third-order polynomial, normally with a weighting scheme to account for the smaller EXAFS at higher energies. The individual polynomials are constrained to meet with equal slopes at the spline points, and combine to produce an overall curve for 1.1,. Subtracting 1.1, from 1.1 and then dividing by p, yields the EXAFS, as shown in Fig. 10. In some cases improved background subtraction can be obtained by removing the low-frequency components of Ap/p, through Fourier fiitering (43).
The choice of the proper functional form for background subtraction is perhaps one of the more difficult and arbitrary steps in processing of the EXAFS data. The Fourier transform of a data set from which background has not been properly subtracted generally shows a very large peak below R of 1 A. The spline routine has proven thus far to be the most useful way of removing background and eliminating these low R features. However, if the compound contains short absorber-scatterer bonds, and if a spline with several regions is chosen, then it is possible to actually fit the low-frequency EXAFS itself. In practice, experience with data for materials of known structure leads to the best method for background subtraction.
B. Fourier Transform Analysis
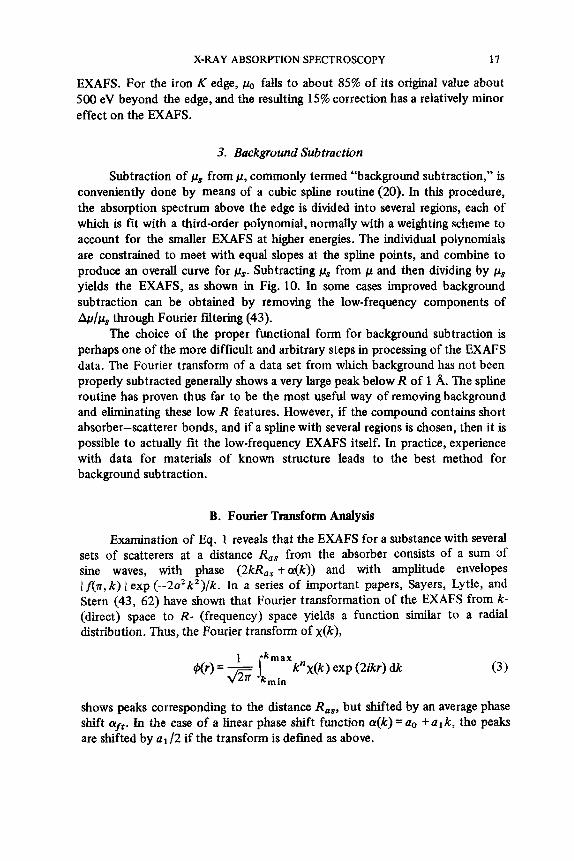
Examination of E q . 1 reveals that the EXAFS for a substance with several sets of scatterers at a distance R,, from the absorber consists of a sum 3f sine waves, with phase (2kR,, +a(k) ) and with amplitude envelopes I f(v, k) I exp (--2a2k2)/k. In a series of important papers, Sayers, Lytle, and Stern (43, 62) have shown that Fourier transformation of the EXAFS from k- (direct) space to R- (frequency) space yields a function similar to a radial distribution. Thus, the Fourier transform of ~(k),
1 Nr) = - r r n a x k ” X ( k ) exp (2ikr) dk fi kmin
(3)
shows peaks corresponding to the distance R,,, but shifted by an average phase shift aft. In the case of a linear phase shift function a(k) = a. +a1 k, the peaks are shifted by a l / 2 if the transform is defined as above.
18 STEPHEN P. CRAMER AND KEITH 0. HODGSON
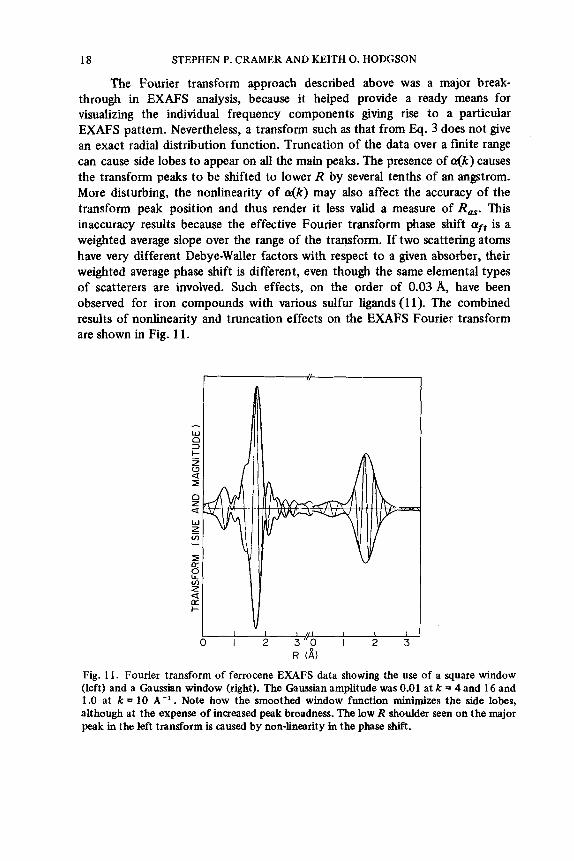
The Fourier transform approach described above was a major break- through in EXAFS analysis, because it helped provide a ready means for visualizing the individual frequency components giving rise to a particular EXAFS pattern. Nevertheless, a transform such as that from Eq. 3 does not give an exact radial distribution function. Truncation of the data over a finite range can cause side lobes to appear on all the main peaks. The presence of .(k) causes the transform peaks to be shifted to lower R by several tenths of an angstrom. More disturbing, the nonlinearity of &(k) may also affect the accuracy of the transform peak position and thus render it less valid a measure of RaS. This inaccuracy results because the effective Fourier transform phase shift aft is a weighted average slope over the range of the transform. If two scattering atoms have very different Debye-Waller factors with respect to a given absorber, their weighted average phase shift is different, even though the same elemental types of scatterers are involved. Such effects, on the order of 0.03 A, have been observed for iron compounds with various sulfur ligands (1 1). The combined results of nonlinearity and truncation effects on the EXAFS Fourier transform are shown in Fig. 11.
w n 3 t 2 W a I n z a w z cn
I c
cn z (L fi
-
e a
I I 1 I ,I I I I I
0 I 2 3 " o I 2 3 R (a)
Fig. 1 1 . Fourier transform of ferrocene EXAFS data showing the use of a square window (left) and a Gaussian window (right). The Gaussian amplitude was 0.01 at k = 4 and 16 and 1.0 at k = 10 A-' . Note how the smoothed window function minimizes the side lobes, although at the expense of increased peak broadness. The low R shoulder seen on the major peak in the left transform is caused by non-linearity in the phase shift.

X-RAY ABSORPTION SPECTROSCOPY 19
Lee and Beni have proposed alleviating the distortions caused by phase- shift nonlinearities by theoretically calculating the phase shifts and including them in the Fourier transform (40). When this is done, the imaginary component of the transform peaks symmetrically at the true absorber-scatterer distances. Although this procedure worked well for structures with scatterers of a single type, it remains to be seen if such procedures will be useful for complicated molecules with several different types of scatterers.
As a means for minimizing the truncation-induced ripple in EXAFS Fourier transforms, several groups have proposed the use of various types of %window” functions. Hayes et al. used a square window with Gaussian edges to moderate the truncation ripple in germanium EXAFS data (28). However, the price paid for removing side lobes is broader peaks, and the merits of various windows depend on the particular structural problem at hand.
C. Cum-Fitting Analysis
The essence of EXAFS curve-fitting analysis is to propose a parameterized function that will model the observed EXAFS, and then to adjust the structure- dependent parameters in this theoretical EXAFS expression until the fit with the experimentally observed EXAFS is optimized. The frnal values of the optimized parameters should then yield structural information about the compound under study.
1. Phase Shifts and Distance Injomtion
To obtain distances from EXAFS data it is necessary to know the phase shift a@). For a given pair of atoms these phase shifts can be obtained empirically from fits to data on compounds of known structure, or they may be derived by theoretical calculations.
Empirical methods for obtaining phase shifts involve fitting the oscillatory part of the EXAFS of a known structure with sin[2kR + a@)]. Typically, Nk) is parameterized as a quadratic function a. + a l k + a2k2 , and each of these parameters is optimized in fitting the EXAFS of a structure with known R. The phase shift parameters are then fixed, and the EXAFS of an unknown structure is fitted by varying R. In a large number of cases this procedure has been shown to yield distances with an accuracy better than 0.03 A.
In many cases, suitable model compounds are not available for obtaining phase shifts by the above procedure. Greater flexibility can be obtained using the fact that the total phase shift 4 k ) may be theoretically divided into an absorber contribution rw,(k) and a scatterer contribution a&), that is, (yaS = ar, +or, - n, where the extra n is added as a convention to make the amplitude function positive (42). Empirically, a, and a, cannot be obtained separately, but it is possible to obtain relationships between various absorber-

20 STEPHEN P. CRAMER AND KEITH 0. HODGSON
scatterer pairs. (In this notation, the x-ray absorber is written first and the photoelectron scatterer is written second.) Thus, if compounds containing pairs x-z, u-z, and u-y are obtained, then the phase shift for pair x-y is a,,, = ax= + auy - auz. Citrin et al. have used this fact to determine phase shifts for atom pairs without using those specific pairs as models (8). For exanple, they calculated the Ge-C distance in H3GeCH3 using BrCH3, Brz , and H3GeBr.
Alternatively, a@) may be calculated from first principles. Lee et al. have calculated and parameterized the absorber and scatterer phase-shift con- tributions separately for absorbers silicon to bromine and scatterers carbon to bromine (42). Their functional form for each was slightly more flexible than the quadratic typically used in empirical work: cu, = a. + 01 k + azk2 + a3/k3 and a, = bo + blk + bzk2 + b3/k3 . For a given atom pair the total phase shift may be assembled by combination of appropriate values for q, and a,: %, = (ao+ bo - n) + (al + b l )k + (az + bz)kZ + (a3 + b 3 ) / k 3 . Curve fitting using these theoretical parameters also requires the use of an adjustable Eo .
2. Amplitudes and Numbers of Scatterers
As seen in Q. 1, the EXAFS amplitude depends on the number of scatterers N,, as well as R , k, If(lr, k) I, and u. Since R is obtained from the frequency of the EXAFS and k is known, calculation of scatterer numbers from EXAFS is possible if IAn, k) 1 and u are known. The various approaches taken towards EXAFS amplitudes have been (1) to ignore them completely (59, that is, use as many parameters as necessary to fit them, but disregard the amplitude results, (2) to use theoretical values for If(n,k) I and to vary both the Debye- Waller factor and the overall amplitude (57), and (3) to parameterize I An, k) I and exp (-2u2k2) together and neglect variations in thermal motion in the fits (1 1-1 5).
Lee et al. (64) have calculated and parameterized electron atom back- scattering amplitudes using the functional form I f(., k) I s A/ [ 1 + BZ (k - C)* ] . Although these theoretical electron atom scattering calculations appear to yield the correct shape of I An, k) 1, they typically predict nearly double the observed EXAFS amplitudes and therefore an overall scale factor is required for their use. Also, in using theoretical amplitudes, the Debye-Waller factor is usually treated as an adjustable parameter.
An alternative empirical approach is to parameterize the total amplitude envelope using the functional form: co exp ( - c l k Z ) / k C ~ . For molybdenum (15) and iron (1 1, 12) compounds these parameters were obtained by curving-fitting model compound EXAFS. The amplitudes obtained agreed reasonably well for the same scatterers (ll), in accord with theory, which predicts that EXAFS amplitudes should be independent of the nature of the x-ray absorbing atom. Thus, in the empirical approach, each shell of scatterers is optimized in the fit by only two parameters: the overall amplitude (co), which gives the number of
X-RAY ABSORPTION SPECTROSCOPY 21
atom in the shell, and the frequency term, R, which provides the distance information. Obtaining accurate scatterer numbers from this approach requires that the model compound and the unknown have similar Debye-Waller fac- tors. For a variety of molybdenum structures it was possible to determine the absolute number of scatterers with an accuracy of about 20% (1 1,15). Note that because of uncertainties in E o , u, and the overall scale factor, the use of theoretical phase shifts and amplitudes actually requires more adjustable para- meters than the empirical approach.
3. Scatterer Identification
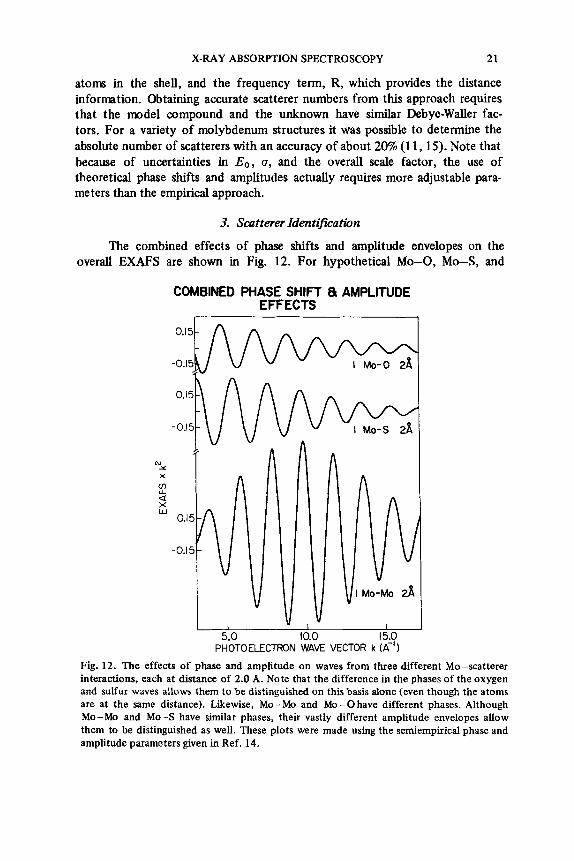
The combined effects of phase shifts and amplitude envelopes on the overall EXAFS are shown in Fig. 12. For hypothetical Mo-0, Mo-S, and
COMBINED PHASE SHIFT 8 AMPLITUDE EFFECTS
I I I I I
5.0 10.0 15.0 PHOTOELECTRON WAVE VECTOR k (A-')
Fig. 12. The effects of phase and amplitude on waves from three different Mo-scatterer interactions, each at distance of 2.0 A. Note that the difference in the phases of the oxygen and sulfur waves allows them to be distinguished on this basis alone (even though the atoms are at the same distance). Likewise, Mo - Mo and Mo - 0 have different phases. Although Mo-Mo and Mo-S have similar phases, their vastly different amplitude envelopes allow them to be distinguished as well. These plots were made using the semiempirical phase and amplitude parameters given in Ref. 14.
22 STEPHEN P. CRAMER AND KEITH 0. HODGSON
Mo-Mo distances of 2 A, it is clear that there are phase differences in the EXAFS. These differences are caused by the different scatterer phase shifts. For a given absorber, different scatterers produce different total phase shifts. The measurable effects, however, are modulo 2n radians, and thus the phase shift term for one scatterer could, unfortunately, resemble another phase shift. When the phase shifts differ on the average by a nonintegral value of 2n radians, it is possible to use them to identify the type of scatterer. In the example given in Fig. 12, it simply would not be possible to fit the Mo-S wave with Mo-0 phase parameters even though the scatterers are at the same distance. This effect can be used to identify the scatterer type. The phase shifts vary rapidly enough that scatterers separated by three or more in atomic number can usually be dis- tinguished.
The phase effects can be used in combination with the amplitude en- velopes to more uniquely define the type of scatterer. For example, it can be seen in Fig. 12 that Mo-S and Mo-Mo have quite different amplitude en- velopes. It would thus be quite difficult to describe an Mo-Mo EXAFS com- ponent by Mo-S amplitude parameters.
V. APPLICATIONS TO BIOINORGANIC CHEMISTRY
The information contained in EXAFS spectra - the type, number, and distances of atoms surrounding the central x-ray absorber - is a large part of what the bioinorganic chemist seeks to know about the structure of metal sites in biological molecules. The positions and intensities of absorption edge features contain information about the oxidation state, site symmetry, and electronic structure of the atom under study. Furthermore, because the interesting x-ray absorption features of different elements are well separated in energy, this type of spectroscopy is a unique method for probing the local environment of specific elements in a complex sample.
The restricted nature of x-ray absorption data is often an advantage. In contrast with crystallographic studies, the information present in EXAFS is limited to the immediate vicinity of the absorber, and long-range features such as secondary and tertiary structure are not important. This means that only a small number of variables must be defined to obtain the local structure, whereas the accuracy of diffraction results depends on refining all of the large number of atomic positions in the crystal. The distances obtained from careful EXAFS studies are accurate to within a few hundredths of an angstrom, while most protein crystallographic results have accuracies to within a few tenths of an angstrom.
Thus, although EXAFS can just approach small-molecule crystallography in accuracy, and cannot reveal the macromolecular features obtained from

X-RAY ABSORPTION SPECTROSCOPY 23
protein crystallography, it is often the method of choice for the study of specific metal sites in large molecules.
At this point, some experimental advantages of x-ray absorption spectro- scopy should be noted. First, this technique can be applied to any state of matter; therefore, crystals, optically transparent solutions, or frozen samples are not required. Second, the selection rules are such that an absorption edge and associated fine structure always exist - paramagnetic or isotopically enriched samples are unnecessary. The lack of isotopic sensitivity makes labeling exper- iments impossible, but metal and ligand substitution studies are conceivable. Finally, x-ray absorption spectra can be collected in minutes or hours, and once the data are obtained, the results may be available within days or weeks, in contrast with the years often required for high resolution single crystal protein diffraction data analysis and refinement.
Currently, the principal drawbacks of the method are the limited avail- ability of synchrotron radiation facilities and the limited sensitivity of the method. Many experimenters have had to wait months to gain a few hours access to the x-ray spectrometers. The building of new synchrotron sources and the dedi- cation of existing ones, as discussed in Section VI, should help to relieve the current congestion of these facilities.
For transition metal x-ray absorption spectroscopy, the minimum useful concentration is on the order of several millimolar. Various efforts are under- way to further improve experimental sensitivity through increased flux and more sophisticated detection systems. Despite the current limitations, a number of pioneering studies in the area of bioinorganic chemistry have already been accomplished, and the use of x-ray absorption in this field should continue to grow exponentially over the next few years.
The applications of EXAFS to bioinorganic problems may be divided into three basic types: (1) refinement (and often correction) of metal coordination sites already known from crystallographically determined structures, (2) eluci- dation of coordination spheres proposed from spectroscopic data or partially refined crystal structures and for metals that have been introduced into bio- molecules as specific probes, and (3) structural determination of completely unknown metal environments.
Each type of problem invites a slightly different analysis procedure. When the basic structure has already been determined from crystallography, only the distances for the absorber-scatterer interactions that contribute to the EXAFS need be determined. In verifying postulated structures, the scatterer ident- ifications must also be varied to ascertain that the proposed atomic types in the coordination sphere fit the data better than any reasonable alternative structure. Finally, the prediction of unknown structures must take into account chemically reasonable bond lengths and coordination numbers, the known chemistry of the system, and the possibility that certain scatterers might not be observed in the

24 STEPHEN P. CRAMER AND KEITH 0. HODGSON
TABLE I Summary of Metatfoprotein X-ray Absorption Studies
Protein Metal Conclusions Ref.
Rubredoxin Fe
Hemoglobin Fe
Hemoglobin Fe
P-450-LM-2 Fe (low-spin ferric)
Chloroperoxidase Fe (high-spin ferric)
Nitrogenase Mo
Azurin c u
Cytochrome oxidase Cu
Hemocyanin c u
Carbonic anhydrase Zn
Fe-S = 2.24 A Fe-S = 2.26 A Fe-S = 2.30 A Fe-S = 2.27 A
Fe-Nnorma1 = Fe-NKempseyf 0.02 A
Fe-Ng$yri, = 1.986 A
Fe-N(pdoer;!b = 2.055 A
Fe-Nporphyrin = 2.00 A Fe-Saxbl = 2.19 A
Fe-Nporphyrin = 2.05 A Fe-Sa,id = 2.30 A
Mo,Fe,S cluster
Mo-Fe = 2.73 A Mo-S = 2.35 A
CU-N = 1.97 A cu-s = 2.10A
inequivalent Cu, one Cu is not redox active; Cu(II), Cu(1) in fully oxidized protein
Deoxy form - both coppers (I); oxy form - both coppers (10
Cu-I = 2.65 A in iodide complex
55 57 52
6
22
23
12
13, 14, 70
65
30
20
5
EXAFS because of their distances and high relative thermal motion. For the last case, the determined set of characteristics often may apply to a number of different structures.
The following examples summarize the recent applications of x-ray absorp tion spectroscopy to bioinorganic chemistry - al l of them made possible by the availability of synchrotron radiation at SSRL. A summary of the results is presented in Table I.
A. Rubredoxin
Rubredoxin is an electron-transfer protein that contains a single iron atom coordinated by four cysteine thiolate ligands. Because of its low molecular weight (6000 for the simplest ones) and the presence of four strongly scattering

X-RAY ABSORPTION SPECTROSCOPY 25
sulfur atoms in the first coordination sphere of iron, this protein is ideally suited for EXAFS studies. The early x-ray crystal structure predicted four Fe-S distances of 2.31, 2.33, 2.39 and 1.97 A (67), later revised to 2.24, 2.32, 2.34, and 2.05 A(68). It had been proposed that the short Fe-S bond length in rubredoxin reflected an entatic state (66) through which the protein modulated the redox potential of the Fe site, and the EXAFS studies have attempted to test the existence of this unusual distortion.
In their early studies Shulman et al. (55) used an empirical ctFeS(k) of the form a,, + a l k + a 2 k Z obtained from curve-fitting EXAFS data for Fe(pyrro1- idinecarbodithiolate-S,Sr)3. They then fitted the phase of absorption-mode EXAFS data for lyophilized rubredoxin with two waves, corresponding to a model with three Fe-S bonds of one length and one Fe-S bond with a different length. The amplitude information was essentially discarded by fitting the envelope with an eight-parameter Pad6 approximant. Examination of the root mean square error for the R 3 , R 1 fit revealed a symmetric well centered near 2.24 A with statistical limits of R 3 = 2.217, R 1 = 2.389 and R 3 = 2.268, R 1 = 2.108 A. This led them to conclude that the Fe-S distances in rubredoxin were
the same to at least within 0.16 8, and that the distortion reported from the x-ray diffraction work was overestimated.
This original work has been expanded upon by the Bell Labs group, using data collected in the fluorescence excitation mode over a wider k range (57). Using theoretically calculated phase shifts and scattering amplitudes, they fit the EXAFS with either 3R3, lR1 or 2R2, 2R', models. They found a strong correlation between the distance differences AR and the root mean square vibrational motion u in the amplitude envelope data, which had previously been discarded. Because of the wider range of data, they were able to refine their Fe-S determination to an average of 2.26rt0.015A and R3- R 1 = 0.00 f 0.1 A. Apart from its implications for the rubredoxin structure, the Bell Labs study is a valuable contribution to statistical error analysis of EXAFS structural calculations. It should be noted that their conservative error limits on R 3 - R 1 arise from using an equal, but unconstrained, u for the Fe-S distances. The relationship u:alc = u:s2tat + &b, and a uvib calculated from the symmetric Fe-S stretching frequency, yielded a calculated ustat of 0.018t_od.?,2& A.
An alternative approach to the analysis of rubredoxin EXAFS was used by Stern and co-workers. They calculated the average Fe-S distance from the Fourier transform peak position and usstat from plots of log x1 (k)/x2(k). Their original work, using EXAFS data out to only 6.4 A - I , reported a Fe-S distance of 2.30 f 0.04 A and ustat of 0.06 f 0.04 A (52). The rather tight error limits were obtained on the narrow range of data by assuming that the effects of thermal motion differences between rubredoxin and the pyrite model were negligible. In an expanded study using data over a wider range (6), Bunker and Stern found an Fe-S distance of 2.267 rt 0.003 A and reported ustat = 0.032+::::$ A. It is interesting to note the rather disparate precision claims put

26 STEPHEN P. CRAMER AND KEITH 0. HODGSON
forth by two different groups with almost identical data. There does seem to be consensus, however, that there are no gross bond-length distortions in rubre- doxin worthy of justifying the Fe(SR)4 site as an example of an entatic state.
B. Hemoglobin
The EXAFS studies of hemoglobin have addressed a conceptually similar chemical question, that is, whether the cooperative nature of hemoglobin- oxygen binding is related to a strained Fe-porphyrin bond in the deoxygenated state. In their preliminary studies of hemoglobin by EXAFS (22), Eisenberger et al. demonstrated the similarity in spectra between the deoxygenated forms of Hb Kempsey and (normal) hemoglobin A. Their results indicated that the average iron-ligand bond length differences were 60.02W. Since deoxy Hb Kempsey is in the high affinity form while deoxy HbA has a low oxygen affinity, they concluded that the energies responsible for the detennination of oxygen affinity are not localized at the Fe-heme site.
In an expanded study(23), using both empirical and theoretical phase shifts, they determined absolute Fe-Nporph distances of 2.055, 2.055, and 2.053 A, respectively, for Cohan’s “picket-fence” compound FeTpivPP (N- MeIm), HbA, and HbKempsey. Their analysis approach was to Fourier filter the EXAFS to remove components from beyond the first coordination sphere and to correct for axial ligand contributions by an iterative procedure that started with an assumed Fe-Nporph distance and worked towards self-consistency. It is interesting that they determined a shorter Fe-N, distance for high-spin ferrous porphyrins such as FeTpivPP (N-MeIm) than for the high-spin ferric case, in contrast with other EXAFS results (1 1, 12).
C. Cytochrome P-450 and Chloroperoxidase
Cytochrome P-450 (26) and chloroperoxidase (45) are heme proteins with unusual catalytic and spectroscopic properties. A question of fundamental importance to the explanation of these properties is the nature and influence of the iron axial ligands during the various stages of the enzymes’ catalytic cycles. Through comparison of the physical properties of synthetic porphyrin com- plexes with various known axial ligands, a strong case has been made for axial cysteinate sulfur ligation in cytochrome P-450 (9, 16,35). The strong spectral resemblance of chloroperoxidase to P-450 would suggest sulfur ligation in the latter enzyme as well, but attempts by Chiang et al. (7) to detect a free sulfhydryl group available for iron ligation have been unsuccessful. It would be quite disturbing if all the unique spectral properties of cytochrome P-450, which have been explained by the presence of thiolate ligation, were reproduced in a protein without such ligation. The EXAFS studies(12) on P-450 and chloro-
X-RAY ABSORPTION SPECTROSCOPY 21
peroxidase were designed to determine whether an axial sulfur ligand was really present, and if so, what the Fe-S distance was.
The protein EXAFS data were analyzed using empirically obtained phase shift and amplitude functions for Fe-N, Fe-0, Fe-S, and Fe-C, interactions. Studies on a variety of synthetic iron porphyrins showed that by fitting the EXAFS with three waves corresponding to Fe-Nporph, Fe-C,, and Fe-Xaxial interactions, distances with an accuracy better than 0.025 A could be obtained. It is worth noting that a different Fe-C phase shift was required for carbon atoms beyond the first coordination sphere than was relevant for the Fe-C interaction in ferrocene. Applying this procedure to the protein data gave results consistent with thiolate ligation in both cases, with an Fe-S distance of 2.30 k 0.03 A in high-spin ferric chloroperoxidase and 2.19 f. 0.03 A in low-spin ferric P-450.
D. Azurin
The “blue” copper proteins are another group of macromolecules whose unusual spectroscopic and chemical properties have been explained by post- ulating cysteine thiolate ligation. Recent EXAFS studies by Tullius et al. (65) have confirmed this assignment and provided the first quantitative picture of a blue copper first coordination sphere. The single copper(I1) ion in the oxidized form of the blue protein azurin (Pseudomnas aemginosa) was found (65) to be ligated by a sulfur atom with a bond length of 2.10 A, the shortest Cu-S bond yet reported. Nitrogen atoms, presumed to be from histidine imidazoles based on other spectroscopic studies, are also bound to the copper, with a Cu-N distance of 1.97 A. Azurin Cu K-edge spectra at high resolution reveal several bound state transitions, indicative of a low symmetry Cu binding site. These structural results are consistent with the x-ray crystal structure of poplar plastocyanin, solved to 2.7 A resolution in the laboratories of H. Freeman at the University of Sydney, Australia (10). The EXAFS studies (65) were the first to report copper-ligand distances in a blue protein, distances not obtainable to such precision from a protein crystal structure.
Preliminary analysis of Cu EXAFS of two other blue copper proteins, plasto- cyanin and stellacyanin, shows that the extremely short Cu-S bond is conserved in the oxidized states of these proteins, and that there is a CQ. 0.1 A lengthening of the Cu-S bond upon reduction of the copper (K. Hodgson and T. Tullius, results to be published).
The remarkably short Cu-S distance in the oxidized proteins helps explain many of the properties of the blue copper proteins. For example, based on normal Cu-S bond lengths, the Cu-S stretch in the resonance Raman was assigned to a weak band observed around 265 cm-’ (44). The largest resonanceenhanced bands occur, however, in a strong envelope around

28 STEPHEN P. CRAMER AND KEITH 0. HODGSON
400 cm-’ . Given the short Cu-S distance in the blue proteins, Badger’s rule (71) predicts that the Cu-S stretch for a 2.10 A bond length should indeed fall in the large resonanceenhanced band. This results in a much more reasonable interpretation of the azurin Raman spectrum.
E. Nitrogenase
The molybdenum-iron (MoFe) protein of nitrogenase contains 2 molybdenum atoms and 24 to 32 atoms each of iron and acid-labile sulfide per molecular weight of 220,000 (3 1). Despite many hypotheses that molybdenum is part of the dinitrogen reduction site, before the advent of x-ray absorption spectroscopy using synchrotron radiation there was no unambiguous means of observing the state of molybdenum in this protein. Recent absorption edge and EXAFS studies (13, 14) thus constitute the first work to provide any infor- mation about the molybdenum environment in nitrogenase.
The first nitrogenase molybdenum EXAFS spectrum (14), recorded on lyophilized Clostridium pusteurianum MoFe protein, showed a clear beat pat- tern that indicated the presence of two strong Mo-scatterer interactions, with a difference in distances to molybdenum of about 0.5 A. Curve fitting identified the lower frequency component as sulfur at about 2.35 A. The smooth shape and lowenergy position of the absorption edge were also consistent with a primarily sulfur environment for the molybdenum.
The higher frequency component, although initially suggestive of a Mo-Mo interaction, could not be adequately fit with an empirical Mo-Mo phase shift. However, use of an approximate Mo-Fe phase shift and amplitude provided a dramatically improved fit, resulting in the prediction of several iron atoms at 2.72 A from a molybdenum atom. A second Mo-S wave at about 2.49A was needed to completely fit the observed data. Comparison of the EXAFS scatterer numbers and distances with crystallographically known struc- tures suggested that a novel Mo,Fe,S cluster was present in nitrogenase. Furthermore, the edge studies ruled out the presence of terminal 0x0 groups (Mo=O), which are so characteristic of molybdenum chemistry. Finally, the phase shift and amplitude analysis unambiguously ruled out the presence of a short Mo-Mo bonding interaction. Thus, the EXAFS results indicate that new directions need to be taken in the synthetic “model” studies of the nitrogenase enzyme.
Spectra were subsequently obtained on an aqueous slurry of Azotobucter vinelundii MoFe protein and on an N-methylformamide solution of the iron- molybdenum cofactor (1 3). The cofactor is a low-molecular-weight species that can be dissociated from the MoFe protein (53) and has been proposed as a universal constituent of all nitrogenase systems. These spectra (Fig. 13) were

X-RAY ABSORPTION SPECTROSCOPY 29
I 4.5 6.0 7.5 9.0 10.5 12.0
PHOTOELECTRON WAVE VECTOR k (8-l)
Fig. 13 . Comparison of the molybdenum Kedge EXAFS for nitrogenase MoFe protein from Clostridium pasteurianum and Azotobacter vinehndii with that of the FeMo cofactor extracted from Azotobacter.
very similar to each other and to that of the lyophilized MoFe protein, thus supporting the similarity of the molybdenum in the cofactor and the molyb- denum in intact nitrogenase, and confirming that lyophilization does not have a major perturbing effect on the molybdenum site.
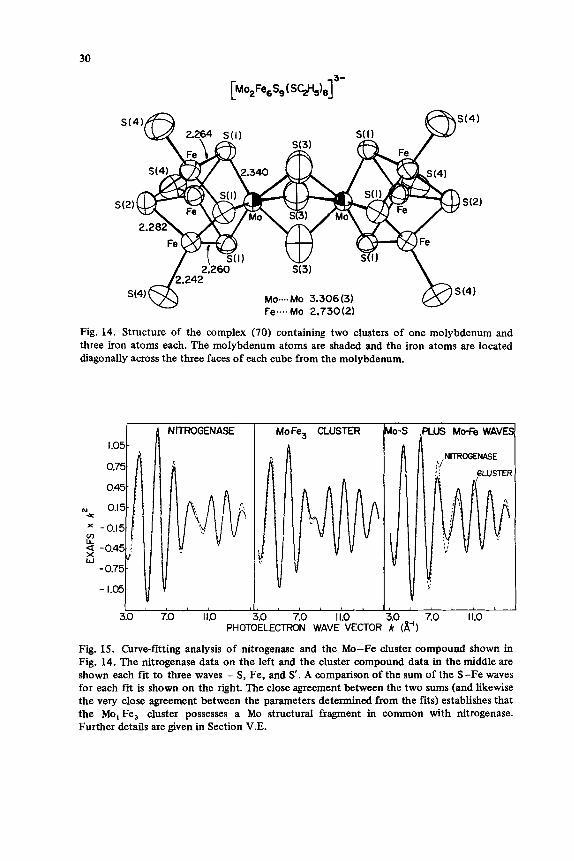
The recent synthesis of a Mo,Fe,S cluster, [Mo2Fe,S9(SC2H5),] 3-, by Holm and his collaborators is a major advance in the structural modeling of nitrogenase (70). The x-ray crystal structure shows a h e r of the kind of Mol Fe& cube proposed for nitrogenase (14) (Fig. 14). The EXAFS of this compound is similar to that of nitrogenase molybdenum but there are distinct differences in the beat region around k = 9 8-l. Curve-fitting analysis of this
30
Fig. 14. Structure of the complex (70) containing two clusters of one molybdenum and three iron atoms each. The molybdenum atoms are shaded and the iron atoms are located diagonally across the three faces of each cube from the molybdenum.
I I I I ’ , 3.0 7.0 11.0
PHOT
Mo Fe3 CLUSTER
I L 1 L 4 L
8.0 7.0 11.0 ELECTRON WAVE VECTOF;
6 - S .PUB Mofe WAVE!
, l ’ ~ ~ ~
3.0 7.0 11.0 k (a-1)
Fig. 15. Curve-fitting analysis of nitrogenase and the Mo-Fe cluster compound shown in Fig. 14. The nitrogenase data on the left and the cluster compound data in the middle are shown each fit to three waves - S , Fe, and S’. A comparison of the sum of the S-Fe waves for each fit is shown on the right. The close agreement between the two sums (and likewise the very close agreement between the parameters determined from the fits) establishes that the Mo,Fe, cluster possesses a Mo structural fragment in common with nitrogenase. Further details are given in Section V.E.

X-RAY ABSORPTION SPECTROSCOPY 31
model suggests that the Mo, Fe, S core structure is virtually identical to that in nitrogenase (Fig. 15) and that the major difference between the model and the protein may reside in the nature of the remaining ligands to molybdenum.
Clearly, a great deal of structural work remains both in elucidating the remainder of the molybdenum coordination and in characterizing the iron in the FeMo cofactor. Furthermore, the nature of the various substrate reduction and inhibition sites remains unclear. EXAFS studies are currently in progress to address both of these questions and should soon yield the first definitive results on structural aspects of substrate and inhibitor interactions in the nitrogenase enzymes.
F. Other Metals in Biological Systems
1. otochrome Oxidase
Cytochrome oxidase is a membrane-bound protein complex that catalyses the reduction of molecular oxygen to water. It contains two copper atoms and two iron atoms per active complex and cycles through a four-electron oxidation/ reduction cycle. In an effort to resolve the nature of the metal oxidation states in the fully reduced and fully oxidized protein, Hu et al. recorded K edges of iron and copper for both states (30). The spectrum of the reduced material could readily be interpreted as corresponding to two Cu(1) and two Fe(I1) sites. However, the edge of the oxidized form appeared to correspond to one Cu(I), one Cu(II), and two Fe(II1). The fact that one of the copper atoms was still Cu(1) in the fully oxidized state of the protein is quite significant in view of the four-electron redox cycle. The authors note that a copper disulfide ligand has been proposed as a primary electron acceptor, and they call for a reexamination of the proposed mechanism for cytochrome oxidase electron transfer. The validity of identifying the &(I) in the oxidized protein is subject to some question because all the effects of symmetry and different ligands on the shape and position of the copper edges are not completely quantified. Further examin- ation should be given to this question before an unambiguous conclusion can be reached.
2. Hemocyanin
Hemocyanin is a protein found in arthropods and molluscs that contains two copper atoms and functions as a reversible oxygen transport protein. X-ray absorption studies have been carried out on the oxygenated, deoxygenated, carboxylated, and NO-treated forms of the protein (21). Even a simple investiga- tion of the copper K edges shown in Fig. 8 reveals important information about the copper sites. The deoxy compound shows bound-state transitions at energies that are characteristic of d' Cu(1). Upon oxygenation, the edge is seen to shift

32 STEPHEN P. CRAMER AND KEITH 0. HODGSON
by about 3 eV to higher energy, and careful inspection reveals the appearance of a 1s +. 3d bound-state transition, which is characteristic of d9 Cu(I1). The edge in carboxylated hernocyanin can be accurately described as a superposition of a deoxy plus an oxy edge, while NO-treated protein shows an edge quite similar to oxyhemocyanin. It is concluded that both copper atoms of the oxy and NO-treated hemocyanin are Cu(I1) and that both coppers in deoxyhemocyanin are likely Cu(1). In carboxy hemocyanin, only half of the copper is seen to be affected by interaction with CO. Studies of the fine structure of the oxy and deoxy forms have revealed only nitrogen and/or oxygen ligands on the coppers and as yet have not resulted in the delineation of a definitive Cu-Cu separation in the protein.
3. CSrrbonic Anhydrase
Studies on the iodide-liganded form of carbonic anhydrase have been carried out through measurements made at the zinc K absorption edge (5). In contrast to crystallographic difference Fourier results, which placed the iodide 3.5 to 3.7 A away from the zinc, the EXAFS studies of Brown et al. determined that the Zn-I distance was 2.65 k 0.06 A. This determination was facilitated by the large magnitude of the iodide scattering.
4. Studies of the Binding of Platinum Cbmplexes to DNA
EXAFS studies have been used by B-K. Teo and S. J. Lippard and their collaborators to study the binding of cis- and truns-dichlorodiammine- platinum(I1) to calf thymus DNA(63). Using curve fitting to first-shell data obtained by a Fourier filtering procedure, they were able to determine that for both the cis and trans isomers, the platinum was still liganded by about four neighbors at 2.03 A (63). More interestingly, they observed no evidence for the retention of chloride ligands on binding of the platinum complex to DNA, nor did they find any evidence of the presence of a Pt-Pt dimer or other metal-metal bonding. These results rule out several proposed models for the mode of interaction of these complexes with DNA. It is worthwhile noting that these results were obtained at the L 1 edge of FY (13.9 keV) and thus represent one of the first extensions of EXAFS curve-fitting analysis to L edge data.
VI. CONCLUSIONS AND THE FUTURE
X-ray absorption spectroscopy has begun to make an important impact as a structural tool in chemical research by providing radial distances to an accuracy of a few hundredths of an angstrom, coordination numbers to about 2%, and qualitative identification of the types of liganding atoms. It has proven

X-RAY ABSORPTION SPECTROSCOPY 33
especially useful in bioinorganic chemistry. Expanded use of this method to study other systems where metal ions play a central role is obvious, and some preliminary applications in other fields have been discussed (29). Continued technological advances in sources and detectors and more refined data analysis procedures appear likely, especially with absorption edge information. Some of the expected developments and the areas of x-ray absorption spectroscopy research that are likely to expand are considered briefly below.
1. Instrumentation
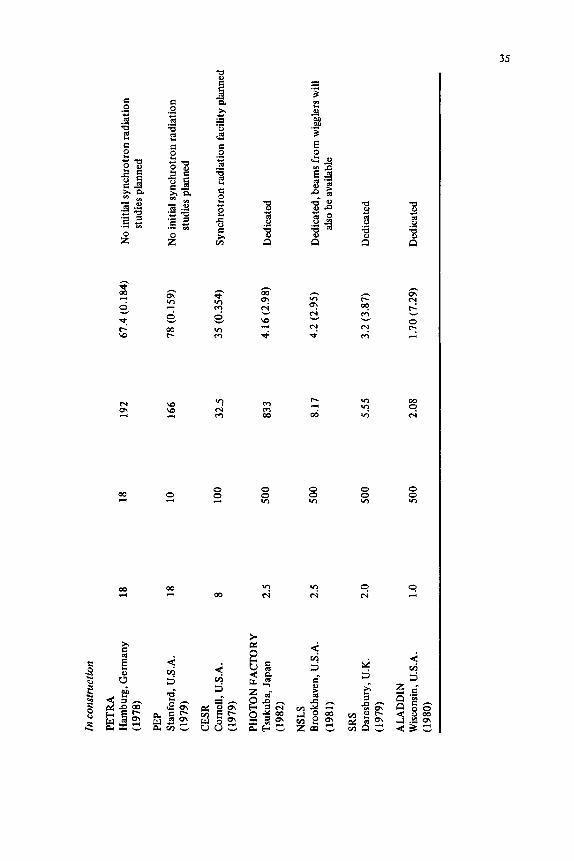
During the next few years, facilities for carrying out the EXAFS experi- ments just described (and numerous other experiments requiring an intense high-energy photon source) will increase. Three major facilities are being planned in the United States: an expanded SSRL at Stanford, the Aladdin ring at Wisconsin, and two rings at the Brookhaven National Laboratory. Along with a smaller facility at Cornell University, these facilities are expected to provide a total of some 60 experimental stations for work in the x-ray range; there are only 10 or so now available. The sources (world-wide) that are most useful for EXAFS studies are summarized in Table 11.
With the dedication of existing sources (such as SPEAR) and construction of new dedicated sources will come increased brightness (flux per unit area) for the second generation of synchrotron radiation sources. When dedicated solely to the production of synchrotron radiation, machines will also operate at higher currents (up to 500 mA or so as compared to the present 20 to 50 mA). One important technological advance will be the use of wiggler magnets(69) to increase the effective energy of the electron beam in a storage ring. A wiggler magnet is a high-field device that causes minute, but sharp, distortions in the electron orbit as the beam passes through the device. The net effect is to shift the spectral distribution to a higher critical energy. Such an effect on the spectrum at SSRL is shown graphically in Fig. 4. The use of wigglers will allow the production of useable fluxes in the hard x-ray region of the spectrum, even when the machine is running at lower energies.
All of these effects can be illustrated by considering the SSRL source. Currently about 10' ' photons sec-' eV-' at 10 keV are available at SSRLwhen operating at 3.5 GeV and 20 mA beam current with colliding beams. When the source is running for dedicated synchrotron radiation production, a flux about two orders of magnitude higher is obtained under the same monochromator conditions. The use of wiggler magnets should shift the critical energy from 2.2 to 4.8 keV and raise the flux of a 2.0 GeV beam about fivefold at a photon energy of 10 keV. The use of more powerful wiggler magnets and a special type of wiggler called the "helical" wiggler (69) could raise the flux to as high as 10' to 10' photons sec-' eV-' at 4 to 6 keV.

TA
BL
E 1
1
Sele
cted
Lis
t of
Sync
hrot
ron
Stor
age
Rin
gs S
uita
ble
for E
XA
FS S
tudi
es
~~~
~~
Ben
ding
C
ritic
al E
nerg
y,
Mac
hine
, Loc
atio
n E
nerg
y, G
eV
Cur
rent
, m
A
radi
us, m
ke
V (A
in A
) R
emar
ks
SPE
AR
St
anfo
rd, U
S.
4 .O
100[
35]
12.7
11
.1 (1
.12)
[
] in
dica
tes
colli
ding
bea
m c
urre
nt
limits
. 50%
ded
icat
ed t
o sy
n-
chro
tron
radi
atio
n af
ter
1980
DO
RIS
H
ambu
rg, G
erm
any
4.5
50
12.1
16
.7 (
0.74
2)
EX
AFS
wor
k ju
st b
egin
ning
usi
ng t
his
sour
ce.
Has
larg
e po
tent
ial w
hen
run
at it
s m
axim
um e
nerg
y
DC
l O
rsay
, Fra
nce
1.8
500
4.0
3.63
(3.4
2)
Goo
d flux o
nly
for K
edg
es o
f lo
wer
2
ele
men
ts. E
XA
FS w
ork
now
be
ing
done
with
thi
s so
urce
VE
EP
4 N
ovos
ibir
sk, U
.S.S
.R.
2.25
10
0 6.
15
4.2
(2.9
5)
EX
AFS
exp
erim
ent b
eing
inst
alle
d
VE
EP
4 7
10
16.5
46
.1 (0
.269
) ln
itial
ope
ratio
n at
4.5
GeV
35
B - 5 a
B d
x c
c .- c
$
3
LI
c e e c
x m
3 c? 0,
v)
VJ m
P r4 W Y m 4
m: 2 2 m m a hl
8 2 5: z v,
0 0 a 3
a d
01 3
i v! 3
a
a v! 3
2 Y hl
a v! 3
36 STEPHEN P. CRAMER AND KEITH 0. HODGSON
Currently, absorption mode EXAFS can be used to study concentrations down to about 10mMfor most elements, and work can be pushed to about 1mM with fluorescence-mode experiments. With the increased flux available from dedicated sources, and under optimum focusing conditions, experiments on submillimolar concentrations should become feasible. The achievement and effective utilization of such high fluxes will depend, however, on improvements in monochromators and detectors.
The use of focusing x-ray monochromator optics can result in a gain of about two orders of magnitude in useable flux at the sample. Improved focusing systems, which gather an even larger portion of the radiation, will push this number even higher. The mirror focusing systems currently in use do not transmit x-rays higher in energy than about 10 keV (5). New mirror designs and perhaps the use of focusing crystals will raise this energy limit and provide higher fluxes for the study of elements whose edges lie in the 10 to 20 keV range.
The development of large d-spacing crystals mounted in a vacuum system will make available monochromatic radiation in the range of 0.5 to 3 keV. This will make possible EXAFS studies of the lower atomic number elements such as magnesium. The development of thinner beryllium windows will also place less restriction on the flux at lower energies, again facilitating EXAFS studies in this region of the spectrum.
The fluorescence detection systems currently in use for studying EXAFS of dilute biological systems are either sodium iodide scintillation counters or silicon-lithium or germanium-lithium solid-state detectors. The maximum count rate for the scintillation detectors is about 150 kHz, while it is only 30 kHz for the solid-state detectors. Without improvements in detector rate capability, it will be quite difficult to make use of the several orders of magnitude increased flux from dedicated synchrotron sources. The use of single-crystal analyzers has the potential for helping to solve this problem. Other detector developments that could enhance the ability to study EXAFS of systems in the 1 O - j to lo-’ M concentration ranges are anticipated.
2. New Directions in X-ray Absorption Spectroscopy
Improvements in methods of analysis have led to a good deal of success in obtaining structural information from analysis of K edge x-ray absorption data. Initial studies have demonstrated the feasibility of L edge EXAFS studies. The analysis of the LII and LIII edges is complicated by the fact that the initial electron state is of p character and the final photoelectron thus may be an s or d wave. This effect introduces complications in phase and amplitude determina- tion for these edges. The ability to obtain good data accurately and rapidly on simple structurally known systems should help in understanding how to treat the effects at L edges. Once such methods have been developed, compared with
X-RAY ABSORPTION SPECTROSCOPY 31
theory, and tested, EXAFS studies of elements through the actinide series will be routinely possible.
The other area of progress is likely to be in the analysis of absorption edges. High-resolution edge studies with synchrotron radiation have already revealed the wealth of structure that is found in the absorption edges. More sophisticated calculations using SCF-Xa! approaches are being developed to theoretically predict the positions and intensities of the bound-state transitions that are superimposed on the continuum transition. From edge analysis, it will likely be possible to obtain even more information about the charge, electronic structure, and site symmetry of a given absorbing atom.
The research progress to date and future promise of x-ray absorption spectroscopy have indeed helped elevate synchrotron radiation from its meager beginnings as an unwanted by-product of high-energy physics research into its current position as a promising research tool being developed in its own right. The communal mode of operation in highenergy physics research has of necessity been imposed on chemists and biologists who were not accustomed to traveling from their own laboratories many miles to do a few experiments. The limited availability of beam time has often necessitated delays of weeks or months in doing critically needed experiments - yet the continuing and increas- ing demand testifies to the value of synchrotron radiation for research in the x-ray region of the spectrum. Our own experience at SSRL has seen chemists biologists, physicists, and engineers brought together under the same roof to do research that simply was impossible in their own labs. The close interactions of such a diverse group of scientists is perhaps the unique factor that has helped to advance the x-ray absorption spectroscopy method so rapidly - the develop ment of experimental practice, theory, and methods of data analysis has been rapidly accomplished through their mutual efforts. The future for this method- ology is bright, and the new science produced with the dedication of synchro- tron sources such as SPEAR and the construction of second-generation sources will most likely place x-ray absorption spectroscopy among the more powerful methods for the determination of structure.
Acknowledgements
We thank Herman Winick for helpful discussions and information on synchrotron radiation sources. We also wish to thank Peter Eisenberger, Richard Holm, and Robert G. Shulman for kindly supplying preprints and results prior to publication. SPC completed part of this review while a National Institutes of Health Postdoctoral Fellow (GM-06478-01) and ICOH is a Fellow of the Alfred P. Sloan Foundation. We also express our gratitude to Tom Tullius for critically reading the manuscript and Salli Morgan and Myra Hodgson for their expert technical assistance in the manuscript preparation. AU of the EXAFS studies described in Section V were carried out at the Stanford Synchrotron Radiation Laboratory, which is a national facility supported by the National Science Foundation.

38 STEPHEN P. CRAMER AND KEITH 0. HODGSON
References
1. C. A. Ashley and S. Doniach,Phys. Rev. B, 11, 1279 (1975). 2. L. V. Azaroff,Rev. Mod. Phys., 35, 1012 (1963). 3. L. Azaroff and D. Pease in X-ray'6pectroscopy, L. Azaroff, Ed., McGraw-Ha, New
4. A. Bienenstock, and H. Winick,Ann. Rev. Nucl. Sci., 28,33 (1978). 5. G. S. Brown, G. Navon, and R. G. Shulman,Roc. Natl. Acad. Sci. U.S.A., 74, 1974
York 1974,Chap. 5.
(1977). 6. B. Bunker and E. A. Stern, Biophys. J., 19, 253 (1977). 7. R. Chiang, R. Makino, W. E. Spooner, and L. P. Hager, Biochemistry, 14. 4166 (1975). 8. P. H. Citrin, P. Eisenberger, and B. M. Kincaid, Phys. Rev. L e f t , 36, 1346 (1976). 9. J. P. Collman, T. N. Sorrell, and B. M. Hoffman,J. Am. Chem. Soc., 97,913 (1975).
10. P. M. Colman, H. C. Freeman, J. M. Cuss, M. Murata, V. A. Norris, J. A. M. Ramshaw, and M. P. Venkatappa, Nature, 272,319 (1978).
11. S. P. Cramer, Ph.D. Thesis, Stanford University, 1977. 12. S. P. Cramer, J. H. Dawson, K. 0. Hodgson, and L. P. Hager, J. Am. Chem. Soc., 100,
13. S. P. Cramer, W. 0. Gillum, K. 0. Hodgson, L. E. Mortenson, E. I. Stiefel, J. R. Chisnell,
14. S. P. Cramer, K. 0. Hodgson, W. 0. Gillum, and L. E. Mortenson, J. Am. Chem. SOC.,
15. S. P. Cramer, K. 0. Hodgson, E. I. Stiefel, and W. E. Newton,J. Am. Chem SOC., 100,
16. J. H. Dawson, R. H. Holm, J. R. Trudell, G. Barth, R. Linder, E. Bunnenberg, C. Djerassi,
17. R. de L. Kronig, 2. Phys., 70, 317 (1931). 18. R. de L. Kronig, 2. Phys., 75, 191 (1932). 19. R. de L. Kronig, 2. Phys., 75, 468 (1932). 20. T. K. Eccles, Ph.D. Thesis, Stanford University, 1977. 21. T. K. Eccles, F. Kutzler, K. 0. Hodgson, and S. Doniach, t o be published. 22. P. M. Eisenberger, R. G. Shulman, G. S. Brown, and S. Ogawa, Roc. Natl. Acad. Sci
23. P. Eisenberger, R. G. Shulman, B. M. Kincaid, G. S. Brown, and S. Owaga, Nature, 274,
24. G. L. Glen and C. G. Dodd,J. Appl. Phys., 39, 5372 (1968). 25. S. Grim, and L. J. Matienzo,lnorg. Chem., 14, 1014 (1975). 26. I. C. Gunsalus, T. C. Pederson, and G. S. Sligar, Annu. Rev. Biochem., 44, 377 (1975). 27. J. B. Hastings, B. M. Kincaid, P. Eisenberger, Nucl. Inst. Meth., 152, 167 (1978). 28. T. M. Hayes, P. N. Sen, and S. H. Hunter,J. Phys. C, 00,4357 (1976). 29. K. 0. Hodgson, H. Winick, and G. Chu, "Synchrotron Radiation Research", Stanford
Synchrotron Radiation Research Laboratory, Stanford, California, 1976. 30. V. W. Hu, S. I. Chan, and G. S. Brown,Roc. Natl. Acad. Sci. U.S.A., 74, 3821 (1977). 31. T. C. Huang, W. G. Zumft, and L. E. Mortenson, J. Bacferiol, 113, 884 (1973) 32. J. Jaklevic, J. Kirby, M. Klein, A. Robertson, G. Brown and P. Eisenberger, Solid
33. B. M. Kincaid, and P. Eisenberger,Phys. Rev. Lett., 34, 1361 (1975). 34. G. S. Knapp, H. Chen, and T. E. Klipert, Rev. Sci. Inst., 49,1658 (1978). 35. S. Koch, S. C. Tang, R. H. Holm, R. B. Frankel, and J. A. Ibers, J. Am. Chem. SOC., 97,
36. A. I. Kozlenkov, Bull. Acad. Sci. U.S.S.R., Phys. Ser. (Engl. Trans.), 25, 968 (1961).
7282 (1 978).
W. J. Brill, and V. K. Shah, J. Am. Chem. Soc., 100, 3814 (1978).
100,3398 (1978).
2748 (1978).
and S. C. Tang, J. A m Chem. Soc., 98, 3707 (1976).
U.S.A., 73, 491 (1976).
30 (1978).
State Commun. 23, 679 (1977).
916 (1975).

39 X-RAY ABSORPTION SPECTROSCOPY
37. W. Kossel, Z. Phys. 1 , 119 (1920). 38. A. I. Kostarev,Zh. Ekspe. Theor. Fiz., 11, 60 (1941). 39. P. A. Lee,Phys. Rev. B, 13, 5261 (1976). 40. P. A. Lee and G. Beni,Phys. Rev. B, 15, 2862 (1977). 41. P. A. Lee and J. B. Pendry,Phys. Rev. B, 11, 2795 (1975). 42. P. A. Lee, B. -K. Teo, and A. L. Simons,J. Am. Chem. Soc., 99, 3856 (1977). 43. F. W. Lytle, D. E. Sayers, and E. A. Stern,Phys. Rev. B, 11,4825 (1975). 44. V. Miskowski, S. Tang, T. G. Spiro, F. Shapiro, and T. H. Moss, Biochm., 14, 1244
45. D. R. Morris, and L. P. Hager, J. Biol. Chem., 241, 1763 (1966). 46. L. G. Parratt, Phys. Rev., 56, 295 (1939). 47. H. Petersen, Z. Phys., 98, 569 (1936). 48. P. T. Pienkos, V. K. Shah, and W. J. Brill, Proc. Natl. Acad. Sci. U.S.A., 74, 5468
49. J. Reed, P. Eisenberger,B. -K. Teo, and B. M. Kincaid, J. Am. Chem. Soc., 99, 5217
50. F. K. Richtmeyer, S. W. Barnes, and E. Ramberg, Phys. Rev., 46, 843 (1934). 51. D. E. Sayers, F. W. Lytle, and E. A. Stern, in Advances in X-ray Analysis, Vol. 13,
Plenum Press, New York, 1970, p. 248. 52. D. E. Sayers, E. A. Stern, and J. R. Herriott,J. Chem. Phys., 64, 427 (1976). 53. V. K. Shah, and W. J. Brill,Proc. Natl. Acad. Sci. U.S.A., 74, 3249 (1977). 54. T. Shiraiwa, T. Ishimura, and M. Sawada, J. Phys. SOC. Jap., 13,847 (1958). 55. R. G. Shulman, P. Eisenberger, W. E. Blumberg, and N. A. Stombaugh, Proc. Natl.
Acad..Sci. U.S.A., 72,4003 (1975). 56. R. G. Shulman, P. Eisenberger, and B. M. Kincaid, Ann. Rev. Biophys. Bioeng., 17,559
(1978). 57. R. G. Shulman, P. Eisenberger, B. -K. Teo, B. M. Kincaid, and G. S. Brown, J. Mol.
Biol., 124, 305 (1978). 58. R. G. Shulman, Y. Yafet, P. Eisenberger, and W. E. Blumberg, Proc. Natl. Amd. Sci.
U.S.A., 73, 1384 (1976). 59. R. Siegbahn, Theory of X-ray Spectroscopy, 1925. 60. U. C. Srivastava, and H. L. Nigam, Coord. Chem. Rev., 9, 275 (1972). 61. E. A. Stern,Phys. Rev. B, 10, 3027 (1974). 62. E. A. Stern, D. E. Sayers, and F. W. Lytle, Phys. Rev. B, 11, 4836 (1976). 63. B. -K. Teo, P. Eisenberger, J. Reed, J . K. Barton, and S. J. Lippard, J. Am, Chem. Soc.,
64. B. -K. Teo, P. A. Lee, A. L. Simons, P. Eisenberger, and B. M. Kincaid, J. Am. Chem.
65. T. Tullius, P. Frank, andK. 0. Hodgson,I+oc. Natl. Acad. Sci. U.S.A., 75, 4069 (1978). 66. B. L. Vallee, and R. J. P. Williams,Proc. Natl. Acad. Sci. U.S.A., 59, 498 (1968). 67. K. D. Watenpaugh, L. C. Sieker, J. R. Herriott, and L. H. Jensen, Cold Spring Harbor
68. K. D. Watenpaugh, L. C. Sieker, J. R. Herriott, and L. H. Jensen,Acfa Cryst. Sec. B,
69. H. Winick, and T. Knight, Eds., “Wiggler Magnets,” SSRL Report #77/05, Stanford
70. T. E. Wolff, J . M. Berg, C. Warrick, R. H. Holm, K. 0. Hodgson,and R. B. Franke1,J. Am.
71. L. Zensovsky, Z. Chem., 5, 252 (1965).
(1975).
(1977).
(1977).
100, 3225 (1978).
Soc., 99, 3854 (1977).
Symp. Quant. Biol., 36, 359 (1971).
29, 943 (1973).
University, Stanford, California, 1977.
Soc., 100,4630 (1978).