
Atomic Emission Spectroscopy Molecular Absorption Spectroscopy

April 2015 | Vol.58 No.4 313© Science China Press and Springer-Verlag Berlin Heidelberg 2015
SCIENCE CHINA Materials REVIEWS
X-ray absorption fine structure spectroscopy in nanomaterialsZhihu Sun, Qinghua Liu, Tao Yao, Wensheng Yan and Shiqiang Wei
X-ray absorption fine structure (XAFS) spectroscopy has been widely used for decades in a wide range of scientific fields, including physics, chemistry, biology, materials sciences, en-vironmental sciences, etc. This review article is devoted to the applications of XAFS in nanomaterials. The basic principles of XAFS are briefly described from the view point of practical application, including its theory, data analysis and experiments. Using selected examples from recent literatures, the power of XAFS in determination of local atomic/electronic structures is illustrated for various nanomaterials, covering metal and semi-conductor nanoparticles, catalysts, core/shell structures, ultra-thin nanosheets, and so on. The utilization of time-resolved XAFS technique is also briefly introduced, for in-situ probing the nucleation/growth processes of nanomaterials and identi-fying reaction intermediates of nanostructured catalysts under operando conditions.
INTRODUCTIONWith the emergence of nanoscience and nanotechnology in the late 1980s [1], they have risen dramatically to be one of the most important research areas in the 21st century. The nanoscience and nanotechnology include the study of objects and systems with at least one dimension in the nanometer scale (typically 1−100 nm) [2]. The objects studied in such a size range are larger than atoms and small molecules but smaller than macroscopic bulk structures. The dimensions of these systems are comparable to the characteristic length scales that define the overall prop-erties of materials. As a result, many of the physical and chemical properties of the nanometer-scaled materials (nanomaterials) are changed relatively to their bulks, and numerous unique behaviors of the nanomaterials emerge, like the quantum size-effect, quantum confinement effect, near-field optical effects, electron tunneling, and so on. Further development of new and improved nanomateri-als requires the ability to control their structure at smaller and smaller scales and complete understanding of their be-haviors at nanoscale. With these improved abilities, there will be great potential to create a rich diversity of materi-als with novel characteristics, functions and applications.
National Synchrotron Radiation Laboratory, University of Science and Technology of China, Hefei 230029, China* Corresponding author (email: [email protected])
To synthesize nanomaterials in a controllable manner and understand their unique and interesting properties, thor-ough characterizations of these materials in either static or transient states are essential. Inspired by these motivations, many new techniques (for instance, the atomic force mi-croscope [3] and the scanning tunneling microscope [4]) have been developed and many traditional techniques (like X-ray absorption fine structure (XAFS) reviewed here) have been extensively applied to this rapidly developing field. Many other spectroscopic techniques have been found wide applications in nanomaterials. For example, optical absorption, photoluminescence and Raman spec-troscopy have shown their power in investigating the ele-mental excitations in nanomaterials, but these are beyond the scope of this article, which aims at reviewing the appli-cation of XAFS in the determination of atomic structure and electronic structures in nanomaterials.
The last four decades has witnessed the great develop-ment of XAFS spectroscopy, as well as its wide applications in nanomaterials. XAFS refers to the oscillatory fine struc-ture of the X-ray absorption coefficient μ(E) that changes as a function of the incident X-ray photons with energy E beyond the absorption edge E0 of a specific atom. Its most outstanding features are the sensitivity to short-range order and element-specificity, which enable them to selectively probe the environments surrounding a specific element in solids, liquids, and even gases [5,6]. The development of XAFS as a powerful tool of structure characterization is associated with the development of an effective scatter-ing theory to express the essential physics, and with the availability of synchrotron radiation (SR) light sources that emit tunable and brilliant X-ray photons. Since 1970’s, the number of XAFS experiments performed has grown ex-ponentially and XAFS has been routinely used as a local structure probe nowadays. Owing to the building of SR light sources with high-brilliance, numerous measurement methods have been developed to obtain high quality XAFS data under various conditions, such as transmission XAFS for usual bulk material, fluorescence XAFS for trace ele-ment, grazing-incidence XAFS for surface research, mag-
mater.scichina.com link.springer.com Published online 10 April 2015 | doi: 10.1007/s40843-015-0043-4Sci China Mater 2015, 58: 313–341
314 April 2015 | Vol.58 No.4 © Science China Press and Springer-Verlag Berlin Heidelberg 2015
REVIEWS SCIENCE CHINA Materials
netic XAFS for spin study, in-situ and operando XAFS for high-temperature/high-pressure/real-reaction investiga-tions, time-resolved XAFS for kinetics studies and even space- resolved XAFS for microzone studies. Nowadays, XAFS has been used in a wide range of scientific fields, including physics, chemistry, biology, materials sciences, environmental sciences, and so on. The structural infor-mation provided by XAFS helped to solve many important scientific problems [7–11].
This review will emphasize on the applications of XAFS to the study of nanomaterials. It is organized as follows. We start with the introduction of the basic principles of XAFS, then briefly describe the most commonly used XAFS ex-perimental modes for XAFS measurements, and a general description of the XAFS data analysis procedure. Then se-lected examples of applications of XAFS in various nano-materials are introduced, including metal and semicon-ductor nanoparticles and catalysts, core/shell structures, and ultrathin nanosheets. The last two subsections are fo-cused on the in-situ probing of the nucleation and growth processes of nanomaterials and studies of nanostructured catalysts under operando conditions. Depending on the materials under investigation, XAFS could provide a rich diversity of information, e.g., size-dependent lattice con-tractions, surface distortions, occupations and distribu-tions of dopants, defect types and dopant valence, chemical reaction progresses, etc. The study on nanomaterials is a rather wide field that a large number of excellent researches have performed, but only a small part of these works could be covered in this review.
BASIC PRINCIPLES OF XAFSIn the X-ray spectral region, the impinging photons inter-act with matter through the dominant photoelectric ab-sorption. The basic physical quantity measured in XAFS is the X-ray absorption coefficient μ(E), which describes how the X-ray absorption of a sample changes as a function of the incident X-ray photons energy E. At specific energies, the X-ray photon has sufficient energy to liberate electrons from the low-energy bound states in the absorbing atoms, and causes a sudden increase in the absorption coefficient μ(E). These energies are called element-specific X-ray ab-sorption edges. Excitation of electrons from 1s, 2s, 2p1/2, and 2p3/2 corresponds to the K, L1, L2, and L3 edges, respec-tively. Across the absorption edge, the X-ray absorption coefficient μ(E) exhibits a jump, followed by oscillatory structure at higher energies [5]; XAFS then describes the details of X-ray absorption at energies near and above the absorption edge.
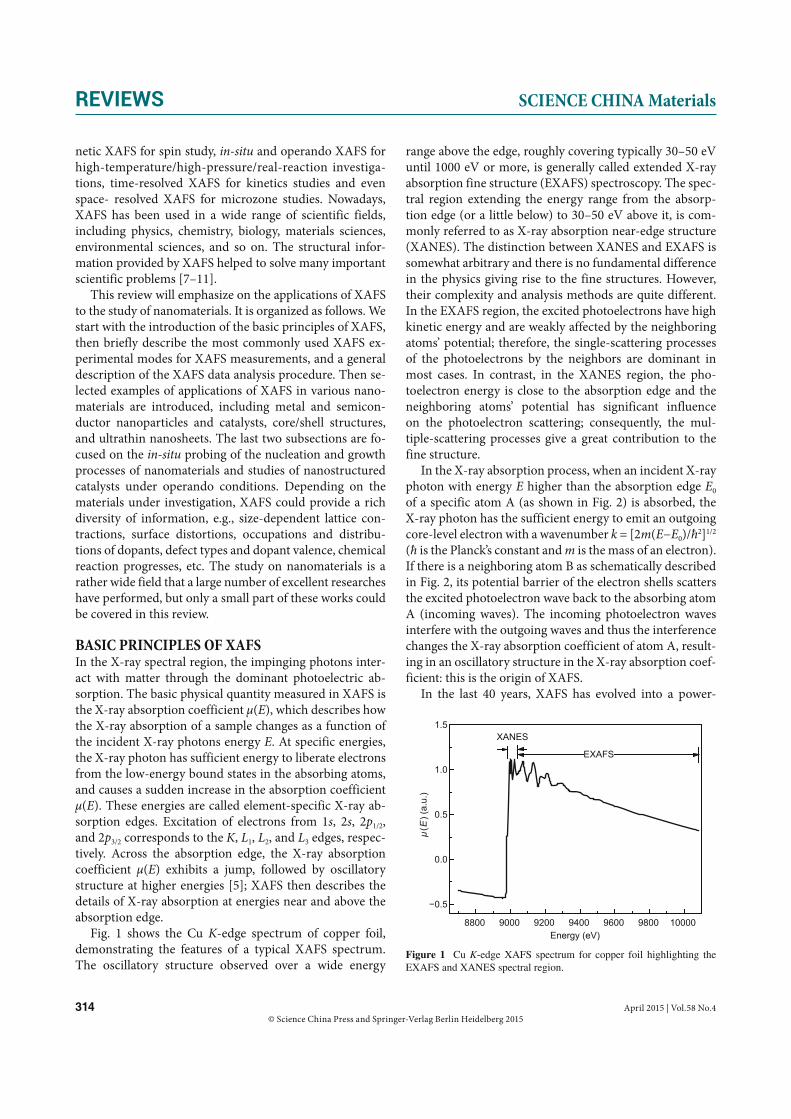
Fig. 1 shows the Cu K-edge spectrum of copper foil, demonstrating the features of a typical XAFS spectrum. The oscillatory structure observed over a wide energy
range above the edge, roughly covering typically 30–50 eV until 1000 eV or more, is generally called extended X-ray absorption fine structure (EXAFS) spectroscopy. The spec-tral region extending the energy range from the absorp-tion edge (or a little below) to 30–50 eV above it, is com-monly referred to as X-ray absorption near-edge structure (XANES). The distinction between XANES and EXAFS is somewhat arbitrary and there is no fundamental difference in the physics giving rise to the fine structures. However, their complexity and analysis methods are quite different. In the EXAFS region, the excited photoelectrons have high kinetic energy and are weakly affected by the neighboring atoms’ potential; therefore, the single-scattering processes of the photoelectrons by the neighbors are dominant in most cases. In contrast, in the XANES region, the pho-toelectron energy is close to the absorption edge and the neighboring atoms’ potential has significant influence on the photoelectron scattering; consequently, the mul-tiple-scattering processes give a great contribution to the fine structure.
In the X-ray absorption process, when an incident X-ray photon with energy E higher than the absorption edge E0 of a specific atom A (as shown in Fig. 2) is absorbed, the X-ray photon has the sufficient energy to emit an outgoing core-level electron with a wavenumber k = [2m(E−E0)/ħ2]1/2 (ħ is the Planck’s constant and m is the mass of an electron). If there is a neighboring atom B as schematically described in Fig. 2, its potential barrier of the electron shells scatters the excited photoelectron wave back to the absorbing atom A (incoming waves). The incoming photoelectron waves interfere with the outgoing waves and thus the interference changes the X-ray absorption coefficient of atom A, result-ing in an oscillatory structure in the X-ray absorption coef-ficient: this is the origin of XAFS.
In the last 40 years, XAFS has evolved into a power-
8800 9000 9200 9400 9600 9800 10000
0.5
0.0
0.5
1.0
1.5XANES
EXAFS
μ(E
) (a.
u.)
Energy (eV)
Figure 1 Cu K-edge XAFS spectrum for copper foil highlighting the EXAFS and XANES spectral region.

April 2015 | Vol.58 No.4 315© Science China Press and Springer-Verlag Berlin Heidelberg 2015
SCIENCE CHINA Materials REVIEWS
ful structural characterization tool. It possesses striking advantages such as element-specificity, sensitivity to the short-range order (typically several Å) and chemical state [5]. It can provide quantitative structural information at an atomic scale about the local environment around the absorbing atom, i.e., near-neighbor species and distance, symmetry, coordination number and fluctuation in bond distance. More specifically, EXAFS is sensitive to the dis-tance, coordination number and species of the atoms im-mediately surrounding the absorbing atoms. XANES can distinguish the electronic state and the three-dimensional coordination geometry (including symmetry, atomic types, bond angles and distances). The sensitivity to the short-range order and element-specificity endow XAFS a unique capability to determine the local structure for a diversity of systems, no matter the studied sample is in solid (crystal-line or amorphous), liquid or even gas state.
Despite the power of XAFS as a local structure probing technique, it also has limitations. First, it can only afford the ensemble-averaged structure information around the absorbing atom, but is difficult to discriminate the target elements mixed in different phases or located at different special positions. Second, its sensitivity to the local struc-ture is limited to a radial range within the first a few coor-dination shells.
XAFS has a long history of more than 90 years since it was first observed by Friche and Hertz in 1920 [12,13]. However, this phenomenon has long been plagued by con-troversial physical interpretations. In 1931, Kronig [14] originally interpreted the XAFS oscillations in crystals as a density-of-states effect in terms of the so-called long-range order (LRO) theory. But attempts to match EXAFS peaks with predictions of LRO theories proved unsatisfac-tory, and afterwards in 1932, Kronig [15,16] presented an alternative theory for small molecules, in which the oscil-latory structure in EXAFS was attributed to the influence
of neighboring atoms on the transition matrix element in the golden rule, i.e., a short range-order (SRO) effect. The debate between the LRO and SRO theories remained for 40 years until in 1971, Sayers, Stern and Lytle performed the k-space Fourier transform to separate peaks correspond-ing to various atomic shells [17]. This is a milestone in the development story of XAFS. Since then it has been wide-ly recognized that the oscillations in the X-ray absorption spectra, more than just a physical phenomenon, could be used as a quantitative structure-determination technique.
In the framework of the single-scattering which assumes that the outgoing wave is scattered back only once by the neighboring atoms (e.g., the single-scattering path A→B→A in Fig. 2), the EXAFS oscillation function χ(k) for randomly ori-ented polycrystalline or solution samples is expressed by:
20 2 / ( )
20
( ) ( )( ) e
sin[(2 ( ) 2 ( )]d .
j j R k
j
C
N S f k g Rkk RkR k k R
(1)
The contributions from atoms of the same atomic num-ber and at similar distances from the absorbing atom may not be resolvable from each other, and the atoms must be conceptually grouped together into “coordination shells” and Nj is the number of atoms in the j-th coordination shell. In Equation ( 1), S0
2 is the amplitude reduction factor, R is the distance between the absorbing and scattering at-oms, g(R) is the pair distribution function of the scattering atom, λ(k) is the mean free path of the excited photoelec-tron, fj(k) and δ(k) are the backscattering amplitude and scattering phase shift of the scattering atom, respectively, φC(k) is phase-shift of the absorbing atom. The amplitude reduction factor S0
2 is weakly dependent on the absorber elements and is typically in the range of 0.7−1.0 [18]. The e−2R/λ term is due to the limited lifetime of the core hole (~1 fs) and the limited range (within 10 Å) of the excited pho-
μ(E
)
Energy
AB
C
Figure 2 Pictorial view of the origin of XAFS: scattering of an outgoing photoelectron wave by neighboring atoms of the absorbing atom A. The solid circles stand for the outgoing photoelectron waves, and the dashed lines stand for the scattered waves.

316 April 2015 | Vol.58 No.4 © Science China Press and Springer-Verlag Berlin Heidelberg 2015
REVIEWS SCIENCE CHINA Materials
toelectron within the matrix, both of which have the effect of damping the oscillation amplitude and are the origin of the local sensitivity of EXAFS.
Equation (1) is applicable to all systems with disorder degrees ranging from low to high. Especially for the low disorder systems, the g(R) function can be represented by a Gaussian distribution,
212 2
2
( )( ) (2 ) exp
2jR R
g R
. (2)
Substituting Equation (2) into Equation (1) gives
2 22
2 2 / ( )02
( )( ) e e
sin[2 ( ) 2 ( )],
j j jk R kj j
j j
j j C
N S f kk
kRkR k k
(3)
which is commonly called the standard EXAFS formula. The σ2 term, known as the Debye-Waller factor, is the mean square variation in the interatomic distance R. The e−2k2σj
2 term accounts for the effects of dynamic (thermal) vibra-tion and configuration (structural) disorders which smear out the EXAFS oscillations at high k region.
For systems with moderately higher disorder, like high- temperature samples and surfaces, the Gaussian distribu-tion fails to represent the pair distribution function, and the asymmetry in the pair distribution must be considered. For instance, thermal expansion cannot be described within a harmonic oscillator but requires anharmonic interatomic potential. In such a case, a widely used model-independent method is cumulant expansion that takes the inharmonic pair into account [19,20]. In the systems with even higher disorder, such as liquid or amorphous materials, some oth-er model-dependent approximation has been considered; for example, a weighted exponential distribution function could be used to account for the structural disorder [21,22].
The EXAFS Equation (1) is derived based on the sin-gle-scattering approximation, which assumes that the out-going photoelectron wave is only scattered once by the neighboring atoms before returning to the absorbing at-oms. But in reality the photoelectron is scattered by more than one neighboring atom and these multiple-scattering (MS) events also contribute to the interference phenom-enon. If the multiple-scattering contributions are small, the single-scattering approximation would be sufficient to describe the EXAFS process. For instance, in collinear configuration where three or more atoms are aligned or al-most aligned, the multiple-scattering EXAFS contributions can even be larger than the high shell single-scattering contribution because of the shadowing or focusing effect. Therefore, in order to avoid poor or misleading results in the extracting the structural information beyond the first
shell, attention to the multiple-scattering events involving different shell atoms should be paid.
Historically, the theoretical treatment of the multiple- scattering EXAFS in terms of effective path length was first proposed in 1975 by Lee and Pendry who took advantage of Fourier transform in the EXAFS data analysis [23]. Its main advantages are its computational efficiency and accu-racy; moreover, it provides a geometrical parametrization and interpretation of EXAFS, which is ideal for analyzing interatomic distances and other structural quantities. Lat-er, the path-by-path XAFS theory was greatly developed by Rehr and Albers who proposed a separable representation of the Green’s-function propagators [24] to overcome all the computational difficulties of the multiple-scattering expansion. For an N-leg path Γ with scatterers at R1, R2, …, RN = R0, the result for the EXAFS amplitude χΓ can be recast exactly in the form of the standard EXAFS equation, but with an effective scattering amplitude feff,
2 2
eff l(2 ( )) 2ff2eff
( )( ) Im e ei kR k kef kk
kR
. (4)
The implementation of these algorithms into the ab ini-tio EXAFS code known as FEFF−named after the effective scattering amplitude feff in the theory−has made accurate calculations of high-order multiple-scattering EXAFS in general materials routine [25]. By using FEFF code, the ef-fective amplitude function feff, phase shift function δl(k) and the mean free path of electrons λ(k) can be calculated for both single- and multiple-scattering paths. For more details on the multiple-scattering FEFF theory, the readers are re-ferred to the excellent review article written by Rehr and Albers [26]. So far, various advancements in the theoretical models have been obtained such as full multiple-scatter-ing (FMS) [27], self-consistent field and fully relativistic calculations [28] especially for a quantitative analysis of the near-edge spectroscopy. The EXAFS theory is imple-mented in various ab initio codes like CONTINUUM [29], EXCURV [30], FEFF [25], GNXAS [31], WIEN2k [32], NSRL-XAFS [33], and others [34–36].
XAFS EXPERIMENTAL TECHNIQUES AND DATA ANALYSISXAFS experimental techniques The objective of a XAFS measurement is to record an ener-gy-dependent quantity that is directly proportional to the absorption coefficient μ(E) of the atom of interest. Since the magnitude of the XAFS oscillatory function is typically on the order of 10−2 of the edge-jump and decreases with increasing energy, a fairly precise and accurate measure-ment scheme is required to collect high quality data. The main experimental key points are the availability of a tun-
April 2015 | Vol.58 No.4 317© Science China Press and Springer-Verlag Berlin Heidelberg 2015
SCIENCE CHINA Materials REVIEWS
able X-ray source with high photon flux and high energy resolution, and high performance detectors for recording the XAFS data.
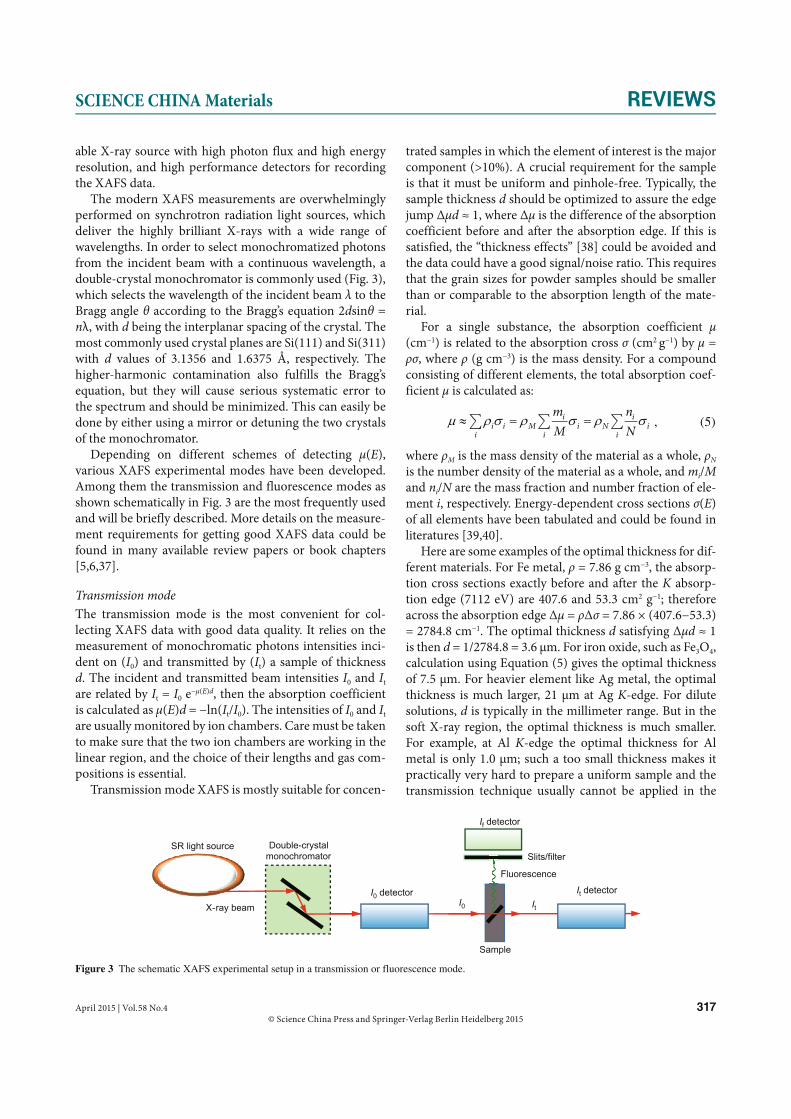
The modern XAFS measurements are overwhelmingly performed on synchrotron radiation light sources, which deliver the highly brilliant X-rays with a wide range of wavelengths. In order to select monochromatized photons from the incident beam with a continuous wavelength, a double-crystal monochromator is commonly used (Fig. 3), which selects the wavelength of the incident beam λ to the Bragg angle θ according to the Bragg’s equation 2dsinθ = nλ, with d being the interplanar spacing of the crystal. The most commonly used crystal planes are Si(111) and Si(311) with d values of 3.1356 and 1.6375 Å, respectively. The higher-harmonic contamination also fulfills the Bragg’s equation, but they will cause serious systematic error to the spectrum and should be minimized. This can easily be done by either using a mirror or detuning the two crystals of the monochromator.
Depending on different schemes of detecting μ(E), various XAFS experimental modes have been developed. Among them the transmission and fluorescence modes as shown schematically in Fig. 3 are the most frequently used and will be briefly described. More details on the measure-ment requirements for getting good XAFS data could be found in many available review papers or book chapters [5,6,37].
Transmission modeThe transmission mode is the most convenient for col-lecting XAFS data with good data quality. It relies on the measurement of monochromatic photons intensities inci-dent on (I0) and transmitted by (It) a sample of thickness d. The incident and transmitted beam intensities I0 and It are related by It = I0 e−μ(E)d, then the absorption coefficient is calculated as μ(E)d = −ln(It/I0). The intensities of I0 and It are usually monitored by ion chambers. Care must be taken to make sure that the two ion chambers are working in the linear region, and the choice of their lengths and gas com-positions is essential.
Transmission mode XAFS is mostly suitable for concen-
trated samples in which the element of interest is the major component (>10%). A crucial requirement for the sample is that it must be uniform and pinhole-free. Typically, the sample thickness d should be optimized to assure the edge jump Δμd ≈ 1, where Δμ is the difference of the absorption coefficient before and after the absorption edge. If this is satisfied, the “thickness effects” [38] could be avoided and the data could have a good signal/noise ratio. This requires that the grain sizes for powder samples should be smaller than or comparable to the absorption length of the mate-rial.
For a single substance, the absorption coefficient μ (cm−1) is related to the absorption cross σ (cm2 g−1) by μ = ρσ, where ρ (g cm−3) is the mass density. For a compound consisting of different elements, the total absorption coef-ficient μ is calculated as:
i ii i M i N i
i i i
m nM N
, (5)
where ρM is the mass density of the material as a whole, ρN is the number density of the material as a whole, and mi/M and ni/N are the mass fraction and number fraction of ele-ment i, respectively. Energy-dependent cross sections σ(E) of all elements have been tabulated and could be found in literatures [39,40].
Here are some examples of the optimal thickness for dif-ferent materials. For Fe metal, ρ = 7.86 g cm−3, the absorp-tion cross sections exactly before and after the K absorp-tion edge (7112 eV) are 407.6 and 53.3 cm2 g−1; therefore across the absorption edge Δμ = ρΔσ = 7.86 × (407.6−53.3) = 2784.8 cm−1. The optimal thickness d satisfying Δμd ≈ 1 is then d = 1/2784.8 = 3.6 μm. For iron oxide, such as Fe3O4, calculation using Equation (5) gives the optimal thickness of 7.5 μm. For heavier element like Ag metal, the optimal thickness is much larger, 21 μm at Ag K-edge. For dilute solutions, d is typically in the millimeter range. But in the soft X-ray region, the optimal thickness is much smaller. For example, at Al K-edge the optimal thickness for Al metal is only 1.0 μm; such a too small thickness makes it practically very hard to prepare a uniform sample and the transmission technique usually cannot be applied in the
SR light source
X-ray beam
Double-crystalmonochromator
I0 detector
If detector
Slits/filter
Sample
It detector
Fluorescence
I0 It
Figure 3 The schematic XAFS experimental setup in a transmission or fluorescence mode.

318 April 2015 | Vol.58 No.4 © Science China Press and Springer-Verlag Berlin Heidelberg 2015
REVIEWS SCIENCE CHINA Materials
soft X-ray region.
Fluorescence yield modeThe requirement of Δμd ≈ 1 in a transmission experiment could be hardly fulfilled for a dilute sample, like the lightly doped samples such as diluted magnetic semiconductors and thin films grown on substrates. Otherwise, the back-ground absorption due to the matrix or substrate would be very large and the transmitted beam intensity would be exponentially attenuated, resulting in very bad quality of the data. To reduce the background absorption, selective-ly recording the atomic-specific signals is a good choice. Among them, monitoring the X-ray fluorescence is the most preferred, since under proper conditions the fluores-cence yield is proportional to the absorption efficient (see Equations (7) and (8) below).
In a fluorescence XAFS measurement, the X-rays emit-ted from the sample will include the fluorescence line of interest, fluorescence lines from other elements in the sam-ple, and both elastic and inelastic (Compton) scattering X-rays. To make good fluorescence XAFS measurements, it is desirable to collect the available fluorescence signal as much as possible. Although in general the fluorescence is emitted isotropically, the scatter is not emitted isotropi-cally because the X-rays from a synchrotron are polarized in the plane of the synchrotron. This means that elastic scatter is greatly suppressed at 90° to the incident beam in the horizontal plane. Therefore, fluorescence detectors are normally placed in the horizontal plane at a right angle to the incident beam, and the sample is placed at 45° to both the incident beam and the fluorescence detector, as shown schematically in Fig. 3. In this geometry, the fluorescence intensity If(E) accepted by a detector with a solid angle Ω/4π is:
0 Af
tot b f
tot b f
( )( )
4 ( ) ( ) 1 exp ( ) ( ) .
I EI EE E
E E d (6)
Here γ is the fluorescence efficiency, d is the sample thickness, Ef is the energy of the fluorescent photons, μA(E) is the absorption from the element of interest, μb(E) is the background absorption coefficient of all the other ele-ments, and μtot(E) = μA(E) + μb(E) is the total absorption coefficient. Because μtot(E) depends on μA(E), in general If is not proportional to μA(E). But in two limiting cases this proportion holds:
Thin samples (typically below 300 nm), in which the series expansion of the exponential in Equation (6) can be truncated at the term linear in d, i.e., −(μtot(E)+μb(Ef))d << 1, 1−exp[−(μtot(E) + μb(Ef))d] ≈ (μtot(E) + μb(Ef))d, and then
f 0 A 0 A( ) ( / 4 ) ( ) ( ) I E I d E I E . (7)
Thick samples with a dilute concentration of the ele-ment of interest, in which μtot(E) >> μA(E) and 1−exp[−(μtot(E)+μb(Ef ))d] ≈ 1. Then Equation (6) reduces to
Af 0 0 A
tot
( )( ) ( / 4 ) ( )
( )
E
I E I I EE . (8)
If neither of the above two conditions was met, a strong suppression of features in the spectrum could be observed. Hence, use of a thick, concentrated sample results in severe-ly distorted XAFS spectra. Such a phenomenon, known as the “self-absorption” effect of the fluorescence data, should be avoided or corrected [41,42].
In the fluorescence mode, to collect only the fluores-cence line of interest, and completely suppress the scatter-ing signals and other fluorescence lines are desirable. This would greatly decrease the background intensity, and in-crease the signal/noise ratio. The intensity of the scattering can be reduced by an order of magnitude by inserting an X-ray filter that has the absorption edge between the flu-orescence line of interest and the elastic scattering peak. A thin metal foil or a homogeneous powder containing the Z−1 element (Z is the atomic number of the element of interest) is conventionally used as a filter. For example, to measure Co K-edge fluorescence XAFS data, a 3- or 6-μm thick Fe2O3 filter is usually used. Besides, to avoid re-radi-ation from the filter itself, a set of slits (Soller slits) is often used to preferentially collect the emission from the sample and block the emission from the filter.
The fluorescence X-ray detector could be a Lytle detec-tor [43], which is also an ionization chamber, but it cannot discriminate the fluorescence of interest from the back-ground. To suppress the background intensity, detectors with energy-discriminating ability, such as high-purity Ge or Si solid-state detector (SSD) and silicon drift diode (SDD) detector, have been developed and used. The ener-gy resolution of these detector is typically in the range of 150−200 eV at 6 keV, as a result of a balance between the counting rate and the background removal. The maximum counting rate of these detectors is limited by the detector electronics, which can be enhanced by an order of magni-tude by assembling multiple detector elements with a close packing geometry. The dilute limit of the fluorescence XAFS measurements is determined by the detector count-ing rate and the incident beam intensity. A state-of-the-art Ge pixel array detector (PAD) with 100 segments has been developed to gain high throughput measurement of fluo-rescence yield by Oyanagi et al. [44]. Because both the inci-dent and the detected signals in the fluorescence mode are penetrating X-rays, fluorescence XAFS is the most suitable choice to study bulk samples. It could also be a surface-sen-

April 2015 | Vol.58 No.4 319© Science China Press and Springer-Verlag Berlin Heidelberg 2015
SCIENCE CHINA Materials REVIEWS
sitive method by using a grazing-incidence geometry [45].
EXAFS data analysisThe aim of EXAFS data processing and analysis is to ex-tract structural parameters such as coordination numbers, interatomic distances, disorder degrees and sometimes, types of atoms, in various coordination shells for an “un-known” sample. The accuracy of EXAFS in obtaining these structural information depends heavily on the standard phase-shift and the amplitude functions which are derived from either experimental reference compounds or theo-retical calculations. In general, the EXAFS data analysis procedure consists of the following steps: deglitching, pre-edge background removal, normalization, conversion to
k-space, Fourier transform to R-space and reverse Fourier transform (Fig. 4). The order of these steps is not critical and not all the steps are necessary. In the following we will take the EXAFS spectrum of Cu foil as an example to show this general procedure in detail, addressing some points that need special attention.
Deglitching The raw EXAFS spectra sometimes contain abnormally sharp data points called “glitches”. Their ori-gin might be diffractions from the crystal monochromator or from the single crystal samples (including crystal sub-strates), or multi-electron excitations. These glitches might be many times larger than the real EXAFS signal and can cause “spectral leakage” in the Fourier transform curves, and must be removed before further processing. The com-
0 2 4 6 8 10
200
400
600
800
1000
1200
2 4 6 8 10 12 14 16
20
10
0
10
20
8800 9200 9600 10000
0.4
0.0
0.4
0.8
1.2
8800 9200 9600 10000
0.0
0.4
0.8
1.2
9200 9600 100000.6
0.8
1.0
1.2
2 4 6 8 10 12 14 1630
20
10
0
10
20
30
R (Å) k (Å 1)
k (Å 1)
f Data Fit
e
dc
b
Victoreen Modified Victoreen
a
E 0
μ (E
) (a.
u.)
μ (E
) (a.
u.)
μ (E
) (a.
u.)
|FT
(k 3
(k))
| (a.
u.)
k 3(k
) (a.
u.)
k 3(k
) (a.
u.)
E (eV)
E (eV) E (eV)
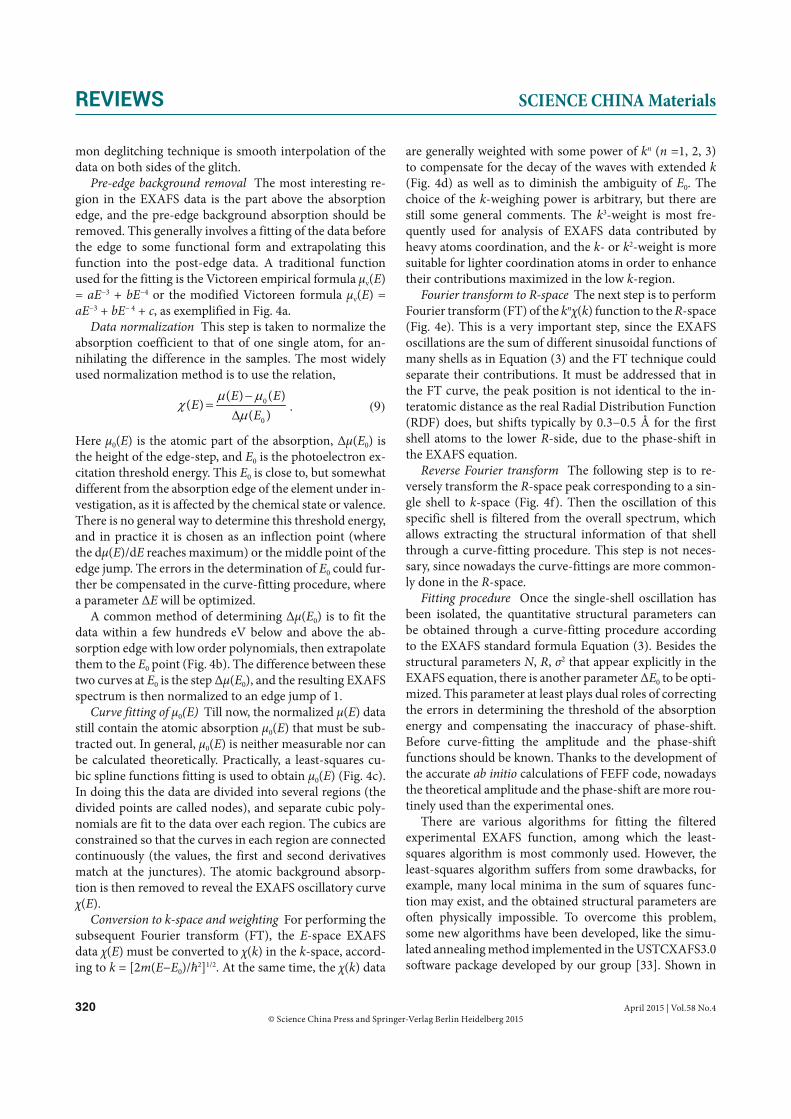
Figure 4 Typical EXAFS data processing and analysis procedure: (a) pre-edge background removal, (b) normalization, (c) curve fitting of μ0, (d) con-version to k-space and weighting, (e) Fourier transform to R-space, and (f) reverse Fourier transform and fitting in the k-space.
320 April 2015 | Vol.58 No.4 © Science China Press and Springer-Verlag Berlin Heidelberg 2015
REVIEWS SCIENCE CHINA Materials
mon deglitching technique is smooth interpolation of the data on both sides of the glitch.
Pre-edge background removal The most interesting re-gion in the EXAFS data is the part above the absorption edge, and the pre-edge background absorption should be removed. This generally involves a fitting of the data before the edge to some functional form and extrapolating this function into the post-edge data. A traditional function used for the fitting is the Victoreen empirical formula μv(E) = aE−3 + bE−4 or the modified Victoreen formula μv(E) = aE−3 + bE− 4 + c, as exemplified in Fig. 4a.
Data normalization This step is taken to normalize the absorption coefficient to that of one single atom, for an-nihilating the difference in the samples. The most widely used normalization method is to use the relation,
0
0
( ) ( )( )
( )E E
EE
. (9)
Here μ0(E) is the atomic part of the absorption, Δμ(E0) is the height of the edge-step, and E0 is the photoelectron ex-citation threshold energy. This E0 is close to, but somewhat different from the absorption edge of the element under in-vestigation, as it is affected by the chemical state or valence. There is no general way to determine this threshold energy, and in practice it is chosen as an inflection point (where the dμ(E)/dE reaches maximum) or the middle point of the edge jump. The errors in the determination of E0 could fur-ther be compensated in the curve-fitting procedure, where a parameter ΔE will be optimized.
A common method of determining Δμ(E0) is to fit the data within a few hundreds eV below and above the ab-sorption edge with low order polynomials, then extrapolate them to the E0 point (Fig. 4b). The difference between these two curves at E0 is the step Δμ(E0), and the resulting EXAFS spectrum is then normalized to an edge jump of 1.
Curve fitting of μ0(E) Till now, the normalized μ(E) data still contain the atomic absorption μ0(E) that must be sub-tracted out. In general, μ0(E) is neither measurable nor can be calculated theoretically. Practically, a least-squares cu-bic spline functions fitting is used to obtain μ0(E) (Fig. 4c). In doing this the data are divided into several regions (the divided points are called nodes), and separate cubic poly-nomials are fit to the data over each region. The cubics are constrained so that the curves in each region are connected continuously (the values, the first and second derivatives match at the junctures). The atomic background absorp-tion is then removed to reveal the EXAFS oscillatory curve χ(E).
Conversion to k-space and weighting For performing the subsequent Fourier transform (FT), the E-space EXAFS data χ(E) must be converted to χ(k) in the k-space, accord-ing to k = [2m(E−E0)/ħ2]1/2. At the same time, the χ(k) data
are generally weighted with some power of kn (n =1, 2, 3) to compensate for the decay of the waves with extended k (Fig. 4d) as well as to diminish the ambiguity of E0. The choice of the k-weighing power is arbitrary, but there are still some general comments. The k3-weight is most fre-quently used for analysis of EXAFS data contributed by heavy atoms coordination, and the k- or k2-weight is more suitable for lighter coordination atoms in order to enhance their contributions maximized in the low k-region.
Fourier transform to R-space The next step is to perform Fourier transform (FT) of the knχ(k) function to the R-space (Fig. 4e). This is a very important step, since the EXAFS oscillations are the sum of different sinusoidal functions of many shells as in Equation (3) and the FT technique could separate their contributions. It must be addressed that in the FT curve, the peak position is not identical to the in-teratomic distance as the real Radial Distribution Function (RDF) does, but shifts typically by 0.3−0.5 Å for the first shell atoms to the lower R-side, due to the phase-shift in the EXAFS equation.
Reverse Fourier transform The following step is to re-versely transform the R-space peak corresponding to a sin-gle shell to k-space (Fig. 4f). Then the oscillation of this specific shell is filtered from the overall spectrum, which allows extracting the structural information of that shell through a curve-fitting procedure. This step is not neces-sary, since nowadays the curve-fittings are more common-ly done in the R-space.
Fitting procedure Once the single-shell oscillation has been isolated, the quantitative structural parameters can be obtained through a curve-fitting procedure according to the EXAFS standard formula Equation (3). Besides the structural parameters N, R, σ2 that appear explicitly in the EXAFS equation, there is another parameter ΔE0 to be opti-mized. This parameter at least plays dual roles of correcting the errors in determining the threshold of the absorption energy and compensating the inaccuracy of phase-shift. Before curve-fitting the amplitude and the phase-shift functions should be known. Thanks to the development of the accurate ab initio calculations of FEFF code, nowadays the theoretical amplitude and the phase-shift are more rou-tinely used than the experimental ones.
There are various algorithms for fitting the filtered experimental EXAFS function, among which the least-squares algorithm is most commonly used. However, the least-squares algorithm suffers from some drawbacks, for example, many local minima in the sum of squares func-tion may exist, and the obtained structural parameters are often physically impossible. To overcome this problem, some new algorithms have been developed, like the simu-lated annealing method implemented in the USTCXAFS3.0 software package developed by our group [33]. Shown in

April 2015 | Vol.58 No.4 321© Science China Press and Springer-Verlag Berlin Heidelberg 2015
SCIENCE CHINA Materials REVIEWS
Table 1 are the structural parameters of Cu foil extracted from EXAFS fitting with USTCXAFS3.0 as an example.
For an EXAFS spectrum with a good signal/noise ratio, typically the accuracy of the first-shell structural parame-ter determination can be: interatomic distance R, ±0.01 Å or better; coordination number N, within ±10%; and De-bye-Waller factor σ2 in the Gaussian approximation, within ±0.0005 Å2. For higher-shells, the accuracy of the obtained structural parameters is usually lower. In practice, one problem in the multi-shell fitting is the correlation among various parameters. For instance, both N and σ2 are relat-ed to the oscillation amplitude and hence are strongly cor-related; if both are treated as free parameters, their accura-cy would be decreased. It often occurs that when too many parameters are to be fitted, the correlations may force the fitting results to converge on values without physical mean-ing. Therefore, reasonable constraints between parameters are necessary.
XAFS APPLICATIONS IN NANOMATERIALSThe XAFS technique, due to its element-specific feature and powerful probing ability for atomic/electronic struc-tures in condensed matter, has been applied extensively in nanomaterials fields. The following subsections will be fo-cused on the applications of XAFS to the study of various nano-structured materials. They cover metal and semicon-ductor nanoparticles and catalysts, core/shell structures, ultrathin nanosheets, as well as the in-situ probing of the nucleation and the growth processes of nanomaterials and the studies of nanostructured catalysts under operando
conditions. The content will be arranged according to the materials systems, with focus on the XAFS-revealed atomic and electronic structural features that play important roles in understanding the structure-function relationship.
Metal nanocrystals and nanoclustersMonodisperse nanocrystals have fascinating size-depen-dent optical, electronic, catalytic and chemical properties which make them very promising in the development of new generations of catalysts, sensors, and optoelectronic devices [46–49]. To understand the interplay between the size and the surface effects that determines the structure and the electronic properties of gold nanocrystals, Zhang and Sham [50] conducted a study on a series of alkanethi-ol-capped Au nanocrystals prepared by the colloidal syn-thesis techniques in the presence of thiol. The size of the thiol-capped nanocrystals were determined by the ratio of the Au precursor (HAuCl4) and the thiol; Au:S ratios of 1:3, 1:1, and 6:1 yielded nanocrystals of 1.6, 2.4, and 4.0 nm, respectively. The Au L3-edge EXAFS data show a size-de-pendent lattice contraction, as apparent in the reverse Fourier transform curves of the first Au-Au pairs where the oscillation becomes progressively farther apart as the nanocrystal size decreases (Fig. 5a). Further quantitative results indicate the contractions of 0.7%, 1.1%, and 1.4% relative to the bulk for the 4.0, 2.4, and 1.6 nm nanocrys-tals, respectively. The EXAFS data also show a reduction in coordination number and increasing disorder (less intense and broad oscillations).
The normalized Au L3-ed ge XANES of the three nano-crystals and Au metal (bulk) show some interesting fea-tures (Fig. 5b). First, all nanocrystals’ spectra exhibit the same line shapes as that of Au metal albeit with a significant broadening, indicating their Au bulk-like environment but with a significant disorder. Second, the white-line intensity increases with the decreasing size of the nanocrystals, sug-gesting an increase in d-hole population (7.2%, 9.0%, and 11.2% relative to the Au metal) with decreased particle size,
Table 1 The structure parameters of Cu foil from a curve fitting
Parameter Real value Fitting resultR (Å) 2.55 2.55 0.01
N 12 12.0 0.4σ2 (Å2) – 0.0086 0.0003E0 (eV) – 4.4 0.5
(k)k
2
Nor
mal
ized
yie
ld (a
.u.)
ba
11.90 11.92 11.94 11.96 11.983 5 7 9 11 13 15
1
0
1
0
1.6 nm2.4 nm4.0 nmFoil
Foil4.0 nm2.4 nm1.6 nm
FT
EXAFS
Au L3-edge
0 2 4 61.6 nm
Foil
Au-Au
x2
S-Au
k (Å 1) Photon energy (keV)
Figure 5 (a) Reverse Fourier transform curves of the nearest R-space Au−Au coordination peaks. The inset compares the Fourier transformed k2χ(k) functions of the 1.6 nm nanocrystals and Au foil. (b) Au L3-edge XANES of the nanocrystals and Au foil. Reprinted with permission from Ref. [50]. Copyright 2003, American Physical Society.

322 April 2015 | Vol.58 No.4 © Science China Press and Springer-Verlag Berlin Heidelberg 2015
REVIEWS SCIENCE CHINA Materials
in good agreement with electronegativity considerations. The implication of these observations is discussed in terms of the interplay of quantum-size and surface effect. It sug-gests that control over the balance between the size and the nature of the capping molecules could afford some degree of tuning the electronic properties of Au nanocrystals.
Supported metal nanoparticles are widely used as cata-lysts, whose activity and selectivity are determined by the chemical and structural nature of the catalytically active surface sites. To addresses the structural, dynamic, and electronic features exhibited in a highly prototypical cat-alytic system, Sanchez and coworkers [51] studied γ-Al2O3 supported Pt nanoparticle catalysts. By collecting EXAFS data for the different-sized (ranging from 0.9 to 2.9 nm) samples at the same temperature (Fig. 6a) and the data for a given sample at different temperatures (Fig. 6b), they could discriminate the effects of temperature and particle size on the structural dynamics. The sensitivity to nanoparticle size therefore permits the extraction of quantitative infor-mation about particle sizes based on the obtained coordi-nation numbers, which is consistent with the average parti-cle sizes obtained by TEM.
A full comparison of the temperature dependence of the nearest Pt−Pt bond lengths for all three samples mea-
sured under He (Fig. 6c) reveals that the subnanometer Pt/γ-Al2O3 sample exhibits a dramatically nonbulk-like nature: it possesses marked relaxations of the Pt−Pt bond distances, negative thermal expansion (NTE) with an av-erage linear thermal expansion coefficient of (−2.4 ± 0.4) × 10−5 K−1. The temperature-dependence of the EXAFS Debye-Waller factors σ2 in Fig. 6d indicates that the static disorder σs
2 and the Einstein temperature increase rapid-ly as the particle size decreases. Adsorption of hydrogen on the sub-nanometer clusters leads to an increase of the Pt−Pt bond lengths and significant attenuation of the dis-order. Oxidation of these same clusters has the opposite effect, leading to an increase in Pt−Pt bond strain and the subsequent enhancement in nonbulk-like thermal proper-ties. This study highlights that the charge exchange due to both metal-support and metal-adsorbate interactions plays an important role in mediating the structural dynamics of the supported nanoscale metal catalysts. Later, the same group studied the influence of adsorbates on the electronic structure, bond strain of the ~1.0 nm Pt/γ-Al2O3 catalyst [52]. They demonstrated that the Pt−Pt bonding in these small clusters is responsive to the presence of adsorbates, exhibiting pronounced coverage-dependent strains, with concomitant modifications of their electronic structures.
0.04
0.02
0.00
0.02
0.04
0.04
0.02
0.00
0.02
0.04
2.80
2.78
2.76
2.74
2.72
2.70
2.68
2.64
0.012
0.010
0.008
0.006
0.004
0.002
0.000
200 400 600 800
0 200 400 600
2 4 6 8 10 12 14
2 4 6 8 10 12 14
200 K298 K423 K573 K
Foil2.9 nm Pt/ -Al2O31.1 nm Pt/ -Al2O30.9 nm Pt/ -Al2O3
Foil
Foil
2.9 nm
2.9 nm
1.1 nm
1.1 nm
0.9 nm
0.9 nm
a c
b d
k (Å 1)
k (Å 1)
(k)
2 (Å2 )
1st N
eigh
bor d
ista
nce
(Å)
(k)
Temperature (K)
Temperature (K)
Figure 6 (a) EXAFS χ(k) functions for different sized Pt/γ-Al2O3 samples. (b) EXAFS χ(k) functions for a 2.9-nm Pt/γ-Al2O3 sample at different temperatures. (c) Thermal dependence of the Pt−Pt bond lengths for different sized Pt/γ-Al2O3 nanoparticles, and (d) temperature-dependence of the Debye-Waller factors for the different sized Pt/γ-Al2O3 nanoparticles, plotted with their respective Einstein models (lines). Reprinted with permission from Ref. [51]. Copyright 2009, American Chemical Society.

April 2015 | Vol.58 No.4 323© Science China Press and Springer-Verlag Berlin Heidelberg 2015
SCIENCE CHINA Materials REVIEWS
Moreover, the Pt−Pt bond strains within the clusters could be relaxed by H2 and CO adsorbates.
Ligand-protected noble metal nanoclusters (Au, Pt, Ag, Cu, etc.) are a new type of nanomaterials that have been intensely studied in recent years [53–56]. The ultra-small size of these nanoclusters (typically < 2 nm, including tens of metal atoms) make them act as “superatoms” and induce molecular-like properties and distinctive quantum confine-ment effects, such as discrete electronic structure, highest occupied molecular orbital-lowest unoccupied molecular orbital (HOMO–LUMO) electronic transition, enhanced photoluminescence, and so on. All these unique properties of the nanoclusters are fundamentally different from those of their larger nanocrystals counterparts in which the op-tical properties are dominated by plasmon excitation and possess a collective nature. The fascinating physicochemi-cal properties of the nanoclusters render them with prom-ising applications in a variety of areas such as photonics, catalysis, sensing, and medicine. To understand the fun-damentally important correlation between the electronic structure and the catalytic activity of Au25 clusters, Liu et al. [57] studied two different Au25 clusters, i.e., mixed-ligand (thiol and phosphine) [Au25(PPh3)10(SC12H25)5Cl2]2+ clus-ters (called Au25-bi) with bi-icosahedral structure and thi-ol-stabilized [Au25(SCH2CH2Ph)18]− clusters (called Au25-i) with icosahedral core-shell structure. They investigated the catalytic activity of the two clusters for styrene oxidation reaction and correlated their electronic structure informa-tion with their catalytic activity by using a combination of XAFS and ultraviolet photoemission spectroscopy (UPS). Compared with bulk Au, the XANES spectra (Fig. 7a) of both Au25 clusters exhibit higher white-line intensity, sug-gesting the higher d-band vacancies in the clusters due to the Au→S charge transfer. The ligands then not only act as colloidal stabilizers, but also as d-band electron acceptor for Au atoms. Seen from the EXAFS spectra in Fig. 7b, the Au25-bi clusters have a higher first-shell Au coordination
number than Au25-i, in spite of their same number of Au core atoms in both clusters. The more electropositive na-ture of clusters resulted in the formation of more oxidative products in the styrene oxidation reaction, thus correlating the electronic and atomic structure of the clusters with cat-alytic activity.
Oxide nanoparticlesHydrogen is a potential solution for satisfying many of our energy needs in the future, and it is mainly produced from the reforming of crude oil, coal, natural gas, wood, organic waste, and biomass. However, CO (1−10% content) present in the reformed fuel degrades the performance of the Pt electrode used in the fuel cell systems. To produce clean hydrogen, the water-gas shift (WGS, CO + H2O → CO2 + H2) reaction is a critical industrial process. It is known that metal-oxide nanoparticles are very promising new candidates for high WGS activity, but the design and op-timization of these nano-catalysts are hindered by a lack of knowledge about basic questions regarding the nature of the active sites and the reaction mechanism. The nature of the active phases in metal/oxide WGS catalysts and the WGS reaction mechanism are subjects under active debate. To address these issues, in-situ techniques can be quite use-ful.
Inverse model catalysts of CeO2 nanoparticles support-ed on Au(111) or Cu(111) have shown high catalytic per-formance in the WGS reaction than the standard Cu/CeO2 catalysts. Barrio and coauthors [58] used in-situ XRD and XAFS techniques to monitor the crystalline phases chang-es and the oxidation states of the CeO2/CuO-Cu catalyst during the WGS reaction, in order to the correlate its struc-ture with activity. Fig. 8a displays the in-situ Cu K-edge XANES spectra of the CeO2/CuO catalyst during the WGS reaction at different temperatures. The XANES spectrum of the starting material demonstrates the features of CuO, and these features are reduced with increasing tempera-
|(R
)| (Å
3 )
Nor
mal
ized
inte
nsity
(a.u
.)
R (Å)Photon energy (eV)11880 11900 11920 11940 11960 11980 12000 0 1 2 3 4 5
Au foilAu25-iAu25-bi
Au foilAu25-iAu25-bi
ba
Figure 7 (a) Normalized Au L3-edge XANES spectra of Au25-bi and Au25-i clusters. (b) Fourier transformed EXAFS data of Au25-i and Au25-bi clusters. Reprinted with permission from Ref. [57]. Copyright 2013, Wiley-Blackwell.

324 April 2015 | Vol.58 No.4 © Science China Press and Springer-Verlag Berlin Heidelberg 2015
REVIEWS SCIENCE CHINA Materials
ture. At 200°C, the spectral profile for Cu2O became evi-dent. At 250°C, the spectral features of XANES matched those of the Cu bulk, suggesting the complete reduction to Cu(0) metal in CeO2/CuO under WGS reaction condi-tions. The Ce L3-edge XANES was also measured during the WGS reaction as shown in Fig. 8b together with spectra for bulk Ce4+ and Ce3+ references. The changes in the spec-tral features with increasing temperature show that CeO2 was partially reduced under WGS reaction conditions, ac-companied by the continuously increased amount of ox-ygen vacancies and Ce3+ cations. The presence of oxygen vacancies in the ceria lattice is an important property of the active phase of the catalyst, and the catalytic process is likely to occur at the interface of the metallic copper with partially reduced ceria.
Patlolla and cooperators [59] combined XAFS, XRD, and Raman spectroscopy to study the structural and com-positional changes of the partially reduced Fe2O3 and 3% chromium oxide-modified Fe2O3 (3% Cr2O3/Fe2O3) cata-lysts before, during, and after the WGS reaction. The use of these methods is advantageous since they could provide complementary information on the structure and valence state of Fe2O3 during reaction. Fig. 9 shows a series of XANES, and EXAFS spectra at Fe K-edge collected after exposing Fe2O3 to O2 at room temperature (RT) and 400°C, during the WGS reaction at 400°C and in the wet gas meter (WGM) flow condition at RT. The XANES spectra show that the Fe K-edge positions measured in O2 flow at RT and 400°C are similar, indicating the preservation of the charge state of Fe. However, in WGS conditions at 400°C, the edge is shifted to the lower energy compared with its oxidized state prior to the WGS reaction, implying the partial reduc-tion of Fe from Fe2O3 to Fe3O4.
The corresponding EXAFS data in Fig. 9b demonstrate significant changes in the local structural environment of Fe in both catalysts, and the changes are markedly different
between the two systems. The first nearest Fe−O peak lo-cated between 1−2.0 Å decreases evidently after the WGS reaction. This reduction can be interpreted either by the de-creased Fe−O coordination number (CN) or the increased bond length disorder or both, but the former factor cannot be too significant due to the similar Fe−O coordination numbers in purely octahedrally coordinated α-Fe2O3 (CN = 6) to a mixture of two-thirds Fe2O3 and one-third tetra-hedrally coordinated Fe3O4 (CN = 5.34). The second peak corresponds to the contributions of Fe−Fe bonds. Com-pared with the data under the WGM conditions, the Fe−Fe peak intensity shows a most notable decrease under O2 conditions at the same temperature of 400°C. Such behav-ior is consistent with the large disorder in Fe environment under O2 prior to the onset of the WGS reaction. The in-terpretation of the EXAFS data is also supported by in situ XRD results and Raman spectroscopy. For the 3% Cr2O3/Fe2O3 sample (Fig. 9c), the stronger reduction of the peak intensity compared with the Fe2O3 sample indicates a more heterogeneous mixture of different Fe oxide phases with different Fe−Fe distances. Combining multiple techniques reveals the role of Cr in stabilizing the low-temperature γ-Fe2O3 phase, the nature of the disordered phase in the active state of the catalysts, and the possible deactivation mechanism.
Semiconductor quantum structures Artificially ordered Ge/Si thin films and superlattices pos-sess exciting electrical and optical properties that open a doorway to band-structure engineering by the formation of strained epitaxial layer of Si and Ge. A clean Si(001) surface shows a (2×1) reconstruction and shortened interatomic distance than the counterpart in bulk Si. For Ge overlayers grown on Si(001), the formation of the dimmer and the in-teratomic distance are more complicated, depending on the number of Gen overlayers. Oyanagi and colleagues [60,61]
Nor
mal
ized
(E
)
Nor
mal
ized
(E
)
Nor
mal
ized
(E
)
E (eV)E (eV)
Ce L3 edgeCe K-edge ba
1.2
0.8
0.4
0.0
3
2
1
08960 9000 9040 9080 5700 5720 5740 5760 5780 5800 5820
Ce+3
Ce+4
Ce-25°CCe-150°CCe-200°CCe-250°CCe-300°C
Cu°Cu-RTCu-100°CCu-150°CCu-200°CCu-250°C
2.0
1.5
1.0
0.5
5720 5730 5740
Figure 8 (a) Cu K-edge XANES spectra collected under WGS reaction conditions at various temperatures. (b) Ce L3-edge XANES collected under WGS conditions at various temperatures. Reprinted with permission from Ref. [58]. Copyright 2010, American Chemical Society.

April 2015 | Vol.58 No.4 325© Science China Press and Springer-Verlag Berlin Heidelberg 2015
SCIENCE CHINA Materials REVIEWS
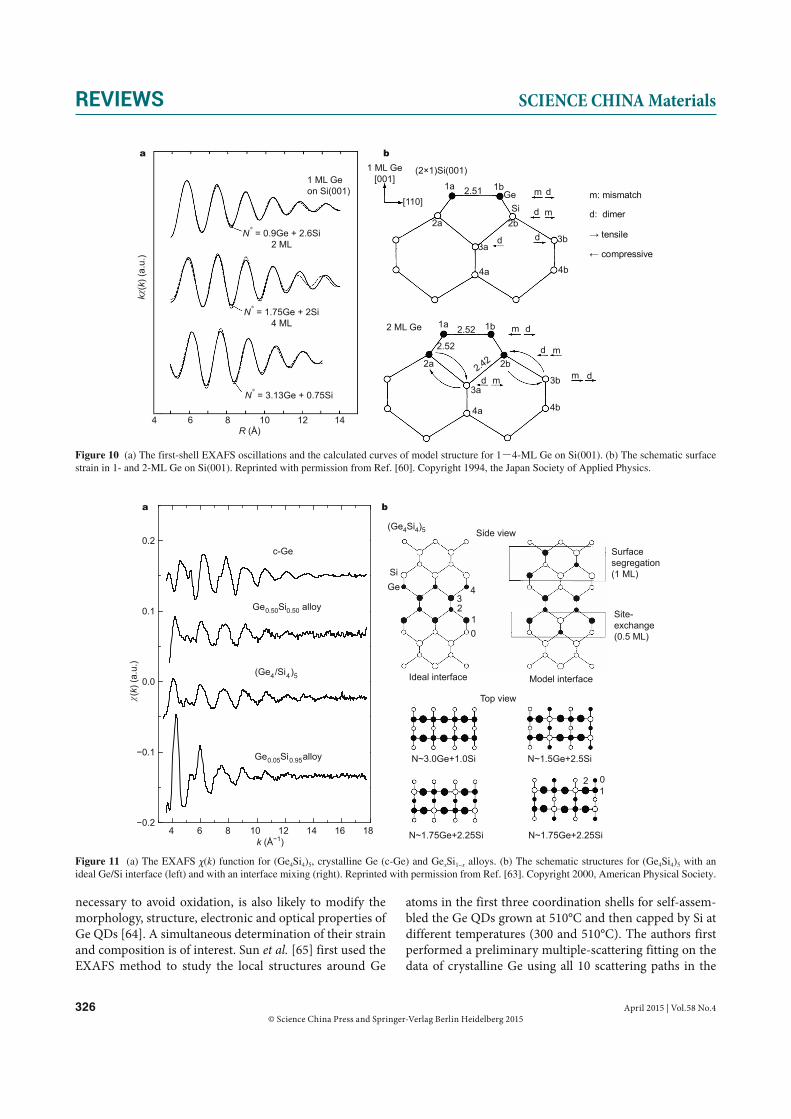
studied the local structure of Ge epitaxial overlayers with Ge thickness from 1 to 4 monolayers (ML) by fluorescence XAFS in the grazing incidence geometry. The reverse Fou-rier transformed first-shell Ge K-edge EXAFS oscillations are displayed in Fig. 10. The obtained Ge–Ge distance is 2.51 ± 0.01 Å and Ge–Si distance is 2.40 ± 0.01 Å for
1-ML Ge on Si(001), indicating that 1-ML Ge overlayer on Si(001) forms an elongated dimmer structure. It is interest-ing that the Ge–Ge distance is significantly longer than the interatomic distance 2.45 Å in Ge bulk, in spite of the uni-axial strain due to lattice mismatch which should shorten the bond length within a simple elastic deformation model. These bond length values remain almost unchanged within ±0.01 Å for 2-ML Ge on Si(001). However, upon increasing the number of Gen overlayers to n = 4, the Ge–Ge distance is reduced to 2.47 ± 0.01 Å and the Ge–Si distance is 2.38 ± 0.01 Å. Fig. 10b shows the surface strain in 1-ML and 2-ML Ge on Si(001) schematically. Stress components are indi-cated by the directions of arrows. Strains are induced by the surface reconstruction (dimmer strain) and the atomic size effect (mismatch strain). A possible channel of atomic migrations is indicated by arrows in the bottom figure.
A (Ge4Si4)5 monolayer strained-layer superlattice grown on Si(001) substrate shows strong optical transitions at 0.75, 1.25, and 2.31 eV unique to the superlattice period, found neither in constituent crystals nor in the Ge0.5Si0.5 alloy [62]. Using grazing-incidence fluorescence EXAFS, Wei and colleagues [63] studied the local structure of (Ge4
Si4)5 strained-layer superlattice. EXAFS spectra for both (Ge4Si4)5 and Ge0.5Si0.5/Si(001) have an intermediate profile, suggesting that these two samples are characterized by an almost equal amount of Ge and Si scatterers (Fig. 11a). The least-squares curve-fitting results indicate that the bond lengths for (Ge4Si4)5 are RGe−Ge = 2.42 ± 0.01 Å, RGe−Si = 2.38 ± 0.01 Å, and the coordination numbers are NGe = 1.8 and NSi = 2.2, respectively. RGe−Si = 2.38 Å in (Ge4Si4)5 is identical with the value for the dilute Ge atoms doped into Si crystal, suggesting that the bond-length compression takes the up-per limit of the isotropic deformation. The observed RGe−Ge and RGe−Si values take slightly larger values than the calcu-lated values for the model (Ge4Si4)5 superlattice. The over-estimation of bond-length compression may occur since most of the model structures do not take interface mixing and non-uniform longitudinal displacement into account. Based on these results, it may be concluded that the lattice matching is achieved by tetragonal deformation via bond bending but the Ge layer is highly compressed. Fig. 11b il-lustrates the schematic structures for (Ge4Si4)5 with an ideal Ge/Si interface and with an interface mixing. In the latter model, the Ge overlayer is assumed to have 0.5 ML site ex-change upon the deposition and 1 ML segregation upon Si overlayer growth.
The self-assembled Ge/Si quantum dots (QDs) is also an interesting research topic. Although the Stranski-Krastanov (S-K) mode is commonly used to describe the growth of Ge QD on Si, due to the intermixing between Ge and Si, the real formation of Ge QDs is much more complicated. Moreover, the capping of the Ge islands by Si, which is
c
b
a1.0
0.8
0.6
0.4
0.2
0.0
1.0
0.8
0.6
0.4
0.2
0.0
7110 7115 7125 71357120 7130
1.5
1.0
0.5
0.0
0 2 4 6 8
0 2 4 6 8
r (Å)
r (Å)
X-ray energy (eV)
Nor
mal
ized
abs
orpt
ion
coef
ficie
ntFT
mag
nitu
de (Å
3 )FT
mag
nitu
de (Å
3 )
Fe2O3 catalyst
Fe2O3 catalyst
3% Cr2O3/Fe2O3 catalyst
Fe+3
Fe+3
O2 at RTO2 at 400°CWGM at 400°CWGM at RT
O2 at RTO2 at 400°CWGM at 400°CWGM at RT
O2 at RT
WGM at RT
Figure 9 (a) Normalized XANES spectra, and (b) the corresponding EXAFS data at Fe K-edge collected after exposing Fe2O3 to O2 at RT and 400°C, during the WGS reaction at 400°C and in the WGM flow condition at RT. (c) Fe K-edge EXAFS spectra for 3% Cr2O3/Fe2O3 cata-lysts collected at room temperature in the O2 and WGM flow conditions. Reprinted with permission from Ref. [59]. Copyright 2012, American Chemical Society.
326 April 2015 | Vol.58 No.4 © Science China Press and Springer-Verlag Berlin Heidelberg 2015
REVIEWS SCIENCE CHINA Materials
necessary to avoid oxidation, is also likely to modify the morphology, structure, electronic and optical properties of Ge QDs [64]. A simultaneous determination of their strain and composition is of interest. Sun et al. [65] first used the EXAFS method to study the local structures around Ge
atoms in the first three coordination shells for self-assem-bled the Ge QDs grown at 510°C and then capped by Si at different temperatures (300 and 510°C). The authors first performed a preliminary multiple-scattering fitting on the data of crystalline Ge using all 10 scattering paths in the
4 6 8 10 12 14R (Å)
k (k
) (a.
u.)
1 ML Geon Si(001)
N* = 0.9Ge + 2.6Si2 ML
N* = 1.75Ge + 2Si4 ML
N* = 3.13Ge + 0.75Si
1 ML Ge[001]
[110]
(2×1)Si(001)
1a 2.51 1bGe
Si
m d
d m2b
dd3a
3b
4b4a
2a
2 ML Ge 1a 2.52 1b m d
md
m d3b
4b
2b
3a
4a
d m
2a 2.422.52
m: mismatch
d: dimer
tensile
compressive
a b
Figure 10 (a) The first-shell EXAFS oscillations and the calculated curves of model structure for 1-4-ML Ge on Si(001). (b) The schematic surface strain in 1- and 2-ML Ge on Si(001). Reprinted with permission from Ref. [60]. Copyright 1994, the Japan Society of Applied Physics.
4 6 8 10 12 14 16 180.2
0.1
0.0
0.1
0.2
Ge0.05Si0.95 alloy
(Ge4/Si4)5
Ge0.50Si0.50 alloy
c-Ge
(k) (
a.u.
)
k (Å 1)
Side view
Top view
Ideal interface Model interface
Surfacesegregation(1 ML)
Site-exchange(0.5 ML)
SiGe
01
23
4
(Ge4Si4)5
N~3.0Ge+1.0Si N~1.5Ge+2.5Si
N~1.75Ge+2.25Si N~1.75Ge+2.25Si
01
2
a b
Figure 11 (a) The EXAFS χ(k) function for (Ge4Si4)5, crystalline Ge (c-Ge) and GexSi1−x alloys. (b) The schematic structures for (Ge4Si4)5 with an ideal Ge/Si interface (left) and with an interface mixing (right). Reprinted with permission from Ref. [63]. Copyright 2000, American Physical Society.

April 2015 | Vol.58 No.4 327© Science China Press and Springer-Verlag Berlin Heidelberg 2015
SCIENCE CHINA Materials REVIEWS
first three shells. It is found that the experimental EXAFS data for the diamond structure can be well reproduced by considering only the single-scattering paths plus one domi-nant multiple-scattering (MS) path Ge0→B1→B2→Ge0. Based on the structure model of the Ge QDs (inset of Fig. 12), EXAFS contributions from the environments around Ge in the islands and the wetting layer were separated. The fit-ting was done in R-space for the first three shells as shown in Fig. 12. From the coordination numbers and consid-ering the interface effect, the average Ge concentrations in the islands were estimated to be ~0.9 and ~0.4 for the QDs capped at 300 and 510°C, respectively, demonstrating much stronger Ge/Si intermixing at the capping tempera-ture of 510°C than at 300°C. For the Ge QDs capped by Si at 300°C, from the first shell bond lengths RGe−Ge (2.43 Å) and RGe−Si (2.37 Å) as well as the estimated in-plane and out-of-plane bond angle distortion Δθ (–2.0°) and Δθ'(1.0°) calculated by the elastic theory, the local strain in the near-est neighbor around Ge is mainly accommodated by the bond bending.
Magnetic semiconductor nanostructuresThe rapidly developing field of spintronics requires the si-multaneous manipulation of spin and charge [66,67], which
could provide enhanced functionality and performance in traditional charge-based electronics. One of the promis-ing material candidates for the semiconductor spintronics is diluted magnetic semiconductor (DMS) which refer to semiconductor substitutionally incorporated by transi-tion-metal (TM) magnetic ions [68]. A magnetically doped semiconductor could be called a “true” DMS material only when the dopants occupy the substitutional positions in the host, as suggested by the prediction of Dietl et al. [69]. In reality, the doped TM ions could occupy different positions (substitutional sites, interstitials) in the host lattice, or form metallic clusters/ secondary phases [70], all of which exert impacts to the magnetic properties of the DMSs. Therefore, structural studies play an extremely important role in un-derstanding the magnetic nature in DMSs. However, iden-tifying the occupation sites of the TM dopants in DMSs is not a trivial task as there are very few techniques capable of solving this issue. Due to its sensitivity to the local atomic/electronic structures and the element-specificity, XAFS has proved to be a unique technique in identifying the occupa-tion sites and the distribution of the dopants, detecting the presence of metal clusters or secondary phases, as well as identifying the defect types and the dopant valence.
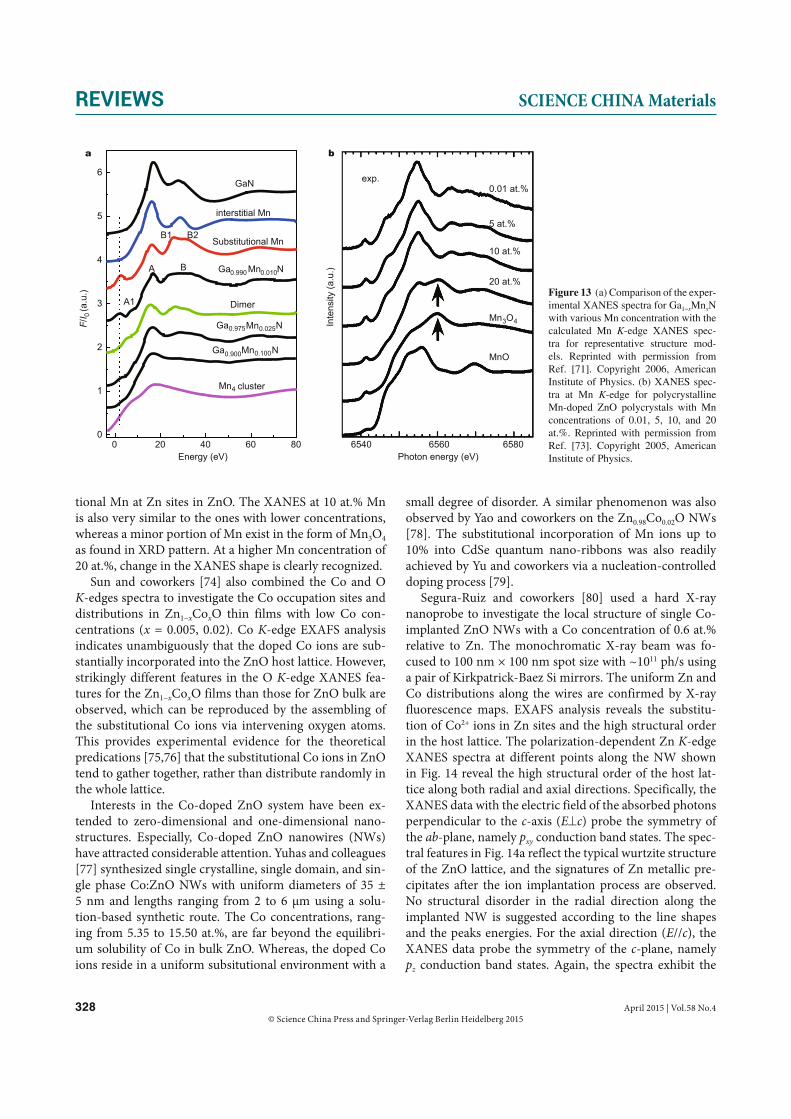
XANES has made a significant contribution to the iden-tification of the occupation sites of TM dopants in DMS materials. Wei and colleagues [71] investigated an Mn-doped GaN system by comparison of experimental and theoretical spectra of XANES. Theoretical XANES spectra of the representative structure models of Mn in GaN lattice were calculated, and compared with the experimental data of 300-nm thick Ga1−xMnxN (x = 0.010, 0.025, 0.10) thin films grown on GaAs(001) substrates using plasma-assist-ed molecular beam epitaxy (Fig. 13a) [72]. It is shown that the substitutional Mn (MnGa) in GaN is characterized by a pre-edge peak at 2.0 eV and a post-edge multiple-scat-tering peak at 29.1 eV. The peaks are shifted in position and dropped in intensity dramatically for the interstitial MnI and MnGa-MnI dimer, and then disappear completely for the metallic Mn clusters. The comparison between the experimental and theoretical XANES spectra indicate that the majority of Mn atoms locate at the MnGa sites in Ga1−x
MnxN with the lowest Mn content (0.010). Upon increas-ing the Mn content to 0.025, a significant fraction of Mn dopants exist in the form of MnGa-MnI dimers. At the high-est Mn doping concentration (0.100), a significant amount of metallic Mn clusters were precipitated. Kunisu et al. [73] also reported a Mn K-edge XANES study on the local en-vironment of Mn dopants in ZnO polycrystals. The spec-tra as shown in Fig. 13b at the Mn concentrations between 0.01 and 5 at.% indicate almost identical features, which could be well reproduced by first-principles spin-polarized density functional theory (DFT) calculations for substitu-
0 1 2 3 4 5 6 7 80
1
2
3
4
5
6
7
8
Ge QDs (300°C capped)
Ge QDs (510°C capped)
Ge0.006Si0.994
c-Ge
20 nm
2 nm
Si cap
InterfaceGe island
GeSi wetting layer
Si(001)
R (Å)
|FT
(k 2
(k))
| (a.
u.)
Figure 12 The Fourier transformed k2χ(k) functions for Ge QDs grown at 510°C and capped by Si at different temperatures: experiment (solid) and fit (open circle). The inset shows the schematic cross-sectional geometry of the Ge QDs.
328 April 2015 | Vol.58 No.4 © Science China Press and Springer-Verlag Berlin Heidelberg 2015
REVIEWS SCIENCE CHINA Materials
tional Mn at Zn sites in ZnO. The XANES at 10 at.% Mn is also very similar to the ones with lower concentrations, whereas a minor portion of Mn exist in the form of Mn3O4 as found in XRD pattern. At a higher Mn concentration of 20 at.%, change in the XANES shape is clearly recognized.
Sun and coworkers [74] also combined the Co and O K-edges spectra to investigate the Co occupation sites and distributions in Zn1−xCoxO thin films with low Co con-centrations (x = 0.005, 0.02). Co K-edge EXAFS analysis indicates unambiguously that the doped Co ions are sub-stantially incorporated into the ZnO host lattice. However, strikingly different features in the O K-edge XANES fea-tures for the Zn1−xCoxO films than those for ZnO bulk are observed, which can be reproduced by the assembling of the substitutional Co ions via intervening oxygen atoms. This provides experimental evidence for the theoretical predications [75,76] that the substitutional Co ions in ZnO tend to gather together, rather than distribute randomly in the whole lattice.
Interests in the Co-doped ZnO system have been ex-tended to zero-dimensional and one-dimensional nano-structures. Especially, Co-doped ZnO nanowires (NWs) have attracted considerable attention. Yuhas and colleagues [77] synthesized single crystalline, single domain, and sin-gle phase Co:ZnO NWs with uniform diameters of 35 ± 5 nm and lengths ranging from 2 to 6 μm using a solu-tion-based synthetic route. The Co concentrations, rang-ing from 5.35 to 15.50 at.%, are far beyond the equilibri-um solubility of Co in bulk ZnO. Whereas, the doped Co ions reside in a uniform subsitutional environment with a
small degree of disorder. A similar phenomenon was also observed by Yao and coworkers on the Zn0.98Co0.02O NWs [78]. The substitutional incorporation of Mn ions up to 10% into CdSe quantum nano-ribbons was also readily achieved by Yu and coworkers via a nucleation-controlled doping process [79].
Segura-Ruiz and coworkers [80] used a hard X-ray nanoprobe to investigate the local structure of single Co- implanted ZnO NWs with a Co concentration of 0.6 at.% relative to Zn. The monochromatic X-ray beam was fo-cused to 100 nm × 100 nm spot size with ~1011 ph/s using a pair of Kirkpatrick-Baez Si mirrors. The uniform Zn and Co distributions along the wires are confirmed by X-ray fluorescence maps. EXAFS analysis reveals the substitu-tion of Co2+ ions in Zn sites and the high structural order in the host lattice. The polarization-dependent Zn K-edge XANES spectra at different points along the NW shown in Fig. 14 reveal the high structural order of the host lat-tice along both radial and axial directions. Specifically, the XANES data with the electric field of the absorbed photons perpendicular to the c-axis (Ec) probe the symmetry of the ab-plane, namely pxy conduction band states. The spec-tral features in Fig. 14a reflect the typical wurtzite structure of the ZnO lattice, and the signatures of Zn metallic pre-cipitates after the ion implantation process are observed. No structural disorder in the radial direction along the implanted NW is suggested according to the line shapes and the peaks energies. For the axial direction (E//c), the XANES data probe the symmetry of the c-plane, namely pz conduction band states. Again, the spectra exhibit the
exp.
6540 6560 6580
Inte
nsity
(a.u
.)
Photon energy (eV)
a b
0.01 at.%
5 at.%
10 at.%
20 at.%
Mn3O4
MnO
0 20 40 60 800
1
2
3
4
5
6
B2B1
BA
A1
Ga0.975Mn0.025N
Ga0.900Mn0.100N
Ga0.990 Mn0.010N
Dimer
interstitial Mn
Substitutional Mn
GaN
F/I 0
(a.u
.)
Energy (eV)
Mn4 cluster
Figure 13 (a) Comparison of the exper-imental XANES spectra for Ga1−xMnxN with various Mn concentration with the calculated Mn K-edge XANES spec-tra for representative structure mod-els. Reprinted with permission from Ref. [71]. Copyright 2006, American Institute of Physics. (b) XANES spec-tra at Mn K-edge for polycrystalline Mn-doped ZnO polycrystals with Mn concentrations of 0.01, 5, 10, and 20 at.%. Reprinted with permission from Ref. [73]. Copyright 2005, American Institute of Physics.

April 2015 | Vol.58 No.4 329© Science China Press and Springer-Verlag Berlin Heidelberg 2015
SCIENCE CHINA Materials REVIEWS
peaks associated to the hexagonal structure, without any evidence of lattice damage along the NW (Fig. 14b).
Core/shell and hybrid nanostructuresIn diluted magnetic semiconductor quantum dots (DMSQDs), the quantum confinement suppresses the fer-romagnetic couplings between the doped magnetic ions. In this size range, introducing extra charge carriers as rou-tinely used for bulk DMSs is not an ideal pathway. To re-alize the ferromagnetic coupling between magnetic ions in DMSQDs still remains rather challenging. Yan and coau-thors [81] proposed that core/shell structure might provide an effective approach to tune ferromagnetic exchange in DMSQDs, because it engineers the energy level of the mag-netic impurity 3d levels relative to the band edge. This idea has been successfully applied to Zn0.96Co0.04O DMSQDs covered by a shell of ZnS or Ag2S.
Experimentally, by the growth of a shell of ZnS or Ag2S around the 5-nm sized Co-doped ZnO QDs cores in an epitaxial-like manner, Zn0.96Co0.04O/ZnS (type-II core/shell) and Zn0.96Co0.04O/Ag2S (inverted core/shell) core/shell structures were synthesized, which were demonstrat-ed to be able to turn the magnetic couplings within the Co-doped ZnO QDs from antiferromagnetic into ferromag-netic. Magnetization measurement results show that the growth of a ZnS shell turns the Co2+–Co2+ magnetic cou-
plings in Zn0.96Co0.04O QDs from antiferromagnetic into ferromagnetic, with a saturation moment as high as 2.8 μB/Co2+. The Zn K-edge XANES spectrum of Zn0.96Co0.04O/ZnS exhibits a similar spectral shape to that of Zn0.96Co0.04O QDs (Fig. 15a), although the white-line peak at ~9673 eV is significantly reduced in intensity (Fig. 15b). They consid-ered several structure models and calculated the Zn K-edge XANES spectra (Fig. 15c). The calculation results suggest that ZnO/ZnS core/shell structure model could reproduce the main spectral features of the experimental data for Zn0.96Co0.04O/ZnS, providing support for the formation of a ZnS layer on the Zn0.96Co0.04O QDs surfaces. From the ZnS/ZnO molar ratio (40:60) obtained from the quanti-tative EXAFS data analysis (Fig. 15d) and considering the particle size (~5 nm), a ZnS shell thickness of about 0.55 nm was estimated. Detailed analysis of EXAFS spectra in Fig. 15e reveals the substitution of Co for Zn sites in all these QDs, ruling out the possibility of forming any Co-re-lated secondary phases. Based on these structure study re-sults, the significantly enhanced saturation magnetic mo-ment of Zn0.96Co0.04O/ZnS (and Zn0.96Co0.04O/Ag2S) QDs is proposed to arise from the modified exchange interactions between the substitutional Co ions.
The same group also used hybrid structure of Zn0.98
Co0.02O QDs and reduced graphene oxide (RGO) to tune the magnetic properties of DMSQDs [82]. They synthe-sized three distinct samples, namely, Zn0.98C o0.02O, Zn0.98-
Co0.02O-RGO and Zn0.98Co0.02O/RGO QDs. Zn0.98Co0.02O/RGO refers to a quasi-core/shell structure in which the Zn0.98Co0.02O cores are almost fully covered by RGO shells, and Zn0.98Co0.02O-RGO means Zn0.98Co0.02O QDs anchored on RGO sheets but not completely wrapped. Magneti-zation measurements show that after covering the RGO shell, the Zn0.98Co0.02O/RGO QDs display a well-defined hysteresis loop, exhibiting a room-temperature ferromag-netic behavior. A similar phenomenon is also observed in Zn0.98Co0.02O-RGO, but its saturation magnetic moment (0.1 μB/Co) is evidently smaller than that (0.3 μB/Co) of Zn0.98Co0.02O/RGO. Fig. 16a displays the Fourier transform of Co K-edge EXAFS k3χ(k) functions for Zn0.98Co0.02O, Zn0.98Co0.02O-RGO and Zn0.98Co0.02O/RGO, which rule out the existence of Co metal and cobalt oxides (like CoO and Co3O4) in the samples. C K-edge XANES measurements (Fig. 16b) show characteristic peaks of C 1s→π* (~285.5 eV) and C 1s→σ* (~292.5 eV) transitions for RGO. Compared with RGO, Zn0.98Co0.02O/RGO hybrid shows a clearly en-hanced intensity of the peak at ~288 eV, most possibly due to the binding of oxygen or other species to the carbon atoms in RGO, suggesting the formation of the interfacial Zn(Co)−O−C bonds (inset of Fig. 16b) in the Zn0.98Co0.02O/RGO hybrid. The Co L2,3-edge XANES spectra of Zn0.98- Co0.02O and Zn0.98Co0.02O/RGO as displayed in Fig. 16c
Point 1
Point 3
Point 2
Nor
mal
ized
μ(E
)
Energy (eV)
E // c
E c
E c
Zn K -edge
E // c
c-axis
k
9640 9660 9680 9700 9720 9740
a
b
Figure 14 Polarization-dependent Zn K-edge XANES spectra of Co-implanted ZnO NWs: (a) Ec, and (b) E//c. Reprinted with permission from Ref. [80]. Copyright 2011, American Chemical Society.

330 April 2015 | Vol.58 No.4 © Science China Press and Springer-Verlag Berlin Heidelberg 2015
REVIEWS SCIENCE CHINA Materials
9680 9720 97600
2
4
6 ZnS
ZnO
a
Model C
Model B
Model A
Zn0.96 Co0.04O
Zn 0.96Co0.04O/ZnS
Energy (eV)
XA
NE
S
Zn K-edge
0 2 4 6
20
40
60
0 2 4 6
20
40
60
80
4 6 8 10 12
9660 9680 97000
1
9660 9680 97000
1
2
e
d
c
ZnO
b
Zn0.96Co0.04O/ZnS
Zn0.96Co0.04O
Zn K-edge
40%ZnS+60%Co:ZnO
ZnS
Distance (Å)
Co K-edge
Zn0.96Co0.04O/Ag2S
Zn0.96Co0.04O/ZnS
Zn0.96Co0.04O
Distance (Å)
ZnO
CoO
Zn0.96Co0.04O/Ag2SZn0.96Co0.04O/ZnS
Zn0.96Co0.04O
K2
(k)
k (Å 1)
ZnO
CoO
Model A
Model B
XA
NE
S
Energy(eV)
Zn0.96Co0.04OZn0.96Co0.04O/ZnS
μ (E
) (a.
u.)
Energy(eV)
FT |k
2(k
)|
|FT
(k 2
(k))
|
Figure 15 (a) Zn K-edge XANES spectra of ZnO, ZnS, Zn0.96Co0.04O, and Zn0.96Co0.04O/ZnS, and the calculated spectra for three model structures: Co doped ZnO (Model A), Co doped ZnO/ZnS (Model B), and ZnO+ZnS (Model C). (b) and (c) are magnified XANES spectra. (d) The FT curves of the Zn K-edge k2χ(k) functions. (e) The FT curves of the Co K-edge k2χ(k) functions. The empty circles show the fitting results. Reprinted with permission from Ref. [81]. Copyright 2014, American Chemical Society.
4 6 8 10k (Å 1)
2 4 6
Co3O4
CoOCo
Co3O4
CoO
Co
Co K-edgeZnO
Zn0.98Co0.02O/RGOZn0.98Co0.02O-RGO
Zn0.98Co0.02O
Zn0.98Co0.02O/RGO
Zn0.98Co0.02O -RGO
ZnO
Distance (Å)
Zn0.98Co0.02O
a
280 290 300
C-O-Zn **
Zn0.98Co0.02O/RGORGO
C K-edge
Energy (eV)
Abs
orba
nce
(a.u
.)
770 780 790
Co L2,3-edge
L2
Abs
orba
nce
(a.u
.)
Energy (eV)
Zn0.98Co0.02O/RGOZn0.98Co0.02O
L3
b
c
2p1/2
2p3/2
3d
L3 L2
|FT
(k 3
(k))
|
k 3(k
)
Figure 16 (a) The Co K-edge EXAFS-FT curves of the k2χ(k) functions for Zn0.98Co0.02O-RGO, Zn0.98Co0.02O/RGO, Zn0.98Co0.02O4 and references. The inset displays the k3χ(k) functions, and the empty circles show the fitting results. (b) C K-edge XANES spectra. The inset displays the bonds between RGO and Co-doped ZnO. (c) Co L2,3-edge XANES spectra. The inset displays the photoelectron transitions of L3 and L2 at Co L2,3-edge. Reprinted with permission from Ref. [82]. Copyright 2014, American Chemical Society.
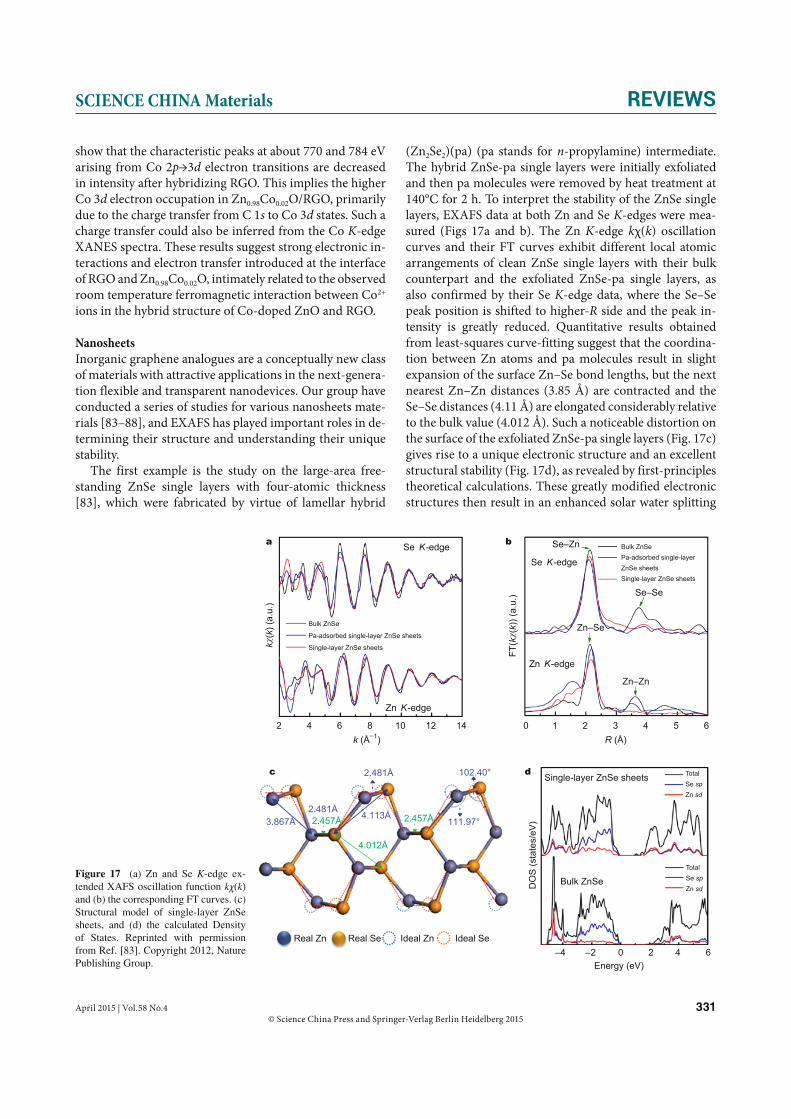
April 2015 | Vol.58 No.4 331© Science China Press and Springer-Verlag Berlin Heidelberg 2015
SCIENCE CHINA Materials REVIEWS
show that the characteristic peaks at about 770 and 784 eV arising from Co 2p→3d electron transitions are decreased in intensity after hybridizing RGO. This implies the higher Co 3d electron occupation in Zn0.98Co0.02O/RGO, primarily due to the charge transfer from C 1s to Co 3d states. Such a charge transfer could also be inferred from the Co K-edge XANES spectra. These results suggest strong electronic in-teractions and electron transfer introduced at the interface of RGO and Zn0.98Co0.02O, intimately related to the observed room temperature ferromagnetic interaction between Co2+
ions in the hybrid structure of Co-doped ZnO and RGO.
NanosheetsInorganic graphene analogues are a conceptually new class of materials with attractive applications in the next-genera-tion flexible and transparent nanodevices. Our group have conducted a series of studies for various nanosheets mate-rials [83–88], and EXAFS has played important roles in de-termining their structure and understanding their unique stability.
The first example is the study on the large-area free-standing ZnSe single layers with four-atomic thickness [83], which were fabricated by virtue of lamellar hybrid
(Zn2Se2)(pa) (pa stands for n-propylamine) intermediate. The hybrid ZnSe-pa single layers were initially exfoliated and then pa molecules were removed by heat treatment at 140°C for 2 h. To interpret the stability of the ZnSe single layers, EXAFS data at both Zn and Se K-edges were mea-sured (Figs 17a and b). The Zn K-edge kχ(k) oscillation curves and their FT curves exhibit different local atomic arrangements of clean ZnSe single layers with their bulk counterpart and the exfoliated ZnSe-pa single layers, as also confirmed by their Se K-edge data, where the Se–Se peak position is shifted to higher-R side and the peak in-tensity is greatly reduced. Quantitative results obtained from least-squares curve-fitting suggest that the coordina-tion between Zn atoms and pa molecules result in slight expansion of the surface Zn–Se bond lengths, but the next nearest Zn–Zn distances (3.85 Å) are contracted and the Se–Se distances (4.11 Å) are elongated considerably relative to the bulk value (4.012 Å). Such a noticeable distortion on the surface of the exfoliated ZnSe-pa single layers (Fig. 17c) gives rise to a unique electronic structure and an excellent structural stability (Fig. 17d), as revealed by first-principles theoretical calculations. These greatly modified electronic structures then result in an enhanced solar water splitting
2.481Å
2.481Å3.867Å
4.113Å
4.012Å
2.457Å 2.457Å 111.97°
102.40°
Real Zn Real Se Ideal Zn Ideal Se
Se K-edge
Zn K-edge
Zn K-edge
Se K-edge
Single-layer ZnSe sheets
Bulk ZnSeDO
S (s
tate
s/eV
)
FT(k
(k
)) (a
.u.)
2 4 6 8 10 12 14
–4 –2 0 2Energy (eV)
0 1 2 3 4 5 6
4 6
k (Å 1) R (Å)
k (k
) (a.
u.)
Bulk ZnSe
Pa-adsorbed single-layer ZnSe sheets
Single-layer ZnSe sheets
Bulk ZnSePa-adsorbed single-layer ZnSe sheetsSingle-layer ZnSe sheets
Se–Zn
Se–Se
Zn–Se
Zn–Zn
a b
c d TotalSe spZn sd
TotalSe spZn sd
Figure 17 (a) Zn and Se K-edge ex-tended XAFS oscillation function kχ(k) and (b) the corresponding FT curves. (c) Structural model of single-layer ZnSe sheets, and (d) the calculated Density of States. Reprinted with permission from Ref. [83]. Copyright 2012, Nature Publishing Group.

332 April 2015 | Vol.58 No.4 © Science China Press and Springer-Verlag Berlin Heidelberg 2015
REVIEWS SCIENCE CHINA Materials
efficiency and photostability of the ZnSe single layers (195 times higher photocurrent density than that of bulk coun-terpart).
Later, the same authors synthesized freestanding SnS2 nanosheets with three atomic-layer thickness through a convenient and scalable liquid exfoliation strategy [84]. EXAFS and first-principles calculations disclosed that the surface atomic elongation and the structural disor-der of the SnS2 single-layers contributed to the excellent structural stability and increased density of states at the valence band edge, enabling the nanosheets to achieve a visible-light water splitting conversion efficiency of 38.7%. Using the scalable interaction/exfoliation strategy, they also fabricated freestanding five-atomic-layer thick Bi2Se3 nanosheets which possess effective phonon scattering and decreased thermal conductivity, and have an 8-fold high-er figure of merit (ZT) relative to the bulk material [85]. EXAFS spectroscopy and first-principles calculations re-vealed considerable surface distortion of the nanosheets which gives them excellent structural stability and a much increased density of states, resulting in a 2-fold higher electrical conductivity relative to the bulk material. The same group also studied pits-confined in ultrathin CeO2 nanosheets for studying catalytic centers in carbon mon-oxide oxidation [86]. EXAFS analysis revealed the average coordination numbers of 4.6 for the artificial three-atom-
ic-layer thin CeO2 nanosheets that have approximately 20% pits occupancy. Density-functional calculations disclose that the four- and five-fold coordinated pit-surrounding cerium sites assume their respective role in carbon mon-oxide adsorption and oxygen activation, which lowers the activation barrier and avoids catalytic poisoning and leads to reduced conversion temperature and enhanced carbon monoxide catalytic ability.
Recently, based on a ‘template-assisted oriented growth’ strategy, Cheng and coworkers [87] synthesized half-unit-cell nanosheets of a typical transition-metal oxide α-Fe2O3 that show robust intrinsic ferromagnetism of 0.6 μB/atom at 100 K and remain ferromagnetic at room temperature. The XPS results as shown in Fig. 18a clearly indicate the mod-ified electronic structure of Fe ions in α-Fe2O3 nanosheets than that in α-Fe2O3 bulk. Next, Fe K-edge XANES spectra (Fig. 18b) reveal the difference between th e Fe coordination environments in the α-Fe2O3 nanosheets and bulk. The pre-edge peak intensity of α-Fe2O3 nanosheets is 40% higher than that of bulk α-Fe2O3, while is similar to that of low-co-ordinated Fe3O4 reference compound, suggesting the in-herent 5-coordinated Fe (“Fe5-co”) of nanosheets. However, the white-line peak shape for α-Fe2O3 nanosheets is close to that of 6-coordinated Fe (“Fe6-co”) in the bulk α-Fe2O3. Thus, the XANES results reveal that the non-degenerate Fe5-co and the Fe6-co coordinations probably coexist in the
7100 7120 7140 7160 7180 72000.0
0.3
0.6
0.9
1.2
1.5
7105 7110 7115 7120
0.1
0.2
Nanosheet Bulk Fe3O4
Energy (eV)
0 1 2 3 4 5 6
2468
10121416
3 6 9 12 1512
6
0
6 Bulk Nanosheet
R (Å )
k (Å 1)
k3(k
)
740 735 730 725 720 715 710 705536 534 532 530 528
Fe 2p1/2
Bulk Nanosheet
Fe 2p3/2
Inte
nsity
(a.u
.)
Energy (eV)
532.1 eV
O 2p 530.3 eV
a b c
d
Hal
f uni
t cel
l th
ick
0.58
nm
Real O
Real Fe
Ideal O
Ideal FeZ ax
is
Y axis
A
B
X a
xis
Y axis
X ax
is
FT (k
3(k
) (a.
u.)
μ (E
) (a.
u.)
Figure 18 (a) XPS and (b) Fe K-edge XANES spectra of α-Fe2O3 nanosheets, α-Fe2O3 bulk and Fe3O4 for reference. (c) FT curves of Fe K-edge k3χ(k) functions of α-Fe2O3 nanosheets and bulk α-Fe2O3 (inset: k3χ(k) curves). (d) Side and top views of the distortion model. Reprinted with permission from Ref. [87]. Copyright 2014, American Chemical Society.

April 2015 | Vol.58 No.4 333© Science China Press and Springer-Verlag Berlin Heidelberg 2015
SCIENCE CHINA Materials REVIEWS
nanosheets, as is further confirmed by XANES calcula-tions. Furthermore, the Fe K-edge EXAFS analysis (Fig. 18c) suggests the retained integrity of hexagonal α-Fe2O3 structure in the nanosheets, but the Fe–Fe second shell is greatly distorted and its structural hom ogeneity is reduced. The obtained Fe–O coordination number (5.3) is slightly larger than that of the ideal nanosheets, further confirming the Fe5-co+Fe6-co mixed coordination. Hence, approximately, 30% Fe ions take the 6-coordinated sites and 70% of Fe ions take the 5-coordinated sites. Based on the structural pa-rameters extracted from EXAFS analysis, a structure model for the α-Fe2O3 nanosheets is established as shown in Fig. 18d. First-principles calculations for this structure model reveal that the efficient breaking of the quantum degenera-cy of Fe 3d energy states activates ferromagnetic exchange interaction in these Fe5-co–O–Fe6-co ions chains.
In-situ study on the formation processes of nanocrystals and nanoclustersQuick XAFS (QXAFS) or energy-dispersive XAFS (ED-XAFS) techniques have found extensive applications in the study of the nucleation and growth processes of nanoparticles, which is a fundamentally important issue in the controllable synthesis of nanomaterials. Yao and co-workers [89] developed a continuous-flow in-situ QXAFS technique to investigate the nucleation of colloidal Au nanocrystals reduced by citrate in water in the presence of poly-vinylpyrrolidone (PVP) as surfactant. The reactive solution prepared by the procedure was continuously cir-culated along the tubes by peristaltic pump during the ac-quisition of XAFS spectra and flowed into Teflon cell sealed with Kapton windows. Because the static reacted vessel is not suitable for the in-situ measurement directly, recircu-lation system was used instead to ensure that the samples at the spot were newly formed from the reacted solution to achieve in-situ detection. The recirculation system also has additional advantages that it could avoid the precipitation of particles after a long time reaction and the possible in-fluence of X-ray irradiation in XAFS measurements.
The in situ XAFS spectra clearly show the whole pro-cess by reduction of the precursor AuCl4
− and the forma-tion of Au nanocrystals (Figs 19a and b). Interestingly, the expansion of the Au–Au bond length for the small nuclei at the initial stage implied the formation of novel Au-con-tained complex which was further confirmed to be the ‘−Cl3Au–AuCl3
−’ dimer cluster by a simulation of the XANES spectra for various cluster configurations in Fig. 19c. The experimental XANES spectra during the first 60 min, for example, the spectrum of 40 min, are more close to that of dimer configuration, and thus can be well fitted (closed squares) by a linear combination of the spectra of the initial state (HAuCl4) and intermediate state (‘−Cl3Au–
AuCl3−’ dimers) with the partially reduced AuCl3
− ions. As the subsequent reduction continued, higher order ‘Aun
Cln+x’ oligomers were formed in the nucleation stage, and then the growth was accelerated by the coalescence of small clusters. According to the temporal evolutions of the quan-titative results, the whole reaction could be classified into three stages: initial nucleation, slow growth, and eventual coalescence (Fig. 19d).
Combining in situ XAFS with other spectroscopy tech-niques (such as UV-vis) permits the simultaneous deter-mination of the structural information and the species evolution during nanocrystal formation. Weckhuysen and coworkers [90,91] have designed a combined in-situ UV-vis/XANES setup to probe the influence of X-rays on aque-ous homogeneous copper solutions. They found that that X-rays had effect on the nucleation behavior of nanoparti-cles due to the radiolysis of water. This effect is mainly lo-calized in a small sample volume within the spot size, with the time scale of several seconds.
Wei and coworkers [92] developed an in-situ measure-ment combining QXAFS and UV-vis absorption spectros-copies to monitor the nucleation pathways in the solution synthesis of Pt nanocrystals. Figs 20a and b indicate that the morphologies of the resultant Pt nanocrystals are strongly dependent on the strength of reductants: a wire-like shape for weak reductant of ethylene glycol (EG) and a spherical shape for strong reductant of citric acid (CA). In-situ XAFS and UV-vis probing (Figs 20c–f)) reveal that two different nucleation events occur for the cases of EG and CA reduc-tants, involving the formation of one-dimensional “PtnClx” complexes from the polymerization of linear “Cl3Pt−PtCl3” dimers and spherical “Ptn
0” clusters from the aggregated Pt0 atoms, respectively. The different nucleation pathways then lead to the different morphologies of nanowires and nano-spheres. This study suggests that the strength of reductant can be used to tune the nucleation of nanocrystals, and ex-erts a great influence on the growth dynamics and the final shapes of the nanocrystals.
Using time-resolved QXAFS spectroscopy, Tanaka and coauthors [93–95] also studied the formation mechanism of monolayer-protected gold nanoparticles. Harada and coworkers performed a series of studies on the photore-ducted formation processes of different metal nanoparti-cles. The investigated systems include the formation pro-cess of Au from AuCl4
− [96], Pd from PdCl2 [97], Rh from RhCl3 [98], and Pt from PtCl6
2− [99] in the presence of PVP as surfactant.
Fig. 21 show an example of using time-resolved XAFS to monitor the evolutions of photoreduced formation of Pt nanoparticles. Seen from the Pt L3-edge XANES spec-tra in Fig. 21a, the intensity of the white line for precursor H2PtCl6 solution (before photoirradiation) decreases rapid-

334 April 2015 | Vol.58 No.4 © Science China Press and Springer-Verlag Berlin Heidelberg 2015
REVIEWS SCIENCE CHINA Materials
ly during the first 10 min and then gradually decreases in course of reduction time. The isosbestic point shifts from 11,569 to 11,568 eV accordingly, especially in the reduction time between 10 and 40 min, indicating the stepwise trans-formation of one species to another (Pt4+→Pt2+→Pt0). Mean-while, the maximum peak position (11,590 eV) attributed to the metallic Pt−Pt bond increases with the increase of reduction time, suggesting the accumulation of small Pt nanoparticles. When the photoirradiation time increases, the Pt−Cl peak located at 1.96 Å in the EXAFS-FT curves (Fig. 21b) gradually decreases in intensity, and the other peak at around 2.57 Å assigned to a metallic Pt−Pt bond
becomes more and more intensive. Based on these spectral observations as well as TEM and UV-vis absorption spec-tra, the authors proposed a general process involving the initial formation of Pt nuclei (i.e., (Pt0)m nucleates approxi-mately m = 4), followed by the aggregative particle growth with the autocatalytic reduction of Pt ionic species on the surface of Pt nuclei to produce Pt nanoparticles (Fig. 21c). Comparison of the different photoreduction reactions for various nanaoparticles indicates that the reductions of the precursor metal species with high oxidation state possessed an induction period before the onset of metal particle for-mation. In these photoreduction reactions, the onset of
1.2
1.0
0.8
0.6
0.4
0.2
0
2.5
2.0
1.5
1.0
0.5
0
11890 11910 11930 11950 11970 11990
50100
150
200250
300
0 min20 min40 min60 min
120 min210 min260 min
Au foil
11920 11940 119600 1
2 3 45 6 30 90
150210
270300
11920 11940 11960E (eV)
E (eV)
E (eV)
exp.
cal.
Linear fit
3-atom
13-atom
43-atom
Dimer
40 min (exp.)
HAuCl4 (cal.)
R (Å)t (min)
t (m
in)
0 min20 min40 min60 min
120 min
210 min260 min
Au foil
Inte
nsity
(a.u
.)
Inte
nsity
(a.u
.)
0 1 2 3 4 5 6R (Å)
Surfactant
TrimersDimers
Au13
AuCl4
a b
c d
A B
μ (E
) (a.
u.)
μ (E
) (a.
u.)
μ (E
) (a.
u.)
Figure 19 (a) Normalized Au L3-edge in situ XANES, and (b) Fourier transformed k2χ(k) functions as a function of reaction time. The insets show the typical Au L3-edge XAFS spectra at different reaction time. (c) Comparison of the experimental XANES spectrum at 40 min with calculations for various Au clusters. Reprinted with permission from Ref. [89]. Copyright 2010, American Chemical Society.
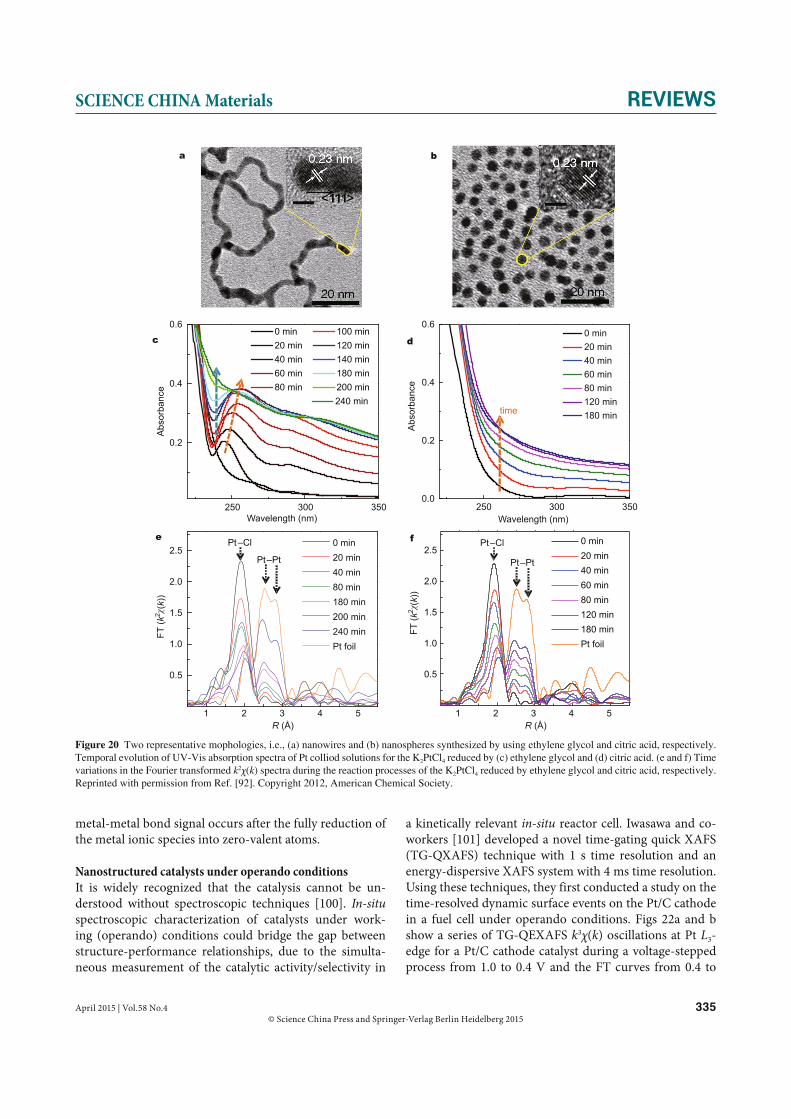
April 2015 | Vol.58 No.4 335© Science China Press and Springer-Verlag Berlin Heidelberg 2015
SCIENCE CHINA Materials REVIEWS
metal-metal bond signal occurs after the fully reduction of the metal ionic species into zero-valent atoms.
Nanostructured catalysts under operando conditionsIt is widely recognized that the catalysis cannot be un-derstood without spectroscopic techniques [100]. In-situ spectroscopic characterization of catalysts under work-ing (operando) conditions could bridge the gap between structure-performance relationships, due to the simulta-neous measurement of the catalytic activity/selectivity in
250 300 350
0.2
0.4
0.6
0 min 100 min 20 min 120 min 40 min 140 min 60 min 180 min 80 min 200 min
240 min
Abs
orba
nce
Wavelength (nm)250 300 350
0.0
0.2
0.4
0.6 0 min 20 min 40 min 60 min 80 min 120 min 180 min
Abs
orba
nce
Wavelength (nm)
1 2 3 4 5
0.5
1.0
1.5
2.0
2.5
0 min 20 min 40 min 80 min 180 min 200 min 240 min Pt foil
Pt–Pt
Pt–Cl
Pt–Pt
Pt–Cl
time
a b
c d
e f
FT (k
2(k
))
FT (k
2(k
))
R (Å) R (Å)1 2 3 4 5
0.5
1.0
1.5
2.0
2.50 min20 min40 min60 min80 min120 min180 minPt foil
Figure 20 Two representative mophologies, i.e., (a) nanowires and (b) nanospheres synthesized by using ethylene glycol and citric acid, respectively. Temporal evolution of UV-Vis absorption spectra of Pt colliod solutions for the K2PtCl4 reduced by (c) ethylene glycol and (d) citric acid. (e and f) Time variations in the Fourier transformed k2χ(k) spectra during the reaction processes of the K2PtCl4 reduced by ethylene glycol and citric acid, respectively. Reprinted with permission from Ref. [92]. Copyright 2012, American Chemical Society.
a kinetically relevant in-situ reactor cell. Iwasawa and co-workers [101] developed a novel time-gating quick XAFS (TG-QXAFS) technique with 1 s time resolution and an energy-dispersive XAFS system with 4 ms time resolution. Using these techniques, they first conducted a study on the time-resolved dynamic surface events on the Pt/C cathode in a fuel cell under operando conditions. Figs 22a and b show a series of TG-QEXAFS k3χ(k) oscillations at Pt L3-edge for a Pt/C cathode catalyst during a voltage-stepped process from 1.0 to 0.4 V and the FT curves from 0.4 to

336 April 2015 | Vol.58 No.4 © Science China Press and Springer-Verlag Berlin Heidelberg 2015
REVIEWS SCIENCE CHINA Materials
11550 11570 11590
30
25
20
15
10
5
00 1 2 3 4 5 6
R (Å)
E (eV)
0 sec200 sec400 sec600 sec800 sec1000 sec1200 sec2400 sec3600 sec4800 sec6000 sec7200 sec8400 sec9600 sec
0 sec600 sec1200 sec1800 sec2400 sec3000 sec3600 sec4200 sec4800 sec5400 sec6000 sec6600 sec7200 sec7800 sec8400 sec9000 sec9600 sec10200 sec
FT o
f k3
(k)
Nor
mal
ized
abs
orpt
ion
(a.u
.)
Reduction-nucleation process
Aggregative growth process
(M0)n + M+ 0)n+1
(M0)n + (M0)m 0)n+m
ac
b
[Pt] = 24.4 mM
Figure 21 Evolution as a function of the reduction time for (a) Pt L3-edge XANES spectra and (b) FT of k3χ(k) spectra for Pt nanoparticles prepared by the photoreduction in the presence of PVP. (c) Schematic presentation of the forma-tion process of Pt nanoparticles involving the reduction-nucleation and aggre-gative growth progresses. Reprinted with permission from Ref. [99]. Copyright 2012, American Chemical Society.
FT [k
3 (k
)]
k3 (k
)
a
c
b6420246
4 6 8 10 12 140 5 1015
2025
3035
Time (s)5 10
1520
2530
35
Time (s)
0654321
14121086420
Oxidation Time
e transfer
e transfer
e transfer
e transfer
Pt-O dissociation
Pt-O dissociation
Pt charging
Pt discharging
ReductionTime
k (Å ) R (Å)
ke1 = 0.39 s 1
ke1 = 2.86 s 1
kPt-O = 0.39 s 1
ke2 = 0.17 s 1
kd = 0.039 s 1
ke2 = 0.049 s 1
kPt-O = 0.013 s 1kd = 0.011 s 1
1.0 V
0.4 V
Figure 22 (a) A series of TG-QEXAFS oscillations of a reduction process (1.0→0.4 V), and (b) the Fourier transforms of an oxidation process (0.4→1.0 V) at Pt L3-edge in a Pt/C fuel cell measured at 333 K. (c) Reaction mechanism for changes in the Pt/C fuel-cell catalysts in cell voltages of 0.4/1.0 V under H2 (anode) and N2 (cathode). Reprinted with permission from Ref. [101]. Copyright 2007, Wiley-Blackwell.

April 2015 | Vol.58 No.4 337© Science China Press and Springer-Verlag Berlin Heidelberg 2015
SCIENCE CHINA Materials REVIEWS
1.0 V. All the TG-QEXAFS spectra have good enough data quality for curve-fitting analysis to evaluate the numbers and the lengths of chemical bonds on the Pt cathode cat-alyst. Based on the obtained parameters (electrochemical charges, numbers and lengths of Pt−Pt and Pt−O bonds, electron density of Pt d orbitals), they determined eight rate constants for the oxidation and reduction processes (Fig. 22c). These eight rate constants, significantly different from each other, are related to the electron transfer, struc-tural change, and d-electron density change at the Pt/C cathode catalyst. Besides, a hysteresis loop for the structur-al changes in the Pt cathode particles in the oxidation and reduction processes is observed.
Iwasawa’s group [102] also studied the reductive forma-tion and oxidative phase separation of γ-Al2O3 supported Pt3Sn nanoparticles during the reduction and oxidation processes at 673 K. Fig. 23a shows a series of time-resolved XANES spectra at Pt L3-edge, which were measured every 0.1 s, in the reduction process of the oxidized Pt3Sn/γ-Al2O3 catalyst at 673 K under a H2 pressure of 23.6 kPa. The white line intensity decreased after H2 admission to the in-situ XAFS cell, and its decay against the reduction time was plotted in Fig. 23b. The change in the white line intensity was nearly completed in 2 s. Because the variation of the white line with reduction time is equivalent to the variation of the amount of PtO in the catalyst, the dynamic behavior and the structural kinetics of the PtO nanopar-ticles in the reduction process could be determined. Fig.
23c displays the change in the white line intensity in the reduction of the catalyst at different pressures of H2, and the obtained rate constants are plotted in Fig. 23d against the H2 pressures. At a very low H2 pressure like 3.0 kPa, the white line intensity varied with time in a two-step pro-cess, where the first reduction step was followed by a slower second step. Further in-situ time-resolved XAFS measure-ments at Pt L3-edge and Sn K-edge reveal that the oxidation of Pt3Sn nanoparticles on γ-Al2O3 with O2 at 673 K proceed by three successive steps via two intermediates to form PtO core nanoparticles with SnO2 shells, whereas the reduction of the oxidized nanoparticles with H2 at 673 K proceed as a single process with similar rate constants at Pt and Sn sites.
Using the established time-resolved XAFS method, the Iwasawa’s group [103] also studied the dynamic structural changes and kinetics of a Re10 cluster catalyst in the direct phenol synthesis from benzene and O2. The real-time XAFS measurements monitoring the structural transformation of active Re10 clusters to inactive Re monomers suggested the direct transformation of Re10 cluster to the Re monomers, showing a first order reaction to the Re10 cluster quanti-ty. Besides, they used the time-resolved XAFS with a 0.5 s time resolution to study the structural kinetics of surface events on a Pt3Co/C cathode catalyst in a polymer electro-lyte fuel cell under operando conditions [104].
Besides the Iwasawa’s group, Frenkel and cooperators have performed a series of studies on the application of XAFS (and other complementary techniques) to hetero-geneous catalysis, like CuO/CeO2 [105], Ce1−xCuxO2 [106], CeO2−x/CuO [58], and AuOx/CeO2 [107] WGS catalysts. Their studies aim to obtain a systematic understanding of the structural, electronic, and chemical properties of these catalysts under the operando conditions, in order to reveal the nature of the active phase in metal/oxide WGS catalysts and the WGS reaction mechanism. Some of these studies have been reviewed in subsection of “Oxide nanoparticles” in this paper, and interested readers are referred to a few re-view articles [108,109] on the capabilities, challenges, and opportunities of the in-situ/operando catalytic studies.
OUTLOOK AND PERSPECTIVEXAFS has been developed into a mature and powerful tech-nique for studies on the local atomic/electronic structures of a specific type of atoms in condensed matters. The recent significant advances in theory and experimental methods have made it more and more widely and extensively used. As many new generations of synchrotron radiation light sources and more advanced XAFS beamlines are available, undoubtedly the range of XAFS applications will continue extending. Especially, in the study of nanomaterials, with the improvement of the time-resolved XAFS technique, the in-situ probing of the formation processes of nanomaterials
a
c d
b
1.401.201.000.800.600.400.200.000 5 15 20 25 30 35 401012840
0.02
123
4
0 4 8 12116401160011560
0.2 0.02
(s)
(s)E (eV)
PH2 (kPa)
KP
t (s
1 )
μtμt μt
Figure 23 (a) In situ time-resolved Pt L3-edge XANES spectra in the reduction process of the oxidized Pt3Sn/γ-Al2O3 catalyst at 673 K under PH2 = 23.6 kPa. (b) Time profile of the change in the white line intensity. (c) Change of the white line intensity over time at different H2 pressures. (d) Dependence on PH2 of the rate constants in the reduction at 673 K. Reprinted with permission from Ref. [102]. Copyright 2011, American Chemical Society.

338 April 2015 | Vol.58 No.4 © Science China Press and Springer-Verlag Berlin Heidelberg 2015
REVIEWS SCIENCE CHINA Materials
and their behaviors under operando conditions will play valuable roles in prompting the prosperity of the nanosci-ence and nanotechnology. It is worthy to note that the local structure from XAFS analysis is always about the average structure. Only a synergetic utilization of different meth-ods bringing complementary information together enables a comprehensive and detailed understanding of the mate-rials under investigation. Along this way, combining two or more in-situ characterization methods in one setup has been greatly advanced and will still continue to be devel-oped.
Received 27 February 2015; accepted 17 March 2015;published online 10 April 2015
1 Drexler KE. Engines of Creation: The Coming Era of Nano technol-ogy. New York: Doubleday, 1986
2 Nanoscience and nanotechnologies: opportunities and uncertain-ties. London: The Royal Society and T he Royal Academy of Engi-neering, 2004
3 Binnig G, Quate CF, Gerber C. Atomic force microsc ope. Phys Rev Lett, 1986, 56: 930–933
4 Binnig G, Rohrer H. Scanning tunneling microsc opy. IBM J Res Dev, 1986, 30: 355–369
5 Koningsberger DC, Prins R. X-Ray Absorption: Principles, Appli-cations, Techniques of EXAFS, SE XAFS and XANES. New York: Wiley, 1988
6 Bunker G. A Practical Guide to X-ray Absorption Fine Structure Spectroscopy. Cambri dge: Cambridge University Press, 2010
7 Dent AJ. Development of time-resolved XAFS instrumentation for quick EXAFS and energy-dispersive EXAFS measurements on cat-alys t systems. Top Catal, 2002, 18: 27–35
8 Pasquarello A, Petri I, Salmon PS, et al. First solvation shell of the Cu(II) aqua ion: evidence for fivefold coor dination. Science, 2001, 291: 856–859
9 Zhang XW, Yan XJ, Zhou ZR, et al. Arsenic trioxide controls the fate of the PML-RAR alpha oncoprotein by directly bin ding PML. Science, 2010, 328: 240–243
10 Chen LX, Jager WJH, Jennings G, et al. Capturing a photoexcited molecular structure through time-domain X-ray absorption fine s tructure. Science, 2001, 292: 262–264
11 Bianconi A, Saini NL, Lanzara A, et al. Determination of the local lattice distortions in the CuO2 plane of La1.85Sr0.15CuO 4. Phys Rev Lett, 1996, 76: 3412–3415
12 Fricke H. The K-characteristic absorption frequencies for the chemical elements magnesium to c hromium. Phys Rev, 1920, 16: 202–215
13 Hertz GZ. Absorption limits of the L-series. Zeitschrift Fur Physik, 1920, 3: 19–25
14 Kronig RD. On the theory of fine structure in the X-ray absorption spectra. Zeit schrift Fur Physik, 1931, 70: 317–323
15 Kronig RD. On the theory of fine structure in the X-ray absorption spectrum 3. Zeit schrift Fur Physik, 1932, 75: 468–475
16 Kronig RD. On the theory of fine structure in the X-ray absorption spectrum. 2. Zeit schrift Fur Physik, 1932, 75: 191–210
17 Sayers DE, Stern EA, Lytle FW. New technique for investigating noncrystalline structures: Fourier analysis of extended X-ray- absorption fine structur e. Phys Rev Lett, 1971, 27: 1204–1207
18 Rehr JJ, Stern EA, Martin RL, Davidson ER. Extended X-ray- absorption fine-structure amplitudes—Wave-function relaxation and chemical e ffects. Phys Rev B, 1978, 17: 560–565
19 Bunker G. Application of the ratio method of exafs analysis to dis-
ordered-systems. Nu cl Instrum Meth A, 1983, 207: 437–44420 Tranquada JM, Ingalls R. Extended X-ray-absorption fine-structure
study of anharmonicity in CuBr. Phys Rev B, 1983, 28: 3520–352821 Crozier ED, Seary AJ. Asymmetric effects in the extended X-ray ab-
sorption fine-structure analysis of solid and liquid zinc. Can J Phys, 1980, 58: 1388–1399
22 Wei SQ, Oyanagi H, Liu WH, et al. Local structure of liquid galli-um studied by X-ray absorption fine structure. J Non-Cryst Solids, 2000, 275: 160–168
23 Lee PA, Pendry JB. Theory of extended X-ray absorption fine-struc- ture. Phys Rev B, 1975, 11: 2795–2811
24 Rehr JJ, Albers RC. Scattering-matrix formulation of curved-wave multiple-scattering theory: application to X-ray-absorption fine-struc ture. Phys Rev B, 1990, 41: 8139–8149
25 Rehr JJ, Deleon JM, Zabinsky SI, Albers RC. Theoretical X-ray absorption fine-structure standards . J Am Chem Soc, 1991, 113: 5135–5140
26 Rehr JJ, Albers RC. Theoretical approaches to X-ray absorption fine struc ture. Rev Mod Phys, 2000, 72: 621–654
27 Fujikawa T, Yiwata N. A new approach to full multiple-scattering XAFS ca lculation. Surf Sci, 1996, 357: 60–64
28 Ankudinov AL, Ravel B, Rehr JJ, Conradson SD. Real-space mul-tiple-scattering calculation and interpretation of X-ray-absorption near-edge struc ture. Phys Rev B, 1998, 58: 7565–7576
29 Natoli CR, Misemer DK, Doniach S, Kutzler FW. First-principles calculation of X-ray absorption-edge structure in molecular clus- ters. Phys Rev A, 1980, 22: 1104–1108
30 Binsted N. EXCURV98: CCLRC Daresbury Laboratory Computer Program. 1998; Available from: http://srs.dl.ac.uk/XRS/Co mput-ing/Programs/excurv97/intro.html
31 Filipponi A, Di Cicco A, Natoli CR. X-ray-absorption spectroscopy and n-body distribution functions in condensed matter. I. Theo ry. Phys Rev B, 1995, 52: 15122–15134
32 Blaha P, Schwarz K, Madsen GKH, Kvasnicka D, Luitz J. WIEN2k: An Augmented Plane Wave plus Local Orbitals Program for Calcu-lating Crystal Properties. Karlheinz Schwa rz, Technisch e Universi-tät Wien, 2001
33 Zhong WJ, He B, Li Z, Wei SQ. USTCXAFS 2.0 software packages (in Chinese). J Univ Sci Technol China, 2001, 31: 228–233
34 Baberschke K. Recent progress in l ow-Z SEXAFS. Phys B, 1989, 158: 19–24
35 Magnan H, Chandesris D, Rossi G, et al. Determination of the local order in amorphous cobalt f ilms. Phys Rev B, 1989, 40: 9989–9992
36 Heckmann O, Magnan H, Lefevre P, Chandesris D, Rehr JJ. Crystal-lographic structure of cobalt filsm on Cu(001): elastic-deformation to a tetragonal structure. Surf Sci, 1994, 312: 62–72
37 Diaz-Moreno S. XAFS data collection: an integrated approach to delivering good data. J Synchrotron Rad, 2012, 19: 863–868
38 Stern EA, Kim K. Thickness effect on the extended-X-ray-absorp-tion-fine-structure ampli tude. Phys Rev B, 1981, 23: 3781–3787
39 Henke BL, Gullikson EM, Davis JC. X-ray interactions: photoab-sorption, scattering, transmission, and reflection at E = 50–30,000 eV, Z = 1–92. Atom Dat a Nucl Data Tables, 1993, 54: 181–342
40 Chantler CT. Theoretical form-factor, attenuation and scattering tabulation for Z = 1–92 from E = 1–10 eV to E = 0.4–1.0 meV. J Phys Chem Ref Data, 1995, 24: 71–591
41 Troger L, Arvanitis D, Baberschke K, et al. Full correction of the self-absorption in soft-fluorescence extended X-ray-absorption fine-struc ture. Phys Rev B, 1992, 46: 3283–3289
42 Booth CH, Bridges F. Improved self-absorption correction for flu-orescence measurements of extended X-ray absorption fine-str uc-ture. Phys Scr, 2005, T115: 202–204
43 Lytle FW, Greegor RB, Sandstrom DR, et al. Measurement of soft-X-ray absorption-spectra with a fluorescent ion-chamber detector. Nu cl Instrum Meth A, 1984, 226: 542–548

April 2015 | Vol.58 No.4 339© Science China Press and Springer-Verlag Berlin Heidelberg 2015
SCIENCE CHINA Materials REVIEWS
44 Oyanagi H, Fonne C, Gutknecht D, et al. Ge pixel array detector for high throughput X-ray spectroscopy. Nu cl Instrum Meth A, 2003, 513: 340–344
45 Oyanagi H, Sakamoto K, Shioda R, Kuwahara Y, Haga K. Ge over-layers on Si(001) studied by surface-extended X-ray-absorption fine struc ture. Phys Rev B, 1995, 52: 5824–5829
46 Yin Y, Alivisatos AP. Colloidal nanocrystal synthesis and the organ-ic-inorganic interface. Nature, 2005, 437: 664–670
47 Donega CD. Synthesis and properties of colloidal heteronanocrys-ta ls. Chem Soc Rev, 2011, 40: 1512–1546
48 Vericat C, Vela ME, Benitez G, Carro P, Salvarezza RC. Self-assem-bled monolayers of thiols and dithiols on gold: new challenges for a well-known syst em. Chem Soc Rev, 2010, 39: 1805–1834
49 Xia YN, Cobley CM, Chen JY, Cho EC, Wang LV. Gold nanostruc-tures: a class of multifunctional materials for biomedical applic a-tions. Chem Soc Rev, 2011, 40: 44–56
50 Zhang P, Sham TK. X-ray studies of the structure and electronic behavior of alkanethiolate-capped gold nanoparticles: the interplay of size and surface eff ects. Phys Rev Lett, 2003, 90: 245502
51 Sanchez SI, Menard LD, Bram A, et al. The emergence of nonbulk properties in supported metal clusters: negative thermal expansion and atomic disorder in Pt nanoclusters supported on gamma-Al2O3 . J Am Chem Soc, 2009, 131: 7040–7054
52 Small MW, Sanchez SI, Marinkovic NS, Frenkel AI, Nuzzo RG. In-fluence of adsorbates on the electronic structure, bond strain, and thermal properties of an alumina-supported Pt c atalyst. ACS Nano, 2012, 6: 5583–5595
53 Jin RC. Quantum sized, thiolate-protected gold nano clusters. Na-noscale, 2010, 2: 343–362
54 Li G, Jin RC. Atomically precise gold nanoclusters as new model catalys ts. Acc Chem Res, 2013, 46: 1749–1758
55 Lu YZ, Chen W. Sub-nanometre sized metal clusters: from synthetic challenges to the unique property discoveri es. Chem Soc Rev, 2012, 41: 3594–3623
56 Spivey JJ, Krishna KS, Kumar C, et al. Synthesis, characterization, and computation of catalysts at the center for atomic-level catalyst design. J Phys Chem C, 2014, 118: 20043–20069
57 Liu J, Krishna KS, Losovyj YB, et al. Ligand-stabilized and atom-ically precise gold nanocluster catalysis: a case study for correlat-ing fundamental electronic properties with catalysi s. Chem-Euro J, 2013, 19: 10201–10208
58 Barrio L, Estrella M, Zhou G, et al. Unraveling the active site in copper-ceria systems for the water-gas shift reaction: in situ char-acterization of an inverse powder CeO2−x/CuO-Cu catalyst . J Phys Chem C, 2010, 114: 3580–3587
59 Patlolla A, Carino EV, Ehrlich SN, Stavitski E, Frenkel AI. Appli-cation of operando XAS, XRD, and Raman spectroscopy for phase speciation in water gas shift reaction cat alysts. ACS Catal, 2012, 2: 2216–2223
60 Oyanagi H, Sakamoto K, Shioda R, Sakamoto T. Ge epitaxial over-layers on Si(001) studied by surface-sensitive X-ray-absorption fine-structure: evidence for strain-induced surface rearrangement. J pn J Appl Phys, 1994, 33: 3545–3552
61 Oyanagi H, Sakamoto K, Shioda R, Kuwahara Y, Haga K. Ge over-layers on Si(001) studied by surface-extended X-ray-absorption fine-struc ture. Phys Rev B, 1995, 52: 5824–5829
62 Pearsall TP, Bevk J, Feldman LC, et al. Structurally induced op-tical-transitions in Ge-Si superlatti ces. Phys Rev Lett, 1987, 58: 729–732
63 Wei SQ, Oyanagi H, Sakamoto K, Takeda Y, Pearsall TP. Local structure of (Ge4Si4)5 monolayer strained-layer superlattice probed by fluorescence X-ray absorption fine struc ture. Phys Rev B, 2000, 62: 1883–1888
64 Kamenev BV, Tsybeskov L, Baribeau JM, Lockwood DJ. Photolu-minescence and Raman scattering in three-dimensional Si/Si1−xGex
nanostructures . Appl Phys Lett, 2004, 84: 1293–129565 Sun ZH, Wei SQ, Kolobov AV, Oyanagi H, Brunner K. Short-range
order structures of self-assembled Ge quantum dots probed by mul-tiple-scattering extended X-ray absorption fine st ructure. Phys Rev B, 2005, 71: 245334
66 Wolf SA, Awschalom DD, Buhrman RA, et al. Spintronics: a spin-based electronics vision for the future. Science, 2001, 294: 1488–1495
67 Žutić I, Fabian J, Das Sarma S. Spintronics: fundamentals and appli-cat ions. Rev Mod Phys, 2004, 76: 323–410
68 Ohno H. Making nonmagnetic semiconductors ferro magnetic. Sci-ence, 1998, 281: 951–956
69 Dietl T, Ohno H, Matsukura F, Cibert J, Ferrand D. Zener model description of ferromagnetism in zinc-blende magnetic semicon-d uctors. Science, 2000, 287: 1019–1022
70 Liu C, Yun F, Morkoc H. Ferromagnetism of ZnO and GaN: a re-view. J Mater Sci-Mater El, 2005, 16: 555–597
71 Wei SQ, Yan WS, Sun ZH, et al. Direct determination of Mn oc-cupations in Ga1−xMnxN dilute magnetic semiconductors by X-ray absorption near-edge structure spectrosc opy. Appl Phys Lett, 2006, 89: 121901
72 He B, Zhang XY, Wei SQ, et al. Local structure around Mn atoms in cubic (Ga,Mn)N thin films probed by fluorescence extended X-ray absorption fine struct ure. Appl Phys Lett, 2006, 88: 051905
73 Kunisu M, Oba F, Ikeno H, Tanaka I, Yamamoto T. Local environ-ment of Mn dopant in ZnO by near-edge X-ray absorption fine structure analy sis. Appl Phys Lett, 2005, 86: 121902
74 Sun ZH, Yan WS, Zhang GB, et al. Evidence of substitutional Co ion clusters in Zn1−xCoxO dilute magnetic semicon ductors. Phys Rev B, 2008, 77: 242508
75 Spaldin NA. Search for ferromagnetism in transition-metal-doped piezoelect ric ZnO. Phys Rev B, 2004, 69: 125201
76 Gopal P, Spaldin NA. Magnetic interactions in transition-metal- doped ZnO: an ab initi o study. Phys Rev B, 2006, 74: 094418
77 Yuhas BD, Fakra S, Marcus MA, Yang PD. Probing the local co-ordination environment for transition metal dopants in zinc oxide n anowires. Nano Lett, 2007, 7: 905–909
78 Yao T, Yan WS, Sun ZH, et al. Magnetic property and spatial occu-pation of Co dopants in Zn0.98Co0.02O nanowires. J Phys Chem C, 2009, 113: 14114–14118
79 Yu JH, Liu XY, Kweon KE, et al. Giant Zeeman splitting in nucle-ation-controlled doped CdSe: Mn2+ quantum n anoribbons. Nat Mater, 2010, 9: 47–53
80 Segura-Ruiz J, Martinez-Criado G, Chu MH, Geburt S, Ronning C. Nano-X-ray absorption spectroscopy of single Co-implanted ZnO nano wires. Nano Lett, 2011, 11: 5322–5326
81 Yan WS, Liu QH, Wang C, et al. Realizing ferromagnetic coupling in diluted magnetic semiconductor quantum dots . J Am Chem Soc, 2014, 136: 1150–1155
82 Sun ZH, Yang XY, Wang C, et al. Graphene activating room-tem-perature ferromagnetic exchange in cobalt-doped ZnO dilute mag-netic semiconductor quantum dots. ACS Nano, 2014, 8: 10589–10596
83 Sun YF, Sun ZH, Gao S, et al. Fabrication of flexible and freestand-ing zinc chalcogenide sin gle layers. Nat Commun, 2012, 3: 1057
84 Sun YF, Cheng H, Gao S, et al. Freestanding tin disulfide single-lay-ers realizing efficient visible-light water splitting. A ngew Chem Int Ed, 2012, 51: 8727–8731
85 Sun YF, Cheng H, Gao S, et al. Atomically thick bismuth selenide freestanding single layers achieving enhanced thermoelectric ener-gy harvesting. J Am Chem Soc, 2012, 134: 20294–20297
86 Sun YF, Liu QH, Gao S, et al. Pits confined in ultrathin cerium(IV) oxide for studying catalytic centers in carbon monoxide oxidation. Nat Commun, 2013, 4: 2899
87 Cheng WR, He JF, Yao T, et al. Half-unit-cell alpha-Fe2O3 semicon-

340 April 2015 | Vol.58 No.4 © Science China Press and Springer-Verlag Berlin Heidelberg 2015
REVIEWS SCIENCE CHINA Materials
ductor nanosheets with intrinsic and robust ferromagnetism. J Am Chem Soc, 2014, 136: 10393–10398
88 Sun YF, Sun ZH, Gao S, et al. All-surface-atomic-metal chalcogenide sheets for high-efficiency visible-light photoelectrochemical water splitting. Adv Energ Mater, 2 014, 4: doi: 10.1002/aenm.201300611
89 Yao T, Sun ZH, Li YY, et al. Insights into initial kinetic nucleation of gold nanocrystals . J Am Chem Soc, 2010, 132: 7696–7701
90 Mesu JG, van der Eerden AM, de Groot FM, Weckhuysen BM. Synchrotron radiation effects on catalytic systems as probed with a combined in-situ UV-Vis/XAFS spectroscopic setup . J Phys Chem B, 2005, 109: 4042–4047
91 Mesu JG, Beale AM, de Groot FM, Weckhuysen BM. Probing the influence of X-rays on aqueous copper solutions using time-re-solved in situ combined video/X-ray absorption near-edge/ultravi-olet-visible spectroscopy. J Phys Chem B, 2006, 110: 17671–17677
92 Yao T, Liu SJ, Sun ZH, et al. Probing nucleation pathways for mor-phological manipulation of platinum nanocrystals . J Am Chem Soc, 2012, 134: 9410–9416
93 Ohyama J, Teramura K, Higuchi Y, et al. An in situ quick XAFS spectroscopy study on the formation mechanism of small gold nanoparticles supported by porphyrin-cored tetradentate passiv-ants. Phys Chem Chem Phys, 2011, 13: 11128–11135
94 Ohyama J, Teramura K, Higuchi Y, et al. In situ observation of nu-cleation and growth process of gold nanoparticles by quick XAFS spectros copy. ChemPhysChem, 2011, 12: 127–131
95 Tanaka T, Ohyama J, Teramura K, Hitomi Y. Formation mechanism of metal nanoparticles studied by XAFS spectroscopy and effec-tive synthesis of small metal nanoparti cles. Catal Today, 2012, 183: 108–118
96 Harada M, Einaga H. In situ XAFS studies of Au particle forma-tion by photoreduction in polymer sol utions. Langmuir, 2007, 23: 6536–6543
97 Harada M, Inada Y. In situ time-resolved XAFS studies of metal particle formation by photoreduction in polymer sol utions. Lang-muir, 2009, 25: 6049–6061
98 Harada M, Tamura N, Takenaka M. Nucleation and growth of met-al nanoparticles during photoreduction using in situ time-resolved SAXS analysis. J Phys Chem C, 2011, 115: 14081–14092
99 Harada M, Kamigaito Y. Nucleation and aggregative growth process of platinum nanoparticles studied by in situ quick XAFS spectr os-copy. Langmuir, 2012, 28: 2415–2428
100 Banares MA. Operando spectroscopy: the knowledge bridge to as-sessing structure-performance relationships in catalyst nanopart i-cles. Adv Mater, 2011, 23: 5293–5301
101 Tada M, Murata S, Asakoka T, et al. In situ time-resolved dynamic surface events on the Pt/C cathode in a fuel cell under operando conditions. A ngew Chem Int Ed, 2007, 46: 4310–4315
102 Uemura Y, Inada Y, Bando KK, et al. Core-shell phase separation and structural transformation of Pt3Sn alloy nanoparticles support-
ed on gamma-Al2O3 in the reduction and oxidation processes char-acterized by in situ time-resolved XAFS . J Phys Chem C, 2011, 115: 5823–5833
103 Tada M, Uemura Y, Bal R, et al. In situ time-resolved DXAFS for the determination of kinetics of structural changes of H-ZSM-5-sup-ported active Re-cluster catalyst in the direct phenol synthesis from benzene and O2. Phy s Chem Chem Phys, 2010, 12: 5701–5706
104 Ishiguro N, Saida T, Uruga T, et al. Operando time-resolved X-ray absorption fine structure study for surface events on a Pt3Co/C cathode catalyst in a polymer electrolyte fuel cell during voltage- operating pro cesses. ACS Catal, 2012, 2: 1319–1330
105 Wang XQ, Hanson JC, Frenkel AI, Kim JY, Rodriguez JA. Time- resolved studies for the mechanism of reduction of copper oxides with carbon monoxide: complex behavior of lattice oxygen and the formation of suboxides. J Phys Chem B, 2004, 108: 13667–13673
106 Wang Q, Hanson JC, Frenkel AI. Solving the structure of reaction intermediates by time-resolved synchrotron X-ray absorption spec-tro scopy. J Chem Phys, 2008, 129: 234502
107 Wang X, Rodriguez JA, Hanson JC, Perez M, Evans J. In situ time-resolved characterization of Au-CeO2 and AuOx-CeO2 cata-lysts during the water-gas shift reaction: presence of Au and O va-cancies in the active phase. J Chem Phys, 2005, 123: 221101
108 Frenkel AI, Rodriguez JA, Chen JGG. Synchrotron techniques for in situ catalytic studies: capabilities, challenges, and opportu nities. ACS Catal, 2012, 2: 2269–2280
109 Rodriguez JA, Hanson JC, Stacchiola D, Senanayake SD. In situ/op-erando studies for the production of hydrogen through the water- gas shift on metal oxide catalysts. Phys Chem Chem Phys, 2013, 15: 12004–12025
Acknowledgements This research was supported by the National Natural Science Foundation of China (11135008, 11175184 and 11475176), and the Foundation for Innovative Research Groups of the National Natural Science Foundation of China (11321503). We would like to express our gratitude to Profs. Kunquan Lu, Xinyi Zhang, Yi Xie, Ziyu Wu, and Tiandou Hu for valuable discussions and encouragements. We also ex-press our thanks to Dr. Zhiyun Pan, Dr. Yong Jiang, Dr. Yongfu Sun, Dr. Jingfu He, Mr. Zhi Xie, Mr. Bo He and Miss Fengchun Hu for fruit-ful collaborations. We appreciate the National Synchrotron Radiation Laboratory (NSRL), Beijing Synchrotron Radiation Facility (BSRF), and Shanghai Synchrotron Radiation Facility (SSRF) for the valuable beam-times that we used in our experiments.
Author contributions Wei S initiated and guided the whole project. Sun Z, Liu Q, Yao T, and Yan W surveyed the literatures, discussed the content, and wrote the manuscript.
Conflict of interest The authors declare that they have no conflict of interest.

April 2015 | Vol.58 No.4 341© Science China Press and Springer-Verlag Berlin Heidelberg 2015
SCIENCE CHINA Materials REVIEWS
中文摘要 X射线吸收精细结构谱学(XAFS)技术是近40年来同步辐射领域最为重要的实验技术之一, 在物理、化学、生物、材料和能
源科学等诸多领域得到了广泛应用. 本文简要综述了XAFS技术在纳米材料科学研究中的应用. 首先介绍了XAFS的基本原理、实验方
法及数据分析处理过程, 进一步通过对XAFS技术在应用于纳米材料研究中的一些代表性工作进行概述, 如金属与半导体纳米颗粒、
催化剂、核壳结构、二维超薄纳米片, 以及原位XAFS技术在研究纳米材料的原位成核/生长过程和纳米催化剂在工作状态下的中间态
表征等, 展示了XAFS技术在 纳米材料领域对其原子和电子结构表征的强大能力.
Zhihu Sun received his PhD degree from University of Science and Technology of China (USTC) in 2005. After post-doctoral research at National Institute of Advanced Industrial Science and Technology of Japan, he became an as-sociate professor of National Synchrotron Radiation Laboratory at USTC. His research interest includes the applications of synchrotron radiation techniques to low-dimensional nanostructures and magnetic semiconductor materials.
Qinghua Liu received his PhD degree in 2009 from USTC. He is an associate professor at National Synchrotron Radiation Laboratory at USTC. His research interest includes on X-ray absorption spectroscopy and photocatalysis.
Shiqiang Wei is a full professor at USTC. He received his PhD degree from USTC in 1992. After working as a se-nior researcher at National Institute of Advanced Industrial Science and Technology of Japan, he was a gainer of the “One-hundred Talents Project” of Chinese Academy of Sciences in 1998, won the “Chinese National Science Fund for Distinguished Young Scholars” in 2007, and became the chief scientist at National Synchrotron Radiation Laboratory of China in 2008. His current research interest covers the development of synchrotron radiation techniques and their appli-cations in advanced function materials.