Wyoming Water Supply Outlook Report - Home | NRCS · Web viewWyoming Water Supply Outlook Report2...
62
Wyoming Basin Outlook Report March 1, 2013 United States Departmen t of Agricultu re Natural Resources Conservat
Transcript of Wyoming Water Supply Outlook Report - Home | NRCS · Web viewWyoming Water Supply Outlook Report2...
Wyoming Basin Outlook Report March 1, 2013
United States Department of Agriculture
Natural Resources ConservationService
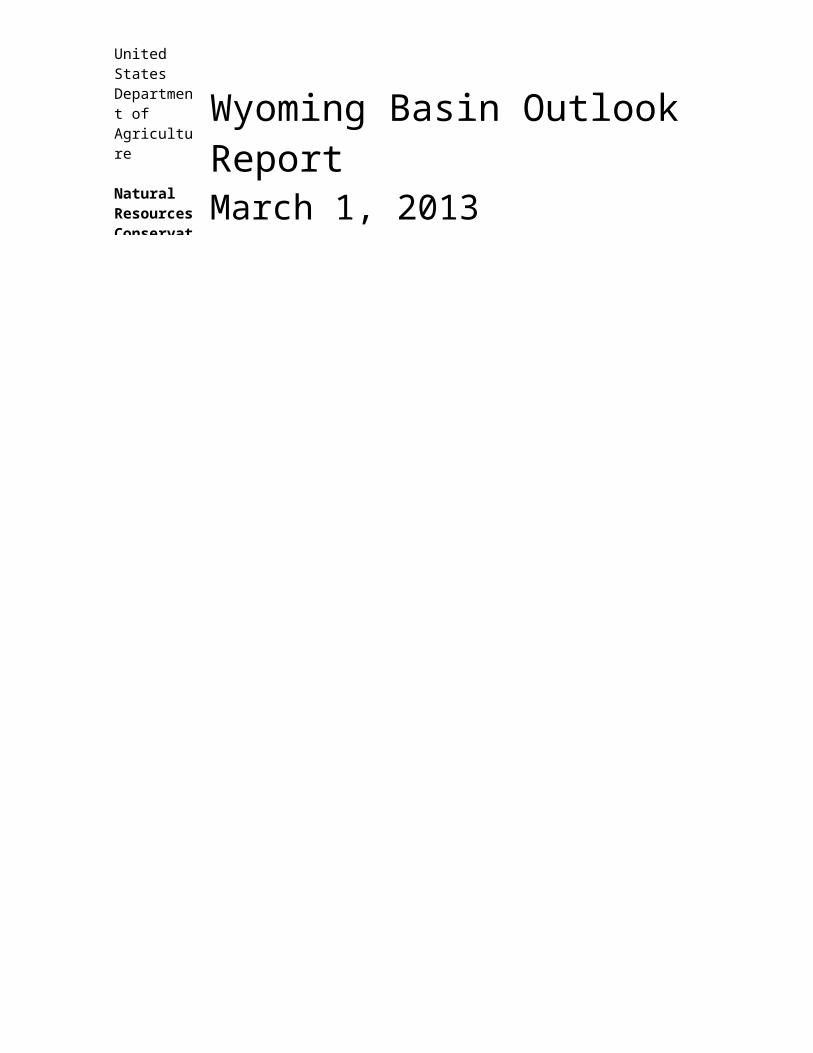
Blind Park SNOTEL (Black Hills)
For more water supply and resource management information, contact:
Lee Hackleman/Water Supply Specialist orKen Von Buettner/Hydrologic Technician100 East "B" Street Casper, WY 82601(307) 233-6744/6743
How forecasts are made
Most of the annual streamflow in the western United States originates as snowfall that has accumulated in the mountains during the winter and early spring. As the snowpack accumulates, hydrologists estimate the runoff that will occur when it melts. Measurements of snow water equivalent at selected manual snow courses and automated SNOTEL sites, along with precipitation, antecedent streamflow, and indices of the El Niño / Southern Oscillation are used in computerized statistical and simulation models to prepare runoff forecasts. Unless otherwise specified, all forecasts are for flows that would occur naturally without any upstream influences.
Forecasts of any kind, of course, are not perfect. Streamflow forecast uncertainty arises from three primary sources: (1) uncertain knowledge of future weather conditions, (2) uncertainty in the forecasting procedure, and (3) errors in the data. The forecast, therefore, must be interpreted not as a single value but rather as a range of values with specific probabilities of occurrence. The middle of the range is expressed by the 50% exceedance probability forecast, for which there is a 50% chance that the actual flow will be above, and a 50% chance that the actual flow will be below, this value. To describe the expected range around this 50% value, four other forecasts are provided, two smaller values (90% and 70% exceedance probability) and two larger values (30%, and 10% exceedance probability). For example, there is a 90% chance that the actual flow will be more than the 90% exceedance probability forecast. The others can be interpreted similarly.
The wider the spread is among these values, the more uncertain the forecast. As the season progresses, forecasts become more accurate, primarily because a greater portion of the future weather conditions become known; this is reflected by a narrowing of the range around the 50% exceedance probability forecast. Users should take this uncertainty into consideration when making operational decisions by selecting forecasts corresponding to the level of risk they are willing to assume about the amount of water to be expected. If users anticipate receiving a lesser supply of water, or if they wish to increase their chances of having an adequate supply of water for their operations, they may want to base their decisions on the 90% or 70% exceedance probability forecasts, or something in between. On the other hand, if users are concerned about receiving too much water (for example, threat of flooding), they may want to base their decisions on the 30% or10% exceedance probability forecasts, or something in between. Regardless of the forecast value users choose for operations, they should be prepared to deal with either more or less water. (Users should remember that even if the 90% exceedance probability forecast is used, there is still a 10% chance of receiving less than this amount.) By using the exceedance probability information, users can easily determine the chances of receiving more or less water.
The U.S. Department of Agriculture (USDA) prohibits discrimination against its customers. If you believe you experienced discrimination when obtaining services from USDA, participating in a USDA program, or participating in a program that receives financial assistance from USDA, you may file a complaint with USDA. Information about how to file a discrimination complaint is available from the Office of the Assistant Secretary for Civil Rights. USDA prohibits discrimination in all its programs and activities on the basis of race, color, national origin, age, disability, and where applicable, sex (including gender identity and expression), marital status, familial status, parental status, religion, sexual orientation, political beliefs, genetic information, reprisal, or because all or part of an individual’s income is derived from any public assistance program. (Not all prohibited bases apply to all programs.) To file a complaint of discrimination, complete, sign, and mail a program discrimination complaint form, available at any USDA office location or online at www.ascr.usda.gov, or write to: USDA Office of the Assistant Secretary for Civil Rights 1400 Independence Avenue, SW. Washington, DC 20250‐9410Or call toll free at (866) 632‐9992 (voice) to obtain additional information, the appropriate office or to request documents. Individuals who are deaf, hard of hearing, or have speech disabilities may contact USDA through the Federal Relay service at (800) 877‐8339 or (800) 845‐6136 (in Spanish). USDA is an equal opportunity provider, employer, and lender. Persons with disabilities who require alternative means for communication of program information (e.g., Braille, large print, audiotape, etc.) should contact USDA's TARGET Center at (202) 720‐2600 (voice and TDD).
Basin Outlook ReportsAndFederal - State - PrivateCooperative Snow Surveys
Wyoming Water Supply Outlook ReportGeneralThe snow water equivalent (SWE) across Wyoming is below normal for March 1st at 85%. Monthly precipitation for the basins varied from 40-162% of average. Year-to-date precipitation for Wyoming basins varies from 62-97% of average. Forecasted runoff varies from 15-105% of average across the Wyoming basins for an overall average of 72%. Basin reservoir levels for Wyoming vary from 39-172% of average for an overall average of 97%.
SnowpackSnow water equivalent (SWE), across Wyoming is below normal for this time of year at 85%. SWE in the NW portion of Wyoming is now about 88% of normal (76% of last year). NE Wyoming SWE is currently about 94% of normal (63% of last year). The SE Wyoming SWE is currently about 76% of normal (80% of last year). The SW Wyoming SWE is about 79% of normal (80% of last year).
PrecipitationLast month's precipitation was below average across Wyoming. The Lower North Platte Basin had the highest precipitation for the month at 162% of average. The Madison-Gallatin Basin had the lowest precipitation amount at 40% of average. The following table displays the major river basins and their departure from average for this month.
Departure | DepartureBasin from average | Basin from average-------------------- ------------ | ------------------- ------------Snake River -53% | Upper North Platte River -10%Madison-Gallatin -60% | Sweetwater River -55%Yellowstone -42% | Lower North Platte +62%Wind River -32% | Laramie River -12%Bighorn -11% | South Platte 0%Shoshone -35% | Little Snake River -23%Powder River -02% | Upper Green River -57%Tongue River +18% | Lower Green River -45%Belle Fourche -04% | Upper Bear River -54%Cheyenne +24% |
StreamsStream flow yield for April to September is expected to be below average across Wyoming. Most probable yield for the entire State of Wyoming is forecast to be about 72% (varying from 15-105% of average). The Snake River and Madison River Basins are expected to yield about 77% and 92% of average, respectively; 72-92% of average for the various forecast points in the basins. Yields from the Yellowstone and Clark's Fork are expected to be 90% and 90% respectively. Yields from the Wind and Bighorn River Basins are expected to be about 73 and 76% of average; varying from 53-94% of average in the basins. Yield from the Shoshone River Basin of Wyoming is expected to yield about 89%, varying from 85-91% of average. Yields from the Tongue & Powder River Basins are expected to be about 77% and 91% of average, respectively; varying from 77-105% of average. Yield for the Cheyenne River Basin is expected to be about 90% of average. Yields for the Upper, Lower North Platte, Sweetwater and Laramie Rivers of Wyoming are expected to be about 46%, 15%, 41, and 70% of average, respectively; varying from 15-71% of average. Yields for the Little Snake, Green River, and Little Bear of Wyoming are expected to be 51%,
Wyoming Water Supply Outlook Report 2 Mar 1, 2013

55%, and 68% of average respectively; yield estimates vary from 51-78% of average.
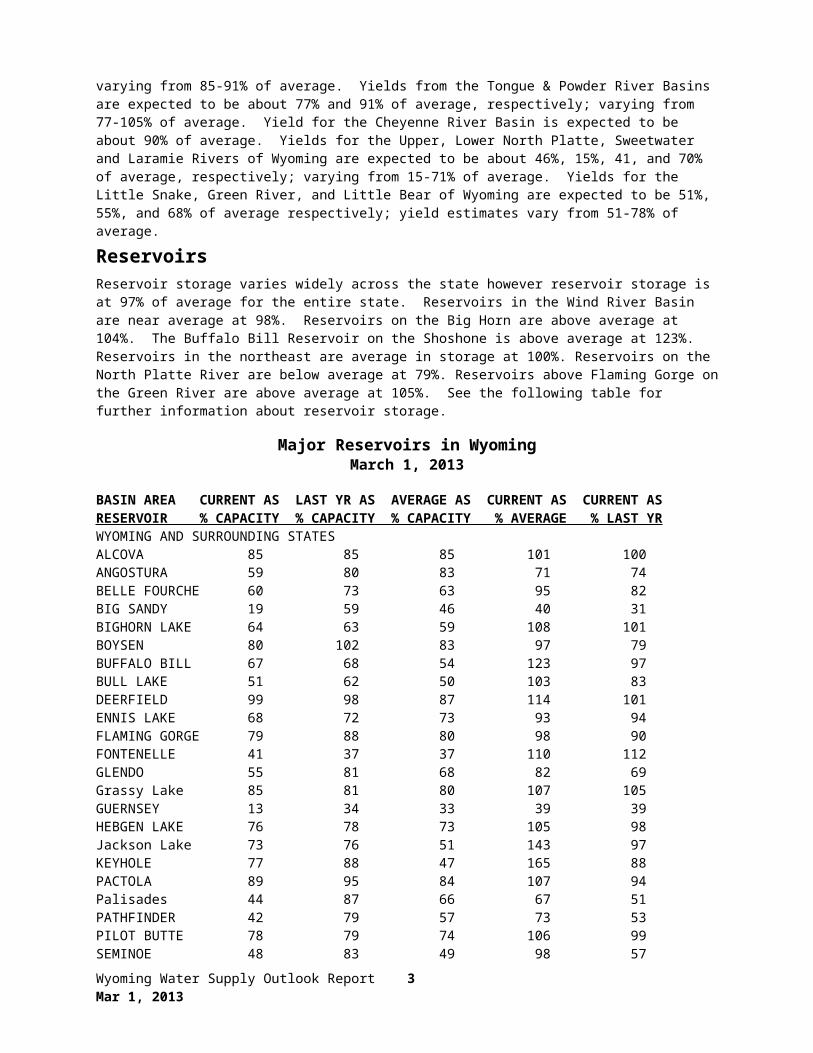
ReservoirsReservoir storage varies widely across the state however reservoir storage is at 97% of average for the entire state. Reservoirs in the Wind River Basin are near average at 98%. Reservoirs on the Big Horn are above average at 104%. The Buffalo Bill Reservoir on the Shoshone is above average at 123%. Reservoirs in the northeast are average in storage at 100%. Reservoirs on the North Platte River are below average at 79%. Reservoirs above Flaming Gorge on the Green River are above average at 105%. See the following table for further information about reservoir storage.
Major Reservoirs in WyomingMarch 1, 2013
BASIN AREA CURRENT AS LAST YR AS AVERAGE AS CURRENT AS CURRENT ASRESERVOIR % CAPACITY % CAPACITY % CAPACITY % AVERAGE % LAST YRWYOMING AND SURROUNDING STATES ALCOVA 85 85 85 101 100ANGOSTURA 59 80 83 71 74BELLE FOURCHE 60 73 63 95 82BIG SANDY 19 59 46 40 31BIGHORN LAKE 64 63 59 108 101BOYSEN 80 102 83 97 79BUFFALO BILL 67 68 54 123 97BULL LAKE 51 62 50 103 83DEERFIELD 99 98 87 114 101ENNIS LAKE 68 72 73 93 94FLAMING GORGE 79 88 80 98 90FONTENELLE 41 37 37 110 112GLENDO 55 81 68 82 69Grassy Lake 85 81 80 107 105GUERNSEY 13 34 33 39 39HEBGEN LAKE 76 78 73 105 98Jackson Lake 73 76 51 143 97KEYHOLE 77 88 47 165 88PACTOLA 89 95 84 107 94Palisades 44 87 66 67 51PATHFINDER 42 79 57 73 53PILOT BUTTE 78 79 74 106 99SEMINOE 48 83 49 98 57SHADEHILL 43 45 61 70 95TONGUE RIVER 61 77 36 172 80VIVA NAUGHTON RES 55 66 68 81 84WHEATLAND #2 AVERAGE NOT ESTABLISHED (CO)WOODRUFF NARROWS 15 86 55 28 18TOTAL 25 RESERV 58 77 60 97 76Raw KAF Totals Current=5450 Last Year=7189 Average=5625 Capacity=9383
Wyoming Water Supply Outlook Report 3 Mar 1, 2013
B A S I N S U M M A R Y O FSNOTEL and S N O W C O U R S E D A T A
MARCH 2013
SNOW SITE ELEVATION DATE SNOW WATER LAST NORMAL DEPTH CONTENT YEAR 81-10-----------------------------------------------------------------------
WYOMING Snow Course and SNOTEL StationsALBANY 9400 2/26/13 31 6.7 11.7 10.6ARAPAHO RIDGE SNTL 10960 3/01/13 52 13.4 15.2 --ASTER CREEK 7750 2/27/13 59 19.3 25.1 21.6BALD MOUNTAIN SNOTEL 9380 3/01/13 47 10.9 18.4 14.7BASE CAMP 7030 3/01/13 48 13.0 20.1 15.0BASE CAMP SNOTEL 7030 3/01/13 --- 13.2 18.3 13.5BATTLE MTN. SNOTEL 7440 3/01/13 29 6.9 10.7 9.9BEARLODGE DIVIDE 4680 2/25/13 11 2.4 1.3 1.6BEARTOOTH LK. SNOTEL 9280 3/01/13 49 12.8 20.9 16.7BEAR RIVER RS SNOTEL 8780 3/01/13 29 6.4 6.1 --BEAR TRAP SNOTEL 8200 3/01/13 31 6.7 7.9 4.4BIG GOOSE SNOTEL 7760 3/01/13 27 5.2 9.2 6.2BIG PARK 8620 2/22/13 42 10.6 13.2 14.0BIG SANDY SNOTEL 9080 3/01/13 38 8.1 12.0 10.1BLACK BEAR SNOTEL 7950 3/01/13 95 29.8 29.2 29.6BLACK'S FORK JUNCTN 8930 2/25/13 28 5.2 5.9 6.7BLACKS FORK JCT SNT 8870 3/01/13 28 5.1 4.9 --BLACKHALL MTN SNOTEL 9820 3/01/13 69 18.1 -- --BLACKWATER SNOTEL 9780 3/01/13 55 16.4 21.5 17.2BLIND BULL SNOTEL 8900 3/01/13 54 14.3 19.9 17.9BLIND PARK SNOTEL 6870 3/01/13 25 5.4 8.4 6.4BLUE RIDGE 9620 2/25/13 28 5.6 8.8 7.9BONE SPGS. SNOTEL 9350 3/01/13 44 10.8 18.0 12.0BROOKLYN LK. SNOTEL 10220 3/01/13 --- 12.5 16.6 15.0BUCK PASTURE SNOTEL 9700 3/01/13 39 9.2 -- --BUG LAKE SNOTEL 7950 3/01/13 39 11.6 12.7 14.8BURGESS JCT. SNOTEL 7880 3/01/13 36 7.7 11.5 8.3BURROUGHS CRK SNOTEL 8750 3/01/13 32 8.5 12.9 10.7BUTTER HILL 7880 2/26/13 38 9.0 10.1 11.5BURT'S-MILLER RANCH 7900 2/26/13 17 3.0 1.8 4.8BURTS-MILLER RANCH S 7860 3/01/13 18 3.5 5.3 3.5CAMERON PASS 10300 2/27/13 54 14.6 16.9 19.6CANYON SNOTEL 8090 3/01/13 39 8.6 10.7 10.5CASPER MTN. SNOTEL 7850 3/01/13 40 7.1 17.6 10.2CASTLE CREEK SNOTEL 8400 3/01/13 24 5.0 7.1 --CASTLE CREEK 8400 2/26/13 20 3.7 5.5 3.0CCC CAMP 7000 2/27/13 37 8.7 9.9 9.7CHALK CK #1 SNOTEL 9100 3/01/13 52 13.8 14.0 18.3CHAMBERS LAKE 9000 2/27/13 21 4.0 5.2 5.8CINNABAR PARK SNOTEL 9690 3/01/13 47 11.5 15.3 17.1CLOUD PEAK SNOTEL 9850 3/01/13 41 9.0 15.2 10.4COLE CANYON SNOTEL 5910 3/01/13 19 4.3 6.6 5.0COLD SPRINGS SNOTEL 9630 3/01/13 28 6.1 7.5 5.5COLUMBINE SNOTEL 9300 3/01/13 --- 15.5 17.9 19.8COTTONWOOD CR SNOTEL 7700 3/01/13 --- 14.3 17.3 16.9CROW CREEK SNOTEL 8830 3/01/13 18 3.9 7.7 6.7DARBY CANYON 8250 2/27/13 57 15.0 16.3 19.0DEADMAN HILL SNOTEL 10200 3/01/13 45 10.2 15.5 12.4DEEP LAKE 10500 2/25/13 76 22.5 27.5 --DEEP LAKE 10500 2/25/13 76 22.5 27.5 --DEER PARK SNOTEL 9700 3/01/13 33 9.5 10.6 10.8DIVIDE PEAK SNOTEL 8860 3/01/13 44 12.0 13.3 15.8Wyoming Water Supply Outlook Report 4 Mar 1, 2013

SNOW COURSE ELEVATION DATE SNOW WATER LAST MEDIAN DEPTH CONTENT YEAR 81-10DITCH CREEK 6870 2/26/13 10 2.1 3.7 3.1DOME LAKE SNOTEL 8880 3/01/13 35 6.9 13.2 8.7DU NOIR 8760 2/27/13 23 4.8 7.1 5.1EF BLACKS FORK GS SN 9360 3/01/13 42 10.1 8.5 --EAST RIM DIV SNOTEL 7930 3/01/13 33 7.9 10.2 8.1ELKHART PARK SNOTEL 9400 3/01/13 --- 7.7 11.6 9.4ELK RIVER SNOTEL 8600 3/01/13 --- 11.0 13.9 15.5EVENING STAR SNOTEL 9200 3/01/13 65 19.5 24.4 19.1FISHER CREEK SNOTEL 9100 3/01/13 78 25.8 28.5 25.8FOUR MILE MEADOWS 7860 3/01/13 40 9.3 9.4 9.6FOXPARK 9060 2/26/13 18 3.2 5.7 6.0GEYSER CREEK 8500 2/27/13 17 3.5 7.9 4.2GLADE CREEK 7040 2/28/13 54 14.7 22.4 18.6GRAND TARGHEE SNOTEL 9260 3/01/13 108 29.8 30.1 30.2GRANITE CRK SNOTEL 6770 3/01/13 44 10.1 15.0 13.8GRANNIER MEADOWS 8860 2/25/13 27 6.2 9.6 9.4GRASSY LAKE 7270 2/28/13 68 19.6 30.4 27.2GRASSY LAKE SNOTEL 7270 3/01/13 75 21.4 27.6 26.2GRAVE SPRINGS SNOTEL 8550 3/01/13 27 5.2 8.2 6.9GROS VENTRE SNOTEL 8750 3/01/13 37 8.3 8.5 9.7GROVER PARK DIVIDE 7000 2/27/13 30 6.9 9.2 8.4GUNSIGHT PASS SNOTEL 9820 3/01/13 38 9.0 10.6 10.6HAIRPIN TURN 9480 2/25/13 33 7.9 14.1 11.5HANSEN S.M. SNOTEL 8360 3/01/13 23 4.4 5.9 4.7HAMS FORK SNOTEL 7840 3/01/13 31 7.2 9.5 9.2HASKINS CREEK 8980 2/26/13 70 19.4 19.4 24.4HOBACK GS 6640 2/25/13 29 6.4 9.4 8.2HOBBS PARK SNOTEL 10100 3/01/13 40 8.8 13.1 9.7HUCKLEBERRY DIVIDE 7300 2/27/13 51 13.5 19.5 16.8INDIAN CREEK SNOTEL 9430 3/01/13 --- 14.6 17.8 19.0JACKPINE CREEK 7350 2/27/13 52 13.8 18.3 17.8JOE WRIGHT SNOTEL 10000 3/01/13 47 10.5 12.8 16.6KELLEY R.S. SNOTEL 8180 3/01/13 39 9.3 11.7 12.1KENDALL R.S. SNOTEL 7740 3/01/13 33 7.7 13.5 9.7LAKE CAMP 7780 3/02/13 34 8.8 7.6 7.8LA PRELE SNOTEL 8380 3/01/13 26 4.5 8.7 7.8LARSEN CREEK 9020 2/25/13 25 5.0 7.7 8.2LARSEN CREEK SNOTEL 9020 3/01/13 24 5.9 10.5 --LEWIS LAKE SNOTEL 7850 3/01/13 71 21.6 26.0 25.2LIBBY LODGE 8750 2/25/13 29 7.5 12.4 8.4LITTLE BEAR RUN 6240 2/26/13 13 2.8 -- 3.3LITTLE GOOSE SNOTEL 8870 3/01/13 30 6.2 10.4 --LITTLE SNAKE RIVER 8920 3/01/13 --- 15.5 18.6 19.7LITTLE WARM SNOTEL 9370 3/01/13 35 7.5 7.3 7.9LOOMIS PARK SNOTEL 8240 3/01/13 --- 8.9 12.9 11.7MADISON PLT SNOTEL 7750 3/01/13 60 17.3 18.1 17.8MALLO 6420 2/26/13 23 5.4 7.9 6.0MARQUETTE SNOTEL 8760 3/01/13 22 4.3 8.4 --MEDICINE LODGE LAKES 9340 2/27/13 34 7.5 11.2 7.6MIDDLE FORK 7420 2/25/13 19 2.9 6.1 4.0MIDDLE POWDER SNOTEL 7760 3/01/13 40 8.4 9.9 8.0MORAN 6750 3/01/13 31 5.1 13.2 10.4MOSS LAKE 9800 2/25/13 53 14.8 15.6 16.6MOUNT TOM 5560 2/28/13 17 3.0 5.2 3.7NEVER SUMMER SNOTEL 10280 3/01/13 51 10.8 12.1 --NEW FORK SNOTEL 8340 3/01/13 28 6.3 10.4 8.2NORRIS BASIN 7500 2/28/13 27 6.0 7.6 8.0
Wyoming Water Supply Outlook Report 5 Mar 1, 2013

SNOW COURSE ELEVATION DATE SNOW WATER LAST MEDIAN DEPTH CONTENT YEAR 81-10N.E. ENTRANCE SNOTEL 7350 3/01/13 24 6.1 9.3 8.2NORTH BARRETT CREEK 9400 2/26/13 56 13.4 14.4 17.0NORTH FRENCH SNOTEL 10130 3/01/13 66 17.0 18.4 21.1NORTH RAPID CK SNTL 6130 3/01/13 24 5.6 7.7 5.9NORTH TONGUE 8450 2/27/13 37 7.7 13.4 9.0OLD BATTLE SNOTEL 9920 3/01/13 65 19.0 20.8 23.9OLD FAITHFUL 7400 2/27/13 35 9.0 9.7 11.0ONION GULCH 8780 2/28/13 27 5.3 8.2 5.3OWL CREEK SNOTEL 8980 3/01/13 22 4.3 4.5 3.9PARKERS PEAK SNOTEL 9400 3/01/13 60 16.6 19.2 16.0PHILLIPS BNCH SNOTEL 8200 3/01/13 58 16.3 20.7 19.7POCKET CREEK 9350 2/25/13 33 8.8 9.2 9.0POCKET CREEK SNOTEL 9350 3/01/13 39 7.0 9.2 --POLE MOUNTAIN 8700 2/27/13 31 5.1 10.2 6.6POWDER RVR.PASS SNTL 9480 3/01/13 37 8.6 11.4 8.0PURGATORY GULCH 8970 2/26/13 36 8.2 10.4 8.8RANGER CREEK 8120 2/27/13 29 6.4 9.6 5.8RAWAH SNOTEL 9020 3/01/13 36 8.2 7.4 --RENO HILL SNOTEL 8500 3/01/13 43 7.7 15.0 10.0REUTER CANYON 6280 2/27/13 26 6.8 9.4 7.2ROACH SNOTEL 9400 3/01/13 43 9.3 12.2 12.4ROWDY CREEK 8300 2/25/13 40 10.2 16.5 13.8RYAN PARK 8400 2/26/13 37 7.6 8.8 9.4SAGE CK BASIN SNTL 7850 3/01/13 39 8.5 14.6 10.6SALT RIVER SNOTEL 7600 3/01/13 35 8.2 9.9 10.6SAND LAKE SNOTEL 10050 3/01/13 67 16.6 21.9 21.2SANDSTONE RS SNOTEL 8150 3/01/13 38 8.9 10.3 10.4SAWMILL DIVIDE 9260 2/25/13 43 8.6 14.4 9.6SHELL CREEK SNOTEL 9580 3/01/13 41 10.2 16.3 11.6SHERIDAN R.S. 7750 2/27/13 15 2.6 3.6 4.2SNAKE RIVER STATION 6920 2/27/13 46 12.3 19.0 16.1SNAKE RV STA SNOTEL 6920 3/01/13 43 11.3 16.8 14.2SNIDER BASIN SNOTEL 8060 3/01/13 33 8.1 11.8 9.6SNOW KING MTN 7660 2/26/13 33 8.2 10.2 11.2SOLDIER PARK SNOTEL 8780 3/01/13 14 3.1 12.8 --SOLDIER PARK 8780 2/26/13 17 3.0 4.9 3.2SOUR DOUGH 8460 2/26/13 25 4.0 5.4 4.2SOUTH BRUSH SNOTEL 8440 3/01/13 35 7.7 7.7 10.3SOUTH PASS SNOTEL 9040 3/01/13 35 7.8 12.9 11.4SPRING CRK. SNOTEL 9000 3/01/13 60 16.2 20.5 18.6STILLWATER CAMP 8550 2/25/13 27 5.0 6.1 8.0ST LAWRENCE ALT SNTL 8620 3/01/13 24 3.8 4.8 5.2SUCKER CREEK SNOTEL 8880 3/01/13 42 9.3 13.6 8.9SYLVAN LAKE SNOTEL 8420 3/01/13 52 13.9 15.7 15.9SYLVAN ROAD SNOTEL 7120 3/01/13 30 7.6 12.1 9.4T CROSS RANCH 7900 2/26/13 18 3.5 7.4 5.2TETON PASS W.S. 7740 2/27/13 52 14.9 21.4 21.1THUMB DIVIDE 7980 2/27/13 40 10.9 12.5 12.5THUMB DIVIDE SNOTEL 7980 3/01/13 44 12.0 13.5 12.3TIE CREEK SNOTEL 6870 3/01/13 20 4.3 6.9 4.3TIMBER CREEK SNOTEL 7950 3/01/13 17 3.0 4.6 3.7TOGWOTEE PASS SNOTEL 9580 3/01/13 60 16.0 18.8 17.7TOWER SNOTEL 10000 3/01/13 82 23.7 27.3 36.3TOWNSEND CRK SNOTEL 8700 3/01/13 24 4.2 8.1 6.5TRIPLE PEAK SNOTEL 8500 3/01/13 54 14.2 20.4 16.8TURPIN MEADOWS 6900 3/01/13 33 7.5 9.8 8.2TWENTY-ONE MILE 7150 3/01/13 44 13.4 11.6 12.4
Wyoming Water Supply Outlook Report 6 Mar 1, 2013

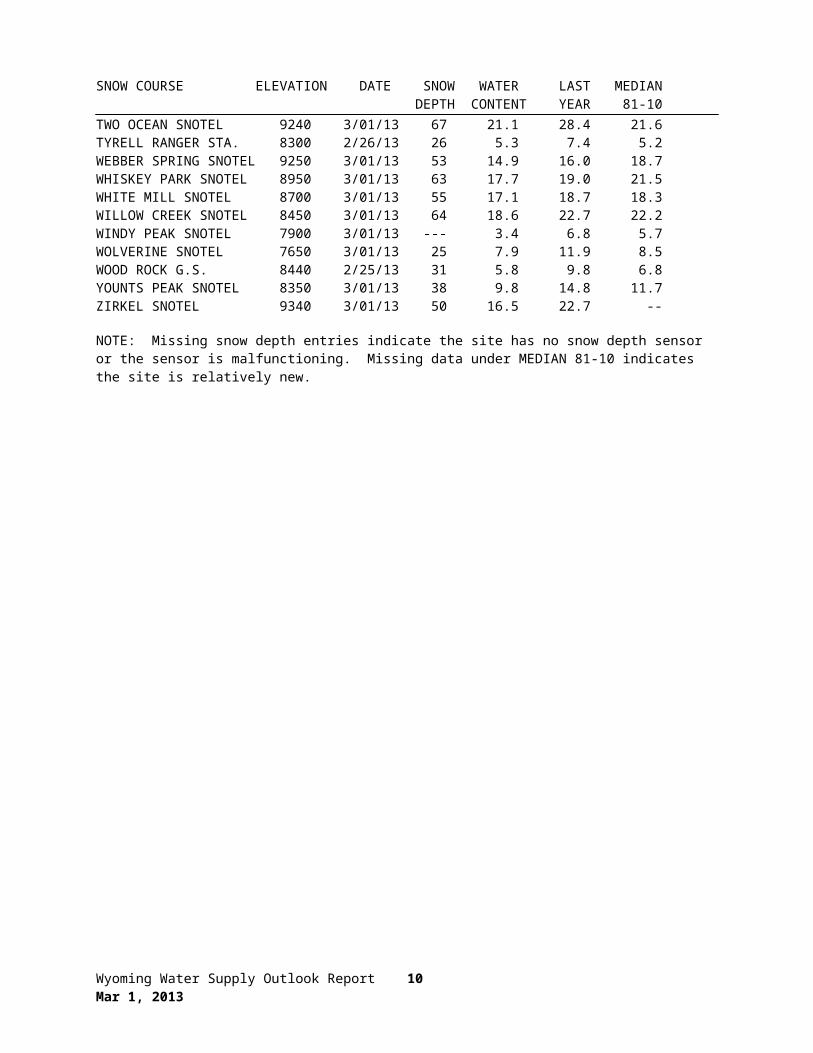
SNOW COURSE ELEVATION DATE SNOW WATER LAST MEDIAN DEPTH CONTENT YEAR 81-10TWO OCEAN SNOTEL 9240 3/01/13 67 21.1 28.4 21.6TYRELL RANGER STA. 8300 2/26/13 26 5.3 7.4 5.2WEBBER SPRING SNOTEL 9250 3/01/13 53 14.9 16.0 18.7WHISKEY PARK SNOTEL 8950 3/01/13 63 17.7 19.0 21.5WHITE MILL SNOTEL 8700 3/01/13 55 17.1 18.7 18.3WILLOW CREEK SNOTEL 8450 3/01/13 64 18.6 22.7 22.2WINDY PEAK SNOTEL 7900 3/01/13 --- 3.4 6.8 5.7WOLVERINE SNOTEL 7650 3/01/13 25 7.9 11.9 8.5WOOD ROCK G.S. 8440 2/25/13 31 5.8 9.8 6.8YOUNTS PEAK SNOTEL 8350 3/01/13 38 9.8 14.8 11.7ZIRKEL SNOTEL 9340 3/01/13 50 16.5 22.7 --
NOTE: Missing snow depth entries indicate the site has no snow depth sensor or the sensor is malfunctioning. Missing data under MEDIAN 81-10 indicates the site is relatively new.
Wyoming Water Supply Outlook Report 7 Mar 1, 2013

Wyoming Water Supply Outlook Report 8 Mar 1, 2013

Snake River BasinSnowThe Snake River Basin snow water equivalent (SWE) is 84% of normal. SWE in the Snake River Basin above Jackson Lake is 84% of normal. Pacific Creek Basin SWE is 87% of normal. SWE in the Buffalo Fork basin is 90% of normal. Gros Ventre River Basin SWE is 88% of normal. SWE in the Hoback River
drainage is 79% of normal. SWE in the Greys River drainage is 84% of normal. In the Salt River area SWE is 84% of normal. See the “Basin Summary of Snow Course Data” at the beginning of this report for a detailed listing of snow course information.
PrecipitationPrecipitation across the basin was below average last month. Monthly precipitation for the basin was 47% of average (40% of last year). Last month's percentages range from 25-76% of average for the 26 reporting stations. Water-year-to-date precipitation is 86% of average for the Snake River Basin (82% of last year). Year-to-date percentages range from 70-106% of average.
ReservoirsCurrent reservoir storage is 91% of average
for the 3 storage reservoirs in the basin. Grassy Lake storage is about 107% of average (12,900 ac-ft compared to 12,300 last year). Jackson Lake storage is 143% of average (621,300 ac-ft compared to 640,000 ac-ft last year). Palisades Reservoir storage is about 67% of average (1,254,500 ac-ft compared to 1,875,800 ac-ft last year). Detailed reservoir data is shown on the following page and on the reservoir storage summary at the beginning of this report.
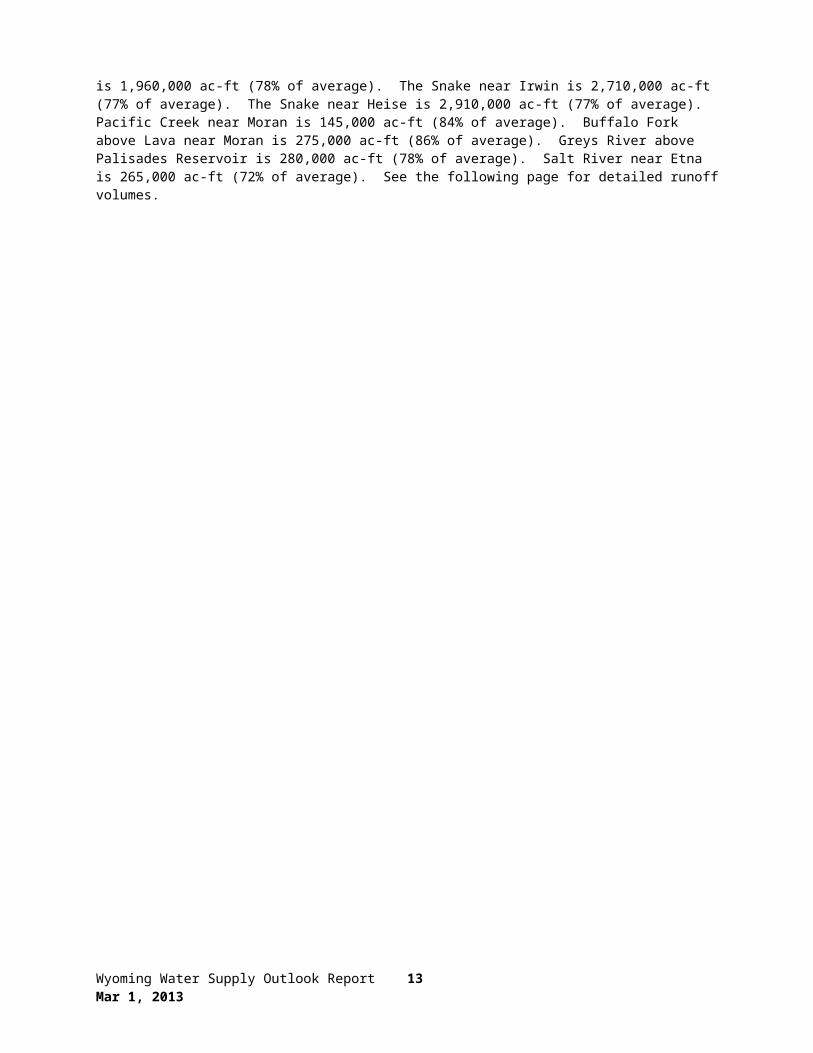
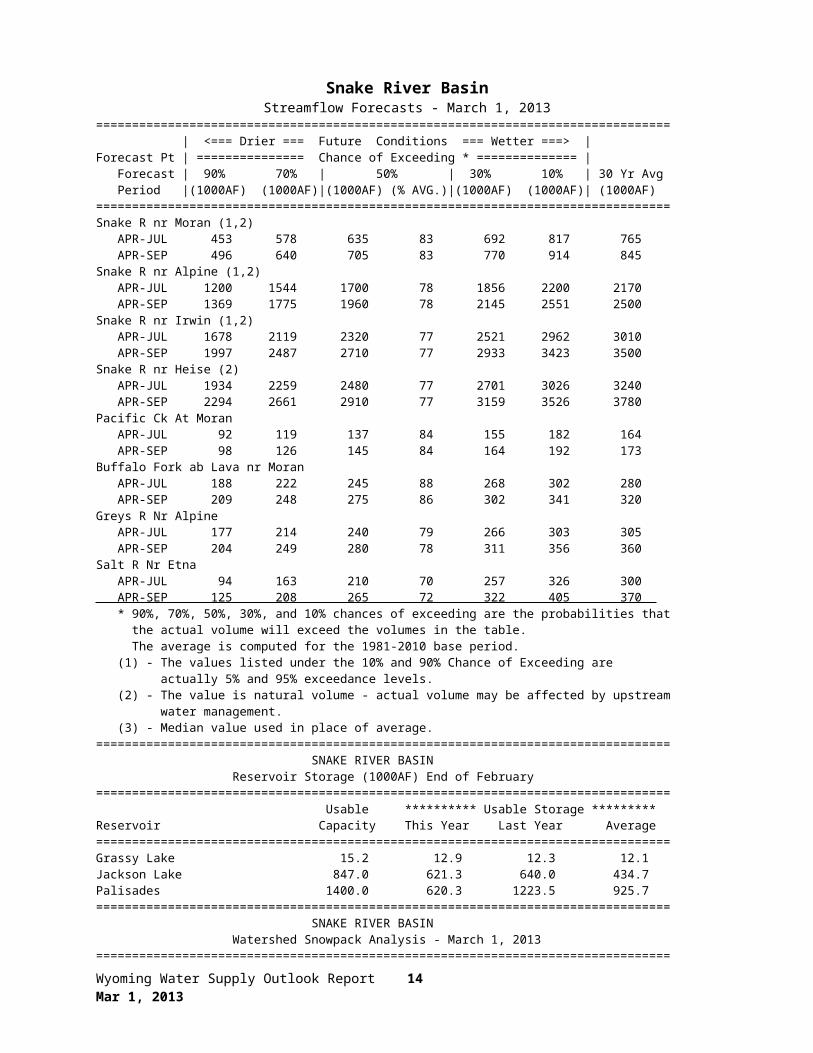
StreamflowThe 50% exceedance forecasts for April through September are below average for the basin. The Snake near Moran is 705,000 ac-ft 83% of average). Snake River above reservoir near Alpine is 1,960,000 ac-ft (78% of average). The Snake near Irwin is 2,710,000 ac-ft (77% of average). The Snake near Heise is 2,910,000 ac-ft (77% of average). Pacific Creek near Moran is 145,000 ac-ft (84% of average). Buffalo Fork above Lava near Moran is 275,000 ac-ft (86% of average). Greys River above Palisades Reservoir is 280,000 ac-ft (78% of average). Salt River near Etna is 265,000 ac-ft (72% of average). See the following page for detailed runoff volumes.
Wyoming Water Supply Outlook Report 9 Mar 1, 2013

Snake River BasinStreamflow Forecasts - March 1, 2013
================================================================================ | <=== Drier === Future Conditions === Wetter ===> |Forecast Pt | =============== Chance of Exceeding * ============== | Forecast | 90% 70% | 50% | 30% 10% | 30 Yr Avg Period |(1000AF) (1000AF)|(1000AF) (% AVG.)|(1000AF) (1000AF)| (1000AF)================================================================================Snake R nr Moran (1,2) APR-JUL 453 578 635 83 692 817 765 APR-SEP 496 640 705 83 770 914 845 Snake R nr Alpine (1,2) APR-JUL 1200 1544 1700 78 1856 2200 2170 APR-SEP 1369 1775 1960 78 2145 2551 2500 Snake R nr Irwin (1,2) APR-JUL 1678 2119 2320 77 2521 2962 3010 APR-SEP 1997 2487 2710 77 2933 3423 3500 Snake R nr Heise (2) APR-JUL 1934 2259 2480 77 2701 3026 3240 APR-SEP 2294 2661 2910 77 3159 3526 3780 Pacific Ck At Moran APR-JUL 92 119 137 84 155 182 164 APR-SEP 98 126 145 84 164 192 173 Buffalo Fork ab Lava nr Moran APR-JUL 188 222 245 88 268 302 280 APR-SEP 209 248 275 86 302 341 320 Greys R Nr Alpine APR-JUL 177 214 240 79 266 303 305 APR-SEP 204 249 280 78 311 356 360 Salt R Nr Etna APR-JUL 94 163 210 70 257 326 300 APR-SEP 125 208 265 72 322 405 370 * 90%, 70%, 50%, 30%, and 10% chances of exceeding are the probabilities that the actual volume will exceed the volumes in the table. The average is computed for the 1981-2010 base period. (1) - The values listed under the 10% and 90% Chance of Exceeding are actually 5% and 95% exceedance levels. (2) - The value is natural volume - actual volume may be affected by upstream water management. (3) - Median value used in place of average.================================================================================ SNAKE RIVER BASIN Reservoir Storage (1000AF) End of February================================================================================ Usable ********** Usable Storage *********Reservoir Capacity This Year Last Year Average================================================================================Grassy Lake 15.2 12.9 12.3 12.1 Jackson Lake 847.0 621.3 640.0 434.7 Palisades 1400.0 620.3 1223.5 925.7 ================================================================================ SNAKE RIVER BASIN Watershed Snowpack Analysis - March 1, 2013================================================================================ Number of This Year as Percent ofWatershed Data Sites Last Year Median================================================================================SNAKE above Jackson Lake 9 73 84PACIFIC CREEK 3 66 87BUFFALO FORK 4 81 90GROS VENTRE RIVER 4 82 83HOBACK RIVER 5 72 79GREYS RIVER 5 77 84SALT RIVER 5 82 84SNAKE above Palisades 31 75 83
Wyoming Water Supply Outlook Report 10 Mar 1, 2013
Madison-Gallatin Rivers BasinSnowSnow water equivalent (SWE) is at 91% of normal in the Madison-Gallatin
drainage. See the “Basin Summary of Snow Course Data” at the front of this report for details.
PrecipitationLast month precipitation in the Madison-Gallatin drainage was about 40% of average (34% of last year). The 6 reporting stations percentages range from 25-48% of average. Water-year-to-date precipitation is about 91% of average (90% of last year’s amount). Year to date percentage ranges from 75-96%.
ReservoirsEnnis Lake is storing about 27,800 ac-ft of water (68% of capacity, 93% of average or 94% of last year’s volume). Hebgen Lake is storing about 287,800 ac-ft
of water (76% of capacity, 105% of average or 98% of last year’s volume). Detailed reservoir data is shown on the following page and on the reservoir storage summary at the beginning of this report.
StreamflowThe 50% exceedance forecast for April through September is below average for the basin. Hebgen Reservoir inflow is 430,000 ac-ft (92% of average). See the following page for detailed runoff volumes.
Wyoming Water Supply Outlook Report 11 Mar 1, 2013

Madison-Gallatin Rivers Basin================================================================================ MADISON-GALLATIN RIVER BASINS Streamflow Forecasts - March 1, 2013================================================================================ | <=== Drier === Future Conditions === Wetter ===> | | |Forecast Pt | =============== Chance of Exceeding * ============== | Forecast | 90% 70% | 50% | 30% 10% | 30 Yr Avg Period |(1000AF) (1000AF)|(1000AF) (% AVG.)|(1000AF) (1000AF)| (1000AF)================================================================================Hebgen Reservoir Inflow (2) APR-JUL 265 305 330 89 355 395 370 APR-SEP 350 400 430 92 460 510 470 ================================================================================ * 90%, 70%, 50%, 30%, and 10% chances of exceeding are the probabilities that the actual volume will exceed the volumes in the table. The average is computed for the 1981-2010 base period. (1) - The values listed under the 10% and 90% Chance of Exceeding are actually 5% and 95% exceedance levels. (2) - The value is natural volume - actual volume may be affected by upstream water management. (3) - Median value used in place of average.================================================================================ MADISON-GALLATIN RIVER BASINS Reservoir Storage (1000AF) End of February================================================================================ Usable ********** Usable Storage *********Reservoir Capacity This Year Last Year Average================================================================================ENNIS LAKE 41.0 27.8 29.6 29.8 HEBGEN LAKE 377.5 287.8 293.5 274.6 ================================================================================
================================================================================ MADISON-GALLATIN RIVER BASINS Watershed Snowpack Analysis - March 1, 2013================================================================================ Number of This Year as Percent ofWatershed Data Sites Last Year Median================================================================================MADISON RIVER in WY 8 91 91 ================================================================================
Wyoming Water Supply Outlook Report 12 Mar 1, 2013

Yellowstone River BasinSnow
SWE in the Yellowstone drainage is at 95% of normal. See the “Basin Summary of Snow Course Data” at the front of this report for details.
PrecipitationLast month precipitation in the Yellowstone drainage was about 58% of average (49% of last year). The 15 reporting stations percentages range from 27-93% of average. Water-year-to-date precipitation is about 92% of average (82% of last year’s amount). Year to date percentage ranges from 56-122%.
ReservoirsNo reservoir data for the basin. StreamflowThe 50%
exceedance forecasts for April through September are below average for the basin. Yellowstone at Lake Outlet is 660,000 ac-ft (86% of average). Yellowstone at Corwin Springs will yield around 1,680,000 ac-ft (89% of average). Yellowstone near Livingston will yield around 1,920,000 ac-ft (90% of average). The Clark's Fork of the Yellowstone River should yield around 495,000 ac-ft (90% of average). See the following page for detailed runoff volumes.
Wyoming Water Supply Outlook Report 13 Mar 1, 2013
Yellowstone River BasinStreamflow Forecasts - March 1, 2013
================================================================================ | <=== Drier === Future Conditions === Wetter ===> | | |Forecast Pt | =============== Chance of Exceeding * ============== | Forecast | 90% 70% | 50% | 30% 10% | 30 Yr Avg Period |(1000AF) (1000AF)|(1000AF) (% AVG.)|(1000AF) (1000AF)| (1000AF)================================================================================Yellowstone R at Yellowstone Lake APR-JUL 385 455 500 87 545 615 575 APR-SEP 510 600 660 86 720 810 770
Yellowstone R at Corwin Springs APR-JUL 1130 1320 1440 91 1560 1750 1590 APR-SEP 1310 1530 1680 89 1830 2050 1880
Yellowstone R at Livingston APR-JUL 1250 1480 1640 91 1800 2030 1800 APR-SEP 1460 1730 1920 90 2110 2380 2140
================================================================================ * 90%, 70%, 50%, 30%, and 10% chances of exceeding are the probabilities that the actual volume will exceed the volumes in the table. The average is computed for the 1981-2010 base period. (1) - The values listed under the 10% and 90% Chance of Exceeding are actually 5% and 95% exceedance levels. (2) - The value is natural volume - actual volume may be affected by upstream water management. (3) - Median value used in place of average.================================================================================ YELLOWSTONE RIVER BASIN Watershed Snowpack Analysis - March 1, 2013================================================================================ Number of This Year as Percent ofWatershed Data Sites Last Year Median================================================================================YELLOWSTONE RIVER in WY 9 83 95CLARKS FORK in WY 8 79 94================================================================================
Wyoming Water Supply Outlook Report 14 Mar 1, 2013
Wind River BasinSnowThe Wind River Basin above Boysen Reservoir is 83% of normal for snow water equivalent at this time of the year. SWE in the Wind River above Dubois is 84% of normal. The Little Wind SWE is 85% of normal, and the Popo Agie drainage SWE is about 75% of normal. See the “Basin Summary of Snow Course
Data” at the front of this report for details.
PrecipitationLast month’s precipitation in the basin varied from 18-175% of average. Precipitation, for the basin, was about 68% of average from the 14 reporting stations; that is about 52% of last year's amount. Water year-to-date precipitation is 79% of average and about 72% of last year at this time. Year-to-date percentages range from 54-132% of average.
ReservoirsCurrent storage in Bull Lake is about 77,600 ac-ft (103% of average) - the reservoir is at 83% of last year. Boysen Reservoir is storing about 97% of average (478,900 ac-ft) – the reservoir is about 79% of last year.
Pilot Butte is at 106% of average (24,800 ac-ft) – the reservoir is at 99% of last year. Detailed reservoir data is shown on the following page and on the reservoir storage summary at the beginning of this report.
StreamflowThe 50% exceedance forecasts for the April through September runoff period are below average. Dinwoody Creek near Burris is 88,000 ac-ft (96% of average). The Wind River above Bull Lake Creek is 415,000 ac- ft (85% of average). Bull Lake Creek near Lenore is 154,000 ac-ft (91% of average). Wind River at Riverton will yield around 450,000 ac-ft (82% of average). Little Popo Agie River near Lander is around 27,000 ac-ft (55% of average). South Fork of Little Wind near Fort Washakie will yield around 67,000 ac-ft (82% of average). Little Wind River near Riverton will yield around 157,000 ac-ft (53% of average). Boysen Reservoir inflow will yield around 485,000 ac-ft (73% of average). See the following page for detailed runoff volumes.
Wyoming Water Supply Outlook Report 15 Mar 1, 2013

Wind River BasinStreamflow Forecasts - March 1, 2013
================================================================================ | <=== Drier === Future Conditions === Wetter ===> | | |Forecast Pt | =============== Chance of Exceeding * ============== | Forecast | 90% 70% | 50% | 30% 10% | 30 Yr Avg Period |(1000AF) (1000AF)|(1000AF) (% AVG.)|(1000AF) (1000AF)| (1000AF)================================================================================Dinwoody Ck nr Burris APR-JUL 49 57 62 94 67 75 66 APR-SEP 71 81 88 96 95 105 92 Wind R ab Bull Lake Ck (2) APR-JUL 225 290 335 84 380 445 400 APR-SEP 285 365 415 85 465 545 490 Bull Lake Ck nr Lenore APR-JUL 95 114 126 91 138 157 139 APR-SEP 116 138 154 91 170 192 169 Wind R at Riverton (2) APR-JUL 225 320 385 81 450 545 475 APR-SEP 260 375 450 82 525 640 550 Little Popo Agie R nr Lander APR-JUL 6.9 15.9 22 52 28 37 42 APR-SEP 10.8 20 27 55 34 43 49 SF Little Wind R nr Fort Washakie APR-JUL 39 51 59 82 67 79 72 APR-SEP 44 58 67 82 76 90 82 Little Wind R nr Riverton APR-JUL 5.0 82 134 50 186 265 270 APR-SEP 15.0 100 157 53 215 300 295 Boysen Reservoir Inflow (2) APR-JUL 50 280 435 71 590 820 610 APR-SEP 54 310 485 73 660 915 665 ================================================================================ * 90%, 70%, 50%, 30%, and 10% chances of exceeding are the probabilities that the actual volume will exceed the volumes in the table. The average is computed for the 1981-2010 base period. (1) - The values listed under the 10% and 90% Chance of Exceeding are actually 5% and 95% exceedance levels. (2) - The value is natural volume - actual volume may be affected by upstream water management. (3) - Median value used in place of average.================================================================================ WIND RIVER BASIN Reservoir Storage (1000AF) End of February================================================================================ Usable ********** Usable Storage *********Reservoir Capacity This Year Last Year Average================================================================================BULL LAKE 151.8 77.6 93.6 75.4 BOYSEN 596.0 478.9 608.1 495.8 PILOT BUTTE 31.6 24.8 25.1 23.3 ================================================================================ WIND RIVER BASIN Watershed Snowpack Analysis - March 1, 2013================================================================================ Number of This Year as Percent ofWatershed Data Sites Last Year Median================================================================================WIND RIVER above Dubois 7 71 84LITTLE WIND 2 70 85POPO AGIE 7 65 75WIND above Boysen Resv 17 70 83================================================================================
Wyoming Water Supply Outlook Report 16 Mar 1, 2013

Bighorn River BasinSnowThe Bighorn River Basin SWE above Bighorn Reservoir is at 95% of normal. The Nowood River is at 104% of normal. The Greybull River SWE is at 81% of
normal. Shell Creek SWE is 87% of normal. See the “Basin Summary of Snow Course Data” at the front of this report for details.
PrecipitationLast month's precipitation was 89% of average (47% of last year). Sites ranged from 53-175% of average for the month. Year-to-date precipitation is 90% of average; that is 70% of last year at this time. Year-to-date percentages, from the 14 reporting stations, range from 58-132%.
ReservoirsBoysen Reservoir is currently storing 478,900 ac-ft (97% of average). Bighorn Lake is now at 863,900 ac-ft
(108% of average). Boysen is currently storing 79% of last year volume at this time and Big Horn Lake is storing 101% of last year's volume. Detailed reservoir data is shown on the following page and on the reservoir storage summary at the beginning of this report.
StreamflowThe 50% exceedance forecasts for the April through September runoffs are anticipated to be below average. Boysen Reservoir inflow should yield 485,000 ac-ft (71% of average); the Greybull River near Meeteetse should yield around 164,000 ac-ft (93% of average); Shell Creek near Shell should yield around 62,000 ac-ft (94% of average) and the Bighorn River at Kane should yield around 685,000 ac-ft (76% of average). See the following page for detailed runoff volumes.
Wyoming Water Supply Outlook Report 17 Mar 1, 2013

Bighorn River BasinStreamflow Forecasts - March 1, 2013
================================================================================ | <=== Drier === Future Conditions === Wetter ===> | | |Forecast Pt | =============== Chance of Exceeding * ============== | Forecast | 90% 70% | 50% | 30% 10% | 30 Yr Avg Period |(1000AF) (1000AF)|(1000AF) (% AVG.)|(1000AF) (1000AF)| (1000AF)================================================================================Boysen Reservoir Inflow (2) APR-JUL 50 280 435 71 590 820 610 APR-SEP 54 310 485 73 660 915 665 Greybull R nr Meeteetse APR-JUL 84 106 121 92 136 158 131 APR-SEP 116 145 164 93 183 210 177 Shell Ck nr Shell APR-JUL 35 44 50 91 56 65 55 APR-SEP 45 55 62 94 69 79 66 Bighorn R at Kane (2) APR-JUL 115 425 635 76 845 1160 840 APR-SEP 119 455 685 76 915 1250 905 ================================================================================ * 90%, 70%, 50%, 30%, and 10% chances of exceeding are the probabilities that the actual volume will exceed the volumes in the table. The average is computed for the 1981-2010 base period. (1) - The values listed under the 10% and 90% Chance of Exceeding are actually 5% and 95% exceedance levels. (2) - The value is natural volume - actual volume may be affected by upstream water management. (3) - Median value used in place of average.================================================================================ BIGHORN RIVER BASIN Reservoir Storage (1000AF) End of February================================================================================ Usable ********** Usable Storage *********Reservoir Capacity This Year Last Year Average================================================================================BOYSEN 596.0 478.9 608.1 495.8 BIGHORN LAKE 1356.0 863.9 855.1 797.1 ================================================================================ BIGHORN RIVER BASIN Watershed Snowpack Analysis - March 1, 2013================================================================================ Number of This Year as Percent ofWatershed Data Sites Last Year Median================================================================================NOWOOD RIVER 7 73 104GREYBULL RIVER 1 56 81SHELL CREEK 4 61 87BIGHORN (Boysen-Bighorn) 12 66 95================================================================================
Wyoming Water Supply Outlook Report 18 Mar 1, 2013

Shoshone River BasinSnowSnowpack in this basin is above normal for this time of year. Snow Water
Equivalent (SWE) is 92% of normal in the Shoshone River Basin. The Clarks Fork River drainage SWE is 94% of normal. See the “Basin Summary of Snow Course Data” at the front of this report for details.
PrecipitationPrecipitation for last month was 65% of average (46% of last year). Monthly percentages range from 33-250% of average. The basin year-to-date precipitation is now 93% of average (74% of last year). Year-to-date percentages range from 53-117% of average for the 5 reporting stations.
ReservoirsCurrent storage in Buffalo Bill Reservoir is about 123% of average (97% of last year's storage) – the reservoir
is at about 67% of capacity. Currently, about 430,000 ac-ft are stored in the reservoir compared to 442,000 ac-ft last year. Detailed reservoir data is shown on the following page and on the reservoir storage summary at the beginning of this report.
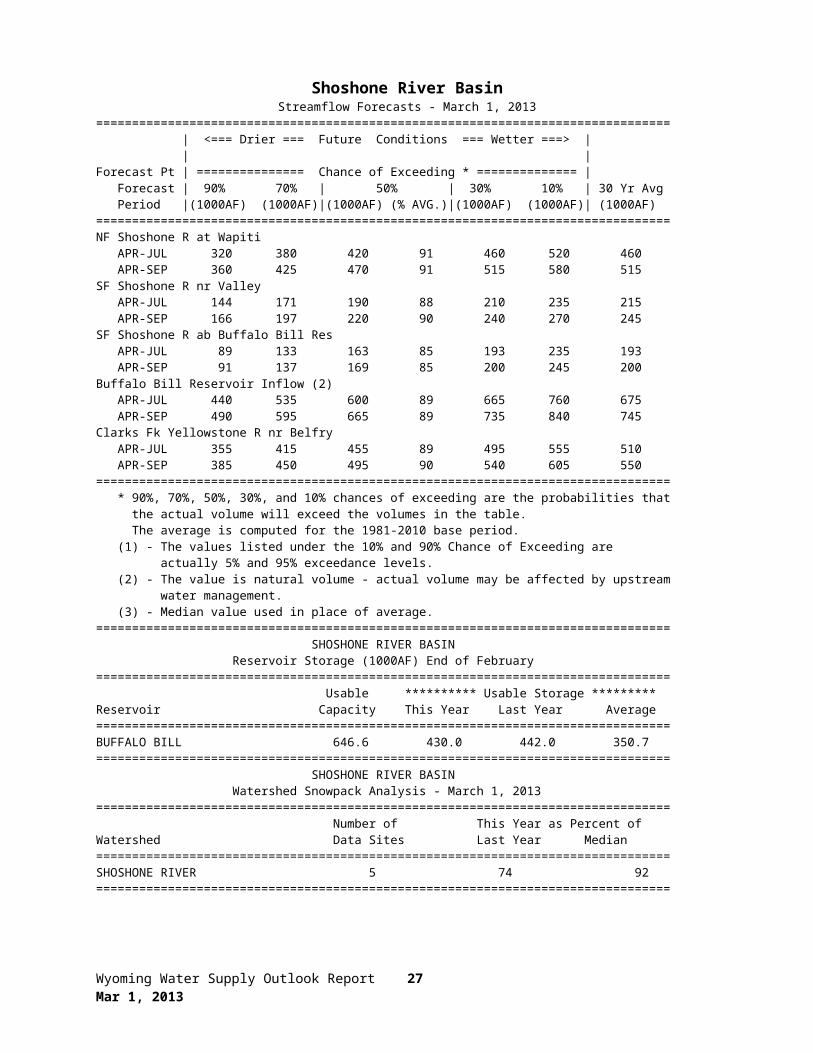
StreamflowThe 50% exceedance forecasts for the April through September period are expected to be below average for the basin. The North Fork Shoshone River at Wapiti is 470,000 ac-ft (91% of average). The South Fork of the Shoshone River near Valley is 220,000 ac-ft (90% of average), and the South Fork above Buffalo Bill Reservoir runoff is 169,000 ac-ft (85% of average). The Buffalo Bill Reservoir inflow is expected to yield around 665,000 ac-ft (89% of average). See the following page for detailed runoff volumes.
Wyoming Water Supply Outlook Report 19 Mar 1, 2013

Shoshone River BasinStreamflow Forecasts - March 1, 2013
================================================================================ | <=== Drier === Future Conditions === Wetter ===> | | |Forecast Pt | =============== Chance of Exceeding * ============== | Forecast | 90% 70% | 50% | 30% 10% | 30 Yr Avg Period |(1000AF) (1000AF)|(1000AF) (% AVG.)|(1000AF) (1000AF)| (1000AF)================================================================================NF Shoshone R at Wapiti APR-JUL 320 380 420 91 460 520 460 APR-SEP 360 425 470 91 515 580 515 SF Shoshone R nr Valley APR-JUL 144 171 190 88 210 235 215 APR-SEP 166 197 220 90 240 270 245 SF Shoshone R ab Buffalo Bill Res APR-JUL 89 133 163 85 193 235 193 APR-SEP 91 137 169 85 200 245 200 Buffalo Bill Reservoir Inflow (2) APR-JUL 440 535 600 89 665 760 675 APR-SEP 490 595 665 89 735 840 745 Clarks Fk Yellowstone R nr Belfry APR-JUL 355 415 455 89 495 555 510 APR-SEP 385 450 495 90 540 605 550 ================================================================================ * 90%, 70%, 50%, 30%, and 10% chances of exceeding are the probabilities that the actual volume will exceed the volumes in the table. The average is computed for the 1981-2010 base period. (1) - The values listed under the 10% and 90% Chance of Exceeding are actually 5% and 95% exceedance levels. (2) - The value is natural volume - actual volume may be affected by upstream water management. (3) - Median value used in place of average.================================================================================ SHOSHONE RIVER BASIN Reservoir Storage (1000AF) End of February================================================================================ Usable ********** Usable Storage *********Reservoir Capacity This Year Last Year Average================================================================================BUFFALO BILL 646.6 430.0 442.0 350.7 ================================================================================ SHOSHONE RIVER BASIN Watershed Snowpack Analysis - March 1, 2013================================================================================ Number of This Year as Percent ofWatershed Data Sites Last Year Median================================================================================SHOSHONE RIVER 5 74 92================================================================================
Wyoming Water Supply Outlook Report 20 Mar 1, 2013

Powder River BasinSnow
Snow water equivalent (SWE) in the Upper Powder River drainage is 105% of normal. SWE in the Clear Creek drainage is 91% of normal. Crazy Woman Creek drainage is 102% of normal. Powder River Basin SWE in Wyoming is 99% of normal. For more information see “Basin Summary of Snow Course Data” at the beginning of this report.
PrecipitationLast month’s precipitation was 98% of average for the 11 reporting stations (54% of last year). Monthly percentages range from 21-169% of average. Year-to-date precipitation is 97% of average in the basin; this is 75% of last year at this time. Precipitation for the year ranges from 61-132% of average.
ReservoirsNo reservoir data for the basin.
StreamflowThe 50% exceedance forecasts for the April through September period are expected to be below average for the basin. The Middle Fork of the Powder River near Barnum is 16,200 ac-ft (95% of average). The North Fork of the Powder River near Hazelton should yield around 10,400 ac-ft (105% of average). Rock Creek near Buffalo will yield about 19,500 ac-ft (89% of average), and Piney Creek at Kearny should yield about 39,000 ac-ft (83% of average). The Powder River at Moorhead is 178,000 ac-ft (91% of average). The Powder River near Locate is 200,000 ac-ft (91% of average). See the following page for detailed runoff volumes.
Wyoming Water Supply Outlook Report 21 Mar 1, 2013

Powder River BasinStreamflow Forecasts - March 1, 2013
================================================================================ | <=== Drier === Future Conditions === Wetter ===> | | |Forecast Pt | =============== Chance of Exceeding * ============== | Forecast | 90% 70% | 50% | 30% 10% | 30 Yr Avg Period |(1000AF) (1000AF)|(1000AF) (% AVG.)|(1000AF) (1000AF)| (1000AF)================================================================================MF Powder R nr Barnum APR-JUL 9.5 13.0 15.3 95 17.6 21 16.1 APR-SEP 10.2 13.8 16.2 95 18.6 22 17.0 NF Powder R nr Hazelton APR-JUL 6.4 8.3 9.6 106 10.9 12.8 9.1 APR-SEP 7.0 9.0 10.4 105 11.8 13.8 9.9 Rock Ck nr Buffalo APR-JUL 8.5 13.0 16.1 87 19.2 24 18.6 APR-SEP 11.3 16.2 19.5 89 23 28 22 Piney Ck at Kearny APR-JUL 11.5 26 36 82 46 61 44 APR-SEP 14.1 29 39 83 49 64 47 Powder R at Moorhead APR-JUL 43 111 157 89 205 270 177 APR-SEP 60 130 178 91 225 295 196 Powder R nr Locate APR-JUL 42 122 177 89 230 310 199 APR-SEP 55 141 200 91 260 345 220 ================================================================================ * 90%, 70%, 50%, 30%, and 10% chances of exceeding are the probabilities that the actual volume will exceed the volumes in the table. The average is computed for the 1981-2010 base period. (1) - The values listed under the 10% and 90% Chance of Exceeding are actually 5% and 95% exceedance levels. (2) - The value is natural volume - actual volume may be affected by upstream water management. (3) - Median value used in place of average.================================================================================ POWDER RIVER BASIN Watershed Snowpack Analysis - March 1, 2013================================================================================ Number of This Year as Percent ofWatershed Data Sites Last Year Median================================================================================UPPER POWDER RIVER 5 75 105CLEAR CREEK 4 53 91CRAZY WOMAN CREEK 3 72 102POWDER RIVER in WY 9 64 99================================================================================
Wyoming Water Supply Outlook Report 22 Mar 1, 2013

Tongue River BasinSnow
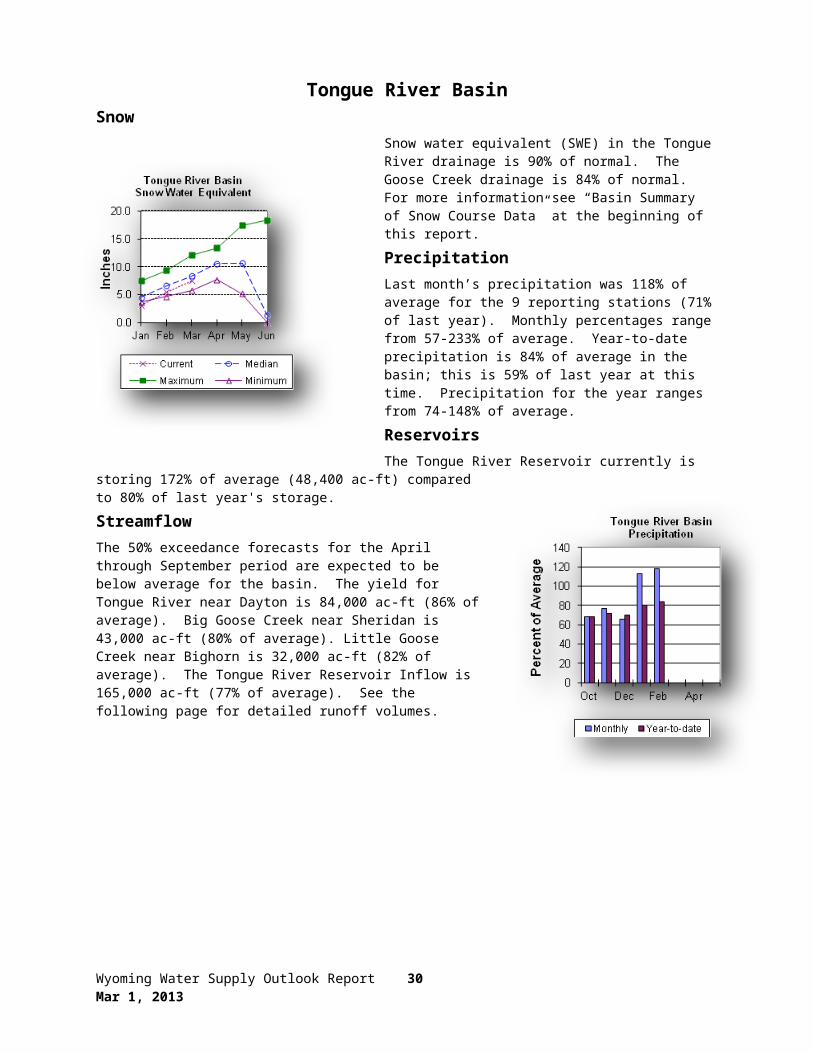
Snow water equivalent (SWE) in the Tongue River drainage is 90% of normal. The Goose Creek drainage is 84% of normal. For more information see “Basin Summary of Snow Course Data” at the beginning of this report.
PrecipitationLast month’s precipitation was 118% of average for the 9 reporting stations (71% of last year). Monthly percentages range from 57-233% of average. Year-to-date precipitation is 84% of average in the basin; this is 59% of last year at this time. Precipitation for the year ranges from 74-148% of average.
ReservoirsThe Tongue River Reservoir currently is storing 172% of average (48,400 ac-ft) compared to 80% of last year's storage.
StreamflowThe 50% exceedance forecasts for the April through September period are expected to be below average for the basin. The yield for Tongue River near Dayton is 84,000 ac-ft (86% of average). Big Goose Creek near Sheridan is 43,000 ac-ft (80% of average). Little Goose Creek near Bighorn is 32,000 ac-ft (82% of average). The Tongue River Reservoir Inflow is 165,000 ac-ft (77% of average). See the following page for detailed runoff volumes.
Wyoming Water Supply Outlook Report 23 Mar 1, 2013

Tongue River BasinStreamflow Forecasts - March 1, 2013
================================================================================ | <=== Drier === Future Conditions === Wetter ===> | | |Forecast Pt | =============== Chance of Exceeding * ============== | Forecast | 90% 70% | 50% | 30% 10% | 30 Yr Avg Period |(1000AF) (1000AF)|(1000AF) (% AVG.)|(1000AF) (1000AF)| (1000AF)================================================================================Tongue R nr Dayton (2) APR-JUL 42 60 73 85 86 104 86 APR-SEP 50 70 84 86 98 118 98 Big Goose Ck nr Sheridan APR-JUL 15.5 27 35 76 43 54 46 APR-SEP 23 35 43 80 51 63 54 Little Goose Ck nr Bighorn APR-JUL 13.0 20 25 81 30 37 31 APR-SEP 18.9 27 32 82 37 45 39 Tongue River Reservoir Inflow (2) APR-JUL 35 101 145 75 189 255 193 APR-SEP 49 118 165 77 210 280 215 ================================================================================ * 90%, 70%, 50%, 30%, and 10% chances of exceeding are the probabilities that the actual volume will exceed the volumes in the table. The average is computed for the 1981-2010 base period. (1) - The values listed under the 10% and 90% Chance of Exceeding are actually 5% and 95% exceedance levels. (2) - The value is natural volume - actual volume may be affected by upstream water management. (3) - Median value used in place of average.================================================================================ TONGUE RIVER BASIN Reservoir Storage (1000AF) End of February================================================================================ Usable ********** Usable Storage *********Reservoir Capacity This Year Last Year Average================================================================================TONGUE RIVER 79.1 48.4 60.6 28.2 ================================================================================ TONGUE RIVER BASIN Watershed Snowpack Analysis - March 1, 2013================================================================================ Number of This Year as Percent ofWatershed Data Sites Last Year Median================================================================================GOOSE CREEK 3 57 84TONGUE RIVER BASIN 9 60 90================================================================================
Wyoming Water Supply Outlook Report 24 Mar 1, 2013

Belle Fourche River BasinSnowThe Belle Fourche River Basin SWE is 97% of normal at this time of year. For
more information see “Basin Summary of Snow Course Data” at the beginning of this report.
PrecipitationPrecipitation for last month was 96% of average or 48% of last year in the Black Hills. There were 3 reporting stations. Year-to-date precipitation is 69% of average and 68% of last year’s amount.
ReservoirsBelle Fourche reservoir is storing 95% of average (107,200 ac-ft), about 60% of capacity. Keyhole reservoir is storing 165% of average (149,200 ac-ft), about 77% of capacity. Shadehill reservoir is
storing 70% of average (35,200 ac-ft), about 43% of capacity. Detailed reservoir data is shown on the following page and on the reservoir storage summary at the beginning of this report.
StreamflowThere are no streamflow forecast points for the basin.
Wyoming Water Supply Outlook Report 25 Mar 1, 2013

Belle Fourche River Basin Streamflow Forecasts - March 1, 2013================================================================================ | <=== Drier === Future Conditions === Wetter ===> | | |Forecast Pt | =============== Chance of Exceeding * ============== | Forecast | 90% 70% | 50% | 30% 10% | 30 Yr Avg Period |(1000AF) (1000AF)|(1000AF) (% AVG.)|(1000AF) (1000AF)| (1000AF)================================================================================ * 90%, 70%, 50%, 30%, and 10% chances of exceeding are the probabilities that the actual volume will exceed the volumes in the table. The average is computed for the 1981-2010 base period. (1) - The values listed under the 10% and 90% Chance of Exceeding are actually 5% and 95% exceedance levels. (2) - The value is natural volume - actual volume may be affected by upstream water management. (3) - Median value used in place of average.================================================================================ BELLE FOURCHE RIVER BASIN Reservoir Storage (1000AF) End of February================================================================================ Usable ********** Usable Storage *********Reservoir Capacity This Year Last Year Average================================================================================BELLE FOURCHE 178.4 107.2 130.9 113.0 KEYHOLE 193.8 149.2 170.2 90.6 SHADEHILL 81.4 35.2 37.0 50.0 ================================================================================ BELLE FOURCHE RIVER BASIN Watershed Snowpack Analysis - March 1, 2013================================================================================ Number of This Year as Percent ofWatershed Data Sites Last Year Median================================================================================BELLE FOURCHE 6 74 97================================================================================
Wyoming Water Supply Outlook Report 26 Mar 1, 2013

Cheyenne River BasinSnowThe Cheyenne River Basin SWE is 90% of normal at this time of year. For more information see “Basin Summary of Snow Course Data” at the beginning of this
report.
PrecipitationPrecipitation for last month was 124% of average or 86% of last year in the Black Hills. There were 4 reporting stations. Monthly percentages range from 25-219%. Year-to-date precipitation is 91% of average and 66% of last year’s amount. Yearly percentages range from 76-109% of average.
ReservoirsAngostura is currently storing 71% of average (72,200 ac-ft), about 59% of capacity. Deerfield reservoir is storing 114% of average (15,100 ac-ft), about 99% of capacity. Pactola reservoir is storing 107% of average (49,100 ac-ft), about 89% of capacity. Detailed reservoir data is
shown on the following page and on the reservoir storage summary at the beginning of this report.
StreamflowThe following runoff values are the 50% exceedance forecasts for the Apr through July period. The Deerfield Reservoir Inflow is expected to be 4,700 ac-ft (90% of average). Pactola Reservoir Inflow is expected to yield around 19,500 ac-ft (89% of average). See the following page for detailed runoff volumes.
Wyoming Water Supply Outlook Report 27 Mar 1, 2013
Cheyenne River BasinStreamflow Forecasts - March 1, 2013
================================================================================ | <=== Drier === Future Conditions === Wetter ===> | | |Forecast Pt | =============== Chance of Exceeding * ============== | Forecast | 90% 70% | 50% | 30% 10% | 30 Yr Avg Period |(1000AF) (1000AF)|(1000AF) (% AVG.)|(1000AF) (1000AF)| (1000AF)================================================================================Deerfield Reservoir Inflow (2) MAR-JUL 1.8 4.0 5.6 90 7.2 9.4 6.2 APR-JUL 2.4 3.7 4.7 90 5.8 7.7 5.2 Pactola Reservoir Inflow (2) MAR-JUL 5.2 15.8 23 92 30 41 25 Pactola Reservoir Inflow APR-JUL 8.2 14.3 19.5 89 25 36 22 ================================================================================ * 90%, 70%, 50%, 30%, and 10% chances of exceeding are the probabilities that the actual volume will exceed the volumes in the table. The average is computed for the 1981-2010 base period. (1) - The values listed under the 10% and 90% Chance of Exceeding are actually 5% and 95% exceedance levels. (2) - The value is natural volume - actual volume may be affected by upstream water management. (3) - Median value used in place of average.================================================================================ CHEYENNE RIVER BASIN Reservoir Storage (1000AF) End of February================================================================================ Usable ********** Usable Storage *********Reservoir Capacity This Year Last Year Average================================================================================ANGOSTURA 122.1 72.2 98.2 101.7 DEERFIELD 15.2 15.1 14.9 13.2 PACTOLA 55.0 49.1 52.2 46.0 ================================================================================ CHEYENNE RIVER BASIN Watershed Snowpack Analysis - March 1, 2013================================================================================ Number of This Year as Percent ofWatershed Data Sites Last Year Median================================================================================CHEYENNE BASIN 7 68 90================================================================================
Wyoming Water Supply Outlook Report 28 Mar 1, 2013

Upper North Platte River BasinSnowThe stations above Seminoe Reservoir are showing about 78% of normal (SWE) for this time of the year. SWE in the drainage area above Northgate is 73% of
normal at this time. SWE in the Encampment River drainage is about 82% of normal. Brush Creek SWE for the year is about 81% of normal. Medicine Bow and Rock Creek drainages SWE are about 83% of normal. For more information see “Basin Summary of Snow Course Data” at the beginning of this report.
PrecipitationTwelve reporting stations show last month’s precipitation at 90% of average or 68% of last year's amount. Precipitation varied from 45-156% of average last month. Total water-year-to-date precipitation is about 79% of average for the basin, which is about 86% of last year's amount. Year to date percentage ranges from 70-101% of average.
ReservoirsSeminoe Reservoir is estimated to be storing
485,600 ac-ft or 48% of capacity. Seminoe Reservoir is also storing about 98% of average for this time of the year and 57% of last year. Detailed reservoir data is shown on the following page and on the reservoir storage summary at the beginning of this report.
StreamflowThe following yields are the 50% exceedance forecasts for the April through September period and are expected to be below average for the Upper North Platte River Basin. Yield for the North Platte River near Northgate will be around 95,000 ac-ft (38% of average). The Encampment River near Encampment is 90,000 ac-ft (65% of average). Rock Creek near Arlington is 37,000 ac-ft (71% of average). Seminoe Reservoir inflow should be around 355,000 ac-ft (46% of average). See the following table for more detailed information on projected runoff.
Wyoming Water Supply Outlook Report 29 Mar 1, 2013

Upper North Platte River BasinStreamflow Forecasts - March 1, 2013
================================================================================ | <=== Drier === Future Conditions === Wetter ===> | | |Forecast Pt | =============== Chance of Exceeding * ============== | Forecast | 90% 70% | 50% | 30% 10% | 30 Yr Avg Period |(1000AF) (1000AF)|(1000AF) (% AVG.)|(1000AF) (1000AF)| (1000AF)================================================================================North Platte R nr Northgate APR-JUL 25 41 86 38 131 197 225 APR-SEP 30 45 95 38 145 220 250 Encampment R nr Encampment APR-JUL 42 67 84 65 101 126 129 APR-SEP 45 72 90 65 108 135 138 Rock Ck nr Arlington APR-JUL 19.1 29 35 71 41 51 49 APR-SEP 20 30 37 71 44 54 52 Sweetwater R nr Alcova APR-JUL 6.5 10.0 22 37 34 51 59 APR-SEP 7.5 12.8 26 41 39 58 64 Seminoe Reservoir Inflow (2) APR-JUL 105 159 330 46 500 755 715 APR-SEP 110 168 355 46 540 820 770 ================================================================================ * 90%, 70%, 50%, 30%, and 10% chances of exceeding are the probabilities that the actual volume will exceed the volumes in the table. The average is computed for the 1981-2010 base period. (1) - The values listed under the 10% and 90% Chance of Exceeding are actually 5% and 95% exceedance levels. (2) - The value is natural volume - actual volume may be affected by upstream water management. (3) - Median value used in place of average.================================================================================ UPPER NORTH PLATTE RIVER BASIN Reservoir Storage (1000AF) End of February================================================================================ Usable ********** Usable Storage *********Reservoir Capacity This Year Last Year Average================================================================================SEMINOE 1016.7 485.6 845.8 493.1 ================================================================================ UPPER NORTH PLATTE RIVER BASIN Watershed Snowpack Analysis - March 1, 2013================================================================================ Number of This Year as Percent ofWatershed Data Sites Last Year Median================================================================================N PLATTE above Northgate 7 87 73ENCAMPMENT RIVER 4 90 82BRUSH CREEK 5 93 81MEDICINE BOW & ROCK CREEKS 2 83 83N PLATTE above Seminoe 18 88 78================================================================================
Wyoming Water Supply Outlook Report 30 Mar 1, 2013
Sweetwater River BasinSnowSWE for the Sweetwater River Basin is at 72% of normal. For more information
see “Basin Summary of Snow Course Data” at the beginning of this report.
PrecipitationLast month’s precipitation was 45% of average or 36% of last year's amount. The water year-to-date precipitation for the basin is currently 62% of average (63% of last year).
ReservoirsReservoir storage is as follows: Pathfinder 427,500 ac-ft (73% of average). Last year at this time the reservoir was 799,500 ac-ft.
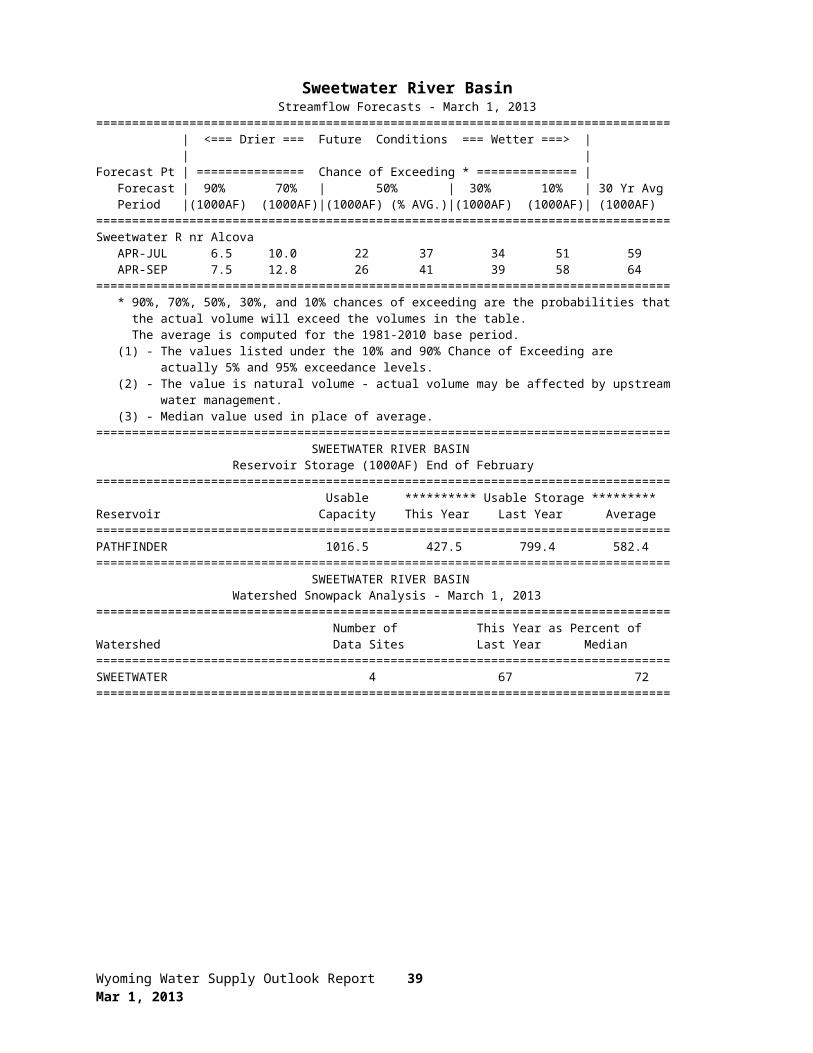
StreamflowThe following yields are based on the 50% exceedance forecasts for the April through September period. The Sweetwater River near Pathfinder is forecast to yield about 26,000 ac-ft (41% of average). See the following table for more detailed information on projected runoff.
Wyoming Water Supply Outlook Report 31 Mar 1, 2013

Sweetwater River BasinStreamflow Forecasts - March 1, 2013
================================================================================ | <=== Drier === Future Conditions === Wetter ===> | | |Forecast Pt | =============== Chance of Exceeding * ============== | Forecast | 90% 70% | 50% | 30% 10% | 30 Yr Avg Period |(1000AF) (1000AF)|(1000AF) (% AVG.)|(1000AF) (1000AF)| (1000AF)================================================================================Sweetwater R nr Alcova APR-JUL 6.5 10.0 22 37 34 51 59 APR-SEP 7.5 12.8 26 41 39 58 64 ================================================================================ * 90%, 70%, 50%, 30%, and 10% chances of exceeding are the probabilities that the actual volume will exceed the volumes in the table. The average is computed for the 1981-2010 base period. (1) - The values listed under the 10% and 90% Chance of Exceeding are actually 5% and 95% exceedance levels. (2) - The value is natural volume - actual volume may be affected by upstream water management. (3) - Median value used in place of average.================================================================================ SWEETWATER RIVER BASIN Reservoir Storage (1000AF) End of February================================================================================ Usable ********** Usable Storage *********Reservoir Capacity This Year Last Year Average================================================================================PATHFINDER 1016.5 427.5 799.4 582.4 ================================================================================ SWEETWATER RIVER BASIN Watershed Snowpack Analysis - March 1, 2013================================================================================ Number of This Year as Percent ofWatershed Data Sites Last Year Median================================================================================SWEETWATER 4 67 72================================================================================
Wyoming Water Supply Outlook Report 32 Mar 1, 2013

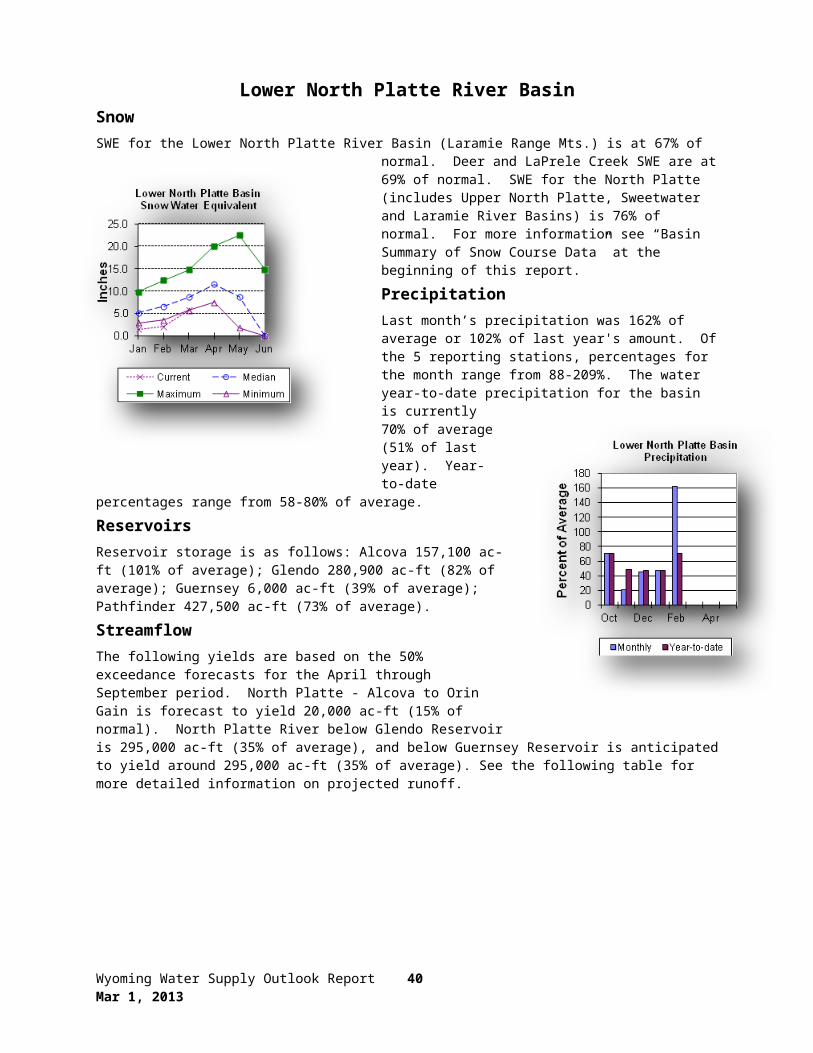
Lower North Platte River BasinSnowSWE for the Lower North Platte River Basin (Laramie Range Mts.) is at 67% of
normal. Deer and LaPrele Creek SWE are at 69% of normal. SWE for the North Platte (includes Upper North Platte, Sweetwater and Laramie River Basins) is 76% of normal. For more information see “Basin Summary of Snow Course Data” at the beginning of this report.
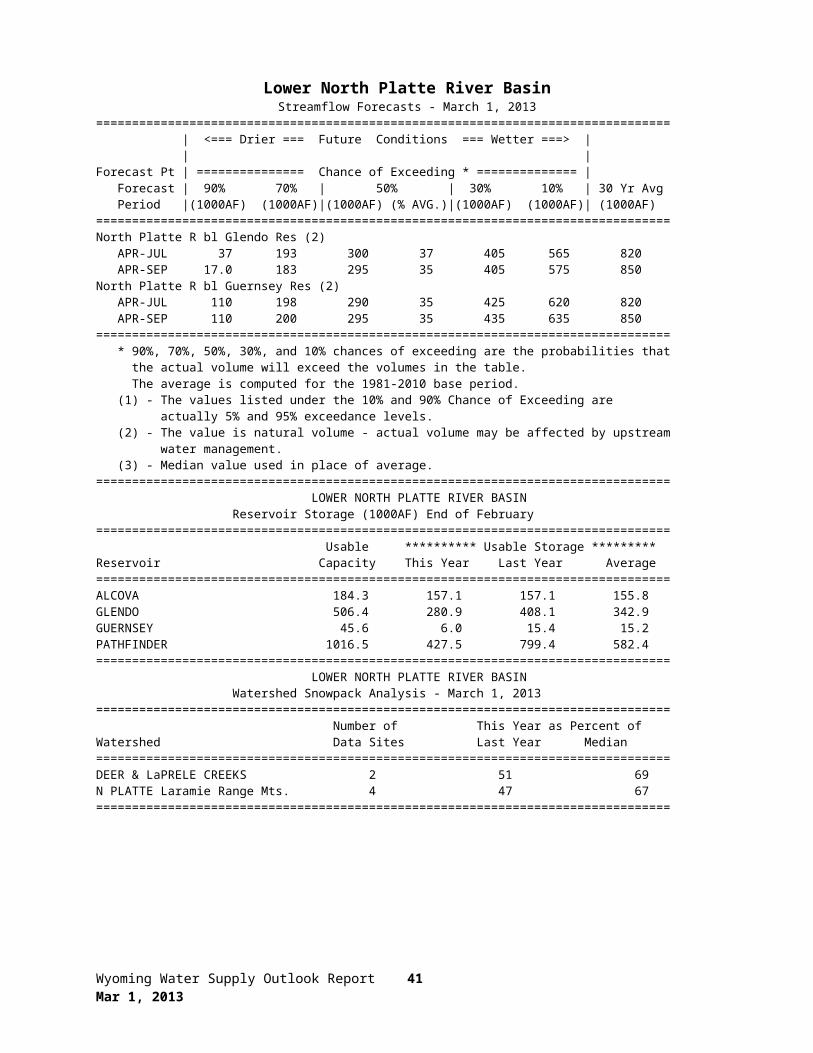
PrecipitationLast month’s precipitation was 162% of average or 102% of last year's amount. Of the 5 reporting stations, percentages for the month range from 88-209%. The water year-to-date precipitation for the basin is currently 70% of average (51% of last year). Year-to-date percentages range from 58-80% of average.
ReservoirsReservoir storage
is as follows: Alcova 157,100 ac-ft (101% of average); Glendo 280,900 ac-ft (82% of average); Guernsey 6,000 ac-ft (39% of average); Pathfinder 427,500 ac-ft (73% of average).
StreamflowThe following yields are based on the 50% exceedance forecasts for the April through September period. North Platte - Alcova to Orin Gain is forecast to yield 20,000 ac-ft (15% of normal). North Platte River below Glendo Reservoir is 295,000 ac-ft (35% of average), and below Guernsey Reservoir is anticipated to yield around 295,000 ac-ft (35% of average). See the following table for more detailed information on projected runoff.
Wyoming Water Supply Outlook Report 33 Mar 1, 2013

Lower North Platte River BasinStreamflow Forecasts - March 1, 2013
================================================================================ | <=== Drier === Future Conditions === Wetter ===> | | |Forecast Pt | =============== Chance of Exceeding * ============== | Forecast | 90% 70% | 50% | 30% 10% | 30 Yr Avg Period |(1000AF) (1000AF)|(1000AF) (% AVG.)|(1000AF) (1000AF)| (1000AF)================================================================================North Platte R bl Glendo Res (2) APR-JUL 37 193 300 37 405 565 820 APR-SEP 17.0 183 295 35 405 575 850 North Platte R bl Guernsey Res (2) APR-JUL 110 198 290 35 425 620 820 APR-SEP 110 200 295 35 435 635 850 ================================================================================ * 90%, 70%, 50%, 30%, and 10% chances of exceeding are the probabilities that the actual volume will exceed the volumes in the table. The average is computed for the 1981-2010 base period. (1) - The values listed under the 10% and 90% Chance of Exceeding are actually 5% and 95% exceedance levels. (2) - The value is natural volume - actual volume may be affected by upstream water management. (3) - Median value used in place of average.================================================================================ LOWER NORTH PLATTE RIVER BASIN Reservoir Storage (1000AF) End of February================================================================================ Usable ********** Usable Storage *********Reservoir Capacity This Year Last Year Average================================================================================ALCOVA 184.3 157.1 157.1 155.8 GLENDO 506.4 280.9 408.1 342.9 GUERNSEY 45.6 6.0 15.4 15.2 PATHFINDER 1016.5 427.5 799.4 582.4 ================================================================================ LOWER NORTH PLATTE RIVER BASIN Watershed Snowpack Analysis - March 1, 2013================================================================================ Number of This Year as Percent ofWatershed Data Sites Last Year Median================================================================================DEER & LaPRELE CREEKS 2 51 69N PLATTE Laramie Range Mts. 4 47 67================================================================================
Wyoming Water Supply Outlook Report 34 Mar 1, 2013

Laramie River BasinSnow
SWE for the Laramie River Basin above mouth is at 72% of normal. SWE for the Laramie River above Laramie is 72% of normal. SWE for the Little Laramie River is 74% of normal. For more information see “Basin Summary of Snow Course Data” at the beginning of this report.
PrecipitationLast month’s precipitation was 88% of average or 56% of last year's amount. Of the 5 reporting stations, percentages for the month range from 29-210%. The water year-to-date precipitation for the basin is currently 72% of average (68% of last year). Year-to-date percentages range from 66-78% of average.
ReservoirsReservoir storage is as follows:
Wheatland #2 24,200 ac-ft (last year it was at 75,100 ac-ft).
StreamflowThe following yields are based on the 50% exceedance forecasts for the April through September period. Laramie River near Woods Landing should yield around 88,000 ac-ft (70% of average). The Little Laramie near Filmore should produce about 36,000 ac-ft (66% of average). See the following table for more detailed information on projected runoff.
Wyoming Water Supply Outlook Report 35 Mar 1, 2013

Laramie River BasinStreamflow Forecasts - March 1, 2013
================================================================================ | <=== Drier === Future Conditions === Wetter ===> | | |Forecast Pt | =============== Chance of Exceeding * ============== | Forecast | 90% 70% | 50% | 30% 10% | 30 Yr Avg Period |(1000AF) (1000AF)|(1000AF) (% AVG.)|(1000AF) (1000AF)| (1000AF)================================================================================Laramie R nr Woods APR-JUL 45 66 80 70 94 115 115 APR-SEP 49 72 88 70 104 127 126 Little Laramie R nr Filmore APR-JUL 14.3 26 34 67 42 54 51 APR-SEP 14.0 27 36 66 45 58 55 ================================================================================ * 90%, 70%, 50%, 30%, and 10% chances of exceeding are the probabilities that the actual volume will exceed the volumes in the table. The average is computed for the 1981-2010 base period. (1) - The values listed under the 10% and 90% Chance of Exceeding are actually 5% and 95% exceedance levels. (2) - The value is natural volume - actual volume may be affected by upstream water management. (3) - Median value used in place of average.================================================================================ LARAMIE RIVER BASIN Reservoir Storage (1000AF) End of February================================================================================ Usable ********** Usable Storage *********Reservoir Capacity This Year Last Year Average================================================================================WHEATLAND #2 98.9 24.2 75.1 ---- ================================================================================ LARAMIE RIVER BASIN Watershed Snowpack Analysis - March 1, 2013================================================================================ Number of This Year as Percent ofWatershed Data Sites Last Year Median================================================================================LARAMIE RIVER abv Laramie 6 69 72LITTLE LARAMIE RIVER 5 66 74LARAMIE RIVER above mouth 12 66 72NORTH PLATTE TOTAL RIVER BAS 35 77 76================================================================================
Wyoming Water Supply Outlook Report 36 Mar 1, 2013

South Platte River BasinSnow
SWE for the South Platte River Basin is at 69% of normal. For more information see “Basin Summary of Snow Course Data” at the beginning of this report.
PrecipitationLast month’s precipitation was 100% of average or 60% of last year's amount. The water year-to-date precipitation for the basin is currently 76% of average (64% of last year).
ReservoirsNo reservoir data for the basin.
StreamflowThere are no streamflow
forecast points for the basin.
Wyoming Water Supply Outlook Report 37 Mar 1, 2013

SOUTH PLATTE RIVER BASINStreamflow Forecasts - March 1, 2013
================================================================================ | <=== Drier === Future Conditions === Wetter ===> | | |Forecast Pt | =============== Chance of Exceeding * ============== | Forecast | 90% 70% | 50% | 30% 10% | 30 Yr Avg Period |(1000AF) (1000AF)|(1000AF) (% AVG.)|(1000AF) (1000AF)| (1000AF)================================================================================================================================================================ * 90%, 70%, 50%, 30%, and 10% chances of exceeding are the probabilities that the actual volume will exceed the volumes in the table. The average is computed for the 1981-2010 base period. (1) - The values listed under the 10% and 90% Chance of Exceeding are actually 5% and 95% exceedance levels. (2) - The value is natural volume - actual volume may be affected by upstream water management. (3) - Median value used in place of average.================================================================================ SOUTH PLATTE RIVER BASIN Watershed Snowpack Analysis - March 1, 2013================================================================================ Number of This Year as Percent ofWatershed Data Sites Last Year Median================================================================================SOUTH PLATTE RIVER 7 70 69================================================================================
Wyoming Water Supply Outlook Report 38 Mar 1, 2013

Little Snake River BasinSnowCurrently, snow water equivalent (SWE) in the Little Snake River drainage is
78% of normal. For more information see “Basin Summary of Snow Course Data” at the beginning of this report.
PrecipitationPrecipitation across the basin was 77% of average (57% of last year) for the 8 reporting stations. Last month’s precipitation ranged from 65-123% of average. The Little Snake River basin water-year-to-date precipitation is currently 76% of average (85% of last year). Year-to-date percentages range from 65-85% of average.
ReservoirsHigh Savery Dam - 7,400 ac-ft (average storage is 12,900 ac-ft).
StreamflowThe 50% exceedance forecast for the April through July time frame on the Little Snake River drainage is expected to be below average this year. The Little Snake River near Slater should yield around 89,000 ac-ft (57% of average). The Little Snake River at Savery is estimated to yield around 175,000 ac-ft (51% of average). See the following table for more detailed information on projected runoff.
Wyoming Water Supply Outlook Report 39 Mar 1, 2013
Little Snake River BasinStreamflow Forecasts - March 1, 2013
================================================================================ | <=== Drier === Future Conditions === Wetter ===> | | |Forecast Pt | =============== Chance of Exceeding * ============== | Forecast | 90% 70% | 50% | 30% 10% | 30 Yr Avg Period |(1000AF) (1000AF)|(1000AF) (% AVG.)|(1000AF) (1000AF)| (1000AF)================================================================================Little Snake R nr Slater (2) APR-JUL 55 74 89 57 105 131 156 Little Snake R nr Savery (2) APR-JUL 79 132 175 51 224 308 345 ================================================================================ * 90%, 70%, 50%, 30%, and 10% chances of exceeding are the probabilities that the actual volume will exceed the volumes in the table. The average is computed for the 1981-2010 base period. (1) - The values listed under the 10% and 90% Chance of Exceeding are actually 5% and 95% exceedance levels. (2) - The value is natural volume - actual volume may be affected by upstream water management. (3) - Median value used in place of average.================================================================================ LITTLE SNAKE RIVER BASIN Reservoir Storage (1000AF) End of February================================================================================ Usable ********** Usable Storage *********Reservoir Capacity This Year Last Year Average================================================================================HIGH SAVERY NO REPORT ================================================================================ LITTLE SNAKE RIVER BASIN Watershed Snowpack Analysis - March 1, 2013================================================================================ Number of This Year as Percent ofWatershed Data Sites Last Year Median================================================================================LITTLE SNAKE RIVER 10 85 78================================================================================
Wyoming Water Supply Outlook Report 40 Mar 1, 2013
Upper Green River BasinSnowSWE in the Green River Basin above Warren Bridge is about 84% of normal. SWE for the West Side of Upper Green River Basin is about 82% of normal. Newfork
River Basin SWE is now about 86% of normal. Big Sandy-Eden Valley Basin is 72% of normal. SWE in the Green River Basin above Fontenelle Reservoir is about 83% of normal. For more information see “Basin Summary of Snow Course Data” at the beginning of this report.
PrecipitationThe 12 reporting precipitation sites in the basin were 43% of average last month (37% of last year). Last month’s precipitation varied from 13-78% of average. Water year-to-date precipitation is about 79% of average (73% of last year). Year to date percentage of average ranges from 64-89% for the reporting stations.
ReservoirStorage in Big Sandy Reservoir is 7,100 ac-ft or 19% of capacity. This is 40% of
average. Fontenelle Reservoir is 140,400 ac-ft or 41% of capacity; 110% of average. This is 102% of average for the Upper Green River basin. Detailed reservoir data is shown on the following page and on the reservoir storage summary at the beginning of this report.
StreamflowThe 50% exceedance forecasts for the April through July runoff period in the Upper Green River Basin are forecast to be below average. The yield on the Green River at Warren Bridge is 180,000 ac-ft (74% of average). Pine Creek above Fremont Lake is 76,000 ac-ft (78% of average). New Fork River near Big Piney is 235,000 ac-ft (66% of average). Fontenelle Reservoir Inflow is estimated to be 430,000 ac-ft (59% of average), and Big Sandy near Farson is expected to be around 34,000 ac-ft (65% of average). See the following table for more detailed information on projected runoff.
Wyoming Water Supply Outlook Report 41 Mar 1, 2013
Upper Green River BasinStreamflow Forecasts - March 1, 2013
================================================================================ | <=== Drier === Future Conditions === Wetter ===> | | |Forecast Pt | =============== Chance of Exceeding * ============== | Forecast | 90% 70% | 50% | 30% 10% | 30 Yr Avg Period |(1000AF) (1000AF)|(1000AF) (% AVG.)|(1000AF) (1000AF)| (1000AF)================================================================================Green R at Warren Bridge APR-JUL 128 158 180 74 204 241 245 Pine Ck ab Fremont Lake APR-JUL 60 69 76 78 83 94 98 New Fork R nr Big Piney APR-JUL 136 192 235 66 282 360 355 Fontenelle Reservoir Inflow (2) APR-JUL 234 344 430 59 526 685 725 Big Sandy R nr Farson APR-JUL 21 28 34 65 40 51 52 ================================================================================ * 90%, 70%, 50%, 30%, and 10% chances of exceeding are the probabilities that the actual volume will exceed the volumes in the table. The average is computed for the 1981-2010 base period. (1) - The values listed under the 10% and 90% Chance of Exceeding are actually 5% and 95% exceedance levels. (2) - The value is natural volume - actual volume may be affected by upstream water management. (3) - Median value used in place of average.================================================================================ UPPER GREEN RIVER BASIN Reservoir Storage (1000AF) End of February================================================================================ Usable ********** Usable Storage *********Reservoir Capacity This Year Last Year Average================================================================================BIG SANDY 38.3 7.1 22.6 17.7 FONTENELLE 344.8 140.4 125.9 127.6 ================================================================================ UPPER GREEN RIVER BASIN Watershed Snowpack Analysis - March 1, 2013================================================================================ Number of This Year as Percent ofWatershed Data Sites Last Year Median================================================================================GREEN above Warren Bridge 5 75 84UPPER GREEN (West Side) 5 71 82NEWFORK RIVER 3 74 86BIG SANDY/EDEN VALLEY 2 63 72GREEN above Fontenelle 14 73 83================================================================================
Wyoming Water Supply Outlook Report 42 Mar 1, 2013
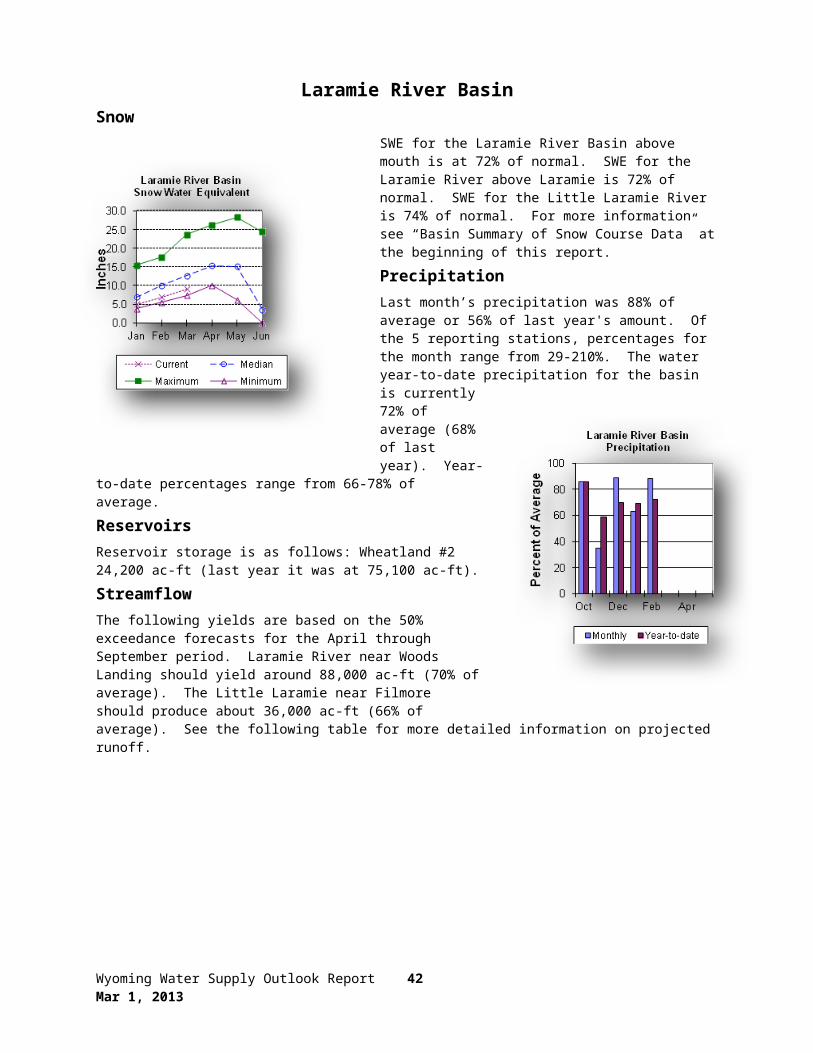
Lower Green River BasinSnowSWE in the Green River Basin above Flaming Gorge is 81% of normal. SWE in the Hams Fork Basin is 77% of normal. Blacks Fork Basin SWE is currently 76% of
normal. In the Henrys Fork drainage SWE is 95%. For more information see “Basin Summary of Snow Course Data” at the beginning of this report.
PrecipitationPrecipitation for the 11 reporting stations during last month was at 55% of average or 49% of last year. Precipitation ranged from 0-128% of average for the month. The basin year-to-date precipitation is currently 80% of average (77% of last year). Year-to-date percentages range from 64-151% of average.
ReservoirsFontenelle Reservoir is
currently storing 140,400 ac-ft; this is 110% of average (112% of last year). Flaming Gorge is currently storing 2,968,000 ac-ft; compared to 3,293,000 at this time last year. Viva Naughton is currently storing 23,400 ac-ft, 81% of average or 55% of capacity. Detailed reservoir data is shown on the following page and on the reservoir storage summary at the beginning of this report.
StreamflowThe 50% exceedance forecasts for the April through July runoff period in the Lower Green River Basin are forecast to be below average. The Green River near Green River is forecast to yield about 395,000 ac-ft (54% of average). The Blacks Fork near Robertson is forecast to yield 60,000 ac-ft (67% of average). East Fork of Smiths Fork near Robertson is forecast to yield 18,000 ac-ft (69% of average). Hams Fork below Pole Creek near Frontier is forecast to be 30,000 ac-ft (56% of average). The Hams Fork Inflow to Viva Naughton Reservoir is forecast to be 38,000 ac-ft (51% of average). The Flaming Gorge Reservoir inflow will be about 535,000 ac-ft (55% of average). See the following table for more detailed information on projected runoff.
Wyoming Water Supply Outlook Report 43 Mar 1, 2013

Lower Green River BasinStreamflow Forecasts - March 1, 2013
================================================================================ | <=== Drier === Future Conditions === Wetter ===> | | |Forecast Pt | =============== Chance of Exceeding * ============== | Forecast | 90% 70% | 50% | 30% 10% | 30 Yr Avg Period |(1000AF) (1000AF)|(1000AF) (% AVG.)|(1000AF) (1000AF)| (1000AF)================================================================================Green R nr Green River, WY (2) APR-JUL 196 306 395 54 495 662 730 Blacks Fk nr Robertson APR-JUL 36 50 60 67 71 90 89 EF of Smiths Fork nr Robertson (2) APR-JUL 9.1 14.1 18.0 69 22 30 26 Hams Fk bl Pole Ck nr Frontier APR-JUL 16.4 24 30 56 37 48 54 Viva Naughton Reservoir Inflow (2) APR-JUL 17.6 29 38 51 49 66 74 Flaming Gorge Reservoir Inflow (2) APR-JUL 235 400 535 55 690 960 980 ================================================================================ * 90%, 70%, 50%, 30%, and 10% chances of exceeding are the probabilities that the actual volume will exceed the volumes in the table. The average is computed for the 1981-2010 base period. (1) - The values listed under the 10% and 90% Chance of Exceeding are actually 5% and 95% exceedance levels. (2) - The value is natural volume - actual volume may be affected by upstream water management. (3) - Median value used in place of average.================================================================================ LOWER GREEN RIVER BASIN Reservoir Storage (1000AF) End of February================================================================================ Usable ********** Usable Storage *********Reservoir Capacity This Year Last Year Average================================================================================FONTENELLE 344.8 140.4 125.9 127.6 FLAMING GORGE 3749.0 2968.0 3293.0 3014.0 VIVA NAUGHTON RES 42.4 23.4 28.0 28.8 ================================================================================ LOWER GREEN RIVER BASIN Watershed Snowpack Analysis - March 1, 2013================================================================================ Number of This Year as Percent ofWatershed Data Sites Last Year Median================================================================================HAMS FORK RIVER 4 80 77BLACKS FORK 4 93 76HENRYS FORK 3 75 95GREEN above Flaming Gorge 26 76 81================================================================================
Wyoming Water Supply Outlook Report 44 Mar 1, 2013

Upper Bear River BasinSnowSnow water equivalent (SWE) in the Upper Bear River Basin in Utah is estimated
to be 74% of normal. SWE in the Wyoming portion of the Bear River drainage (Smiths and Thomas Forks) is at 77% of normal. Bear River Basin SWE, above the Idaho State line, is 75% of normal. For more information see “Basin Summary of Snow Course Data” at the beginning of this report.
PrecipitationPrecipitation for last month was 46% of average for the 8 reporting stations; this is 43% of the precipitation received last year. Precipitation ranged from 33-60% of average for the month. The year-to-date precipitation, for the basin, is 79% of average; this is 86% of last year’s amount. Year-to-date
percentages range from 70-84% of average.
ReservoirsStorage in Woodruff Narrows reservoir is 8,700 ac-ft. Reservoir storage last year at this time was 49,000 ac-ft.
StreamflowThe following 50% exceedance forecasts are for the April through September period. The Bear River near the Utah-Wyoming State Line is 74,000 ac-ft (60% of average). The Bear River above Reservoir near Woodruff is 68,000 ac-ft (53% of average). The Smiths Fork River near Border Jct. is 65,000 ac-ft (63% of average). See the following table for more detailed information on projected runoff.
Wyoming Water Supply Outlook Report 45 Mar 1, 2013
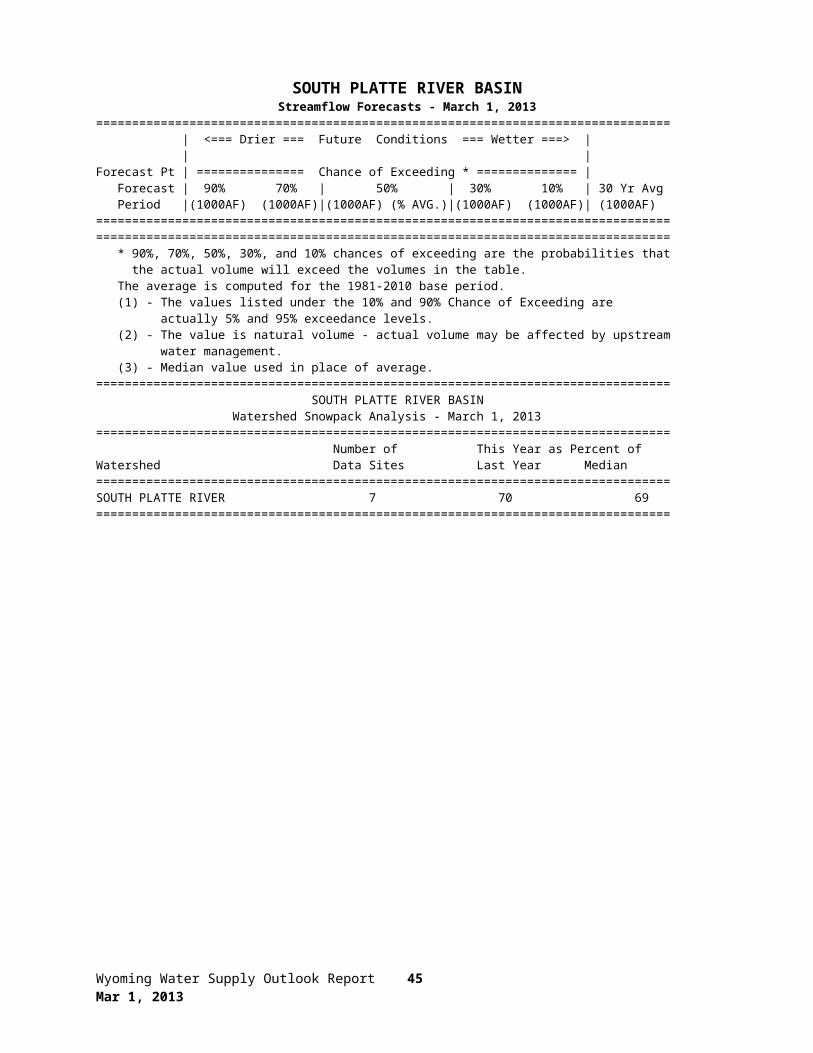
Upper Bear River BasinStreamflow Forecasts - March 1, 2013
================================================================================ | <=== Drier === Future Conditions === Wetter ===> | | |Forecast Pt | =============== Chance of Exceeding * ============== | Forecast | 90% 70% | 50% | 30% 10% | 30 Yr Avg Period |(1000AF) (1000AF)|(1000AF) (% AVG.)|(1000AF) (1000AF)| (1000AF)================================================================================Bear R nr UT-WY State Line APR-JUL 35 54 67 60 80 99 112 APR-SEP 37 59 74 60 88 110 123 Bear R ab Res nr Woodruff APR-JUL 23 51 70 58 89 117 121 APR-SEP 19.0 48 68 53 88 116 128 Smiths Fk nr Border APR-JUL 26 42 53 60 64 81 89 APR-SEP 34 52 65 63 77 96 104 ================================================================================ * 90%, 70%, 50%, 30%, and 10% chances of exceeding are the probabilities that the actual volume will exceed the volumes in the table. The average is computed for the 1981-2010 base period. (1) - The values listed under the 10% and 90% Chance of Exceeding are actually 5% and 95% exceedance levels. (2) - The value is natural volume - actual volume may be affected by upstream water management. (3) - Median value used in place of average.================================================================================ UPPER BEAR RIVER BASIN Reservoir Storage (1000AF) End of February================================================================================ Usable ********** Usable Storage *********Reservoir Capacity This Year Last Year Average================================================================================WOODRUFF NARROWS 57.3 8.7 49.0 31.6 ================================================================================ UPPER BEAR RIVER BASIN Watershed Snowpack Analysis - March 1, 2013================================================================================ Number of This Year as Percent ofWatershed Data Sites Last Year Median================================================================================UPPER BEAR RIVER in Utah 6 92 74SMITHS & THOMAS FORKS 3 81 77BEAR RIVER abv ID line 11 89 75================================================================================
NORTHWEST 70 76 88
NORTHEAST 25 63 94
SOUTHEAST 33 80 76
SOUTHWEST 37 80 79
Wyoming Water Supply Outlook Report 46 Mar 1, 2013

Issued by Released by
Jason Weller (Acting Chief) Astrid MartinezU.S.D.A. State Con.Natural Resources Conservation Service N R C SWashington D.C. Casper, Wyoming
Wyoming Water Supply Outlook Report 47 Mar 1, 2013

The Following Agencies and Organizations Cooperate with the Natural Resources Conservation Service on the Snow Survey Work.
FEDERAL:
United States Department of the Interior (National Park Service)
United States Department of Agriculture (Forest Service)
United States Department of the Interior (Bureau of Reclamation)
United States Department of Commerce NOAA (National Weather Service)
State:
The Wyoming State Engineer's Office
The University of Wyoming
Local:
The City of Cheyenne
The City of Rawlins
Wyoming Water Supply Outlook Report 48 Mar 1, 2013

Natural Resources Conservation Service100 East B StreetBox 33124Casper, WY 82601
«Name»«Title»«Address1»«Address2»«City», «State» «PostalCode»
«MailingListID»