Www.worldbank.org/analyzinghealthequity Book published by the World Bank in 2008. Presentations...
19
www.worldbank.org/analyzinghe althequity Book published by the World Bank in 2008. Presentations accompany the book and are designed as a course on health equity analysis. The book contents can b downloaded from the website above.
-
Upload
kelley-francis -
Category
Documents
-
view
228 -
download
1
Transcript of Www.worldbank.org/analyzinghealthequity Book published by the World Bank in 2008. Presentations...

www.worldbank.org/analyzinghealthequity
Book published by the World Bank in 2008.
Presentations accompany the book and are designed as a course on health equity analysis.
The book contents can be downloaded from thewebsite above.
“Analyzing Health Equity Using Household Survey Data” Owen O’Donnell, Eddy van Doorslaer, Adam Wagstaff and Magnus Lindelow, The World Bank, Washington DC, 2008, www.worldbank.org/analyzinghealthequity
Analyzing Health Equity Using Household Survey Data
Lecture 1
Introduction

“Analyzing Health Equity Using Household Survey Data” Owen O’Donnell, Eddy van Doorslaer, Adam Wagstaff and Magnus Lindelow, The World Bank, Washington DC, 2008, www.worldbank.org/analyzinghealthequity
Huge rich-poor inequalities in health outcomes and health care in Bolivia
0
20
40
60
80
100
120
poorest20%
2ndpoorest
20%
middle20%
secondrichest20%
richest20%
risk
of
new
born
dyin
g b
efo
re
5th
bir
thday (
per
10
00
)
0
10
20
30
40
50
60
70
80
90
100
poorest20%
2ndpoorest
20%
middle20%
secondrichest20%
richest20%
% b
abie
s deliv
ere
d
by a
medic
ally
tra
ined p
ers
on

“Analyzing Health Equity Using Household Survey Data” Owen O’Donnell, Eddy van Doorslaer, Adam Wagstaff and Magnus Lindelow, The World Bank, Washington DC, 2008, www.worldbank.org/analyzinghealthequity
And Bolivia is not an isolated example in Latin America and the
Caribbean….
0
20
40
60
80
100
120
140
160
180
1 2 3 4 5
Wealth quintile (poorest to richest)
Under
-five
mort
alit
y ra
te
Haiti 1994/95Haiti 2000Guatemala 1998/99Guatemala 1995Nicaragua 1997/98Colombia 1995Paraguay 1990Bolivia 2003Colombia 2000Colombia 2005Dominican Republic 2002Nicaragua 2001Dominican Republic 1996Bolivia 1998Peru 1996Peru 2000Brazil 1996

“Analyzing Health Equity Using Household Survey Data” Owen O’Donnell, Eddy van Doorslaer, Adam Wagstaff and Magnus Lindelow, The World Bank, Washington DC, 2008, www.worldbank.org/analyzinghealthequity
Health inequality and inequity• Rich-poor inequalities in health largely, if not
entirely, derive from differences in constraints (e.g. incomes, time costs, health insurance, environment) rather than in preferences.
• Hence they are often considered to represent inequities.
• But in high-income countries the poor often use more health care and this may not be represent inequity.
• Drawing conclusions about health equity involves consideration of the causes of health inequalities.

“Analyzing Health Equity Using Household Survey Data” Owen O’Donnell, Eddy van Doorslaer, Adam Wagstaff and Magnus Lindelow, The World Bank, Washington DC, 2008, www.worldbank.org/analyzinghealthequity
Equity of what?
• Health outcomes, e.g. infant mortality, child growth, disability, incidence of illness, general health, life expectancy.
• Health care utilisation, e.g. doctor visits, inpatient stays, vaccinations, maternity care.
• Subsidies received through use of public health care.
• Payments for health care (both direct and indirect).
“Analyzing Health Equity Using Household Survey Data” Owen O’Donnell, Eddy van Doorslaer, Adam Wagstaff and Magnus Lindelow, The World Bank, Washington DC, 2008, www.worldbank.org/analyzinghealthequity
Equity in relation to what?
• Equity in health, health care and health payments could be examined in relation to gender, ethnicity, geographic location, education, income….
• This course focuses on equity by socioeconomic status, usually measured by income, wealth or consumption.
• Many of the techniques are applicable to equity in relation to other characteristics but they often require that individuals can be ranked by that characteristic.

“Analyzing Health Equity Using Household Survey Data” Owen O’Donnell, Eddy van Doorslaer, Adam Wagstaff and Magnus Lindelow, The World Bank, Washington DC, 2008, www.worldbank.org/analyzinghealthequity
Course objectives• To provide a step-by-step practical guide to the
measurement of various aspects of health equity. • To introduce the relevant theory and literature.• To provide hands-on experience of computing
health equity measures using Stata®.• To illustrate the interpretation of results through
worked examples.• To stimulate analysis that will facilitate more
comprehensive monitoring of health equity, especially in developing countries.

“Analyzing Health Equity Using Household Survey Data” Owen O’Donnell, Eddy van Doorslaer, Adam Wagstaff and Magnus Lindelow, The World Bank, Washington DC, 2008, www.worldbank.org/analyzinghealthequity
Questions addressed by health equity analyses
• Snapshots. Does inequality in child survival between the poor and better-off exist? How large is it?
• Movies. Is inequality in child survival smaller now than in the 1990s?• Cross-country comparisons. Is inequality in child survival larger in
Brazil than in Cuba?• Decompositions. To what extent is inequality in child survival
explained by inequalities in education, health insurance cover, access to maternal and child health care, etc?
• Cross-country detective exercises. To what extent is greater inequality in child survival in Brazil than Cuba explained by greater income inequality, given differences in health systems?
• Program impact evaluations. To what extent is inequality in child survival reduced by an intervention such as a vaccination program, expanded health insurance cover or improved water supply?

“Analyzing Health Equity Using Household Survey Data” Owen O’Donnell, Eddy van Doorslaer, Adam Wagstaff and Magnus Lindelow, The World Bank, Washington DC, 2008, www.worldbank.org/analyzinghealthequity
Ingredients of health equity analysis
• Data usually from a household survey.• Measurement of the key variables -
health/health care/health payments and of socioeconomic status.
• Quantitative measures of inequality or inequity.
• Multivariate methods to explain inequality, identify its causes and the impact on it of interventions
“Analyzing Health Equity Using Household Survey Data” Owen O’Donnell, Eddy van Doorslaer, Adam Wagstaff and Magnus Lindelow, The World Bank, Washington DC, 2008, www.worldbank.org/analyzinghealthequity
Course content• The course is structured around these four ingredients, plus
applications.• Part I – Data
– data requirements and sources (lecture 2) – measurement of the key variables – child survival,
anthropometrics, adult health & living standards (3-6).• Part II – Tools
– measures of socioeconomic inequality in health variables (7-9)
– multivariate analysis (10-11)– decomposition methods (12-13).
• Part III – Applications– to health care utilisation (14-15) – to health payments (16-19).

“Analyzing Health Equity Using Household Survey Data” Owen O’Donnell, Eddy van Doorslaer, Adam Wagstaff and Magnus Lindelow, The World Bank, Washington DC, 2008, www.worldbank.org/analyzinghealthequity
Concentration curves (lecture 7) are central to the assessment of
socioeconomic inequality in health
0%
10%
20%
30%
40%
50%
60%
70%
80%
90%
100%
0% 20% 40% 60% 80% 100%
cumul. % pop. (poorest first)
cum
ul. %
under-
five d
eath
s
equality
Haiti 1994/95
Guatemala 1995
Bolivia 2003
Bolivia 1998
Brazil 1996
“Analyzing Health Equity Using Household Survey Data” Owen O’Donnell, Eddy van Doorslaer, Adam Wagstaff and Magnus Lindelow, The World Bank, Washington DC, 2008, www.worldbank.org/analyzinghealthequity
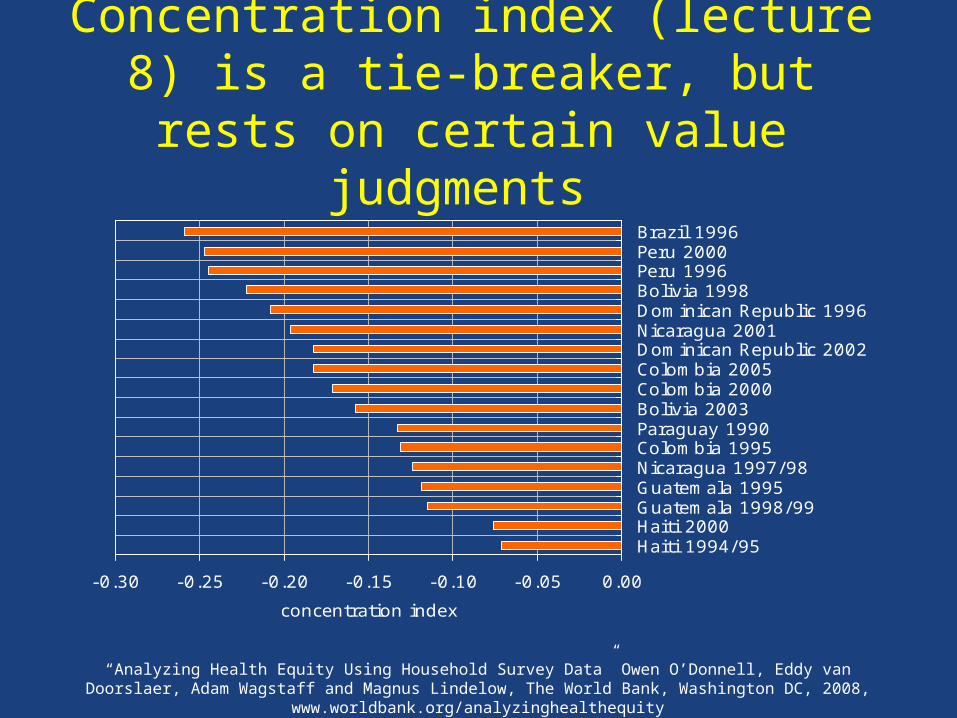
Concentration index (lecture 8) is a tie-breaker, but rests on certain value
judgments
-0.30 -0.25 -0.20 -0.15 -0.10 -0.05 0.00
Haiti 1994/95Haiti 2000Guatemala 1998/99Guatemala 1995Nicaragua 1997/98Colombia 1995Paraguay 1990Bolivia 2003Colombia 2000Colombia 2005Dominican Republic 2002Nicaragua 2001Dominican Republic 1996Bolivia 1998Peru 1996Peru 2000Brazil 1996
concentration index

“Analyzing Health Equity Using Household Survey Data” Owen O’Donnell, Eddy van Doorslaer, Adam Wagstaff and Magnus Lindelow, The World Bank, Washington DC, 2008, www.worldbank.org/analyzinghealthequity
Multivariate methods
• Estimation and inference with complex survey data (lecture 10)
• Nonlinear models for health and medical expenditure data (11)
• Explaining differences between groups: Oaxaca decomposition (12)
• Explaining socioeconomic-related health inequality: Decomposition of the concentration index (13)

“Analyzing Health Equity Using Household Survey Data” Owen O’Donnell, Eddy van Doorslaer, Adam Wagstaff and Magnus Lindelow, The World Bank, Washington DC, 2008, www.worldbank.org/analyzinghealthequity
Lecture 14: Who (really) benefits from health care subsidies? Often the better off!
0 5 10 15 20 25 30 35 40 45
Nepal
Gansu, China
Heilongjiang, China
India
Indonesia
Vietnam
Bangladesh
Thailand
Sri Lanka
Malaysia
Hong Kong SAR
share of govt. health subsidies accruing to poorest 20%
“Analyzing Health Equity Using Household Survey Data” Owen O’Donnell, Eddy van Doorslaer, Adam Wagstaff and Magnus Lindelow, The World Bank, Washington DC, 2008, www.worldbank.org/analyzinghealthequity
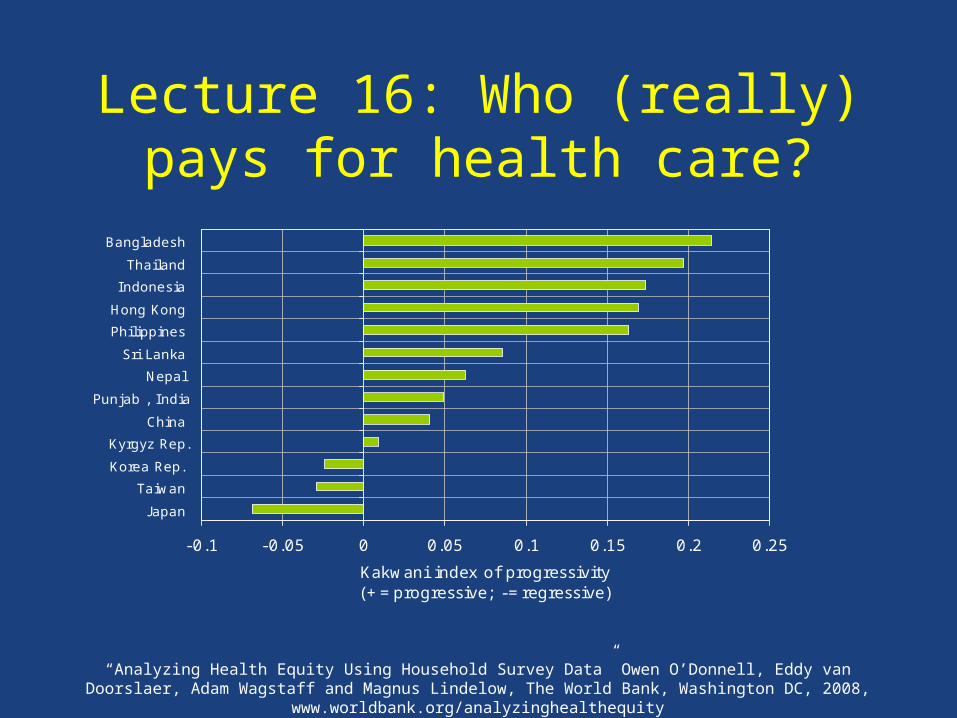
Lecture 16: Who (really) pays for health care?
-0.1 -0.05 0 0.05 0.1 0.15 0.2 0.25
J apan
Taiwan
Korea Rep.
Kyrgyz Rep.
China
Punjab , India
Nepal
Sri Lanka
Philippines
Hong Kong
Indonesia
Thailand
Bangladesh
Kakwani index of progressivity(+=progressive; -=regressive)

“Analyzing Health Equity Using Household Survey Data” Owen O’Donnell, Eddy van Doorslaer, Adam Wagstaff and Magnus Lindelow, The World Bank, Washington DC, 2008, www.worldbank.org/analyzinghealthequity
Lecture 18: Incidence of catastrophic out-of-pocket payments varies across
countries
0% 5% 10% 15% 20% 25% 30% 35%
MALAYSIA
TAIWAN
THAILAND
HONG KONG SAR
PHILIPPINES
INDONESIA
SRI LANKA
KOREA REP.
NEPAL
KYRGYZ REP.
INDIA
CHINA
BANGLADESH
VIETNAM
% pop. with out-of-pocket payments exceeding 15% non-food consumption

“Analyzing Health Equity Using Household Survey Data” Owen O’Donnell, Eddy van Doorslaer, Adam Wagstaff and Magnus Lindelow, The World Bank, Washington DC, 2008, www.worldbank.org/analyzinghealthequity
Lecture 19: Health care payments and poverty
Pre-payment and post-payment consumption, Bangladesh 2000
0
2
4
6
8
10
12
14
16
0 500 1000 1500 2000 2500 3000 3500 4000 4500 5000 5500 6000 6500 7000
HHs ranked by total consumption
HH
con
s as
mul
tiple
of p
ov li
ne P
L
Poverty line Post payment consumption Pre payment consumption

“Analyzing Health Equity Using Household Survey Data” Owen O’Donnell, Eddy van Doorslaer, Adam Wagstaff and Magnus Lindelow, The World Bank, Washington DC, 2008, www.worldbank.org/analyzinghealthequity
Acknowledgements • Participants in the ECuity and Equitap projects• The European Commission INCO-DEV programme (ICA4-
CT-2001-10015) that funded the Equitap project.• The Dutch government for financial support for the production
and printing of the book and these slides through Reaching the Poor II
• Davidson Gwatkin and Abdo Yazbeck for encouragement and support during the production and market-testing of the technical notes, and the production of the volume
• John Didier, Tanya Ringland, Chialing Yang and others at the World Bank Institute for managing the production and dissemination of the book