Www.skope.ox.ac.uk Educational attainment, occupational outcomes and the distribution of earnings:...
33
www.skope.ox.ac.uk Educational attainment, occupational outcomes and the distribution of earnings: an application of unconditional quantile regression techniques Craig Holmes Pembroke College, Oxford University and SKOPE QuantSIG seminar, April 28 th 2014
-
Upload
joella-garrett -
Category
Documents
-
view
217 -
download
1
Transcript of Www.skope.ox.ac.uk Educational attainment, occupational outcomes and the distribution of earnings:...

www.skope.ox.ac.uk
Educational attainment, occupational outcomes and the distribution of earnings:
an application of unconditional quantile regression techniques
Craig HolmesPembroke College, Oxford University and SKOPE
QuantSIG seminar, April 28th 2014

www.skope.ox.ac.uk
Outline
• Background on research project• Methodology
– Decompositions of distributions– Quantile regressions
• Data• Decomposition results• Discussion and future work

www.skope.ox.ac.uk
Background• Wage inequality in the UK has risen since the 1980s

www.skope.ox.ac.uk
Background• Rising upper- and lower-tail inequality until mid 1990s• Small increases in upper-tail inequality since mid 1990s (except at very
top), coupled with falling inequality at bottom end
0.0 0.1 0.2 0.3 0.4 0.5 0.6 0.7 0.8 0.9 1.00.0%
5.0%
10.0%
15.0%
20.0%
25.0%
30.0%
35.0%
40.0%
1987-2001
1994-2007
Percentile
Real
wag
e gr
owth
www.skope.ox.ac.uk
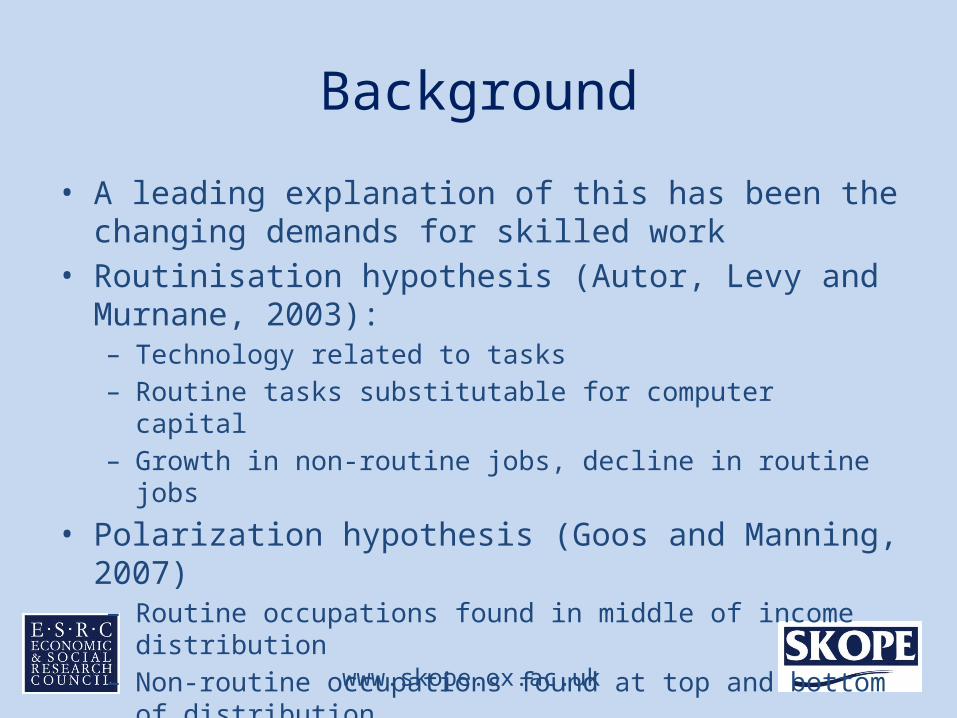
Background
• A leading explanation of this has been the changing demands for skilled work
• Routinisation hypothesis (Autor, Levy and Murnane, 2003):– Technology related to tasks– Routine tasks substitutable for computer capital– Growth in non-routine jobs, decline in routine jobs
• Polarization hypothesis (Goos and Manning, 2007)– Routine occupations found in middle of income distribution– Non-routine occupations found at top and bottom of distribution

www.skope.ox.ac.uk
Background
• Goos and Manning (2007) – 1979-1999:

www.skope.ox.ac.uk
Background
• Similar results observed in:– US (Autor, Katz and Kearney, 2006; Caranci and Jones, 2011) – Germany (Spitz-Oener, 2006; Oesch and Rodríguez Menés, 2011)– Spain and Switzerland (Oesch and Rodríguez Menés, 2011) – Across Europe (Goos, Manning and Salomons, 2009)
• Other explanations have been put forward:– Offshoring– Growing wage inequality and demand for services

www.skope.ox.ac.uk
Background
• The shift away from routine work should increase the number of high-wage and low-wage jobs, everything else being equal
0 2 4 6 8 10 12 140.00
0.05
0.10
0.15
0.20
0.25
0.30
All
Routine
High skill non routine
Low skill non routine
Gross hourly wage, 1987
www.skope.ox.ac.uk
Background
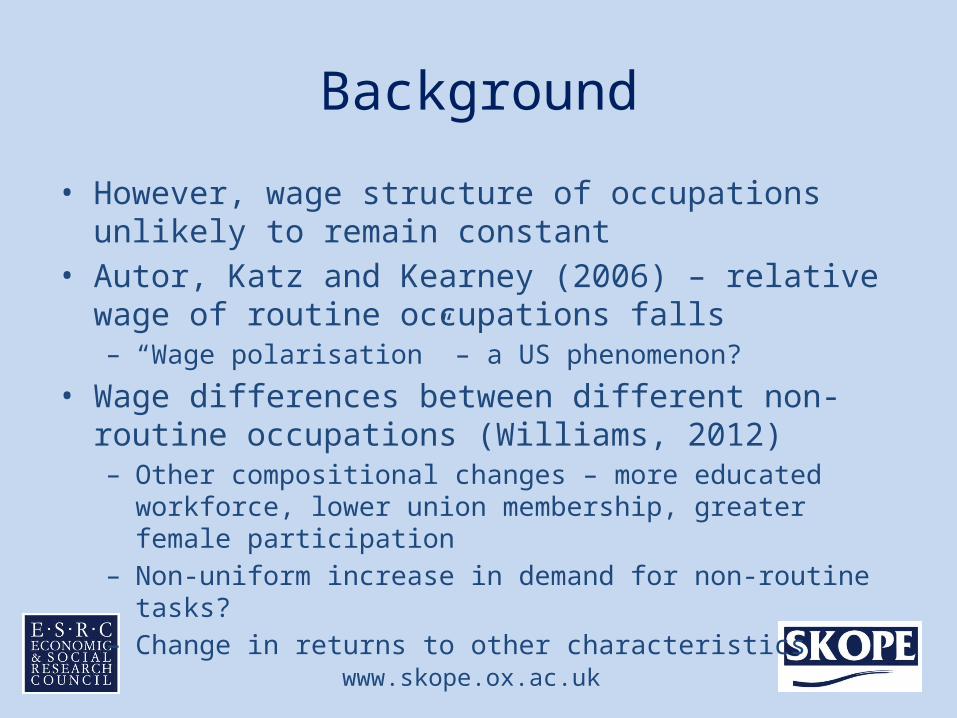
• However, wage structure of occupations unlikely to remain constant
• Autor, Katz and Kearney (2006) – relative wage of routine occupations falls– “Wage polarisation” – a US phenomenon?
• Wage differences between different non-routine occupations (Williams, 2012)– Other compositional changes – more educated workforce, lower union
membership, greater female participation– Non-uniform increase in demand for non-routine tasks?– Change in returns to other characteristics
www.skope.ox.ac.uk
Background
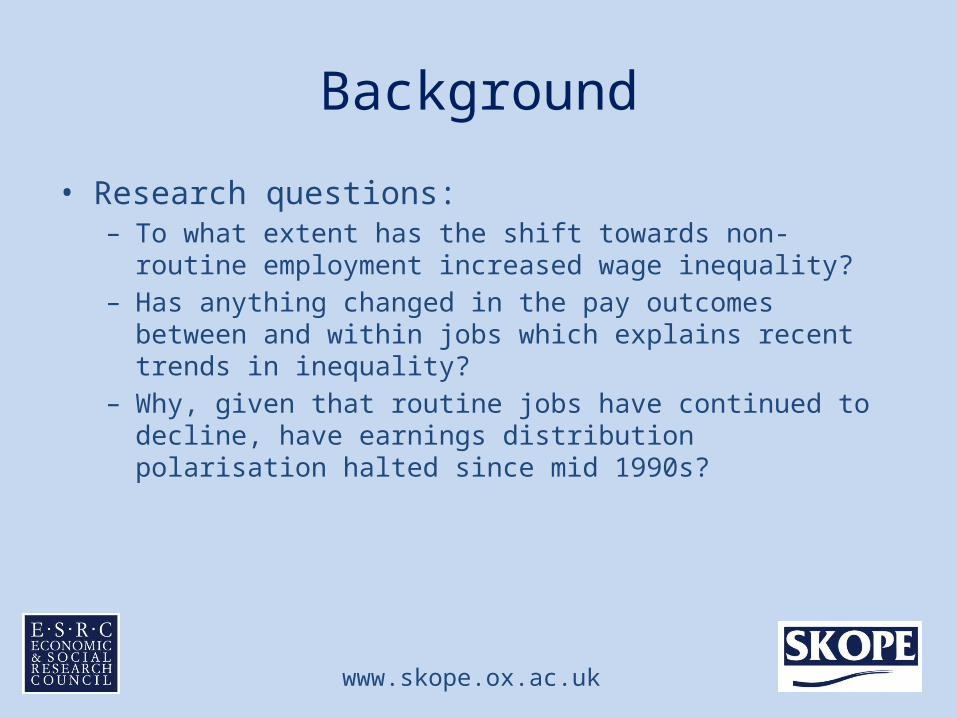
• Research questions:– To what extent has the shift towards non-routine employment
increased wage inequality?– Has anything changed in the pay outcomes between and within jobs
which explains recent trends in inequality?– Why, given that routine jobs have continued to decline, have earnings
distribution polarisation halted since mid 1990s?

www.skope.ox.ac.uk
Methodology• To be able to answer this question we need to be able to
decompose the changes in distributional statistics• Two main changes: compositional effects and wage effects...• ...broken down into individual variable contributions of:
— Occupational attachment— Educational attainment— Labour market experience— Union membership— Gender— Ethnicity— Type of contract (full-time/part-time)

www.skope.ox.ac.uk
Methodology• Doing this for the mean is easy:
– OLS regression estimates the mean conditional on the set of explanatory variables:
– where t = {0, 1}– Unconditional estimates of the mean can be found from this
regression:
– The change in mean wage can then be broken down:
tttt Xw ln
ttt Xw ln
10101001 lnln XXXww
www.skope.ox.ac.uk
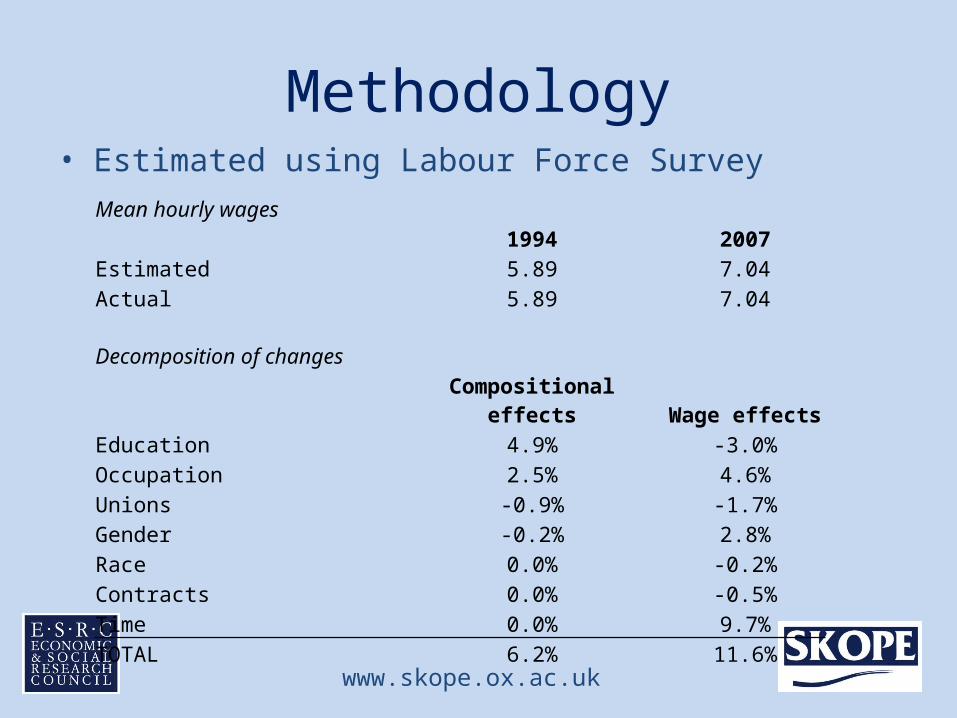
Methodology• Estimated using Labour Force Survey
Mean hourly wages1994 2007
Estimated 5.89 7.04Actual 5.89 7.04
Decomposition of changesCompositional effects Wage effects
Education 4.9% -3.0%Occupation 2.5% 4.6%Unions -0.9% -1.7%Gender -0.2% 2.8%Race 0.0% -0.2%Contracts 0.0% -0.5%Time 0.0% 9.7%TOTAL 6.2% 11.6%

www.skope.ox.ac.uk
Methodology• My research questions require looking at changes in particular
quantiles of the distribution, rather than the mean• However, the same approach does not work for quantile
regressions as it does for OLS regressions. • The unconditional statistic can not be inferred from the as a
weighted average of the conditional estimates:
75th percentile of hourly wage distribution
1994 2007Estimated from weighted average quantile regression 7.55 8.96
Actual 8.47 10.06

www.skope.ox.ac.uk
Methodology• Various solutions to this problem in the literature:1. Juhn, Murphy and Pierce (1993)
– Calculates aggregate composition and wage effects by imputation– Can not decompose composition effect– Strong assumptions
2. Machato and Mata (2005)– Calculates aggregate composition and wage effects from quantile
regressions – Can not decompose composition effect
3. Firpo, Fortin and Lemieux (2009)– Calculates aggregate composition and wage effects from reweighting– Can estimate individual contributions to both using RIF-regressions

www.skope.ox.ac.uk
Methodology
• Data:– N observations, N0 from initial distribution, N1 from final distribution
– Ti = 1 if from final distribution, i = 1,...,N. Pr(Ti) = p
• Data can be reweighted• Reweighting:
– where p(X) = Pr (T=1|X)
)(1
)(1
)1&Pr()1|Pr( 0
0
Xp
Xp
p
TEF
p
TyYTyYF
yYC
C

www.skope.ox.ac.uk
Methodology
• This counterfactual can be used to decompose wage and composition effects of a distributional statistic,v(F) :
• A re-centered influence function measures the sensitivity of a distributional statistic to each observation.
• The RIF of a percentile τ, qτ, for an observation y is defined as:
• where E(RIF) = qτ
CW
CC
vv
FvFvFvFvv
01
)(
)(100);(
qf
qyqqyRIF
I

www.skope.ox.ac.uk
Methodology
• Then, assume a linear projection of RIF for each τ-th percentile onto the explanatory variables X:
– where j = {0, C, 1}
• As E(RIF) = qτ, then it can be estimated:
• Hence, we get a more general Blinder-Oaxaca expression:
jjjj XRIF
jjj Xq
CW Xq 11
001 XXqC

www.skope.ox.ac.uk
Data
• Family Expenditure Survey, 1987-2001– Around 10,000 observations each year– Usual gross pay and usual hours of work– Education – year left FT education four levels– Union membership – subscription fees>0
• Quarterly Labour Force Survey, 1994-2007– Around 150,000 observations each quarter (5 quarter membership)– Gross hourly pay directly reported– Educational qualifications– Union membership directly reported

www.skope.ox.ac.uk
Data 1987 2001 1994 2007
Female 47.3% 50.3% 50.7% 52.1%Union membership 29.0% 15.3% 36.9% 31.5%Works part-time 23.6% 23.3% 26.3% 26.6%University graduates 9.4% 16.9% 13.4% 23.4%No qualifications 36.1% 18.6% 17.2% 8.3%Experience < 5 years 11.9% 9.4% 7.7% 8.2%Experience > 20 years 49.1% 53.5% 57.8% 53.8% Professional 11.2% 12.8% 11.9% 14.4%
Managerial 7.3% 11.7% 12.5% 14.9%
Intermediate 10.1% 13.7% 14.0% 15.8%
Manual Routine 36.1% 26.4% 26.9% 19.9%12.2%Admin Routine 19.7% 15.2% 14.7%
Manual Non-routine 1.8% 0.8% 0.9% 1.1%
Service 13.8% 19.4% 17.9% 21.7%
N 7253 5908 32355 54098

www.skope.ox.ac.uk
Composition and wage effects• FES, 1987-2001:
0.00 0.10 0.20 0.30 0.40 0.50 0.60 0.70 0.80 0.90 1.00
-5.0%
0.0%
5.0%
10.0%
15.0%
20.0%
Composition
Wage structure
Percentile
Real
wag
e gr
owth
, 198
7-20
01
www.skope.ox.ac.uk
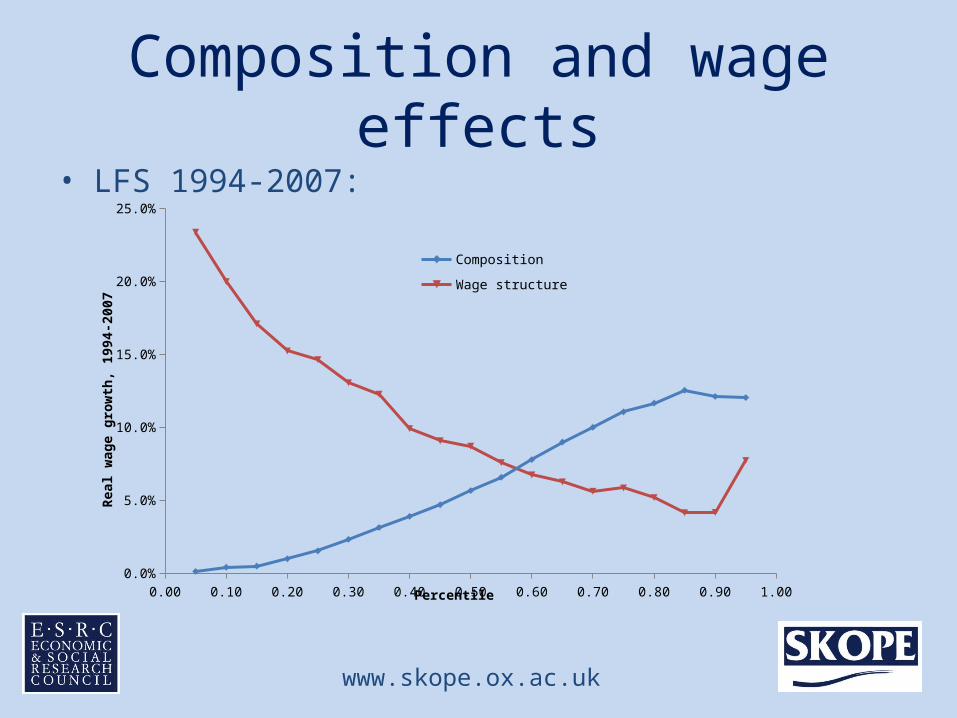
Composition and wage effects• LFS 1994-2007:
0.00 0.10 0.20 0.30 0.40 0.50 0.60 0.70 0.80 0.90 1.000.0%
5.0%
10.0%
15.0%
20.0%
25.0%
Composition
Wage structure
Percentile
Real
wag
e gr
owth
, 199
4-20
07

www.skope.ox.ac.uk
Composition and wage effects
• Both periods find compositional changes decreasing the number of middle-wage jobs
• Wage structure changes reverse this – partially in the 1987 and 2001, and completely between 1994 and 2007
Year Jobs earning below 2/3 * median hourly
wage
Jobs earning above 1.5* median hourly
wageInitial (1987) 20.2% 23.4%Composition effects only 24.0% 27.1%Final (2001) 23.0% 25.6%Initial (1994) 22.6% 25.2%Composition effects only 25.2% 27.3%Final (2007) 21.3% 25.9%

www.skope.ox.ac.uk
Individual composition effects
0.00 0.10 0.20 0.30 0.40 0.50 0.60 0.70 0.80 0.90 1.00
-5.0%
0.0%
5.0%
10.0%
15.0%
20.0%
Total estimated composition
Occupations
Education
Unions
Female
Percentile
Real
wag
e gr
owth
, 198
7-20
01

www.skope.ox.ac.uk
Individual composition effects
0.00 0.10 0.20 0.30 0.40 0.50 0.60 0.70 0.80 0.90 1.00
-2.0%
0.0%
2.0%
4.0%
6.0%
8.0%
10.0%
12.0%
14.0%
Total estimated composition
Occupation
Education
Unions
Female
Percentile
Real
wag
e gr
owth
, 199
4-20
07
www.skope.ox.ac.uk
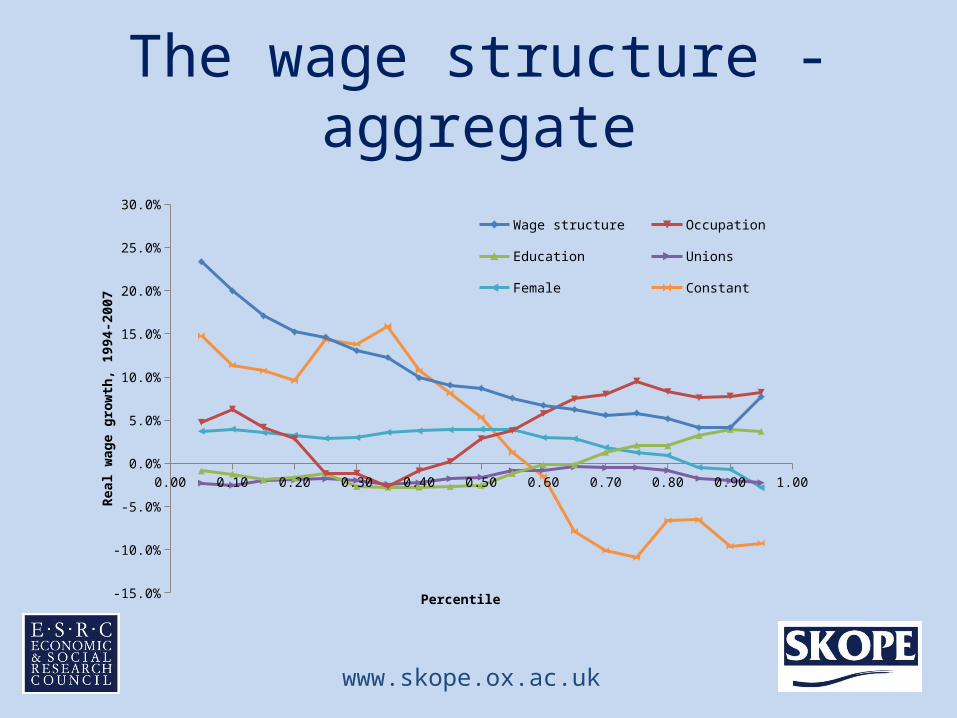
The wage structure - aggregate
0.00 0.10 0.20 0.30 0.40 0.50 0.60 0.70 0.80 0.90 1.00
-15.0%
-10.0%
-5.0%
0.0%
5.0%
10.0%
15.0%
20.0%
25.0%
30.0%
Wage structure Occupation Education
Unions Female Constant
Percentile
Real
wag
e gr
owth
, 199
4-20
07

www.skope.ox.ac.uk
The wage structure - occupations
0.00 0.10 0.20 0.30 0.40 0.50 0.60 0.70 0.80 0.90 1.00
-2.00%
-1.00%
0.00%
1.00%
2.00%
3.00%
4.00%
5.00%
6.00%Professional
Managerial
Intermediate
Routine manual
Service
Percentile
Real
wag
e gr
owth
, 199
4-20
07
www.skope.ox.ac.uk
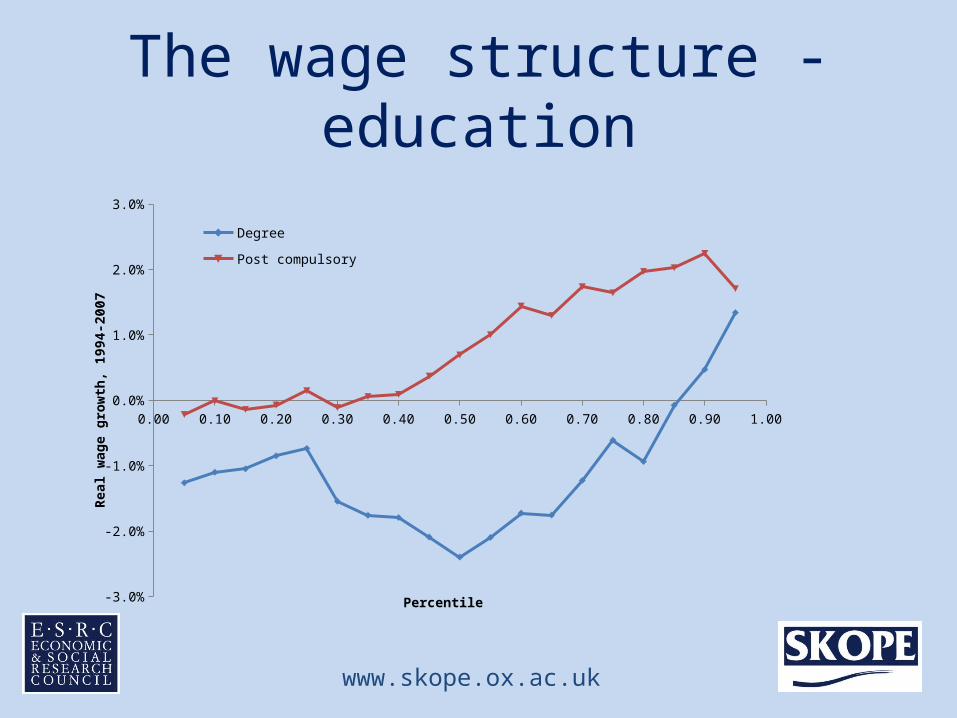
The wage structure - education
0.00 0.10 0.20 0.30 0.40 0.50 0.60 0.70 0.80 0.90 1.00
-3.0%
-2.0%
-1.0%
0.0%
1.0%
2.0%
3.0%
Degree
Post compulsory
Percentile
Real
wag
e gr
owth
, 199
4-20
07

www.skope.ox.ac.uk
Discussion
• Changes in the composition of the workforce would have increased wage inequality since the 1980s
• Changes in the wage structure have offset this – almost entirely sine 1994.
• However, hard to interpret as educational or occupational opportunities pulling the middle up – despite the “room at the top” mindset of policymakers
• An alternative interpretation – downward sloping wage structure is a ‘correction’ of compositional changes – not as many people in high wage jobs as we’d predict

www.skope.ox.ac.uk
Discussion
• Increasingly heterogeneous occupational groups
Low pay Middle pay High pay
-5.00%
-4.00%
-3.00%
-2.00%
-1.00%
0.00%
1.00%
2.00%
3.00%
Professionals Managerial
Intermediate Manual routine
Admin routine Service
Chan
ge in
em
ploy
men
t sha
re, 1
994-
2007

www.skope.ox.ac.uk
Discussion
• Unrelated to educational attainment? Graduates only:
Low pay Middle pay High pay
-5.00%
-4.00%
-3.00%
-2.00%
-1.00%
0.00%
1.00%
2.00%
Professionals Managerial
Intermediate Manual routine
Admin routine Service
Chan
ge in
em
ploy
men
t sha
re, 1
994-
2007

www.skope.ox.ac.uk
Discussion
• This could reflect a supply problem if it reflects quality of graduates
• Could also reflect suitability of university route into labour market vs. vocational education
• Can not ignore changes on the demand side – in particular, are technology and skilled labour always complements?
• Brown, Lauder and Ashton (2011):– “Knowledge work” “Working knowledge”– “Digital Taylorism” – deskilling of high skill work– “War for Talent” – high premium paid for small pool of graduates at
top universities

www.skope.ox.ac.uk
Contact Details
Craig Holmes
Pembroke College, Oxford, andESRC Centre on Skills, Knowledge and Organisational
Performance (SKOPE),
Email: [email protected]