Www.environment.gov.au/soe SoE 2011 – Built Environment chapter - Overview This presentation is...
38
www.environment.gov.au/ soe SoE 2011 – Built Environment chapter - Overview This presentation is one of a series of Australia State of the Environment 2011 (SoE 2011) presentations given by the SoE Committee members and departmental staff following the release of the SoE 2011. This material was developed to be delivered as part of an oral presentation. The full report should be referred to for understanding the context of this information. For more information please refer to: http://www.environment.gov.au/soe/in dex.html Or contact the SoE team via email: [email protected]
-
Upload
tyler-matthews -
Category
Documents
-
view
213 -
download
0
Transcript of Www.environment.gov.au/soe SoE 2011 – Built Environment chapter - Overview This presentation is...

www.environment.gov.au/soe
SoE 2011 – Built Environment chapter - Overview
This presentation is one of a series of Australia State of the Environment 2011 (SoE 2011) presentations given by the SoE Committee members and departmental staff following the release of the SoE 2011.
This material was developed to be delivered as part of an oral presentation. The full report should be referred to for understanding the context of this information.
For more information please refer to:http://www.environment.gov.au/soe/index.htmlOr contact the SoE team via email:[email protected]

www.environment.gov.au/soe
New cover page
Presentation – SoE 2011 Built environment chapter overview Photo: Aerial view of the Pilbara, by Andrew Griffiths, Lensaloft

www.environment.gov.au/soe
State of the Environment reporting
A report on the Australian environment must be tabled in Parliament every five years
No current regulations regarding scope, content or process
All reports so far written by independent committees

www.environment.gov.au/soe
Purpose of SoE 2011
Provide relevant and useful information on environmental issues to the public and decision-makers...
… to raise awareness and support more informed environmental management decisions …
… leading to more sustainable use and effective conservation of environmental assets.

www.environment.gov.au/soe
State of the Environment 2011 Committee
Chair
Tom Hatton (Director, CSIRO Water for a Healthy Country)
Members
Steven Cork (research ecologist and futurist)
Peter Harper (Deputy Australian Statistician)
Rob Joy (School of Global Studies, Social Science & Planning, RMIT)
Peter Kanowski (Fenner School of Environment & Society, ANU)
Richard Mackay (heritage specialist, Godden Mackay Logan)
Neil McKenzie (Chief, CSIRO Land and Water)
Trevor Ward (marine and fisheries ecologist)
Barbara Wienecke – ex officio (Australian Antarctic Division, DSEWPaC)

www.environment.gov.au/soe
What’s new in 2011?
Improved relevance to decision makers
More detailed information
Discussion of the major drivers of change
Wide range of credible resources used in the analyses
Report-card style assessments of condition, pressures and management effectiveness
Discussions of current resilience and future risks
Outlooks

www.environment.gov.au/soe
Quality and credibility
Independence – written by an independent committee with relevant expertise, tasked with advocating for ‘accurate, robust and meaningful environmental reporting and identification of policy issues, but not for any particular policy position’
Authors sought best available evidence from credible sources
Extensive consultation
Workshops to determine consensus in expert opinion where evidence low
Transparency about quality of evidence and level of consensus
Peer reviewed (47+ reviewers of chapters and supplementary materials)
www.environment.gov.au/soe
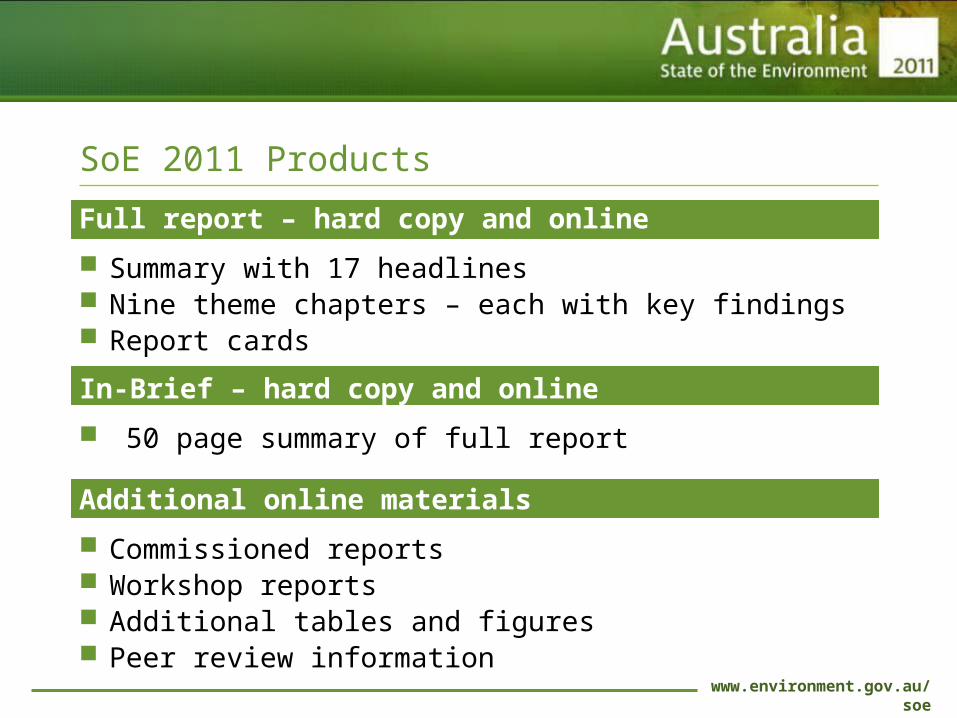
SoE 2011 Products
Full report – hard copy and online
Summary with 17 headlines Nine theme chapters – each with key findings Report cards
In-Brief – hard copy and online
50 page summary of full report
Additional online materials
Commissioned reports Workshop reports Additional tables and figures Peer review information

www.environment.gov.au/soe

www.environment.gov.au/soe

www.environment.gov.au/soe
Assessment summaries in the report

www.environment.gov.au/soe
Drivers chapter – context for rest of SoE
How are a changing climate, population growth and economic growth creating pressures on our environment?

www.environment.gov.au/soe
SoE 2011 Headlines
17 headlines in
summary chapter
give a high level
overview of the
big issues

www.environment.gov.au/soe
Key Findings (in theme chapters)
‘key findings’
give an
overview of
more specific
conclusions
for each
theme

www.environment.gov.au/soe
What is the general state of the environment? Much of Australia is in good condition shape or improving
Wind erosion has decreased
Some major threats to vegetation cover are lessening
Water consumption has fallen considerably in recent years
Many urban air pollutants are on the decline
Use of public transport is on the rise
Other parts are in poor condition or deteriorating The East Antarctic Ice Sheet is losing billions of tonnes of ice a year
Soil acidification and pests and weeds are affecting large areas of the continent
Our natural and cultural heritage continues to be threatened

www.environment.gov.au/soe
Drivers of environmental change
The principal drivers of pressures on Australia’s environment—and its future condition—are climate variability and change, population growth and economic growth
It is likely that we are already seeing the effects of climate change in Australia
The Australian economy is projected to grow by 2.7% per year until 2050
Under the base scenario, Australia’s population of 22.2 million people in 2010 is projected to grow to 35.9 million by 2050
We have opportunities to decouple population and economic growth from pressure on our environment

www.environment.gov.au/soe
Persistent pressures on our environment
Past decisions and practices have left ongoing impacts on our environment
Introduction of feral animals and weeds
Land clearing
Pollution
Unsustainable water resource management
Intense harvest of fish stocks
Lack of integrated and supported management
Our changing climate, and growing population and economy, are now confronting us with new challenges
www.environment.gov.au/soe

www.environment.gov.au/soe
Key findings
Australia’s built environment faces many pressures and is only in a fair shape
The Australian built environment consumes significant natural resources, although this may be improving
Recent government initiatives aim to improve the uncoordinated management of the built environment
The outlook for the built environment is mixed

www.environment.gov.au/soe
State and trends
Significant parts of Australia’s built environment have aspects that are considered poor
Natural resource consumption
Waste generation
Traffic congestion
Photo by Taras Vyshnya

www.environment.gov.au/soe
Household energy use

www.environment.gov.au/soe
Household distributed water use

www.environment.gov.au/soe
Municipal waste generation, 2008-09
www.environment.gov.au/soe
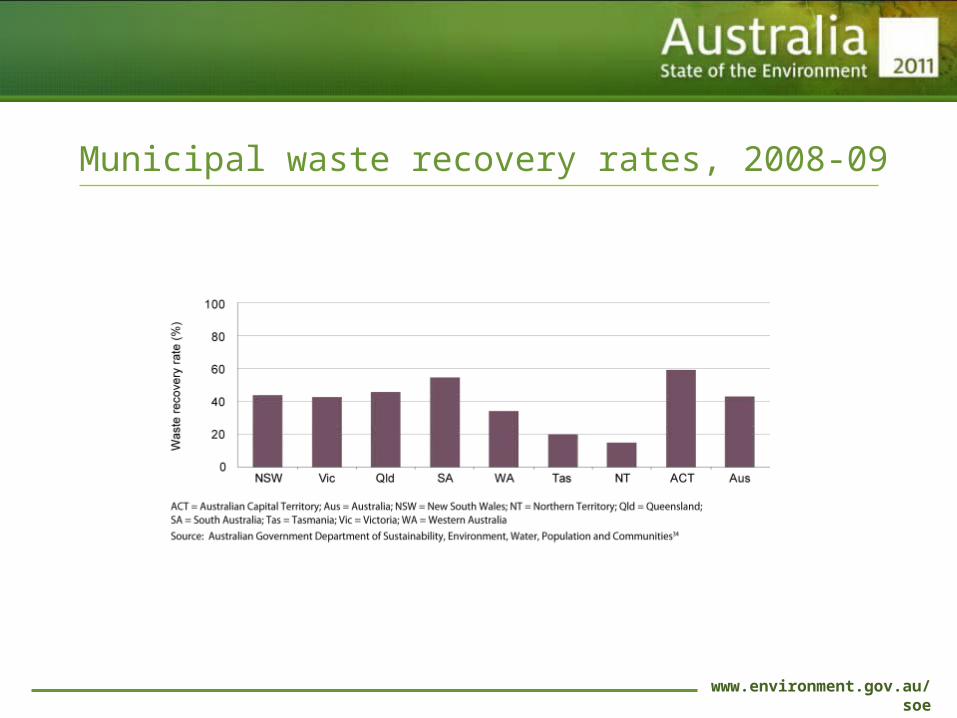
Municipal waste recovery rates, 2008-09

www.environment.gov.au/soe
Use of motorised transport modes in capital cities

www.environment.gov.au/soe
Cost of congestion for Australian metropolitan areas

www.environment.gov.au/soe
Percentage of adults using public transport as the main form of transport for work or study
City 1996 2000 2003 2006Change between
1996 and 2006a
Sydney 23.4 25.0 25.9 26.3 12.4
Melbourne 13.1 15.9 15.3 17.7 35.1
Brisbane 14.3 11.6 15.7 17.5 22.4
Adelaide 12.2 10.6 13.4 14.4 18.0
Perth 10.5 11.3 10.5 10.7 1.9
Hobart 12.8 5.2 6.9 10.3 - 19.5
Canberra 11.4 8.2 8.1 7.9 - 30.7
Total capital citiesb
16.3 17.2 17.9 19.1 17.2
Other areasc 2.7 1.9 2.4 1.7 - 37.0
Australia 11.9 12.2 13.0 13.5 13.4

www.environment.gov.au/soe
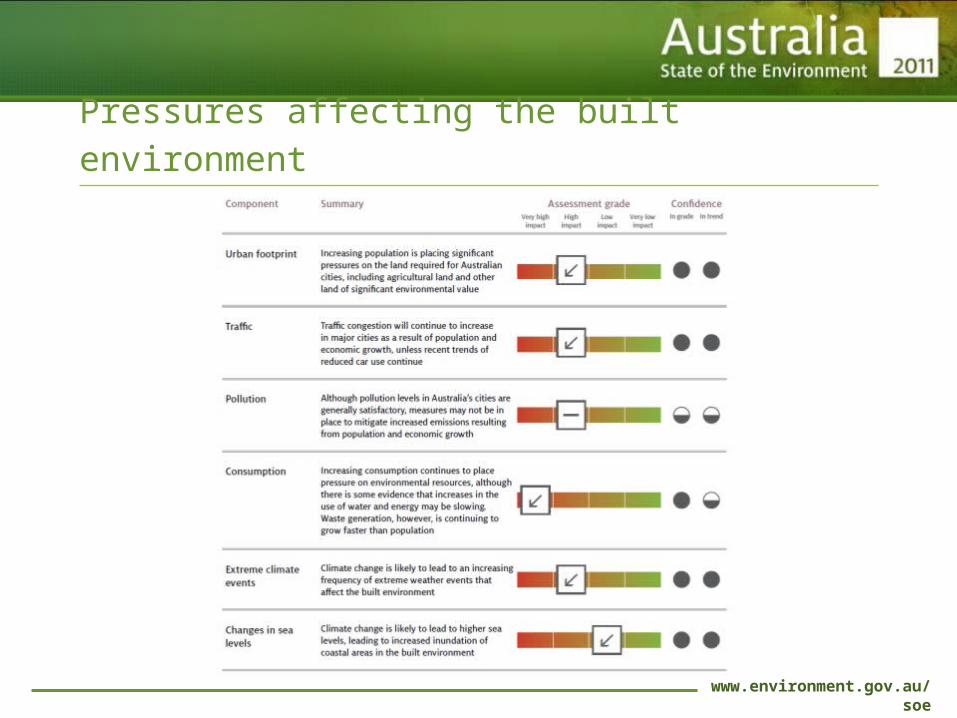
Pressures affecting the built environment Population growth, economic growth and climate change
lead to a number of pressures on the built environment:
Increased urban footprint
Increased traffic
Increased pollution
Increased consumption
Increased extreme weather events
Increased sea levels
www.environment.gov.au/soe
Pressures affecting the built environment

www.environment.gov.au/soe
Residents’ rating of state/territory government planning and managing of urban growth, 2011

www.environment.gov.au/soe
Management effectiveness
Recent management initiatives:
COAG criteria for capital city planning
National Urban Policy
Canberra, Australian Capital Territory. Photo by Ilya Genkin

www.environment.gov.au/soe
Management effectiveness
Current management of the built environment is only partly effective:
Good understanding of issues in development of plans
Disparate and often uncoordinated management arrangements
Investment often inadequate to deal with issues
Leads to partially effective outputs and outcomes

www.environment.gov.au/soe
Resilience
The resilience of the built environment to pressures is variable
Eastern suburbs of Melbourne, Victoria. Photo by Andrew Griffiths
The built environment is generally not resilient to pressures arising from growth, particularly population growth
More resilient to pressures associated with weather-related events

www.environment.gov.au/soe
Risks
mega-storms (likely, catastrophic)
mega-fires (likely, major)
heatwaves (almost certain, moderate)
floods (almost certain, moderate)
Increased traffic congestion (likely, major)
Contamination of water supply(possible, major)
Carram Downs bushfire, January 2009, Victoria. Photo by Winning Images
Increased urban footprint (almost certain, major)
Increased sea levels (almost certain, moderate)
Weather-related incidents, e.g:

www.environment.gov.au/soe
Outlook for the built environment Outlook for the built environment is mixed
Increasing pressures resulting from population and economic growth and climate change pose significant challenges
Increasing urban land use
Traffic congestion
Waste generation
More efficient consumption of water and energy
Recent initiatives to improve urban planning should lead to greater capability to deal with emerging challenges

www.environment.gov.au/soe
More information on the built environment
DETAILED REPORT
Work your way through the built environment chapter of Australia State of the Environment 2011
Have a look at the other chapters (drivers, coasts and atmosphere chapters are of particular relevance)
QUICK LOOK
Web site – www.environment.gov.au/soe
In Brief

www.environment.gov.au/soe
Intentions and impacts of SoE 2011...
Based on available information and expert opinion drawn from sources that are referenced in the report
Was designed to raise awareness and assist decision-makers
Highlights current issues that will require management responses to influence projected trends
Provides critical information, but can support change only if decision-makers consider and use it

www.environment.gov.au/soePhoto: Aerial view of the Pilbara, by Andrew Griffiths, Lensaloft
For more information email: [email protected]
To order copiesemail: [email protected]
phone: 1800 803 772 or read it online: www.environment.gov.au/soe