Www.bournemouth.ac.uk Hungry in hospital; Healthy in prison? H.J. HARTWELL and J.S.A. EDWARDS The...
41
www.bournemouth.ac.uk Hungry in hospital; Hungry in hospital; Healthy in prison? Healthy in prison? H.J. HARTWELL and J.S.A. EDWARDS H.J. HARTWELL and J.S.A. EDWARDS The Foodservice and Applied Nutrition Research The Foodservice and Applied Nutrition Research Group, School of Services Management, Group, School of Services Management, Bournemouth University Bournemouth University
-
Upload
ella-mahoney -
Category
Documents
-
view
215 -
download
1
Transcript of Www.bournemouth.ac.uk Hungry in hospital; Healthy in prison? H.J. HARTWELL and J.S.A. EDWARDS The...

www.bournemouth.ac.uk
Hungry in hospital; Healthy in Hungry in hospital; Healthy in prison?prison?
H.J. HARTWELL and J.S.A. EDWARDSH.J. HARTWELL and J.S.A. EDWARDS
The Foodservice and Applied Nutrition Research The Foodservice and Applied Nutrition Research Group, School of Services Management, Group, School of Services Management,
Bournemouth UniversityBournemouth University

www.bournemouth.ac.uk

www.bournemouth.ac.uk
Institutional Stereotyping
Subjects were asked
to rate their
anticipated
acceptability of 12
food items served in a
variety of settings
Eggs, toast, steak,
burger, pie, coffee etc
(Cardello, 1996)
1 = Dislike extremely5 = Neither dislike nor like9 = Like extremely
HomeHomeRestaurantRestaurant – traditional and fast foodAirlineAirlineSchoolSchoolMilitaryMilitaryHospitalHospital

www.bournemouth.ac.uk
Institutional Stereotyping
HomeHome (Cardello et al, 1996)
Full-service RestaurantFull-service Restaurant
Fast FoodFast Food
School Food ServiceSchool Food Service
Military Food ServiceMilitary Food Service
Airline Food ServiceAirline Food Service
Hospital Food ServiceHospital Food Service
Acceptability

www.bournemouth.ac.uk
Institutional Institutional StereotypingStereotyping
4
4.5
55.5
6
6.5
77.5
8
8.5
Chocola
te S
hake
Pizza
White
Bre
ad
Chocola
te C
ake
Peaches in
Syr
up
Gravy
Min
ced B
eef
Lik
ing
Unlabelled

www.bournemouth.ac.uk
Institutional StereotypingInstitutional Stereotyping
4
4.55
5.5
66.5
7
7.58
8.5
Chocola
te S
hake
Pizza
White
Bre
ad
Chocola
te C
ake
Peaches in
Syr
up
Gravy
Min
ced B
eef
Lik
ing
Unlabelled Labeled as Institution

www.bournemouth.ac.uk
Institutional StereotypingInstitutional Stereotyping
4
4.55
5.5
66.5
7
7.58
8.5
Chocola
te S
hake
Pizza
White
Bre
ad
Chocola
te C
ake
Peaches in
Syr
up
Gravy
Min
ced B
eef
Lik
ing
Unlabelled Labeled as Institution Actual

www.bournemouth.ac.uk
Hospitals
Hospital food often has a poor image, even before entering hospital, patients generally anticipate poor quality and low acceptance.
200 out of 500 patients were undernourished on admission and 75%
had lost weight while in hospital
McWhirter & Pennington (1994)

www.bournemouth.ac.uk
The Challenge of Hospital Foodservice
• Unwilling customers• Customers anxious, frightened, removed from
security of home• Alien environment, surrounded by strangers• Loss of privacy• Surrounded by ‘superior’ knowledgeable staff• Eating needs have to fit in with medical routine• Unnatural eating position• Meal times imposed• Menu choice made early
www.bournemouth.ac.uk
The NHS hospital is an 842 acute
bed site, serving approximately
800 meals at each main mealtime.

www.bournemouth.ac.uk
Study Design
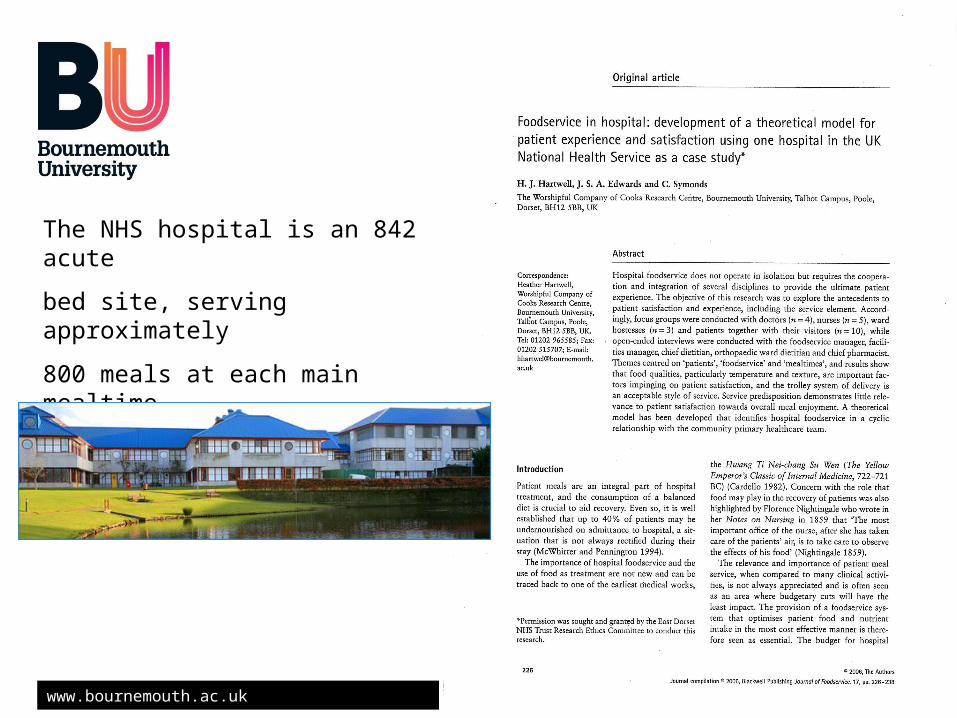
• Collect food consumption data for a period of 3 consecutive days (n=279) Collect food consumption data for a period of 3 consecutive days (n=279) from a plated and bulk system of foodservice deliveryfrom a plated and bulk system of foodservice delivery
• Questionnaires/interviews conducted to collect the perceptions and Questionnaires/interviews conducted to collect the perceptions and expectations of patients (n=615)expectations of patients (n=615)
• Interviews and focus groups conducted with stakeholders in hospital food Interviews and focus groups conducted with stakeholders in hospital food service - medical staff, caterers, dietitians, hospital managers, service - medical staff, caterers, dietitians, hospital managers, patients/visitors, pharmacy, ward hostesspatients/visitors, pharmacy, ward hostess
• Participant observation as a ward hostessParticipant observation as a ward hostess
www.bournemouth.ac.uk
Data Collection - Plated meal system

www.bournemouth.ac.uk
Data Collection - Bulk trolley system

www.bournemouth.ac.uk
Nut
ritio
nal I
ntak
e Nutrient/day Male Age Range 54-86 yrs Female Age Range 34-89 yrs Recommended/
day Plate system
( n = 8)
Bulk system ( n = 9 )
Recommended/day
Plate system
( n = 23 )
Bulk system ( n = 22 )
Energy (kcal)*
50-59yr 2550 60-64yr 2380 65-74yr 2330 75+ yr 2100
1308 299
1184 331
19-49yr 1940 50-74yr 1900 75+ 1810
1309 399
1134 252
Energy (MJ)* 50-59yr 10.60 60-64yr 9.93 65-74yr 9.70 75+ yr 8.77
5.5 1.2
5.0 1.4
19-49yr 8.10 50-74yr 7.96 75+ 7.61
5.5 1.7
4.8 1.0
Protein (g)* 53.3
51 15 50 13.5 46.5 48.3 13 45.1 13
Fat (% Energy)*
35 38 35 35 39 38
CHO (% Energy)*
50 50 51 50 50 49
Vitamin C (mg)**
40 78 42 64 29 40 94 68 75 23
Iron (mg)** 8.7 7.0 2.0 7.3 2.5 19-50yr 14.8 50+yr 8.7
7.0 2.1 7.4 2.4
Folate (g)** 200
139 45 144 67 200 153 49 145 47
*Recommendations from Dietary Reference Values(Department of Health 1991) **Recommendations from The Nutritional Guidelines for Hospital Catering (Department of Health 1995) Estimated Average Requirement (EAR) with PAL=1.4 Reference Nutrient Intake (RNI)

www.bournemouth.ac.uk
Plated system Trolley system Plate Kitchen Plate Trolley
11.6% None - food remaining sentto staff restaurant
5.9% 20.5%
Food Wastage According to Meal Service System

www.bournemouth.ac.uk
Pat
ient
Sat
isfa
ctio
n Plate
system
Trolley system
Items Mean Mean Before: meal experience (Expectation)
How much are you looking forward to your meal? 4.51 4.91* How appealing do you think that the meal will be? 4.81 4.77
How tasty do you think the food will be? 4.8 4.87 How satisfied do you expect to be with your meal? 5.01 5.11
After: meal experience (Perception) How well did the portion size match expectation? 5.54 5.85 *
How would you rate the presentation of your meal? 5.14 5.58 * How appealing was the meal? 4.58 5.27 *
Were the food items served at the correct temperature? 1.21 1.86 * How tasty was your food? 5.05 5.60 *
How satisfied were you with your meal? 5.10 5.72 * How happy were you with the choice available? 5.14 5.03
How would you rate the overall standard of catering in this hospital?
5.85 6.75 *
* denotes significant difference (p<0.05) (1=highly negative response to 7/9=highly positive response)

www.bournemouth.ac.uk
• Patient expectation/perception
• Empathy and emotional support from staff
www.bournemouth.ac.uk
Study Design
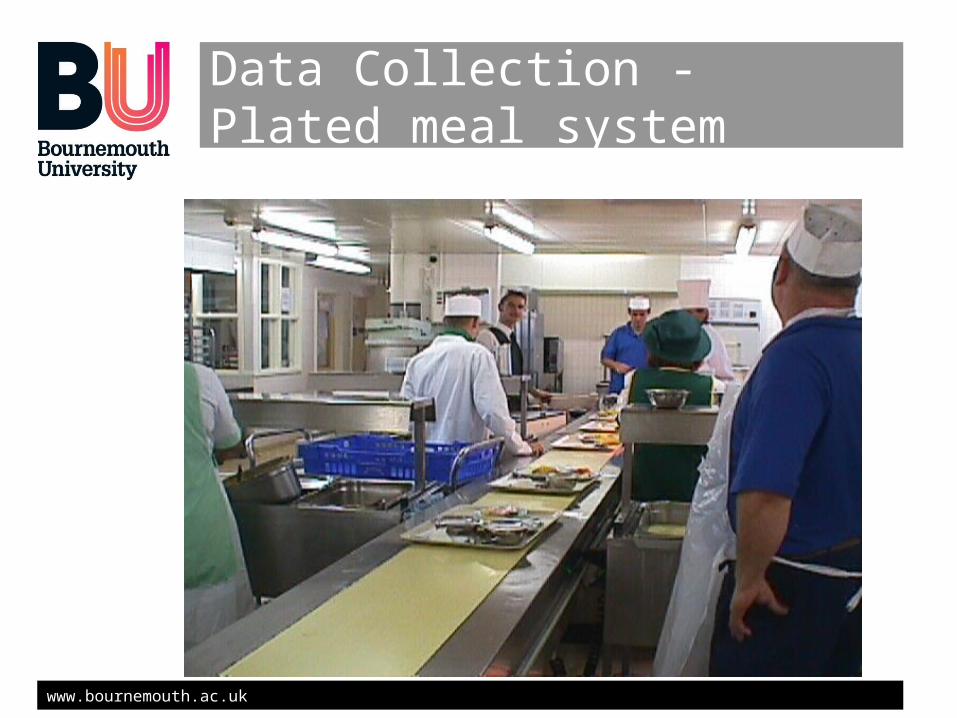
Imagine this menu was presented for you to choose from for tomorrow. Please make a choice from each course on the following
sample menu;Starter
Tomato Soup Chefs Special hearty Tomato Soup
Heinz Tomato SoupMain Course
Youngs Fish Pie Fish Pie
Locally caught Fish PieDessert
Cadburys Chocolate Sponge and Cadburys Chocolate Sauce
Legendary Chocolate Sponge and Chocolate Sauce
Chocolate Sponge and Chocolate Sauce
Hartwell, H, and Edwards, J.S.A (2008) Descriptive menus and branding in hospital foodservice – a pilot study. International Journal of Contemporary Hospitality Management, (in press)

www.bournemouth.ac.uk
Results – issues of importance
Male mean Female mean
Hospitals provide a healthy and nutritious meal 4.3 I prefer food that I am familiar with 4.5
The ingredients in foods are important to me 4.3 The ingredients in foods are important to me 4.4
I prefer food that I am familiar with 4.2 Hospitals provide a healthy and nutritious meal 4.1
It is important to me where the ingredients have come from
4.1 It is important to me where the ingredients have come from
3.8
The majority of menu choices are appealing to me 4.0 The majority of menu choices are appealing to me 3.6
I would like to know more about the dishes on the menu
3.5 I would like to know if any brands of foods are used on the menu
3.6
During the production process branded foods are produced professionally and with care
3.5 I would like to know more about the dishes on the menu
3.5
I would like to know if any brands of foods are used on the menu
3.4 Basic dish descriptions do not help my decision in choosing an item from the menu
3.2
The ingredients in popular branded foods are of a higher quality when compared to unbranded food products
3.0 During the production process branded foods are produced professionally and with care
3.1
I would like to see more familiar brands 2.8 I would like to see more familiar brands 3.0

www.bournemouth.ac.uk

www.bournemouth.ac.uk
Discussion

www.bournemouth.ac.uk
Discussion

www.bournemouth.ac.uk
Study Design
Profile accumulation technique (PAT):
• The best things about...are...
• The reasons why they are best are…
• The things that are not so good about...are...
• The reasons why they are not so good are…
• 41 usable forms obtained, mostly self-filled, 6 completed by amanuensis.
Johns N, Hartwell H and Morgan M (2009) Evaluating the patient experience: using Profile Accumulation Technique (PAT)

www.bournemouth.ac.uk
PROFILE OF RESPONDENT COMMENTS
0
5
10
15
20
25
30
35
40
45
50
Foods &food quality
Choice Servicestaff
Being caredfor
Timing &routine
Meals &lifestyle
Relativefood quality
Servicequality
Foodquantity
Relativeservicequality
Positive items
Negative items

www.bournemouth.ac.uk
‘…what we need is basic care, the food that we want, it should be hot, it should be well presented and well cooked. If we don’t eat we will be in hospital for longer and all we want to do is go home’ – patient

www.bournemouth.ac.uk
Prison Foodservice in Prison Foodservice in EnglandEngland
Edwards, J.S.A., Hartwell, H.J., Reeve, W.G. and Schafheitle, J. (2007). The diet of prisoners in England. British Food Journal. 109(3). 216-232.

www.bournemouth.ac.uk
The Challenge of Prison Foodservice
• Relieves boredom and monotony of a routine existence
• Catalyst for aggression, particularly at meal times
• Obvious/easy target and vehicle for complaints
• Used as a currency and to barter on the ‘underground economy’
• Used to bully and influence

www.bournemouth.ac.uk
Study Design
Random
Kitchen/service area observation
3-days data from cyclical menus
Standard recipes & menus
Unstructured interviews
Prison SelectionPrison Selection
Data collection Data collection
methodsmethods
4 Male Prisons2 Female Prisons2 Young Offenders Institutes
1 Private Contract

www.bournemouth.ac.uk
The Prison Menu
Food Quantity
Breakfast cereal (various) Various (± 30g)
Full fat milk 284 g
Tea bags 13 g
Coffee whitener 10 g
Sugar, white 20 g
Brown or white bread 2 slices
Jam 25 g
Spread 10 g
Typical Breakfast Meal

www.bournemouth.ac.uk
The Prison Menu
Typical Midday & Evening Meals
Day Midday Evening
Day 1 Vegetarian Pasta BakeChicken & Mushroom PieHalal Jamaican Beef PattiCorned Beef & Pickle RollJacket Potato & Coleslaw
Vegetable SupremeChicken SupremeHalal Chicken CurryGrilled GammonPork Pie Salad
Day 2 Vegetable Pancake RollBreaded fishCheese & Beano GrillCheese & Tomato RollJacket Potato & Tuna
Bean & Vegetable CurryChicken ChasseurHalal Beef CasseroleFish in Parsley SauceVegetable Quiche Salad

www.bournemouth.ac.uk
Food Preparation
Staffing
Prison officers – Both uniformed and civilian
Prisoners –
Cooks
‘Specialist’ cooks
Kitchen porters
ServicePrison officersPrisoners
www.bournemouth.ac.uk
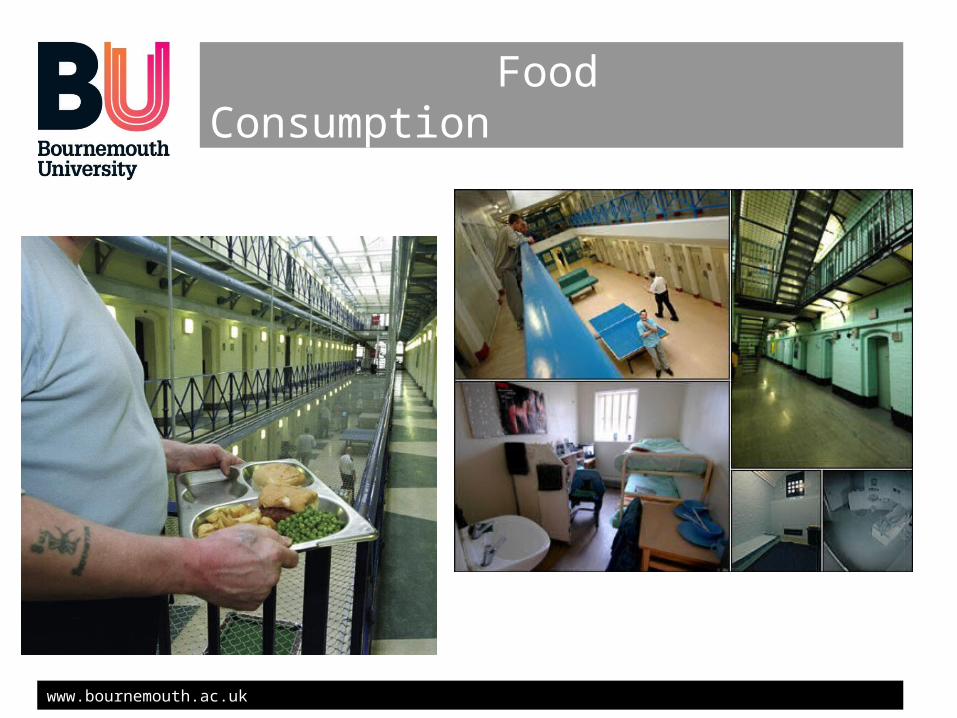
Food Consumption

www.bournemouth.ac.uk
Nutritional Intake
Nutrient UnitStandard
MaleDiet
Recom-mend-ations
Standard Female
Diet
Recom-mend-ations
StandardYOIDiet
Recom-mend-ations
Mean SD Mean SD Mean SD
Energy kcal 3042 87 2550 3007 471 1940 3115 561 2755
MJ 12.80 0.37 10.6 12.64 1.96 8.1 13.13 2.53 11.51
Protein g 104.6 7.4 55.5 98.1 5.2 45 98.4 5.4 55.2
Total Fat g 119.2 3.2
130.9 30.1 108.3 32.2
Carbohydrate g 413.9 18.2
385.5 44.8 465.6 78.8

www.bournemouth.ac.uk
Macronutrient Contribution
0 5 10 15 20 25 30 35 40 45 50 55 60
Study 2 S
tanda
rd Y
OI Diet
Study 2 S
tanda
rd F
emale Diet
Study 2 S
tanda
rd M
ale Diet
Study 1 S
tanda
rd M
ale Diet
Carbohydrate of which Saturated Fat Total Fat
%

www.bournemouth.ac.uk
Macronutrient Contribution
0 5 10 15 20 25 30 35 40 45 50 55 60
Study 2 S
tanda
rd Y
OI Diet
Study 2 S
tanda
rd F
emale Diet
Study 2 S
tanda
rd M
ale Diet
Study 1 S
tanda
rd M
ale Diet
Carbohydrate of which Saturated Fat Total Fat
%

www.bournemouth.ac.uk
Macronutrient Contribution
0 5 10 15 20 25 30 35 40 45 50 55 60
Study 2 S
tanda
rd Y
OI Diet
Study 2 S
tanda
rd F
emale Diet
Study 2 S
tanda
rd M
ale Diet
Study 1 S
tanda
rd M
ale Diet
Carbohydrate of which Saturated Fat Total Fat
%

www.bournemouth.ac.uk
Sodium Intake
Nutrient Unit
Study 1Standard
MaleDiet
Study 2Standard
MaleDiet
Study 2Standard FemaleDiet
Study 2Standard
YOIDiet
Recom-mend-ations
Mean SD Mean SDMea
n SD Mean SD
Sodium mg4096 1286 4534 847 4208 268 3912 706 1600
Salt 10.4g 11.6g 10.7g 10.0g 6.0g

www.bournemouth.ac.uk
Menu Balance
• Healthy options
• Able to select a range of meals
• Similar to WW2 diet• Monotony-repetition
• Fruit
• Vegetables

www.bournemouth.ac.uk
Prisoners are provided with a high standard of food, which with some exceptions, enables them choose a healthy, nutritionally balance diet; which in the main they do.
Prisons have attempted to provide meals which conform with the balance of good health.

www.bournemouth.ac.uk
Hospital or Prison?

www.bournemouth.ac.uk
Foodservice and Applied Foodservice and Applied Nutrition Research GroupNutrition Research Group
John S.A. Edwards,John S.A. Edwards,PhD., Dr honoris causa (Örebro University, Sweden)
Professor of Foodservice
Heather J. Hartwell, Heather J. Hartwell, PhD., Registered Nutritionist