WWC Intervention Report U.S. DEPARTMENT OF EDCATION What ... · Fast Track October 2014 Page 6 WWC...
40
Fast Track October 2014 Page 1 WWC Intervention Report U.S. DEPARTMENT OF EDUCATION Children Classified as Having an Emotional Disturbance October 2014 What Works Clearinghouse ™ Fast Track: Elementary School Program Description 1 Fast Track is a comprehensive intervention program designed to reduce conduct problems and promote academic, behavioral, and social improvement. Prior to first grade, students are identified as being at risk for long-term antisocial behavior through teacher and par- ent reports of conduct problems. Delivery of the program begins in the first grade and continues through tenth grade. After the first year, the frequency of the supports is reduced based on the assessed function- ing of the students and their families. Fast Track consists of seven integrated intervention components: the Promoting Alternative THinking Strategies (PATHS) curriculum, parent groups, parent–child sharing time, child social skills training groups, home visiting, child peer-pairing, and academic tutoring. These com- ponents take place during the school day, during 2-hour long extra- curricular enrichment programs involving both parents and children, and in the home. Research 2 The What Works Clearinghouse (WWC) identified one study of Fast Track that both falls within the scope of the Children Classified as Having an Emotional Disturbance topic area and meets WWC group design standards. This study meets standards without reservations. This study included 891 students who were identified in kindergarten as being behaviorally disruptive and at high risk for long-term antisocial behavior in 54 schools in four locations. The WWC considers the extent of evidence for Fast Track on the behavior and achievement outcomes for children classified as having an emotional disturbance (or children at risk for classification) to be small for four outcome domains—emotional/internal behavior, reading achievement/literacy, external behavior, and social outcomes. There were no studies that meet standards in the three other domains, so this intervention report does not report on the effectiveness of Fast Track for those domains. (See the Effectiveness Summary starting on p. 5 for more details of effectiveness by domain.) Effectiveness Fast Track was found to have potentially positive effects on emotional/internal behavior, reading achievement/lit- eracy, external behavior, and social outcomes for children classified as having an emotional disturbance (or children at risk for classification). Report Contents Overview p. 1 Program Information p. 3 Research Summary p. 4 Effectiveness Summary p. 5 References p. 8 Research Details for Each Study p. 10 Outcome Measures for Each Domain p. 14 Findings Included in the Rating for Each Outcome Domain p. 22 Supplemental Findings for Each Outcome Domain p. 26 Endnotes p. 37 Rating Criteria p. 39 Glossary of Terms p. 40
Transcript of WWC Intervention Report U.S. DEPARTMENT OF EDCATION What ... · Fast Track October 2014 Page 6 WWC...

Fast Track October 2014 Page 1
WWC Intervention Report U.S. DEPARTMENT OF EDUCATION
Children Classified as Having an Emotional Disturbance October 2014
What Works Clearinghouse™
Fast Track: Elementary SchoolProgram Description1
Fast Track is a comprehensive intervention program designed to reduce conduct problems and promote academic, behavioral, and social improvement. Prior to first grade, students are identified as being at risk for long-term antisocial behavior through teacher and par-ent reports of conduct problems. Delivery of the program begins in the first grade and continues through tenth grade. After the first year, the frequency of the supports is reduced based on the assessed function-ing of the students and their families.
Fast Track consists of seven integrated intervention components: the Promoting Alternative THinking Strategies (PATHS) curriculum, parent groups, parent–child sharing time, child social skills training groups, home visiting, child peer-pairing, and academic tutoring. These com-ponents take place during the school day, during 2-hour long extra-curricular enrichment programs involving both parents and children, and in the home.
Research2 The What Works Clearinghouse (WWC) identified one study of Fast Track that both falls within the scope of the Children Classified as Having an Emotional Disturbance topic area and meets WWC group design standards. This study meets standards without reservations. This study included 891 students who were identified in kindergarten as being behaviorally disruptive and at high risk for long-term antisocial behavior in 54 schools in four locations.
The WWC considers the extent of evidence for Fast Track on the behavior and achievement outcomes for children classified as having an emotional disturbance (or children at risk for classification) to be small for four outcome domains—emotional/internal behavior, reading achievement/literacy, external behavior, and social outcomes. There were no studies that meet standards in the three other domains, so this intervention report does not report on the effectiveness of Fast Track for those domains. (See the Effectiveness Summary starting on p. 5 for more details of effectiveness by domain.)
EffectivenessFast Track was found to have potentially positive effects on emotional/internal behavior, reading achievement/lit-eracy, external behavior, and social outcomes for children classified as having an emotional disturbance (or children at risk for classification).
Report Contents
Overview p. 1
Program Information p. 3
Research Summary p. 4
Effectiveness Summary p. 5
References p. 8
Research Details for Each Study p. 10
Outcome Measures for Each Domain p. 14
Findings Included in the Rating for Each Outcome Domain p. 22
Supplemental Findings for Each Outcome Domain p. 26
Endnotes p. 37
Rating Criteria p. 39
Glossary of Terms p. 40
Fast Track October 2014 Page 2
WWC Intervention Report
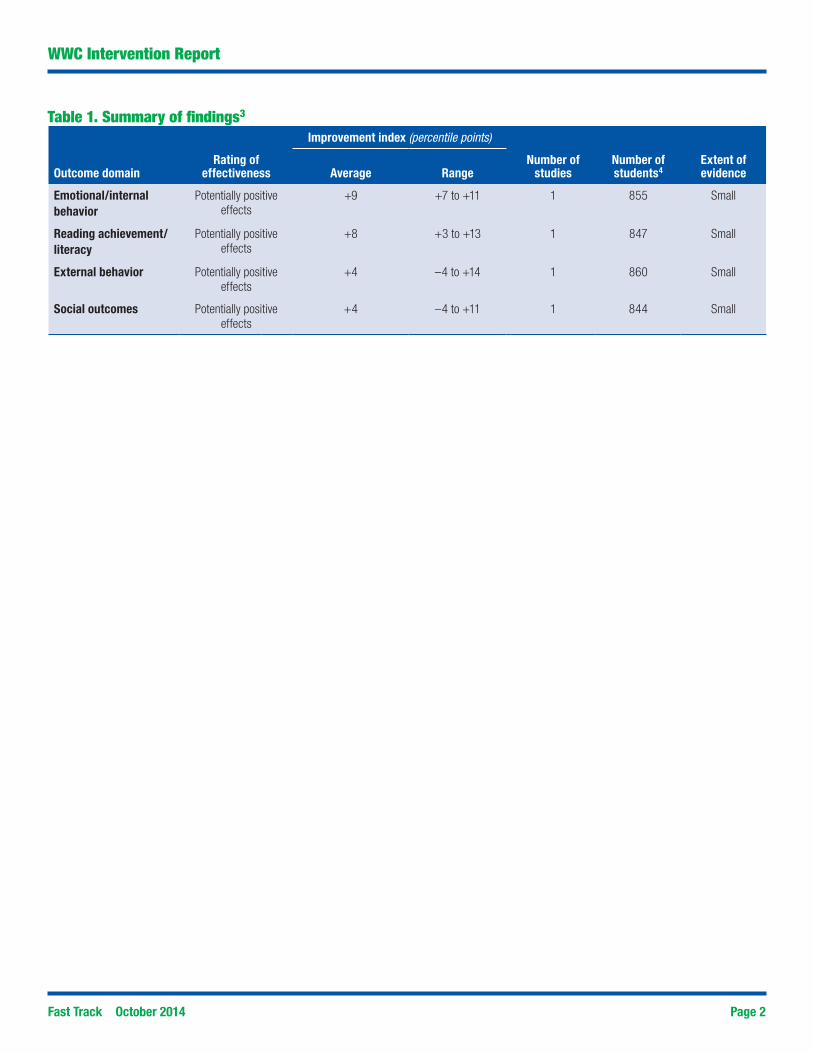
Table 1. Summary of findings3
Improvement index (percentile points)
Outcome domainRating of
effectiveness Average RangeNumber of
studiesNumber of students4
Extent of evidence
Emotional/internal behavior
Potentially positive effects
+9 +7 to +11 1 855 Small
Reading achievement/literacy
Potentially positive effects
+8 +3 to +13 1 847 Small
External behavior Potentially positive effects
+4 –4 to +14 1 860 Small
Social outcomes Potentially positive effects
+4 –4 to +11 1 844 Small

Fast Track October 2014 Page 3 3
WWC Intervention Report
Program Information
BackgroundThe developers and principal investigators of Fast Track are: Karen L. Bierman, Ph.D.; Kenneth A. Dodge, Ph.D.; Mark T. Greenberg, Ph.D.; John E. Lochman, Ph.D.; Robert J. McMahon, Ph.D.; and Ellen E. Pinderhughes, Ph.D. Address: Fast Track & Fast Track Data Center, Bay C, 2nd Floor, Mill Bldg, 2024 W. Main St., Duke Box 90539, Durham, NC 27708-0539. Telephone: (814) 863-0112. Fax: (814) 865-2530. Email: [email protected]. Web: http://www.fasttrackproject.org/.
Program detailsFast Track is a comprehensive intervention program designed to reduce conduct problems and promote academic, behavioral, and social improvement. From first through fifth grade, students identified as high risk for long-term antisocial behavior receive multiple components of the intervention:
• ThePATHS curriculum, which is intended to develop emotional communication, social understanding, self-control, and problem solving, is delivered by teachers in the classroom. Lessons are delivered, on average, two to three times a week.
• Theparentgrouptrainingandhomevisitsareintendedtoteachparentingandbehaviormanagementskillsand foster parents’ problem solving, self-efficacy, and life management skills. Home visits are conducted once every 2 weeks, supplemented by telephone calls between group sessions.
• Thestudentsocialskillstraininggroups,includingaparent–childactivitysessiontofosterpositiveinteraction,are delivered as part of a 2-hour enrichment program at school outside of regular hours.
• Studentsparticipateintwo30-minutetutoringsessionsinreadingandone30-minutefriendshipenhancementactivity each week at the school during school hours. The peer-pairing friendship enhancement sessions are intended to provide students with the opportunity to play and apply their social skills to develop friendships with their classroom peers.
After the first year, the frequency of these supports is reduced based on the assessed functioning of the students and their families.
Fast Track also provides long-term student and family support from sixth through tenth grade. Support during the middle and high school years includes student and parent groups and individualized support. Student groups address issues of peer pressure, substance abuse, sexual development, and organization and decision-making skills. Parent groups focus on the development of positive relationships and monitoring of their children, and emphasize support for academic achievement. Based on their assessed need, students receive academic tutoring, mentoring, or family problem-solving assistance.
Cost5 Fast Track is estimated to cost $58,283 per student over a 10-year period in 2004 US dollars. Costs were estimated from a payer perspective for the 10-year period of intervention delivery.
Fast Track October 2014 Page 4
WWC Intervention Report
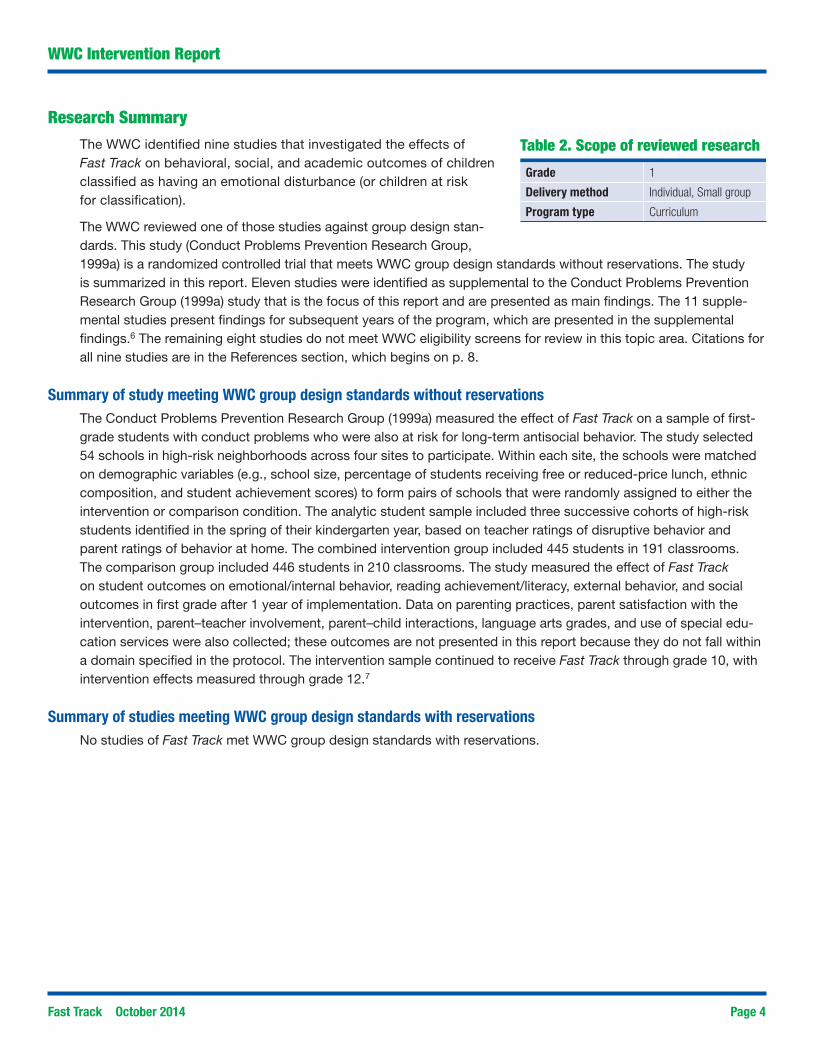
Research SummaryThe WWC identified nine studies that investigated the effects of Fast Track on behavioral, social, and academic outcomes of children classified as having an emotional disturbance (or children at risk for classification).
The WWC reviewed one of those studies against group design stan-dards. This study (Conduct Problems Prevention Research Group, 1999a) is a randomized controlled trial that meets WWC group design standards without reservations. The study is summarized in this report. Eleven studies were identified as supplemental to the Conduct Problems Prevention Research Group (1999a) study that is the focus of this report and are presented as main findings. The 11 supple-mental studies present findings for subsequent years of the program, which are presented in the supplemental findings.6 The remaining eight studies do not meet WWC eligibility screens for review in this topic area. Citations for all nine studies are in the References section, which begins on p. 8.
Summary of study meeting WWC group design standards without reservationsThe Conduct Problems Prevention Research Group (1999a) measured the effect of Fast Track on a sample of first-grade students with conduct problems who were also at risk for long-term antisocial behavior. The study selected 54 schools in high-risk neighborhoods across four sites to participate. Within each site, the schools were matched on demographic variables (e.g., school size, percentage of students receiving free or reduced-price lunch, ethnic composition, and student achievement scores) to form pairs of schools that were randomly assigned to either the intervention or comparison condition. The analytic student sample included three successive cohorts of high-risk students identified in the spring of their kindergarten year, based on teacher ratings of disruptive behavior and parent ratings of behavior at home. The combined intervention group included 445 students in 191 classrooms. The comparison group included 446 students in 210 classrooms. The study measured the effect of Fast Track on student outcomes on emotional/internal behavior, reading achievement/literacy, external behavior, and social outcomes in first grade after 1 year of implementation. Data on parenting practices, parent satisfaction with the intervention, parent–teacher involvement, parent–child interactions, language arts grades, and use of special edu-cation services were also collected; these outcomes are not presented in this report because they do not fall within a domain specified in the protocol. The intervention sample continued to receive Fast Track through grade 10, with intervention effects measured through grade 12.7
Summary of studies meeting WWC group design standards with reservationsNo studies of Fast Track met WWC group design standards with reservations.
Grade 1
Delivery method Individual, Small group
Program type Curriculum
Table 2. Scope of reviewed research

Fast Track October 2014 Page 5
WWC Intervention Report
Effectiveness Summary
Table 3. Rating of effectiveness and extent of evidence for the emotional/internal behavior domainRating of effectiveness Criteria met
Potentially positive effectsEvidence of a positive effect with no overriding contrary evidence.
In the one study that reported findings, the estimated impact of the intervention on outcomes in the emotional/internal behavior domain was positive and statistically significant.
Extent of evidence Criteria met
Small One study that included 855 students in 54 schools reported evidence of effectiveness in the emotional/internal behavior domain.
The WWC review of Fast Track for the Children Classified as Having an Emotional Disturbance topic area includes student outcomes in seven domains: emotional/internal behavior, reading achievement/literacy, external behavior, social outcomes, math achievement, school attendance, and other academic performance. The one study of Fast Track that meets WWC group design standards reported findings in four of the seven domains: (a) emotional/inter-nal behavior, (b) reading achievement/literacy, (c) external behavior, and (d) social outcomes. The findings below present the authors’ estimates and WWC-calculated estimates of the size and statistical significance of the effects of Fast Track on children classified as having an emotional disturbance (or children at risk for classification). For a more detailed description of the rating of effectiveness and extent of evidence criteria, see the WWC Rating Criteria on p. 39.
Summary of effectiveness for the emotional/internal behavior domainOne study that meets WWC group design standards without reservations reported findings in the emotional/internal behavior domain.
The Conduct Problems Prevention Research Group (1999a) found, and the WWC confirmed, a positive and statisti-cally significant difference between the intervention and comparison groups on the Emotion Recognition Question-naire and Interview of Emotional Experience (IEE).
Thus, for the emotional/internal behavior domain, one study with a strong design showed a statistically significant positive effect. This results in a rating of potentially positive effects, with a small extent of evidence.
Summary of effectiveness for the reading achievement/literacy domainOne study that meets WWC standards without reservations reported findings in the reading achievement/literacy domain.
The Conduct Problems Prevention Research Group (1999a) found, and the WWC confirmed, a positive and sta-tistically significant difference between the intervention and comparison groups on the Spache Diagnostic Read-ing Scale (DRS), and no statistically significant difference between the intervention and comparison groups on the Woodcock-Johnson Psycho-Educational Battery–Revised, Letter-Word Identification subtest.
Thus, for the reading achievement/literacy domain, one study with a strong design showed a statistically significant positive effect. This results in a rating of potentially positive effects, with a small extent of evidence.
Fast Track October 2014 Page 6
WWC Intervention Report
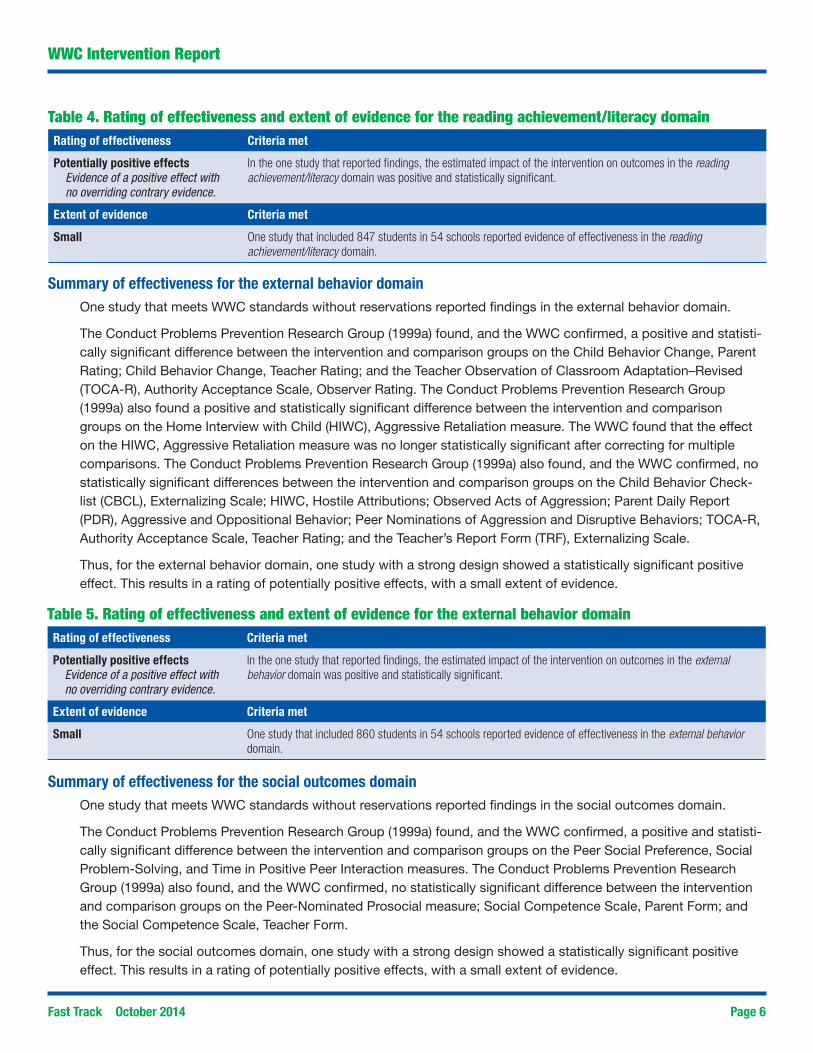
Summary of effectiveness for the external behavior domainOne study that meets WWC standards without reservations reported findings in the external behavior domain.
The Conduct Problems Prevention Research Group (1999a) found, and the WWC confirmed, a positive and statisti-cally significant difference between the intervention and comparison groups on the Child Behavior Change, Parent Rating; Child Behavior Change, Teacher Rating; and the Teacher Observation of Classroom Adaptation–Revised (TOCA-R), Authority Acceptance Scale, Observer Rating. The Conduct Problems Prevention Research Group (1999a) also found a positive and statistically significant difference between the intervention and comparison groups on the Home Interview with Child (HIWC), Aggressive Retaliation measure. The WWC found that the effect on the HIWC, Aggressive Retaliation measure was no longer statistically significant after correcting for multiple comparisons. The Conduct Problems Prevention Research Group (1999a) also found, and the WWC confirmed, no statistically significant differences between the intervention and comparison groups on the Child Behavior Check-list (CBCL), Externalizing Scale; HIWC, Hostile Attributions; Observed Acts of Aggression; Parent Daily Report (PDR), Aggressive and Oppositional Behavior; Peer Nominations of Aggression and Disruptive Behaviors; TOCA-R, Authority Acceptance Scale, Teacher Rating; and the Teacher’s Report Form (TRF), Externalizing Scale.
Thus, for the external behavior domain, one study with a strong design showed a statistically significant positive effect. This results in a rating of potentially positive effects, with a small extent of evidence.
Table 4. Rating of effectiveness and extent of evidence for the reading achievement/literacy domainRating of effectiveness Criteria met
Potentially positive effectsEvidence of a positive effect with no overriding contrary evidence.
In the one study that reported findings, the estimated impact of the intervention on outcomes in the reading achievement/literacy domain was positive and statistically significant.
Extent of evidence Criteria met
Small One study that included 847 students in 54 schools reported evidence of effectiveness in the reading achievement/literacy domain.
Table 5. Rating of effectiveness and extent of evidence for the external behavior domainRating of effectiveness Criteria met
Potentially positive effectsEvidence of a positive effect with no overriding contrary evidence.
In the one study that reported findings, the estimated impact of the intervention on outcomes in the external behavior domain was positive and statistically significant.
Extent of evidence Criteria met
Small One study that included 860 students in 54 schools reported evidence of effectiveness in the external behavior domain.
Summary of effectiveness for the social outcomes domainOne study that meets WWC standards without reservations reported findings in the social outcomes domain.
The Conduct Problems Prevention Research Group (1999a) found, and the WWC confirmed, a positive and statisti-cally significant difference between the intervention and comparison groups on the Peer Social Preference, Social Problem-Solving, and Time in Positive Peer Interaction measures. The Conduct Problems Prevention Research Group (1999a) also found, and the WWC confirmed, no statistically significant difference between the intervention and comparison groups on the Peer-Nominated Prosocial measure; Social Competence Scale, Parent Form; and the Social Competence Scale, Teacher Form.
Thus, for the social outcomes domain, one study with a strong design showed a statistically significant positive effect. This results in a rating of potentially positive effects, with a small extent of evidence.

Fast Track October 2014 Page 7
WWC Intervention Report
Table 6. Rating of effectiveness and extent of evidence for the social outcomes domainRating of effectiveness Criteria met
Potentially positive effectsEvidence of a positive effect with no overriding contrary evidence.
In the one study that reported findings, the estimated impact of the intervention on outcomes in the social outcomes domain was positive and statistically significant.
Extent of evidence Criteria met
Small One study that included 844 students in 54 schools reported evidence of effectiveness in the social outcomes domain.

Fast Track October 2014 Page 8
WWC Intervention Report
References
Studies that meet WWC group design standards without reservationsConduct Problems Prevention Research Group. (1999a). Initial impact of the Fast Track prevention trial for conduct
problems: I. The high-risk sample. Journal of Consulting and Clinical Psychology, 67(5), 631–647. Additional sources:Bierman, K. L., Coie, J., Dodge, K., Greenberg, M., Lochman, J., McMohan, R., … Conduct Problems Pre-
vention Research Group. (2013). School outcomes of aggressive-disruptive children: Prediction from kindergarten risk factors and impact of the Fast Track prevention program. Aggressive Behavior, 39(2), 114–130.
Conduct Problems Prevention Research Group. (2002a). Evaluation of the first 3 years of the Fast Track prevention trial with children at high risk for adolescent conduct problems. Journal of Abnormal Child Psychology, 30(1), 19–35.
Conduct Problems Prevention Research Group. (2002c). Using the Fast Track randomized prevention trial to test the early-starter model of the development of serious conduct problems. Development and Psycho-pathology, 14(4), 925–943.
Conduct Problems Prevention Research Group. (2004). The effects of the Fast Track program on serious problem outcomes at the end of elementary school. Journal of Clinical Child and Adolescent Psychology, 33(4), 650–661.
Conduct Problems Prevention Research Group. (2007). Fast Track randomized controlled trial to prevent externalizing psychiatric disorders: Findings from grades 3 to 9. Journal of the American Academy of Child and Adolescent Psychiatry, 46(10), 1250–1262.
Conduct Problems Prevention Research Group. (2010a). Fast Track intervention effects on youth arrests and delinquency. Journal of Experimental Criminology, 6(2), 131–157.
Conduct Problems Prevention Research Group. (2010b). The difficulty of maintaining positive intervention effects: A look at disruptive behavior, deviant peer relations, and social skills during the middle school years. The Journal of Early Adolescence, 30(4), 593–624.
Conduct Problems Prevention Research Group. (2011). The effects of the Fast Track preventive intervention on the development of conduct disorder across childhood. Child Development, 82(1), 331–345.
Dodge, K. A., Godwin, J., & Conduct Problems Prevention Research Group. (2013). Social-information-processing patterns mediate the impact of preventive intervention on adolescent antisocial behavior. Psychological Science, 24(4), 456–465.
Foster, E. M. (2010). Costs and effectiveness of the Fast Track intervention for antisocial behavior. The Journal of Mental Health Policy and Economics, 13(3), 101–119.
Rabiner, D. L., Malone, P. S., & Conduct Problems Prevention Research Group. (2004). The impact of tutor-ing on early reading achievement for children with and without attention problems. Journal of Abnormal Child Psychology, 32(3), 273–284.
Studies that meet WWC group design standards with reservationsNone.
Studies that do not meet WWC group design standardsNone.

Fast Track October 2014 Page 9
WWC Intervention Report
Studies that are ineligible for review using the Children Classified as Having an Emotional Disturbance Evidence Review Protocol
Conduct Problems Prevention Research Group. (1999b). Initial impact of the Fast Track prevention trial for conduct problems: II. Classroom effects. Journal of Consulting and Clinical Psychology, 67(5), 648–657. The study is ineligible for review because it does not use a sample aligned with the protocol—the sample includes less than 50% students at risk for emotional disturbance or classified as emotionally disturbed.
Conduct Problems Prevention Research Group. (2010c). The effects of a multiyear universal social-emotional learn-ing program: The role of student and school characteristics. Journal of Consulting and Clinical Psychology, 78(2), 156–168. The study is ineligible for review because it does not use a sample aligned with the proto-col—the sample includes less than 50% students at risk for emotional disturbance or classified as emotionally disturbed.
Greenberg, M. T., & Kusche, C. A. (1993). Promoting social and emotional development in deaf children: The PATHS project. Seattle: University of Washington Press. The study is ineligible for review because it does not use a sample aligned with the protocol—the sample includes less than 50% students at risk for emotional distur-bance or classified as emotionally disturbed.
Greenberg, M. T., Kusche, C. A., Cook, E. T., & Quamma, J. P. (1995). Promoting emotional competence in school-aged children: The effects of the PATHS curriculum. Development and Psychopathology, 7(1), 117–136. The study is ineligible for review because it does not use a sample aligned with the protocol—the sample includes less than 50% students at risk for emotional disturbance or classified as emotionally disturbed.
Jones, D., Godwin, J., Dodge, K. A., Bierman, K. L., Coie, J. D., Greenberg, M. T., … Pinderhughes, E. E. (2010). Impact of the Fast Track prevention program on health services use by conduct-problem youth. Pediatrics, 125(1), 130–136. The study is ineligible for review because it does not include an outcome within a domain specified in the protocol.
Lavallee, K. L., Bierman, K. L., & Nix, R. L. (2005). The impact of first-grade “friendship group” experiences on child social outcomes in the Fast Track program. Journal of Abnormal Child Psychology, 33(3), 307. The study is ineligible for review because it does not use a comparison group design or a single-case design.
Nix, R. L., Bierman, K. L., McMahon, R. J., & Conduct Problems Prevention Research Group. (2009). How atten-dance and quality of participation affect treatment response to parent management training. Journal of Con-sulting and Clinical Psychology, 77(3), 429–438. The study is ineligible for review because it does not use a comparison group design or a single-case design.
Orrell-Valente, J., Pinderhughes, E. E., Valente, E., Jr., & Laird, R. D. (1999). If it’s offered, will they come? Influences on parents’ participation in a community-based conduct problems prevention program. American Journal of Community Psychology, 27(6), 753–783. The study is ineligible for review because it does not include a stu-dent outcome.
Fast Track October 2014 Page 10
WWC Intervention Report
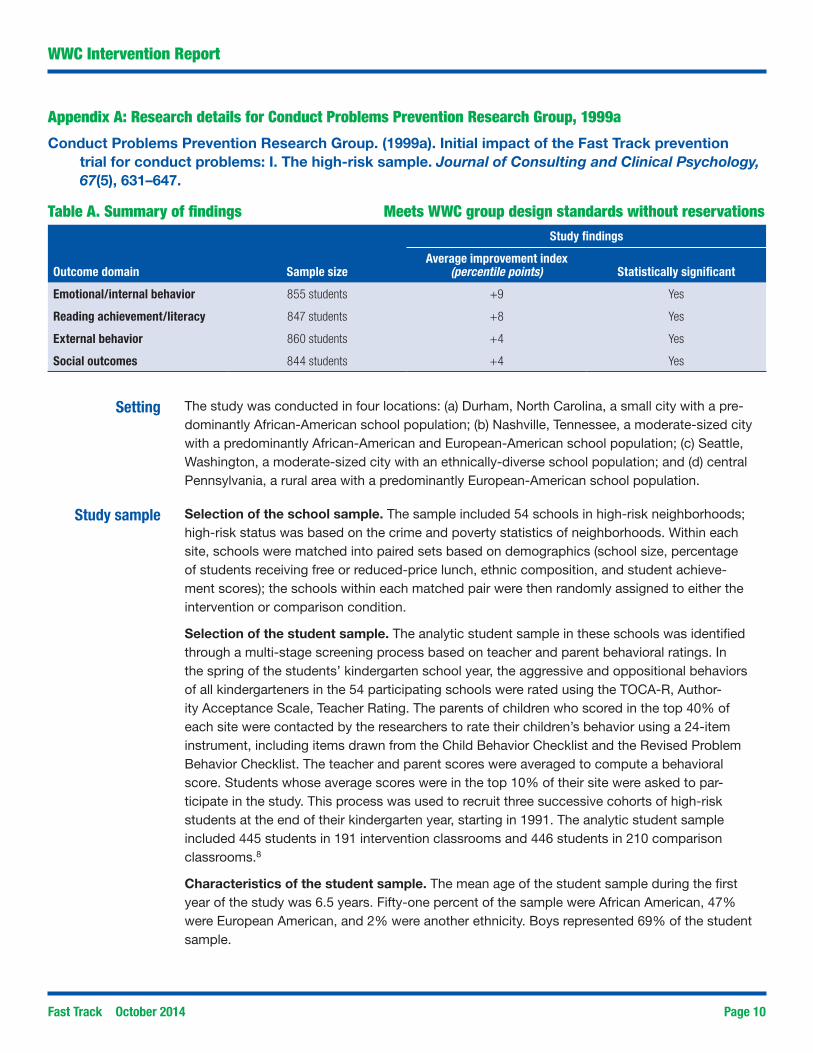
Table A. Summary of findings Meets WWC group design standards without reservationsStudy findings
Outcome domain Sample sizeAverage improvement index
(percentile points) Statistically significant
Emotional/internal behavior 855 students +9 Yes
Reading achievement/literacy 847 students +8 Yes
External behavior 860 students +4 Yes
Social outcomes 844 students +4 Yes
Setting The study was conducted in four locations: (a) Durham, North Carolina, a small city with a pre-dominantly African-American school population; (b) Nashville, Tennessee, a moderate-sized city with a predominantly African-American and European-American school population; (c) Seattle, Washington, a moderate-sized city with an ethnically-diverse school population; and (d) central Pennsylvania, a rural area with a predominantly European-American school population.
Study sample Selection of the school sample. The sample included 54 schools in high-risk neighborhoods; high-risk status was based on the crime and poverty statistics of neighborhoods. Within each site, schools were matched into paired sets based on demographics (school size, percentage of students receiving free or reduced-price lunch, ethnic composition, and student achieve-ment scores); the schools within each matched pair were then randomly assigned to either the intervention or comparison condition.
Selection of the student sample. The analytic student sample in these schools was identified through a multi-stage screening process based on teacher and parent behavioral ratings. In the spring of the students’ kindergarten school year, the aggressive and oppositional behaviors of all kindergarteners in the 54 participating schools were rated using the TOCA-R, Author-ity Acceptance Scale, Teacher Rating. The parents of children who scored in the top 40% of each site were contacted by the researchers to rate their children’s behavior using a 24-item instrument, including items drawn from the Child Behavior Checklist and the Revised Problem Behavior Checklist. The teacher and parent scores were averaged to compute a behavioral score. Students whose average scores were in the top 10% of their site were asked to par-ticipate in the study. This process was used to recruit three successive cohorts of high-risk students at the end of their kindergarten year, starting in 1991. The analytic student sample included 445 students in 191 intervention classrooms and 446 students in 210 comparison classrooms.8
Characteristics of the student sample. The mean age of the student sample during the first year of the study was 6.5 years. Fifty-one percent of the sample were African American, 47% were European American, and 2% were another ethnicity. Boys represented 69% of the student sample.
Appendix A: Research details for Conduct Problems Prevention Research Group, 1999a
Conduct Problems Prevention Research Group. (1999a). Initial impact of the Fast Track prevention trial for conduct problems: I. The high-risk sample. Journal of Consulting and Clinical Psychology, 67(5), 631–647.

Fast Track October 2014 Page 11
WWC Intervention Report
Intervention group
Program delivery in grades 1–5. During grades 1–5, the multi-component intervention included: (a) a classroom-based curriculum, (b) small-group enrichment, (c) home visits and telephone contact with parents, and (d) school-based student tutoring.
•Classroom-based curriculum. Intervention teachers delivered, on average, two to three lessons per week throughout the school year, based on an adapted version of the PATHS curriculum. The curriculum covered four domains of skills: emotional understanding and communication, friendship building, self-control, and social problem solving. These curri-cula were not delivered in the Durham, North Carolina schools because the administrators would not allow it.
•Small-group enrichment. Parents and children participated in a 2-hour enrichment program on Saturdays or weekday evenings at the school. During these sessions, the Fast Track Edu-cational Coordinators (EC) used discussion, modeling, role-playing, and cooperative activi-ties to teach emotional understanding and communication, friendship building, self-control, and social problem solving to children. Family Coordinators (FC) taught parents strategies to help support their children’s adjustment to school, strengthen parents’ self-control, develop appropriate expectations for children’s behavior, and improve interactions with their children. Parents and children then participated in cooperative activities to allow parents to practice parenting skills. During the last half hour of the program, the children worked with tutors on their reading skills while the parents observed. This tutoring session was no longer offered after the first year. The enrichment sessions were held weekly for first-grade students, for a total of 22 sessions; biweekly during second grade; and monthly during grades 3–5, for a total of nine sessions each year. Ninety-eight percent of the children attended at least one small group program. Among the children who attended the groups, the average attendance was 78%. Ninety-six percent of the parents attended at least one parent group. Among the parents who attended the groups, the average attendance was 71%.
•Home visits and telephone contact with parents. Home visits were conducted every other week, on average, and were supplemented with telephone contacts each week by the FCs. Following the first year of implementation, the frequency of the home visits varied based on the assessed level of functioning of the child and family.
•School-based student tutoring. Paraprofessional tutors used the Wallach and Wallach tutoring program to provide academic support during the school day for first- and sec-ond-grade students. Students received three 30-minute tutoring sessions a week, which consisted of two sessions focused on reading skills and one session in which students were paired with peers. During the peer-pairing sessions, students engaged in play with rotating classmates to promote the development of friendship skills in a school setting. After the first grade, the frequency of the tutoring and peer-pairing sessions varied based on the assessed level of functioning of the student and family.
Program delivery in grades 6–10. During grades 6–10, the components of the interven-tion included: (a) the middle school transition program, (b) parent and youth groups, (c) youth forums, and (d) individualized support.

Fast Track October 2014 Page 12
WWC Intervention Report
•Middle school transition program. In grade 6, students participated in monthly group ses-sions focusing on the transition to middle school, studying and organizational skills, resis-tance to drug use, and sexual development. Parents participated in four 2-hour meetings focused on developing positive relationships with teachers and counselors. Intervention staff also visited the middle school and met with the school counselor.
•Parent and youth groups. In grade 6, four 2-hour meetings were held with parents and stu-dents. Parent meetings centered on positive involvement with and monitoring of children, con-flict management, and support for academic achievement. Student meetings focused on issues such as peer pressure, refusal and resistance skills, problem-solving, and decision-making skills. Sessions attended by both parents and students focused on relationship issues, sexual education, drinking, smoking, drug use, and vocational planning.
•Youth forums. In grades 7 and 8, eight small-group youth forums were held to discuss vocational opportunities, budgeting and life skills, job interview skills, and summer employ-ment opportunities.
• Individualized support. In grades 7–10, students received monthly support, such as aca-demic tutoring, mentoring, positive peer-group involvement, and family problem solving.
Comparison group
The students in the comparison classrooms received their regular curriculum. There was no effort to encourage or discourage comparison classrooms or schools from implementing other preven-tion programs. The authors do not provide any information on whether, or what, other prevention programs may have been implemented in comparison classrooms/schools.
Outcomes and measurement
This study included measures of aggression, authority acceptance, oppositional behavior, emo-tion recognition, social skills, and reading achievement after 1 year of implementation, and after 3–9 years of implementation. The study also included measures of arrests and other offenses 2 years after the 10-year intervention program ended. For a more detailed description of these outcome measures, see Appendix B.1.
Because the most intense phase of the intervention occurs in the first year of implementa-tion, the intervention ratings in this report are based on the impacts of Fast Track after 1 year of implementation (Appendices C.1–C.4). Additional references that examined the effect of the intervention after 3 years of implementation (Appendices D.1, D.2a, D.2c, D.2d, D.3), 4 years of implementation (Appendices D.2a, D.3, D.4a), 5 years of implementation (Appendices D.2a, D.3, D.4a), 6 years of implementation (Appendices D.2a, D.2c, D.2d, D.3), 7 years of implementation (Appendices D.2a, D.3), 8 years of implementation (Appendices D.2a, D.3), 9 years of implemen-tation (Appendices D.2c, D.2d), and 2 years after the 10-year implementation ended (Appendices D.2b, D.2c, D.2d, D.4b) are also presented.
Detailed descriptions of outcome measures used to measure the impacts of Fast Track after 1 year of implementation are provided in Appendix B.1. Descriptions of measures used for the supplemental findings are provided in Appendix B.2.

Fast Track October 2014 Page 13
WWC Intervention Report
Support for implementation
The Fast Track EC and FC staff attended a 3-day workshop, observed training videos, and received instructional manuals. Intervention staff also participated in weekly meetings with program devel-opers where they discussed the goals and activities of upcoming sessions, talked about the recep-tivity of children and parents to activities, were observed by the clinical supervisor and co-principal investigators, and were given feedback on adherence to the program.
Teachers at intervention schools attended a 2.5-day training workshop. Fast Track staff also spent, on average, 1.5 hours each week in each teachers’ classroom conducting observations, modeling lessons, and team teaching. Weekly meetings were held with the intervention teachers to provide coaching and feedback on their delivery of the curriculum and classroom management and behavior issues.

Fast Track October 2014 Page 14
WWC Intervention Report
Emotional/internal behavior
Emotion Recognition Questionnaire The Emotion Recognition Questionnaire (Ribordy, Camras, Stafani, & Spacarelli, 1988)9 assesses students’ skills in identifying the emotions likely to be elicited in a variety of everyday contexts. Students were verbally presented with 16 vignettes (e.g., “It is Susie’s birthday, and she is given a party with lots of cake and fun games to play”) and asked to point to one of four pictures to indicate the feeling state of the character in each vignette (happy, sad, mad, or scared). The percentage of emotions correctly identified was computed for analyses (α = .66) (as cited in Conduct Problems Prevention Research Group, 1999a).
Interview of Emotional Experience (IEE) The IEE (Greenberg & Kusche, 1990)10 is a 22-item measure that asks students to describe the kinds of things that make them feel a certain way (i.e., happy, sad, angry, or worried), the kinds of things they do when they feel that way, and the kinds of things they do when they see others feeling that way. The IEE has been shown to have adequate validity in normative samples. Responses were coded as “prosocial/competent” or “aggressive/inept.” Responses were summed across emotional states to create a score representing the percentage of prosocial/competent responses given. Inter-rater agreement for these codes was assessed for 15% of the data (κ = .91) (as cited in Conduct Problems Prevention Research Group, 1999a).
Reading achievement/literacy
Spache Diagnostic Reading Scale (DRS) The Spache DRS (Spache, 1981)11 is a set of individually administered tests for the evaluation of oral and silent reading abilities and auditory comprehension. A subset of this measure that assessed word-attack skills (e.g., sounding out and recognizing initial and final consonants) (α = .94) was administered to the second and third cohorts (as cited in Conduct Problems Prevention Research Group, 1999a).
Woodcock-Johnson Psycho-Educational Battery–Revised, Letter-Word Identification Subtest
The Woodcock-Johnson Psycho-Educational Battery–Revised (Woodcock & Johnson, 1990)12 is a commonly used measure of students’ achievement. The 57-item Letter-Word identification subtest (α = .79) is made up of five items that measure symbolic learning, or the ability to match a pictorial representation of a word with an actual picture of the object, and 52 items that assess the child’s ability to identify letters and words. The items are arranged in order of difficulty, with the easiest items presented first and the most difficult items last. Initial analyses revealed that this test was too difficult for many of the children in the high-risk sample in cohort 1 of the Conduct Problems Prevention Research Group (1999a) study; thus, the measure failed to provide a sensitive assessment of the pre-reading and initial reading skills that developed in grade 1. Therefore, this measure was only used for cohort 1 and was replaced by the Spache DRS for cohorts 2 and 3 (as cited in Conduct Problems Prevention Research Group, 1999a).
External behavior
Child Behavior Change, Parent Rating This measure asks parents to report the amount of change they observed in their child’s behavior problems (i.e., following rules and controlling aggression) in grade 1. The nine items are rated on a 7-point scale, with response options ranging from –3 (much worse) to 3 (much better). The ratings of each item are used to compute a total score (α = .82). The measure was administered at the end of the first grade to parents in cohorts 2 and 3 (as cited in Conduct Problems Prevention Research Group, 1999a).
Child Behavior Change, Teacher Rating This measure asks teachers to report the amount of change they observed in student behavioral control and school performance in grade 1. The eight items are rated on a 7-point scale, with response options ranging from –3 (much worse) to 3 (much better). The ratings of each item are used to compute a total score (α = .94). The measure was administered at the end of the first grade to teachers in cohorts 2 and 3 (as cited in Conduct Problems Prevention Research Group, 1999a).
Child Behavior Checklist (CBCL), Externalizing Scale
The Externalizing Scale of the CBCL (Achenbach, 1991)13 asks parents to report the extent to which their children exhibited a series of oppositional, aggressive, and delinquent behaviors within the past 6 months. The 33 items are rated using a 3-point scale (as cited in Conduct Problems Prevention Research Group, 1999a).
Home Interview with Child (HIWC), Aggressive Retaliation
The Aggressive Retaliation subscale of the HIWC (Dodge et al., 1990)14 assesses students’ aggressive inten-tions. Students were presented with eight drawings and verbal vignettes describing mild and ambiguous peer provocations (e.g., being ignored, bumped, or pushed). For each incident, the student was asked about what he/she would do to the other students involved in the incident. Behavioral response intentions were coded as “aggressive” or “nonaggressive.” This measure was computed as the percentage of aggressive behavioral response intentions (e.g., intentions to threaten or harm the other students) a student expressed. Reliability for this measure was .74, and inter-rater agreement, based on 15% of the data, was .89 (as cited in Conduct Problems Prevention Research Group, 1999a).
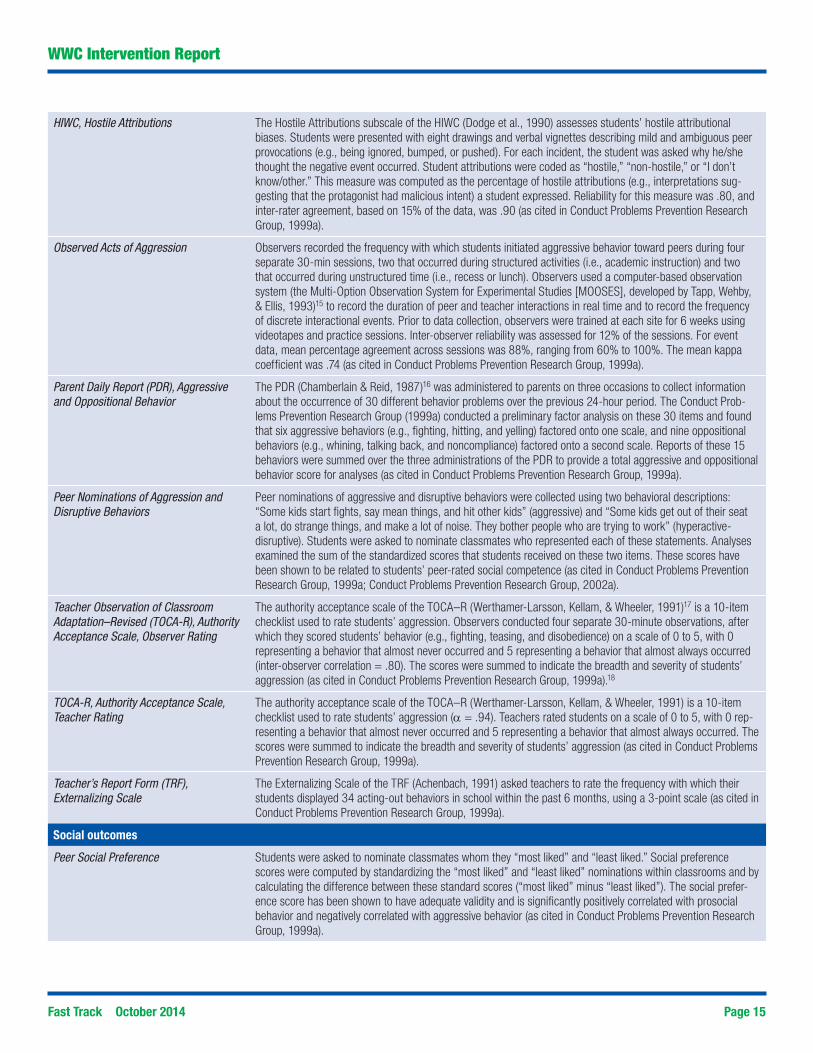
Appendix B.1: Outcome measures included in main findings for each domain
Fast Track October 2014 Page 15
WWC Intervention Report
HIWC, Hostile Attributions The Hostile Attributions subscale of the HIWC (Dodge et al., 1990) assesses students’ hostile attributional biases. Students were presented with eight drawings and verbal vignettes describing mild and ambiguous peer provocations (e.g., being ignored, bumped, or pushed). For each incident, the student was asked why he/she thought the negative event occurred. Student attributions were coded as “hostile,” “non-hostile,” or “I don’t know/other.” This measure was computed as the percentage of hostile attributions (e.g., interpretations sug-gesting that the protagonist had malicious intent) a student expressed. Reliability for this measure was .80, and inter-rater agreement, based on 15% of the data, was .90 (as cited in Conduct Problems Prevention Research Group, 1999a).
Observed Acts of Aggression Observers recorded the frequency with which students initiated aggressive behavior toward peers during four separate 30-min sessions, two that occurred during structured activities (i.e., academic instruction) and two that occurred during unstructured time (i.e., recess or lunch). Observers used a computer-based observation system (the Multi-Option Observation System for Experimental Studies [MOOSES], developed by Tapp, Wehby, & Ellis, 1993)15 to record the duration of peer and teacher interactions in real time and to record the frequency of discrete interactional events. Prior to data collection, observers were trained at each site for 6 weeks using videotapes and practice sessions. Inter-observer reliability was assessed for 12% of the sessions. For event data, mean percentage agreement across sessions was 88%, ranging from 60% to 100%. The mean kappa coefficient was .74 (as cited in Conduct Problems Prevention Research Group, 1999a).
Parent Daily Report (PDR), Aggressive and Oppositional Behavior
The PDR (Chamberlain & Reid, 1987)16 was administered to parents on three occasions to collect information about the occurrence of 30 different behavior problems over the previous 24-hour period. The Conduct Prob-lems Prevention Research Group (1999a) conducted a preliminary factor analysis on these 30 items and found that six aggressive behaviors (e.g., fighting, hitting, and yelling) factored onto one scale, and nine oppositional behaviors (e.g., whining, talking back, and noncompliance) factored onto a second scale. Reports of these 15 behaviors were summed over the three administrations of the PDR to provide a total aggressive and oppositional behavior score for analyses (as cited in Conduct Problems Prevention Research Group, 1999a).
Peer Nominations of Aggression and Disruptive Behaviors
Peer nominations of aggressive and disruptive behaviors were collected using two behavioral descriptions: “Some kids start fights, say mean things, and hit other kids” (aggressive) and “Some kids get out of their seat a lot, do strange things, and make a lot of noise. They bother people who are trying to work” (hyperactive-disruptive). Students were asked to nominate classmates who represented each of these statements. Analyses examined the sum of the standardized scores that students received on these two items. These scores have been shown to be related to students’ peer-rated social competence (as cited in Conduct Problems Prevention Research Group, 1999a; Conduct Problems Prevention Research Group, 2002a).
Teacher Observation of Classroom Adaptation–Revised (TOCA-R), Authority Acceptance Scale, Observer Rating
The authority acceptance scale of the TOCA–R (Werthamer-Larsson, Kellam, & Wheeler, 1991)17 is a 10-item checklist used to rate students’ aggression. Observers conducted four separate 30-minute observations, after which they scored students’ behavior (e.g., fighting, teasing, and disobedience) on a scale of 0 to 5, with 0 representing a behavior that almost never occurred and 5 representing a behavior that almost always occurred (inter-observer correlation = .80). The scores were summed to indicate the breadth and severity of students’ aggression (as cited in Conduct Problems Prevention Research Group, 1999a).18
TOCA-R, Authority Acceptance Scale, Teacher Rating
The authority acceptance scale of the TOCA–R (Werthamer-Larsson, Kellam, & Wheeler, 1991) is a 10-item checklist used to rate students’ aggression (α = .94). Teachers rated students on a scale of 0 to 5, with 0 rep-resenting a behavior that almost never occurred and 5 representing a behavior that almost always occurred. The scores were summed to indicate the breadth and severity of students’ aggression (as cited in Conduct Problems Prevention Research Group, 1999a).
Teacher’s Report Form (TRF), Externalizing Scale
The Externalizing Scale of the TRF (Achenbach, 1991) asked teachers to rate the frequency with which their students displayed 34 acting-out behaviors in school within the past 6 months, using a 3-point scale (as cited in Conduct Problems Prevention Research Group, 1999a).
Social outcomes
Peer Social Preference Students were asked to nominate classmates whom they “most liked” and “least liked.” Social preference scores were computed by standardizing the “most liked” and “least liked” nominations within classrooms and by calculating the difference between these standard scores (“most liked” minus “least liked”). The social prefer-ence score has been shown to have adequate validity and is significantly positively correlated with prosocial behavior and negatively correlated with aggressive behavior (as cited in Conduct Problems Prevention Research Group, 1999a).

Fast Track October 2014 Page 16
WWC Intervention Report
Peer-Nominated Prosocial Peer nominations were collected for the behavioral item “Some kids are really good to have in your class because they cooperate, help others, and share. They let other kids have a turn.” Students were asked to nominate classmates who represented these statements. Nominations were totaled and standardized within each classroom (as cited in Conduct Problems Prevention Research Group, 1999a).
Social Competence Scale, Parent Form This is a 12-item measure that includes five items describing prosocial behaviors (e.g., shares and listens) and seven items describing emotion regulation (e.g., copes well with failure, can calm down, and controls temper). Parents rated each item on a 5-point scale, and a total sum score was computed (α = .87) (as cited in Conduct Problems Prevention Research Group, 1999a).
Social Competence Scale, Teacher Form The Social Competence Scale, Teacher Form (Conduct Problems Prevention Research Group, 1995)19 is a sub-scale of the Social Health Profile (SHP). It is a 9-item instrument created for the Fast Track project that assesses a student’s ability to handle social interactions in a classroom environment. Each item contained a descriptive phrase such as “initiates interactions with others.” The teacher assessed how well each descriptor was true for a target student. Responses were coded on a 6-point scale from which a total score is computed (α = .92) (as cited in Conduct Problems Prevention Research Group, 1999a).
Social Problem-Solving The Social Problem-Solving measure (Dodge et al., 1990)20 is designed to assess students’ ability to generate appropriate solutions to common social problems. Students were presented with eight drawings and verbal vignettes depicting peer entry or peer conflict problems and were asked what the story character could do to solve the problem. Students were prompted to provide up to three different solutions to each problem. Responses were coded as “prosocial/competent” or “aggressive/inept.” The percentage of “prosocial/compe-tent” responses given by students (summed across stories) was analyzed. The “prosocial/competent” score has adequate internal consistency (α = .70) across vignettes and is significantly correlated with teacher ratings of problem behaviors. Inter-rater agreement was assessed for 15% of the data (κ = .94) (as cited in Conduct Problems Prevention Research Group, 1999a).
Time in Positive Peer Interaction Observers recorded (in real time) the percentage of time students were engaged in positive peer interaction using a computer-based observation system, the MOOSES, developed by Tapp, Wehby, & Ellis (1993). Observa-tions took place during four separate 30-min sessions, two that occurred during structured activities (i.e., aca-demic instruction) and two that occurred during unstructured time (i.e., recess or lunch). Prior to data collection, observers were trained at each site for 6 weeks using videotapes and practice sessions. Inter-observer reliability was assessed for 12% of the sessions. For event data, mean percentage agreement across sessions was 88%, ranging from 60% to 100%. The mean kappa coefficient was .74 (as cited in Conduct Problems Prevention Research Group, 1999a).

Fast Track October 2014 Page 17
WWC Intervention Report
Reading achievement/literacy
Spache Diagnostic Reading Scale (DRS) The Spache DRS (Spache, 1981)21 is a set of individually administered tests for the evaluation of oral and silent reading abilities and auditory comprehension. A subset of this measure that assessed word-attack skills (e.g., sounding out and recognizing initial and final consonants) (α = .94) was administered to the second and third cohorts (as cited in Conduct Problems Prevention Research Group, 1999a).
External behavior
Antisocial Behavior This measure is the summary score of the serious-offense items from the 34-item Self-Report of Delinquency scale, after eliminating the status-offense and minor-offense items (see description for Self-Report of Delinquency). This scale included behaviors such as stealing items valued over $100, selling heroin or LSD, attacking to hurt someone, and forcing sex upon another person. The grade 9 scale consisted of 25 items. The grade 6 administration included 20 items, after dropping five items about behaviors inappropriate for sixth-grade students, such as having sex with someone against their will. This measure was not collected in the main study; it is included in the supplemental findings from the follow-up study at the end of grades 6 and 9 (as cited in Conduct Problems Prevention Research Group, 2007).
Arrest Index, Adult This index assigns a severity score ranging from 1 to 5 to each arrest adjudicated in adult court. Level 5 includes arrests for all violent crimes, such as murder, rape, kidnapping, and first-degree arson. Level 4 contains arrests for crimes involving serious or potentially serious harm, and includes assault with weapons and first-degree burglary. Level 3 reflects arrests for medium severity crimes, such as simple assault, felonious breaking and entering, possession of controlled substances with intent to sell, and fire-setting. Level 2 includes arrests for low-severity crimes such as breaking and entering, disorderly conduct, possession of controlled substances, shoplifting, vandalism, and public intoxication. Level 1 involves arrests for status and traffic offenses. The high-est severity scores from each adult arrest from grades 6–12 are summed to yield a lifetime severity weighted frequency of adult arrests. This measure was included in the supplemental findings from the follow-up study at the end of grade 12 (as cited in Conduct Problems Prevention Research Group, 2010a).
Arrest Index, Juvenile This index assigns a severity score ranging from 1 to 5 to each arrest adjudicated in juvenile court. Level 5 includes arrests for all violent crimes, such as murder, rape, kidnapping, and first-degree arson. Level 4 contains arrests for crimes involving serious or potentially serious harm, and includes assault with weapons and first-degree burglary. Level 3 reflects arrests for medium severity crimes, such as simple assault, felonious breaking and entering, possession of controlled substances with intent to sell, and fire-setting. Level 2 includes arrests for low-severity crimes such as breaking and entering, disorderly conduct, possession of controlled sub-stances, shoplifting, vandalism, and public intoxication. Level 1 involves arrests for status and traffic offenses. The highest severity scores from each juvenile arrest from grades 6–12 are summed to yield a lifetime severity weighted frequency of juvenile arrests. This measure was included in the supplemental findings from the follow-up study at the end of grade 12 (as cited in Conduct Problems Prevention Research Group, 2010a).
Behavior Disorder Classification During Grades 1–4
Following grade 4, students were given this classification if their school records ever indicated an Individualized Education Program (IEP) classification of Severely Behaviorally Disordered, Severely Emotionally Disordered, or Behaviorally/Emotionally Handicapped during grades 1–4. Most of the students who received this classification had conduct problems, ODD, or related externalizing problems. This outcome did not include the category “Other Health Impaired” which is the classification many children with ADHD received (as cited in Bierman et al., 2013).22
Behavior Disorder Classification During Grades 7–10
Following grade 10, students were given this classification if their school records ever indicated an IEP clas-sification of Severely Behaviorally Disordered, Severely Emotionally Disordered, or Behaviorally/Emotionally Handicapped during grades 7–10. Most of the students who received this classification had conduct problems, ODD, or related externalizing problems. This outcome did not include the category “Other Health Impaired” which is the classification many children with ADHD received (as cited in Bierman et al., 2013).23
Child Behavior Change, Parent Rating This measure asks parents to report the amount of change they observed in their child’s behavior problems (i.e., following rules and controlling aggression) over the past year. The ten items are rated on a 7-point scale, with response options ranging from –3 (much worse) to 3 (much better). The ratings of each item are used to compute a total score (α = .89) (as cited in Conduct Problems Prevention Research Group, 2002a; Conduct Problems Prevention Research Group, 2002c).
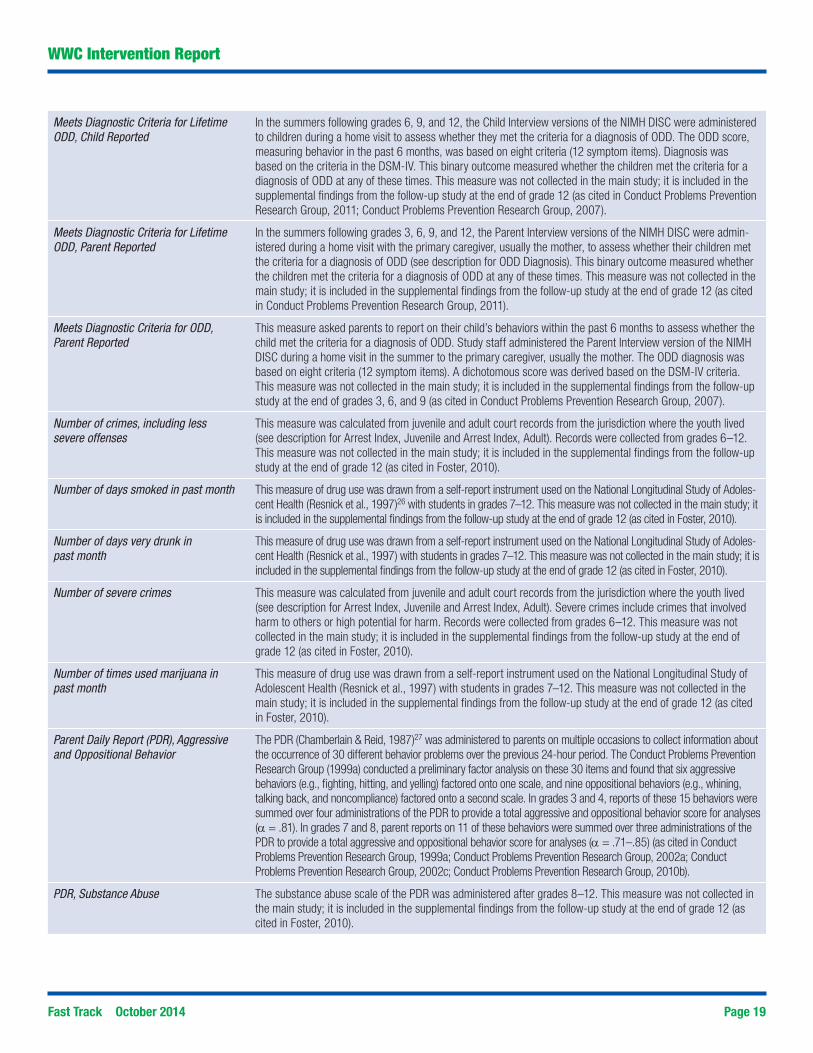
Appendix B.2: Outcome measures included in supplemental findings for each domain

Fast Track October 2014 Page 18
WWC Intervention Report
Child Behavior Change, Teacher Rating This measure asks teachers to report the amount of change they observed in student behavioral control and school performance in grade 3. The eight items are rated on a 7-point scale, with response options ranging from –3 (much worse) to 3 (much better). The ratings of each item are used to compute a total score (α = .94) (as cited in Conduct Problems Prevention Research Group, 1999a; Conduct Problems Prevention Research Group, 2002a).
Child Behavior Checklist (CBCL), Externalizing Scale
The Externalizing Scale of the CBCL (Achenbach, 1991)24 asks parents to report the extent to which their children exhibited a series of oppositional, aggressive, and delinquent behaviors within the past 6 months. The 33 items are rated using a 3-point scale (α = .89) (as cited in Conduct Problems Prevention Research Group, 1999a; Conduct Problems Prevention Research Group, 2010b).
Home and Community Problems Outcome Domain
This score combines two parent-reported measures, the Parent Daily Report (PDR) Aggressive and Oppositional score (averaged over three telephone administrations) and the Parent Ratings of Child Behavior Change, and a child self-report outcome called “Things You Have Done” (see descriptions for the PDR, Aggressive and Opposi-tional Behavior and Parent Ratings of Child Behavior Change). The “Things You Have Done” scale measured the number of times youth engaged in substance abuse (five items) and other delinquent behaviors (19 items) over the past year. Because of low reporting of delinquent behaviors, these items were dichotomized (no report vs. any report) and single-factor categorical data factor analysis generated factor scores. Due to low involvement with substance abuse, these items were converted into dichotomous variables. This measure was not collected in the main study; it is included in the supplemental findings from the follow-up studies at the end of grades 4 and 5 (as cited in Conduct Problems Prevention Research Group, 2004).
Home Interview with Child (HIWC), Hostile Attributions
The Hostile Attributions subscale of the HIWC (Dodge et al., 1990) assesses students’ hostile attributional biases. Students were presented with eight drawings and verbal vignettes describing mild and ambiguous peer provocations (e.g., being ignored, bumped, or pushed). For each incident, the student was asked why he/she thought the negative event occurred. Student attributions were coded as “hostile,” “non-hostile,” or “I don’t know/other.” This measure was computed as the percentage of hostile attributions (e.g., interpretations sug-gesting that the protagonist had malicious intent) a student expressed. Reliability for this measure was .80, and inter-rater agreement, based on 15% of the data, was .90 (as cited in Conduct Problems Prevention Research Group, 1999a; Conduct Problems Prevention Research Group, 2002a).
Meets Diagnostic Criteria for Conduct Disorder (CD), Parent Reported 25
This measure asked parents to report on their child’s behaviors within the past 12 months to assess whether the child met the criteria for a diagnosis of CD. Study staff administered the Parent Interview version of the National Institute of Mental Health (NIMH) Diagnostic Interview Schedule for Children (DISC) during a home visit in the summer to the primary caregiver, usually the mother. The CD diagnosis was based on 15 criteria (23 symptom items) taken from the Diagnostic and Statistical Manual of Mental Disorders–Fourth Edition (DSM-IV). For children in grade 3, the DSM-III-R was used. A dichotomous score was derived based on the DSM criteria. This measure was not collected in the main study; it is included in the supplemental findings from the follow-up study at the end of grades 3, 6, and 9 (as cited in Conduct Problems Prevention Research Group, 2007).
Meets Diagnostic Criteria for CD or Oppositional Defiant Disorder (ODD), Parent Reported
This measure asked parents to report on their child’s behaviors to assess whether the child met the criteria for a diagnosis of CD or ODD. Study staff administered the Parent Interview version of the NIMH DISC during a home visit in the summer to the primary caregiver, usually the mother. The CD diagnosis was based on behavior in the past 12 months and 15 criteria (23 symptom items). The ODD diagnosis was based on behavior in the past 6 months and eight criteria (12 symptom items). Diagnoses were based on the criteria in the DSM-IV. A dichotomous score was derived based on the DSM criteria. This measure was not collected in the main study; it is included in the supplemental findings from the follow-up study at the end of grade 3 (as cited in Conduct Problems Prevention Research Group, 2002a).
Meets Diagnostic Criteria for Lifetime CD, Child Reported
In the summers following grades 6, 9, and 12, the Child Interview versions of the NIMH DISC were administered to students during a home visit to assess whether they met the criteria for a diagnosis of CD. The CD diagnosis was based on behavior in the past 12 months and 15 criteria (23 symptom items). Diagnosis was based on the criteria in the DSM-IV. This binary outcome measured whether the students met the criteria for a diagnosis of CD at any of these times. This measure was not collected in the main study; it is included in the supplemental findings from the follow-up study at the end of grade 12 (as cited in Conduct Problems Prevention Research Group, 2011; Conduct Problems Prevention Research Group, 2007)
Meets Diagnostic Criteria for Lifetime CD, Parent Reported
In the summers following grades 3, 6, 9, and 12, the Parent Interview versions of the NIMH DISC were admin-istered during a home visit with the primary caregiver, usually the mother, to assess whether their children met the criteria for a diagnosis of CD (see description for CD Diagnosis). This binary outcome measured whether the children met the criteria for a diagnosis of CD at any of these times. This measure was not collected in the main study; it is included in the supplemental findings from the follow-up study at the end of grade 12 (as cited in Conduct Problems Prevention Research Group, 2011).
Fast Track October 2014 Page 19
WWC Intervention Report
Meets Diagnostic Criteria for Lifetime ODD, Child Reported
In the summers following grades 6, 9, and 12, the Child Interview versions of the NIMH DISC were administered to children during a home visit to assess whether they met the criteria for a diagnosis of ODD. The ODD score, measuring behavior in the past 6 months, was based on eight criteria (12 symptom items). Diagnosis was based on the criteria in the DSM-IV. This binary outcome measured whether the children met the criteria for a diagnosis of ODD at any of these times. This measure was not collected in the main study; it is included in the supplemental findings from the follow-up study at the end of grade 12 (as cited in Conduct Problems Prevention Research Group, 2011; Conduct Problems Prevention Research Group, 2007).
Meets Diagnostic Criteria for Lifetime ODD, Parent Reported
In the summers following grades 3, 6, 9, and 12, the Parent Interview versions of the NIMH DISC were admin-istered during a home visit with the primary caregiver, usually the mother, to assess whether their children met the criteria for a diagnosis of ODD (see description for ODD Diagnosis). This binary outcome measured whether the children met the criteria for a diagnosis of ODD at any of these times. This measure was not collected in the main study; it is included in the supplemental findings from the follow-up study at the end of grade 12 (as cited in Conduct Problems Prevention Research Group, 2011).
Meets Diagnostic Criteria for ODD, Parent Reported
This measure asked parents to report on their child’s behaviors within the past 6 months to assess whether the child met the criteria for a diagnosis of ODD. Study staff administered the Parent Interview version of the NIMH DISC during a home visit in the summer to the primary caregiver, usually the mother. The ODD diagnosis was based on eight criteria (12 symptom items). A dichotomous score was derived based on the DSM-IV criteria. This measure was not collected in the main study; it is included in the supplemental findings from the follow-up study at the end of grades 3, 6, and 9 (as cited in Conduct Problems Prevention Research Group, 2007).
Number of crimes, including less severe offenses
This measure was calculated from juvenile and adult court records from the jurisdiction where the youth lived (see description for Arrest Index, Juvenile and Arrest Index, Adult). Records were collected from grades 6–12. This measure was not collected in the main study; it is included in the supplemental findings from the follow-up study at the end of grade 12 (as cited in Foster, 2010).
Number of days smoked in past month This measure of drug use was drawn from a self-report instrument used on the National Longitudinal Study of Adoles-cent Health (Resnick et al., 1997)26 with students in grades 7–12. This measure was not collected in the main study; it is included in the supplemental findings from the follow-up study at the end of grade 12 (as cited in Foster, 2010).
Number of days very drunk in past month
This measure of drug use was drawn from a self-report instrument used on the National Longitudinal Study of Adoles-cent Health (Resnick et al., 1997) with students in grades 7–12. This measure was not collected in the main study; it is included in the supplemental findings from the follow-up study at the end of grade 12 (as cited in Foster, 2010).
Number of severe crimes This measure was calculated from juvenile and adult court records from the jurisdiction where the youth lived (see description for Arrest Index, Juvenile and Arrest Index, Adult). Severe crimes include crimes that involved harm to others or high potential for harm. Records were collected from grades 6–12. This measure was not collected in the main study; it is included in the supplemental findings from the follow-up study at the end of grade 12 (as cited in Foster, 2010).
Number of times used marijuana in past month
This measure of drug use was drawn from a self-report instrument used on the National Longitudinal Study of Adolescent Health (Resnick et al., 1997) with students in grades 7–12. This measure was not collected in the main study; it is included in the supplemental findings from the follow-up study at the end of grade 12 (as cited in Foster, 2010).
Parent Daily Report (PDR), Aggressive and Oppositional Behavior
The PDR (Chamberlain & Reid, 1987)27 was administered to parents on multiple occasions to collect information about the occurrence of 30 different behavior problems over the previous 24-hour period. The Conduct Problems Prevention Research Group (1999a) conducted a preliminary factor analysis on these 30 items and found that six aggressive behaviors (e.g., fighting, hitting, and yelling) factored onto one scale, and nine oppositional behaviors (e.g., whining, talking back, and noncompliance) factored onto a second scale. In grades 3 and 4, reports of these 15 behaviors were summed over four administrations of the PDR to provide a total aggressive and oppositional behavior score for analyses (α = .81). In grades 7 and 8, parent reports on 11 of these behaviors were summed over three administrations of the PDR to provide a total aggressive and oppositional behavior score for analyses (α = .71–.85) (as cited in Conduct Problems Prevention Research Group, 1999a; Conduct Problems Prevention Research Group, 2002a; Conduct Problems Prevention Research Group, 2002c; Conduct Problems Prevention Research Group, 2010b).
PDR, Substance Abuse The substance abuse scale of the PDR was administered after grades 8–12. This measure was not collected in the main study; it is included in the supplemental findings from the follow-up study at the end of grade 12 (as cited in Foster, 2010).

Fast Track October 2014 Page 20
WWC Intervention Report
Peer Nominations of Aggression and Disruptive Behaviors
Peer nominations of aggressive and disruptive behaviors were collected using two behavioral descriptions: “Some kids start fights, say mean things, and hit other kids” (aggressive) and “Some kids get out of their seat a lot, do strange things, and make a lot of noise. They bother people who are trying to work” (hyperactive-disruptive). Students were asked to nominate classmates who represented each of these statements. Analyses examined the sum of the standardized scores that students received on these two items. These scores have been shown to be related to students’ peer-rated social competence (as cited in Conduct Problems Prevention Research Group, 1999a; Conduct Problems Prevention Research Group, 2002a).
Self-Report of Delinquency The Self-Report of Delinquency measure (Elliott et al., 1985)28 asks participants to describe their delinquent activities, spanning the areas of property damage, theft, assault, and substance use. For each of 34 different offenses, the participant is asked whether he/she ever committed it, how many times in the past year, if others were involved, and if he/she was under the influence of alcohol or drugs while committing it. Offenses range from lying about one’s age in order to obtain something to attacking someone with intent to hurt. The measure was administered from grades 7–12 (in Conduct Problems Prevention Research Group, 2010a) and in grades 7 and 8 (in Conduct Problems Prevention Research Group, 2010b) and captured the number of times in the past year the respondent committed 34 different offenses. The items in each grade were capped at three to avoid creating an extremely skewed distribution. To create an annual scale capturing both frequency and severity of delinquency, each item was multiplied by a weight capturing the severity of the crime, and the 34 weighted items were summed. The final outcome measure sums the products for all items across measured grades. This measure was not collected in the main study; it is included in the supplemental findings from follow-up studies at the end of grades 7, 8, and 12 (as cited in Conduct Problems Prevention Research Group, 2010a; Conduct Problems Prevention Research Group, 2010b).
Teacher Observation of Classroom Adaptation–Revised (TOCA-R), Authority Acceptance Scale, Teacher Rating
The authority acceptance scale of the TOCA–R (Werthamer-Larsson, Kellam, & Wheeler, 1991) is a 10-item checklist used to rate students’ aggression (α = .94). Teachers rated students on a scale of 0 to 5, with 0 rep-resenting a behavior that almost never occurred and 5 representing a behavior that almost always occurred. The scores were summed to indicate the breadth and severity of students’ aggression (as cited in Conduct Problems Prevention Research Group, 1999a; Conduct Problems Prevention Research Group, 2002a).
Teacher’s Report Form (TRF), Externalizing Scale
The Externalizing Scale of the TRF (Achenbach, 1991) asked teachers to rate the frequency with which their students displayed 34 acting-out behaviors in school within the past 6 months, using a 3-point scale (α = .96) (as cited in Conduct Problems Prevention Research Group, 1999a; Conduct Problems Prevention Research Group, 2002a; Conduct Problems Prevention Research Group, 2010b).
Social behavior
Adult Relations This outcome was measured by a single item on a 5-point response scale from the Teacher Ratings of Student Adjustment (TRSA), created for the Fast Track project. Teachers completed the TRSA at end of the school year. Within each year, multiple teacher ratings, up to five per student, were collected for 60% to 85% of the students, and were averaged to compute a score for the student. The intraclass coefficient was 0.36. This measure was not collected in the main study; it is included in the supplemental findings from the follow up study at the end of grades 6, 7, and 8 (as cited in Conduct Problems Prevention Research Group, 2010b).
Child Prosocial Behavior Change, Social Competence, Teacher Rating
The Social Competence subscale of the Child Prosocial Behavior Change measure assesses change in prosocial competence. It includes eight items that are rated on a 7-point scale (α = .94). This measure was not collected in the main study; it is included in the supplemental findings from the follow-up study at the end of grade 4 (as cited in Conduct Problems Prevention Research Group, 2002c).
Peer Social Preference Students were asked to nominate classmates whom they “most liked” and “least liked.” Social preference scores were computed by standardizing the “most liked” and “least liked” nominations within classrooms and by calculat-ing the difference between these standard scores (“most liked” minus “least liked”). The social preference score has been shown to have adequate validity and is significantly positively correlated with prosocial behavior and negatively correlated with aggressive behavior (as cited in Conduct Problems Prevention Research Group, 1999a; Conduct Problems Prevention Research Group, 2002a; Conduct Problems Prevention Research Group, 2002c).
Peer-Nominated Prosocial Peer nominations were collected for the behavioral item “Some kids are really good to have in your class because they cooperate, help others, and share. They let other kids have a turn.” Students were asked to nomi-nate classmates who represented these statements. Nominations were totaled and standardized within each classroom (as cited in Conduct Problems Prevention Research Group, 1999a; Conduct Problems Prevention Research Group, 2002a).
Fast Track October 2014 Page 21
WWC Intervention Report
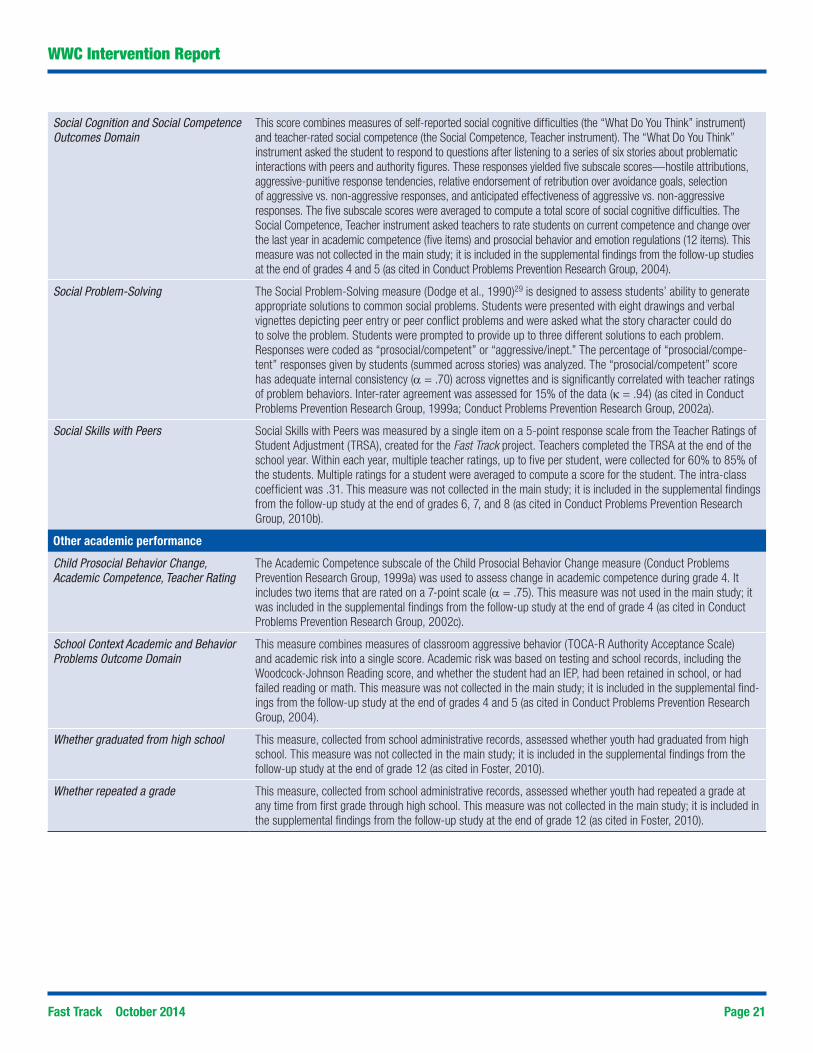
Social Cognition and Social Competence Outcomes Domain
This score combines measures of self-reported social cognitive difficulties (the “What Do You Think” instrument) and teacher-rated social competence (the Social Competence, Teacher instrument). The “What Do You Think” instrument asked the student to respond to questions after listening to a series of six stories about problematic interactions with peers and authority figures. These responses yielded five subscale scores—hostile attributions, aggressive-punitive response tendencies, relative endorsement of retribution over avoidance goals, selection of aggressive vs. non-aggressive responses, and anticipated effectiveness of aggressive vs. non-aggressive responses. The five subscale scores were averaged to compute a total score of social cognitive difficulties. The Social Competence, Teacher instrument asked teachers to rate students on current competence and change over the last year in academic competence (five items) and prosocial behavior and emotion regulations (12 items). This measure was not collected in the main study; it is included in the supplemental findings from the follow-up studies at the end of grades 4 and 5 (as cited in Conduct Problems Prevention Research Group, 2004).
Social Problem-Solving The Social Problem-Solving measure (Dodge et al., 1990)29 is designed to assess students’ ability to generate appropriate solutions to common social problems. Students were presented with eight drawings and verbal vignettes depicting peer entry or peer conflict problems and were asked what the story character could do to solve the problem. Students were prompted to provide up to three different solutions to each problem. Responses were coded as “prosocial/competent” or “aggressive/inept.” The percentage of “prosocial/compe-tent” responses given by students (summed across stories) was analyzed. The “prosocial/competent” score has adequate internal consistency (α = .70) across vignettes and is significantly correlated with teacher ratings of problem behaviors. Inter-rater agreement was assessed for 15% of the data (κ = .94) (as cited in Conduct Problems Prevention Research Group, 1999a; Conduct Problems Prevention Research Group, 2002a).
Social Skills with Peers Social Skills with Peers was measured by a single item on a 5-point response scale from the Teacher Ratings of Student Adjustment (TRSA), created for the Fast Track project. Teachers completed the TRSA at the end of the school year. Within each year, multiple teacher ratings, up to five per student, were collected for 60% to 85% of the students. Multiple ratings for a student were averaged to compute a score for the student. The intra-class coefficient was .31. This measure was not collected in the main study; it is included in the supplemental findings from the follow-up study at the end of grades 6, 7, and 8 (as cited in Conduct Problems Prevention Research Group, 2010b).
Other academic performance
Child Prosocial Behavior Change, Academic Competence, Teacher Rating
The Academic Competence subscale of the Child Prosocial Behavior Change measure (Conduct Problems Prevention Research Group, 1999a) was used to assess change in academic competence during grade 4. It includes two items that are rated on a 7-point scale (α = .75). This measure was not used in the main study; it was included in the supplemental findings from the follow-up study at the end of grade 4 (as cited in Conduct Problems Prevention Research Group, 2002c).
School Context Academic and Behavior Problems Outcome Domain
This measure combines measures of classroom aggressive behavior (TOCA-R Authority Acceptance Scale) and academic risk into a single score. Academic risk was based on testing and school records, including the Woodcock-Johnson Reading score, and whether the student had an IEP, had been retained in school, or had failed reading or math. This measure was not collected in the main study; it is included in the supplemental find-ings from the follow-up study at the end of grades 4 and 5 (as cited in Conduct Problems Prevention Research Group, 2004).
Whether graduated from high school This measure, collected from school administrative records, assessed whether youth had graduated from high school. This measure was not collected in the main study; it is included in the supplemental findings from the follow-up study at the end of grade 12 (as cited in Foster, 2010).
Whether repeated a grade This measure, collected from school administrative records, assessed whether youth had repeated a grade at any time from first grade through high school. This measure was not collected in the main study; it is included in the supplemental findings from the follow-up study at the end of grade 12 (as cited in Foster, 2010).

Fast Track October 2014 Page 22
WWC Intervention Report
Table Notes: For mean difference, effect size, and improvement index values reported in the table, a positive number favors the intervention group and a negative number favors the comparison group. The effect size is a standardized measure of the effect of an intervention on student outcomes, representing the average change expected for all students who are given the intervention (measured in standard deviations of the outcome measure). The improvement index is an alternate presentation of the effect size, reflecting the change in an average student’s percentile rank that can be expected if the student is given the intervention. The WWC-computed average effect size is a simple average rounded to two decimal places; the average improvement index is calculated from the average effect size. The statistical significance of the study’s domain average was determined by the WWC. na = not applicable.a For Conduct Problems Prevention Research Group (1999a), a correction for multiple comparisons was needed but did not affect whether any of the contrasts were found to be sta-tistically significant. No corrections for clustering were needed. The p-values presented here were reported in the original study. The WWC calculated the program group mean using a difference-in-differences approach (see WWC Handbook) by adding the impact of the program (i.e., difference in mean gains between the intervention and comparison groups) to the unadjusted comparison group posttest means. Please see the WWC Procedures and Standards Handbook (version 2.1) for more information. The authors reported effect sizes that are based on calculations or metrics that are not consistent with WWC practice; therefore, the author-reported effect sizes are not presented in this report. This study is characterized as having a statistically significant positive effect because the effect for at least one measure within the domain is positive and statistically significant, and no effects are negative and statistically significant, accounting for multiple comparisons. For more information, please refer to the WWC Standards and Procedures Handbook (version 2.1), p. 96.
Mean
(standard deviation) WWC calculations
Outcome measureStudy
sampleSample
sizeIntervention
groupComparison
groupMean
differenceEffect size
Improvement index p-value
Conduct Problems Prevention Research Group, 1999aa
Emotion Recognition Questionnaire
Grade 1 54 schools/827 students
12.79(2.17)
12.14(2.46)
0.65 0.28 +11 < .01
Interview of Emotional Experience (IEE)
Grade 1 54 schools/855 students
1.18(0.65)
1.06(0.65)
0.12 0.18 +7 .02
Domain average for emotional/internal behavior(Conduct Problems Prevention Research Group, 1999a)
0.23 +9 Statistically significant
Domain average for emotional/internal behavior across all studies 0.23 +9 na
Appendix C.1: Findings included in the rating for the emotional/internal behavior domain

Fast Track October 2014 Page 23
WWC Intervention Report
Appendix C.2: Findings included in the rating for the reading achievement/literacy domain
Mean
(standard deviation) WWC calculations
Outcome measureStudy
sampleSample
sizeIntervention
groupComparison
groupMean
differenceEffect size
Improvement index p-value
Conduct Problems Prevention Research Group, 1999aa
Spache Diagnostic Reading Scale (DRS)
Grade 1 54 schools/551 students
0.15(0.73)
–0.15(0.99)
0.30 0.34 +13 < .01
Woodcock-Johnson Psycho-Educational Battery–Revised, Letter-Word Identification Subtest
Grade 1 54 schools/296 students
22.59(6.35)
22.11(6.47)
0.48 0.07 +3 .44
Domain average for reading achievement/literacy(Conduct Problems Prevention Research Group, 1999a)
0.21 +8 Statistically significant
Domain average for reading achievement/literacy across all studies 0.21 +8 na
Table Notes: For mean difference, effect size, and improvement index values reported in the table, a positive number favors the intervention group and a negative number favors the comparison group. The effect size is a standardized measure of the effect of an intervention on student outcomes, representing the average change expected for all students who are given the intervention (measured in standard deviations of the outcome measure). The improvement index is an alternate presentation of the effect size, reflecting the change in an average student’s percentile rank that can be expected if the student is given the intervention. The WWC-computed average effect size is a simple average rounded to two decimal places; the average improvement index is calculated from the average effect size. The statistical significance of the study’s domain average was determined by the WWC. na = not applicable.a For Conduct Problems Prevention Research Group (1999a), a correction for multiple comparisons was needed but did not affect whether any of the contrasts were found to be sta-tistically significant. No corrections for clustering were needed. The p-values presented here were reported in the original study. The WWC calculated the program group mean using a difference-in-differences approach (see WWC Handbook) by adding the impact of the program (i.e., difference in mean gains between the intervention and comparison groups) to the unadjusted comparison group posttest means. Please see the WWC Procedures and Standards Handbook (version 2.1) for more information. The authors reported effect sizes that are based on calculations or metrics that are not consistent with WWC practice; therefore, the author-reported effect sizes are not presented in this report. The Spache DRS was adminis-tered at the end of the first grade to students in cohorts 2 and 3; this measure was not used with cohort 1.The Woodcock-Johnson Psycho-Educational Battery–Revised, Letter-Word Identification Subtest was administered at the end of the first grade to students in cohort 1; this measure was not used with cohorts 2 and 3. This study is characterized as having a statistically significant positive effect because the effect for at least one measure within the domain is positive and statistically significant, and no effects are negative and statistically significant, accounting for multiple comparisons. For more information, please refer to the WWC Standards and Procedures Handbook, (version 2.1), p. 96.

Fast Track October 2014 Page 24
WWC Intervention Report
Appendix C.3: Findings included in the rating for the external behavior domain
Mean
(standard deviation) WWC calculations
Outcome measureStudy
sampleSample
sizeIntervention
groupComparison
groupMean
differenceEffect size
Improvement index p-value
Conduct Problems Prevention Research Group, 1999aa
Child Behavior Change, Parent Rating
Grade 1 54 schools/553 students
1.62(0.73)
1.37(0.80)
0.25 0.33 +13 < .01
Child Behavior Change, Teacher Rating
Grade 1 54 schools/552 students
1.33(0.85)
1.00(1.00)
0.33 0.36 +14 < .01
Child Behavior Checklist (CBCL), Externalizing Scaleb
Grade 1 54 schools/854 students
62.35(9.25)
62.76(9.39)
0.41 0.04 +2 .62
Home Interview with Child (HIWC), Aggressive Retaliationb
Grade 1 54 schools/847 students
0.30(0.26)
0.35(0.27)
0.05 0.19 +7 .04
HIWC, Hostile Attributionsb Grade 1 54 schools/ 847 students
0.66(0.24)
0.67(0.25)
0.01 0.04 +2 .64
Observed Acts of Aggressionb Grade 1 54 schools/843 students
0.10(0.14)
0.09(0.11)
–0.01 –0.08 –3 .31
Parent Daily Report (PDR), Aggressive and Oppositional Behaviorb
Grade 1 54 schools/846 students
0.50(0.16)
0.51(0.16)
0.01 0.06 +2 .11
Peer Nominations of Aggression and Disruptive Behaviorsb
Grade 1 54 schools/809 students
0.79(1.28)
0.66(1.25)
–0.13 –0.10 –4 .38
Teacher Observation of Classroom Adaptation–Revised (TOCA-R), Authority Acceptance Scale, Observer Ratingb
Grade 1 54 schools/843 students
0.50(0.51)
0.62(0.64)
0.12 0.21 +8 < .01
TOCA-R, Authority Acceptance Scale, Teacher Ratingb
Grade 1 54 schools/860 students
1.95(1.12)
1.92(1.16)
–0.03 –0.03 –1 .85
Teacher’s Report Form (TRF), Externalizing Scaleb
Grade 1 54 schools/750 students
64.53(11.07)
64.55(10.76)
0.02 0.00 0 .83
Domain average for external behavior(Conduct Problems Prevention Research Group, 1999a)
0.09 +4 Statistically significant
Domain average for external behavior across all studies 0.09 +4 na
Table Notes: For mean difference, effect size, and improvement index values reported in the table, a positive number favors the intervention group and a negative number favors the com-parison group. The effect size is a standardized measure of the effect of an intervention on student outcomes, representing the average change expected for all students who are given the intervention (measured in standard deviations of the outcome measure). The improvement index is an alternate presentation of the effect size, reflecting the change in an average student’s percentile rank that can be expected if the student is given the intervention. The WWC-computed average effect size is a simple average rounded to two decimal places; the average improvement index is calculated from the average effect size. The statistical significance of the study’s domain average was determined by the WWC. na = not applicable.a For Conduct Problems Prevention Research Group (1999a), the p-values presented here were reported in the original study. A correction for multiple comparisons was needed and resulted in a WWC-computed critical p-value of .02 for HIWC, Aggressive Retaliation; therefore, the WWC does not find the result to be statistically significant. No corrections for clustering were needed. The WWC calculated the program group mean using a difference-in-differences approach where pretest data were available (see WWC Handbook) by adding the impact of the program (i.e., difference in mean gains between the intervention and comparison groups) to the unadjusted comparison group posttest means. Please see the WWC Procedures and Standards Handbook, (version 2.1) for more information. The authors reported effect sizes that are based on calculations or metrics that are not consistent with WWC practice; therefore, the author-reported effect sizes are not presented in this report. The Child Behavior Change, Parent Rating and Child Behavior Change, Teacher Rating were admin-istered at the end of the first grade to parents and teachers in cohorts 2 and 3; this measure was not used with cohort 1. This study is characterized as having a statistically significant positive effect because the effect for at least one measure within the domain is positive and statistically significant, and no effects are negative and statistically significant, accounting for multiple comparisons. For more information, please refer to the WWC Standards and Procedures Handbook (version 2.1), p. 96.b This outcome measures a negative behavior; thus, signs were reversed on the mean difference, effect size, and improvement index to demonstrate that the intervention group was favored when negative differences were reported and not favored when positive differences were reported.
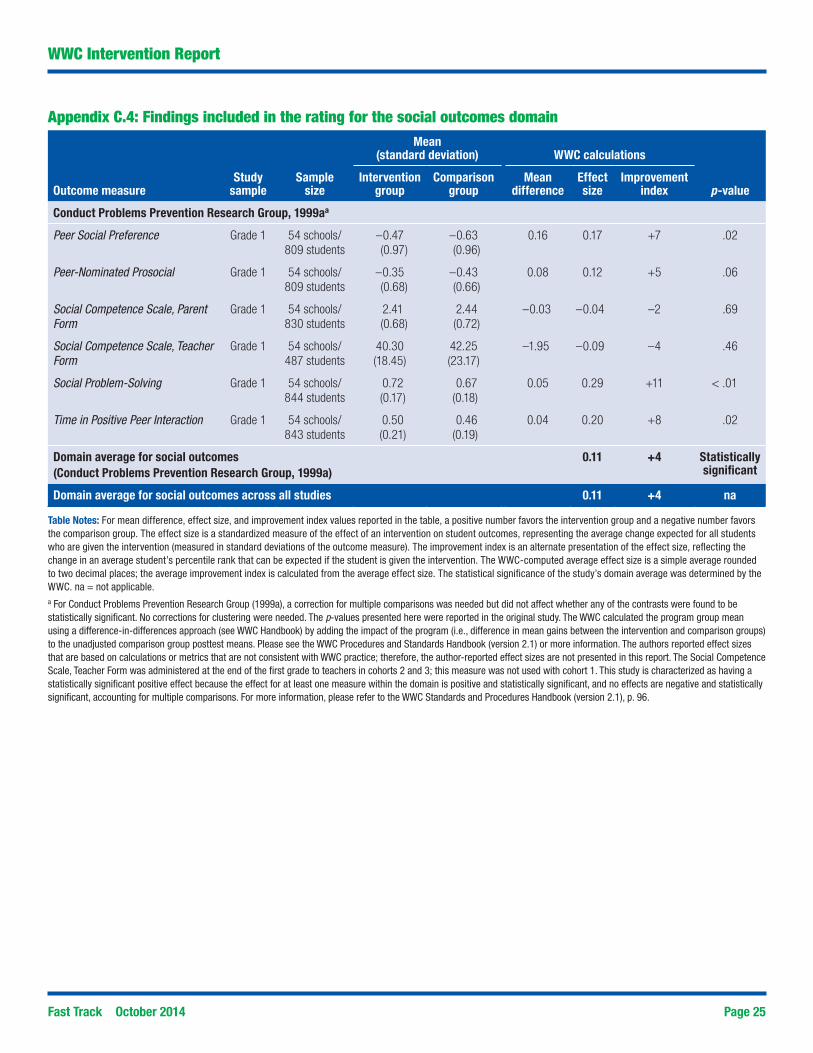
Fast Track October 2014 Page 25
WWC Intervention Report
Appendix C.4: Findings included in the rating for the social outcomes domain
Table Notes: For mean difference, effect size, and improvement index values reported in the table, a positive number favors the intervention group and a negative number favors the comparison group. The effect size is a standardized measure of the effect of an intervention on student outcomes, representing the average change expected for all students who are given the intervention (measured in standard deviations of the outcome measure). The improvement index is an alternate presentation of the effect size, reflecting the change in an average student’s percentile rank that can be expected if the student is given the intervention. The WWC-computed average effect size is a simple average rounded to two decimal places; the average improvement index is calculated from the average effect size. The statistical significance of the study’s domain average was determined by the WWC. na = not applicable.a For Conduct Problems Prevention Research Group (1999a), a correction for multiple comparisons was needed but did not affect whether any of the contrasts were found to be statistically significant. No corrections for clustering were needed. The p-values presented here were reported in the original study. The WWC calculated the program group mean using a difference-in-differences approach (see WWC Handbook) by adding the impact of the program (i.e., difference in mean gains between the intervention and comparison groups) to the unadjusted comparison group posttest means. Please see the WWC Procedures and Standards Handbook (version 2.1) or more information. The authors reported effect sizes that are based on calculations or metrics that are not consistent with WWC practice; therefore, the author-reported effect sizes are not presented in this report. The Social Competence Scale, Teacher Form was administered at the end of the first grade to teachers in cohorts 2 and 3; this measure was not used with cohort 1. This study is characterized as having a statistically significant positive effect because the effect for at least one measure within the domain is positive and statistically significant, and no effects are negative and statistically significant, accounting for multiple comparisons. For more information, please refer to the WWC Standards and Procedures Handbook (version 2.1), p. 96.
Mean
(standard deviation) WWC calculations
Outcome measureStudy
sampleSample
sizeIntervention
groupComparison
groupMean
differenceEffect size
Improvement index p-value
Conduct Problems Prevention Research Group, 1999aa
Peer Social Preference Grade 1 54 schools/809 students
–0.47 (0.97)
–0.63 (0.96)
0.16 0.17 +7 .02
Peer-Nominated Prosocial Grade 1 54 schools/809 students
–0.35(0.68)
–0.43 (0.66)
0.08 0.12 +5 .06
Social Competence Scale, Parent Form
Grade 1 54 schools/830 students
2.41 (0.68)
2.44 (0.72)
–0.03 –0.04 –2 .69
Social Competence Scale, Teacher Form
Grade 1 54 schools/487 students
40.30(18.45)
42.25(23.17)
–1.95 –0.09 –4 .46
Social Problem-Solving Grade 1 54 schools/844 students
0.72 (0.17)
0.67 (0.18)
0.05 0.29 +11 < .01
Time in Positive Peer Interaction Grade 1 54 schools/843 students
0.50 (0.21)
0.46 (0.19)
0.04 0.20 +8 .02
Domain average for social outcomes(Conduct Problems Prevention Research Group, 1999a)
0.11 +4 Statistically significant
Domain average for social outcomes across all studies 0.11 +4 na

Fast Track October 2014 Page 26
WWC Intervention Report
Appendix D.1: Description of supplemental findings during later intervention years (grade 3) for the reading achievement/literacy domain
Table Notes: The supplemental findings presented in this table are additional findings from studies in this report that do not factor into the determination of the intervention rating. For mean difference, effect size, and improvement index values reported in the table, a positive number favors the intervention group and a negative number favors the comparison group. The effect size is a standardized measure of the effect of an intervention on student outcomes, representing the average change expected for all students who are given the intervention (measured in standard deviations of the outcome measure). The improvement index is an alternate presentation of the effect size, reflecting the change in an average student’s percentile rank that can be expected if the student is given the intervention. nr = not reported.a Conduct Problems Prevention Research Group (2002a) reported study findings after 3 years of implementation, at the end of grade 3. No corrections for clustering or multiple comparisons and no difference-in-differences adjustment were needed. The p-value presented here was reported in the original study. The standard deviations for the outcome were not reported. The authors reported effect sizes that are based on calculations or metrics that are not consistent with WWC practice; therefore, the author-reported effect sizes are not presented in this report. The study used imputation methods that are consistent with the WWC guidance.
Mean
(standard deviation) WWC calculations
Outcome measureStudy
sampleSample
sizeIntervention
groupComparison
groupMean
differenceEffect size
Improvement index p-value
Conduct Problems Prevention Research Group, 2002aa
Spache Diagnostic Reading Scale (DRS)
Grade 3 54 schools/891 students
0.03(nr)
–0.02(nr)
0.05 nr nr > .05

Fast Track October 2014 Page 27
WWC Intervention Report
Appendix D.2a: Description of supplemental findings during later intervention years (grades 3–10) for the external behavior domain
Mean
(standard deviation) WWC calculations
Outcome measureStudy
sampleSample
sizeIntervention
groupComparison
groupMean
differenceEffect size
Improvement index p-value
Bierman et al., 2013a
Behavior Disorder Classification During Grades 1–4b
Grade 4 54 schools/ 891 students
0.10(na)
0.07(na)
–0.03 –0.07 –3 > .05
Behavior Disorder Classification During Grades 7–10b
Grade 10 54 schools/ 891 students
0.17(na)
0.16(na)
–0.01 –0.02 –1 > .05
Conduct Problems Prevention Research Group, 2002ac
Child Behavior Change, Parent Rating
Grade 3 54 schools/ 891 students
1.27(nr)
1.09(nr)
0.18 nr nr .01
Child Behavior Change, Teacher Rating
Grade 3 54 schools/ 891 students
1.11 (nr)
0.87 (nr)
0.24 nr nr < .01
Home Interview with Child (HIWC), Hostile Attributionsb
Grade 3 54 schools/ 891 students
0.61(nr)
0.64(nr)
0.03 nr nr .06
Meets Diagnostic Criteria for Conduct Disorder (CD) or Oppositional Defiant Disorder (ODD), Parent Reportedb
Grade 3 54 schools/ 891 students
0.17(nr)
0.15(na)
–0.02 nr nr > .05
Parent Daily Report (PDR), Aggressive and Oppositional Behaviorb
Grade 3 54 schools/ 891 students
0.20(nr)
0.22(nr)
0.02 nr nr .05
Peer Nominations of Aggression and Disruptive Behaviorsb
Grade 3 54 schools/ 891 students
0.77(nr)
0.63(nr)
–0.14 nr nr > .05
Teacher Observation of Classroom Adaptation–Revised (TOCA-R), Authority Acceptance Scale, Teacher Ratingb
Grade 3 54 schools/ 891 students
1.70(nr)
1.88(nr)
0.18 nr nr .01
Teacher’s Report Form (TRF), Externalizing Scaleb
Grade 3 54 schools/ 891 students
62.65(nr)
62.70(nr)
0.05 nr nr > .05
Conduct Problems Prevention Research Group, 2002cd
PDR, Aggressive and Oppositional Behavior
Grade 4 54 schools/ 891 students
nr nr 0.03 nr nr < .02
Conduct Problems Prevention Research Group, 2004e
Home and Community Problems Outcome Domainb
Grade 4 and 5
54 schools/ 891 students
0.22 0.29 0.07 0.22 +9 < .01
Conduct Problems Prevention Research Group, 2010bf
TRF, Externalizing Scaleb Grade 6 54 schools/ 891 students
20.82 (nr)
20.98 (nr)
0.16 nr nr .68
TRF, Externalizing Scaleb Grade 7 54 schools/ 891 students
18.94 (nr)
19.55 (nr)
0.61 nr nr .76
Child Behavior Checklist (CBCL), Externalizing Scaleb
Grade 7 54 schools/ 891 students
14.80(nr)
14.40(nr)
–0.40 nr nr .07
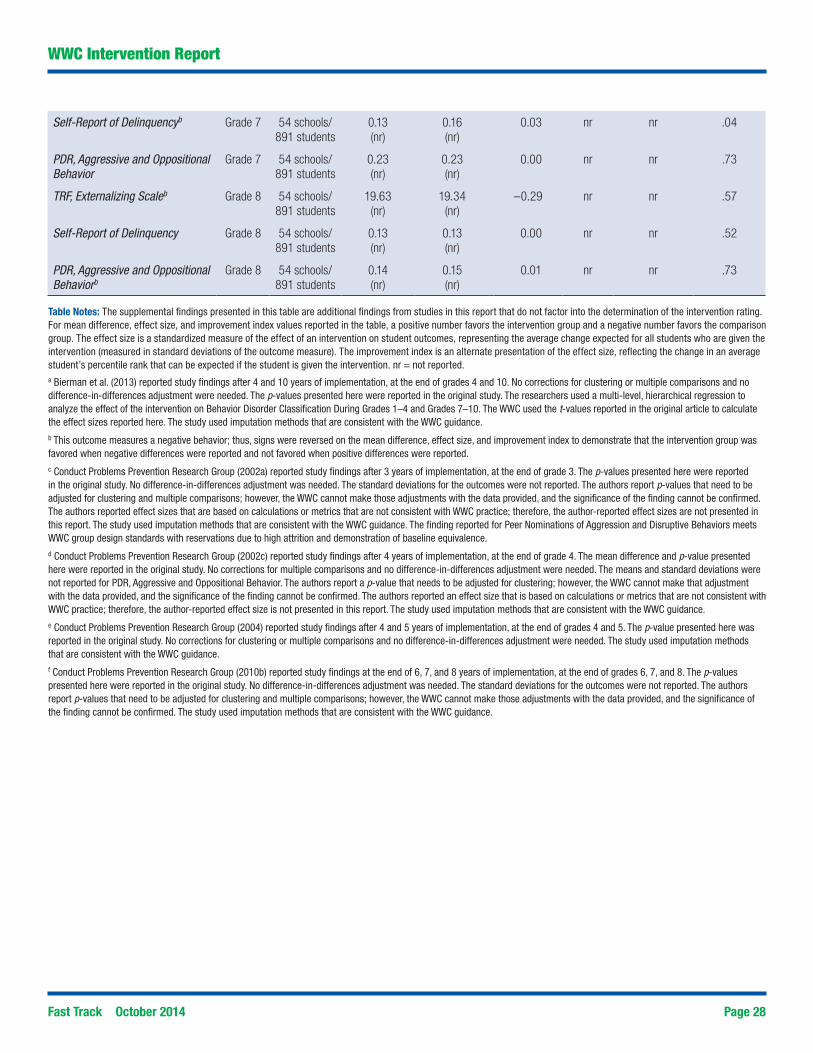
Fast Track October 2014 Page 28
WWC Intervention Report
Table Notes: The supplemental findings presented in this table are additional findings from studies in this report that do not factor into the determination of the intervention rating. For mean difference, effect size, and improvement index values reported in the table, a positive number favors the intervention group and a negative number favors the comparison group. The effect size is a standardized measure of the effect of an intervention on student outcomes, representing the average change expected for all students who are given the intervention (measured in standard deviations of the outcome measure). The improvement index is an alternate presentation of the effect size, reflecting the change in an average student’s percentile rank that can be expected if the student is given the intervention. nr = not reported.a Bierman et al. (2013) reported study findings after 4 and 10 years of implementation, at the end of grades 4 and 10. No corrections for clustering or multiple comparisons and no difference-in-differences adjustment were needed. The p-values presented here were reported in the original study. The researchers used a multi-level, hierarchical regression to analyze the effect of the intervention on Behavior Disorder Classification During Grades 1–4 and Grades 7–10. The WWC used the t-values reported in the original article to calculate the effect sizes reported here. The study used imputation methods that are consistent with the WWC guidance. b This outcome measures a negative behavior; thus, signs were reversed on the mean difference, effect size, and improvement index to demonstrate that the intervention group was favored when negative differences were reported and not favored when positive differences were reported.c Conduct Problems Prevention Research Group (2002a) reported study findings after 3 years of implementation, at the end of grade 3. The p-values presented here were reported in the original study. No difference-in-differences adjustment was needed. The standard deviations for the outcomes were not reported. The authors report p-values that need to be adjusted for clustering and multiple comparisons; however, the WWC cannot make those adjustments with the data provided, and the significance of the finding cannot be confirmed. The authors reported effect sizes that are based on calculations or metrics that are not consistent with WWC practice; therefore, the author-reported effect sizes are not presented in this report. The study used imputation methods that are consistent with the WWC guidance. The finding reported for Peer Nominations of Aggression and Disruptive Behaviors meets WWC group design standards with reservations due to high attrition and demonstration of baseline equivalence.d Conduct Problems Prevention Research Group (2002c) reported study findings after 4 years of implementation, at the end of grade 4. The mean difference and p-value presented here were reported in the original study. No corrections for multiple comparisons and no difference-in-differences adjustment were needed. The means and standard deviations were not reported for PDR, Aggressive and Oppositional Behavior. The authors report a p-value that needs to be adjusted for clustering; however, the WWC cannot make that adjustment with the data provided, and the significance of the finding cannot be confirmed. The authors reported an effect size that is based on calculations or metrics that are not consistent with WWC practice; therefore, the author-reported effect size is not presented in this report. The study used imputation methods that are consistent with the WWC guidance.e Conduct Problems Prevention Research Group (2004) reported study findings after 4 and 5 years of implementation, at the end of grades 4 and 5. The p-value presented here was reported in the original study. No corrections for clustering or multiple comparisons and no difference-in-differences adjustment were needed. The study used imputation methods that are consistent with the WWC guidance.f Conduct Problems Prevention Research Group (2010b) reported study findings at the end of 6, 7, and 8 years of implementation, at the end of grades 6, 7, and 8. The p-values presented here were reported in the original study. No difference-in-differences adjustment was needed. The standard deviations for the outcomes were not reported. The authors report p-values that need to be adjusted for clustering and multiple comparisons; however, the WWC cannot make those adjustments with the data provided, and the significance of the finding cannot be confirmed. The study used imputation methods that are consistent with the WWC guidance.
Self-Report of Delinquencyb Grade 7 54 schools/ 891 students
0.13 (nr)
0.16 (nr)
0.03 nr nr .04
PDR, Aggressive and Oppositional Behavior
Grade 7 54 schools/ 891 students
0.23 (nr)
0.23 (nr)
0.00 nr nr .73
TRF, Externalizing Scaleb Grade 8 54 schools/ 891 students
19.63 (nr)
19.34 (nr)
–0.29 nr nr .57
Self-Report of Delinquency Grade 8 54 schools/ 891 students
0.13 (nr)
0.13 (nr)
0.00 nr nr .52
PDR, Aggressive and Oppositional Behaviorb
Grade 8 54 schools/ 891 students
0.14 (nr)
0.15 (nr)
0.01 nr nr .73

Fast Track October 2014 Page 29
WWC Intervention Report
Appendix D.2b: Description of supplemental findings during 2-year follow-up (grade 12) for the external behavior domain
Mean
(standard deviation) WWC calculations
Outcome measureStudy
sampleSample
sizeIntervention
groupComparison
groupMean
differenceEffect size
Improvement index p-value
Conduct Problems Prevention Research Group, 2010aa
Arrest Index, Adultb Grade 12 54 schools/891 students
1.89 (0.05)
1.82 (0.04)
–0.07 nr nr .77
Arrest Index, Juvenileb Grade 12 54 schools/891 students
3.18 (0.29)
3.27 (0.28)
0.09 nr nr .05
Self-Report of Delinquencyb Grade 12 54 schools/891 students
54.99(4.22)
55.15(4.06)
0.16 0.04 +2 .78
Foster, 2010c
Number of crimes, including less severe offenses
Grade 12 54 schools/891 students
nr nr nr nr nr > .05
Number of days smoked in past month
Grade 12 54 schools/891 students
nr nr nr nr nr > .05
Number of days very drunk in past month
Grade 12 54 schools/891 students
nr nr nr nr nr > .05
Number of severe crimes Grade 12 54 schools/891 students
nr nr nr nr nr > .05
Number of times used marijuana in past month
Grade 12 54 schools/891 students
nr nr nr nr nr > .05
Parent Daily Report (PDR), Substance Abuse
Grade 12 54 schools/891 students
nr nr nr nr nr > .05
Table Notes: The supplemental findings presented in this table are additional findings from studies in this report that do not factor into the determination of the intervention rating. For mean difference, effect size, and improvement index values reported in the table, a positive number favors the intervention group and a negative number favors the comparison group. The effect size is a standardized measure of the effect of an intervention on student outcomes, representing the average change expected for all students who are given the intervention (measured in standard deviations of the outcome measure). The improvement index is an alternate presentation of the effect size, reflecting the change in an average student’s percentile rank that can be expected if the student is given the intervention. nr = not reported.a Conduct Problems Prevention Research Group (2010a) reported study findings at the end of grade 12, 2 years after the 10-year implementation ended. The p-values presented here were reported in the original study. A stereotype logit estimate was used to analyze the effect of the intervention on the Arrest Index, Adult. An ordered logit estimate was used to analyze the effect of the intervention on the Arrest Index, Juvenile. A standard linear regression was used to analyze the effect of the intervention on Self-Report of Delinquency. Prob-ability estimates were reported for Arrest Index, Adult and Arrest Index, Juvenile, and a treatment coefficient was provided for Self-Report of Delinquency. All analyses included covari-ate adjustments, and no standardized effect sizes were reported in the original study. The Arrest Index, Adult and Arrest Index, Juvenile measures are ordinal, so we cannot calculate the effect size for these outcomes. Corrections for multiple comparisons were needed and resulted in a WWC-computed critical p-value of .02 for Arrest Index, Juvenile; therefore, the WWC does not find the result to be statistically significant. No corrections for clustering and no difference-in-differences adjustment were needed. The study used imputation methods that are consistent with the WWC guidance. The finding reported for Arrest Index, Juvenile meets WWC group design standards with reservations due to high attrition and demonstra-tion of baseline equivalence.b This outcome measures a negative behavior; thus, signs were reversed on the mean difference, effect size, and improvement index to demonstrate that the intervention group was favored when negative differences were reported and not favored when positive differences were reported.c Foster (2010) reported study findings at the end of grade 12, 2 years after the 10-year implementation ended. The p-values presented here were reported in the original study. No corrections for clustering or multiple comparisons and no difference-in-differences adjustment were needed. The study used imputation methods that are consistent with the WWC guidance. The findings reported for Number of crimes, including less severe offenses and Number of severe crimes meet WWC group design standards with reservations due to high attrition and demonstration of baseline equivalence.
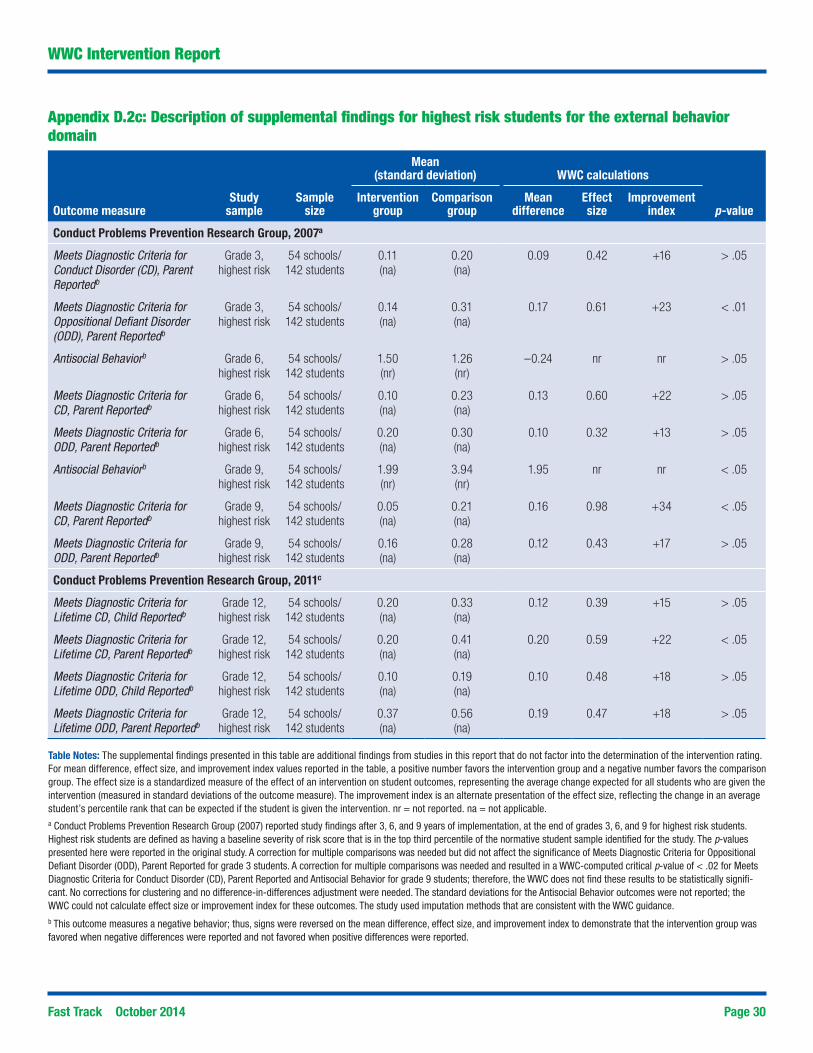
Fast Track October 2014 Page 30
WWC Intervention Report
Appendix D.2c: Description of supplemental findings for highest risk students for the external behavior domain
Mean
(standard deviation) WWC calculations
Outcome measureStudy
sampleSample
sizeIntervention
groupComparison
groupMean
differenceEffect size
Improvement index p-value
Conduct Problems Prevention Research Group, 2007a
Meets Diagnostic Criteria for Conduct Disorder (CD), Parent Reportedb
Grade 3, highest risk
54 schools/142 students
0.11(na)
0.20(na)
0.09 0.42 +16 > .05
Meets Diagnostic Criteria for Oppositional Defiant Disorder (ODD), Parent Reportedb
Grade 3, highest risk
54 schools/142 students
0.14(na)
0.31(na)
0.17 0.61 +23 < .01
Antisocial Behaviorb Grade 6, highest risk
54 schools/142 students
1.50(nr)
1.26(nr)
–0.24 nr nr > .05
Meets Diagnostic Criteria for CD, Parent Reportedb
Grade 6, highest risk
54 schools/142 students
0.10(na)
0.23(na)
0.13 0.60 +22 > .05
Meets Diagnostic Criteria for ODD, Parent Reportedb
Grade 6, highest risk
54 schools/142 students
0.20(na)
0.30(na)
0.10 0.32 +13 > .05
Antisocial Behaviorb Grade 9, highest risk
54 schools/142 students
1.99(nr)
3.94(nr)
1.95 nr nr < .05
Meets Diagnostic Criteria for CD, Parent Reportedb
Grade 9, highest risk
54 schools/142 students
0.05(na)
0.21(na)
0.16 0.98 +34 < .05
Meets Diagnostic Criteria for ODD, Parent Reportedb
Grade 9, highest risk
54 schools/142 students
0.16(na)
0.28(na)
0.12 0.43 +17 > .05
Conduct Problems Prevention Research Group, 2011c
Meets Diagnostic Criteria for Lifetime CD, Child Reportedb
Grade 12, highest risk
54 schools/142 students
0.20(na)
0.33(na)
0.12 0.39 +15 > .05
Meets Diagnostic Criteria for Lifetime CD, Parent Reportedb
Grade 12, highest risk
54 schools/142 students
0.20(na)
0.41(na)
0.20 0.59 +22 < .05
Meets Diagnostic Criteria for Lifetime ODD, Child Reportedb
Grade 12, highest risk
54 schools/142 students
0.10(na)
0.19(na)
0.10 0.48 +18 > .05
Meets Diagnostic Criteria for Lifetime ODD, Parent Reportedb
Grade 12, highest risk
54 schools/142 students
0.37(na)
0.56(na)
0.19 0.47 +18 > .05
Table Notes: The supplemental findings presented in this table are additional findings from studies in this report that do not factor into the determination of the intervention rating. For mean difference, effect size, and improvement index values reported in the table, a positive number favors the intervention group and a negative number favors the comparison group. The effect size is a standardized measure of the effect of an intervention on student outcomes, representing the average change expected for all students who are given the intervention (measured in standard deviations of the outcome measure). The improvement index is an alternate presentation of the effect size, reflecting the change in an average student’s percentile rank that can be expected if the student is given the intervention. nr = not reported. na = not applicable. a Conduct Problems Prevention Research Group (2007) reported study findings after 3, 6, and 9 years of implementation, at the end of grades 3, 6, and 9 for highest risk students. Highest risk students are defined as having a baseline severity of risk score that is in the top third percentile of the normative student sample identified for the study. The p-values presented here were reported in the original study. A correction for multiple comparisons was needed but did not affect the significance of Meets Diagnostic Criteria for Oppositional Defiant Disorder (ODD), Parent Reported for grade 3 students. A correction for multiple comparisons was needed and resulted in a WWC-computed critical p-value of < .02 for Meets Diagnostic Criteria for Conduct Disorder (CD), Parent Reported and Antisocial Behavior for grade 9 students; therefore, the WWC does not find these results to be statistically signifi-cant. No corrections for clustering and no difference-in-differences adjustment were needed. The standard deviations for the Antisocial Behavior outcomes were not reported; the WWC could not calculate effect size or improvement index for these outcomes. The study used imputation methods that are consistent with the WWC guidance.b This outcome measures a negative behavior; thus, signs were reversed on the mean difference, effect size, and improvement index to demonstrate that the intervention group was favored when negative differences were reported and not favored when positive differences were reported.
Fast Track October 2014 Page 31
WWC Intervention Report
c Conduct Problems Prevention Research Group (2011) reported study findings at the end of grade 12, 2 years after the 10-year implementation ended, for highest risk students. Highest risk students are defined as having a baseline severity of risk score that is in the top third percentile of the normative student sample identified for the study. The p-values presented here were reported in the original study. Corrections for multiple comparisons were needed and resulted in a WWC-computed critical p-value of .01 for Meets Diagnostic Criteria for Lifetime Conduct Disorder (CD), Parent Reported; therefore, the WWC does not find the result to be statistically significant. No corrections for clustering and no difference-in-differences adjustment were needed. The study used imputation methods that are consistent with the WWC guidance. The findings reported for Meets Diagnostic Criteria for Lifetime Conduct Disorder (CD), Child Reported and Meets Diagnostic Criteria for Lifetime Oppositional Defiant Disorder (ODD), Child Reported meet WWC group design standards with reservations due to high attrition and demonstration of baseline equivalence.

Fast Track October 2014 Page 32
WWC Intervention Report
Appendix D.2d: Description of supplemental findings for moderate risk students for the external behavior domain
Mean
(standard deviation) WWC calculations
Outcome measureStudy
sampleSample
sizeIntervention
groupComparison
groupMean
differenceEffect size
Improvement index p-value
Conduct Problems Prevention Research Group, 2007a
Meets Diagnostic Criteria for Conduct Disorder (CD), Parent Reportedb
Grade 3, moderate risk
54 schools/749 students
0.10(na)
0.05(na)
–0.05 –0.45 –17 > .05
Meets Diagnostic Criteria for Oppositional Defiant Disorder (ODD), Parent Reportedb
Grade 3, moderate risk
54 schools/749 students
0.12(na)
0.10(na)
–0.02 –0.12 –5 > .05
Antisocial Behaviorb Grade 6, moderate risk
54 schools/749 students
1.20(nr)
1.00(nr)
–0.20 nr nr > .05
Meets Diagnostic Criteria for CD, Parent Reportedb
Grade 6, moderate risk
54 schools/749 students
0.09(na)
0.06(na)
–0.03 –0.27 –10 > .05
Meets Diagnostic Criteria for ODD, Parent Reportedb
Grade 6, moderate risk
54 schools/749 students
0.16(na)
0.15(na)
–0.01 –0.05 –2 > .05
Antisocial Behaviorb Grade 9, moderate risk
54 schools/749 students
2.05(nr)
2.51(nr)
0.46 nr nr > .05
Meets Diagnostic Criteria for CD, Parent Reportedb
Grade 9, moderate risk
54 schools/749 students
0.05(na)
0.04(na)
–0.01 –0.14 –6 > .05
Meets Diagnostic Criteria for ODD, Parent Reportedb
Grade 9, moderate risk
54 schools/749 students
0.10(na)
0.12(na)
0.02 0.12 +5 > .05
Conduct Problems Prevention Research Group, 2011c
Meets Diagnostic Criteria for Lifetime CD, Parent Reportedb
Grade 12, moderate risk
54 schools/749 students
0.20(na)
0.13(na)
–0.07 –0.32 –13 <.05
Meets Diagnostic Criteria for Lifetime CD, Child Reportedb
Grade 12, moderate risk
54 schools/749 students
0.15(na)
0.13(na)
–0.02 –0.09 –4 > .05
Meets Diagnostic Criteria for Lifetime ODD, Parent Reportedb
Grade 12, moderate risk
54 schools/749 students
0.31(na)
0.30(na)
–0.02 –0.05 –2 > .05
Meets Diagnostic Criteria for Lifetime ODD, Child Reportedb
Grade 12, moderate risk
54 schools/749 students
0.10(na)
0.10(na)
0.00 0.01 0 > .05
Table Notes: The supplemental findings presented in this table are additional findings from studies in this report that do not factor into the determination of the intervention rating. For mean difference, effect size, and improvement index values reported in the table, a positive number favors the intervention group and a negative number favors the comparison group. The effect size is a standardized measure of the effect of an intervention on student outcomes, representing the average change expected for all students who are given the intervention (measured in standard deviations of the outcome measure). The improvement index is an alternate presentation of the effect size, reflecting the change in an average student’s percentile rank that can be expected if the student is given the intervention. nr = not reported. na = not applicable. a Conduct Problems Prevention Research Group (2007) reported study findings after 3, 6, and 9 years of implementation, at the end of grades 3, 6, and 9 for moderate risk students. Moderate risk students are defined as having a baseline severity of risk score that is below the top third percentile of the normative student sample identified for the study. The p-values presented here were reported in the original study. No corrections for multiple comparisons and clustering and no difference-in-differences adjustment were needed. The standard deviations for the Antisocial Behavior outcomes were not reported; the WWC could not calculate effect size or improvement index for these outcomes. The study used impu-tation methods that are consistent with the WWC guidance.b This outcome measures a negative behavior; thus, signs were reversed on the mean difference, effect size, and improvement index to demonstrate that the intervention group was favored when negative differences were reported and not favored when positive differences were reported.c Conduct Problems Prevention Research Group (2011) reported study findings at the end of grade 12, 2 years after the 10-year implementation ended, for moderate risk students. Moderate risk students are defined as having a baseline severity of risk score that is below the top third percentile of the normative student sample identified for the study. The p-values presented here were reported in the original study. Corrections for multiple comparisons were needed and resulted in a WWC-computed critical p-value of .01 for Meets Diagnostic Criteria for Lifetime Conduct Disorder (CD), Parent Reported; therefore, the WWC does not find the result to be statistically significant. No corrections for clustering and no difference-in-differences adjustment were needed. The study used imputation methods that are consistent with the WWC guidance.

Fast Track October 2014 Page 33
WWC Intervention Report
Appendix D.3: Description of supplemental findings during later intervention years (grades 3–8) for the social outcomes domain
Mean
(standard deviation) WWC calculations
Outcome measureStudy
sampleSample
sizeIntervention
groupComparison
groupMean
differenceEffect size
Improvement index p-value
Conduct Problems Prevention Research Group, 2002aa
Peer Social Preference Grade 3 54 schools/ 891 students
–0.55(nr)
–0.57(nr)
0.02 nr nr > .05
Peer-Nominated Prosocial Grade 3 54 schools/ 891 students
–0.47(nr)
–0.49(nr)
0.02 nr nr > .05
Social Problem-Solving Grade 3 54 schools/ 891 students
0.74(nr)
0.72(nr)
0.02 nr nr .06
Conduct Problems Prevention Research Group, 2002cb
Child Prosocial Behavior Change, Social Competence, Teacher Rating
Grade 4 54 schools/ 891 students
nr nr 0.13 nr nr < .01
Peer Social Preference Grade 4 54 schools/ 891 students
nr nr 0.22 nr nr < .02
Conduct Problems Prevention Research Group, 2004c
Social Cognition and Social Competence Outcome Domaind
Grades 4 and 5
54 schools/ 891 students
0.16(na)
0.23(na)
0.07 0.27 +11 < .01
Conduct Problems Prevention Research Group, 2010be
Adult Relations Grade 6 54 schools/ 891 students
1.88(nr)
1.94(nr)
–0.06 nr nr .54
Social Skills with Peers Grade 6 54 schools/ 891 students
1.85(nr)
1.83(nr)
0.02 nr nr .93
Adult Relations Grade 7 54 schools/ 891 students
1.87(nr)
1.81(nr)
0.06 nr nr .98
Social Skills with Peers Grade 7 54 schools/ 891 students
1.92(nr)
1.96(nr)
–0.04 nr nr .94
Adult Relations Grade 8 54 schools/ 891 students
1.81(nr)
1.90(nr)
–0.09 nr nr .12
Social Skills with Peers Grade 8 54 schools/ 891 students
1.91(nr)
1.98(nr)
–0.07 nr nr .09
Table Notes: The supplemental findings presented in this table are additional findings from studies in this report that do not factor into the determination of the intervention rating. For mean difference, effect size, and improvement index values reported in the table, a positive number favors the intervention group and a negative number favors the comparison group. The effect size is a standardized measure of the effect of an intervention on student outcomes, representing the average change expected for all students who are given the intervention (measured in standard deviations of the outcome measure). The improvement index is an alternate presentation of the effect size, reflecting the change in an average student’s percentile rank that can be expected if the student is given the intervention. nr = not reported. na = not applicable. a Conduct Problems Prevention Research Group (2002a) reported study findings after 3 years of implementation, at the end of grade 3. The p-values presented here were reported in the original study. No corrections for clustering or multiple comparisons and no difference-in-differences adjustment were needed. The authors reported effect sizes based on calcula-tions or metrics that are not consistent with WWC practice; therefore, the author-reported effect sizes differ from the WWC-calculated effect sizes and are not presented in this report. The study used imputation methods that are consistent with the WWC guidance. The findings reported for Peer Social Preference and Peer-Nominated Prosocial meet WWC group design standards with reservations due to high attrition and demonstration of baseline equivalence.b Conduct Problems Prevention Research Group (2002c) reported study findings after 4 years of implementation, at the end of grade 4. The mean differences and p-values presented here were reported in the original study. No difference-in-differences adjustment was needed. The means and standard deviations were not reported for Child Prosocial Behavior Change, Social Competence, Teacher Rating or Peer Social Preference. The authors report p-values that need to be adjusted for clustering and multiple comparisons; however, the WWC cannot make those adjustments with the data provided, and the significance of the findings cannot be confirmed. The authors reported effect sizes that are based on calcula-

Fast Track October 2014 Page 34
WWC Intervention Report
tions or metrics that are not consistent with WWC practice; therefore, the author-reported effect sizes are not presented in this report. The study used imputation methods that are consistent with the WWC guidance. c Conduct Problems Prevention Research Group (2004) reported study findings after 4 and 5 years of implementation, at the end of grades 4 and 5. The p-value presented here was reported in the original study. No corrections for clustering or multiple comparisons and no difference-in-differences adjustment were needed. The study used imputation methods that are consistent with the WWC guidance.d This outcome measures a negative behavior; thus, signs were reversed on the mean difference, effect size, and improvement index to demonstrate that the intervention group was favored when negative differences were reported and not favored when positive differences were reported.e Conduct Problems Prevention Research Group (2010b) reported study findings at the end of 6, 7, and 8 years of implementation, at the end of grades 6, 7, and 8. The p-values presented here were reported in the original study. No corrections for clustering or multiple comparisons and no difference-in-differences adjustment were needed. The study used imputation methods that are consistent with the WWC guidance.

Fast Track October 2014 Page 35
WWC Intervention Report
Appendix D.4a: Description of supplemental findings during later intervention years (grades 4–5) for the other academic performance domain
Mean
(standard deviation) WWC calculations
Outcome measureStudy
sampleSample
sizeIntervention
groupComparison
groupMean
differenceEffect size
Improvement index p-value
Conduct Problems Prevention Research Group, 2002ca
Child Prosocial Behavior Change, Academic Competence, Teacher Rating
Grade 4 54 schools/891 students
nr nr 0.14 nr nr < .02
Conduct Problems Prevention Research Group, 2004b
School Context Academic and Behavior Problems Outcome Domainc
Grades 4 and 5
54 schools/891 students
0.21(na)
0.17(na)
–0.04 –0.16 –6 > .05
Table Notes: The supplemental findings presented in this table are additional findings from studies in this report that do not factor into the determination of the intervention rating. For mean difference, effect size, and improvement index values reported in the table, a positive number favors the intervention group and a negative number favors the comparison group. The effect size is a standardized measure of the effect of an intervention on student outcomes, representing the average change expected for all students who are given the intervention (measured in standard deviations of the outcome measure). The improvement index is an alternate presentation of the effect size, reflecting the change in an average student’s percentile rank that can be expected if the student is given the intervention. nr = not reported. na = not applicable.a Conduct Problems Prevention Research Group (2002c) reported study findings after 4 years of implementation, at the end of grade 4. No corrections for multiple comparisons and no difference-in-differences adjustment were needed. The means and standard deviations were not reported for Child Prosocial Behavior Change, Academic Competence, Teacher Rating. The mean difference and p-value presented here were reported in the original study. The authors report a p-value that needs to be adjusted for clustering; however, the WWC cannot make that adjustment with the data provided, and the significance of the findings cannot be confirmed. The authors reported an effect size that is based on calculations or metrics that are not consistent with WWC practice; therefore, the author-reported effect size is not presented in this report. The study used imputation methods that are consistent with the WWC guidance.b Conduct Problems Prevention Research Group (2004) reported study findings after 4 and 5 years of implementation, at the end of grades 4 and 5. No corrections for clustering or multiple comparisons and no difference-in-differences adjustment were needed. The study used imputation methods that are consistent with the WWC guidance. The p-value presented here was reported in the original study.c This outcome measures a negative behavior; thus, signs were reversed on the mean difference, effect size, and improvement index to demonstrate that the intervention group was favored when negative differences were reported and not favored when positive differences were reported.

Fast Track October 2014 Page 36
WWC Intervention Report
Table Notes: The supplemental findings presented in this table are additional findings from a study in this report that do not factor into the determination of the intervention rating. For mean difference, effect size, and improvement index values reported in the table, a positive number favors the intervention group and a negative number favors the comparison group. The effect size is a standardized measure of the effect of an intervention on student outcomes, representing the average change expected for all students who are given the intervention (measured in standard deviations of the outcome measure). The improvement index is an alternate presentation of the effect size, reflecting the change in an average student’s percentile rank that can be expected if the student is given the intervention. nr = not reported.a Foster (2010) reported study findings at the end of grade 12, 2 years after the 10-year implementation ended. No corrections for clustering or multiple comparisons and no difference-in-differences adjustment were needed. The p-values presented here were reported in the original study. The study used imputation methods that are consistent with the WWC guidance.
Mean
(standard deviation) WWC calculations
Outcome measureStudy
sampleSample
sizeIntervention
groupComparison
groupMean
differenceEffect size
Improvement index p-value
Foster, 2010a
Whether graduated from high school
Grade 12 54 schools/891 students
nr nr nr nr nr > .05
Whether repeated a grade Grade 12 54 schools/891 students
nr nr nr nr nr > .05
Appendix D.4b: Description of supplemental findings during 2-year follow-up (grade 12) for the other academic performance domain
Fast Track October 2014 Page 37
WWC Intervention Report
Endnotes1 The descriptive information for this program was obtained from a publicly available source: the program’s website (http://www. fasttrackproject.org/, downloaded July 2013). The WWC requests developers review the program description sections for accuracy from their perspective. The program description was provided to the developer in July 2013, and the WWC incorporated feedback from the developer. Further verification of the accuracy of the descriptive information for this program is beyond the scope of this review.2 The literature search reflects documents publicly available by March 2014. The studies in this report were reviewed using the Group Design standards from the WWC Procedures and Standards Handbook (version 2.1), along with those described in the Children Clas-sified as Having an Emotional Disturbance review protocol (version 2.0). The evidence presented in this report is based on available research. Findings and conclusions may change as new research becomes available.3 For criteria used in the determination of the rating of effectiveness and extent of evidence, see the WWC Rating Criteria on p. 39. These improvement index numbers show the average and range of student-level improvement indices for all findings across the studies. There were no studies that met WWC group design standards that included the other three domains included in the Children Classified as Having an Emotional Disturbance review protocol (version 2.0): math achievement, school attendance, or other academic performance. 4 Outcome data were not always provided for all 891 students in Conduct Problems Prevention Research Group (1999a), so sample sizes vary for each variable and domain. The student sample sizes listed throughout this report for Conduct Problems Prevention Research Group (1999a) are based on the outcome with the largest sample size within each domain.5 Cost information was obtained from Foster, E. M., Jones, D. E., & Conduct Problems Prevention Research Group. (2006). Can a costly intervention be cost-effective? An analysis of violence prevention. Archives of General Psychiatry, 63(11), 1284–1291.6 Conduct Problems Prevention Research Group (2007; 2011) reported study findings separately for the highest risk students and for moderate risk students. Highest risk students are defined as having a baseline severity of risk score that is in the top third percentile of the normative student sample identified for the study. Moderate risk students are defined as having a baseline severity of risk score that is below the top third percentile of the normative student sample identified for the study. These findings are presented in Appendi-ces D.2c and D.2d and do not contribute to the intervention rating.7 The contrasts between students who received 1 year of Fast Track and students in the comparison group (Conduct Problems Preven-tion Research Group, 1999a) are presented in Appendices C.1–C.4 and form the basis of the intervention ratings because the most intense phase of the intervention occurred in the first year of implementation. Comparisons on the same sample of students after 3 years of implementation (Conduct Problems Prevention Research Group, 2002a; 2007), 4 years after implementation (Bierman et al., 2013; Conduct Problems Prevention Research Group, 2002c; 2004), 5 years after implementation (Conduct Problems Prevention Research Group, 2004), 6 years after implementation (Conduct Problems Prevention Research Group, 2007; 2010b), 7 years of implementation (Conduct Problems Prevention Research Group, 2010b), 8 years after implementation (Conduct Problems Prevention Research Group, 2010b ), 9 years after implementation (Conduct Problems Prevention Research Group, 2007), 10 years after implementation (Bierman et al., 2013) and 2 years after the 10-year implementation ended (Conduct Problems Prevention Research Group, 2010a; 2011; Foster, 2010) are presented in Appendices D.1–D.4 and do not contribute to the intervention rating. Findings from Rabiner et al. (2004) are not presented in this report because these findings replicate the presented findings from Conduct Problems Prevention Research Group (1999a). Findings from Dodge et al. (2013) are not presented in this report because these findings replicate the presented findings from Conduct Problems Prevention Research Group (2007).8 A total of 9,594 students were present in study classrooms during the spring of the students’ kindergarten school year. From this total group of students, 8,243 did not meet the study inclusion criteria, as they were not identified as being at risk for long-term antiso-cial behavior during the spring of their kindergarten year. An additional 401 students did not participate in the school or home assess-ments (so eligibility could not be assessed), and 59 students did not matriculate to first grade. Based on information provided to the WWC from the authors, refusals to participate in the assessments were made without knowledge of the condition, and the number of students who refused to participate in the assessments and failed to matriculate to the first grade was roughly equal in both study conditions. Overall attrition is low after accounting for these refusals and students who failed to matriculate to first grade.9 Ribordy, S. C., Camras, L. A., Stafani, R., & Spacarelli, S. (1988). Vignettes for emotion recognition research and affective therapy with children. Journal of Clinical Child Psychology, 17(4), 322–325.10 Greenberg, M. T., & Kusche, C. A. (1990). Inventory of emotional experience (technical report). Seattle: University of Washington Press.11 Spache, G. D. (1981). DRS: Diagnostic Reading Scales examiner’s manual. Monterey, CA: McGraw-Hill. 12 Woodcock, R. W., & Johnson, M. B. (1990). Woodcock–Johnson Psycho-Educational Battery—Revised. Allen, TX: D. M. Teaching Resources.

Fast Track October 2014 Page 38
WWC Intervention Report
13 Achenbach, T. M. (1991). Manual for the child behavior checklist/4–18 and 1991 profile. Burlington: University of Vermont, Depart-ment of Psychiatry. 14 Dodge, K. A., Bates, J. E., & Pettit, G. S. (1990). Mechanisms in the cycle of violence. Science, 250, 1678–1683.15 Tapp, J. T., Wehby, J. H., & Ellis, D. N. (1993). A multiple option observation system for experimental studies: MOOSES (Unpublished manuscript). Vanderbilt University, Nashville, TN.16 Chamberlain, P., & Reid, J. B. (1987). Parent observation and report of child symptoms. Behavioral Assessment, 9(1), 97–109.17 Werthamer-Larsson, L., Kellam, S. G., & Wheeler, L. (1991). Effects of first grade classroom environment on shy behavior, aggressive behavior, and concentration problems. American Journal of Community Psychology, 19(4), 585–602.18 The description of this measure was supplemented with information from the program’s website (http://www.fasttrackproject.org/, downloaded July 2013).19 Conduct Problems Prevention Research Group. (1995). Psychometric properties of the Social Competence Scale–Teacher and Par-ent Ratings. (Fast Track project technical report). University Park: Pennsylvania State University.20 Dodge, K. A., Bates, J. E., & Pettit, G. S. (1990). Mechanisms in the cycle of violence. Science, 250, 1678–1683.21 Spache, G. D. (1981). DRS: Diagnostic Reading Scales examiner’s manual. Monterey, CA: McGraw-Hill. 22 The description of this measure was supplemented with information obtained directly from the authors.23 The description of this measure was supplemented with information obtained directly from the authors.24 Achenbach, T. M. (1991). Manual for the child behavior checklist/4–18 and 1991 profile. Burlington: University of Vermont, Depart-ment of Psychiatry. 25 The Diagnosis of Conduct Disorder (CD) and Oppositional Defiant Disorders (ODD) outcomes were included to be as informative as possible. These measures do not clearly fall under the external behavior domain, but this is the most appropriate domain in the Chil-dren Classified as Having an Emotional Disturbance topic area.26 Resnick, M. D., Bearman, P. S., Blum, R. W., Bauman, K. E., Harris, K. M., Jones, J., …Udry, J. R. (1997). Protecting adolescents from harm: Findings from the National Longitudinal Study on Adolescent Health. JAMA, 278(10), 823–832.27 Chamberlain, P., & Reid, J. B. (1987). Parent observation and report of child symptoms. Behavioral Assessment, 9(1), 97–109.28 Elliott, D. S., Huizinga, D., & Ageton, S. S. (1985). Explaining delinquency and drug use. Beverly Hills: Sage Publications.29 Dodge, K. A., Bates, J. E., & Pettit, G. S. (1990). Mechanisms in the cycle of violence. Science, 250, 1678–1683.
Recommended CitationU.S. Department of Education, Institute of Education Sciences, What Works Clearinghouse. (2014, October).
Children Classified as Having an Emotional Disturbance intervention report: Fast Track. Retrieved from http://whatworks.ed.gov

Fast Track October 2014 Page 39
WWC Intervention Report
Criteria used to determine the rating of a studyStudy rating Criteria
Meets WWC evidence standards without reservations
A study that provides strong evidence for an intervention’s effectiveness, such as a well-implemented RCT.
Meets WWC evidence standards with reservations
A study that provides weaker evidence for an intervention’s effectiveness, such as a QED or an RCT with high attrition that has established equivalence of the analytic samples.
Criteria used to determine the rating of effectiveness for an interventionRating of effectiveness Criteria
Positive effects Two or more studies show statistically significant positive effects, at least one of which met WWC evidence standards for a strong design, AND No studies show statistically significant or substantively important negative effects.
Potentially positive effects At least one study shows a statistically significant or substantively important positive effect, AND No studies show a statistically significant or substantively important negative effect AND fewer or the same number of studies show indeterminate effects than show statistically significant or substantively important positive effects.
Mixed effects At least one study shows a statistically significant or substantively important positive effect AND at least one study shows a statistically significant or substantively important negative effect, but no more such studies than the number showing a statistically significant or substantively important positive effect, OR At least one study shows a statistically significant or substantively important effect AND more studies show an indeterminate effect than show a statistically significant or substantively important effect.
Potentially negative effects One study shows a statistically significant or substantively important negative effect and no studies show a statistically significant or substantively important positive effect, OR Two or more studies show statistically significant or substantively important negative effects, at least one study shows a statistically significant or substantively important positive effect, and more studies show statistically significant or substantively important negative effects than show statistically significant or substantively important positive effects.
Negative effects Two or more studies show statistically significant negative effects, at least one of which met WWC evidence standards for a strong design, AND No studies show statistically significant or substantively important positive effects.
No discernible effects None of the studies shows a statistically significant or substantively important effect, either positive or negative.
Criteria used to determine the extent of evidence for an interventionExtent of evidence Criteria
Medium to large The domain includes more than one study, ANDThe domain includes more than one school, ANDThe domain findings are based on a total sample size of at least 350 students, OR, assuming 25 students in a class, a total of at least 14 classrooms across studies.
Small The domain includes only one study, ORThe domain includes only one school, ORThe domain findings are based on a total sample size of fewer than 350 students, AND, assuming 25 students in a class, a total of fewer than 14 classrooms across studies.
WWC Rating Criteria
Fast Track October 2014 Page 40
WWC Intervention Report
Please see the WWC Procedures and Standards Handbook (version 2.1) for additional details.
Attrition Attrition occurs when an outcome variable is not available for all participants initially assigned to the intervention and comparison groups. The WWC considers the total attrition rate and the difference in attrition rates across groups within a study.
Clustering adjustment If intervention assignment is made at a cluster level and the analysis is conducted at the student level, the WWC will adjust the statistical significance to account for this mismatch, if necessary.
Confounding factor A confounding factor is a component of a study that is completely aligned with one of the study conditions, making it impossible to separate how much of the observed effect was due to the intervention and how much was due to the factor.
Design The design of a study is the method by which intervention and comparison groups were assigned.
Domain A domain is a group of closely related outcomes.
Effect size The effect size is a measure of the magnitude of an effect. The WWC uses a standardized measure to facilitate comparisons across studies and outcomes.
Eligibility A study is eligible for review and inclusion in this report if it falls within the scope of the review protocol and uses either an experimental or matched comparison group design.
Equivalence A demonstration that the analysis sample groups are similar on observed characteristics defined in the review area protocol.
Extent of evidence An indication of how much evidence supports the findings. The criteria for the extent of evidence levels are given in the WWC Rating Criteria on p. 39.
Improvement index Along a percentile distribution of students, the improvement index represents the gain or loss of the average student due to the intervention. As the average student starts at the 50th percentile, the measure ranges from –50 to +50.
Multiple comparison adjustment
When a study includes multiple outcomes or comparison groups, the WWC will adjust the statistical significance to account for the multiple comparisons, if necessary.
Quasi-experimental design (QED)
A quasi-experimental design (QED) is a research design in which subjects are assigned to intervention and comparison groups through a process that is not random.
Randomized controlled trial (RCT)
A randomized controlled trial (RCT) is an experiment in which investigators randomly assign eligible participants into intervention and comparison groups.
Rating of effectiveness The WWC rates the effects of an intervention in each domain based on the quality of the research design and the magnitude, statistical significance, and consistency in findings. The criteria for the ratings of effectiveness are given in the WWC Rating Criteria on p. 39.
Single-case design A research approach in which an outcome variable is measured repeatedly within and across different conditions that are defined by the presence or absence of an intervention.
Standard deviation The standard deviation of a measure shows how much variation exists across observations in the sample. A low standard deviation indicates that the observations in the sample tend to be very close to the mean; a high standard deviation indicates that the observations in the sample tend to be spread out over a large range of values.
Statistical significance Statistical significance is the probability that the difference between groups is a result of chance rather than a real difference between the groups. The WWC labels a finding statistically significant if the likelihood that the difference is due to chance is less than 5% ( p < .05).
Substantively important A substantively important finding is one that has an effect size of 0.25 or greater, regardless of statistical significance.
Glossary of Terms