
Wu, Shenyi (1999) Investigation of ejector re- …eprints.nottingham.ac.uk/10369/1/S._Wu.pdf ·...
142
Wu, Shenyi (1999) Investigation of ejector re- compression absorption refrigeration cycle. PhD thesis, University of Nottingham. Access from the University of Nottingham repository: http://eprints.nottingham.ac.uk/10369/1/S._Wu.pdf Copyright and reuse: The Nottingham ePrints service makes this work by researchers of the University of Nottingham available open access under the following conditions. This article is made available under the University of Nottingham End User licence and may be reused according to the conditions of the licence. For more details see: http://eprints.nottingham.ac.uk/end_user_agreement.pdf For more information, please contact [email protected]
Transcript of Wu, Shenyi (1999) Investigation of ejector re- …eprints.nottingham.ac.uk/10369/1/S._Wu.pdf ·...

Wu, Shenyi (1999) Investigation of ejector re-compression absorption refrigeration cycle. PhD thesis, University of Nottingham.
Access from the University of Nottingham repository: http://eprints.nottingham.ac.uk/10369/1/S._Wu.pdf
Copyright and reuse:
The Nottingham ePrints service makes this work by researchers of the University of Nottingham available open access under the following conditions.
This article is made available under the University of Nottingham End User licence and may be reused according to the conditions of the licence. For more details see: http://eprints.nottingham.ac.uk/end_user_agreement.pdf
For more information, please contact [email protected]

INVESTIGATION OF EJECTOR RE-COMPRESSION
ABSORPTION REFRIGERATION CYCLE
By Shenyi Wu, BEng, MSc.
Thesis submitted to the University of Nottingham
for the degree of Doctor of Philosophy, May, 1999
CONTENTS 1
ABSTRACT i"
ACKNOWLEDGEMENTS iv
LIST OF FIGURES v
LIST OF TABLES ix
NOMENCLATURE x
CHAPTER 1
INTRODUCTION 1
CHAPTER 2
PAST RESEARCH ON ABSORPTION REFRIGERATION 7
2.1 The Absorption Cycles 8
2.2 Hybrid Absorption Cycles 15
2.3 The Working Fluids 21
2.4 Conclusion 22
CHAPTER 3
THEORETICAL STUDY OF THE EJECTOR
RE-COMPRESSION ABSORPTION CYCLE 25
3.1 Lithium Bromide Absorption Cycles 25
3.2 The Ejector Re-compression Absorption Cycle 30
3.3 The Performance Characteristics of Ejector and Its Modelling 36
3.4 Simulation Model of the Novel Cycle 49
3.5 Factors Affecting the Performance of the Novel Cycle and COP
Prediction 50
3.6 Conclusion 57
CHAPTER 4
PRELIMINARY EXPERIMENTAL STUDY
OF THE STEAM EJECTOR 59
4.1 The Experimental Apparatus 59
4.2 The Experimental Approach 63

4.3 Ejector Performance Characteristics 63
4.4 Efficient Use of Ejector 70
CHAPTER 5
MANUFACTURE OF A REFRIGERATOR
BASED ON THE NOVEL REFRIGERATION CYCLE 71
5.1 The Steam Generator 72
5.2 The Concentrator 74
5.3 The Absorber 81
5.4 The Evaporator 83
5.5 The Condenser 84
5.6 Measurement and Control System 85
5.7 Commission of the Experimental Rig 86
CHAPTER 6
EXPERIMENTAL STUDIES ON THE REFRIGERATOR 88
6.1 Experimental Methods 88
6.2 Calculation from the Readings 88
6.3 Experimental Results 93
6.4 Conclusion 111
CHAPTER 7
GENERAL DISCUSSION AND CONCLUSION 112
REFERENCE 115
APPENDIX A 124
APPENDIX B 125 APPENDIX C 127
n

ABSTRACT
This thesis describes a theoretical and experimental investigation of the ejector
re-compression lithium bromide absorption refrigeration cycle. In this novel
cycle, a steam ejector is used to enhance the concentration process by
compressing the vapour to a state that it can be used to re-heat the solution
from where it was evolved. Since this cycle recovers the heat otherwise
wasted in a conventional absorption cycle, the energy performance of the
cycle is improved. The theoretical study shows that the improvement of the
efficiency is proportional to the performance of the steam ejector. A COP of
1.013 was achieved from the experiment in this investigation.
The novel cycle does not only improve the energy efficiency but also avoids
the corrosion that will happen when high temperature heat sources are used to
drive a lithium bromide absorption refrigerator. The steam ejector in the novel
cycle acts as an efficient temperature converter in acceptance of different
temperature heat sources, which reduces the energy loss when the temperature
difference between the solution and the heat source is big. Therefore, the
solution temperature can be set to a low level while the heat source
temperature is high. This is significant to avoid the corrosion of lithium
bromide solution at high temperature. Furthermore, the construction of the
machine based on the novel cycle is simpler than that based on the
conventional double-effect cycle. This refrigerator will be more reliable and
have a lowed initial capital cost.
The cycle was investigated comprehensively in this thesis. In the theoretical
study, a mathematical model for this novel cycle was established. The
theoretical study reveals the operation characteristics and the factors that affect
the energy efficiency of the cycle as well as how to design a refrigerator based
on the novel cycle. In the experimental study, an concept-approved
refrigerator was manufactured and tested. The part-load performance of the
novel cycle was investigated from the experiment. The theoretical results had
a good agreement with the experimental ones.
ni
ACKNOWLEDGEMENT
During my study for PhD degree, I received a lot of help from the people in
the Department of Architecture and Building Technology, the School of the
Built Environment, the University of Nottingham. Without this help, I can not
imagine that I could finish the study. My first thanks should go to Dr. Ian W.
Fames. I am very grateful for his generous expert advice, understanding and
encouragement in my whole period of the study. He created an excellent
research surrounding from which I was benefited. I will never forget what I
gained from him. I also wish to thank Mr. Mark Worral for his help in the
ejector test, Mr. David Oliver for his wonderful skills to build the
experimental rig and Mr. Robert Clark for his help in electrical devices, and
all the technicians in this department for their great supports.
I wish to thank EPSRC and the University of Nottingham for their financial
and facility support on this project.
Finally, I wish to express my thanks to my wife and my family. Their support
has been a great encouragement for me to finish this study.
IV

LIST OF FIGURES
Figure 1.1 The novel absorption cycle 4
Figure 1.2 Single-effect lithium bromide absorption cycle 5
Figure 2.1 Cycle schematic for the triple-effect cycle 9
Figure 2.2 Two-stage triple-effect ammonia-water system 10
Figure 2.3 Low pressure triple effect cycle - cooling mode 12
Figure 2.4 Cycle schematic for GAX cycle 13
Figure 2.5 Branched GAX cycle 14
Figure 2.6 Absorption-compression cycle 17
Figure 2.7 An absorption heat pump by Cacciola (1990) 17
Figure 2.8 An absorption refrigeration cycle proposed
by Kulenschimidt (1973) 19
Figure 2.9 Ejector absorber cycle 19
Figure 2.10 Combined ejector-absorption cycle 20
Figure 2.11 Two ejectors absorption cycle 20
Figure 3.1 Single-effect lithium bromide-water refrigeration system 26
Figure 3.2 Thermodynamic cycle of single-effect lithium bromide
refrigerator 27
Figure 3.3 Double-effect lithium bromide
absorption refrigeration cycle 28
Figure 3.4 Thermodynamic cycle of double effect lithium bromide
refrigerator 30
Figure 3.5 The novel refrigeration cycle 31
Figure 3.6 Ejector re-compression absorption
refrigeration cycle on P-T-C chart 32
Figure 3.7 Ejector re-compression process 32
Figure 3.8 Structure and pressure profile of the concentrator 34
Figure 3.9 Schematic diagram of ejector 37
Figure 3.10 Performance characteristics of ejector 38
Figure 3.11 Schematic drawing of a supersonic ejector showing the
nomenclature used in this section 40
Figure 3.12 Convergent-divergent (de-Laval) nozzle 40
Figure 3.13 Detail of the entrainment model 41

Figure 3.14 Enhancement factor variation with the solution states 52
Figure 3.15 The influence of temperature
difference to entrainment ratio 53
Figure 3.16 Comparison of COP vs. concentration 56
Figure 3.17 COP variation with the solution concentration 56
Figure 3.18 COP variation with the steam temperature 57
Figure 4.1 Schematic diagram of the experimental rig 60
Figure 4.2 Photograph of the experimental rig 61
Figure 4.3 Schematic diagram of the ejector assembly 62
Figure 4.4 Entraimnent ratio variation with primary and secondary flows
65
Figure 4.5 Entraimnent ratio variation with back-pressure and primary
pressure 66
Figure 4.6 Measured variation in entrainment ratio with nozzle pressure
ratio for different nozzle exit/throat area ratio 68
Figure 4.7 Measured variation in optimum nozzle exit position with
secondary pressure ratio 69
Figure 4.8 Measured effect of primary pressure ratio, diffuser throat area
and nozzle pressure ratio on critical condenser pressure 70
Figure 4.9 Measured variation in entrainment ratio
with diffuser throat area ratio 70
Figure 5.1 Schematic diagram of the experimental rig 72
Figure 5.2 Photograph of the experimental rig 73
Figure 5.3 Diagram of the steam generator 74
Figure 5.4 Schematic structure of the concentrator 75
Figure 5.5 Diagram of the steam ejector 75
Figure 5.6 View of concentrator heat exchanger tube arrangement
from 'A' direction in Figure 5.4 77
Figure 5.7 Fin dimension of the copper tube 77
Figure 5.8 Photograph of the steam ejector 78
Figure 5.9 Photograph of the heat exchanger of the concentrator 78
Figure 5.10 The absorber and evaporator system 83
Figure 5.11 Diagram of the measuring and controlling system 86
Figure 6.1 Measured primary flow rate (0 = 1.1 mm) 90
vi

Figure 6.2 Measured primary flow rate (0 = 1.0 mm) 90
Figure 6.3 Back-pressure and pressure lift ratio
(15 bar, 1.1mm throat diameter) 94
Figure 6.4 Back-pressure and pressure lift ratio
(12.5 bar, 1.1mm throat diameter) 94
Figure 6.5 Back-pressure and pressure lift ratio
(10 bar, 1.1 mm throat diameter) 95
Figure 6.6 Back-pressure and pressure lift ratio
(15 bar, 1.0mm throat diameter) 95
Figure 6.7 Back-pressure and pressure lift ratio
(12.5 bar, 1.0mm throat diameter) 96
Figure 6.8 Back-pressure and pressure lift ratio
(10 bar, 1.0mm throat diameter) 96
Figure 6.9 Entrainment ratio variation with back-pressure (15 bar) 98
Figure 6.10 Entraimnent ratio variation with suction pressure 99
Figure 6.11 Entrainment ratio variation with back-pressure (12.5 Bar) 99
Figure 6.12 Mass ratio of the evolved vapour
to the motive steam (15 bar) 100
Figure 6.13 Mass ratio of the evolved vapour
to motive steam (12.5 bar) 101
Figure 6.14 Temperature difference between the steam and the solution
(at 15 bar motive steam) 102
Figure 6.15 Temperature difference between the steam and the solution
(at 12.5 bar motive steam) 103
Figure 6.16 COP variation with motive steam pressure 104
Figure 6.17 COP difference between the part-load
and the design operations 105
Figure 6.18 Cooling capacity vs. motive steam pressure 106
Figure 6.19 COP variation with solution concentration 107
Figure 6.20 Comparison of the experimental and theoretical COPs at
different solution concentration 108
Figure Al 124
Figure Bl Evaporator volume vs. height 125
vn

Figure B2 Measuring vessel volume vs. height 126
Figure B3 Condenser volume vs. height 126
vui

LIST OF TABLES
Table 3.1 Recommended ejector geometrical features
taken from ESDU (1986) 48
Table 3.2 Ejector Entrainment Ratio at different solution condition 51
Table 3.3 Enhancement factor varied with the solution condition 51
Table 3.4 COP Comparison between the single-effect
and the ejector boost single-effect cycles 55
Table 4.1 Test Nozzle Geometry 67
Table 4.2 Geometries of 3 test diffusers 69
Table 5.1 Flow geometric sizes of the ejector 76
Table 6.1 Ejector primary rates (gmin"^) at different steam pressure 89
Table 6.2 Pressure lift ratio of the steam ejector 93
Table 6.3 The pressure loss between the evaporator and absorber 110
IX

NOMENCLATURE
A area, m^
AD diffuser throat area, m^
Aexit primary nozzle exit area, m
Ai surface area inside tube, m
Ao surface area outside tube, m
At primary nozzle throat area, m^
AR AD/A ,
AT Aexit/A,
C concentration
Cv specific heat at constant volume, J-(kg-K)'^
Cp specific heat at constant pressure, J(kgK)"^
D diameter, m
Dth diffuser throat diameter, m
DAB molecular diffusivity,m^s'^
COP Coefficient of Performance
g gravity accelerate, m-s'
P pressure, bar or Pa
Pa atmosphere pressure, bar
h specific enthalpy, kJ- (kg-K)"'
hfg latent heat of condensation, kJ kg'l
h, total or stagnation enthalpy, kJkg'*
h mean heat transfer coefficient, W- (m^°C)"^
k thermal conductivity, W- (m°C) '
Km mixing section momentum loss coefficient
Mn Mach Number
rh mass flow rate, kg-s"'
Nn ratio of total primary to secondary pressures
Np ratio of primary to back-pressures
Ns ratio of back to secondary pressures
Ns' critical condenser pressure ratio
Nu average Nusselt number

NXP nozzle exit position, m
Pr Prandtl number
P, total or stagnation pressure. Pa or bar
q heat flux, kWm'^
Q heat flow rate, kW
r radius, m
R individual gas constant, k J ( k g K ) ' '
Re Reynolds number
s specific entropy, kJ • (kg K)"'
T temperature, K, °C
T, total or stagnation temperature, K "7 1
U overall coefficient of heat transfer, W- (m -"C)'
V velocity, m-s'
w entrainment ratio (rhs/rhp)
X mass concentration, %
Xc mass concentration of strong solution, %
Xd mass concentration of weak solution, %
Greek
a ratio of mass flow rate, m^ frit
x^ X solution circulation factor,
X^ -Xj
r\ efficiency of solution heat exchanger
rid diffuser pressure recovery factor
riN stagnation pressure loss factor in primary nozzle
T]s secondary flow stagnation pressure loss factor
C„ Y specific heat ratio, —^
V
p density, kg m"
e enhancement ratio
V kinematic viscosity, m^s'^
\i dynamic viscosity, N s m'^
XI

a surface tension, Nm'
6 film thickness, m
r mass flow rate per unit width, kg- (ms)"
Subscript
a
b
c
con
d
dp
e
f
g
H
i
in
int
1
L
m
0
od
P
rec
ref
s
sat
,T
th
V
w
absorber
back-pressure
concentrated
condenser
dilute
design point
evaporator
liquid
generator, gas
high pressure
inside tube
input
internal loop
liquid
low pressure
mixed flow
outside tube
off-design or part-load
ejector primary flow
rectifier
reference state
ejector secondary flow
saturated
total
throat
vapour
wall
0,1,2.. .numbers for the states
xn

CHAPTER 1
INTRODUCTION
Global warming (due to greenhouse gas accumulation in the lower
atmosphere) and stratospheric ozone depletion are increasingly recognized as
two coexistent, partly-related processes threatening to upset the ecological
support system of the Earth. A recent analysis of the potential public health
impact of climate change concluded that a few degrees increase of average
global temperature would lead to: increased incidence of heat strokes and
heat-related death in chronic diseases; geographic shifts in tropical and
infectious diseases; increased occurrence of death, injury and epidemics due to
weather-related emergencies and flooding of coastal areas (Slooff et al 1995).
In order to curb the global warming and ozone depletion, two important
documents. The United Nations Framework Convention on Climate Change
(FCCC) and Montreal Protocol, were signed by many countries. According to
these two documents, CFC and HCFC fluids, which are widely used in vapour
compression refrigerators and heat pumps will be gradually phased out and the
emission of greenhouse gas CO2 should be reduced to their 1990 levels. In
some EU countries, this ban extends to HFC fluids.
The ban on CFC, HCFC and HFC fluids has encouraged research into
environmental friendly refrigerants such as water. The lower CO2 emission
requires not only reduction in fossil fuel consumption but also improvement of
energy efficiency of refrigerators and heat pumps. Utilization of low-grade
energy is also an effective way to reduce CO2 emissions. For the latter, heat
powered refrigeration cycles can provide the answer. There are several heat
powered refrigeration cycles that can be considered. They are:
• Adsorption cycle - similar to absorption cycle but using solid
substance as absorbent. Regeneration of the absorbent could be a
problem if continuous cooling load is required. Adsorption

machines are suitable for particular applications but are not proven
commercially.
• Ejector cycle - using an ejector to compress refrigerants. Water can
be used as refrigerant. Simple in structure and low cost but low
energy efficiency.
• Absorption cycle - proven commercially, good energy efficiency and
environmentally friendly but may be complex when pursuing high
efficiency.
Of the three types of heat powered cycles, the absorption cycle is considered
to be the best in terms of energy performance today and it has the potential to
be improved. So, the absorption cycle has potential to be widely used if its
efficiency can be increased further and its construction can be made simpler.
This project was concerned with a novel absorption cycle which could deliver
a better performance than a single-effect cycle.
The absorption machine was invented in the mid-nineteenth century by a
Frenchman, Ferdinand Carre. Since then, the popularity of absorption systems
has risen and fallen due to economic conditions and advances in competing
technologies. The benefits of absorption systems have remained constant and
include the following:
• absorption systems are able to be driven by low grade thermal
energy.
• otherwise wasted heat can be utilized to power the absorption
refrigeration cycle.
• absorption units are quiet and vibration free.
• absorption units pose no threat to global environmental ozone
depletion and may have less impact on global warming than most
other options.
• absorption units are economically attractive when the fuel costs are
substantially less than electricity costs.

Absorption refrigerators and heat pumps using ammonia-water or water-
lithium bromide as working fluid pairs are commercially available. For above
0°C cooling applications, water-lithium bromide systems offer higher
efficiencies than ammonia-water systems do. Compared with aqua-ammonia
systems, LiBr-water units are simpler in construction because the rectification
process, required in aqua-ammonia, is absent. The only drawback for the
water-lithium bromide system is that water will freeze at subzero evaporator
temperatures. However, near subzero temperature operation is made possible
by adding a small amount salt in the evaporator. The real problems for water-
lithium bromide systems are crystallization and corrosion when the solution
concentration and temperature are high. Current commercial available lithium
bromide absorption systems are not suitable for working at a solution
concentration greater than 65% and a solution temperature greater than 200°C
for reasons of crystallisation and corrosion. This temperature limitation
inevitably reduces the second law efficiency when using high temperature heat
sources to drive conventional lithium bromide absorption cycles. The
concentration limitation results in the increase of circulation rate. The
ammonia-water system does not have the crystallization problem that water-
lithium bromide system has. However, the high-pressure of the ammonia
system makes it impractical at above 200°C. Therefore, efficient use of high
temperature heat sources becomes a challenge to the researchers in the field of
absorption refrigeration. Much research has been carried out in recent years
but the problem still exists. The current trend to use multi-stage, multi-effect
cycles and find new working pairs to improve performance seems to have
some way to go. Chapter 2 reviews the current state-of-the-art with regard to
the improvement of absorption refrigeration cycles and working fluids.
In this research, a novel cycle, which can be driven by high temperature heat
sources, is proposed and investigated. This cycle uses an ejector to enhance
the concentration process, rather than the evaporating process usually found in
previous work on ejector-absorption cycles, which are reviewed in Chapter 2.
The ejector entrains the refrigerant vapour evolved at the generator and re-
compresses it to such a state that it can be re-used to concentrate the solution.

The entrained vapour, together with the driving flow, are then used to heat the
solution. A schematic diagram of the novel cycle is shown in Figure 1.1. From
this diagram, it can be seen that the novel cycle is similar to a steam powered
single-effect absorption cycle which is shown schematically in Figure 1.2 for
comparison. The difference is that an ejector is used to enhance the
concentration process in the cycle. Because of the ejector being introduced
into the cycle, the solution temperature and concentration in the concentrator
can be set to optimum points no matter how high the heat source temperature.
In addition, the useful work, which is lost in the conventional absorption
cycles due to temperature limitation, is used by the ejector to generate more
vapour from the solution. Therefore, this novel cycle can not only avoid
crystallization and corrosion but also can increase the second low efficiency
when it operates with high temperature heat sources. This novel cycle can be
classified as a double effect cycle because the input heat is used twice. So, this
cycle is single-effect construction but with double-effect performance.
Compared with multi-stage, multi-effect cycles which are believed to have the
potential for excellent energy efficiency in use of high temperature heat
sources, this cycle offers a practical answer. Furthermore, since this cycle uses
the well-established and approved working fluid, H20-LiBr, it is easier for it
to be commercialized.
Driving flow
evaporatoi
Figure 1.1 The novel absorption cycle

The objectives of this research programme were to:
• Establish the state-of-art in regard to absorption cycle design in
order to place the invention within context.
• Experimentally and theoretically determine the performance
characteristics of the novel cycle over a range of operating
conditions.
concentrator
Driving flow condenser
X
evaporatoi
Figure 1.2 Single-effect lithium bromide absorption cycle
To achieve these objectives:
• A detailed literature review was carried out. The results of this are
described in Chapter 2. In this chapter, recent developments in
advanced absorption cycle design are reviewed, including multi
stage multi-effect absorption cycles, Generator-Absorber heat
Exchange (GAX) cycles and hybrid absorption cycles. Since
working fluids are strongly related to the cycle design, a review of
recent research activity on multi-component fluid is also included.
• A detailed theoretical study of the novel cycle was undertaken. This
included a theoretical analysis of the novel cycle with regard to the

cycle performance and the factors that influence its performance;
the ejector behaviour in the concentration process.
Experimental study of this novel cycle was carried out. A preliminary
experiment on the steam ejector for the experimental study on the
novel cycle is described in Chapter 4. The design and manufacture
of the 'concept approve' test rig are presented in Chapter 5. The
experimental results of the novel cycle are given in Chapter 6.
The discussion and conclusion are made in Chapter 7. In this
Chapter, the advantages of this novel cycle over the conventional
absorption cycle are highlighted. The problems which occurred in
this research are discussed. The suggestions for future study on this
novel cycle are also included.

CHAPTER 2
PAST RESEARCH ON ABSORPTION REFRIGERATION
Similar to vapour compression refrigeration, absorption refrigeration also uses
a phase change process to produce a cooling effect. The main differences
between them are: (a) the refrigerant vapour in an absorption cycle is absorbed
by a liquid before being compressed by a pump. Therefore, the mechanical
work required in absorption cycles is much less than that in the vapour-
compression cycles and (b) low-grade heat energy can be used to drive the
absorption cycle whereas high-grade work is required to drive vapour-
compression machines.
The Coefficient of Performance (COP) is a measure of refrigerator energy
efficiency. For absorption refrigerators, COP is defined as the ratio of the
evaporator cooling capacity to heat input at the generator. In terms of COP,
absorption systems are less efficient than vapour-compression systems.
However, when the primary energy is considered, the difference in overall
COP (or Energy Efficiency Ratio, EER) is not so great. Environmental
concern encourages developing more efficient absorption refrigeration
machines
Finding ways to improve absorption system efficiency has been a great
challenge for the researchers in recent years. Works was mainly focused on
inventing new or hybrid cycles, finding new working fluids and improving the
heat and mass transfer of the absorption refrigerator. In the following sections,
the past works on the absorption (or hybrid) cycles and working fluids are
reviewed. The terms 'desorber', 'generator' and 'concentrator' used in this
chapter are all referred to the concentration devices for the cycles.

2.1 THE ABSORPTION CYCLES
2.1.1 Single- and double-effect absorption cycles
Among the varieties of the absorption refrigeration cycles, the single-effect
and double-effect machines are the most popular and are commercially
available. The coefficient of performance of the lithium bromide-water
absorption machines, based on single- or double-effect cycles, typically varies
over the range 0.7< COP <1.2 for refrigeration temperature above 0°C.
Ammonia-water machines allow refrigeration temperature down to -77.7°C
but coefficient of performance is typically around 0.5 (Herold 1996).
The single or double-effect absorption cycles using water-LiBr as working
fluid are suitable to work at the solution temperature under 200°C. Above this
temperature, corrosion and crystallisation of the working fluid can be
problematic. If the solution temperature increases with the heat source
temperature, the solution concentration will increase. This makes the solution
become not only more corrosive to the construction material, but also
suspectable to crystallisation when it is cooling down through the solution heat
exchanger. If the solution temperature does not increase with the heat source
temperature, the second law efficiency of the cycle will decrease due to the
irreversible loss in heat transfer. In other words, the use of a high temperature
heat source, such as gas combustion products, to drive conventional single- or
double-effect absorption cycles is wasteful of energy. The research on
advanced cycles, for example, multi-stage, multi-effect absorption cycles, has
concentrated on reducing this waste.
2.12 Multi-stage, multi-effect absorption cycles
For high temperature heat sources, multi-effect absorption refrigeration cycles
have well-proven potential to attain a performance which is superior to the
performance of conventional cycles (Ziegler 1985, Alefeld 1983). The Four-
Pressure Triple-effect Cycle using water-lithium bromide was a natural
development from conventional double-effect cycles. This cycle has one more
high-pressure generator on top of the conventional double effect cycle, and the
8

vapour evolved from this generator is used to drive the double-effect cycle as
shown in Figure 2.1. Therefore, in this machine the input heat is recycled three
times to improve the efficiency. It was reported that the calculated COP for
this cycle is 1.645 (Herold 1996). Although the triple-effect absorption cycle
can reduce the energy loss for high temperature heat source, the corrosion will
be problematic for the machines using lithium bromide-water pair since this
cycle requires a high solution temperature. Special materials may be required
to prevent the corrosion in this case. However, this is a costly answer with
current technology. Some companies have tried to use other working fluids to
produce triple-effect chillers. Until now, there is no other form of triple-effect
cycles proposed for water-lithium bromide pair.
Heal transfer direction
SHX - Solution Heat Exchanger E - Evaporator C - Condenser
E -
TQ,
Cl i_Q.
Desorber
r sHxv
Absorber
T^ Figure 2.1 Cycle schematic for the triple-effect cycle
Previous work has shown that there are theoretically a large number of cycles
that fall into the category of "triple-effect". However, DeVault et al (1990)
indicated there were only three basic triple-effect cycles if by limiting the
cycles to air conditioning of buildings and by limiting the cycles to basic
combinations of cycles using standard evaporator, condenser, absorber and
generator components. Among the three cycles, only Two-stage, Triple-effect

cycle is suitable for using the ammonia-water pair as a_working fluid, which is
shown in Figure 2.2 (Alefeld 1983). Refering to Figure 2.2, while the
refrigerant NH3 from the high-pressure generator releases condensing heat to
the low-pressure generator, the heat from the high-temperature absorber is also
transferred to the low pressure generator. So, the input heat is used three times.
The calculated COP for this cycle is 1.41 (Herold 1996). This cycle was also
investigated theoretically by other researchers and its COP is in the range of
1.4 - 1.5 for a temperature lift of about 30°C (DeVault 1990, Ivester 1993,
Garimella 1994, Ziegler 1993). Garimella et al (1994) compared working
fluids NH3-H2O/NH3-H2O with NH3-H2O for the triple-effect cycle. In their
investigation, the NHj-NaSCN pair was used for the low-pressure sub-cycle in
the triple-effect cycle while the NHj-H^O was used for the high-pressure cycle.
They found that both working fluids are essentially indistinguishable in terms
of performance and temperature-pressure considerations, with the primary
difference being that the NaSCN cycle resulted in the same overall
performance without the use of a low cycle rectifier. Ivester and Shelton
(1996) also discussed the optimised evaporator and generator temperature for
this cycle. Their result shows that the COP of this cycle was 1.38 when the
generator temperature was 200°C, evaporator temperature 5°C and condenser
temperature 35°C.
- - • -Int. Heat Exchanger SHX - Solution Heat Exchanger E - Evaporator R - Rectifier C - Condenser
C2 R Desorber
Figure 2.2 Two-stage triple-effect ammonia-water system
10

The Two-stage, Triple-effect Ammonia cycle requires the generator to work at
high-pressure, which increases the manufacturing cost. Gopalnarayanan and
Radermacher (1996) reported a low-pressure triple-effect, ammonia-water
cycle for multiple application modes as shown in Figure 2.3 for cooling mode.
In this cycle, the high temperature desorber (Dl) works under the same
pressure as the low temperature desorber (D2). The cooling load is produced
from the evaporator (E) and the desorber (D3). They claimed that the major
advantages of this cycle over the Two-stage triple-effect cycle were a lower
operating pressure and temperature in the high-pressure generator and a
comparable COP. Their calculations indicate that the optimum COP of the
cycle in cooling mode with a pinch point temperature difference of 5°C and a
temperature lift from 5 - 35°C is of the order of 1.46. However, this cycle has
three different solution circuits. To obtain optimum COP, the concentrations
of the three solution circuits need to be controlled precisely, which is not easy
to achieve.
Triple-effect cycle can also be formed with two independent cycles using
different fluids. Inoue et al (1993) simulated such a triple-effect cycle which
used H20-LiBr for the low temperature sub-cycle and NH3-H2O for the high
temperature sub-cycle. The low temperature sub-cycle was driven by the heat
from high temperature cycle's absorber and condenser. Their simulation result
showed that the COP of 1.33-1.48 was achievable when the generator
temperature was above 205°C, the evaporator temperature was at 5°C, the
condenser and the absorber temperatures were in the range between 32°C and
42°C.
The triple-effect cycles generally require higher temperature heat source to
drive them. For triple-effect chillers, the solution temperature needs to reach
205-230°. For this reason, triple-effect chillers will most likely be direct-fired.
This presents significant challenges in the area of absorbent solution
chemistry, materials of construction, and component design. Yet, several
11

companies are now developing triple-effect chillers with targeted fuel-based
COP value of 1.4-1.5 (Burgett 1999).
SHX - solution heat exchanger
-> Int. Heat Exchanger A - absorber D - desorber C - condenser E - evaporator R - rectifier
Figure 2.3 Low pressure triple effect cycle - cooling mode
2.13 Generator-absorber heat exchange cycles (GAX)
While multi-effect absorption cycles deliver high efficiency, the configuration
of the cycles tends to be more complicated. In contrast to the multi-effect
cycles. Generator-absorber heat exchange (GAX) cycles provide potentially
high energy efficiency at single-stage configuration. This cycle was first
described by Altenkirch and patented in 1914 (Altenkirch 1914). A schematic
GAX cycle is shown in Figure 2.4. The potential high efficiency of the GAX
cycle has attracted a lot of recent interest. In a GAX cycle, absorber heat is
directly supplied to the desorber to generate refrigerant vapour, which results
in less heat input to the desorber and less rejected by the absorber. By careful
arrangement of the heat transfer between the absorber and the desorber, an
improved COP is achievable. It was reported that a 250 kW, gas-fired GAX
cycle was installed in a government building in Maastricht, The Netherlands
(Bassols 1994). This machine uses ammonia-water as a working fluid and
returned a seasonal average COP of 1.53.
12

The basic GAX cycle has a problem that the amount of heat provided by the
high temperature end of the absorber is less than the heat requirement of the
low temperature end of the desorber under most operation conditions. This
problem can be solved by increasing the mass flow rate in the high-
temperature end of the absorber only. This is accomplished with the so-called
branched GAX cycles as shown in Figure 2.5. A second solution pump is
used. The configuration with a second solution pump is termed the branched
GAX cycle (Herold 1991, Rane 1994). The performance improvement due to
the second pump is in the range of 5%.
There are many possible GAX cycle arrangements. Anand and Ericson (1999)
conceptualised and documented a total of 21 advanced GAX cycles for space
conditioning. Among these cycles, they recommended a SVX GAX cycle as
the most promising cycle which has COP improvement of at least 30% over
basic GAX and is independent of any unproven advances in pumping
technology.
^on
C
Qn Q„
Q. . Q .
Desorber
Absorber
Figure 2.4 Cycle schematic for GAX cycle
13

Absorber
Qe iQa
Figure 23 Branched GAX cycle
Zaltash and Grossman (1996) used their computer model to simulate a GAX
cycle with the binary working fluid NH3/H2O and the ternary fluid
NHj/HjO/LiBr. Their simulation results showed that with the ternary fluid
NH3/H20/LiBr at higher firing temperatures (greater than 204°C) the cycle
COP achieved was over 21% higher than that alternated with the binary
working fluid NHj/H^O. The presence of salt (LiBr) resulted in a significant
decrease in the rectifier duty. Their performance simulation results showed the
potential of using advanced cycles with advanced fluid mixtures (ternary or
quaternary mixtures).
Cheung et al (1996) reported their performance assessments of nine multi
stage absorption cycles which were classified into three groups: water-lithium
bromide cycles, ammonia-water absorption cycles and cascaded absorption
cycles. They suggested that the three-stage, triple-effect cycle for water-
lithium bromide group, GAX for ammonia-water group and single-stage.
14

water-LiBr cycle cascaded with a single-stage, ammonia-water cycle for the
cascaded group deserved further consideration.
The key problem for a GAX cycle is the heat transfer between the absorber
and the generator. The normal GAX configuration requires the use of two
pumps. The second pump is used to circulate a heat transfer fluid between the
absorber and the generator. If the second pump could be eliminated, a large
cost saving would be realised. Dence et al (1996) suggested positioning the
high temperature section of the absorber directly into the generator. To achieve
this, the generator and absorber must have similar temperature profiles.
Further, one has to assure that heat transfer between the absorber and the
generator must be matched precisely. They proposed a method to design such
a GAX heat exchanger.
2.1.4 Other absorption cycles
There are some other lithium bromide absorption cycles. The Half-Effect and
the resorption cycles are among them. The Half-effect cycle is suitable for
applications where the temperature of the available heat source is less than the
minimum necessary to fire a single-effect cycle. The resorption cycle,
however, has the potential of expanding the design options of water-lithium
bromide technology, i.e., a wider range of the solution concentration but the
COP of both cycles is low (Herold 1996).
2.2 HYBRID ABSORPTION CYCLES
While the research activities to improve the absorption system efficiency have
focused on the multi-stage, multi-effect absorption cycles, some researchers
have been working on combining other refrigeration cycles with absorption
cycles to achieve better energy performance. The majority of those reported
are the combination of the vapour-absorption and vapour-compression cycles.
This, perhaps, is the result of similarity between them. Either mechanical or
thermal compressors have been found in the combinations. A combination of
vapour-compression and absorption cycles, which is known as the sorption-
15

compression system, can be achieved in a number of ways (Morawetz 1989).
The basic sorption-compression cycle is shown in Figure 2.6. The refrigerant
vapour in this cycle is compressed by a mechanical compressor from the
desorber to the absorber. The cooling load is provided by the desorber while
the heat is supplied from the absorber. The sorption-compression cycles can
deliver higher energy efficiencies and have simple configurations but they
require mechanical work. Feldman et al (1998) reported an absorption
refrigerator based on the absorption-compression cycle but which used an
organometallic absorbent and hydrogen or nitrogen gas as a refrigerant. The
resulting value of COP for cooling was 3.06.
Cacciola et al. (1990) analysed an absorption heat pump using two
combinations of working fluids, NHj/HjO and KHO/H2O. Their cycle is
shown in Figure 2.7. This cycle reduced the highest system pressure and
avoided the need for a rectifier in the water/NHj system. Riffat et al (1994,
1996) reported a rotary absorption-recompression heat pump. In this novel
arrangement, a gas engine was used to drive a screw compressor which
compressed vapour evolved at the generator. In this machine, the evaporator,
absorber, condenser and generator assembly rotated at about 800 rpm. The
rotation of the assembly improved the heat and mass transfer condition in the
system, due to the thin and highly sheared liquid films caused by centrifugal
acceleration. The theoretical primary energy ratios for cooling were 1.96 with
working fluid H^O/LiBt and 1.3 with HjO/NaOH-KOH-CsOH. The
configuration of the system was quite complicated and the sealing was found
to be problematic.
16

Absorber
Restrictor Y ( / \ ) Compressor
Desorber
Figure 2.6 Absorption-compression cycle
Generator Condenser
Absorber
Pump
Solution Heat Exchanger
\l) A Restrictor Restrictor ]:
Compressor
O
Desorber
Figure 2.7 An absorption heat pump by Cacciola (1990)
Using an ejector as a compressor in absorption cycles is another way of
combining the vapour-absorption cycles with the vapour-compression cycles,
and this approach avoids the use of mechanical work. The ejector function in
the absorption cycles can be classified as three forms, i.e., to enhance the
evaporation process, to enhance the absorption process and to enhance the
concentration process. Kuhlenschmidt (1973) proposed a cycle that used an
ejector to entrain the vapour from the evaporator and discharged it to the
17

absorber as shown in Figure 2.8. In the cycle, the ejector was driven by the
vapour from the low-pressure generator of a double-effect absorption cycle.
This cycle increased the temperature lift and eliminated the need for a
condenser, but COP could not be improved. Neither theoretical nor
experimental results for this cycle are yet available. Chung et al. (1984) and
Chen (1988) used the returning solution (DMETE/R21 and DMETE/R22)
from the generator as a primary fluid to entrain the refrigerant vapour from the
evaporator. The mixture fluid was discharged into the absorber. Since this
arrangement allowed the absorber pressure to be higher than the evaporator
pressure, the circulation ratio of the solution could be reduced, therefore, COP
was improved. However, this system can only be operated using high-density
refrigerant vapour because a liquid driven ejector is not suitable for low-
density vapour such as water vapour as used in water-LiBr absorption cycles.
This cycle is shown in Figure 2.9.
Eames et al (1995) investigated an ejector-absorption cycle both theoretically
and experimentally. This cycle shown in Figure 2.10 consisted of two sub-
cycles: the steam ejector cycle and LiBr-water single effect absorption cycle.
The ejector cycle was driven by water vapour from the generator of the
absorption cycle. Because the steam ejector utilised the energy, otherwise lost
in a conventional absorption cycle, to enhance the vaporisation process in this
novel cycle, a higher COP was expected. The computer simulation of this
novel cycle was reported by Sun et al (1996). Experimental COP of this cycle
was reported in the range between 0.8 to 1.04 for 5°C cooling temperature
(1994). However, this cycle required the generator temperature of at least
200°C and this may result in increased corrosion rates which may be
problematic (Eames 1996).
Gu et al (1996) suggested a hybrid cycle that used two ejectors to entrain the
refrigerant vapour from the evaporator: one driven by returning solution from
the generator and another driven by the refrigerant vapour from the generator
as shown in Figure 2.11. This cycle was actually the combination of Chung et
18

al (1984), Chen (1988) and Eames (1995), but with R21-DMF as working
pairs. The calculated COP for this cycle was 0.651. No experimental results
were provided.
HP Generator
LP Generator
Solution Heat Exchangers
Ejector
Figure 2.8 An absorption refrigeration cycle proposed
by Kulenschimidt (1973)
Generator Condenser
Pump (O
Solution Heat Exchanger
Ejector
RestrictorX
Absorber evaporator
Figure 2.9 Ejector absorber cycle
19

Generator Condenser
SHX
iQ Pump
Absorber
Ejector
Restrictor
Evaporator
Figure 2.10 Combined ejector-absorption cycle
Generator
SHX
"TDQ Pumps
Storage
J E
Ejector
Condenser
Restrictor
Ejector Absorber
Evaporator
Figure 2.11 Two ejectors absorption cycle
20

2.3 THE WORKING FLUIDS
The efficiency of an absorption cycle is not only determined by the cycle
design, but also determined by the working fluid used in the cycle. Therefore,
the working fluid is an important subject in order to improve the efficiency of
absorption cycles. For absorption refrigerators, the following pairs are
frequently employed or discussed:
NH3/H2O
H20/H20-LiBr
CHjOH/CHjOH-salt solution
R22 (CHCIF2)/E181 or other organic solvent
R133a (CH2C1CF3)/ETFE
The criteria for working fluids for absorption systems have been discussed by
Alefeld et al (1994).
Among the working fluids, H20/H20-LiBr and NH3/NH3-H2O are the most
widely used in proprietory absorption refrigerators. This is because these two
working pairs have so far provided the best energy performance compared
with others. However, water-LiBr solution is corrosive at high temperatures
and crystallisation occurs at high concentrations. Water as the refrigerant also
freezes at sub-zero temperatures, which limits its applications. Although the
ammonia-water pair does not crystallise and can work at sub-zero temperature,
the volatility of water with ammonia and the high vapour pressure of the
solution results in increased complexity of construction and high cost.
Furthermore, the efficiency of the ammonia-water systems is lower than that
of LiBr-water system owing the need for rectification in the former.
In recent years, binary fluids have been studied in order to improve HjO-LiBr
and NH3-H2O working pairs. The aqueous solutions of LiBr can be used as an
absorber for NH3 (ammonia) or for CH3NH2 (methylamine). In this case, the
solution operation-zone is extended towards significantly higher generator
21

temperatures. For a given desorber temperature and pressure, the solution has
a higher ammonia (or methylamine) composition in relation to H2O content in
the liquid phase. This reduces the rectification requirements significantly.
Similar improvement can, in principle, be obtained for HjO/LiBr with HjO as
the working fluid. The crystallisation limit is moved to high temperature by
adding a second anti-freeze liquid, for example, glycol (Alefeld 1994).
Homma et al (1996) investigated a novel binary working fluid, LiBr+Lil-HiO,
for a double effect absorption cycle. Compared with LiBr-H20 pair, LiBr+Lil-
H2O working fluid could extend the crystallisation limit by 5°C and it was
predicted up to 12% higher thermal efficiency could be expected. The research
interest on the working fluids tended towards ternary and quaternary working
fluids (lyoki 1990), (lyoki 1993), (Kim 1995) and (Saravannan 1998).
Saravanan (1998) compared 16 working fluid combinations for a vapour-
absorption refrigeration system and concluded that H20-LiCl combination was
better from the cut-off temperature and circulation ratio point of view and the
H20-LiBr+LiCl+ZnCl2 combination was better from the coefficient of
performance and efficiency ratio point of view.
Lange et al (1999) reported their test results of Water-Lithium Chlorate (H2O-
LiCL03) in which they claimed that this working pair can increase COP by 5%
for heat pumps compared with H20-LiBr pair, no crystallisation and no severe
corrosion problems were found in first tests. This working pair also allowed
the absorber and the condenser to work at a higher temperature.
2.4 CONCLUSION
Recent research activity on absorption refrigeration shows that multi-stage,
multi-effect and GAX cycles have been considered as an effective way to
improve energy efficiency. Many multi-stage, multi-effect absorption cycles
have been proposed and investigated in past ten years although few have been
tested experimentally. The simulation results do favour these cycles, and
imply that the higher efficiency is possible by increasing the number of effects
22

and stages. However, more heat exchangers are required in these cycles, which
results in increased complexity and cost. From this point of view, a three-
stage, triple-effect cycle might be the most complicated one to be practically
realised. GAX cycles are similar to a single stage system and it has potential to
deliver better energy performance, however, it is not easy to implement the
heat transfer efficiently between the generator and absorber which is crucial to
GAX cycles. Most research on the advanced cycles has been carried out in
simulation methods and few experimental results are reported. So, there is
some way to go before many of the proposed advanced cycles can be
commercialised.
In general, higher COP carries with it the penalty of increased complexity and
therefore cost. Furthermore, the greater complexity generally causes a greater
sensitivity to approach temperature (the temperature difference occurring in
heat exchanger). Therefore, it is difficult to obtain higher COP by increasing
cycle stages and effects in practice.
Hybrid absorption cycles provide an altemative way to improve the energy
efficiency of absorption heat pumps. Since mechanical compressors require
high-grade energy (electrical or mechanical) to drive them, the hybrid
absorption cycles using mechanical compressors lose the ability to utilise low-
grade heat sources, which is the one of the most important features of the
absorption cycle. The rotary vapour re-compression cycle proposed by Riffat
(1994) can be driven by thermal energy at the cost of a gas fired engine and
the complexity of configuration. Therefore, the mechanical compressor
involved absorption cycles may only be suitable for particular applications.
Using the ejector in the absorption cycle improves cycle performance at low
cost, and simulation analysis and experimental results have shown
improvements in energy efficiency. The survey shows that the past research on
the ejector involved hybrid absorption cycles was focused on using ejectors,
driven by the refrigerant vapours or the solutions, to enhance the evaporating
23

process. While these cycles offered better energy efficiency, the corrosion and
crystallisation problems exists for the cycles using LiBr-H20 pair. Their
performance with high temperature heat sources is just as good as the
conventional single- or double-effect cycles. The cycle using an ejector to re-
compress the vapour from the generator to enhance desorption process, which
is to be investigated in this research project, is not found by this survey.
Although much effort has been made to find and improve working fluids for
vapour absorption systems, lithium bromide-water and water-ammonia pairs
are still the best in general use. Multi-component working fluids, such as
binary, ternary and quaternary solutions, can improve the performance of
absorption systems for particular applications, however, there is no evidence
that they will soon replace lithium bromide-water or water-ammonia working
pairs at this stage. For ejector hybrid absorption cycles, H20-LiBr pair is the
most suitable working fluid. This is because (a) water vapour (the refrigerant)
can be directly used as a working fluid of ejectors, which is flexible to the
cycle arrangement; (b) the construction of the hybrid absorption cycles using
H20-LiBr is simple; (c) it can deliver the best energy performance when
required cooling temperature is above 0°C.
24
CHAPTER 3
THEORETICAL STUDY OF THE EJECTOR
RE-COMPRESSION ABSORPTION CYCLE
In this chapter, the ejector re-compression cycle will be investigated
theoretically. This cycle uses an ejector to enhance the concentration process
in a conventional single-effect absorption cycle as has been described briefly
in Chapter 1. In order to understand the novel cycle, we start from the
conventional lithium bromide absorption cycles. After discussing the single
and double effect lithium bromide cycles, a mathematical model of the novel
cycle is developed. Since the steam ejector was a key component of the novel
cycle, mathematical modelling and designing of the ejector are discussed then.
The performance characteristics of the novel cycle are simulated from the two
mathematical models. This chapter will provide all the necessary knowledge
for further investigation of the novel refrigeration cycle.
3.1 LITHIUM BROMIDE ABSORPTION REFRIGERATION CYCLES
3.1.1 The thermodynamic cycles of the absorption refrigerators
An absorption cycle consists of two pairs of opposite processes that are
absorption-desorption and evaporation-condensation. The absorption-
desorption process takes place in the solution side, whose function is very
similar to the compressor in a vapour compression refrigerator, while the
evaporating-condensing process is carried out in the condenser-evaporator
system. Since the refrigerant in the absorption machine is compressed in
liquid, only a small amount of input energy is required for pumping it. With
the solution, most of the energy, however, is used to desorb the solution by
boiling. A single-effect lithium bromide absorption machine is schematically
shown in Figure 3.1 and its thermodynamic cycle is shown as in Figure 3.2. In
the single-effect absorption cycle, the diluted lithium bromide solution is
pumped back to the generator through a solution heat exchanger where it is
heated by the concentrated solution from the generator. The solution is then
boiled in the generator to desorb the water from the solution. The concentrated
solution flows back to the absorber to complete the solution cycle, while the
25

water vapour flows to the condenser and condenses there. Because the
concentrated solution has the chemical potential to absorb the water, it causes
the water to evaporate in the evaporator, which produces the cooling effect in
the evaporator.
Condenser Generator
a
Qe
m
Evaporator Absorber
Pump
Figure 3.1 Single-effect lithium bromide-water refrigeration system
A double-effect lithium bromide absorption cycle has a similar process to the
single-effect, except that there is a low pressure generator to use the
condensation heat from the water vapour otherwise wasted in the condenser in
order to further concentrate the solution. As a result, the energy efficiency is
improved.
26

Pre sur e
con
^^ Water path
^ Solution path
T T = T e a con
Tenperature
Figure 3.2 Thermodynamic cycle of single-effect lithium bromide refrigerator
3.12 Energy efficiency of the lithium bromide absorption reirigeration
cycle
The efficiency of a absorption refrigeration cycle is defined as the ratio of the
cooling power to the heat power input. It can be obtained by applying the mass
and energy balances to the refrigeration cycle. For a single-effect lithium
bromide absorption refrigeration cycle, it can be expressed as follow (Gosney
1982),
COP = S^ = h^ -h^
d (h,-h,)+x{h,-h,) (3.1)
where, X is the circulation factor which is the mass flow rate of the
concentrated solution to absorb unit mass flow rate of vapour from the
evaporator. It is determined by the two solution concentrations from the fact
that all the lithium bromide which enters with the strong solution leaves with
weak solution. Supposing unit mass flow rate from the evaporator, the flow
rates of the solutions are X, and (?^+l), and the mass balance for lithium
bromide gives:
^x^ = (A + l)xj
hence:
Xj
A = '— X, -X,
(3.2)
27

It should be noted that the power consumption of the pump and the heat loss
from the solution heat exchanger are not taken into account in Equation (3.1).
The circulation factor, k, is important to the energy efficiency of an absorption
cycle. The smaller the circulation factor, the higher the energy efficiency,
because the low circulation factor reduces power consumption on the pump
and solution heat effect in the absorption and desorption processes. The heat
rejected from the condenser can be expressed as Equation (3.3),
Qcon=^{hr-h2) (3.3)
where, hi and ^2 are the specific enthalpies of the vapour leaving the generator
and water in the condenser. This heat may be used to concentrate the solution
in a low pressure generator as it does in a double-effect cycle. A double-effect
lithium bromide absorption machine is shown as in Figure 3.3 and its
thermodynamic cycle is shown as in Figure 3.4.
Condenser
a
Evaporator
Pump
Figure 3.3 Double-effect lithium bromide absorption refrigeration cycle
The concentration process in a double-effect cycle takes place in the high and
low pressure generators as shown in Figure 3.3. In the double-effect cycle, the
solution is concentrated in the high-pressure, and then it is further
28

concentrated in the low pressure generator by using the condensation heat of
the vapour from the high-pressure generator which is otherwise rejected by the
condenser in a single-effect cycle. So, less heat is discharged into the
envirorunent from a double-effect cycle and its energy performance is better.
Since the vapour from the high-pressure generator has to meet the requirement
for concentrating the solution in the low-pressure generator, the minimum
temperature of a heat source for a double-effect cycle is higher than a single-
effect cycle. If the two concentration processes of a double-effect cycle in
Figure 3.3 are considered as a whole, as shown in the dash line square, the
energy balance for the concentration process can be written as follows,
Q =in^h^ +mfjh2 +mAhg ~m{A + iytj (3.4)
The mass balance for the refrigerant of the cycle requires,
m =mf^ +rh„ (3.5)
Substituting m^ of Equation (3.4) with (3.5), Equation (3.4) can be expressed
as follow,
Qg = rti(/z, -/ly) + rhX(h^ -h.,)-rh„{h^ -h^) (3.6)
If there is no heat loss in the heat exchanger, then the efficiency of the cycle is
COP = ^ = Kzh (3 7) Q, {h,-h,)^A(h,-h,)-a{h,-h,)
In Equation (3.7), a is the ratio of the mass flow rates of the refrigerant
generated by the high-pressure generator to the total refrigerant of the cycle,
i.e., a=m^ /m . The production of a(h\-h2) reflects the energy recovered by
the low-pressure concentrarion process. It is obvious that the double-effect
cycle is more efficient than the single-effect one by comparing Equation (3.7)
for the double-effect cycle with Equation (3.1) for the single-effect cycle. The
value of rhf^ can be determined from the mass balance of the solution cycle.
29

-* Water path
Solution path
T T = T e a con
Temperature
Figure 3.4 Thermodynamic cycle of double effect
lithium bromide refrigerator
3.2 THE EJECTOR RE-COMPRESSION ABSORPTION CYCLE
The ejector re-compression absorption cycle is similar to the conventional
single-effect lithium bromide absorption cycle which was discussed in section
3.1. The difference between them is that there is a steam ejector in this novel
cycle for enhancing the concentration process. Because of the use of the steam
ejector in the cycle, the performance and the operating characteristics of the
novel cycle are therefore different from the conventional cycle, which are
discussed in this section.
32.1 Description of the cycle
The ejector re-compression absorption cycle is shown schematically in Figure
35. Referring Figure 3.5, the expansion of the high-pressure steam causes a
low pressure at the exit of the primary nozzle of the steam ejector, therefore,
the vapour at point 8 in the concentrator is entrained by the primary flow. The
two streams are mixed in the steam ejector and condensed in the heat
exchanger of the concentrator. The condensation heat is used to heat the
solution in the concentrator. Obviously, the heat of the entrained vapour is
recovered by the steam ejector in this process. Water at point 3 splits into two
streams, one flows back to the steam generator and other flows into condenser.
In the stable operation, the mass flow rate of the first stream equals to that of
30

primary flow while the mass flow rate of the second stream equals to that of
the entrained vapour. The rest part of the cycle is similar to that of the
conventional single-effect lithium bromide absorption cycle
n EJECTOR
m-,
CONCENTRATOR
_im
^Afiftafc:
w,
m^ CONDENSER
8 J
SOLUTION. PUMP
4-RESTRICTOR
SOLUTION HEAT EXCHANGER
10
RESTRICTOR
6 | ,; ABSORBER EVAPORATOR
STEAM GENERATOR 1
WATER PUMP
RESTRICTOR
_ ^ e ^
Figure 3.5 The novel refrigeration cycle
Figure 3.6 shows the novel cycle on P-T-C diagram. Referring to Figure 3.6,
the cycle 6-7-9-10-6 takes up water at the absorber (10-6) and releases it as
vapour at the concentrator (7-9). In the conventional absorption cycle, the
vapour is condensed at 8' and the condensation heat is rejected to the
surroundings. In the novel cycle, this vapour undergoes a compression process
through the ejector to point 2. Since the vapour temperature is greater than the
solution temperature in the concentrator, this vapour is used to heat the
solution by condensation to point 3. Therefore the heat otherwise wasted is
recovered and the energy efficiency is improved. The ejector process on T-s
chart is shown in Figure 3.7. In Figure 3.7, the process from points 3 to 5 takes
place in the expansion valve and the evaporator while the process from points
31

5 to 8 is the absorption and desorption of the refrigerant, which takes place in
the solution cycle. Points la and lb are the states of the steam at the exit of the
primary nozzle and in the mixing area of the steam ejector while point lb to
point 2' is an ideal compression process. The temperature difference between
the T3 and Tg in the Figure 3.6 is required for the heat transfer between the
steam exit from the ejector and the solution in the concentrator.
Figure 3.6 Ejector re-compression absorption refrigeration cycle
on P-T-C chart
Figure 3.7 Ejector re-compression process
32

322 Theoretical cooling efficiency of the cycle
Using the state-point information in Figures 3.5, 3,6 and 3.7 and the mass and
energy balance, we can theoretically analyse the cycle's energy efficiency.
This analysis assumes that the cycle is in steady-state operation and the ejector
entrairunent ratio is known.
In order to understand the flows in the concentrator clearly, a schematic
diagram of the concentrator is shown in Figure 3.8. It consists of a steam
ejector and heating tubes in a sealed glass vessel which is separated into two
chambers. The steam ejector sits in the smaller chamber, termed 'ejector
housing', while the heating tubes are placed in the larger 'solution chamber'.
The chambers are cormected by a passage which allows vapour to flow
between them. To prevent the droplets of lithium bromide solution from
entering the ejector housing, a baffle is positioned in the vapour passage. At
the right end of the vessel, there are three outlets: one for the vapour at the top
for the vapour to flow to the condenser, the second for the strong solution to
return to the absorber and the third at the bottom for discharging the
condensed water. The condensed water is then separated into two streams at
the outlet: one is pumped back to the boiler, and the other flows to the
condenser. The flow rates of two streams can be determined from the mass
balance. An inlet is provided at this end for the weak solution retuming from
the absorber. The high-pressure steam inlet is at the left-hand end of the
concentrator. The heating tubing is placed in the solution chamber in such a
way that it can minimise the solution level required to cover the tubes to
reduce the gravity influence to boiling. The flow rate of the vapour entrained
by the steam ejector is shown as rii^, which is the part of the total vapour flow
rate m^j. evolved from the solution chamber.
33

EJECTOR HOUSING SOLUTION CHAMBER
DIFFUSER Vapour Out
Solution In
Solution Out
Condensed Water
Pressure in solution chamber
1 2 3 4 5
Figure 3.8 Structure and pressure profile of the concentrator
For the mass flow rate, rhg, entrained by ejector from the vapour evolved from
the solution, we can obtain from the definition of the entraimnent ratio.
/Wg =m^w
where, w is the ejector entrainment and m, is the motive steam flow rate. By
mass balance, the mixed steam flow rate m2is as follow,
^ 2 = m, + mg = Wj (l + w) (3.8)
Applying an energy balance to the heat transfer process taking place at the
concentrator, the heat released by condensation of the mixed flow m^ in the
process 2-3 should equal that required to evaporate the refrigerant, mg . ,from
its solution at the concentrator. It can be expressed as follow.
m K{h2-hi) = rh I
ST h^ + X^ XJ
-K-X ^ Ji A
•hy (3.9)
Subsdtuting Equation (3.8) for W2then,
m,(l + w)(h2-h,) = rh^j
therefore.
h^+-X^ XJ X„ XJ
•h, (3.10)
34

/Wgj. = m,(l + wXh2-h,)
(3.11)
X^ Xj X^ Xj -h.
Equation (3.11) gives the refrigerant mass flow rate evolved at the
concentrator and shows it is a function of the ejector primary flow (m,) and
the entraimnent ratio (w), the states of absorbent, h? and hg, in the concentrator
and the difference of the specific enthalpy, (h2-h3).
Since the quantity of de-sorbed refrigerant must equal that taken into solution
at the absorber, (during steady-state operation), we can use the refrigerant
flow, mg.T, to the calculate cooling rate at the evaporator.
^1(1 + ^X^2-^3X^5-^4) Qe =^8j(K-K) =
K+^^ (3.12)
-"-c ^d ^c ^d
The input heat, Q^^ = nl.^{h•^ -h^), and therefore,
{l + wXh2-hJh,-h,) COP = ^ = (3.13)
{h,-h,) h„ + X. -x^
-/I9 -X^ A J
-h.
Equation (3.13) gives the energy efficiency of the novel cycle. If we use the
circulation factor, A, defined in Equation (3.2) to replace the concentrations
of Equation (3.13) and ignore the energy loss in the solution heat exchanger,
the energy efficiency of the novel cycle becomes Equation (3.14),
/?5 -h^ cop_Q^ _{^ + ^lK-K) Qin K-K K-h(, + ^{h,o-K)
(3.14)
In the right-hand of the equation, there are two items. The first one termed
'enhancement factor' describes the improvement of the energy efficiency due
to using the steam ejector. The second is the energy efficiency of the
conventional single-effect cycle, which has been shown in Equation (3.1).
Therefore, the novel cycle is virtually a single effect cycle but its COP is
enhanced by the steam ejector according to Equation (3.14).
35

323 Enhancement factor
The 'enhancement factor' can also be written in following form, which
provides more clearly a physical meaning,
^ = ^ ^ ( l + w) (3.15) n, - H j
The ratio, (h2-h3)/(hi-h3), is the fraction of the input energy that can be used to
heat the solution and it has the relationship with the ratio, (hi-h2)/(hi-h3), as
follow,
2 -^3 ^i_fh ~h
where, the ratio, (hi-h2)/(hi-h3), indicates the fraction of the input energy that
is used to entrain the vapour from the solution chamber into the copper tubes
by the steam ejector. For the best energy performance, it is desirable to get the
maximum w for the minimum (h]-h2)/(hi-h3). Obviously, the ejector has a
strong influence on the performance of the novel cycle. Therefore, it is
necessary to discuss the ejector performance in order to understand the
behaviour of the novel cycle.
3.3 THE PERFORMANCE CHARACTERISTICS OF
EJECTOR AND ITS MODELLING
In the section 3.2, it was found that the ejector has a strong influence to the
enhancement ratio, e. This means that the improvement of the energy
efficiency of the novel cycle largely depends on the ejector performance. In
this section, the performance characteristics and the factors that affect the
performance are theoretically discussed.
33.1 Operation of an ejector
Ejectors are fluidic pumps that use the kinetic energy of a primary fluid to
pump a secondary fluid. There are different types of ejectors in use. For this
research purpose, only the supersonic steam ejector is considered. A steam
ejector consists of a convergent-divergent nozzle and a diffuser. Figure 3.9
shows a schematic construction of a supersonic ejector. In operation, high-
pressure steam, coming from a steam generator, is accelerated to supersonic
36

velocity through the convergent-divergent nozzle. As this high velocity jet
emerges from the nozzle it entrains a secondary vapour steam and mixes with
the entrained flow at the convergent section of the diffuser. The supersonic
mixing flow is slowed down in the convergent section and undergoes a
thermodynamic shock at the throat section of the diffuser, where it becomes
subsonic flow. The flow is decelerated in the divergent section of diffuser until
its pressure equals the back-pressure. This is the process where an ejector
pumps a flow from low pressure to high pressure, also called compression
process for the secondary flow, because its density is increased in the process.
In the process, the primary flow is a driving flow and the secondary is a driven
flow. Naturally, the ratio of secondary mass flow to primary mass flow or the
entrainment ratio reflects the ejector efficiency. In practice, this is one of the
specifications of an ejector. Similarly, the description of the performance for a
compressor, a pressure ratio of the back-pressure to the secondary pressure,
Ns, is used to describe the pressure lifting ability of the ejector. The
entrairunent ratio and the secondary pressure ratio describe the pumping
characteristic of an ejector. The effect of the driving flow to the pumping
characteristic is described by the primary pressure ratio, Np, defined as the
ratio of the primary pressure, Pp, to the back-pressure, Pb. The entrairunent
ratio, w, the secondary pressure ratio, Ns, and the primary pressure ratio, Np,
complete the description of performance of an ejector. Their relationship will
be discussed later.
Primary nozzle Diffuser
Primary flow
Mixed flow
secondary flow
Mixing section
1 2
Diffusion section
Figure 3.9 Schematic diagram of ejector
37

33.2 Performance characteristics of ejector
The entrainment ratio and the pressure lift ratio of a ejector are determined by
the stagnation pressure of the motive flow, the stagnant pressure of secondary
flow and the back-pressure. In general, the entrainment ratio can be
represented functionally by:
(3.16)
i.e., it is dependent on the stagnation pressure and back-pressure ratios. This
relationship can also be represented in three dimension surfaces shown as
Figure 3.10 (Addy et al, 1981).
Break-off curve
Ptj/Ptp - dependent
Pb/Ptp
Figure 3.10 Performance characteristics of ejector
The three dimension surfaces consist of 'Supersonic regime', 'Saturated
supersonic regime' and Mixed regime' and they are separated by so-called
'Break-off curves shown as Figure 3.10. If the Mach number at the minimum
flow area is unity, the ejector operates in either 'Supersonic regime' or
'Saturated supersonic regime', but if this Mach number is less than unity the
ejector operates in 'Mixed regime'. The line a-b-c in Figure 3.10 forms a
'Break-off curve' which separates 'Mixed regime' from 'Supersonic' and
'Saturated supersonic' regimes. On the left of the curve, the entrainment ratio
is independent of the pressure ratio Pb/Ptp and is constant when the pressure
38

ratio Pts/Ptp is fixed. But it becomes Pb/Ptp dependent when Pb/Ptp falls into the
right side of the curve and drops down dramatically for any increase of the
ratio. The entrainment ratio will drop to zero when the pressure ratio Pb/Ptp
reaches to the curve a-d and the ejector has lost its function. The back-pressure
Pb at Break-off curve is called the critical pressure.
For efficient use of energy, it is desirable to let the ejector work at as close as
possible to the left side of the Break-off curve. However, this is also an
unstable condition, because any interruption to the pressure ratio Pb/Ptp will
cause the entrairunent ratio to drop down dramatically if it moves the pressure
ratio to the right side of the curve. So, this factor must be taken into account
when determining the pressure ratio Pb/Ptp.
When the ejector operates on the surfaces at the left of Break-off curve, the
entraimnent ratio is independent of the ratio of back-pressure to motive
pressure. At these surfaces, the entrairmient ratio increases as the pressure
ratio Pts/Ptp increases.
3 3 3 One-dimensional analysis
The purpose of this analysis is to determine the entrainment ratio of a
supersonic ejector given a particular maximum required pressure lift and then,
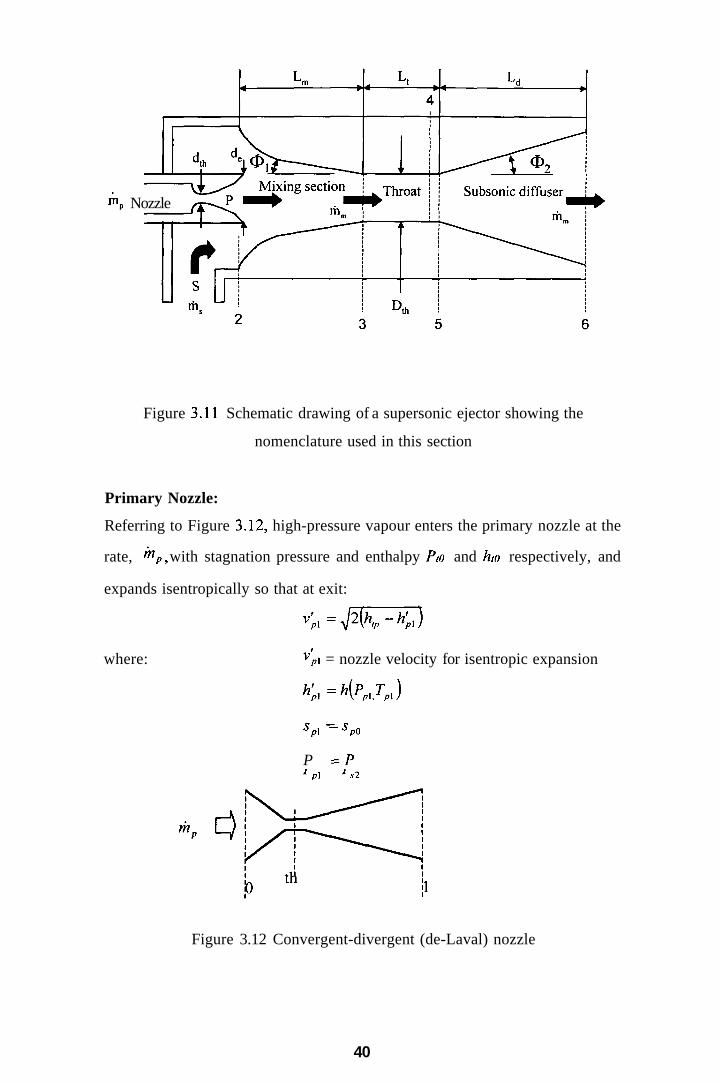
if required, the dimension of critical flow passages. Figure 3.11 is the
schematic drawing of a supersonic ejector showing the nomenclature used in
this section.
39
•"p Nozzle
Figure 3.11 Schematic drawing of a supersonic ejector showing the
nomenclature used in this section
Primary Nozzle:
Referring to Figure 3.12, high-pressure vapour enters the primary nozzle at the
rate, '^p, with stagnation pressure and enthalpy Pto and hio respectively, and
expands isentropically so that at exit:
where: ^p\ = nozzle velocity for isentropic expansion
^p\ - ^pO
P = P - ' p i •'.?2
Figure 3.12 Convergent-divergent (de-Laval) nozzle
40

In practice, fluid friction reduces the flow velocity. To account for this an
isentropic efficient factor is introduced:
VN = K-hp, _Vpi
From which the actual nozzle velocity is given:
Vp, = ^^^n^^K^K^ (3.17)
Typical values of rj^ lay between 0.97 and 0.99, (ESDU 1986).
Mixing section:
For simplicity, in this section the primary and secondary fluids are assumed to
be dry saturated or superheated vapours of the same species.
Ps nis ^2
Pn "^P ^1 P , ^ 3 ^3
Figure 3.13 Detail of the entrainment model
Referring to Figure 3.13, assuming the walls of the mixing section offer no
frictional resistance to the flow, and applying Newton's second law of motion
to the control volume yields:
YF =fAdP = m„v, -rh^v, -rh^v^ (3.18)
The solution of Equation (3.18) is complicated by the integration on the left-
hand-side. To make this amenable to analytical solution it is usual to assume
that either the flow area (A) remains constant (i.e. a constant area design) or
the static pressure (P) remains constant and therefore, dP = 0. In the present
case, for super-sonic ejectors with high secondary pressure ratio, (Pb/Ps), it is
usual to apply the later assumption; i.e., that the static pressure is constant
41

throughout the entrainment region. Experimentally this has been shown to
produce designs which produce pressure lifts and entrainment values closer to
those predicted using the constant area assumption. Thus, assuming dP = 0,
Equation (3.18) reduces on rearrangement to:
< ^ 3 =^/ ,^ i+^.^2 (3.19)
From mass flow continuity: m„ = ^p + /h^ (3.20)
Defining entrairunent ratio: w = —- (3.21)
Substituting (3.20) and (3.21) into (3.19) yields on rearrangement:
v ; . ^ ^ P 2 2 ) l + w
In the present case, the velocity of the primary flow will be at least two order
of magnitude greater than that of the secondary flow. In other words vz « vi
and in which case, from (3.22) we can write;
v ; = - ^ (3.23) 1 + w
An effect of fluid friction at the wall of the mixing section will be to reduce
the mixed flow velocity. The effect of wall friction can be accounted for by
introducing a momentum loss coefficient, ^;;,:
y,=Ky,=^ (3.24) 1 + w
Typical values ofK^ lay between 0.85 and 0.9, (ESDU 1986).
The stagnation enthalpy at the end of the mixing section can be determined by
applying the steady flow energy equation across the volume in Figure 3.13.
Assuming neither heat nor work transfer occur, then;
m,h,j=m^h,p+mX (3-25)
Substituting (3.20) and then (3.21) into (3.25) and rearranging the result gives,
h,p + wh,.
1 + w
Applying the steady flow energy equation within the diffuser throat yields,
/i,3=ft3+f- (3.27)
h,3=—. (3-26)
42

Thermodynamic shock process:
At the design-point, it is assumed that a normal shock process occurs at the
end of the diffuser throat, between state-point (4) and (5) in Figure 3.11.
Because the process occurs over a very short distance, it can be assumed to be
adiabatic but never isentropic, and also the flow area can be assumed constant.
Therefore, from mass flow continuity:
Ps^s = P4V4 = P3V3 (3.28)
Note that if frictionless flow is assumed over the length of the diffuser throat
then also,
V4 = V3 and P4 = P3
From the steady flow energy equation and noting that h4=h3,
/^5+Y = ^ 4 + y = / ,3 (3.29)
Applying the momentum conservation principle across the shock and noting
that P4 = P3 = P2 for a constant static pressure entrainment without wall
friction, then;
PS^P^S-PI+PA (3-30)
When determining P2, it is usual to recognise a loss in total pressure in the
secondary flow between the entry to suction pipe and the mixing section. This
effect is normally accounted for by introducing a secondary flow total pressure
loss coefficient:
r],=~ where 0.95 s 7, s 1, (ESDU 1986). IS
If the Mach number of the secondary flow, as it enters the mixing region, is
less than 0.1 then we may assume it to be incompressible (p = constant) and
the static pressure P2 is given by Bernoulli's equation:
2 2
P2 = P.2 - P2Y = rfsP. - PsY
Substituting this result into Equation (3.30) and noting that v^ «v^ yields:
Ps + Ps^s = rjsP. + Py. (3-31)
The total pressure at state-point 5, down stream of the shock, is determined by
compressing the flow isentropically from P5, hs to hi5:
43

5
i^3=P5+/(/^-^/^Lco..a„. (3.32) (5
Sub-sonic diffuser section:
It is usual to recognise that there will be a loss in total pressure through the
diffuser and this is normally accounted for by introducing a diffuser pressure
recovery coefficient:
7]d =— where 0.9 ^TJ^ ^ 0.96, (ESDU 1986). Pl5
Noting that V6 will usually be small (M„ < 0.1), then from Bernoulli's equation
the maximum back-pressure an ejector can overcome will be,
Pe-^dP,s-^ (3-33)
The density, p6, can be determined from Pg and ho- The latter is given by
applying the steady flow energy equation:
^ 6 = ^ 5 + ^ ^ = / ' , 3 - f (3-34)
Thermodynamic properties
P, V, T, h and 5 data are required to solve (3.17) to (3.34). If the reduced
temperature (TITcru) of a gas or vapour is greater than 2 and its reduced
pressure (PIPc) is less than 0.1, then it can be usually assumed that its
thermodynamic behaviour will be similar to that of an ideal gas:
Pv=RT (3.35)
And h = CpT (336)
Where the specific heat value, Cp = constant.
Isentropic expansion and compression of an ideal gas obeys the isentropic law;
Pv^ = constant (337)
III P ''
Combining (3.35) and (3.37) gives; constant (3.38)
Where the isentropic index, 7 = Cp/Cv = constant in this case.
44

If a gas or vapour is assumed to be semi-perfect (sometimes referred to as
thermally perfect and calorically imperfect) then the ideal gas equation of state
in (3.35) still applies, but the specific heat values are taken to be functions of
temperature (only):
h-K,f = jC^iT)dT (3.39)
where C r r ) = fl+Z)r+cr'+f/r'+-^ (3.40)
The isentropic index (/) in this case is also a function of temperature. The
simplest method of dealing with this problem is to assume,
1 ^ C,(J)
A more accurate solution may be determined by calculating /using (3.37) at
both ends of the process and using the arithmetic average. A still better
average value may be obtained by combining the first and second laws of
thermodynamics for an open system, and assuming the fluid to be taken as an
ideal gas yields:
ds^C„—-R— (3.42) " T P
Substituting Equation (3.40) and noting that ds = 0 for an isentropic process,
integrating (3.42) gives:
in(f)4{«in(|).6(r,-r).|(r/-r').f(r/-r)-i 'J—J-
(3.43)
If it is assumed that the vapour expands isentropically across a nozzle from
known values of P, and T, to a given static pressure P, the value of static
temperature (T) which satisfies Equation (3.43) must be determined
iteratively. Once this value has been calculated the mean isentropic index may
be determined:
y = ^- (3.44)
^ ^ in ( r , / r )
HP, IP)
45
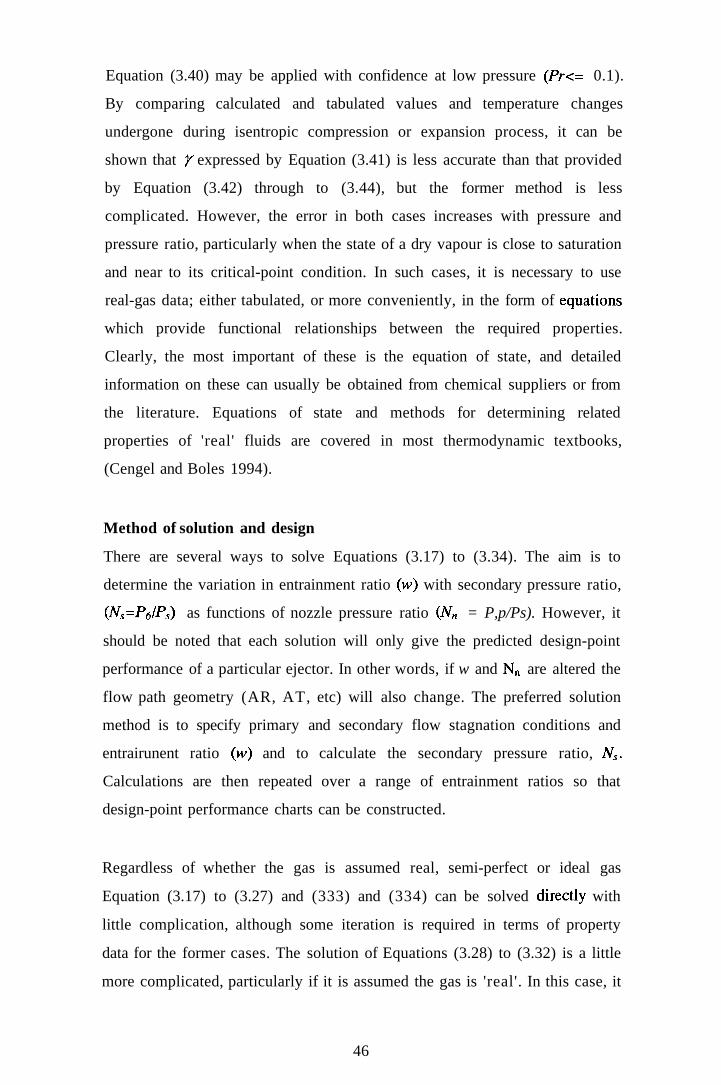
Equation (3.40) may be applied with confidence at low pressure {Pr<= 0.1).
By comparing calculated and tabulated values and temperature changes
undergone during isentropic compression or expansion process, it can be
shown that 7 expressed by Equation (3.41) is less accurate than that provided
by Equation (3.42) through to (3.44), but the former method is less
complicated. However, the error in both cases increases with pressure and
pressure ratio, particularly when the state of a dry vapour is close to saturation
and near to its critical-point condition. In such cases, it is necessary to use
real-gas data; either tabulated, or more conveniently, in the form of equarions
which provide functional relationships between the required properties.
Clearly, the most important of these is the equation of state, and detailed
information on these can usually be obtained from chemical suppliers or from
the literature. Equations of state and methods for determining related
properties of 'real' fluids are covered in most thermodynamic textbooks,
(Cengel and Boles 1994).
Method of solution and design
There are several ways to solve Equations (3.17) to (3.34). The aim is to
determine the variation in entrainment ratio (w) with secondary pressure ratio,
(Ns=P6/Ps) as functions of nozzle pressure ratio iN„ = P,p/Ps). However, it
should be noted that each solution will only give the predicted design-point
performance of a particular ejector. In other words, if w and Nn are altered the
flow path geometry (AR, AT, etc) will also change. The preferred solution
method is to specify primary and secondary flow stagnation conditions and
entrairunent ratio (w) and to calculate the secondary pressure ratio, Ns.
Calculations are then repeated over a range of entrainment ratios so that
design-point performance charts can be constructed.
Regardless of whether the gas is assumed real, semi-perfect or ideal gas
Equation (3.17) to (3.27) and (333) and (334) can be solved direcfly with
little complication, although some iteration is required in terms of property
data for the former cases. The solution of Equations (3.28) to (3.32) is a little
more complicated, particularly if it is assumed the gas is 'real'. In this case, it
46
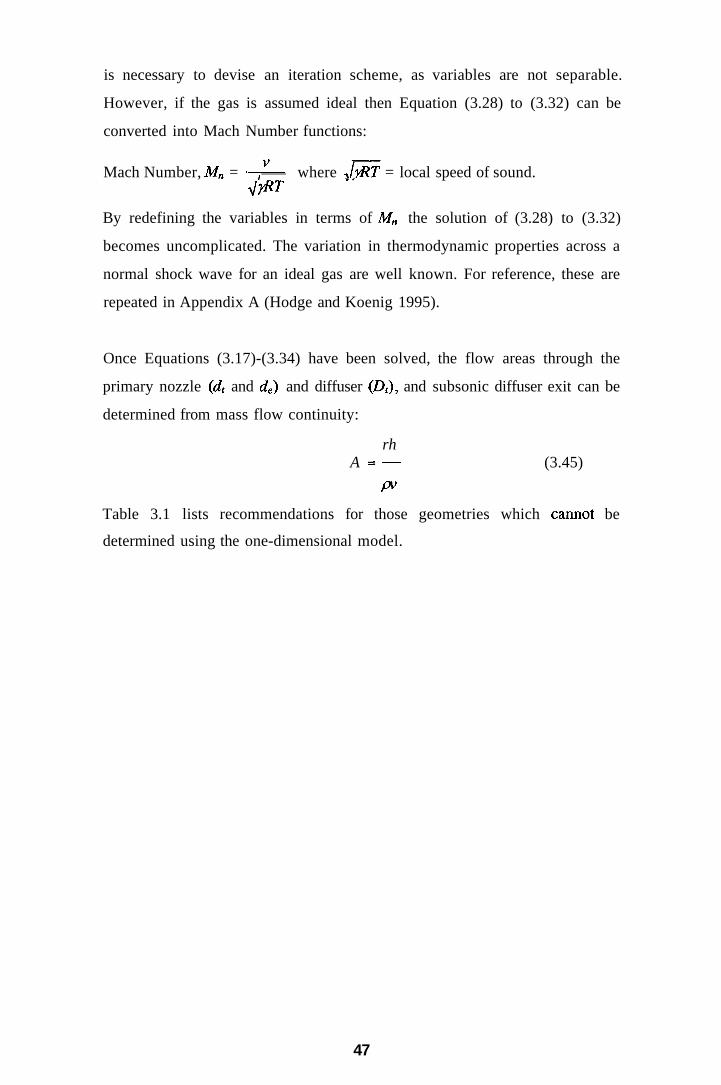
is necessary to devise an iteration scheme, as variables are not separable.
However, if the gas is assumed ideal then Equation (3.28) to (3.32) can be
converted into Mach Number functions:
Mach Number, M„ = • , ' where JyRT = local speed of sound.
By redefining the variables in terms of M„ the solution of (3.28) to (3.32)
becomes uncomplicated. The variation in thermodynamic properties across a
normal shock wave for an ideal gas are well known. For reference, these are
repeated in Appendix A (Hodge and Koenig 1995).
Once Equations (3.17)-(3.34) have been solved, the flow areas through the
primary nozzle (dt and de) and diffuser (D,), and subsonic diffuser exit can be
determined from mass flow continuity:
rh A = — (3.45)
A-
Table 3.1 lists recommendations for those geometries which carmot be
determined using the one-dimensional model.
47

Table 3.1: Recommended ejector geometrical
(1986). (Refer to Figure 3.11 for
features taken from ESDU
nomenclature)
Dimension
Primary nozzle conical
divergent expansion tube
included angle
Velocity of steam entering
at primary nozzle
Radius of convergent
steam entry region within
primary nozzle
(1)1
Radius of entry region to
the mixing section
'-m
u h
Diffuser exit diameter, Dc
Recommendation
10°
50 m-s"'
03d,h
2° -10°
ID
5 to 10 D
2 t o 4 D
3° to 4°
<2 .4D
Comments
The primary nozzle
discharge orifice should have
a sharp lip
Maximum value
Minimum value
If a conical inlet to mixing
chamber is used then this
should be have an included
angle of 20° to 40°
ESDU recommend that the
entry region should consist
of a generous bell-mouth.
The ID given here is
suggested by the authors
Measured from the exit plane
of the constant area section
(diffuser throat)
Not great than 7°
Ld is determined from ({>2 and
Dc, however, from the
authors experience Ld is
usually set at 7 D
48

3.4 SIMULATION MODEL OF THE NOVEL CYCLE
The COP of the novel cycle can be determined from Equation (3.14) and the
entrainment ratio, which is necessary for Equation (3.14), can be determined
from Equations for the steam ejector in the section 3.3.3. So, the simulation of
the novel cycle can be performed by computing those equations.
3.4.1 The variables used in the simulation
In the simulation, the external conditions are as follows.
Steam temperature, X^
Condenser temperature, °C
Absorber temperature, 'C
Evaporator temperature, °C
Required cooling capacity, kW.
The internal parameters include:
Mass concentrations of the solution, %
Solution temperature of the concentrator, °C
Steam temperature in the concentrator, °C
h -h Efficiency of the solution heat exchanger, T] = -^ , where ho is the
enthalpy of weak solution leaving the solution heat exchanger, h^ and hg
are the solution enthalpy in the absorber and the concentrator
respectively.
3.42 The properties of working fluids
Equations describing steam properties were taken from Irvine et al (1984).
However, because the vapour pressure in the ejector is low, it was assumed
that water vapour behaved like an ideal gas. The properties of lithium bromide
solutions were calculated from the correlations provided by ASHRAE (1993),
Lee et al (1990), Patterson et al (1988) and Hellmann (1996).
49

3.43 The method of the simulation
In the simulation, the ejector entraimnent ratio was determined from its
operating conditions: the state of the motive flow was obtained from its
temperature, assuming that the steam was drysaturated. The condition of the
secondary flow was determined from temperature and solution concentration
in the concentrator (the vapour was superheated); and the back-pressure of the
ejector was determined from the state of the mixed steam in the concentrator
(the condensing temperature of the mixed steam). From these conditions, the
entrainment ratio was determined. Once this was obtained, the calculation of
the COP was straightforward. The simulation model was programmed using
Microsoft Excel and Visual basic.
3.5 FACTORS AFFECTING THE PERFORMANCE
OF THE NOVEL CYCLE AND COP PREDICTION
The computer simulation model was used to exam the factors which effect the
performance of the novel cycle. However, attention here was paid only to
those effects which are particular to the novel cycle. For brevity, those effects
common with conventional absorption cycle refrigeration are not included
because they are fully covered in several textbooks including Gosney (1985)
and Stoecker (1982).
3.5.1 Effect of the solution states to enhancement factor
From the discussions in Sections 3.2 and 3.3, the solution concentration, Xc,
and temperature, Ts, were found to effect the enhancement factor (E) in
Equation (3.15). This is thought to because the solution state determines the
operating condition of the steam ejector. In this particular application, the
suction and the discharge conditions of the steam ejector are linked by the
state of the lithium-bromide solution in the concentrator, i.e., the vapour
pressure of the solution is the ejector secondary flow pressure while the
solution temperature determines the ejector back-pressure. So, any change in
the solution condition will effect the entrainment ratio of the ejector. Table 3.2
lists some typical theoretical results.
50

Table 3.2 Ejector Entrainment Ratio at different solution condition
Solution temperature
70 °C 75 °C 80 °C
fote: The motive steam
Solution Concentration, %
55 56 57 58 59 60
Entrainment ratio
0.4533 0.4364 0.4196
0395 0382 0367
0344 0.332 0319
was assumed to be at :
0.296 0.285 0.274
0.255 0.243 0.233
0.2332 0.2037 0.1951
5 bar and the mixed flo\
temperature equalled the solution temperature.
The results in Table 3.2 suggest that the solution concentration affects
entrainment ratio more than its temperature does. Keeping the solution at low
concentration will allow the steam ejector operate more efficienUy. It should
be noted that these calculated results are based on the ejector design conditions
and do not represent an ejector's off-design performance. The enhancement
factor has a similar characteristic to the entrairunent ratio, as shown in Table
3.3 and Figure 3.14.
Table 3.3 Enhancement factor varied with the solution condition
Solution temperature
70 °C 75 °C 80 °C
Solution Concentration, %
55 56 57 58 59 60
Enhancement factor
1.35 1.34 1.33
1.303 1.295 1.285
1.255 1.248 1.239
1.210 1.204 1.198
1.173 1.164 1.159
1.131 1.127 1.123
Compared with entrainment ratio, enhancement factor is less affected by the
variation of the solution temperature and concentration, but the trend is
similar. So, solution concentration should be kept as low as possible to achieve
a greatest enhancement factor. However, this will result in low efficiency for
the absorption cycle as has been discussed in previous chapter.
51

1.40
concentration, %
Figure 3.14 Enhancement factor variation with the solution states
3S2 Effect of the temperature difference between the solution and steam
The results in Table 3.2 and 3.3 were based on the assumption that there was
no temperature difference between the two sides of the heating tubes in the
concentrator vessel in Figure 3.8. However, in practice, a temperature
difference will exist and this will increase the back-pressure (Pback) to the
vapour pressure (Pvapour) ratio. Ejector entrainment ratio will, therefore,
decrease and so accordingly will the enhancement factor. The theoretical
results indicated that the reduction of the enhancement factor due to the
temperature difference is larger at low solution concentrations than at higher
values and is proportional to temperature difference, as shown in Figure 3.15.
In this figure, the percentage loss of entrainment ratios was referred to their
entrainment ratios at zero temperature difference between two sides of the
tubes in the concentrator. This is to say that the loss of entrainment ratio at zero
temperature difference is naught.
52

12
10- -
o ts
a> E c
c 0) o (0 (0 o
solution concentration
- •—55%
-•—56%
-A—57%
^(—58%
- * - 5 9 %
-«—60%
1 2 3 Temperature difference (°C)
Figure 3.15 The influence of temperature difference to entrainment ratio
3.5.3 COP predictions
The coefficient of performance was calculated by assuming the following
conditions:
a. Condensing and absorption temperatures were at 30°C,
b. Evaporating temperature was at 5°C,
c. The heat source was steam at 198.3 °C @ 15 bar,
d. Solution heat exchanger effectiveness was assumed to be 0.7
(Dorgan 1995),
e. The electrical power consumption of the pumps was neglected.
From the calculated results of enhancement factor in Table 3.3, it was found
that the values of the enhancement factor were greater than unity. This means
that under assumed operating conditions, the COP of the steam ejector re
compression cycle is predicted to be greater than that of the conventional
single-effect cycle provided that the heat source can drive the steam ejector.
Estimated values of COP are listed in Table 3.4.
COP values responding to the solution concentration change in the novel cycle
were found to differ from those of single-effect cycle. The COP of
53

conventional cycle increases with the solution concentration. However, for the
ejector-enhanced cycle, there is a concentration at which the cycle has a
maximum COP value. This is a result of the ejector entrairunent ratio
decreasing as concentration increases while the COP of the single-effect cycle
increases with the concentration. Figure 3.16 compares the variation in COP
with solution concentration between the novel and conventional cycles..
Another difference between the novel cycle and the conventional single-effect
cycle is that the maximum COP of the novel cycle decreases as the solution
temperature increases, as shown in Figure 3.17. In the conventional absorption
cycle, there is a solution temperature at which the cycle COP reaches
maximum value.
54

u o
OQ
V3
o -•-» o
I
To c »3 o o JO
o "57
13
G
D -C • * - •
C! (U
<u
c o
on
S o O CL,
O o ' en 1)
1
U o
C/3
(U
C3
• 4 — •
C o
B 00
o
C/3
U o
oo
U o
C/3
00 0\
(N
ON ON
ON
ON
CO O O
ON o o
ON
ON
O r^
ON ON
O
o
o o
oo
ON ON
o
en oo
ON
ON
00
O
o
00
oo
o o o
CN 1—H
O
VO OO
o
U o O
IZl
o
oo
ON
m OS
o ON OS
o
ON
ON ON
ON
OO OS ON
ON ON
CO
o
o 00
o o
o
oo
o
ON
o 00
o oo
oo ON
<N O 00
OS oo ON
O
o oo
m ON ON
o oo
o
ON ON O
ON O 00
(N o o
o 00
o
oo
00 o
<
2
< 2
ON
ON
ON
OO
o
oo ON
(N oo o
oo ON
oo o
ON
ON
SO
OO
o
<
2
m ON in
U0IJBJJU3DU00 uoijnps
O o O en
(3 u G. 6 c
_o
& o
< U o
CO
<u
s 00
c
1 o
> u >-. o O
S o
00 V
"o >
_ U S i> 13 S 130 >
•a c/) < .
§ I I U oo 2
55

Q. o o
1.200
1.100
1.000
0.900
0.800
0.700
solution temperature 72°C
-single-effect
• novel cycle
56.5 57.0 57.5 58.0 58.5 59.0 59.5 60.0
concentration, %
Figure 3.16 Comparison of COP vs. solution concentration
Q. 1.000 o O 0.995
57.0
solution temperature »-70°C
t-JVC fc-72°C
«-73°C
lt-74°C
• -75°C
58.0 59.0 60.0
concentration, %
61.0
Figure 3.17 COP variation with the solution temperature
• the novel cycle, COP was found to increase with the heat source temperature,
ile the solution temperature remains unchanged. Figure 3.18 shows the predicted
id in COP with the steam temperature. In these results, the solution concentration
:he concentrator was 59% and the solution temperature was 71°C.
56

1.120
1.100 4
1.080
Q. 1.060 O
" 1.040
1.020
1.000
0.980 200 220 240 260
steam temperature,°C 280 300
Figure 3.18 COP variation with ejector steam supply
temperature
> CONCLUSIONS
this chapter, the theoretical energy efficiency of the novel refrigeration cycle was
cussed. From the theoretical results, it can be concluded that the novel cycle, using
ejector to re-compress the vapour for re-heating the solution, can increase the cycle
IP. However, a high temperature heat source is required to drive a steam ejector for
:h a cycle. The improvement of the COP of this novel cycle largely depends on the
rairunent ratio of the ejector. Since the steam ejector is introduced into the
rigeration cycle, the cycle performance characteristics are profoundly affected by
ejector. As a result, the COP responses to the variation of the operation condition
the novel cycle are different from those for the conventional cycles. These
ferences are:
• The novel cycle COP decreases as the solution temperature increases while
there is a solution temperature where the conventional cycle COP reaches
maximum value.
• There is a solution concentration where the novel cycle COP reaches
maximum value while the COP increases with the solution concentration in
the conventional cycle.
57

• The novel cycle COP increases with the heat source temperature, however,
the COP of the conventional single-effect absorption cycle can not always
increase with the heat source temperature.
• The novel cycle COP is more sensitive to the temperature difference
between the steam and the solution.
srefore, an efficient steam ejector is essential to obtain high COP from the novel
;le. In the meantime, the following requirements should be met if the novel cycle is
36 mn efficiently,
• The solution temperature should be kept as low as possible.
• The solution concentration should be chosen for the maximum COP.
• The temperature difference AT for the heat transfer between the steam and
solution should be kept low as it affects the performance significantly.
;se requirements are the results of using a steam ejector in the concentration
cess. They may not be necessary for the conventional cycles.
58

CHAPTER 4
PRELIMINARY EXPERIMENTAL STUDY OF THE STEAM
EJECTOR
It is quite normal for a refrigerator to operate at part-load conditions, so, it is
important to know the part-load performance. For the novel cycle, the part-
load operation means that the steam ejector is also operated under off-design
condition. Therefore, it is necessary to know the off-design characteristics of
the steam ejector to predict the part-load performance of the novel cycle. In
Chapter 3, an ejector model has been developed which can be used to predict
the steam ejector performance. However, this is not sufficient to reveal the
novel cycle performance under part-load conditions, because this model is
only suitable for predicting the ejector entrainment ratio at its designed
working condition. It is difficult to predict the ejector off-design performance
from a mathematical model because the flow inside the ejector becomes
complicated. So, experiment remains a good way to find out the off-design
performance. In this chapter, a preliminary experimental study was carried out
in order to find out the ejector off design performance.
4.1 THE EXPERIMENTAL APPARATUS
The test facility is shown schematically in Figure 4.1. The apparatus consisted
of five principle components: a 7 kW electrically powered steam generator
assembly, an ejector assembly, a flash-evaporator, an 8 kW water cooled
condenser and a 2 kW evaporator heater. A photograph of the apparatus is
included in Figure 4.2.
59

0) O)
3 « U) > <A i | -0) 0)
</) c a. a.
5 o
0)
a. 01
O 4) •S •-« 3
"5 c (/> (0
s «• 2 0) - I n .a
3 « (fl »
ni > v ' i : — p TJ n <»
0) .Q " o
3 fe 0) 5 K ° !3 « U) O 3 r. 2 S t g a OT'D o)
0)
a o
.2>o
E <fl
0) o
o a » 2 i! V O L .
a «> C O ) ?
"N a . t> 0) V M IB -s -e t ;
V) 4)
a.9-E a a
JS 3* 4) .C 3 a"^ I. p Q. L. O
.fc 3 O -J-
o » *3 g I - k. L. O 0) a> 0) Q. M (8 § §
O) 4)
4)
i E
a o)
t) O) 3 n) O) 4)
!i5 ^ « 2 «! Q.
I . 1-
4> IE
_4) "5 i-
« O
gel
B E fc S 9) 2 £ •" « L. IB 4) 4) .-ti c It .O* 4) ^ T3 O)
E
IB O
3 4) "I E 8
O IB I -IB
a 4) V) I -3 O
a « l w ~
> 1 » ^
o ' a 4 ) . i _ D ) . c . _ . _ , j e : _ E c o Q . O ' ' - < ' > * ' 3 > $
/® f;:)©
4
"a s o u o
00
CO
.6 (U CL,
o
00
B
o 00
op
60

1 - Steam Ejector 2 - Evaporator
3 - Condenser 4 - Steam Boiler
Figure 4.2 Photograph of experimental rig
The ejector assembly is shown schematically in Figure 4.3. The ejector used in
this study was designed using the semi-empirical method described by Eames
and Aphomratana (1995 [1]). The body of the ejector was made from 80 mm
O.D. stainless steel pipe fitted with flanges at both ends in order to provide a
connection with the condenser and a location for the primary nozzle support
61

plate. An 80mm O.D. stainless steel suction manifold was welded to the
ejector body and provided with a flange to connect it to the evaporator. All
flange mating surfaces were sealed with 'O' ring seals to provide an airtight
connection.
+ NXP ?^-NXP
080 s^
Primary noZ2l« detail steam flow
1. Nozzle support flange 5. Primary nozzle 9. Ejector body 2. Suction manifold 6. Mixing section 10. Tall piece 3. Nozzle connector 7. Diffuser throat section 11. 'O" seals 4. Spacer 8. Subsonic diffuser section 12. Fixing rings
Figure 4.3 Schematic diagram of the ejector assembly
Referring again to Figure 4.3; the primary nozzle assembly was made in three
pieces: the nozzle itself, a spacer and a screwed connector to connect the
assembly to the support flange. The diffuser assembly consists of a mixing
section, a diffuser throat section, a subsonic diffuser section and a tail piece.
These were manufactured from aluminum. Their diameters were machined in
order to provide a push fit into the ejector body, and 'O' ring seals were fitted
to prevent steam leaking back from the condenser, between the diffuser and
ejector body and into the evaporator. Location lugs were provided to ensure
good alignment between the separate pieces of the diffuser assembly.
Figure 4.3 also shows the nozzle exit position (NXP) datum used during the
experiments. With reference to this: ten, equally spaced, wall static pressure

tapping were included along the length of the diffuser on 40 mm centres from
NXP = 20 mm. Each tapping was connected to a pressure manifold via a short
length of pipe, and an isolation valve positioned above for switching the
measuring point on/off. The static pressure in the diffuser was measured by
comparing its difference with the pressure in the condenser, which was
measured using a mercury manometer.
4.2 THE EXPERIMENTAL APPROACH
The objectives were to investigate the part-load operation of steam-steam
ejectors and to determine the significance of the primary nozzle position, the
nozzle exit area and the diffuser throat area with regard to performance and
operating stability.
The apparatus was operated at a steady state condition until the water level in
the generator reached its safe lower limit. During this time the water levels,
temperature and pressure readings around the apparatus were recorded. From
these data, the entrainment ratio and the pressure lift were determined.
Experiments were repeated a number of times for different ejector
configurations, and the results presented here represent averaged values. The
back-pressure of the ejector was adjusted by cooling water flow rate to the
condenser, while the suction pressure was adjusted by hot water flow rate to
the evaporator.
Experiments were carried out using three geometries of diffuser, three primary
nozzle geometries and every combination of these over ranges of nozzle exit
positions and evaporator, condenser and generator pressure (saturation
temperature) condition.
4.3 EJECTOR PERFORMANCE CHARACTERISTICS
43.1 Entrainment ratio variation with primary stream pressure
If an ejector was designed to work at the primary pressure ratio, Np4 =
PpO,d/Pb,d, and the secondary pressure ratio, Np,d = Pb,d/PsO,d» the ejector usually
gives a maximum value of entrainment ratio, Wd=m^^ Irh^^ , when it works at
63

the designed pressure ratios, Np,d and Np,d. Therefore, the designed nozzle
pressure ratio, Nn,d= Ppo,d/ Pso,d, is also determined. When the primary pressure
ratio Np is increased or decreased from Np^ due to the change of the primary
pressure, the experimental result shows that the entrainment ratio, w, will
decrease, as shown in Figure 4.4. The test ejector was designed to be driven by
15 bar saturated steam (111.4°C) of primary pressure and to entrain 5°C (8.7
mbar) saturated water vapour. The entraimnent ratio reaches maximum at the
designed point and falls down at each side of the designed point. This can be
explained as follows. In the case of Nn>Nn,d, the primary flow at the nozzle
exit is under-expanded, in other words, its static pressure would have initially
been greater than that in the mixing section at the nozzle exit position, causing
the flow to expand through a series of expansion waves. During this process it
is believed that the secondary flow is increasingly pushed away from the
emerging jet until expansion is completed, thus causing the entrainment ratio
to fall with rising nozzle pressure ratio, and reducing the effective length of
the mixing section. In the case of Nn<Nn,d, the flow would have been over-
expanded as it left the nozzle. The flow would adjust its pressure through a
series of compression waves. During this process, it is believed that the
secondary flow is drawn towards the jet, thus increasing the entrainment ratio.
However, it appears from the results that over-expansion has limited effect.
When Nn is reduced, the momentum of the jet will fall due to the decrease of
mass flow. Eventually, there is insufficient momentum in the combined flow
to overcome the back-pressure at the diffuser exit, causing the entrairunent
ratio to sharply fall away.
64

evaporator temperature
—•—5°C
-•—10°C
—A-15°C
110 l i s 120 Boiler Temperature °C
Figure 4.4 Entrainment ratio variation with primary and secondary flows
43.2 Entrainment ratio variation with the secondary stream pressure
Obviously, the entrainment ratio increases as the secondary flow pressure
rises, because the higher the pressure, the more momentum is potentially
possessed. However, the maximum entrainment ratio tends to appear at lower
primary pressure as the secondary pressure increases from its designed
pressure, as shown in Figure 4.4. In the figure, the maximum entrainment ratio
moves from 1.5 bar (111.4°C) to 1.2 bar (105°C) at 8.7 mbar (5°C) and 17.04
mbar (15°C) curves respectively. The primary flow pressure for the maximum
entrairunent ratio moving towards lower pressure is believed to occur as a
result of self-adjusting of flows in the mixing section. In this case, the nozzle
pressure ratio, Nn, for the maximum entrairunent ratio is much less than the
designed nozzle pressure ratio, NnKi, therefore, the primary flow at the nozzle
exit is over-expanded, which is believed to help the mixing process of the two
flows. The loss of momentum of the mixing flow due to reducing the primary
pressure is compensated by increasing the secondary pressure, so that the
mixing flow can overcome the back-pressure. To keep the nozzle pressure
ratio at the designed value it is necessary to increase the primary pressure to
2.94 bar and its mass flow rate is therefore increased. Since the flow area of
the diffuser does not increase as the flow rate does, the flow area for the
secondary flow becomes smaller. So, the entrainment ratio has to fall.
65

4 3 3 Back-pressure influence
The back-pressure influence to the entrainment ratio of a ejector is
characterized by the critical pressure which divides the entrairunent ratio into
back-pressure independent and dependent regimes. When the back-pressure is
lower than the critical pressure, the entrainment ratio is independent of the
back-pressure. Otherwise, it is dependent on the back-pressure. Figure 45
shows the experimental result of a steam ejector with regard to the back
pressure influence on the entrairunent ratio. In the back-pressure dependent
regime, the entrainment ratio is sensitive to the change of back-pressure. Any
small increase of the back-pressure causes a large fall in the entraimnent ratio.
Therefore, letting the ejector work in this regime should be avoided. Figure
45 also shows the primary pressure ratio, Np, at the critical pressure points.
The value of Np at the critical points varies between 56.7 and 59.2 except the
point of 64.1 on the curve for 115°C, which is abnormal due to missing the
critical point in the test. That the primary pressure ratios, Np, are so close each
other suggests the increase of the critical back-pressure is linearly proportional
to the increase of the primary pressure, if the difficulty to catch up the critical
condition is taken into account.
20 25 30 35 40 45 50
back pressure (mbar)
Figure 4.5 Entrairunent ratio variation with back-pressure
and primary pressure
66

43.4 The geometric factors that affect the entrainment ratio
In addition to the operation conditions affecting ejector performance, the
intemal geometric factors also have an influence. These are the nozzle outlet
area, the nozzle exit position and the diffuser throat area. These effects are
discussed here based on our experimental results.
Nozzle outlet area effect
The Mach number of a supersonic nozzle at outlet is determined by its area
ratio of the throat and the outlet. The exit area of the nozzle is critically
determined by the pressure, Nn, so that the static pressure in the flow equals
that in the mixing section. If the exit area is manufactured to be less than the
critical value, then the flow will be under-expanded on leaving the nozzle, and
the entrainment ratio will be reduced for the same reasons for the increase of
the primary pressure. Conversely, if the nozzle is manufactured with an
oversized exit area then the flow would be over-expanded and the entraimnent
ratio would be reduced also. This is shown as Figure 4.6 from the
experimental data. The nozzle geometry for this experiment is described in
Table 4.1. No. 1 nozzle with 8mm-exit diameter was the originally designed
while No. 2 was purposely manufactured with over-sized exit area. It is shown
that the entrairmient ratio with No. 2 nozzle is lower than that with No. 1 over
the test range.
Table 4.1 Test Nozzle Geometry
Nozzle Number
1
2
Throat Diameter
2 mm
2 mm
Exit Diameter
8nun
12 mm
Area Ratio
16
36
67

0.6
o 4.^ (0 ^ *^ c E c (0
c «
0.5
0.4
0.3
0.2
^— No. 1 Nozzle
No. 2 Nozzle
100 120 140 160 180 200 220
N=P/P n p s
Figure 4.6 Measured variation in entrairunent ratio with nozzle pressure ratio
for different nozzle exit/throat area ratio
Effects of nozzle exit position, (NXP)
NXP is defined here as the distance from the exit plane of the primary nozzle
to the entry plane of the second conical part of the mixing chamber, as defined
in Figure 4.3. Experimental results indicate that the primary nozzle position,
NXP, does affect the secondary pressure ratio, Ns. The optimum NXP value,
which gives the greatest secondary pressure ratio, Ns, moves towards the
diffuser throat as Np increases, as shown in Figure 4.7. It was also found that
the critical pressure could be increased by increasing the ratio of the nozzle
position distance to the diffuser throat diameter, NXP/D. Furthermore, if the
primary and secondary pressures were maintained, entrairunent ratio was
found to be maximum at the optimum NXP/D position.
68

2.5
Figure 4.7 Measured variation -n optimum nozzle exit position with secondary
f^ressure ratio
Effects of diffuser throat area
The effects of diffuser throat area are shown as in Figure 4.8 and 4.9 from the
experiment results. For a constant diffuser throat area ratio, the critical
secondary pressure ratio increases with the primary pressure. However, for a
constant nozzle pressure ratio, Nn=Pg/Pe, increasing diffuser throat area ratio
results in a falling of critical secondary pressure ratio, see Figure 4.8, while the
entrairunent ratio increases as tue diffuser area ratio increases, as shown in
Figure 4.9 (Eames 1998). Tte geometries of the diffusers for the test are
shown in Table 4.2.
Table 4.2 Geometries of 3 test diffusers, mm (referring to Figure 4.3)
A
36
40.6
53.8
B
98.5
139.8
183.8
C
130.9
176.6
219.6
D
495.4
518.1
493.6
E
52.5
533
50.7
F
14
18
22
G
17.8
24.1
29.9
69

60
Si 55
o
1 50
M d>
5. 45
(0
E a 40
35
/ / /227 >s
AR =121 / / /
8lV /
49V
Nn = 164
NXP = 1 AT = 16
\ *** \^ V \ s \^
X. \ ^ X x . \ ^ X
266 \ Ns
1 1
Np = Pg/Pc
Ns = Pc/Pe
Nn = Pg/Pe = Np.Ns
_ - extrapolation from experimental data
3I7J 359
2.5 3.5 9.5 4.5 5.5 6.5 7.5 8.5
critical secondary pressure ratio (Ns')
Figure 4.8 Measured effect of primary pressure ratio, diffuser throat area
and nozzle pressure ratio on critical condenser pressure
10.5
(0
a>
E c 'ta
a>
0.45
0.4
0.35
0.3
0.25
0.2
i : 0.15
0.1
0.05
Nn:
AT =
= 227 v ^
= 16 > ^
r 1 1 1 1 1 1 1
40 50 60 70 80 90 100
diffuser area ratio, AR
110 120 130
Figure 4.9 Measured variation in entrainment ratio
with diffuser throat area ratio
4.4 EFFICIENT USE OF EJECTORS
From the above discussions, the following points should be emphasized
regarding the application of a steam ejector in the ejector re-compression
absorption cycle:
70

a. The entrainment ratio of an ejector is reversibly proportional
to its secondary pressure ratio which is determined by the
operation conditions of the concentration process of the
refrigeration cycle. Therefore, the effects on the entrainment
ratio must be taken into account when choosing the
operation conditions of the concentration process in order to
achieve best energy efficiency;
b. The closer to the critical back-pressure, the higher the
efficiency from an ejector. However, this is not a stable
working condition and the ejector is prone to loss of
function under this working condition. It is necessary to
leave enough room to allow for unexpected intenuption;
c. The ejector should be operated at design condition as far as
possible.
71

CHAPTER 5
MANUFACTURE OF A REFRIGERATOR BASED ON
THE NOVEL REFRIGERATION CYCLE
A proof-of-concept experimental refrigerator was designed and manufactured
to test the novel cycle. In layout the machine was similar to a conventional
single-effect lithium bromide-water absorption refrigerator except that there
was an ejector working within the concentrator. The experimental refrigerator
was based on the novel cycle and consisted of six major components plus
pumps and valves. The major components included: a steam generator, a
concentrator, an absorber, a steam ejector, an evaporator and a condenser.
Figure 5.1 shows a schematic diagram of the experimental refrigerator. The
photo of the experimental rig is showoi in Figure 5.2.
DIFFUSER HEAT EXCHANG TUBES /->v
PUMP
Figure 5.1 Schematic diagram of the experimental rig
72

1 - Concentrator 2 - Evaporator 3 - Absorber 4 - Condenser
5 - Steam Generator 6 - Measuring Vessel 7 - Pump 8 - Pump
9 - Baffle 10 - Data Logger
Figure 5.2 Photograph of the experimental rig
5.1 THE STEAM GENERATOR
A 10 kW (max), electrically powered, steam generator was designed and
manufactured. It consisted of the water boiler and the steam tank or knock-out
73

vessel, shown in Figure 5.3. A three-phase electrical heat element was fitted to
the water boiler together with a thermostat to protect the heat element from
damage by overheating. The steam tank or knock-out vessel was located above
the water boiler. Baffle plates positioned inside the knock-out vessel prevented
water droplets from entering the steam ejector which could reduce its
performance. The water boiler and knock-out vessel were coimected by pipe
work. The lower liquid retum pipe was coiled to allow for thermal expansion.
The steam generator was made of stainless steel and rated at 15 bar operating
pressure. Thermocouples and a pressure transmitter were installed to measure
the steam temperature and pressure at the knock-out vessel. Steam pressure
was chosen as a control parameter because it was found to give better control
performance than temperature. A safety pressure relief valve fitted on the top
of the knock-out vessel.
baffle plates ^ and mesh screen
knock-out drum
steam supply
support brackets
feed water supply
15 bar, 10 kW Steam Generator
Approximate Dimensions:
Knock-out drum 200 mm dia x 700 mm
Heater vessel 150 mm dia x 500 mm
Wet steam pipe 33 nun dia
Condensate retum 13 mm dia
Feedwater suppy 13 mm dia
Steam supply pipe 13 mm dia
Electric Heaters To be found
3X3 3 eleclncal ^ heat elements
heat vessel
Stainless steel to be used throughout
XIJL
Figure 5.3 Diagram of the steam generator
5,2 THE CONCENTRATOR
The construction of the concentrator is shown in Figure 5.4. The concentrator
consisted of two parts; the steam ejector and the concentrator proper. The
ejector assembly was made of stainless steel to avoid problems of corrosion.
74

The motive flow for the ejector was designed for 5 kW of saturated steam at
15 bar, 198 °C. The relative position between the primary nozzle and diffuser
was made adjustable in order to optimise their relative positions. The ejector
was housed in a 150mm diameter glass pipe. One end of the pipe was sealed
using a stainless steel plate and a proprietary flange while the other end was
connected to the concentrator housing, which consisted of a 150mm diameter
QVF glass pipe. Figure 5.5 shows the construction of the steam ejector.
vapour flow thermocouple
bafne Q^"" ^"'^ P'P'=
pressure taps
sleam inlet
primary nozzle
vapour out
solution inlet
^ A waler outlet
solution outlet
low finned copper tubes diffuse
Figure 5.4 Schematic stmcture of the concentrator
The flow geometry of the ejector was determined from a computer model
based on one-dimensional fluid analysis and experimental works which were
discussed and described in Chapter 3 and Chapter 4. The ejector working
condition was set as follows: The primary flow at 198.3°C, secondary flow at
33°C and back-pressure at 0.6 bar. Its flow geometric sizes are listed in Table
5.1.
primary flow
secondary flow
primary nozzle
mixture flow
diffuser
Figure 5.5 Diagram of the steam ejector
75

Table 5.1 Flow geometric sizes of the ejector
Primary Nozzle
Throat diameter (mm)
Exit diameter (mm)
1.23
5.12
Constant Pressure Mixing Chamber
Inlet diameter (mm)
Exit diameter (mm)
Length (mm)
11.98
9.26
15.60
Constant Area Mixing Chamber
Diameter (mm)
Area ratio
9.26
57.14
Diffuser
Inlet diameter (mm)
Exit diameter (mm)
Length (mm)
9.26
22.69
96.24
The concentrator heat exchanger was made from low firmed copper tubing.
Sixteen copper tubes were used for the tube bank which had a semi-circular
shape when viewed from the right in Figure 5.4. From a heat exchange point
of view, the tubes were arranged in parallel to the steam flow from the ejector,
and connected to manifolds at both ends. The left-hand end (in Figure 5.4) was
connected to the diffuser of the steam ejector and right-hand end to a vessel for
measuring the condensation water. The numbers of heat exchanger tubes, from
top to bottom, were in descending order, 6 , 5 , 4 , 1 . This meant that most of the
heat energy, carried by high-pressure steam coming from the ejector, was
distributed to the top surface of the solution in the vessel. The arrangement of
the tubes is shown in Figure 5.6 and the fin size is shown in Figure 5.7. This
arrangement makes the vapour easier to evolve, as the density gradient in the
solution encourages circulation. A photograph of the steam ejector and the
heat exchanger of the concentrator are shown in Figure 5.8 and 5.9.
76
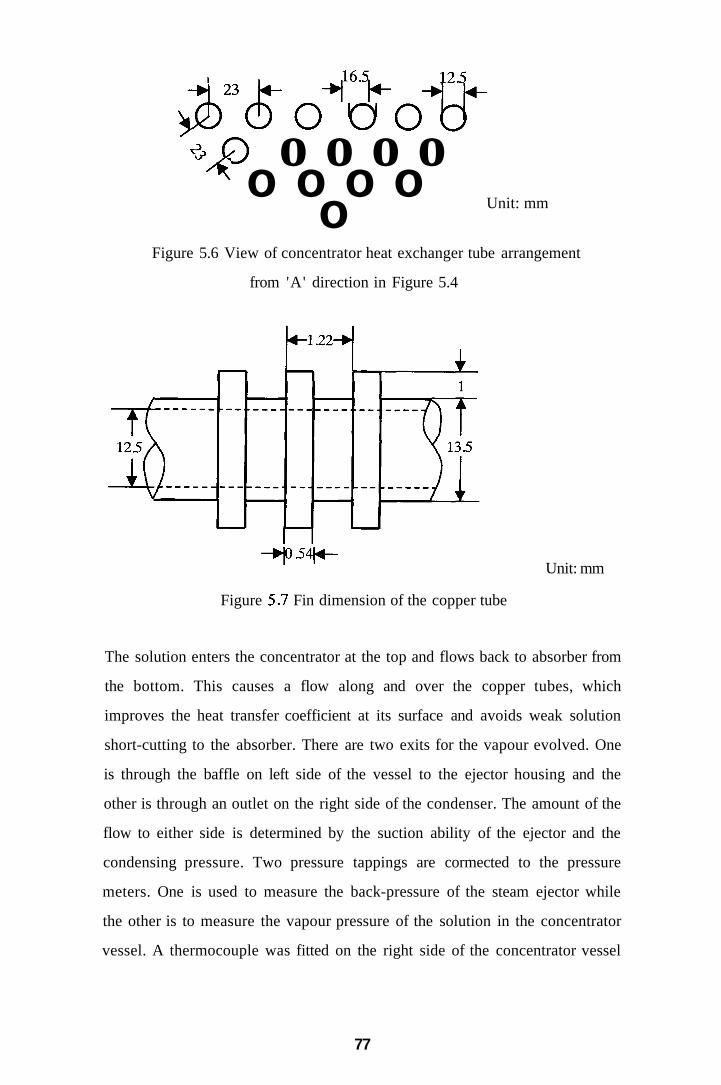
J) (5 0 0 0 -J- o o o o ^ o o o o
o Figure 5.6 View of concentrator heat exchanger tube arrangement
from 'A' direction in Figure 5.4
Unit: mm
- • j o . 541^-
Figure 5.7 Fin dimension of the copper tube
Unit: mm
The solution enters the concentrator at the top and flows back to absorber from
the bottom. This causes a flow along and over the copper tubes, which
improves the heat transfer coefficient at its surface and avoids weak solution
short-cutting to the absorber. There are two exits for the vapour evolved. One
is through the baffle on left side of the vessel to the ejector housing and the
other is through an outlet on the right side of the condenser. The amount of the
flow to either side is determined by the suction ability of the ejector and the
condensing pressure. Two pressure tappings are cormected to the pressure
meters. One is used to measure the back-pressure of the steam ejector while
the other is to measure the vapour pressure of the solution in the concentrator
vessel. A thermocouple was fitted on the right side of the concentrator vessel
77

to measure solution temperature. Solution concentration was determined from
its vapour pressure and solution temperature.
Figure 5.8 Photograph of the steam ejector
Copper Tubes Baffle
Water Exit . - ? « ^
Ejector
Figure 5.9 Photograph of the heat exchanger of the concentrator
5.2.1 Concentrator heat transfer design calculation
Adrian Bejan (1993) indicates that when.
Re = <3.5xl0^ (5.1)
for a condensable vapour flowing through a horizontal tube, then the
condensation process is dominated by natural convection, and the mean heat
transfer coeflficient. h , is given by
78

^ = 0.555 D"hf^g{p,-p^)
1/4
(5.2)
This equation was used to calculate the required heat transfer area for
condensation. The saturation temperature inside the tubes was assumed to be
at 80°C and the inside-diameter of the tube was set at 12>5mm. Substituting
the properties of the steam at SO'C into Equation (5.2), i.e.
k, = 666X10"*kW(mK)-' D = 0.0125 mm
g = 9.8 m-s' V, = 0.38X10"'m'-s"'
hf^ = 2320.8 kJ-kg-' p, = 974.42 kg-m'
The heat transfer coefficient for the condensation inside the heat exchanger
tubes at different T^^, - T^ are:
h = 2.22kW- m-'-K', when T^^, - 7 ; = 2°C
h = 2.00kW- m ' K ' , w h e n T^^, - 7 ; = 3°C
^ = 1.76kW- m'-K' , when 7;„, - T , = 5 °C
Therefore, for the condensation capacity of 5kW at T , -T^ =5°C, 0567m-
of heat transfer area was required. The inside diameter and length of the tubes
used for the heat transfer were 12.5mm and 950mm, respectively. Sixteen
tubes were used in parallel for the heat exchanger. The total cross-section area
for the steam flow was 1.963x10^ m^ For 5kW steam condensation in the
tubes, the Reynolds number of the vapour flow inside the tubes was 12,816.
This satisfied the requirement expressed by Equation (5.1) for using Equation
(5.2) to calculate heat transfer coefficient. The total surface areas inside tubes
for heat transfer was 0.5966 m^, which was greater than the required heat
transfer area by 5.2%. The required heat transfer area was met.
Outside the tubes, heat transfer was assumed to be boiling LiBr-water solution
at 59% concentration by mass at 75°C. Referring to Figure 5.4, the heat
exchanger tubes were immersed in the shallow lithium bromide solution which
acted as heating element. Therefore, this was a typical pool boiling case whose
heat transfer coefficient varied from the boiling types. The boiling type could
79
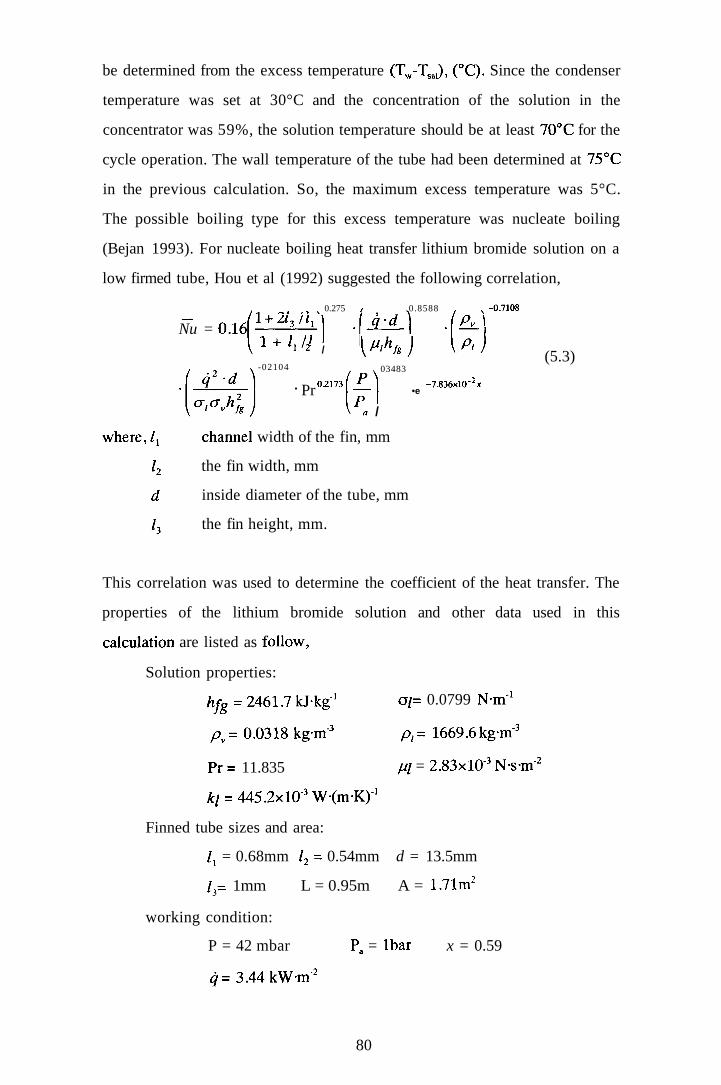
be determined from the excess temperature (T^-T^J, (°C). Since the condenser
temperature was set at 30°C and the concentration of the solution in the
concentrator was 59%, the solution temperature should be at least 70°C for the
cycle operation. The wall temperature of the tube had been determined at 75°C
in the previous calculation. So, the maximum excess temperature was 5°C.
The possible boiling type for this excess temperature was nucleate boiling
(Bejan 1993). For nucleate boiling heat transfer lithium bromide solution on a
low firmed tube, Hou et al (1992) suggested the following correlation,
» . , . ^ 0.275 / .0.8588 .^-0.7108
Nu = 0.16 1 + lJl 2 /
q-d
iM,J .P') -02104 03483
(5.3)
Pr 02173 •e
-7.836xl0"'x
« /
where,/i chaimel width of the fin, mm
the fin width, mm
inside diameter of the tube, mm
the fin height, mm.
This correlation was used to determine the coefficient of the heat transfer. The
properties of the lithium bromide solution and other data used in this
calcularion are listed as follow.
o/= 0.0799 N m '
/?,= 1669.6 kgm-^
/// = 2.83x10"' N-s-m"'
Solution properties:
/iyg = 2461.7 kJ-kg"'
/7^= 0.0318 k g m '
Pr= 11.835
)t/ = 445.2x10'W-(m-K)-'
Finned tube sizes and area:
/i = 0.68mm Ij ~ 0.54mm d = 13.5mm
/3= 1mm L = 0.95m A = 1.71m'
working condition:
P = 42 mbar P, = Ibar x = 0.59
^ = 3.44kW-m-'
80

The calculated Nusselt number was 35.09 and the coefficient of the heat
transfer can be obtained from Equation (5.4).
,- Nuk, h = - ^ (5.4)
The excess temperature can be calculated from following Equation (5.5).
AT = f (5.5) h
From Equation (5.4) and (5.5), the coefficient of boiling heat transfer was
1.157 kWm'K"' and the excess temperature was 2.97°C. In other words, it
was sufficient to meet the heat transfer requirement if there was the excess
temperature of 3°C between the tube wall and solution. This was less than the
maximum excess temperature allowed. So, the heat transfer requirement was
satisfied.
The overall heat transfer coefficient between the steam and solution could be
calculated from Equation (5.6),
\ \ t \ .... — = — -I---I-— (5.6)
U K k k where, t is the wall thickness of the tubes.
5.3 THE ABSORBER
A falling film absorber was manufactured, because this type has a low
pressure drop and simplicity of construction, as shown in Figure 5.10. The
outside vessel was made from a 225mm diameter glass pipe fitted with two
stainless steel end-disks to provide sealing at the two ends. Solution
distributors were fitted above the coils. The distributors consisted of two
copper rings with diameters of the copper coils. In order to distribute the
solution evenly to the surfaces of the heat exchange coils, flow guiders were
employed to direct the flow from the holes in the rings onto the surface of each
coil. The total surface area of the coils was 2.393 m^ A temperature sensor
was placed at the bottom of the vessel and a pressure transmitter at the top. A
pump was used for the circulation and distribution of the solution in the
absorber.
81

Absorption is a combined mass transfer with the heat transfer process. So, the
coefficients of mass and heat transfers should be considered in the design of
the absorber. For falling film mass transfer, the average coefficient of mass
transfer can be determined by the following Equations (5.7) and (5.8) (Treybal
1986). Equation (5.7) is for small flow rate or long times contact of contact of
the liquid with the gas (usually for film Reynolds numbers less than 100)
while Equation (5.8) is for for a larger Reynolds numbers or short contact
time,
D,
where kLav
DAB
8
r L
^ i / j v -
^ i ^ v =
3.41 ^ 5
np^ j
average mass transfer coefficient (m-s"')
molecular diffusivity (m'-s"')
film thickness (m)
mass flow rate per unit width (kg-(sm)"')
length of wetted wall ( m)
(5.7)
(5.8)
Thus the average mole flux for the entire gas-liquid surface per unit width can
be calculated from the following equation,
where N^^v average mole flux (kmole- (sm)"^)
CA i LiBr concentration at liquid-vapour interface (kmole m)
CA 0 concentration at the beginning of the wall (kmole m')
CA L concentration at the end of the wall (kmole m')
Cooling water flows through inside of the tube coils to carry away the heat
created by the absorption process. The heat transfer for this side of the coils is
fairiy straightforward. The Nusselt number is determined by using the
following correlation for turbulent flow in a coil (Rohsenow 1985),
82

0.1
iV« =0.023 R e " ' ' ^ Pr"'
where, r, is the inside radius of the tube and R is radius of the coil.
(5.10)
hot water in
weak solution outlet
cooling water inlel & oullel
pressure lapping
- ^ H - ,n
cooling water inlet & outlet
rculation pump
Strong solution ilet
Figure 5.10 The absorber and evaporator system
5.4 THE EVAPORATOR
A flash-type evaporator design was manufactured. The evaporator vessel was
made from a 76.2mm diameter (ID) stainless steel tube as shown in Figure
5.10. A 3kW electrical heat element was fitted at the bottom to provide a
cooling load. Further cooling load was provided via hot water supplied from
an electrical immersion heat tank through a plate heat exchanger shown in
Figure 5.10. A spray nozzle positioned on the top of the evaporator nozzle was
used to create large surfaces to assist the refrigerant to vaporize. A sight-glass
was fitted on the evaporator vessel to observe and measure the water level
change inside the evaporator. The evaporation rate, and thus cooling capacity,
was measured from the water-level changes in the evaporator vessel.
Thermocouples were positioned at the mid-height position in the centre of the
83

vessel. The temperature signal was fed to a data logger and was used to control
the electrical heating element to maintain the evaporator temperature at a pre
set value. The hot water supply to the plate heat exchanger was turned on only
when the cooling capacity was more than the heat provided by the electrical
heating element alone.
5.5 THE CONDENSER
A shell and coil type condenser was manufactured. The heat exchange coil was
made from 13.5mm OD soft copper tubing. This was formed into two
diameter coils of 12 cm and 9 cm fitted concentrically within the vessel. For
film condensation on a copper tubing wound coil vertically positioned, the
coefficient of heat transfer can be determined with following correlation
(Lienhard, 1987):
— hdcosa Nu =
{pf -Pg)pff^fgg{dcosaf
pkAT
1/4
f\^^B\(5.n)
(5.12)
where B is a centripetal parameter:
jj^Pf-Ps'^P^Ti^n'a
Pf hj^ Pr
and a is the helix angle. The function of the tube-to-helix diameter ratio, d/D,
and B can be evaluated numerically. The helix angle a of the coil used in the
absorber is so small that the centripetal parameter B can be considered as zero.
For d/D = 133/120 = 0.113 and 135/90 = 0.15, f(dlD,0) equals 0.728 and
0.726, respectively according to Karimi's work (1977). An average value was
used for Equation (5.13). Therefore, the external heat transfer coefficient was
given by:
•I \ 3 ^ 1 / 4
\Pf-Ps)Pf''fBSk dpb.T
The heat transfer inside coils is similar to that in the absorber, and can be
determined from Equation (5.10). The copper coils have a l.lm^ total surface
area. The overall heat transfer coefficient was calculated to be around 2500
W«(m^»K)'. The shell was constructed from a Schedule 10s, 152.4mm bore
h = 0.727 (5.13)
84

pipe, 80cm in length. A level indicator (sight-glass) was fitted to enable the
condensation rate to be measured.
5.6 THE MEASUREMENT AND CONTROL SYSTEM
Type 'K' thermocouples were used throughout for temperature measurement.
The temperatures were collected by a data logger and displayed on the
computer screen. Three Rosemount absolute pressure transmitters, Model
2088, calibrated for the ranges from 0 to 1 PSI and 0 to 20 bar respectively,
were used to measure the vapour pressures in the absorber, concentrator and
steam generator vessels. The pressure transmitter used to measure the
concentrator was also used to measure the condenser pressure by switching a
valve between them. These signals were also fed to the data logger and the
steam pressure was fed back to control the steam generator heaters. A pressure
gauge was used to monitor the back-pressure of the steam ejector which was
displayed on the meter. The circulation flow of the solution was measured
with a rotor meter, calibrated for lithium bromide solution from 0 to 2.8 Lmin
'@ 40 °C. The heat power input to the steam generator and the evaporator
were calculated from measured voltages and the currents inputs to the heating
elements. All the data was collected by a Data Electronics data logger DT505.
Figure 5.11 shows the diagram of the measuring and controlling system used
in the rig. All the measurement points are listed in the diagram except two
meters without signal out to the data logger. They were the flow meter and a
pressure gauge for measuring the back-pressure of the steam ejector.
85

PC RS232
data
logg
er
absorber, temperature, pressure evaporator, temperature, pressure
condenser, temperature, pressure
boiler, temperature, pressure
concentrator, temperature, pressure
flow meter, temperature
mixture vessel, temperature
solution heal exchanger, temperatures
boiler, electrical power
evaporator, electrical power
control box
boiler conctrol
evaporator control
Figure 5.11 Diagram of the measuring and controlling system
5.7 COMMISSION OF THE EXPERIMENTAL RIG
Following the construction, the rig was pressurized with compressed air to 1
bar gauge for the leakage test. Since this was an experimental rig which
needed to be modified late, many removable joints and gaskets and fitting
were used. Thus perfect leak tightness was impossible. After the leakage test,
the system had a leaking rate below 1 mbar per hour when the system was
vacuumed down to 20 mbar. This would cause the air accumulation in the
system over the period of experiment, which could deteriorate the cycle
performance. A vacuum pump was used to evacuate air and all non-
condensable gases from the system before starting an experiment and during
the operation if it was necessary.
The condenser, the evaporator and the measuring vessels would be used to
measure the flow rates in experiments. Their height-to-volume relationships
were calibrated before the rig was used. A measuring cup was used to measure
the volume of water filling into the vessels during the calibrations. The height
of the water level corresponding to the volume of water filled was recorded
and the water temperature was measured. These data were correlated into
86

formulas for calculating the flow rate from the level change. The volume -
height relationships for the three vessels were listed in Appendix B.
The primary flow rate of the ejector was also measured in the commission
stage in order to use it as power input to the cycle. Two primary nozzles were
used: one with the throat diameter of 1.0mm, another with 1.1mm. Each
primary nozzle was fitted to a same diffuser in tum to comprise an ejector. The
ejector was tested under primary pressures of 10 bar, 12.5 bar and 15 bar. The
measurement was carried out as follows: (a) blocking the secondary flow
passage of the ejector, (b) opening the steam valve to the primary nozzle when
the generator pressure reached to the set point, (c) adjusting back-pressures to
operate the ejector in the choke condition, (d) taking reading of level change
from the measuring vessel in a fixed time interval when the ejector was in
stable operation. The measurement was repeated several times and an average
value was used for the primary flow rate.
87

CHAPTER 6
EXPERIMENTAL STUDIES ON THE REFRIGERATOR
In this chapter, the experimental study of the novel cycle was discussed. The
aim of this study was to investigate the operation characteristics of the novel
absorption refrigerator and the energy efficiency.
6.1 EXPERIMENTAL METHOD
The experimental rig has been described in Chapter 5. As was indicated in
Chapter 5 it was necessary to evacuate the system every time before the
experiment. A vacuum pump was used to evacuate the system until the
evaporator temperature started to fall. Once the system was evacuated, the
steam generator was switched on. When the steam pressure reached 2 bar,
steam was discharged to the atmosphere for 5 minutes to get rid of the
remaining air from the steam generator.
Once the steam generator pressure had reached the set value, the supply valve
to the concentrator was opened. In the meantime, the solution circulation
started. It took about 1 hour for the system to enter stable operation. Once the
rig was in a stable operation, the readings (water levels, temperature, pressure
and flow rate) were taken, in tum, every five minutes. There were three water
levels (evaporator, mixing vessel and condenser) to be taken from the sight
glasses in order to determine the cooling capacity, the ejector entrainment ratio
and the amount of refrigerant generated. All three readings were important in
determining the cycle performance. The error was reduced by, first, marking
each individual water level before taking measurements. The test lasted about
15 to 20 minutes for every operation condition. An average value during the
period was used as experimental results.
6.2 CALCULATION FROM THE READINGS
For the purpose of precisely describing the experimental results, some
important parameters relating to the refrigerator performance must be cleariy
88

defined. These are the steam power input, the cooling capacity, the steam
ejector entrainment ratio and the solution concentrations of the concentrator
and the absorber.
62.1 Steam power input to the refrigerator
The power input was determined from the steam flow rate through the primary
nozzle. There were two reasons why the electrical power was not used as the
power input directly. The first was that the thermal insulation of the steam
generator was not good enough. The second was that it was not convenient for
the measurement system to carry out the calculation for the power
consumption simultaneously. Since the flow rate through the primary nozzle is
only determined by the primary pressure when it works under choked
condition, it is adequate to calculate the power input from the pre-calibrated
nozzle pressure-flow rate data that were ready for use, see Table 6.1.
Table 6.1 Ejector primary rates (gmin') at different steam pressure
Steam Pressure, bar
15.0
125
10.0
Primary nozzle diameter, mm
1.1
131.14
110.95
89.91
1.0
98.39
80.23
60.69
Figure 6.1 and 6.2 were plotted from the data in Table 6.1. The flow rate
between the measured pressure points was calculated from those two figures.
89

150
^r* t E 6) (0
ate
>_ ^ 2
130
110
90
70
50
12.5
Steam pressure (bar)
15
Figure 6.1 Measured primary flow rate (0 = 1.1 mm)
12.5
steam pressure (bar)
15
Figure 6.2 Measured primary flow rate (0 = 1.0 mm)
622 Evaporator cooling capacity
The cooling capacity of the refrigerator is proportional to the rate at which the
water is vaporized in the evaporator vessel. The water-level changes in the
evaporator vessel over a time interval were used to determine the cooling
capacity. The volumes against height for the evaporator were calibrated in
Chapter 5 and listed in Appendix B.
90

623 Ejector entrainment ratio
Entrainment rario is the ratio between secondary to primary flows at the steam
ejector. The primary flow rate was pre-calibrated under different primary
pressures, which was also used for calculating the steam power input described
earlier. The secondary flow was measured from the water-level changes in the
measuring vessel shown in Figure 5.1 by taking away the known primary flow
at the steam generator pressure (Figure 6.1). The secondary flow rate,
therefore, is equal to the difference between the mixture and primary flow
rates. The volume versus height of water level in the measuring vessel was
calibrated in Chapter 5 and listed in Appendix B.
6.2.4 Vapour evolved from the solution of the concentrator
The flow rate of the vapour leaving from the LiBr-water solution in the
concentrator during the concentration process describes the capability of the
concentrator. This flow rate consists of two parts in this experimental rig: one,
which equals the secondary flow to the ejector and two, the flow to the
condenser. The former was known from determinmg the entrainment ratio, and
the latter was measured from the water level change of the condenser. So, the
total flow rate of the vapour is evolved from the secondary flow rate plus the
flow rate to the condenser.
6.2.5 Solution concentration
The solution concentration in the concentrator was calculated from
temperature and vapour pressure measurements, while that in the absorber was
measured using a hydrometer. This is because the equilibrium solution
temperature in the absorber is difficult to measure accurately in this case.
Except for the measurements discussed, others were straightforward. All the
measurements were taken on a time-averaged basis.
91

6.3 EXPERIMENTAL RESULTS
63.1 The steam ejector performance
The ejector was the combination of one diffuser with each of two primary
nozzles. The first nozzle (with 1.1mm throat diameter) was designed for the
diffuser, which means that this nozzle matches the diffuser under design
condition. The second nozzle, however, had a reduced throat diameter (with
1.0 mm throat diameter) to reduce the steam input. The geometrical sizes of
the ejector were listed in Chapter 5. The distance between the nozzle exit and
the mixing entrance is defined as the nozzle position (NPX). NPX was made
to be adjustable within the mixing chamber entry to optimise the ejector
performance, which has also been described in Chapter 5.
Maximum pressure lift ratio
The maximum pressure lift ratio is the ratio of the back-pressure to the suction
pressure when the secondary flow is zero. This ratio indicates the pressure lift
ability of an ejector. In the present application, that the highest solution
concentration in the concentrator can be used is determined by this ratio. In
practice, the steam ejector should not be designed to work under such
conditions because no benefit will be from the use of an ejector in the cycle.
Test results of the pressure lift ratios with steam generator pressure at 10 bar,
12.5 bar and 15 bar are listed in Table 6.2. These data show that the maximum
pressure lift ratio increases with the primary pressure. They also show that the
lift ratio for the 1.0mm diameter throat is lower than that for the 1.1mm
diameter throat. It was found in the test that the pressure lift ratio was unstable
and an intermittent flow to the ejector housing was observed if the back
pressure was too high. This is the result of the back-pressure being at or higher
than the critical back-pressure. The maximum pressure lift ratio for the 1.1mm
nozzle ejector is shown in Figures 6.3 to 6.5. The critical pressure increases as
the primary pressure increases. It was found experimentally that the critical
back-pressure was 394.3 mbar for 15 bar steam pressure, 342 mbar for 12.5
bar steam pressure and 268 mbar for 10 bar steam pressure for the present
ejector design. Figures 6.6 to Figure 6.8 show the pressure lift ratio of the
92

ejector with a smaller throat diameter nozzle. The critical pressures for the
smaller throat area nozzle were also decreased, which could be the result of
mismatch between the nozzle and diffuser. The test results indicate that the
ejector with a 1.1mm throat diameter give better performance. Therefore, in
the following experiment, the nozzle with 1.0mm diameter would not be used.
Table 6.2 Pressure lift ratio of the steam ejector
Throat diameter
(mm)
1.1
1.0
Pressure lift ratio
Pg =10 bar
13.41
11.242
Pg = 125 bar
15.08
12.383
Pg = 15 bar
15.78
12.437
It should be noted that Figure 6.3 to Figure 6.8 recorded the histories of the
change of the pressure lift ratio in the tests. There was a period for the back
pressure to build up in the tests while the suction pressure did not fall because
some water existed in the ejector housing. This resulted in the pressure-lift
ratios being low at the start. If there was no water in the ejector housing, the
pressure-lift ratio should be higher but would be lower than the maximum
value according to the discussion in previous chapters.
93

150 200 250 300 350 back pressire (nrter)
400
Figure 6.3 Back-pressure and pressure lift ratio
(15 bar, 1.1mm throat diameter)
350
back pressure (mbar)
400
Figure 6.4 Back-pressure and pressure lift ratio
(12.5 bar, 1.1mm throat diameter)
94

200 back pressure (mbar)
300
Figure 6.5 Back-pressure and pressure lift ratio
(10 bar, 1.1 mm throat diameter)
200 250 300
back pressure (mbar)
350
Figure 6.6 Back-pressure and pressure lift ratio
(15 bar, 1.0mm throat diameter)
95

100 150 200
back pressure (mbar)
250
a> 3 (0 (0 V
Figure 6.7 Back-pressure and pressure lift ratio
( 12.5 bar, 1.0mm throat diameter)
100 150 200 back pressure (mbar)
250
Figure 6.8 Back-pressure and pressure lift ratio
(10 bar, 1.0mm throat diameter)
Ejector entrainment ratio
Since the concentrator was directly connected to the condenser, the vapour
pressure of the concentrator was dominated by the condenser pressure. This
96

resulted in the suction pressure of the steam ejector also being controlled by
the condenser pressure. For the refrigeration operation, the condenser pressure
was usually kept constant. This meant that the suction pressure of the ejector
was in constant while its back-pressure varied with the solution temperature
and concentration. That is to say the solution state determines the ejector's
pressure lift ratio. From our previous discussion, it was known that when the
primary pressure was fixed, the ejector entrainment ratio was varied with the
pressure lift ratio. Therefore, the ejector entrainment ratio is determined by the
thermodynamic states of LiBr-water solution. Knowledge of the relationship
between entrairunent ratio and the thermodynamic state of LiBr-water solution
is necessary to understand how the cycle might operate efficiently.
Figure 6.9 is the experimental result of the entraimnent ratio variation with the
back-pressure, which was determined by the solution concentration and
temperature. This figure shows that the entrairunent ratio remains unchanged
almost until the back-pressure is greater than 452 mbar. When the back
pressure is greater than 452 mbar, the entrairunent ratio is unstable and falls
dramatically. The test result shows that the ejector lost suction function totally
at 469 mbar. In this particular case, therefore, the critical back-pressure lay
between 463.64 mbar and 469 mbar where the entrairunent ratio approached
zero. The maximum solution temperature of the concentrator should be lower
than the saturation temperature of water corresponding to this pressure for the
rig to be in operation. The critical back-pressure is also decreased with the
suction pressure. Figure 6.10 shows the relationship of entrairunent ratio and
suction pressure of the ejector. In Figure 6.10, the entrairunent ratio falls
quickly when the suction pressure is lower than 46.8 mbar and approaches
zero at about 45.5 mbar. So, the increase of the solution concentration in the
concentrator is limited by this pressure. It is concluded from these
experimental results that the best operating conditions for this particular steam
ejector design are when the back-pressure is less than 452 mbar and suction
pressure is higher than 50 mbar. The corresponding temperature and
97

concentration of the solution in the concentrator for this condition will be
around 73°C and 59% respectively.
When the motive steam pressure was reduced from 15 bar to 12.5 bar, the
critical pressure of the ejector was also decreased. Figure 6.11 shows the
ejector entrainment ratio when the steam pressure was at 12.5 bar. In Figure
6.11, the entrainment ratio does not have significant change, however, the
critical back-pressure is dropped to 386.3 mbar. A fall in critical back-pressure
due to lowering motive steam pressure resulted in a reduction in solution
concentration at the concentrator when the condensing temperature was held
constant. Therefore, the optimum solution concentration and temperature
operation of the steam ejector used in this case was approximately operation
58% and 70°C respectively. However, this limited the maximum condenser
temperature to approximately 30°C. Above this temperature, the ejector
entrairunent ratio falls sharply, which results in a reduction of the cycle
efficiency.
o (0 k. ^* c E c '5 c UJ
0.3
0.25
0.2
0.15
0.1 -
0.05 -
0
-0.05
-0.1
» ••
- ^
400 420 440 460
Back pressure (mbar)
480
Figure 6.9 Entrainment ratio variation with back-pressure (15 bar)
98

Suction pressure (mbar)
Figure 6.10 Entrainment ratio variation with suction pressure
360 380
back pressure (mbar) 400
Figure 6.11 Entrainment ratio variation with back-pressure (12.5 Bar)
632 The energy efficiency of the concentrator
The efficiency of the concentration process in the concentrator was defined as
the ratio between the mass rates of the vapour evolved from the solution and
99

the steam input to the concentrator from the steam generator. This efficiency
parameter is proportional to cycle COP under steady operation and therefore, it
was important to know what factors affected the concentration process, and
how they influenced the cycle performance. Experiments were carried out over
a range of solution concentrations and motive steam pressures. The results
indicated that the solution concentration has a strong influence on the
efficiency of the concentration process.
The influence of solution concentration
The concentration of the solution has a significant influence over the mass
flow of vapour evolved from the concentrator. Experimental results indicated
that this influence increases with concentration. Figure 6.12 shows results of
experiments, which were carried out from concentration of 56% to 60.44%
with 15 bar motive steam pressure. From Figure 6.12, it was found that the
mass ratio decreases as the concentration increases. In the range 56% to 58%
concentration, the ratio changes less. The ratio decreases quicker as the
concentration increases. In this case the mass ratio was found to decrease
rapidly above 60.44% concentration.
56 57
concentration (%)
Figure 6.12 Mass ratio of the evolved vapour to the motive steam (15 bar)
100
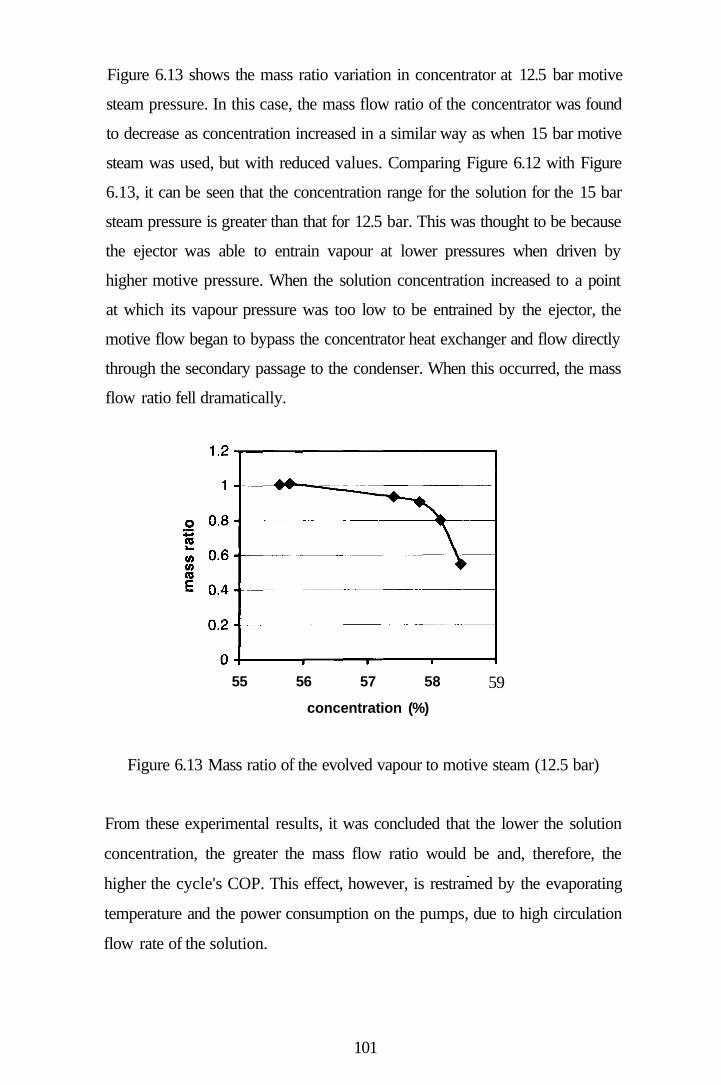
Figure 6.13 shows the mass ratio variation in concentrator at 12.5 bar motive
steam pressure. In this case, the mass flow ratio of the concentrator was found
to decrease as concentration increased in a similar way as when 15 bar motive
steam was used, but with reduced values. Comparing Figure 6.12 with Figure
6.13, it can be seen that the concentration range for the solution for the 15 bar
steam pressure is greater than that for 12.5 bar. This was thought to be because
the ejector was able to entrain vapour at lower pressures when driven by
higher motive pressure. When the solution concentration increased to a point
at which its vapour pressure was too low to be entrained by the ejector, the
motive flow began to bypass the concentrator heat exchanger and flow directly
through the secondary passage to the condenser. When this occurred, the mass
flow ratio fell dramatically.
55 56 57 58
concentration (%)
59
Figure 6.13 Mass ratio of the evolved vapour to motive steam (12.5 bar)
From these experimental results, it was concluded that the lower the solution
concentration, the greater the mass flow ratio would be and, therefore, the
higher the cycle's COP. This effect, however, is restramed by the evaporating
temperature and the power consumption on the pumps, due to high circulation
flow rate of the solution.
101
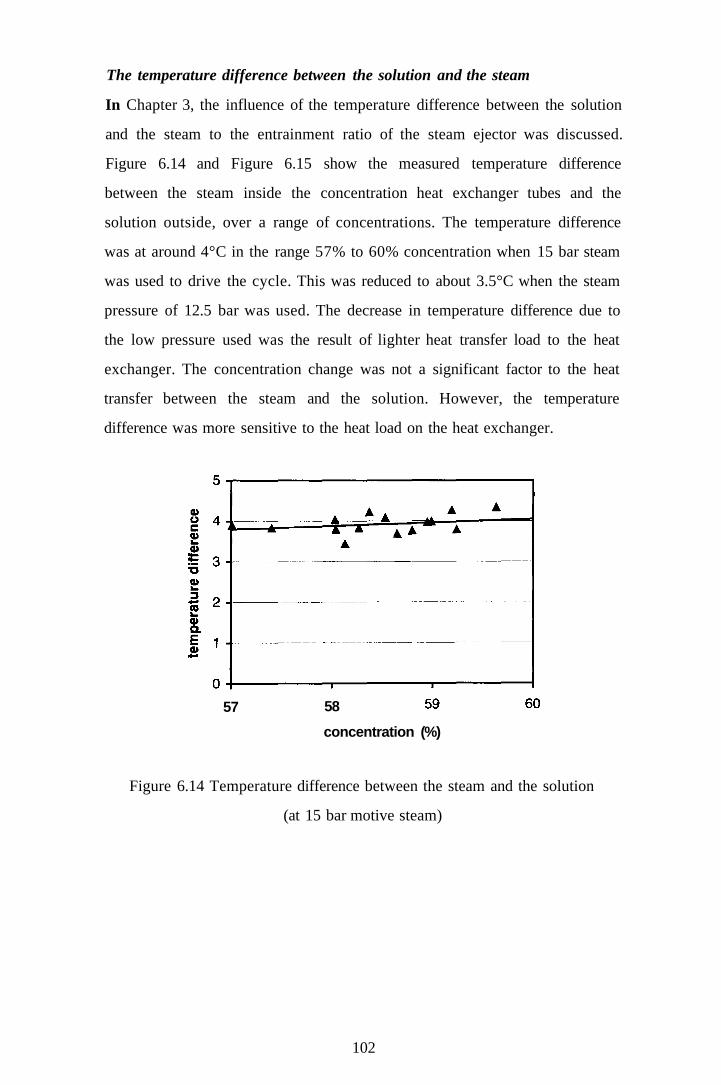
The temperature difference between the solution and the steam
In Chapter 3, the influence of the temperature difference between the solution
and the steam to the entrainment ratio of the steam ejector was discussed.
Figure 6.14 and Figure 6.15 show the measured temperature difference
between the steam inside the concentration heat exchanger tubes and the
solution outside, over a range of concentrations. The temperature difference
was at around 4°C in the range 57% to 60% concentration when 15 bar steam
was used to drive the cycle. This was reduced to about 3.5°C when the steam
pressure of 12.5 bar was used. The decrease in temperature difference due to
the low pressure used was the result of lighter heat transfer load to the heat
exchanger. The concentration change was not a significant factor to the heat
transfer between the steam and the solution. However, the temperature
difference was more sensitive to the heat load on the heat exchanger.
57 58
concentration (%)
Figure 6.14 Temperature difference between the steam and the solution
(at 15 bar motive steam)
102

57.2 57.4 57.6 57.8
concentration (%)
58 58.2
Figure 6.15 Temperature difference between the steam and the solution (at
125 bar motive steam)
6 3 3 The energy efficiency of the refrigerator
The efficiency of this novel refrigeration cycle and its characteristics are the
main concern of this research project. A theoretical evaluation of cycle
efficiency was discussed in Chapter 4. Experimental results are now described
and compared with the theory. Interest is focused mainly on the influence of
factors such as the motive steam temperature, the evaporating temperature, the
solution concentration and the condensing pressure on cycle efficiency.
COP at different motive steam pressures
Ejector motive steam pressure was found to have a strong influence on its
COP and cooling capacity of the novel refrigerator. To determine how the
motive steam pressure affects COP and the cooling capacity of this novel
cycle, the refrigerator was tested over a range of steam generator pressure from
12.5 bar to 15 bar. In the test, the evaporating and condensing temperatures
were held at 5 °C and at 30 °C respectively. Cooling capacity and COP
variation with motive steam pressure are shown in Figures 6.16 and 6.18. It
was found that cooling capacity and COP increased slowly as steam pressure
was varied from 12.5 bar to 13.5 bar. When the pressure was increased above
14 bar, both COP and cooling capacity increased more quickly at first and
103
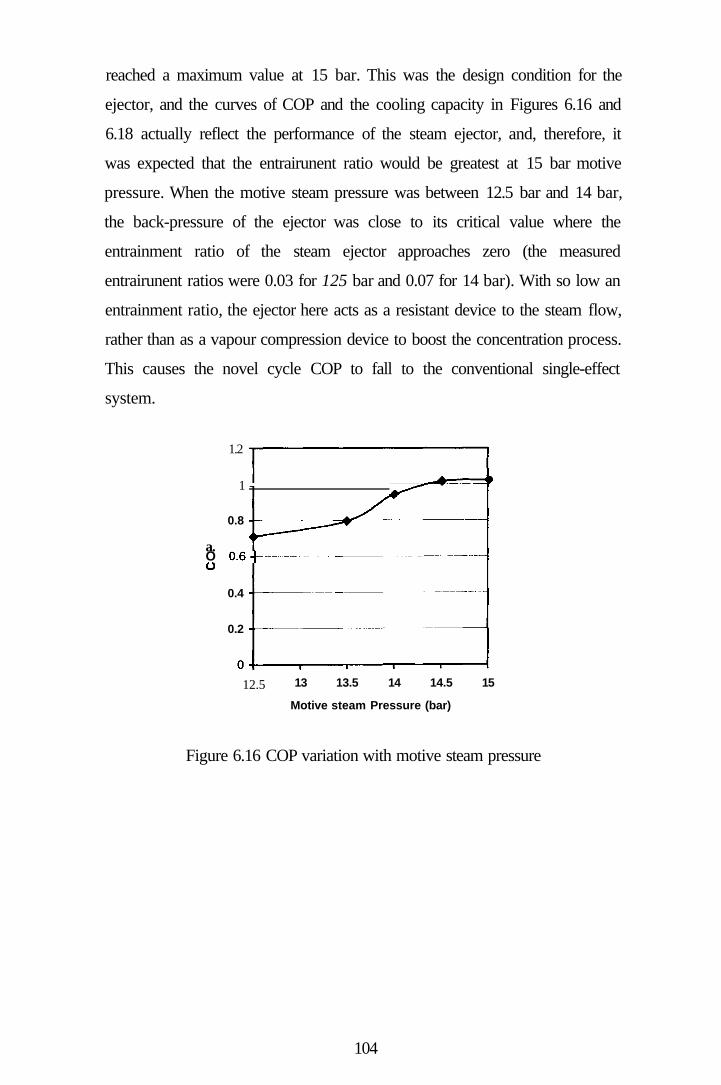
reached a maximum value at 15 bar. This was the design condition for the
ejector, and the curves of COP and the cooling capacity in Figures 6.16 and
6.18 actually reflect the performance of the steam ejector, and, therefore, it
was expected that the entrairunent ratio would be greatest at 15 bar motive
pressure. When the motive steam pressure was between 12.5 bar and 14 bar,
the back-pressure of the ejector was close to its critical value where the
entrainment ratio of the steam ejector approaches zero (the measured
entrairunent ratios were 0.03 for 125 bar and 0.07 for 14 bar). With so low an
entrainment ratio, the ejector here acts as a resistant device to the steam flow,
rather than as a vapour compression device to boost the concentration process.
This causes the novel cycle COP to fall to the conventional single-effect
system.
1.2
1 -
0.8
a. O 0.6-h o
0.4
0.2
12.5
^ ^ - ^ —"
13 13.5 14 14.5
Motive steam Pressure (bar)
15
Figure 6.16 COP variation with motive steam pressure
104

1 . 1 •
1 i
0. rt n Q -U
n R .
0.7^
ft • 4^ T
t , ,
—•—calculated performance
A measured performance
— 1 1
12.5 13 13.5 14 14.5 15
Steam Generator Pressure (bar)
Figure 6.17 COP difference between part-load and design operation
This experiment conceming the steam pressure influence to the cooling
capacity and COP of the refrigerator above 15 bar was not carried out for the
safety reasons. However, from the trend of the curves in Figure 6.16 and 6.18,
and from Figure 4.4 in Section 4.3 of Chapter 4, it can be predicted that further
increasing the steam pressure above 15 bar will result in an increase of the
cooling capacity but a decrease of COP. The speed of the cooling capacity
increasing will slow down because the entraimnent ratio will not increase as
the pressure increases, and when the pressure reaches a point where the high
primary flow rate blocked the secondary flow, this cycle goes back to the
conventional single-effect absorption cycle again. Figure 6.17 compares the
part-load operation and with the designed operation in terms of COP. In the
figure, the COP for designed operation was calculated from the computer
model, which needs several ejectors work at its designed condition to realise.
It shows the influence of the ejector to the cycle performance.
105

6000
12.5 13 13.5 14 14.5
Motive Steam Pressure (bar)
15
Figure 6.18 Cooling capacity vs. motive steam pressure
COP and solution concentration
The solution concentration in the concentrator influences the cycle COP.
Figure 6.19 shows the measured variation in COP over a range of
concentration from 57% to 59.5%. COP over the range is approximately rmity
and its trend increases with the concentration. In the Chapter 3, the effect of
the concentration on the COP was discussed, where the theoretical result
indicated that there was a concentration where the COP reached maximum
value. The concentration alternation to either side of the maximum point
would resulted in decrease of the COP. The experimental result, however, did
not have such a trend. The experimental COP seemed to increase with the
solution concentration in the concentration range. The comparison between the
experimental and theoretical results is shown in Figure 6.20. The trend-line
difference between them can be explained by the fact that the theoretical
analysis was based on an assumption that the ejector was designed to work at
the design condition but the steam ejector did not always work at its design
point over tested range of concentration. Referring to Figure 6.9, this figure
was drawn from the experimental data from which the ejector was operated at
15 bar (motive steam pressure) and 50mbar suction pressure (secondary flow).
The entrainment ratio in Figure 6.9, it should be noted, remains approximately
106

constant until the back-pressure reaches 466.3 mbar. In the concentrator, the
back-pressure varies with the solution temperature while the vapour pressure is
mainly controlled by the condenser pressure which remained unchanged
during the test. This means only the back-pressure is increased with the
solution concentration. If the concentration increase does not cause the back
pressure to rise above the critical back-pressure, the entrainment ratio still
remains unchanged. Furthermore, it was indicated in the previous chapter that
COP of the single-effect system increases with the solution concentration. So,
the overall COP of the novel cycle also increases with the solution
concentration. However, COP will fall quickly once the concentration reaches
a value to which the corresponding back-pressure is above the critical point.
1.2
Q. O 0.8 u
0.6
0.4
57.5
^ ^ ^ _ » _ • ^ •
58 58.5 59 59.5
Concentration (%)
60
Figure 6.19 COP variation with solution concentration
107

a O u
1.2
1.1
1
0.9
0.8
0.7
0.6 ^
0.5
• •
• experimental
theoretical
• Linear (experimental)
57 57.5 58 58.5 59 59.5
Concentration (%)
60
Figure 6.20 Comparison of the experimental and theoretical COPs
at different concentration
63.4 Stability of the concentration process
It was observed in experiments that a steam flow periodically appeared from
the ejector housing to the concentrator proper when the solution temperature
rose to 75°C. This became continuous as the solution temperature further
increased and the solution finally stopped boiling. This phenomenon occurred
when the absoiption process was not working properly. So, the concentration
process was unstable when the solution temperature was above 75°C. The
unstable concentration process was caused by the pressure lift ratio of the
steam ejector. When less water vapour was absorbed, the concentration of the
solution entering the concentrator increased, while the input power remained
unchanged. Consequently, the bulk concentration of the solution in the
concentrator was increased. The increase of the solution concentration not
only resulted in lower vapour pressure (the suction pressure) by
thermodynamic equilibrium, but also a reduction in the boiling heat transfer
coefficient. The latter caused the solution temperature (therefore the back
pressure of the ejector) to increase. Therefore, the ratio between the back
pressure and suction pressure increased. Once the pressure ratio was beyond
the maximum pressure lift ratio of the steam ejector, the motive steam would
flow through the ejector housing rather than the heating tubes. If the pressure
108

ratio then fell within the maximum pressure lift ratio, the flow disappeared
otherwise the flow remained. Although this phenomenon was found when the
absorber did not work properly, it is equivalent to the situation in practice
when cooling load demand reduces. The unstable concentration process caused
the cycle COP to fall sharply and should be avoided.
63.5 The problem with the absorption
The absorber in the experimental rig was found to be rather inefficient in that
it was not capable of absorbing the quantity of vapour evolved at the
concentrator when the absorption temperature is at 30°C. To balance the
absorbing ability of the absorber with the concentrator, the solution
temperature had to be decreased. Experimental data showed that at a solution
temperature of 23°C, vapour flow balance was achieved between absorber and
concentrator with the solution concentration in the absorber maintained at
54%. Perhaps the fault lies with the absorber suction line between absorber
and evaporator and therefore, not the absorber. Calculations showed that the
pressure resistance between the evaporator and absorber is a major factor
responsible for the poor efficiency. The cormecting pipe between them
consisted of two 90° elbows, one sudden contraction and one sudden
expansion as shown in Figure 5.8 in Chapter 5. Table 6.3 lists the calculated
pressure losses at these parts (Munson 1989). The total pressure loss was
estimated to be 1.57 mbar, which requires the absorber to operate at least 4°C
lower than what it would be without the flow resistance. Considering other
inefficiencies in the absorber, such as effects of the film distribution and non-
condensable gas to the mass transfer coefficient, 23°C solution temperature
seems to be acceptable for this case. Measurement of the solution density has
confirmed that the solution concentration remains around 54% at this
temperature.
109

Table 6.3 The pressure loss between the evaporator and absorber
Velocity, m»s'
Loss coefficient
Friction factor
Pressure loss, Pa
2xelbows
157.46
0.3
50.2
Sudden
expansion
157.46
0.9
75.8
Sudden
contraction
157.46
0.3
25.3
Tubing
157.46
0.02
6.1
63.6 Concluding discussion
The results of the experimental investigation showed that COP of the steam
ejector re-compression absorption cycle is 25% greater than that of single
effect cycle. Although this is not yet as efficient as the double-effect cycle, it is
only about another 0.2 COP lower. This could be reduced by improving the
steam ejector performance and other parts of the experimental rig, such as a
better heat exchanger in the concentrator.
Only one steam ejector was tested and it is believed that this may not have
been optimised for the cycle. It was indicated in the Chapter 3 that the steam
ejector has a strong influence on the cycle COP. Any improvement in the
performance of the steam ejector will proportionally increase the COP.
Improvements needed include the raising of both the entraimnent and pressure
lift ratios. If the entrainment ratio of the steam ejector could be raised to 0.4,
the cycle will be in a strong position to replace the conventional double-effect
lithium bromide refrigerator. If the pressure lift ratio was increased at the same
time, the solution circulation rate would be reduced, and this too would make
the cycle more efficient. So, the entraimnent ratio and the pressure lift ratio of
the steam ejector are considered to be important areas for future research in
this novel cycle.
The temperature difference between the steam and the solution in the
concentrator is a further important factor which determines the cycle COP.
The larger the temperature difference, the higher the back-pressure for the
110

steam ejector and therefore the greater the pressure lift ratio required. In this
experimental rig, there was a 5°C temperature difference between them, which
was mainly caused by steam condensation heat transfer. If the heat transfer
between them can be further improved, the cycle COP will increase.
The absorber used in the experimental rig was not as efficient as it may have
been, resulting in a lower than required solution temperature to balance the
steam mass flows in concentration and absorbing processes. The low
absorption temperature also decreased the heat exchanger efficiency and this
tended to reduce the cycle COP.
6.4 CONCLUSION
The novel cycle has been tested experimentally and discussed in this chapter.
The experimental results have approved that using a steam ejector in the
concentration process can improve the energy performance of a lithium
bromide absorption cycle. The part-load performance is also discovered from
the experiment work. From the experimental results, we conclude,
• The experimental COP value was 1.01 with Tg = 1983°C,
T,<,„ = 30°C (42.42 mbar), T3 = 30°C (calculated from
concentration and vapour pressure) and T = 5°C.
• The experimental results show that the steam ejector can
enhance the concentration process, which improves the cycle
efficiency. At the design conditions, COP of this novel cycle is
25% higher than that of the conventional single-effect cycle but
slightly lower than that of conventional double-effect cycle.
• The steam ejector operation characteristics strongly affect the
cycle performance. The solution temperature and concentration
in the concentrator must meet the ejector operation conditions,
otherwise, the efficiency decreases. In the worse situation, the
111
operation of the refrigerator is unstable. The COP of the novel
cycle is even lower than that of conventional single-effect cycle
in the worst case.
• The experimental results compare favourably with the
theoretical analysis in Chapter 3.
112

CHAPTER 7
GENERAL DISCUSSION AND CONCLUSION
The novel absorption refrigeration cycle has been theoretically and
experimentally investigated in the previous chapters. The literature survey in
this study showed that this novel cycle, which used a steam ejector to enhance
the concentration process for a lithium bromide absorption cycle, was
investigated for the first time. In the theoretical study, we investigated its
energy performance and operational features with the use of the steam ejector.
It was found that the steam ejector had a significant effect on the cycle energy
performance. For this reason, a detailed one-dimensional analysis and design
method for the ejector was discussed. The theoretical study also showed that
the solution concentration should be as low as possible to achieve better
energy performance. This was different from conventional absorption cycles.
Since the one-dimensional analysis was not able to model the off -design
performance of the ejector, a preliminary experimental study on steam ejectors
was carried out in order to reveal the ejector off-design operation. Finally, the
novel cycle was tested under the experimental conditions, which were
described in the Chapter 6. Thus, the novel cycle was investigated
comprehensively in this research.
One of the most important features of the novel cycle is the improvement of
the energy performance, although the experimental results are not better than
the conventional double-effect cycle. The theoretical and experimental results
showed that the otherwise wasted thermal energy in the refrigerant vapour,
evolved from the solution, could be recovered by a steam ejector. The
recovered energy could be used to generate more refrigerant vapour from the
solution. By doing this, the overall energy efficiency of the cycle was
therefore improved. A COP = 1.013 was achieved experimentally when the
input steam was at 198.3°C (15 bar), evaporator temperature at 5°C, condenser
and absorber temperatures at 30°C. This figure puts the novel cycle in a
position between the single and double effect absorprion cycles in terms of
COP. It could be better if the steam ejector was optimized. The efficiency of
113
this novel cycle increased with the heat source temperature while it decreased
for the conventional single-effect cycle when the heat source temperature was
beyond a certain point.
Another feature of the novel cycle is that it can maintain a low generating
temperature and concentration without reducing the energy efficiency when a
high temperature heat source is used. LiBr-water solution in the novel cycle
could be kept well below the temperature at which the solution may attack the
constmction material. In other words, using high temperature heat source to
drive the novel cycle does not cause the corrosion problem. Compared with
the triple-effect machines, which are supposed to be more efficient with the
use of high temperature heat source, the machine based on this novel cycle is
simple in construction and low in capital cost, but provides excellent energy
performance. These features give the novel cycle a very good prospect when
using heat sources above 200°C.
Simple construction, low capital cost and less maintenance are also very
attractive features. According to the definition of 'effect' for the absorption
cycle, the novel cycle is also a double-effect cycle but a steam ejector replaces
the high-pressure generator and the solution heat exchanger presented in the
conventional double-effect cycle. Since the steam ejector is a simple device,
the structure and capital cost of the machine based on the novel cycle are also
simpler and lower than those of the conventional double-effect machine.
Therefore, this novel cycle also offers potential competition to the
conventional double-effect cycle in using below 200°C heat sources. Yet the
scope for this novel cycle in this region depends on how much the entrainment
ratio of the steam ejector can be increased.
As was indicated in the previous chapters, the steam ejector plays an important
part in the cycle energy efficiency. Improving the ejector performance is vital
to the novel cycle. For the best result, a high entrainment ratio with required
pressure lift ratio is essential. So far, this research work has finished proving
the concept. Neither optimising the ejector and the system, nor designing a
114

better ejector for the system was done. This means that there is potential to
improve the cycle COP. The steam ejector used in this rig has 0.25
entrainment ratio and it may not be the best. A different design of the ejector
may be necessary to achieve a better performance.
While the steam ejector improves the cycle energy efficiency, it also creates a
new problem for the system i.e. the unstable concentration process when the
back-pressure of the ejector is greater than its critical value. As was indicated
in the Chapter 6, an unstable concentration process decreased the cycle COP,
and this must be prevented in practice. Positioning a one-way valve between
the ejector housing and concentrator proper may be an answer to prevent the
motive flow bypass. In the case of a less demanding cooling load, less heat
input is required and it should be adjusted in On/Off mode because this allows
the steam at the rated pressure to be supplied to the ejector for it to work at
design condition. So, an adequate control system may be required in practice
application.
CONCLUSION
The ejector re-compression absorption cycle provides a different way to deal
with problems, such as corrosion or low second low efficiency which may be
encountered in conventional or advanced absorption cycles when using high
temperature heat source. The results of this research confirm that this is a
practical way to solve these problems. In the case of using high temperature
heat source, the machine based on this novel cycle has the advantages of low
cost and simple construction over the advanced absorption cycles such as the
triple-effect absorption cycles. A COP of 1.013 was achieved experimentally
in this research. The author believes that this figure could be improved if the
steam ejector had been optimized. This work has completed the first step in
the cycle study. To obtain the best performance from this novel cycle, it is
required to optimize the steam ejector and absorption cycle.
115

REFERENCE
A
Addy, A.L.,Dutton, J. C and Mikkelsen, C. D., (1981), Supersonic Ejector-
Diffuser Theory and Experiments, Department of Mechanical and Industrial
Engineering, Engineering Experiment Station, University of Illinois at
Urbana-Champaign, Urbana, Illinois 61801.
Bejan, A., (1993), Hear Transfer, John Wiley & Son, Inc., ISBN 0-471-50290-
1.
Alefeld, G., (1983), Double Effect Triple Effect and Quardruple Effect
Absorption Machines, Proc. 16" Int. Congr. Of Refr., Paris 2,:951-956.
Alefeld, G. and Radermacher, R., (1994), Heat Conversion System, CRC
Press Inc., ISBN 0-8493-8928-3.
Altenkirch, E.and Tenckhoff, B., (1914), Absorptionskaeltemaschine zur
kontinuierlichen Erzeugung vonKaelte und Waerme oder acuh von Arbeit,
September 22, German Patent 278,076.
Anand, G., Erickson, D. C, (1999), Identification and Evaluation of Advanced
GAX Cycles for Space Conditioning, Munich: Proceeding of the Intemational
Sorption Heat Pump Conference, March 24-26, pp.507-521.
Aphomratana, S., (1994), A Theoretical and Experimental Investigation of a
Combined Ejector-absorption Refrigerator, PhD thesis. The University of
Sheffield.
ASHRAE Handbook, (1993), Fundamentals, American Society of Heating, pp
17.81-17.83, Refrigeration and Air-Conditioning Engineers, Inc, ISBN 0-
910110-96-4.
116
B
Bassols, J., Schneider, R., Veelken, H., Kuckelkom, B. and Ohrt, D., (1994),
1st Operation Results of a Gas-fired 250 kW Absorption Heat Pump with
Plate-fin Heat Exchangers, New Orleans: Procedings of the Intemational
AbsorptionHeat Pump Conference, ASME AES-Vol. 31, January 19-21, pp.
73-78,1994.
Burgett, L. W., Byars, M. D. and Schultz, K., (1999), Absorption Systems:
The Future, More Than a Niche?, Munich: Proceedings of the Intemational
Sorption Heat Pump Conference, pp.13-24, March 24-26.
C
Cacciola, G., Restuccia, G. and Rizzo, G., (1990), Theoretical Performance of
an Absorption Heat Pump Using Ammonia-Water-Potassium Hydroxide
Solution, Heat Recovery System & CHP, Vol. 10, No. 3, pp 177-185.
Cengel, YA. and Boles, M. A., (1994), An Engineering Approach to
Thermodynamics, 2"'' ed., McGraw-Hill Inc., ISBN 0 07 113249 X.
Chen, L.T., (1988), A New Ejector-Absorber Cycle to Improve the COP of an
Absorption Refrigeration System, Aren;t Energy, Vol. 30, pp 37-51.
Cheung, K., Hwang, Y., Judge, J. F., Kolos, K., Singh, A. and Radermacher,
R., (1996) Performance Assessment of Multistage Absorption Cycles,
Intemational Journal of Refrigeration, Vol. 19 No. 7, pp. 473-481.
Chung, H., Huor, M. H., Prevost, M. and Bugarel, R., (1984), Domestic
Heating Application of an Absorption Heat Pump, Directly Fired Heat Pumps,
Procs. Int. Conf. Uni. Of Bristol.
D
Dence, A. E., Nowak, C. C. and Perez-Bianco, H., (1996), A Novel GAX Heat
Exchanger for Cooling Applications, Montreal: Proceedings of the
117

Intemational AB-sorption Heat Pump Conference, pp.595-602, September 17-
20.
DeVault, R. C. and Marsala, J., (1990), Ammonia-Water Triple-effect
Absorption Cycles, ASHRAE Trans. Vol. 96, No. 1 pp. 676-682.
Dorgan, C. B., Leight, S. P. and Dorgan, C. E., (1995), Application Guide for
Absorprion Cooling/Refrigeration Using Recovered Heat, ASHRAE, Inc.,
ISBN 1-883413-26-
E
Eames, I. W. and Aphomratana, S., (1996), Jet-Pump Air Conditioning
Powered by Waste Heat From A District Heating System, Built Environment -
Trends and Challenges, vol 1, pp 141-151, ASHRAE Conf. Proc, Singapore,
June.
Eames, I.W. and Aphomratana, S., (1995), A Novel Ejector/Absorption Cycle
Refrigerator for Building Air Conditioning, Proc. CIBSE National
Conference, Eastboume.
Eames, I.W., Georghiades, M., Tucker, R.J. Aphomratana, S. and Wu, S.,
(1996), Combined Ejector-Absorption Cycle Technology for Gas-Fired Air
Conditioning, Proc. Ab-Sorption 96, Vol. I, pp. 201-208, Sept. 17-20, Canada.
Eames I. W., Wu, S., (1998), Worrel M., Observations on the Operation of
Ejectors for Applications m Jet-Pump Refrigeration Powered by Low-Grade
Heat, (in print).
ESDU, (1986), Ejectors and Jet Pumps, Design for Steam Driven Flow,
Engineering Science Data Item 86030, Engineering Science Data Unit,
London.
118

F
Feldman, K.T., Jensen, CM., Kim, K J. and Razani, A., (1998), A New
Absorption Heat Pump, ASHRAE Transactions, 104, PT IB, 1427-1433.
G
Garimella, S., Lacy. D. and Stout, R. E., (1994), Investigation of Triple-effect
Cycle Absorption Heat Pump for Light Commercial Applications, AES, Vol.
32, pp. 23-32.
Gopalnarayanan, S. and Radermacher, R., (1996), Analysis of a Low Pressure
Triple Effect Ammonia-water Cycle in Multiple Operation Modes,
Intemational Ab-Sorption Heat Pump Conference, Ab-Sorption '96, Vol. 1,
pp. 253-260, ISBN 0-660-16598-8.
Gosney, W. B., (1982), Principles of Refrigeration, Cambridge University
Press, ISBN 0521236711.
Gu, Z., Feng, S. and Yu, Y., (1996), Absorption-Ejector Hybrid Refrigeration
Cycle Powered by Low Grade Heat, Proc. Ab-Sorption 96, Vol. I, pp. 177-
182, Sept. 17-20, Canada.
H
Hellmann, H. M., Grossman, G., (1996), Improved Property Data Correlations
of Absorption Fluids for Computer Simulation of Heat Pump Cycles,
ASHRAE Transaction, Vol. 102,1, 980-997.
Herold, K. E., He, X., Erickson, D. C, Rane, M. V., (1991), The Branched
GAX Absorption Heat Pump Cycle, Tokyo: Proceeding of Absorption Heat
Pump Conference, September 30 - October 2, pp. 127-132.
Herold, K. E., Radermacher, R. and Klein, S., (1996), Absorption Chillers and
Heat Pumps, CRC Press, INC, ISBN 0-8493-9427-9.
119

Hodge B. K., Koenig, K., (1995), Compressible Ruid Dynamics, Chap. 2 3 ,
pp 54-62, pub. Prentice Hall Inc., ISBN 0 13 308552 X.
Homma, R., Fujikura, K., Nishiyama, N. and Nakamura, M., (1996),
Development of a High-performance Absorption Chiller-heat by Use of a
Novel Working fluid, Proc. Ab-Sorption 96, Vol. I, pp. 51-58, Sept. 17-20,
Canada.
Hou, M., Tan, S., (1992), Nucleate Boiling Heat Transfer of Lithium
BromideAVater Solution on a Low Finned Tube, ASHRAE Transaction, vol.
98,2,pp.44-50.
I
Inoue, N., lizuka, H. and Ninomiya, Y., (1993), COP Evaluation for Advanced
Ammonia-Based Absorption Cycles, AES-Vol. 31, 1-6, Intemational
Absorption Heat Pump Conference, ASME.
Irvine, T. F. Jr, Liley, P. E., (1984), Steam and Gas Tables with Computer
Equations, Appendix I, III, Academic Press.
Ivester, D. N. and Shelton, S., (1993), Varying Heat Exchanger Parameters in
the Triple-effect Absorption Cycle, Intemational Absorption Heat Pump
Conference, ASME, AES, Vol. 31, pp243-250.
Ivester, D. N. and Shelton, S. V., (1996), Optimized Evaporator and Generator
Temperature for the Triple-effect Absorption Cycle, Intemational Ab-Sorption
Heat Pump Conference, Ab-Sorption '96, Vol. 1, pp. 429-441, ISBN 0-660-
16598-8.
lyoki, S., Iwasaki, S. and Uemura, T., (1990), Vapour Pressure of the Water-
Lithium Bromide-Lithium Iodide System, J. Chem. Eng. Data, 35,429-433.
120

lyoki, S., Kuriyama, Y., Tamaka, H., Kira, K., Okable, T. and Uemura, T.,
(1993), Vapour Pressure of Water + Lithium Chloride + Lithium Nitrate
System, J. Chem. Thermodynamics, 25,569-577.
K
Karimi, A., (1977), Laminar Film Condensation on Helical Reflux Condensers
and Related Configurations, Int. J. Heat Mass Transfer, vol. 20, pp. 1137-
1144.
Kim, J.-S., Lee, H. and Won, S.-H., (1995), Vapour Pressure of Water +
Lithium Chloride + Ethylene Glycol and Water + Lithium Chloride + Lithium
Bromide + Ethylene Glycol, J. Eng. Data, 40,496-498.
Kuhlenschmidt, D., (1973), Absorption Refrigeration System with Multiple
Generator Stages, U.S. Patent No. 3717007.
L
Lange, CA.G.M, Oving, G J., (1999), Water-Lithium Chlorate (LiCI03) -
Evaluation of a Working Pair for Absorption Heat Pumps, Munich:
Proceeding of the Intemational Sorption Heat Pump Conference, March 24-
26,pp.l93-195.
Lee, R. J., DiGulio, R. M., Jeter, S. M., Teja, A. S., (1990), Properties of
Lithium Bromide - Water Solutions at High Temperatures and Concentrations
- II: Density and Viscosity, pp. 709 - 713, Symposium papers, ASHRAE
winter meeting, 10 - 14 Feb., Aflanta, Georgia.
Lienhard, J. H., (1987), A Heat Transfer Textbook, 2"'^,Prentice-Hall, Inc.,
ISBN 0-13-385089-7 025.
M
Morawetz, E., (1989), Sorption-Compression Heat Pump, Int. J. Energy
Research, Vol. 13, pp. 83-102
121

Munson, B., Young, D., T. Okiishi, (1989), Fundamentals of Ruid Mechanics,
John Wiley & Sons, Inc.
P
Patterson, M. R., Perez-Bianco, H., (1988), Numerical Fits of the Properties of
Lithium-Bromide Water solutions, ASHRAE Transaction, Vol. 94, 2, 2059-
2077.
R
Rane, M. V., Erickson, D. C, (1994), Advanced Absorption Cycle: Vapour
Exchanger GAX, New Orleans: Proceedings of the Intemational Absorption
Heat Pump Conference, ASME AES-Vol. 31 January 19-21, pp. 25-32.
Riffat, S.B., Shankland, N J. and Wong, C.W., (1994), Rotary Absorption -
Recompression Heat Pump, Building Serv. Eng. Res. Techol. 15(1) 27-30.
Riffat, S.B., Webb, R. A., Afonso, A., Oliveira, A. Siren, K. E. and Karola, A.,
(1996), An Efficient Rotary Absorption/Recompression Heat Pump for Air-
Conditioning, Proceedings of Ab-Sorption 96, Vol. 1, pp.143-151, Sept. 17-
20.
Rohsenow, W. M., and Hartnett, J. P. and Ganic, E. N., (1985), Handbook of
Heat Transfer Applications, 2"'' ed. New York: McGraw-Hill.
S
Saravanan, R. and Maiya, M.P., (1998), Thermodynamic Comparison of
Water-Based Working Fluid Combinations for a Vapour Absorption
Refrigerarion System, Thermal Engineering, Vol. 18, No. 7, pp. 553-568.
Slooff, R., Mcmichael, A.J. and Kjellstrom, T., (1995), Global Warming and
Stratospheric Ozone Depletion: Two Source of Risk to Human Health in the
Built Environment, Proceedings of the Medical & Public Health Sessions of
the Asia-Pacific Conference on the Built Environment, Vol. 2, pp. 13-24,
Singapore, June 1-3, ISBN 981-00-6652-X (Vol. 2).
122

Stoecker, W. F., Jones, J. W., (1982), Refrigeration and Air Conditioning, nd McGraw - Hill Intemational Editions 2"^ ISBN 0-07-066591-5.
Sun, D. and Eames, I.W. Aphomratana, S., (1996), Evaluation of a Novel
Combined Ejector-Absorption Refrigeration Cycle - 1 : Computer Simulation,
Int. J. Refrig. Vol. 19, No. 3 pp. 172-180
T
Treybal, R. E., (1986), Mass-Transfer Operation, 3' '', Mcgraw-Hill Book
Company, ISBNO-07-065176-0.
Z
Zaltash, A. and Grossman, G., (1996), Simulation and Performance Analysis
of Basic GAX and Advanced GAX Cycles with AmmoniaAVater and
AmmoniaAVater/LiBr Absorption Fluids, Ab-Sorption 96, Vol. II. Pp. 445-
452, September 17-20, Canada, ISBN No. 0-660-16599-6.
Ziegler, F., (1985), Advanced Absorption Cycles, Proc. Int. Workshop on
Heat Transformation and Storage, 9-11 Oct., Ispra, Italy. Rep. No.
S A./I.04.D2. 8535., CEC, Joint Research Center, Ispra Establishment.
Ziegler, F. and Alefeld, G., (1993), Comparison of Multi-Effect Absorption
Cycles, Intemational Absorption Heat Pump Conference, ASME, Vol.31,
pp.257-264.
123

APPENDIX A
Referring to Figure Al , the thermodynamic property relationships for an ideal
gas across a normal shock wave are as follows, (Hodge and Koenig 1995).
shock wave \
flow
4
Static pressure ratio;
Density ratio;
Mach Number;
Total temperature ratio;
Total pressure ratio;
/ 1
Figure Al
Ps _2jMl y-1
P^ y +1 X +1
Static temperature ratio; - ^ =
l^'-^M;M^Ml-l. y - 1
n4
M 2y Y -1^
n4 j - 1 2
p, V, {y-l)Ml,+2
2 MlSy-i)+2
'(5 = 1
(5
(4
z
i + ^{r-i)M:,
y - i
2r ,,2 r - i -M:
r-i
124

APPENDIX B
Calibration of the vessels
The condenser, evaporator and measuring vessels were used to measure the
flow rates for calculation of the power input, cooling capacity, ejector
entrainment ratio and total vapour flow rate evolved from the solution. These
were calibrated and shown as in Figures Al , A2 and A3. The temperature
under which the calibrations were carried out was 20°C and the formulas were
produced by Microsoft Excel. It should be noted that quadratic relationships
were results from the heat elements or the cooling coils inside vessels.
_l E oT
Vo
lum
800
700
600 -
500
400
300
200
100
0 i
. y = 0.0037x2 + 4.0554X + 6.4602 ^
C \ 1 i 50 100 150
height, mm
200
Figure Bl Evaporator volume vs. height
125

200 400 600
height, mm
800
Figure B2 Measuring vessel volume vs. height
E
Vo
lum
e,
3500 -
3000 -
2500
2000
1500
1000
500
o<
y = -0.0217x2 +22.165x-
1 1
1.1033 j^
\ 1
50 100 150
height, mm
200 250
Figure B3 Condenser volume vs. height
126

APPENDIX C
ACCESSORIES USED IN THE EXPERIMENTAL RIG
1. Pumps:
Circulation pump for absorber
Manufacturer
Model
Type
Max flow rate
Max head
Power
Water feed back pump
Manufacturer
Model
Type
Max flow rate
Max head
Power
Evaporator circulation pump
Manufacturer
Model
Type
Max flow rate
Max head
Power
Totton Pump
NEMP 160/9 Polyproylene parts
Centrifugal
160L/min.
9m water
0.18 kW
Grosvenor Pump
Plunger pump
23L/hr.
30 bar
0.18 kW 3PH
1
Totton Pump
EMP 40/4
Centrifugal
40L/min.
4m water
240V 035A IHP
Concentrator circulation pump
Manufacturer Totton Pump
Model NEMP 40/6
Type Centrifugal
127

Max flow rate
Max head
Power
40L/min.
6m water
240V 0.45A
Hot water circulation pump
Manufacturer
Model
Type
Max flow rate
Max head
Power
Totton Pump
ND 25L/2
Centrifugal
25L/min.
2m water
2. Pressure transmitter
Manufacturer
Model
Calibrated range
Output
Rosemount Limited
2088 Absolute pressure transmitter
0 - 1 PSI X 2
0 - 2 0 bar
4 - 2 0 m A o r O - 5 V
3. Data logger
Manufacturer
Model
Input channels
Digital charmels
Data Electronics (Aust.) Pty. Ltd.
Datataker 505 Series 2
Analogue, 10 in differential or 30 in single end
4 digital input/output charmels
4. Solution flow meter
Manufacturer
Scale
Platen
0 - 2.8 L»min. \ (calibrated at 40'C)
128