WSTA Market Overview
28
18TH – 20TH MAY 2015 THE 35TH with data from the WSTA Market Overview London Wine Fair 2015 Edition
Transcript of WSTA Market Overview

1 8 T H – 2 0 T H M A Y 2 0 1 5
T H E 3 5 T H
with data from the
WSTA Market Overview
London Wine Fair 2015 Edition
Contents
The UK Alcohol Industry
The Wine Story
The Spirits Story
A Responsible Industry
Taxation
Exclusive: IWSR Data - UK Wine data - UK Spirits data
4
8
12
16
18
22
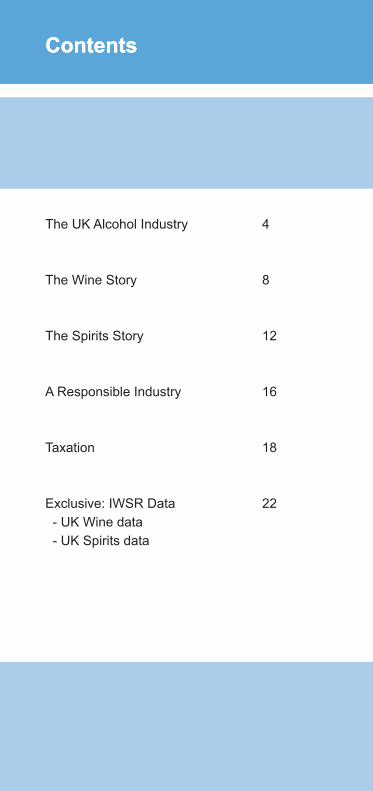
Contents
Contents
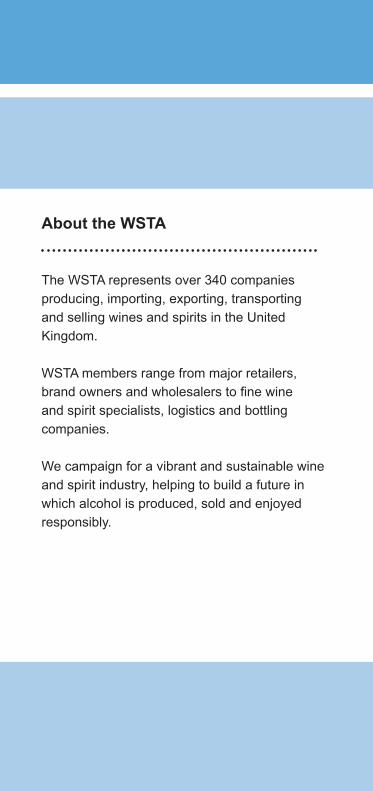
About the WSTA
The WSTA represents over 340 companies producing, importing, exporting, transporting and selling wines and spirits in the United Kingdom.
WSTA members range from major retailers, brand owners and wholesalers to fine wine and spirit specialists, logistics and bottling companies.
We campaign for a vibrant and sustainable wine and spirit industry, helping to build a future in which alcohol is produced, sold and enjoyed responsibly.
Contents

page 4
Most popular drinks in the UK
At home
Red wineWhite wineLager
LagerCiderAle
White wineRed wineLager
In a pub In a restaurant
The UK alcohol industry is worth
£39 billion in sales
The UK Alcohol Industry

page 5
LWF2015The WSTA Market OverviewThe UK Alcohol Industry
Employment
Wine & spirits directly and indirectly support
512,000 jobs
69% of these jobs are directly dependent on the industry’s activity
+ 76,000 more through retailers= 588,000 jobs

page 6
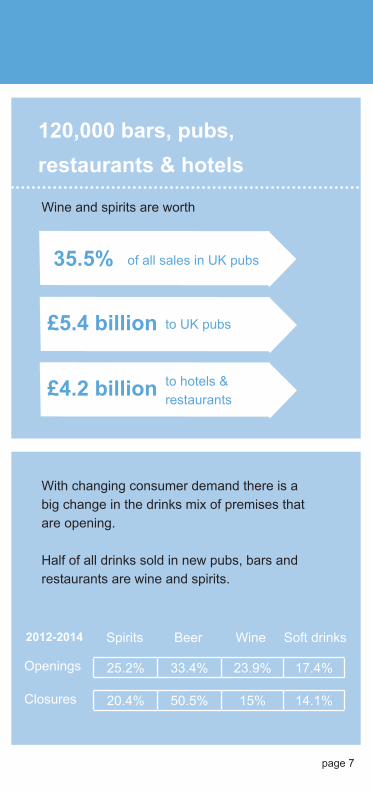
Bars, pubs and restaurants
The UK Alcohol Industry
Wine £3.9 billion - 17.2%
Spirits £5.3 billion - 23%
RTDs £330 million - 2.4%
204,282 licensed premises in the UK and 570,044 personal license holders
£9.6 billion in sales to the on trade
£10.4 billion in sales to the off trade
Wine and spirits are worth
page 7
LWF2015The WSTA Market Overview
Wine and spirits are worth
Openings
Spirits2012-2014 Beer Wine Soft drinks
Closures
£5.4 billion
£4.2 billion
35.5%
25.2% 33.4% 23.9% 17.4%
20.4% 50.5% 15% 14.1%
of all sales in UK pubs
to UK pubs
to hotels & restaurants
With changing consumer demand there is a big change in the drinks mix of premises that are opening.
Half of all drinks sold in new pubs, bars and restaurants are wine and spirits.
The UK Alcohol Industry
120,000 bars, pubs, restaurants & hotels

page 8
The Wine StoryThe Wine Story
The UK wine market is the sixth largest wine market in the world
60% of UK adults (30 million people) drink wine

page 9
LWF2015The WSTA Market Overview
in economic activity
in total contribution to the public purse (duty, VAT, corporation and income tax)
in duty and VAT paid by consumers
in sales
£17.3 billion
£8.7 billion
£5.7 billion
£10 billion
The Wine Story
The wine industry generates
The wine industry is currently worth £6 billion to shops £4 billion to bars, pubs and restaurants

page 10
The Wine Story
600 millionbottles of wine are bottled in the UK
Wine bottles are 30% lighter than they were 7 years ago, helping cut emissions
170,000 people are directly employed in wine and 100,000 are employed in the supply chain
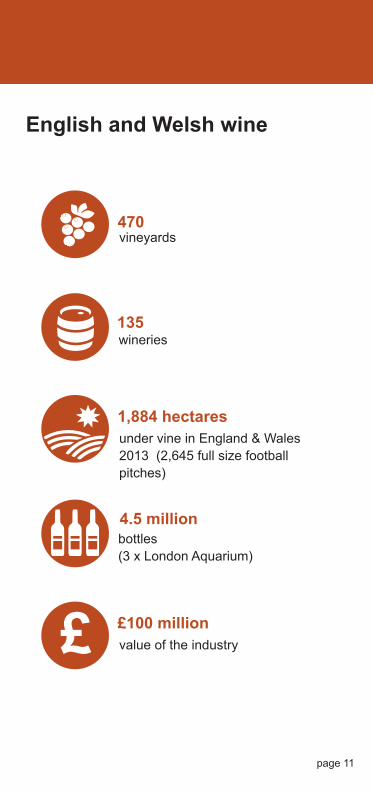
page 11
LWF2015The WSTA Market Overview
470
135
4.5 million
vineyards
wineries
bottles(3 x London Aquarium)
1,884 hectares
£100 million
under vine in England & Wales 2013 (2,645 full size football pitches)
value of the industry
The Wine Story
English and Welsh wine
£

page 12
The Spirits Story
1.1 billion litres were exported from the UK to foreign markets in 2013
48% of UK adults (24 million people) drink spirits
139 millionbottles of gin
58.5 millionbottles of vodka
1.2 billionbottles of whisky

page 13
LWF2015The WSTA Market OverviewThe Spirits Story
in economic activity
in total contribution to the public purse (duty, VAT, corporation and income tax)
in duty and VAT paid by consumers
in sales
£28.2 billion
£6.9 billion
£4.5 billion
£9 billion
The spirit industry generates
The spirits industry is currently worth £3.8 billion to shops £5.3 billion to bars, pubs and restaurants

page 14
The Spirits StoryThe Spirits Story
Emissions of CO2 from distillers has fallen by 94,000 tonnes since 1999taking 30,200 cars off the road
186,000 people are directly employed in spirits and 110,000 are employed in the supply chain

page 15
LWF2015The WSTA Market Overview
202 registered distilleries
Scotland
England
Wales
N Ireland
134
61
6
1
The Spirits Story

page 16
A Responsible Industry
1.3 billion units of alcohol removed from the UK market by industry
A responsible industry
130 irresponsible products removed from shelves by the Portman Group
ensured 80% of alcohol product labels contain health information
91% contain a warning about drinking while pregnant

page 17
LWF2015The WSTA Market Overview
10.1 10.19.9
9.69.4 9.4
10.811.1
1111.4
11.6
2004 2005 2006 2007 2008 2009 2010 2011 2012 2013 2014
Consumption in litres per head (+15)
19% fall in consumption from 2004 to 2014
61% of young people (11-15) have never
tried alcohol
9% of young people tried alcohol in the
last week (down from 26% in 2001)
A responsible industry
2 2 1
90% of people have heard of units (up from 79% since 1997)
page 18
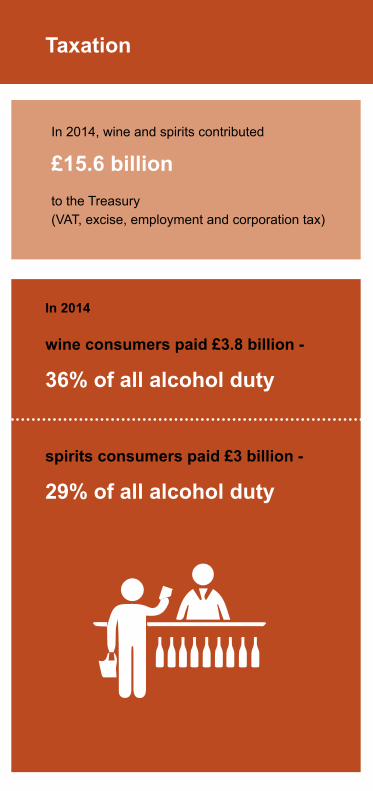
Taxation
In 2014, wine and spirits contributed
£15.6 billion to the Treasury (VAT, excise, employment and corporation tax)
In 2014 wine consumers paid £3.8 billion - 36% of all alcohol duty
spirits consumers paid £3 billion - 29% of all alcohol duty

page 19
LWF2015The WSTA Market OverviewTaxation
collected across all member states
67%
43%
25%
39%
of wine duties
of sparkling wine duties
of spirits duties
of beer duties
38.2% of all EU alcohol duty collected across member states is collected by the UK Chancellor
Since 2008, wine taxation has increased 54%
Spirits taxation has increased 41%

page 20
Taxation
wine
55%tax
74%tax
vodka blended whisky
gin
76%tax
76%tax
£5.37avgprice
£12.71avgprice
£13.06avgprice
£13.05avgprice
£2.05 on a 75cl bottle of wine+VAT
£7.75on a 70cl bottle of spirits+VAT
Current UK duty tax

page 21
LWF2015The WSTA Market OverviewTaxation
Sources
The UK Alcohol Industry CGA Strategy EY HMRC Home Office WSTA Market Report Q1 2015 YouGov The Wine Story English Wine Producers EY IWSR WSTA YouGov
The Spirits Story EY HMRC IWSR YouGov
A Responsible Industry Department of Health HMRC ONS Portman Group
Taxation EY HMRC

page 22
About the IWSR
The IWSR quantifies the global market for alcohol by volume and value, and provides insight into short-term and long-term trends.
Globally, we track overall consumption and trends at brand, quality and category level for wines, spirits and RTDs, with the aim of providing data that is as accurate and detailed as possible.
Our unique methodology allows us to get closer to what is actually consumed and understand better how markets work. The IWSR researchers conduct face-to-face interviews with 1,500 companies around the world, tapping into local expertise, with further input from 350 companies.
About
Please note that the following figures are preliminary and may be subject to change

page 23
LWF2015Exclusive data from the IWSRWineAbout
UK wine sales 2010 - 2014
UK wine sales by category 2014
(000s of 9L cases)
151,474 147,129 144,290 142,489 142,150
2010
2011
2012
2013
2014
-1.2
%
-0.2
%-2.6
%
-2.9
%
-1.7
%
Light Wine
Year on Year -1%5 years -9%
Sparkling Wine
Year on Year +12%5 years +33%
Fortified Wine
Year on Year -7%5 years -17%

page 24
UK still wine sales by colour
UK still wine sales by country of origin
52,540,000 9L cases -2%
55,160,000 9L cases -1%
14,250,000 9L cases -1%
43%
45%
12%
Australia
France
Italy
USA
Spain
South Africa
Chile
New Zealand
Germany
Argentina
24,600
16,680
16,560
14,310
13,280
11,210
10,860
4,915
3,195
2,440
+1%
-4%
-4%
-4%
-1%
+1%
+1%
+8%
-7%
+3%
1
2
3
4
5
6
7
8
9
10
2014Country
000s 9L cases
Market share % change v 2013
% change
Data from the IWSR
Red
White
Rosé
page 25
LWF2015Exclusive data from the IWSRWine
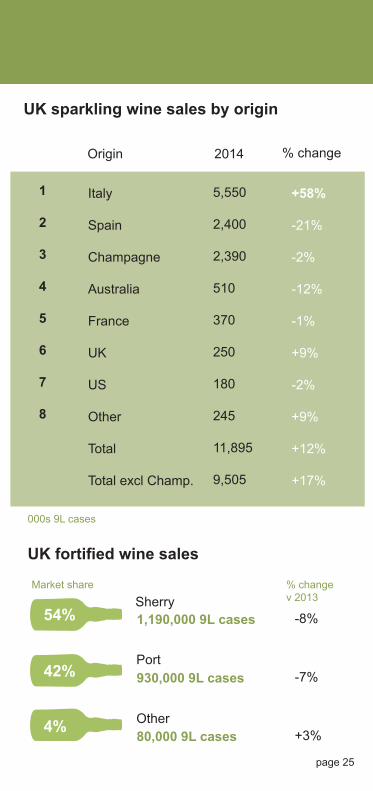
UK fortified wine sales
UK sparkling wine sales by origin
54%
42%
4%
1
2
3
4
5
6
7
8
% change v 2013
Market share
000s 9L cases
Origin 2014 % change
Data from the IWSR
Italy
Spain
Champagne
Australia
France
UK
US
Other
Total
Total excl Champ.
Sherry
5,550
2,400
2,390
510
370
250
180
245
11,895
9,505
1,190,000 9L cases
930,000 9L cases
80,000 9L cases
+58%
-21%
-2%
-12%
-1%
+9%
-2%
+9%
+12%
+17%
-8%
-7%
+3%
Port
Other

page 26
Data
UK spirits sales 2014
Vodka30.3%
Flavoured spirits19.6%
Scotch whisky18.8%
Gin9.4%
Rum9.3%
Brandy5.8%
Other: US Whiskey (5.1%), Irish Whiskey (1%), Tequila (0.7%)
Vodka9,550+2.5%
Flavoured Spirits6,175+1%
Scotch Whisky5,950-2%
Gin2,975+5%
Rum2,950+5%
Brandy1,825-2.5%
US Whiskey1,600+14%
Irish Whiskey315+2%
Tequila225+5%000s 9L cases

page 27
LWF2015Exclusive data from the IWSR
Data compiled and designed by:
Selected data kindly supplied by:
www.theIWSR.com39 Moreland StreetLondonEC1V 8BB
If you have any comments, queries or suggestions please contact Antonia Fordyce
[email protected] 0207 089 3880
www.wsta.co.ukInternational Wine & Spirit Centre39-45 Bermondsey StreetLondonSE1 3XF
Data
Scotch whisky18.8%
Rum9.3%
Flavoured Spirits6,175+1%
Gin2,975+5%
Brandy1,825-2.5%
Irish Whiskey315+2%

Wine and Spirit Trade Association www.wsta.co.uk [email protected] @wstauk
Registered Number: 410660 England
Limited by Guarantee
VAT Number: GB 243 8260 60