WSSC: Changing how utilities interact with ... - Esri€¦ · Session Title: Using GIS to Manage...
38
WSSC: Changing how utilities interact with distribution systems Session Title: Using GIS to Manage Your Water Utility Esri UC 2014 July 15, 2014
Transcript of WSSC: Changing how utilities interact with ... - Esri€¦ · Session Title: Using GIS to Manage...

WSSC: Changing how utilities interact with distribution systems
Session Title: Using GIS to Manage Your Water Utility
Esri UC 2014
July 15, 2014
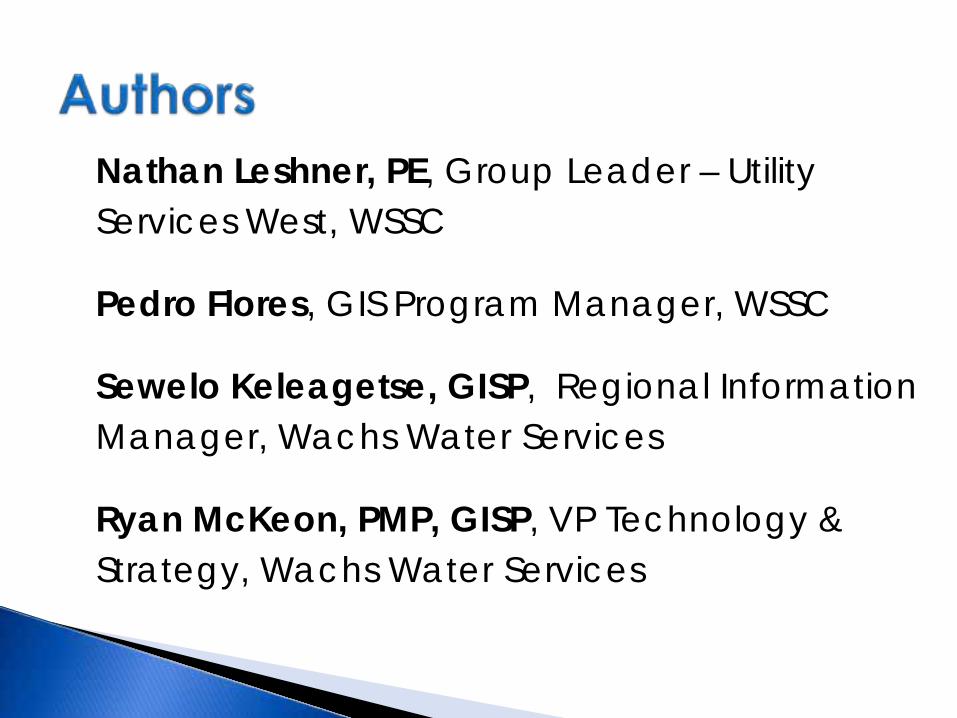
Nathan Leshner, PE, Group Leader – Utility Services West, WSSC
Pedro Flores, GIS Program Manager, WSSC
Sewelo Keleagetse, GISP, Regional Information Manager, Wachs Water Services
Ryan McKeon, PMP, GISP, VP Technology & Strategy, Wachs Water Services

}Presenters }WSSC Overview }Project Overview } Technical Processes }Accurate GIS Adding Value }Questions & Answers

Ryan McKeon, PMP, GISP, VP Technology & Strategy, Wachs Water Services
}Presenters }WSSC Overview }Project Overview } Technical Processes }Accurate GIS Adding Value }Questions & Answers
o Established in 1918
o Among the largest water and wastewater utilities in the nation (11,000+ miles of buried pipeline)
o Serving 1.8 million people (460,000 accounts) in Prince George’s and Montgomery counties in Maryland
o FY13 operating and capital budget of $1.4B
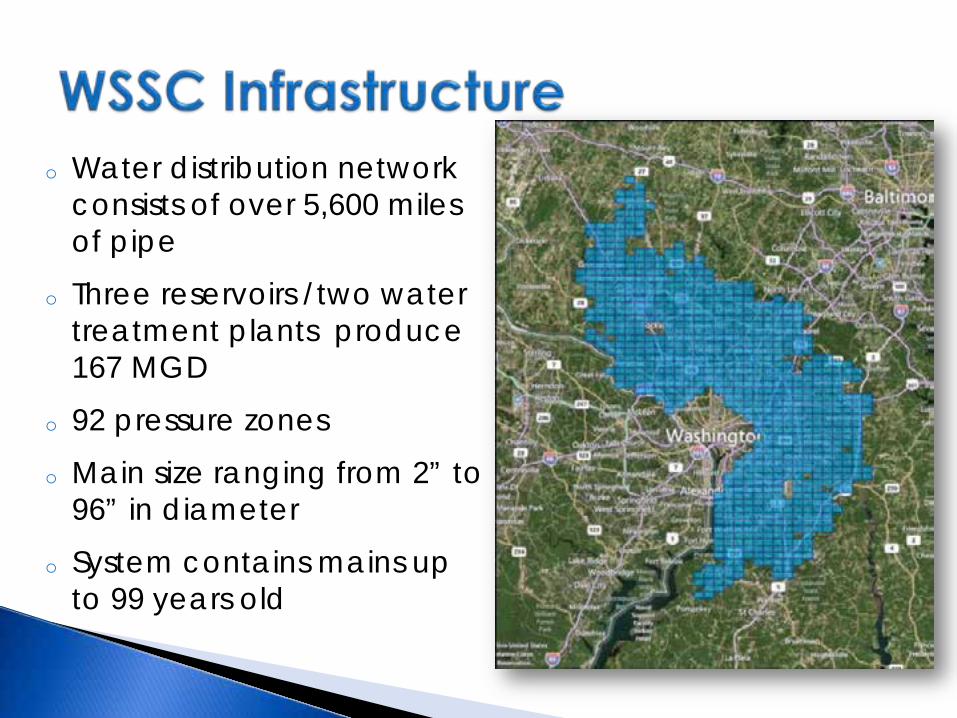
o Water distribution network consists of over 5,600 miles of pipe
o Three reservoirs /two water treatment plants produce 167 MGD
o 92 pressure zones
o Main size ranging from 2” to 96” in diameter
o System contains mains up to 99 years old

o Water dataset includes all real-world assets except domestic services and meters
o Data is maintained in 10.2 simple edge geometric network
o Primary drinking water data source was 200 scale drawings
o Primary data publishing tool is browser-based EGIS (ArcGIS Server Application)
}Presenters }WSSC Overview }Project Overview } Technical Processes }Accurate GIS Adding Value }Questions & Answers
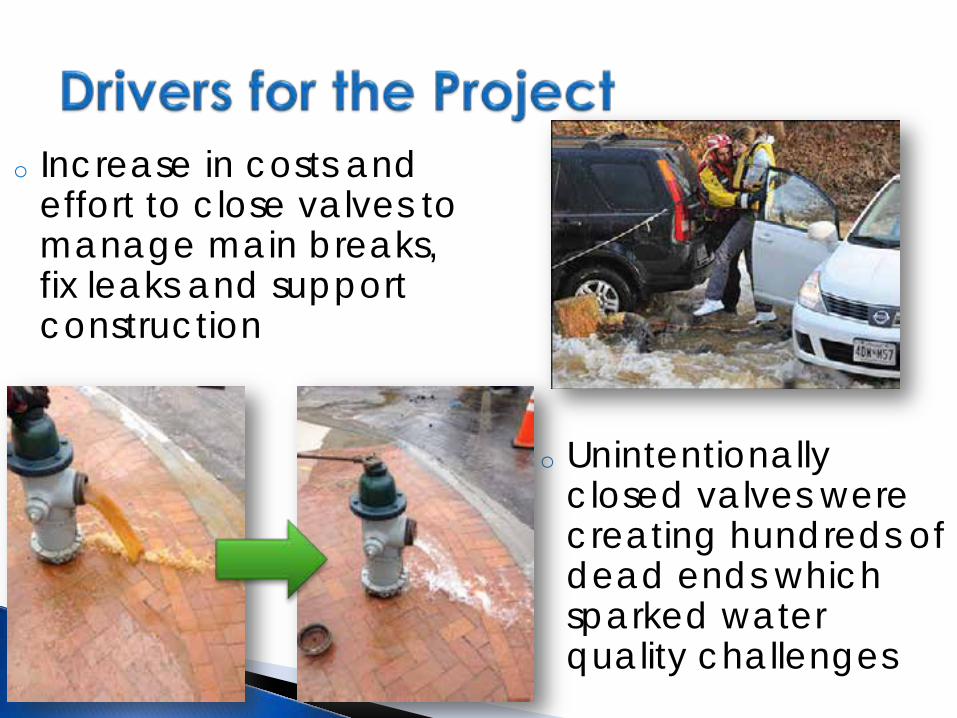
o Increase in costs and effort to close valves to manage main breaks, fix leaks and support construction
o Unintentionally closed valves were creating hundreds of dead ends which sparked water quality challenges

o GIS dataset lacked critical data elements and the mapping geometry was derived from 200 scale drawings

o Perform a physical inventory of the inline valves in the distribution system (recently extended to the transmission system)
o Capture critical data elements for all assets inventoried
o Integrate captured data into existing WSSC business systems (GIS & MMIS)
o Physically cycle assets for preventative maintenance purposes and data documentation purposes
o Return high priority assets to usability by performing light repairs

o 61,000 small system valves (≤ 12in) inventoried, tested and documented,
o 250 large valves (> 12in) inventoried, tested and documented
o Many repairs performed (11,000+) to restore usability o Sub-foot GPS captured at each asset

o 6 key attributes for each system valve inventoried
o 350,000+ attributes updated
Key Attributes Updated Current Position Operating Nut Depth Turns Close Direction Structure (Valve Box or Vault) Valve Type
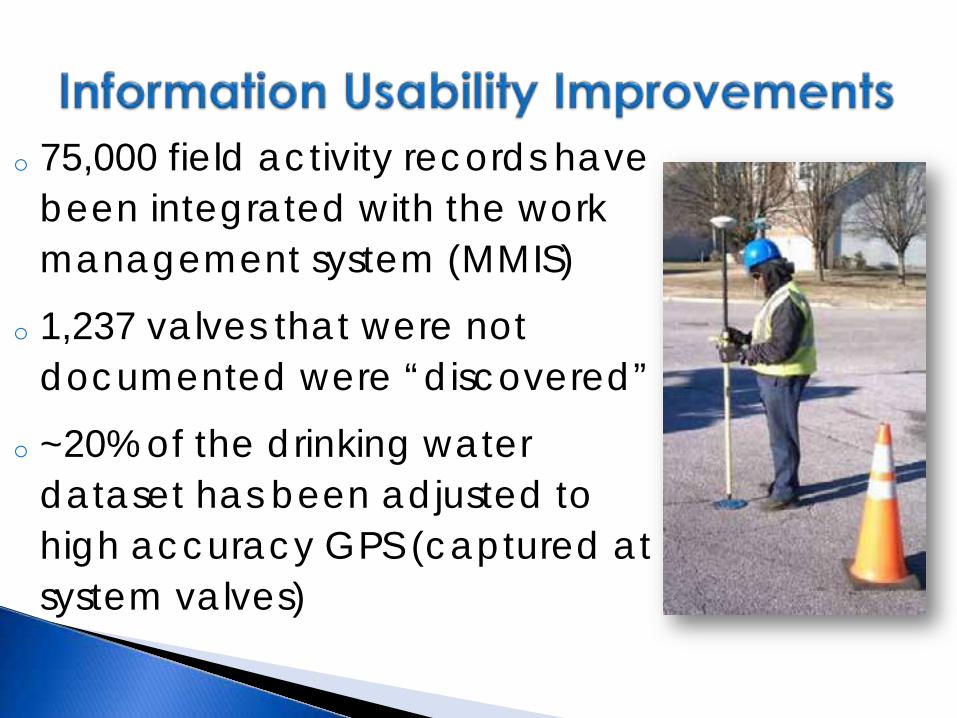
o 75,000 field activity records have been integrated with the work management system (MMIS)
o 1,237 valves that were not documented were “discovered”
o ~20% of the drinking water dataset has been adjusted to high accuracy GPS (captured at system valves)
}Presenters }WSSC Overview }Project Overview } Technical Processes }Accurate GIS Adding Value }Questions & Answers

Data Collection & Consolidation
GIS Editing & Spatial Adjustment

Data Collection & Consolidation
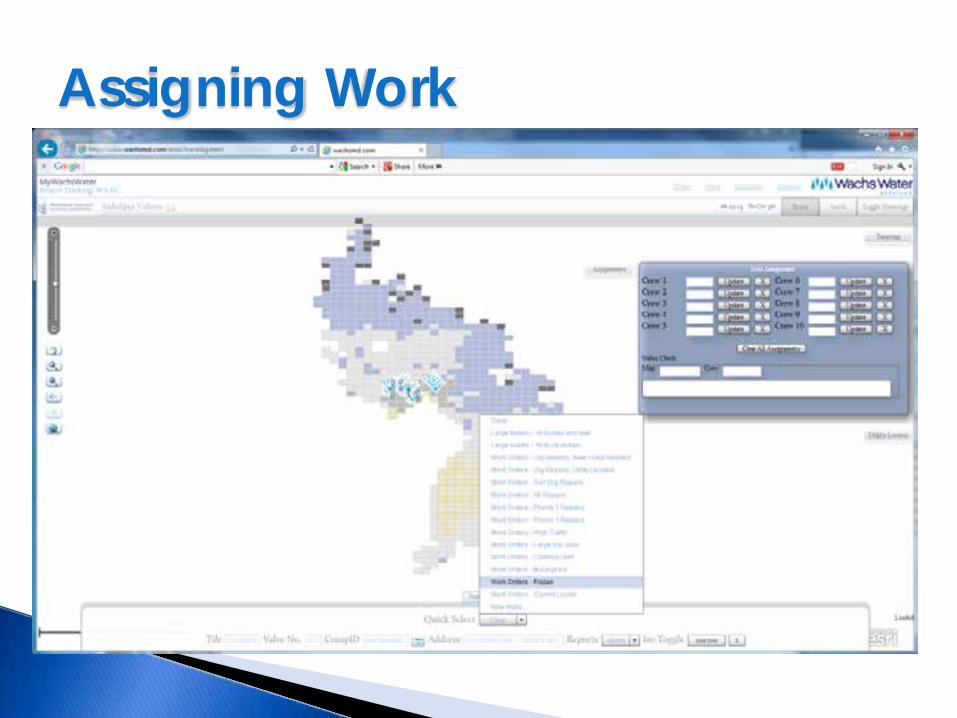
Assigning Work
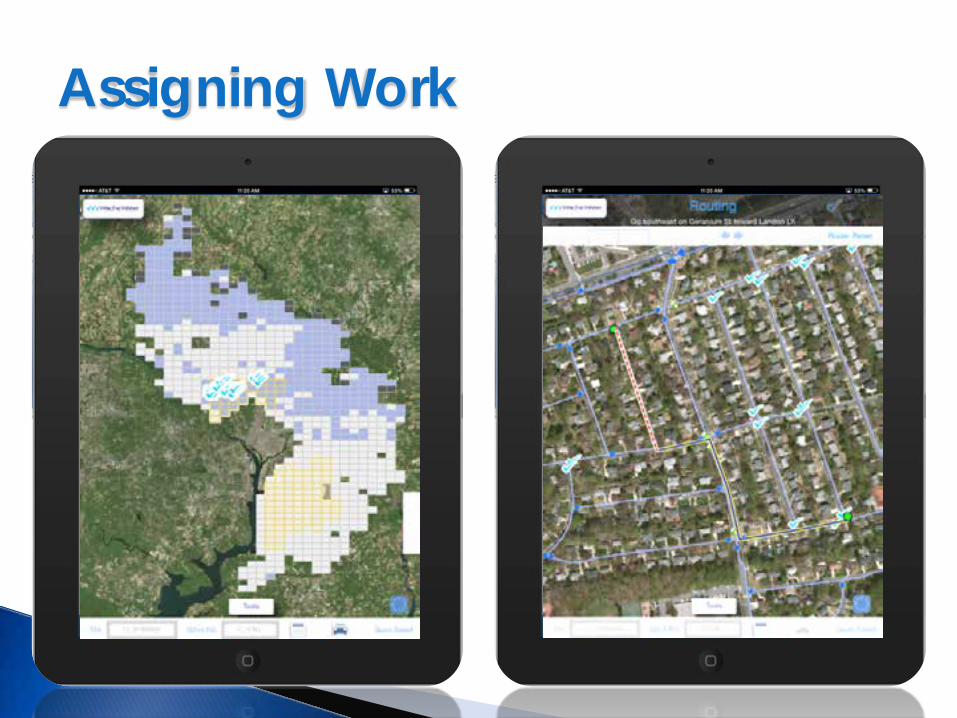
Assigning Work

o Equipment: Trimble GeoXH 2008 w/ Zephyr II
o Software : Trimble TerraSync o Methodology: Post-
Processed (PPA workflow)
GPS Data Capture
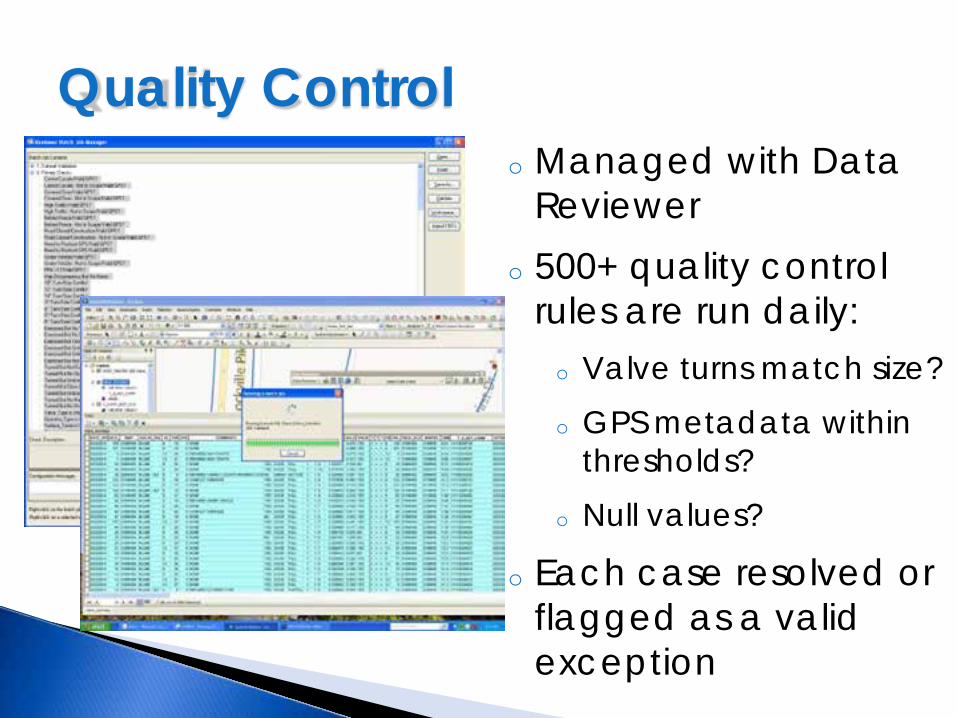
Quality Control o Managed with Data
Reviewer o 500+ quality control
rules are run daily: o Valve turns match size? o GPS metadata within
thresholds? o Null values?
o Each case resolved or flagged as a valid exception
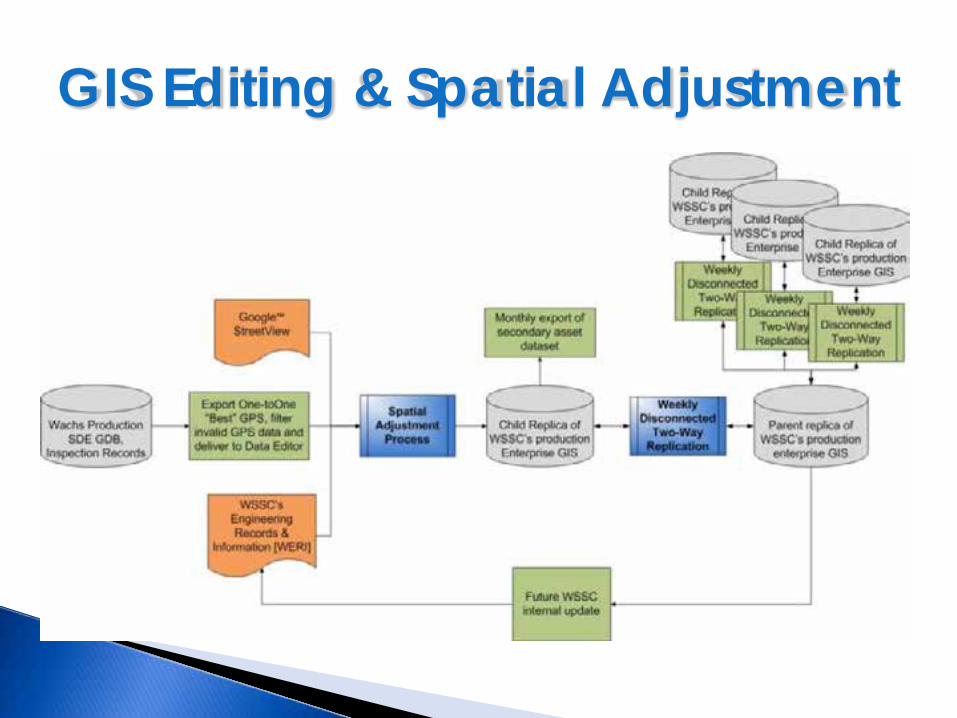
GIS Editing & Spatial Adjustment

Green Lines: Unadjusted Geometry Red Lines: Adjusted Geometry
GIS Editing & Spatial Adjustment o Establish a link table
from (X,Y) to (X,Y) on surveyed system valves
o Batch adjust with Spatial Adjustment Rubbersheet tool
o Massage with the Reshape tool (visually referencing drawings)
o More manual massaging is required with sparse control points

o 60,555 features adjusted o 33,319 pipe segment
features adjusted (1,220 miles of 5,600)
o 7,277 of 46,196 lateral segment features adjusted
o 13,434 of 61,334 system valve features adjusted
o 6,525 of 45,009 hydrant features adjusted
GIS Editing & Spatial Adjustment

GIS Editing & Spatial Adjustment
Green Lines: Unadjusted Geometry Red Lines: Adjusted Geometry
Tee 30’
Valve 30’
Hydrant 13’ Valve 27’
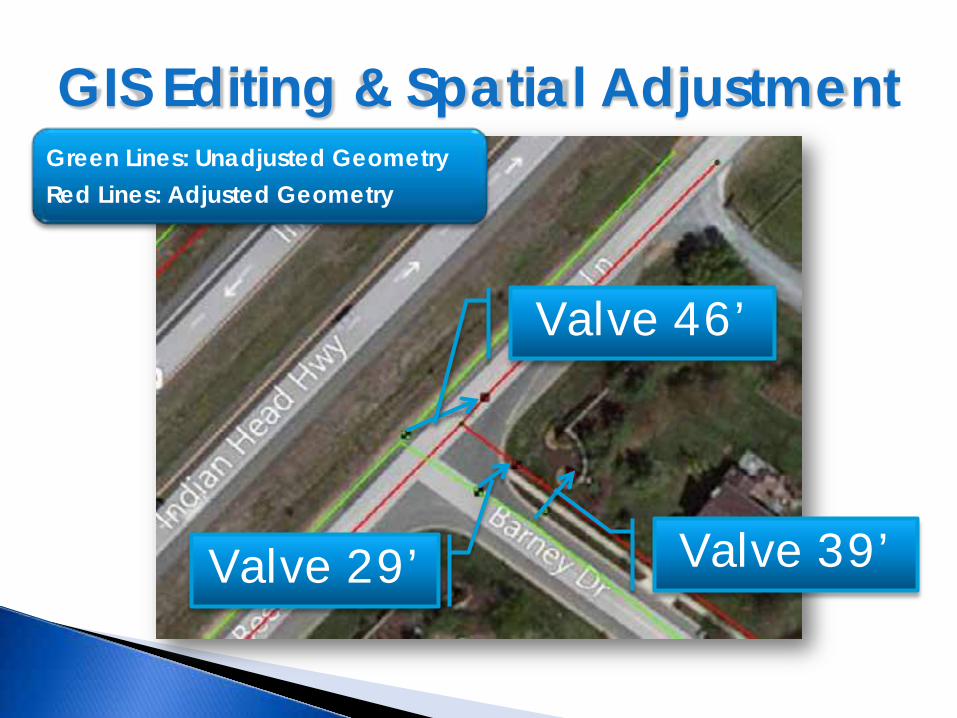
GIS Editing & Spatial Adjustment Green Lines: Unadjusted Geometry Red Lines: Adjusted Geometry
Valve 46’
Valve 29’ Valve 39’

Green Lines: Unadjusted Geometry Red Lines: Adjusted Geometry
GIS Editing & Spatial Adjustment
Valve 32’
Valve 57’
Valve 19’
Hydrant 16’
Tee 32’

Quality Control o Utilize Data Reviewer tool
o Check for cutbacks (common error when moving many features participating in a geometric network)
o Check for point features connected to more than 2 pipes (edge count for junctions)
o Water Utility Network tools are used to validate connectivity

Disconnected Two-Way Replication: synchronization takes place on command (on a weekly schedule) when the XML data change messages are imported
Integration

}Presenters }City of Atlanta Overview }Comprehensive Project Overview }GIS Implementation Phase }Accurate GIS Adding Value }Questions & Answers

Accurate GIS Adding Value
∆ = 27’
Average system valve search area reduced by 99.8%:
2,3002 ft → 32 ft
1
2 3
4 5
6
7
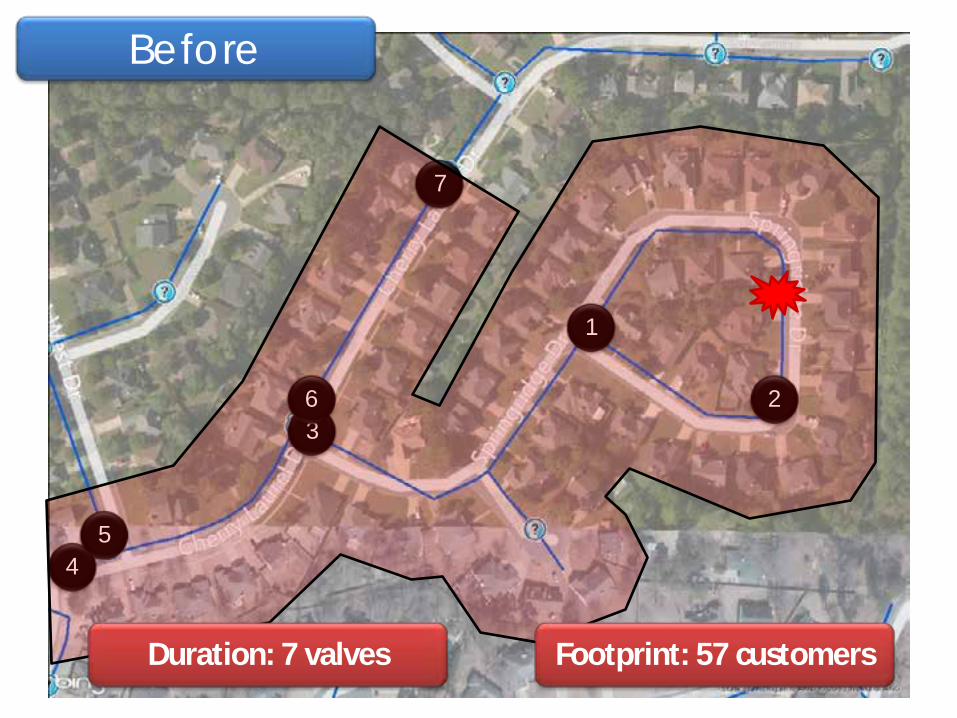
Before
Duration: 7 valves Footprint: 57 customers

1 2
3
Duration: 3 valves Footprint: 57 customers
Information Usability Improvements

Duration: 2 valves Footprint: 13 customers
Information & Asset Usability Improvements
1
2
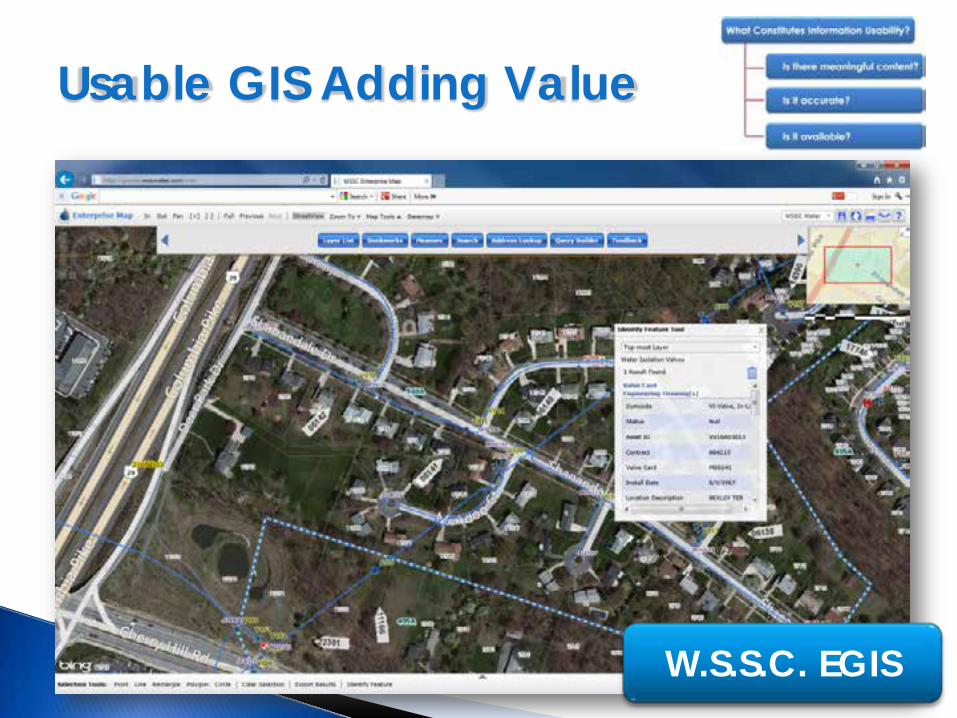
Usable GIS Adding Value
W.S.S.C. EGIS

} More useable GIS…. ◦ Much less dependence
on scanned plat cards ◦ Reduces time to find
each asset ◦ Complete asset registry ◦ Enhanced content
(attributes) ◦ Reduces risk, improves
customer satisfaction, saves money
Usable GIS Adding Value

Questions?
Esri UC 2014 Paper 1036 WSSC: Changing how utilities interact with distribution systems