Ws Day 2015
25
Wilson Sons Meet the Management Day 2015
-
Upload
wilsonsonsri -
Category
Documents
-
view
143 -
download
0
Transcript of Ws Day 2015

Wilson SonsMeet the Management Day 2015

What Drives Wilson Sons?
2
Trade Flow
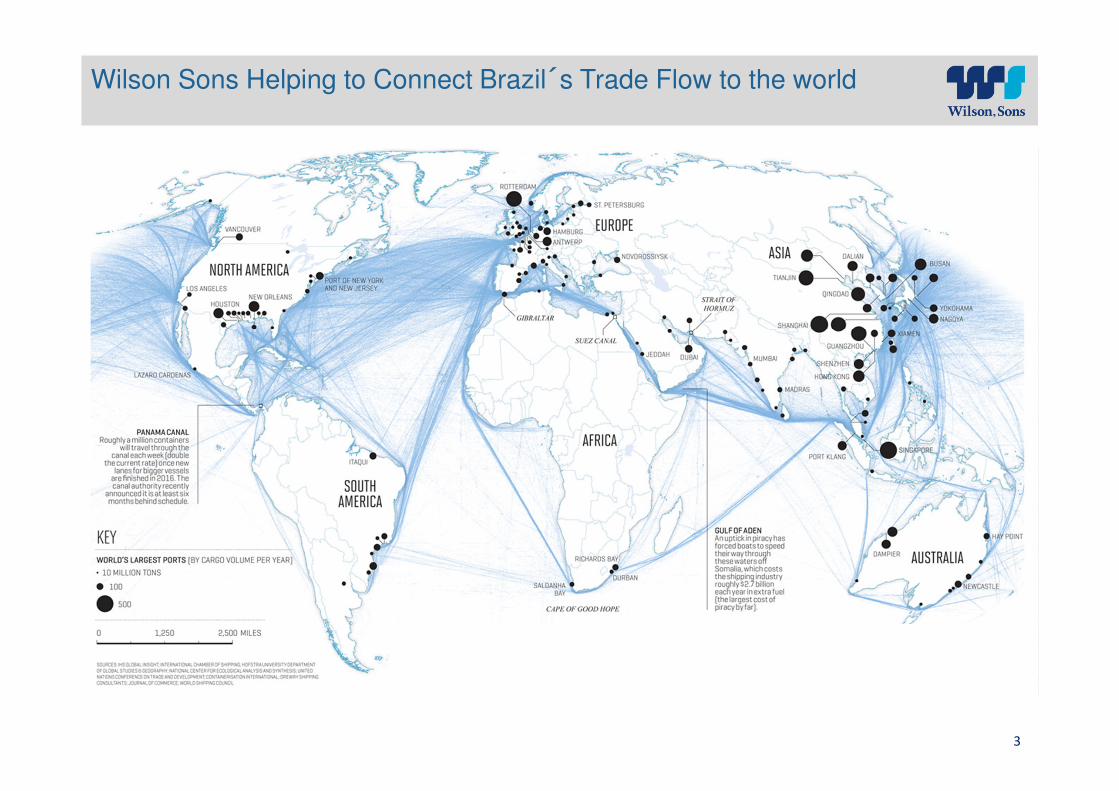
Wilson Sons Helping to Connect Brazil´s Trade Flow to the world
3

4
Total Trade to GDP ratio in BrazilSource: World Bank
25.3% 25.1%27.1%
21.9% 22.3%24.1%
26.1% 27.0%
52.2% 52.6%54.4%
47.0%
51.7%
55.1% 55.4% 55.6%
2006 2007 2008 2009 2010 2011 2012 2013
Brazil Average of G7

Trade Flow Value v Tonnes (2009 - 2014)
5
Trade Flow (US$ Billion)Source: Central Bank 2014
CAGR: 10.1% CAGR: 5.8%
Trade Flow (Billion tonnes)Source: Central Bank 2014
280.7
383.6
482.2465.7 481.7
454.2
2009 2010 2011 2012 2013 2014
559.3
658.3692.9 688.0
718.0742.0
2009 2010 2011 2012 2013 2014

1Q2015 Trade Flow Value v Trade Tonnes
6
Trade Flow (US$ Billion)Source: Central Bank 2014
Change: -13.4% Change: 9.0%
36.1 30.5
33.9
27.0
35.1
33.4
1Q14 1Q15
March
February
January
105.2
91.1
54.2 54.8
50.0 51.2
53.065.4
1Q14 1Q15
March
February
January
157.3
171.5
Trade Flow (Billion tonnes)Source: Central Bank 2014

Export Trade Partner Distribution
7
40.6
27.0
14.2
13.0
6.7
6.6
4.9
4.7
4.6
4.0
China
US
Argentina
Netherlands
Japan
Germany
Chile
India
Venezuela
Italy
Main Export Partners (US$ Million)Source: MDIC 2014
Main Product Export PartnersSource: MDIC 2014 and FMI 2015
Brazil - -1,0
World - 3,5
CountryShare of Brazil
Total Exports (%)
Projection (Real
GDP 2015)
China 18.0 6.8
United States 12.0 3.1
Argentina 6.3 -0.3
Netherlands 5.8 1.6
Japan 3.0 1.0
Germany 2.9 1.6
Chile 2.2 2.7
India 2.1 7.5
Venezuela 2.1 -7.0
Italy 1.8 0.5
Main partners weighted
average3.2

How do we see our trade flow driven assets?
8

This picture is property of Wilson Sons and can not be used or reproduced without written permission
Wilson Sons Container Terminal Efficiency Reduces Turnaround and Waiting Time for Shipowners
9Tecon Rio Grande
Road Access BR 392 conected to BR-471,
BR-116 e BR-293
Rail Access –Malha Sul operated
by Brado Logistica
Tecon Rio Grande
Inland Waterway Access via Lagoa dos Patos

This picture is property of Wilson Sons and can not be used or reproduced without written permission
Wilson Sons Container Terminals Create new Transport solutions for Exporters and Importers
10
Soya - New Product Containerisation -Tecon Rio Grande
Rice in Tecon Rio Grande
Celullose in Tecon Salvador

11
1.1 1.11.2
1.4
1.71.8
2.2
2008 2009 2010 2011 2012 2013 2014
Cabotage Growth in Brazil (# TEU M)Source: Datamar
Historical CAGR 12.2%
5,000 tons of cargo requiries:
- Cabotage: 1 vessel; or
- Rail: 72 railway carriages; or
- Road: 143 trucks.
Cabotage – National growth and growing importance for Wilson Sons
Comparative between transport typesSource: Confederação Nacional do Transporte (CNT) 2013
Transport distribution in Brazil (% tons)Source: Adapted from ILOS 2014
Historical CAGR 8.9%
51.9 53.7
66.672.7 71.6
80.986.8
2008 2009 2010 2011 2012 2013 2014
Cabotage at Wilson Sons Terminals (# TEU ‘000)Source: Wilson Sons (Tecon SSA + Tecon RG)
65.6%
19.5%
9.6%
3.4%1.8%
0.1%
Road
Rail
Cabotage
Pipeline
Water way
Air

12
Towage – Meeting the demand throughout Brazils PortsSource Wilson Sons As of March/2015
North8 tugboats
Northeast33 tugboats
Southeast21 tugboats
South14 tugboats
173,694,974
170,521,854
161,139,464
144,233,177
53,335,016
50,242,097
44,968,614
44,843,492
40,023,838
85,851,207
Rio de Janeiro
Espírito Santos
São Paulo
Maranhão
Rio grande do sul
Pará
Paraná
Santa catarina
Bahia
Others
Total cargo handled in Brazil in 2014 (ton.)Source: ANTAQ, 2014

This picture is property of Wilson Sons and can not be used or reproduced without written permission
Wilson Sons Towage increases berth productivity for ports and helps ship owners reduce fuel consumption with increased safety
13
Special Operation for Fire in the port of Santos

This picture is property of Wilson Sons and can not be used or reproduced without written permission
Wilson Sons Towage COR increases berth productivity for ports and helps ship owners reduce fuel consumption with increased safety
14
Towage Centralised Operations Room (COR)

What Drives Wilson Sons?
15
Oil & Gas

16
Oil and Gas is a Relevant and Increasing Part of Brazils GDP
The importance of Oil sector to the Brazilian GDPSource: IBP 2014
Contribution of Oil sector to the Brazilian GDP
0%
3%
6%
9%
12%
15%
-
100.0
200.0
300.0
400.0
500.0
Oil sector contribution to the Brazilian GDP, 2009 (R$ Billion) Participation in the Brazilian GDP

17
3.016.0
42.0
119.0
169.0
301.0
412.0
2008 2009 2010 2011 2012 2013 2014
The growing Brazilian Pre-Salt Oil Production (k bpd)Source: Petrobras
Pre-salt fields alreadycontributes more than27% of total oilproduction in Brazil
Brazil Has Significant and Increasing Oil Reserves and Production Particularly in Presalt

18
Wilson Sons Helping to Unlock Brazils Oil and Gas
125 km
Average Campos Basin Distances
300 km
Pre-salt Distances
Significantly Increased Distances to new Oil Rigs

Offshore Vessels – Global Fleet Utilisation v Brazil Fleet UtilisationSource: Offshore Merchant Partners AS (15 May 2015)
19

How do we see our Oil & Gas driven assets?
20

21
BRAZIL
AR
UY
CH
BO
PA
PE
Buenos Aires
Montvideo
Equatorial Margin
5% current OSV fleet
North - East
15% of current OSV fleet
Santos, Campos and Espírito Santo
80% of current OSV fleet 91% of O&G production in Brazil
The Evolving Exploration of Brazils Oil Reserves

Guarujá II Facilities
Wilson Sons Shipyard Consistently Delivering World Class Vessels

23
43.9 45.773.0
86.9109.0 109.2 108.3
152.0 146.3
182.8160.1
4.0 3.4
3.24.5
12.9 19.2 13.1
11.3 16.0
23.139.2
2004 2005 2006 2007 2008 2009 2010 2011 2012 2013 2014
EBITDA (IFRS)
EBITDA (Offshore Vessels)
47.9 49.1
76.291.4
122.7 128.4 121.4
163.3 162.3
205.9 199.3
EBITDA
Costs
Revenue
R$ Source/Denominated
US$ Source/Denominated
Net Revenues (Proforma) not correlated to exchange rate US$ M
EBITDA (Proforma) not correlated to exchange rate US$ M
Net Revenues & EBITDA
CAGR: 12.6%
CAGR: 15.3%
Estimated (Proforma) Revenue, Costs and EBITDA(Year ended Dec/14)
Annual Average Exchange RatesUS$ - R$
CAGR: -2.2%
10%90%
53% 47%
211.2278.0
325.7393.3
476.7 439.8547.6
656.6610.4
660.1 633.5
6.5
7.28.4
10.7
21.6 38.1
28.0
41.447.0
54.4 76.8
2004 2005 2006 2007 2008 2009 2010 2011 2012 2013 2014
Net Revenues (IFRS)
Net Revenues (Offshore Vessels)
217.7
285.2334.1
404.0
498.3477.9
575.6
657.4698.0 714.5 710.3
2.93
2.43
2.18
1.951.84
1.99
1.761.67
1.96
2.162.35
2004 2005 2006 2007 2008 2009 2010 2011 2012 2013 2014

24
What is important for the current market conditions
• Safe and efficient operations
• Solid balance sheet and financial flexibility
• Operational , Client and Driver diversity
• Strong customer base and relationships (+ 2 000 clients)
• CAPEX optimization
• Return capital to shareholders including dividends

Thank you. Questions?