Loops More loops Off-by-one errors Infinite loops Nested Loops.

Writing Loops
Ken Rice
Thomas Lumley
UW Biostatistics
Liege, September 2007
Writing loops in R
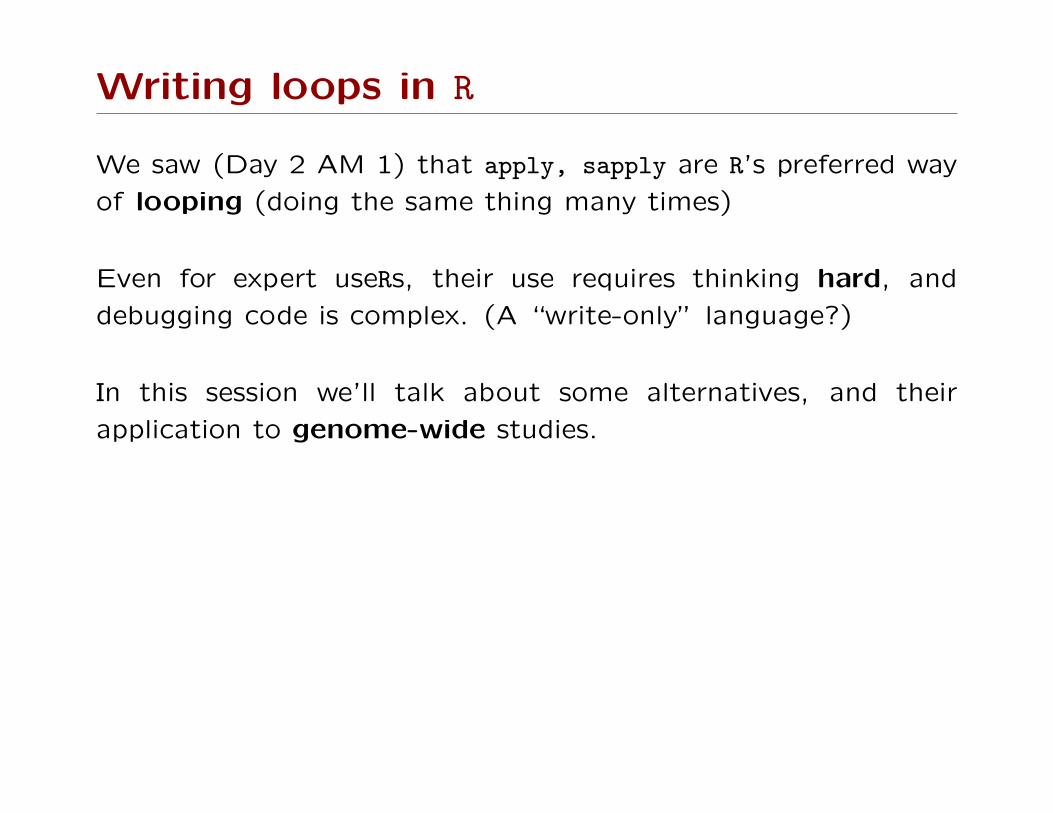
We saw (Day 2 AM 1) that apply, sapply are R’s preferred way
of looping (doing the same thing many times)
Even for expert useRs, their use requires thinking hard, and
debugging code is complex. (A “write-only” language?)
In this session we’ll talk about some alternatives, and their
application to genome-wide studies.

for loops
Your first computer program?
for(i in 1:100){
print("Hello world!")
print(i*i)
}
• Everything inside the curly brackets {...} is done 100 times
• Looped commands can depend on i (or whatever you called
the counter)
• R creates a vector i with 1:100 in it. You could use any
vector that’s convenient
for loops
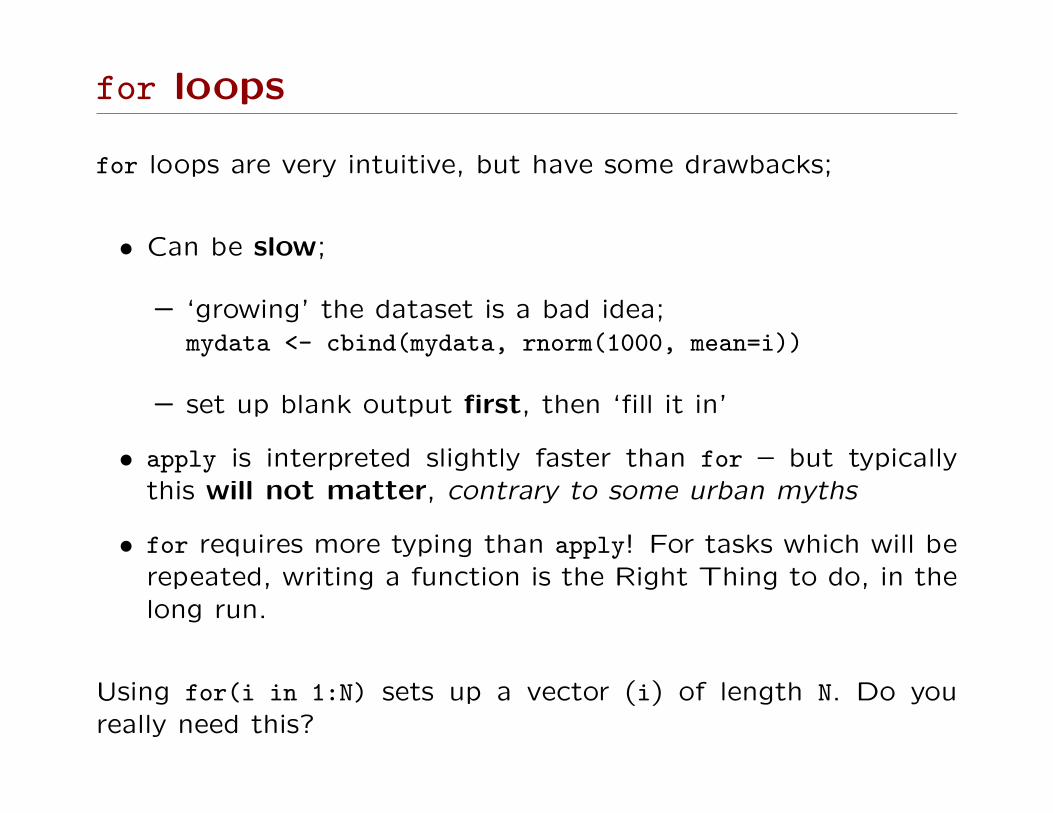
for loops are very intuitive, but have some drawbacks;
• Can be slow;
– ‘growing’ the dataset is a bad idea;mydata <- cbind(mydata, rnorm(1000, mean=i))
– set up blank output first, then ‘fill it in’
• apply is interpreted slightly faster than for – but typicallythis will not matter, contrary to some urban myths
• for requires more typing than apply! For tasks which will berepeated, writing a function is the Right Thing to do, in thelong run.
Using for(i in 1:N) sets up a vector (i) of length N. Do youreally need this?
for loops
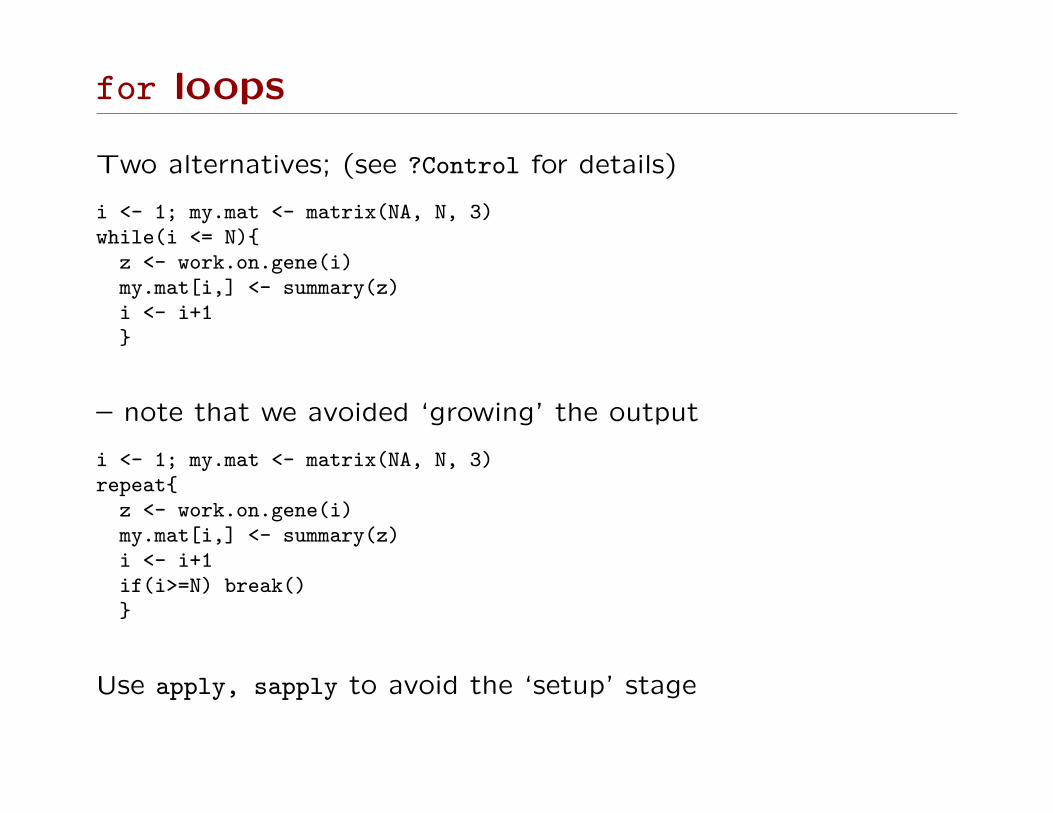
Two alternatives; (see ?Control for details)
i <- 1; my.mat <- matrix(NA, N, 3)while(i <= N){
z <- work.on.gene(i)my.mat[i,] <- summary(z)i <- i+1}
– note that we avoided ‘growing’ the output
i <- 1; my.mat <- matrix(NA, N, 3)repeat{
z <- work.on.gene(i)my.mat[i,] <- summary(z)i <- i+1if(i>=N) break()}
Use apply, sapply to avoid the ‘setup’ stage

Application to whole-genome study
Whole genome studies look very intimidating ...
Genome-wide association study identifies newsusceptibility loci for Crohn disease and implicatesautophagy in disease pathogenesis

Application to whole-genome study
... however, each p-value on that picture comes from a single
logistic regression.
There are 304,413 tests in total; if each one takes 1/10 sec, the
analysis is done in under an hour;
Time per test Total time0.01 sec 51 mins0.1 sec 8 hours 27 mins1 sec 3 days 12.5 hrs5 sec 17 days 15 hrs (!)
5 mins 3 yrs 11 months (!!!)
Cutting time per test from 1 sec → 0.1 sec is clearly worthwhile
Proposing analyses where each test takes > 5 secs is silly.
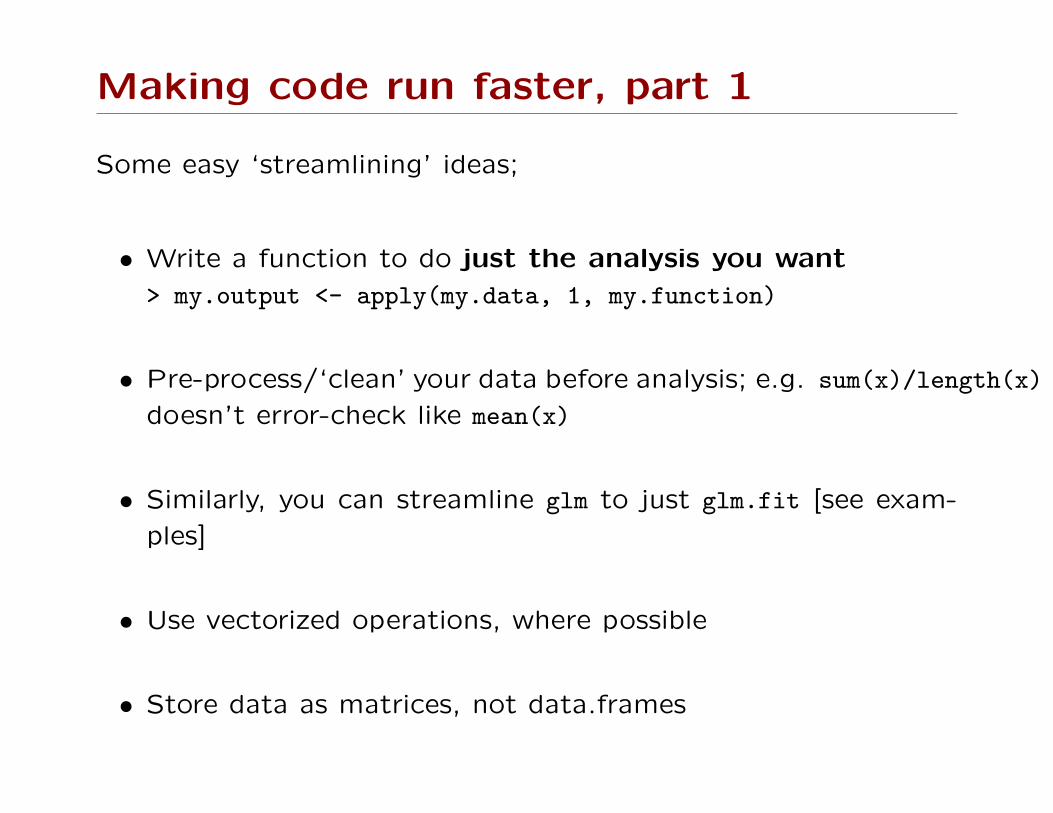
Making code run faster, part 1
Some easy ‘streamlining’ ideas;
• Write a function to do just the analysis you want
> my.output <- apply(my.data, 1, my.function)
• Pre-process/‘clean’ your data before analysis; e.g. sum(x)/length(x)
doesn’t error-check like mean(x)
• Similarly, you can streamline glm to just glm.fit [see exam-
ples]
• Use vectorized operations, where possible
• Store data as matrices, not data.frames

Making code run faster, part 2
Streamlining, for ‘experts-only’
• Write small but important pieces of code in C, and call
these from R
• Batch mode processing lets you break down e.g. the
whole genome into 23 chromosomes – great if you have 23
processors to use.
– Save your analysis in 23 output files
– read in the answers
– finally produce e.g. multi-color pictures
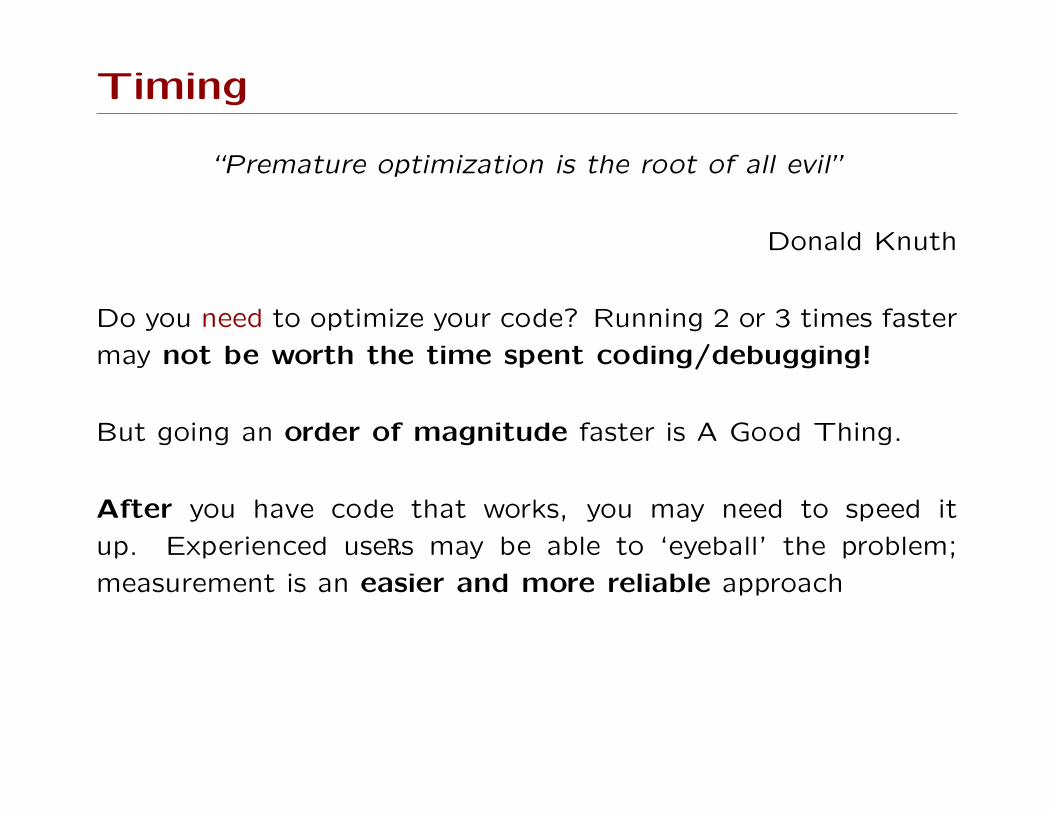
Timing
“Premature optimization is the root of all evil”
Donald Knuth
Do you need to optimize your code? Running 2 or 3 times faster
may not be worth the time spent coding/debugging!
But going an order of magnitude faster is A Good Thing.
After you have code that works, you may need to speed it
up. Experienced useRs may be able to ‘eyeball’ the problem;
measurement is an easier and more reliable approach

Timing
• proc.time() returns the current time. Save it before a task
and subtract from the value after a task.
• system.time() times the evaluation of expression
• R has a profiler; this records which functions are being run,
many times per second. Rprof(filename) turns on the profiler,
Rprof(NULL) turns it off. summaryRprof(filename) reports how
much time was spent in each function.
Remember that a 1000-fold speedup in a function used 10% of
the time is less helpful than a 30% speedup in a function used
50% of the time.

High-throughput code – caveats
We saw yesterday that ‘weird’ datasets can crash your code.These will appear in genome-wide studies, and a crash at SNP299,999 will be very frustrating.
• Some ‘weirdness’ is easy to spot;
– Everyone is homozygous– All cases missing– No variation in outcome ...
• In more complex models, it’s easier to ‘try it and see’. UsetryCatch
• When ‘weirdness’ is found, high-throughput code should;– Produce sensible output (NA, -999 etc)– Handle these appropriately in summary output