Wright 2014 - research
27
Accepted Manuscript Recalibration and validation of the Cumberland Ankle Instability Tool cutoff score for individuals with Chronic Ankle Instability Cynthia J. Wright, PhD, ATC Brent L. Arnold, PhD, ATC Scott E Ross, PhD, ATC Shelley W Linens, PhD, ATC PII: S0003-9993(14)00334-7 DOI: 10.1016/j.apmr.2014.04.017 Reference: YAPMR 55822 To appear in: ARCHIVES OF PHYSICAL MEDICINE AND REHABILITATION Received Date: 26 November 2013 Revised Date: 14 April 2014 Accepted Date: 17 April 2014 Please cite this article as: Wright CJ, Arnold BL, Ross SE, Linens SW, Recalibration and validation of the Cumberland Ankle Instability Tool cutoff score for individuals with Chronic Ankle Instability, ARCHIVES OF PHYSICAL MEDICINE AND REHABILITATION (2014), doi: 10.1016/ j.apmr.2014.04.017. This is a PDF file of an unedited manuscript that has been accepted for publication. As a service to our customers we are providing this early version of the manuscript. The manuscript will undergo copyediting, typesetting, and review of the resulting proof before it is published in its final form. Please note that during the production process errors may be discovered which could affect the content, and all legal disclaimers that apply to the journal pertain.
-
Upload
fapperforreal -
Category
Documents
-
view
212 -
download
0
description
clinical research CAI
Transcript of Wright 2014 - research
Accepted Manuscript
Recalibration and validation of the Cumberland Ankle Instability Tool cutoff score forindividuals with Chronic Ankle Instability
Cynthia J. Wright, PhD, ATC Brent L. Arnold, PhD, ATC Scott E Ross, PhD, ATCShelley W Linens, PhD, ATC
PII: S0003-9993(14)00334-7
DOI: 10.1016/j.apmr.2014.04.017
Reference: YAPMR 55822
To appear in: ARCHIVES OF PHYSICAL MEDICINE AND REHABILITATION
Received Date: 26 November 2013
Revised Date: 14 April 2014
Accepted Date: 17 April 2014
Please cite this article as: Wright CJ, Arnold BL, Ross SE, Linens SW, Recalibration andvalidation of the Cumberland Ankle Instability Tool cutoff score for individuals with Chronic AnkleInstability, ARCHIVES OF PHYSICAL MEDICINE AND REHABILITATION (2014), doi: 10.1016/j.apmr.2014.04.017.
This is a PDF file of an unedited manuscript that has been accepted for publication. As a service toour customers we are providing this early version of the manuscript. The manuscript will undergocopyediting, typesetting, and review of the resulting proof before it is published in its final form. Pleasenote that during the production process errors may be discovered which could affect the content, and alllegal disclaimers that apply to the journal pertain.
MANUSCRIP
T
ACCEPTED
ACCEPTED MANUSCRIPT
Running Head: Recalibration of the CAIT in CAI individuals Title: Recalibration and validation of the Cumberland Ankle Instability Tool cutoff score for individuals with Chronic Ankle Instability Authors name and highest academic degree (in order of authorship) Cynthia J Wright*, PhD, ATC Brent L Arnold†, PhD, ATC Scott E Ross‡, PhD, ATC Shelley W Linens§, PhD, ATC Research was conducted in the Department of Health and Human Performance at Virginia Commonwealth University, Richmond, Virginia, USA. All authors were affiliated with Virginia Commonwealth University at the time of study completion. All authors have changed affiliations since study completion. Current affiliations are indicated below. * Whitworth University † Indiana University School of Health and Rehabilitation Sciences ‡ University of North Caroline Greensboro § Georgia State University Portions of the content of this manuscript were presented at 2 national conferences: Wright CJ, Arnold BL, Ross SE, Pidcoe PE. (2011, June). Validation of a Recalibrated
Cumberland Ankle Instability Tool Cutoff Score for Chronic Ankle Instability. Poster session for the 2011 National Athletic Trainer’s Association Annual Meeting and Clinical Symposium, New Orleans, LA. Published Abstract: J Athl Train 2011: 46(3)(Suppl):S124.
Arnold BL, Wright CJ, Linens SW, Ross SE (2010, June). Recalibration of the CAIT cutoff score for chronic ankle instability. Poster presentation for the 2011 American College of Sports Medicine Annual Meeting, Denver, CO. Published Abstract: Med Sci Sports Exerc 2011: 43(5)(Suppl)S341.
No financial support was received for this research. The authors have no conflicts of interest to disclose. Shelley Linens reports a doctoral research grant from the National Athletic Trainers' Association Research and Education Foundation Corresponding author: Cynthia Wright Whitworth University 300 W Hawthorne Road Spokane, WA 99251 (509) 777-3244 Office (509) 777-4943 Fax [email protected]
MANUSCRIP
T
ACCEPTED
ACCEPTED MANUSCRIPT
1
Recalibration and validation of the Cumberland Ankle Instability Tool cutoff score 1
for individuals with Chronic Ankle Instability 2
3
Objective: To independently recalibrate and re-validate the Cumberland Ankle Instability Tool 4
(CAIT) cutoff score for discriminating individuals with and without chronic ankle instability 5
(CAI). There are concerns the original cutoff score (≤27) may be suboptimal for use in the CAI 6
population. Design: Case-control. Setting: Research laboratory. Participants: Two independent 7
datasets were used. Dataset 1 included 61 individuals with a history of ≥1 ankle sprain and ≥2 8
episodes of giving-way in the past year (CAI), and 57 participants with no history of ankle sprain 9
or instability in their lifetime (uninjured). Dataset 2 included 27 uninjured participants, 29 CAI 10
participants, and 26 individuals with a history of a single ankle sprain and no subsequent 11
instability (copers). Interventions: All participants completed the CAIT during a single session. 12
In Dataset 1 a receiver operating curve (ROC) was calculated using CAIT score and group 13
membership as the test variables. The ideal cutoff score was identified using Youden’s index. 14
The recalibrated cutoff score was validated in Dataset 2 using ROC analysis and clinimetric 15
characteristics. Main Outcome Measure(s): CAIT cutoff score and clinimetrics. Results: In 16
Dataset 1, the optimal cutoff score was ≤25, which is lower than previously reported. In Dataset 17
2 the recalibrated cutoff score demonstrated a sensitivity of 96.6%, specificity of 86.8%, positive 18
likelihood ratio (LR+) of 7.318, negative likelihood ratio (LR-) of 0.039. There were seven false 19
positives and one false negative. Conclusions: The recalibrated CAIT score demonstrated very 20
good clinimetric properties; all properties improved when compared to the original cutoff. 21
Clinicians using the CAIT should utilize the recalibrated cutoff score to maximize test 22
characteristics. Caution should be taken with copers, who had a high rate of false positives. 23
MANUSCRIP
T
ACCEPTED
ACCEPTED MANUSCRIPT
2
24
Keywords: Functional Ankle Instability; Ankle Sprain; Clinimetrics; Patient Questionnaire; 25
Self-Reported Measure; Test Characteristics 26
27
List of abbreviations: 28
CAI Chronic Ankle Instability 29
CAIT Cumberland Ankle Instability Tool 30
ROC receiver operating curve 31
LR+ positive likelihood ratio 32
LR- negative likelihood ratio 33
AUC area under the curve 34
MANUSCRIP
T
ACCEPTED
ACCEPTED MANUSCRIPT
3
Chronic ankle instability (CAI) is a common sequelae of lateral ankle sprain, affecting 35
approximately 32-47% of ankle sprain patients.1-3 A symptomatically defined pathology, CAI is 36
characterized by recurrent sprains and/or recurrent instability (e.g. episodes of “giving-way”) 37
after an ankle sprain.4, 5 Recent articles have reviewed the problems and variability involved with 38
a symptomatic definition of CAI.5, 6 39
Patient questionnaires can serve various functions. One function can be to provide 40
reliable measurement of patient reported symptoms such as pain, functional limitations, and 41
instability occurrence with specific activities. A questionnaire that has been widely used in ankle 42
instability literature,7-10 translated into multiple languages,11, 12 and shown to be a significant 43
predictor of ankle instability status,13 is the Cumberland Ankle Instability Tool (CAIT).14 First 44
published by Hiller et al.14 in 2006, this nine question survey focuses on symptoms of instability 45
during several different physical tasks. The CAIT results in a score ranging from zero to 30 with 46
higher scores indicating higher stability. Original research established a cutoff score of ≤27 as 47
indicative of CAI group membership.14 We observed in our laboratory that the established cutoff 48
score appeared to be too high. Individuals who had a history of ankle sprain, but subjectively 49
reported that their ankle “didn’t really bother them” were occasionally classified as having CAI 50
based on the established cutoff score of ≤27. Perhaps because of this issue, some authors have 51
independently chosen to use a lower cutoff score (i.e. ≤23 and ≤24) than what was originally 52
validated by Hiller et al.15, 16 Recently, the International Ankle Consortium recommended that a 53
cutoff score of ≤24 be used in CAI inclusion criteria.17 However, to our knowledge statistical 54
evidence to support the selection of a lower cutoff value has not been reported in the literature. 55
Further investigation into the question of appropriate cutoff scores for the CAIT 56
highlighted an important limitation in the criteria used to establish the original cutoff score. 57
MANUSCRIP
T
ACCEPTED
ACCEPTED MANUSCRIPT
4
Hiller et al.14 used a history of ankle sprain alone to define group membership when calculating 58
the cutoff score. This created a group designation of “sprained” vs. “un-sprained”—yet the cutoff 59
score derived has been commonly used to define “CAI” vs. “No CAI” group membership. These 60
two categorization schemes have important differences, and we propose should not be used 61
interchangeably. Specifically, recent research has highlighted that some individuals (frequently 62
called “copers”) have a history of ankle sprain but no ongoing instability.7, 18-26 Copers score 63
similar to uninjured controls on questionnaires such as the Foot and Ankle Ability Measure 64
(FAAM), FAAM-Sport, and CAIT.7 Thus, inclusion of these individuals in the sprained group 65
could inflate scores and lead to the establishment of a higher cutoff value that would be 66
established if only symptomatic ankles were included. 67
The purpose of the current investigation was to independently re-validate and potentially 68
recalibrate a CAIT cutoff score, by including only individuals with a history of lateral ankle 69
sprain AND recurrent instability in the CAI group.13 We hypothesized that the resulting cutoff 70
score would be lower than previously reported. Additionally, we desired to test whether a 71
recalibrated cutoff score would appropriately classify subjects in an independent subject pool 72
including uninjured control subjects, copers and CAI individuals. We hypothesized that a lower 73
cutoff score would result in fewer false classifications of copers. 74
75
METHODS 76
Subjects Dataset 1: Recalibration 77
Subjects were originally recruited for three independent research studies which collected 78
CAIT scores. Participants were recruited from a large metropolitan area, including a university 79
campus. The one hundred and eighteen individuals were recruited via direct contact with 80
MANUSCRIP
T
ACCEPTED
ACCEPTED MANUSCRIPT
5
individuals and recruiting announcements in university courses and included in this study: 61 81
individuals with CAI and 57 uninjured individuals. Demographics are reported in Table 1. 82
Inclusion criteria for the CAI group included a history of at least one lateral ankle sprain >6 83
weeks prior to study entry and at least two reported episodes of giving way per year. Uninjured 84
individuals had no history of ankle sprain or instability in their lifetime. Exclusion criteria for 85
both groups included a history of lower extremity fracture or surgery, any acute symptoms of 86
ankle injury, or assisted ambulation. University Institutional Review Board approval was 87
obtained prior to data collection for both datasets. 88
Subjects Dataset 2: Validation 89
Eighty-two subjects were recruited from a large metropolitan area, including a university 90
campus via direct contact with individuals and recruiting announcements made in university 91
courses. Twenty-nine individuals with CAI, 26 copers and 27 uninjured individuals were 92
included in the dataset. Table 2 includes subject demographics. Inclusion criteria for the CAI 93
group and uninjured group were the same as in Dataset 1, with the addition that CAI subjects had 94
to be at least 1 year post-initial injury. Individuals categorized as copers reported a history of a 95
single lateral ankle sprain which required protected weight bearing, immobilization, and/or 96
limited activity for ≥ 24 hours, no perceived instability, and had resumed all pre-injury activities 97
without limitation for at least 12 months prior to testing. Perceived instability was assessed with 98
a single yes or no question, “Does your ankle ever give-way, roll-over or feel unstable?” 99
Exclusion criteria were the same as in Dataset1. Additionally, subjects had to perform at least 90 100
minutes of physical activity per week; this activity could be of any intensity or mode. The CAIT 101
score was not used as an inclusion criteria for any group. 102
Data Collection 103
MANUSCRIP
T
ACCEPTED
ACCEPTED MANUSCRIPT
6
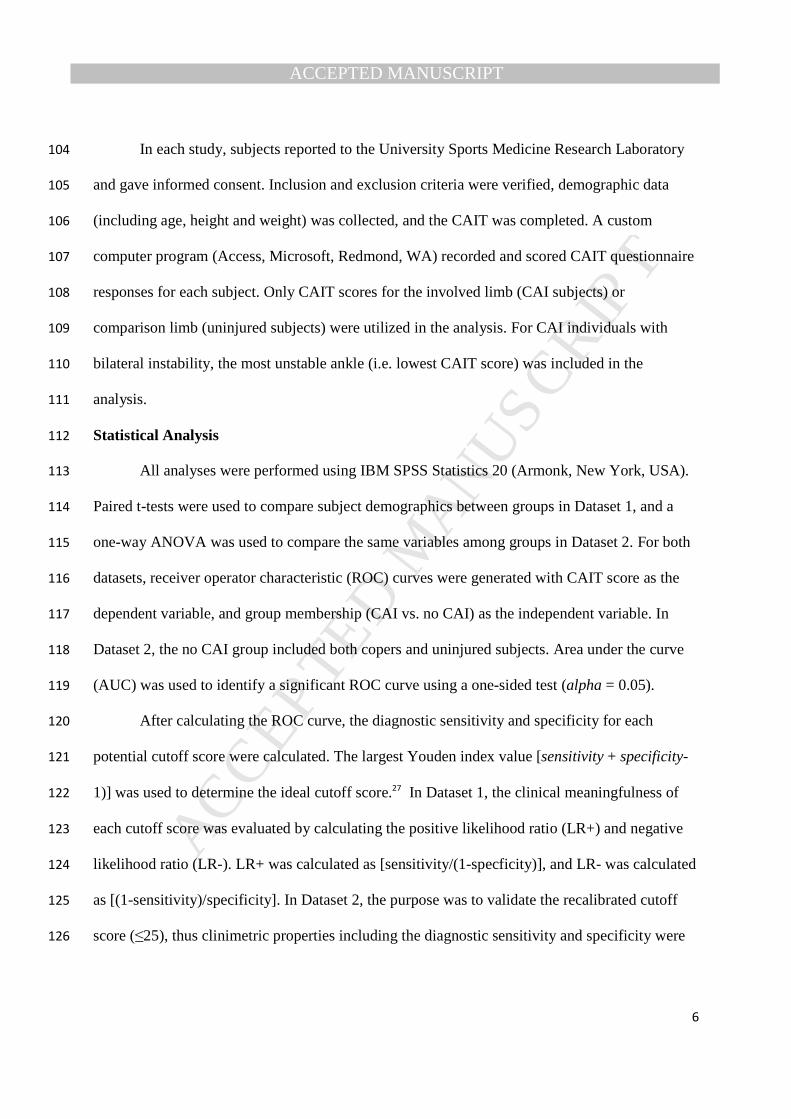
In each study, subjects reported to the University Sports Medicine Research Laboratory 104
and gave informed consent. Inclusion and exclusion criteria were verified, demographic data 105
(including age, height and weight) was collected, and the CAIT was completed. A custom 106
computer program (Access, Microsoft, Redmond, WA) recorded and scored CAIT questionnaire 107
responses for each subject. Only CAIT scores for the involved limb (CAI subjects) or 108
comparison limb (uninjured subjects) were utilized in the analysis. For CAI individuals with 109
bilateral instability, the most unstable ankle (i.e. lowest CAIT score) was included in the 110
analysis. 111
Statistical Analysis 112
All analyses were performed using IBM SPSS Statistics 20 (Armonk, New York, USA). 113
Paired t-tests were used to compare subject demographics between groups in Dataset 1, and a 114
one-way ANOVA was used to compare the same variables among groups in Dataset 2. For both 115
datasets, receiver operator characteristic (ROC) curves were generated with CAIT score as the 116
dependent variable, and group membership (CAI vs. no CAI) as the independent variable. In 117
Dataset 2, the no CAI group included both copers and uninjured subjects. Area under the curve 118
(AUC) was used to identify a significant ROC curve using a one-sided test (alpha = 0.05). 119
After calculating the ROC curve, the diagnostic sensitivity and specificity for each 120
potential cutoff score were calculated. The largest Youden index value [sensitivity + specificity-121
1)] was used to determine the ideal cutoff score.27 In Dataset 1, the clinical meaningfulness of 122
each cutoff score was evaluated by calculating the positive likelihood ratio (LR+) and negative 123
likelihood ratio (LR-). LR+ was calculated as [sensitivity/(1-specficity)], and LR- was calculated 124
as [(1-sensitivity)/specificity]. In Dataset 2, the purpose was to validate the recalibrated cutoff 125
score (≤25), thus clinimetric properties including the diagnostic sensitivity and specificity were 126
MANUSCRIP
T
ACCEPTED
ACCEPTED MANUSCRIPT
7
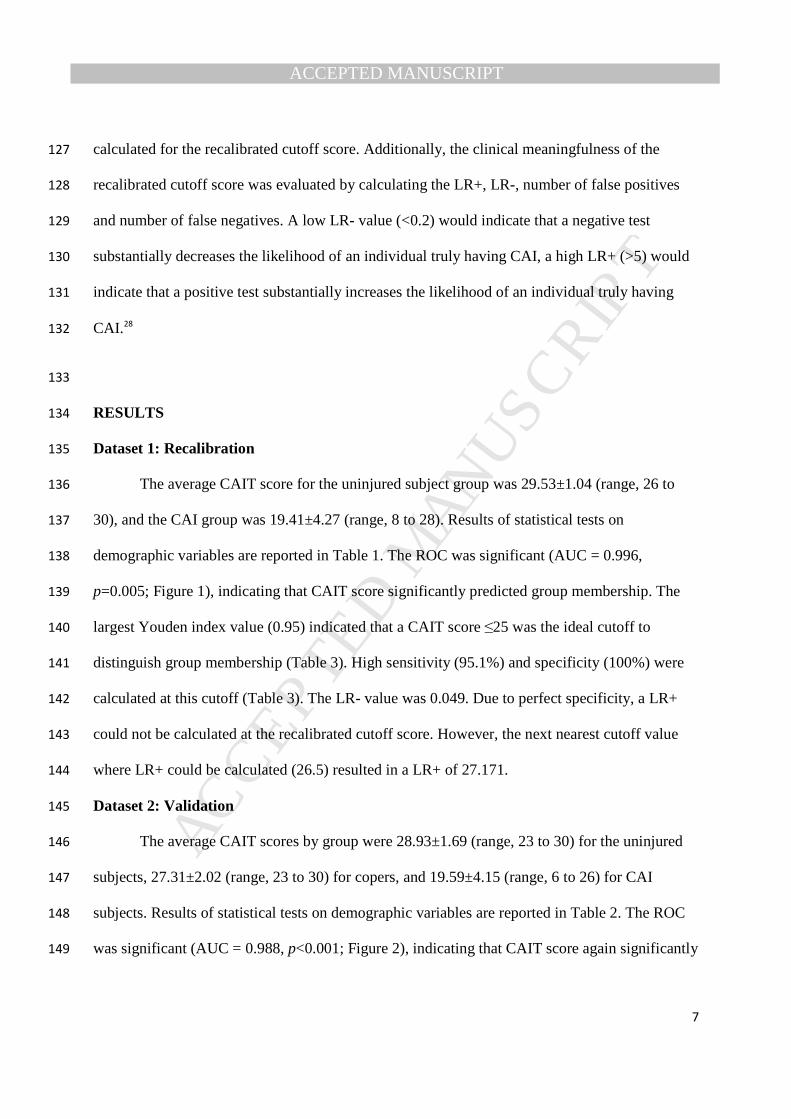
calculated for the recalibrated cutoff score. Additionally, the clinical meaningfulness of the 127
recalibrated cutoff score was evaluated by calculating the LR+, LR-, number of false positives 128
and number of false negatives. A low LR- value (<0.2) would indicate that a negative test 129
substantially decreases the likelihood of an individual truly having CAI, a high LR+ (>5) would 130
indicate that a positive test substantially increases the likelihood of an individual truly having 131
CAI.28 132
133
RESULTS 134
Dataset 1: Recalibration 135
The average CAIT score for the uninjured subject group was 29.53±1.04 (range, 26 to 136
30), and the CAI group was 19.41±4.27 (range, 8 to 28). Results of statistical tests on 137
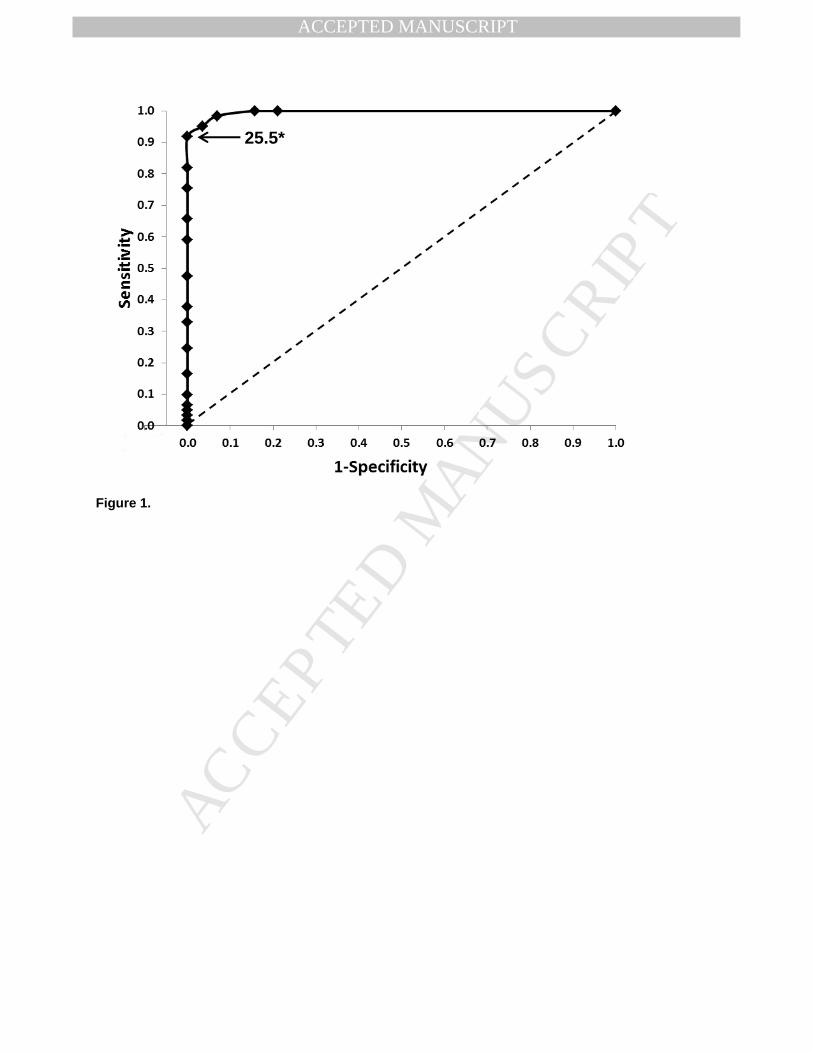
demographic variables are reported in Table 1. The ROC was significant (AUC = 0.996, 138
p=0.005; Figure 1), indicating that CAIT score significantly predicted group membership. The 139
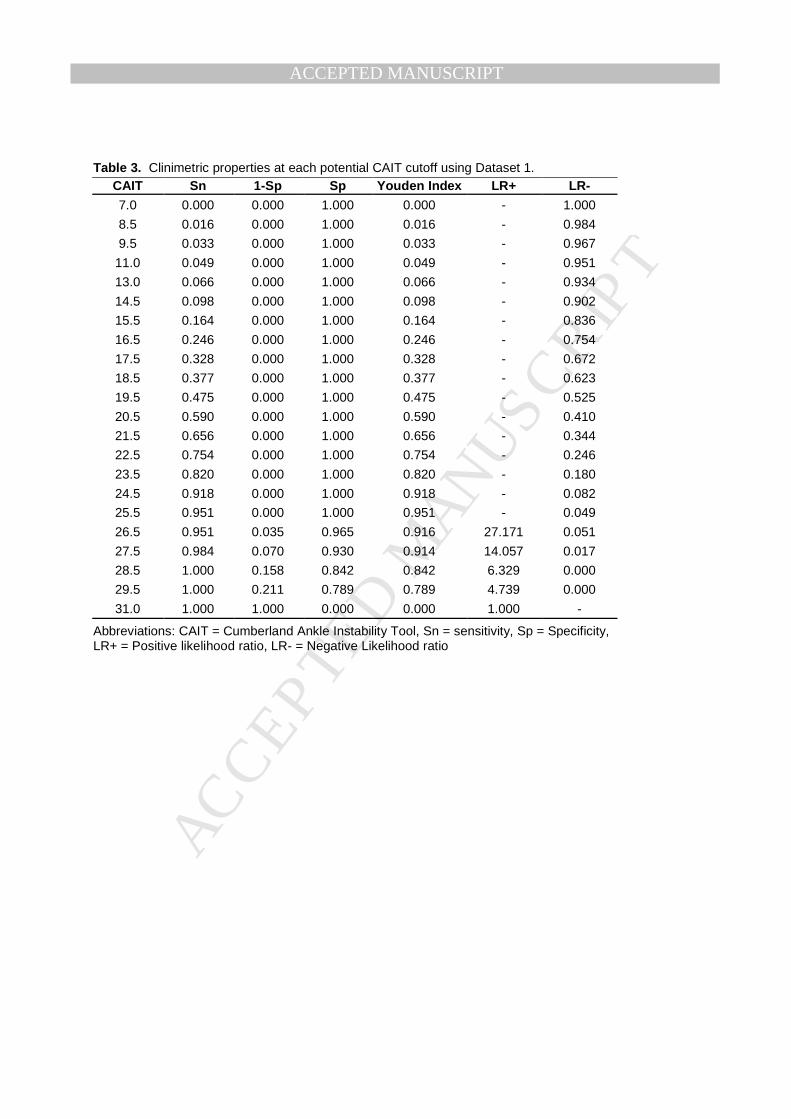
largest Youden index value (0.95) indicated that a CAIT score ≤25 was the ideal cutoff to 140
distinguish group membership (Table 3). High sensitivity (95.1%) and specificity (100%) were 141
calculated at this cutoff (Table 3). The LR- value was 0.049. Due to perfect specificity, a LR+ 142
could not be calculated at the recalibrated cutoff score. However, the next nearest cutoff value 143
where LR+ could be calculated (26.5) resulted in a LR+ of 27.171. 144
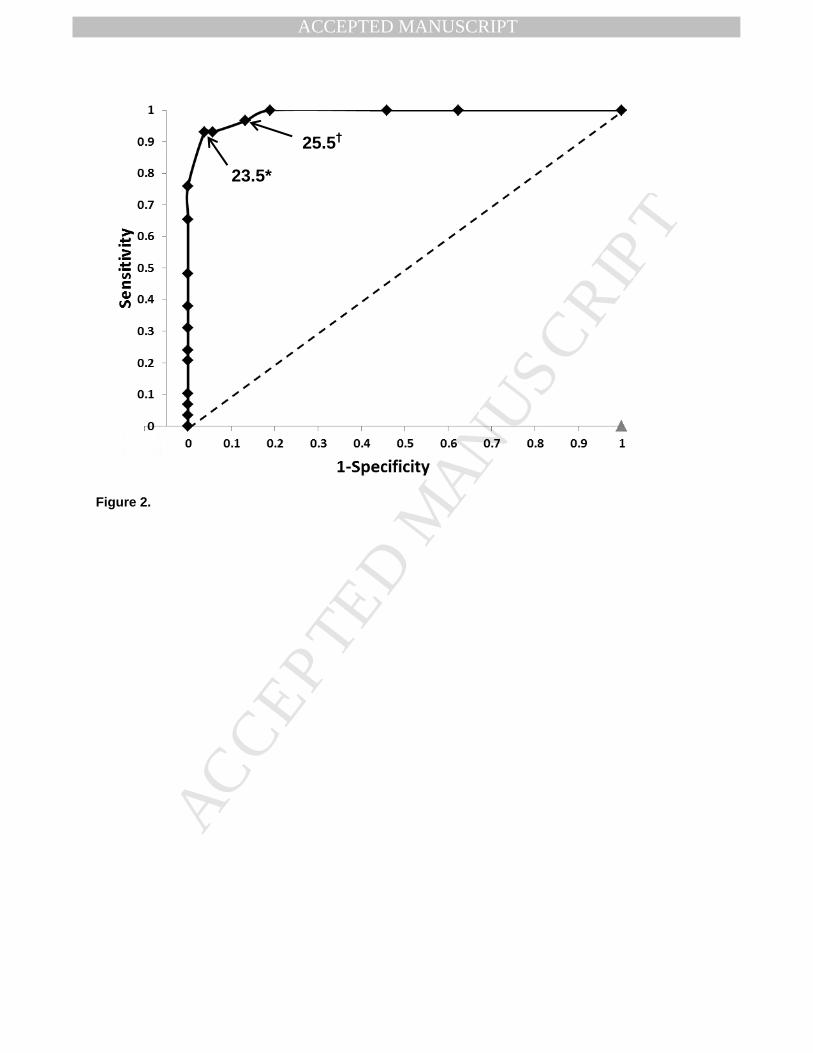
Dataset 2: Validation 145
The average CAIT scores by group were 28.93±1.69 (range, 23 to 30) for the uninjured 146
subjects, 27.31±2.02 (range, 23 to 30) for copers, and 19.59±4.15 (range, 6 to 26) for CAI 147
subjects. Results of statistical tests on demographic variables are reported in Table 2. The ROC 148
was significant (AUC = 0.988, p<0.001; Figure 2), indicating that CAIT score again significantly 149
MANUSCRIP
T
ACCEPTED
ACCEPTED MANUSCRIPT
8
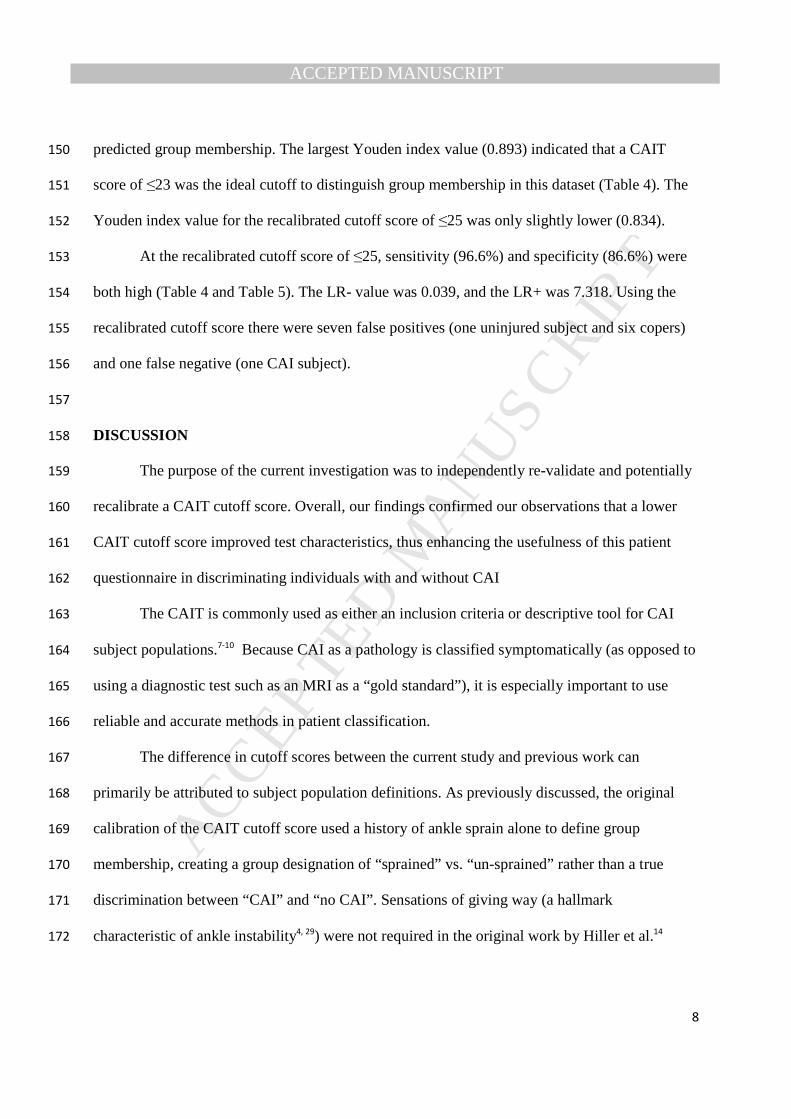
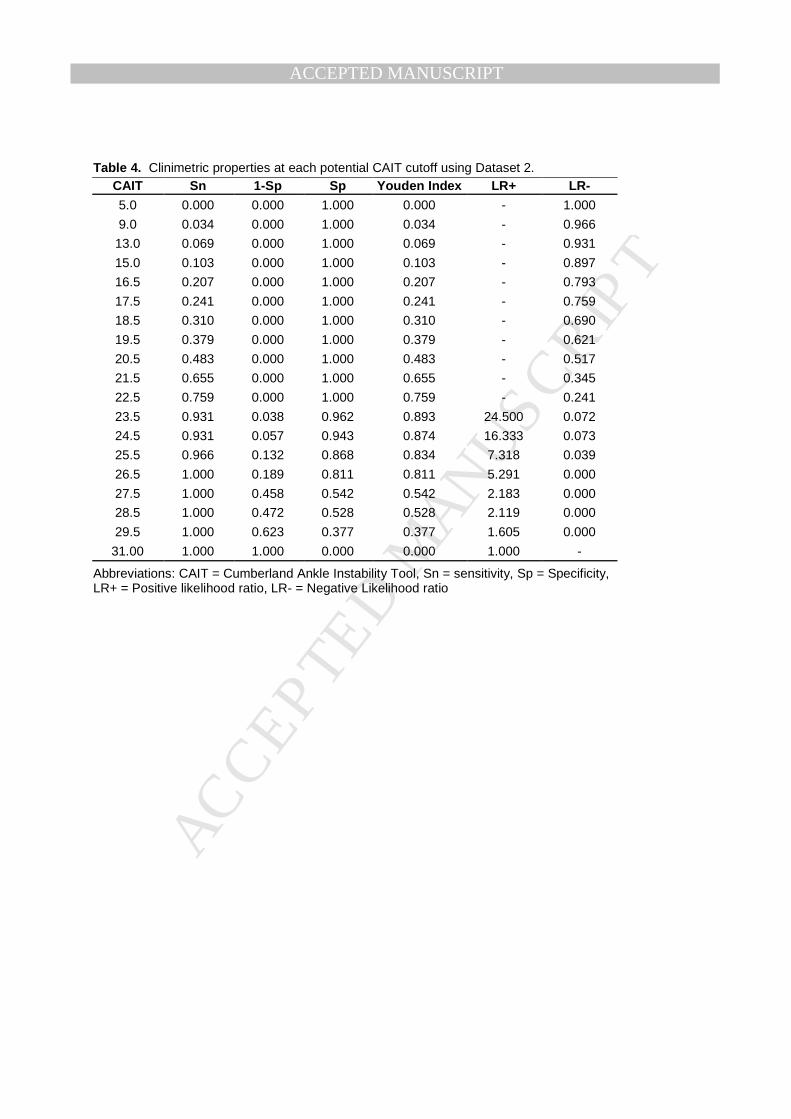
predicted group membership. The largest Youden index value (0.893) indicated that a CAIT 150
score of ≤23 was the ideal cutoff to distinguish group membership in this dataset (Table 4). The 151
Youden index value for the recalibrated cutoff score of ≤25 was only slightly lower (0.834). 152
At the recalibrated cutoff score of ≤25, sensitivity (96.6%) and specificity (86.6%) were 153
both high (Table 4 and Table 5). The LR- value was 0.039, and the LR+ was 7.318. Using the 154
recalibrated cutoff score there were seven false positives (one uninjured subject and six copers) 155
and one false negative (one CAI subject). 156
157
DISCUSSION 158
The purpose of the current investigation was to independently re-validate and potentially 159
recalibrate a CAIT cutoff score. Overall, our findings confirmed our observations that a lower 160
CAIT cutoff score improved test characteristics, thus enhancing the usefulness of this patient 161
questionnaire in discriminating individuals with and without CAI 162
The CAIT is commonly used as either an inclusion criteria or descriptive tool for CAI 163
subject populations.7-10 Because CAI as a pathology is classified symptomatically (as opposed to 164
using a diagnostic test such as an MRI as a “gold standard”), it is especially important to use 165
reliable and accurate methods in patient classification. 166
The difference in cutoff scores between the current study and previous work can 167
primarily be attributed to subject population definitions. As previously discussed, the original 168
calibration of the CAIT cutoff score used a history of ankle sprain alone to define group 169
membership, creating a group designation of “sprained” vs. “un-sprained” rather than a true 170
discrimination between “CAI” and “no CAI”. Sensations of giving way (a hallmark 171
characteristic of ankle instability4, 29) were not required in the original work by Hiller et al.14 172
MANUSCRIP
T
ACCEPTED
ACCEPTED MANUSCRIPT
9
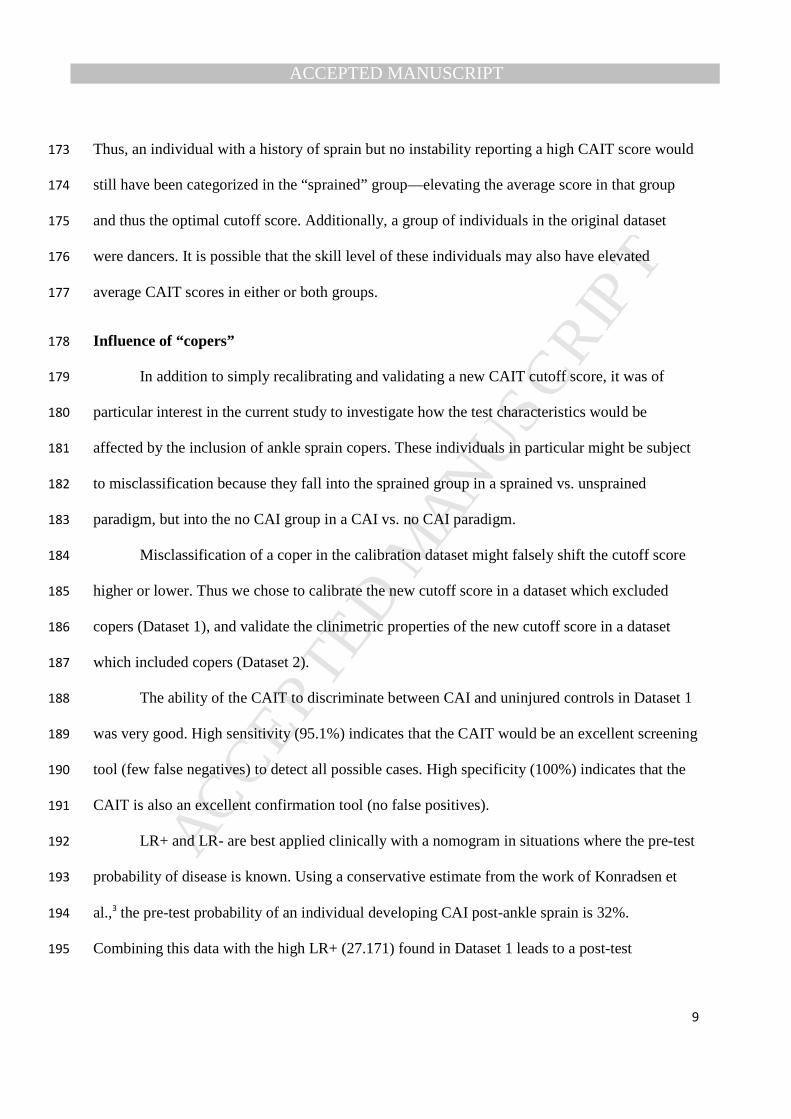
Thus, an individual with a history of sprain but no instability reporting a high CAIT score would 173
still have been categorized in the “sprained” group—elevating the average score in that group 174
and thus the optimal cutoff score. Additionally, a group of individuals in the original dataset 175
were dancers. It is possible that the skill level of these individuals may also have elevated 176
average CAIT scores in either or both groups. 177
Influence of “copers” 178
In addition to simply recalibrating and validating a new CAIT cutoff score, it was of 179
particular interest in the current study to investigate how the test characteristics would be 180
affected by the inclusion of ankle sprain copers. These individuals in particular might be subject 181
to misclassification because they fall into the sprained group in a sprained vs. unsprained 182
paradigm, but into the no CAI group in a CAI vs. no CAI paradigm. 183
Misclassification of a coper in the calibration dataset might falsely shift the cutoff score 184
higher or lower. Thus we chose to calibrate the new cutoff score in a dataset which excluded 185
copers (Dataset 1), and validate the clinimetric properties of the new cutoff score in a dataset 186
which included copers (Dataset 2). 187
The ability of the CAIT to discriminate between CAI and uninjured controls in Dataset 1 188
was very good. High sensitivity (95.1%) indicates that the CAIT would be an excellent screening 189
tool (few false negatives) to detect all possible cases. High specificity (100%) indicates that the 190
CAIT is also an excellent confirmation tool (no false positives). 191
LR+ and LR- are best applied clinically with a nomogram in situations where the pre-test 192
probability of disease is known. Using a conservative estimate from the work of Konradsen et 193
al.,3 the pre-test probability of an individual developing CAI post-ankle sprain is 32%. 194
Combining this data with the high LR+ (27.171) found in Dataset 1 leads to a post-test 195
MANUSCRIP
T
ACCEPTED
ACCEPTED MANUSCRIPT
10
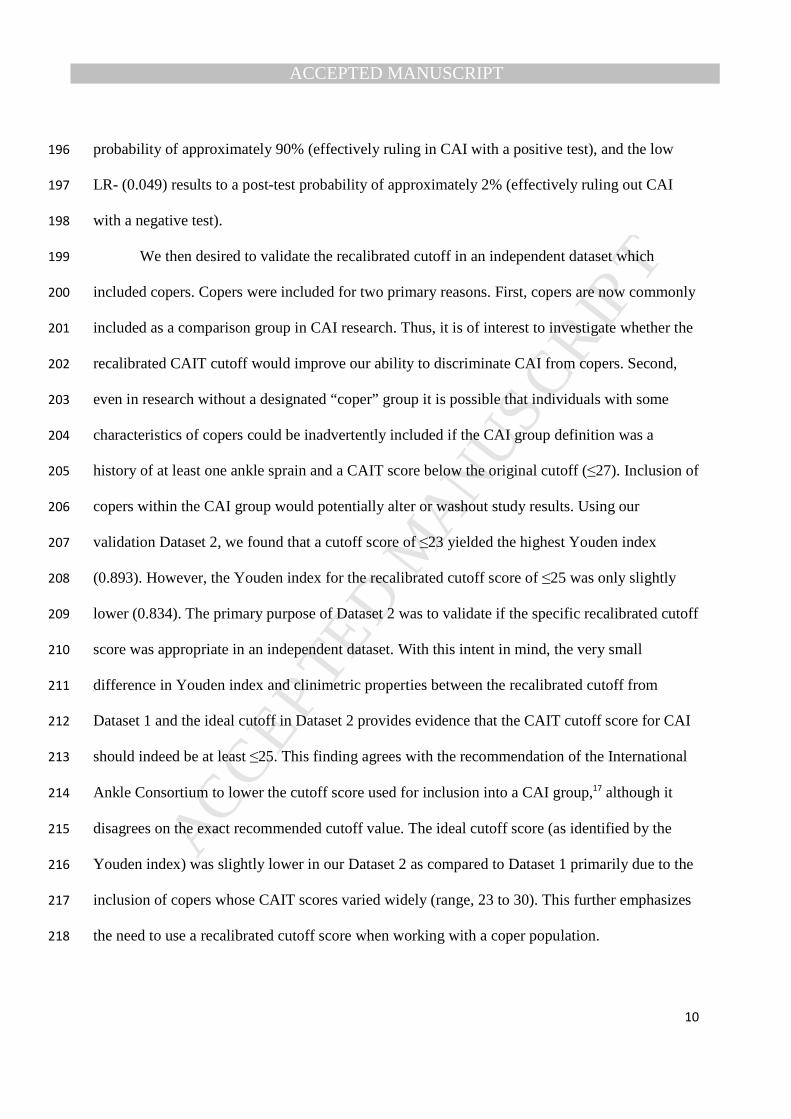
probability of approximately 90% (effectively ruling in CAI with a positive test), and the low 196
LR- (0.049) results to a post-test probability of approximately 2% (effectively ruling out CAI 197
with a negative test). 198
We then desired to validate the recalibrated cutoff in an independent dataset which 199
included copers. Copers were included for two primary reasons. First, copers are now commonly 200
included as a comparison group in CAI research. Thus, it is of interest to investigate whether the 201
recalibrated CAIT cutoff would improve our ability to discriminate CAI from copers. Second, 202
even in research without a designated “coper” group it is possible that individuals with some 203
characteristics of copers could be inadvertently included if the CAI group definition was a 204
history of at least one ankle sprain and a CAIT score below the original cutoff (≤27). Inclusion of 205
copers within the CAI group would potentially alter or washout study results. Using our 206
validation Dataset 2, we found that a cutoff score of ≤23 yielded the highest Youden index 207
(0.893). However, the Youden index for the recalibrated cutoff score of ≤25 was only slightly 208
lower (0.834). The primary purpose of Dataset 2 was to validate if the specific recalibrated cutoff 209
score was appropriate in an independent dataset. With this intent in mind, the very small 210
difference in Youden index and clinimetric properties between the recalibrated cutoff from 211
Dataset 1 and the ideal cutoff in Dataset 2 provides evidence that the CAIT cutoff score for CAI 212
should indeed be at least ≤25. This finding agrees with the recommendation of the International 213
Ankle Consortium to lower the cutoff score used for inclusion into a CAI group,17 although it 214
disagrees on the exact recommended cutoff value. The ideal cutoff score (as identified by the 215
Youden index) was slightly lower in our Dataset 2 as compared to Dataset 1 primarily due to the 216
inclusion of copers whose CAIT scores varied widely (range, 23 to 30). This further emphasizes 217
the need to use a recalibrated cutoff score when working with a coper population. 218
MANUSCRIP
T
ACCEPTED
ACCEPTED MANUSCRIPT
11
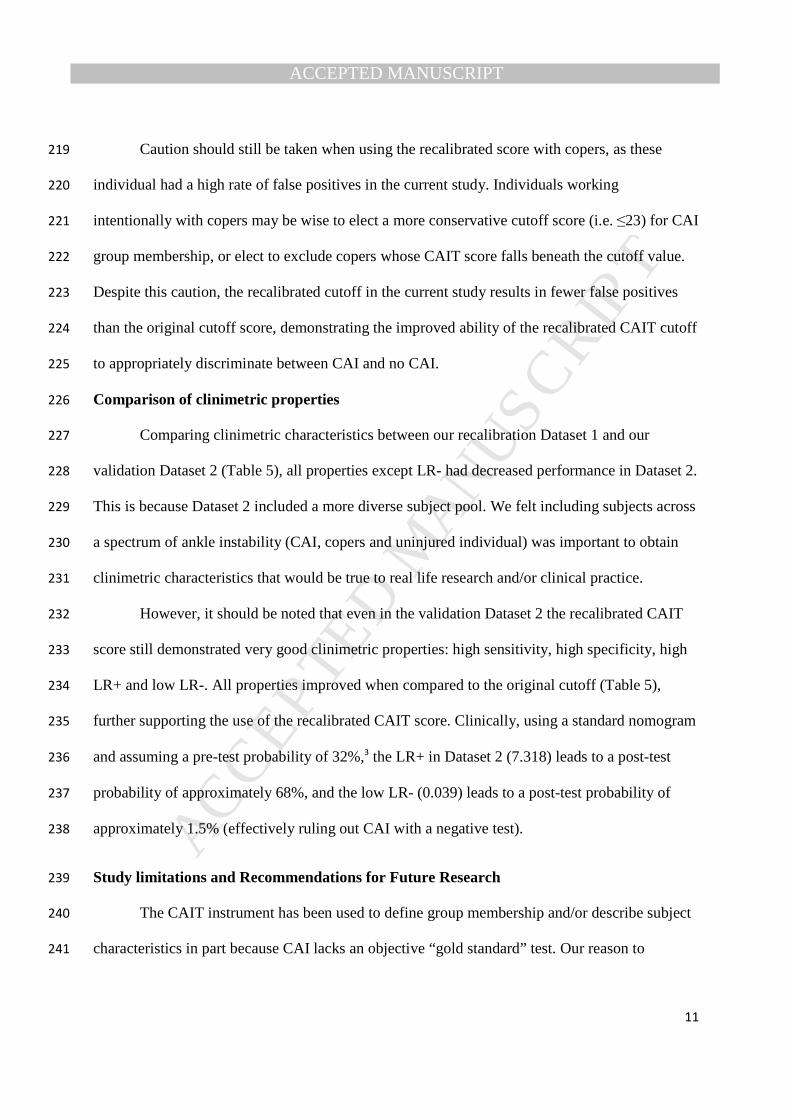
Caution should still be taken when using the recalibrated score with copers, as these 219
individual had a high rate of false positives in the current study. Individuals working 220
intentionally with copers may be wise to elect a more conservative cutoff score (i.e. ≤23) for CAI 221
group membership, or elect to exclude copers whose CAIT score falls beneath the cutoff value. 222
Despite this caution, the recalibrated cutoff in the current study results in fewer false positives 223
than the original cutoff score, demonstrating the improved ability of the recalibrated CAIT cutoff 224
to appropriately discriminate between CAI and no CAI. 225
Comparison of clinimetric properties 226
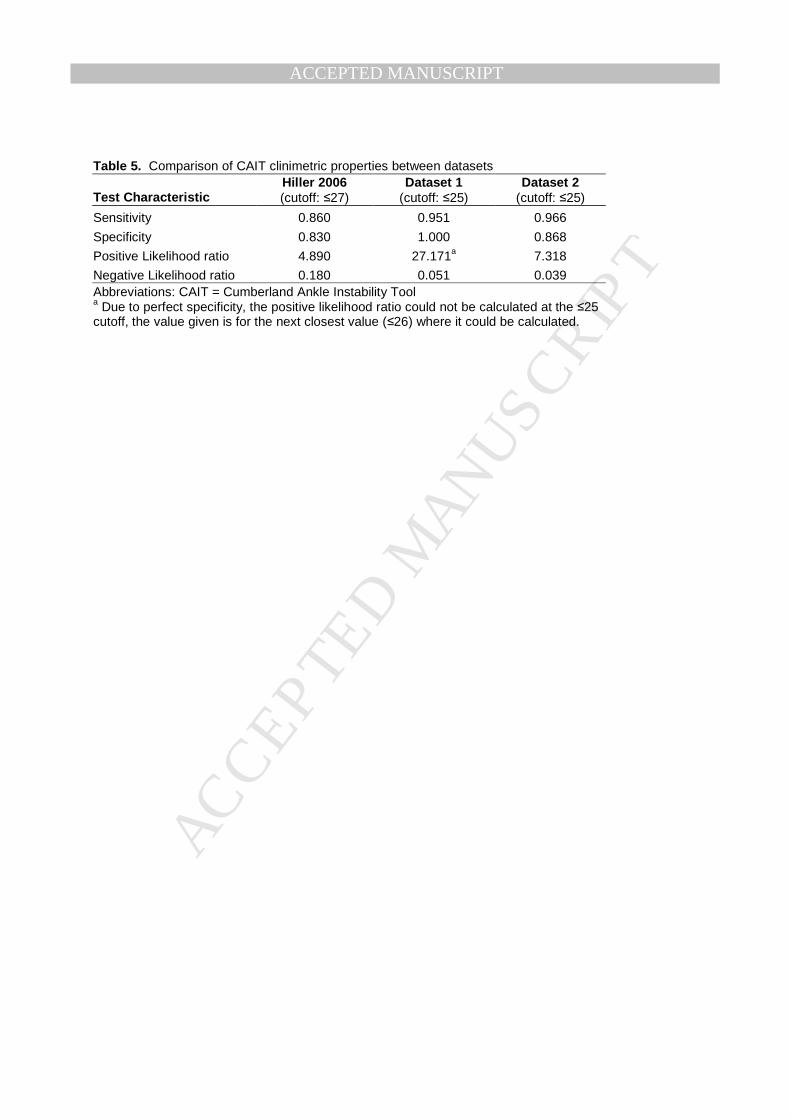
Comparing clinimetric characteristics between our recalibration Dataset 1 and our 227
validation Dataset 2 (Table 5), all properties except LR- had decreased performance in Dataset 2. 228
This is because Dataset 2 included a more diverse subject pool. We felt including subjects across 229
a spectrum of ankle instability (CAI, copers and uninjured individual) was important to obtain 230
clinimetric characteristics that would be true to real life research and/or clinical practice. 231
However, it should be noted that even in the validation Dataset 2 the recalibrated CAIT 232
score still demonstrated very good clinimetric properties: high sensitivity, high specificity, high 233
LR+ and low LR-. All properties improved when compared to the original cutoff (Table 5), 234
further supporting the use of the recalibrated CAIT score. Clinically, using a standard nomogram 235
and assuming a pre-test probability of 32%,3 the LR+ in Dataset 2 (7.318) leads to a post-test 236
probability of approximately 68%, and the low LR- (0.039) leads to a post-test probability of 237
approximately 1.5% (effectively ruling out CAI with a negative test). 238
Study limitations and Recommendations for Future Research 239
The CAIT instrument has been used to define group membership and/or describe subject 240
characteristics in part because CAI lacks an objective “gold standard” test. Our reason to 241
MANUSCRIP
T
ACCEPTED
ACCEPTED MANUSCRIPT
12
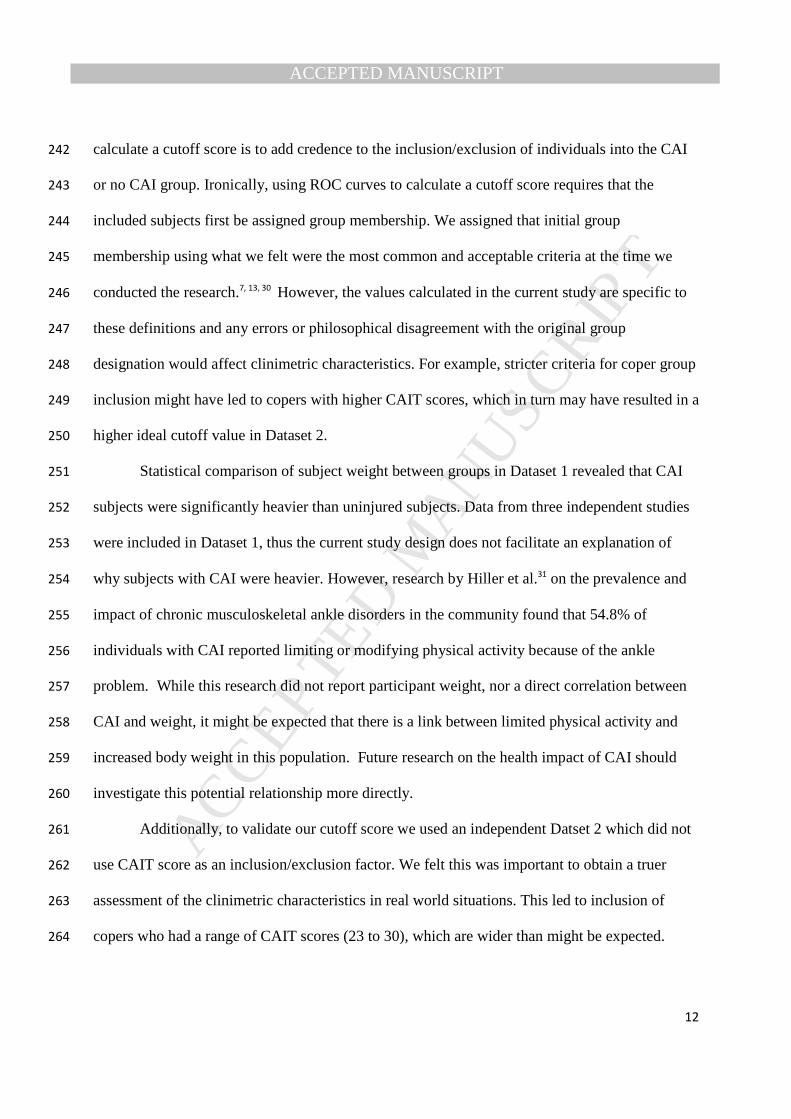
calculate a cutoff score is to add credence to the inclusion/exclusion of individuals into the CAI 242
or no CAI group. Ironically, using ROC curves to calculate a cutoff score requires that the 243
included subjects first be assigned group membership. We assigned that initial group 244
membership using what we felt were the most common and acceptable criteria at the time we 245
conducted the research.7, 13, 30 However, the values calculated in the current study are specific to 246
these definitions and any errors or philosophical disagreement with the original group 247
designation would affect clinimetric characteristics. For example, stricter criteria for coper group 248
inclusion might have led to copers with higher CAIT scores, which in turn may have resulted in a 249
higher ideal cutoff value in Dataset 2. 250
Statistical comparison of subject weight between groups in Dataset 1 revealed that CAI 251
subjects were significantly heavier than uninjured subjects. Data from three independent studies 252
were included in Dataset 1, thus the current study design does not facilitate an explanation of 253
why subjects with CAI were heavier. However, research by Hiller et al.31 on the prevalence and 254
impact of chronic musculoskeletal ankle disorders in the community found that 54.8% of 255
individuals with CAI reported limiting or modifying physical activity because of the ankle 256
problem. While this research did not report participant weight, nor a direct correlation between 257
CAI and weight, it might be expected that there is a link between limited physical activity and 258
increased body weight in this population. Future research on the health impact of CAI should 259
investigate this potential relationship more directly. 260
Additionally, to validate our cutoff score we used an independent Datset 2 which did not 261
use CAIT score as an inclusion/exclusion factor. We felt this was important to obtain a truer 262
assessment of the clinimetric characteristics in real world situations. This led to inclusion of 263
copers who had a range of CAIT scores (23 to 30), which are wider than might be expected. 264
MANUSCRIP
T
ACCEPTED
ACCEPTED MANUSCRIPT
13
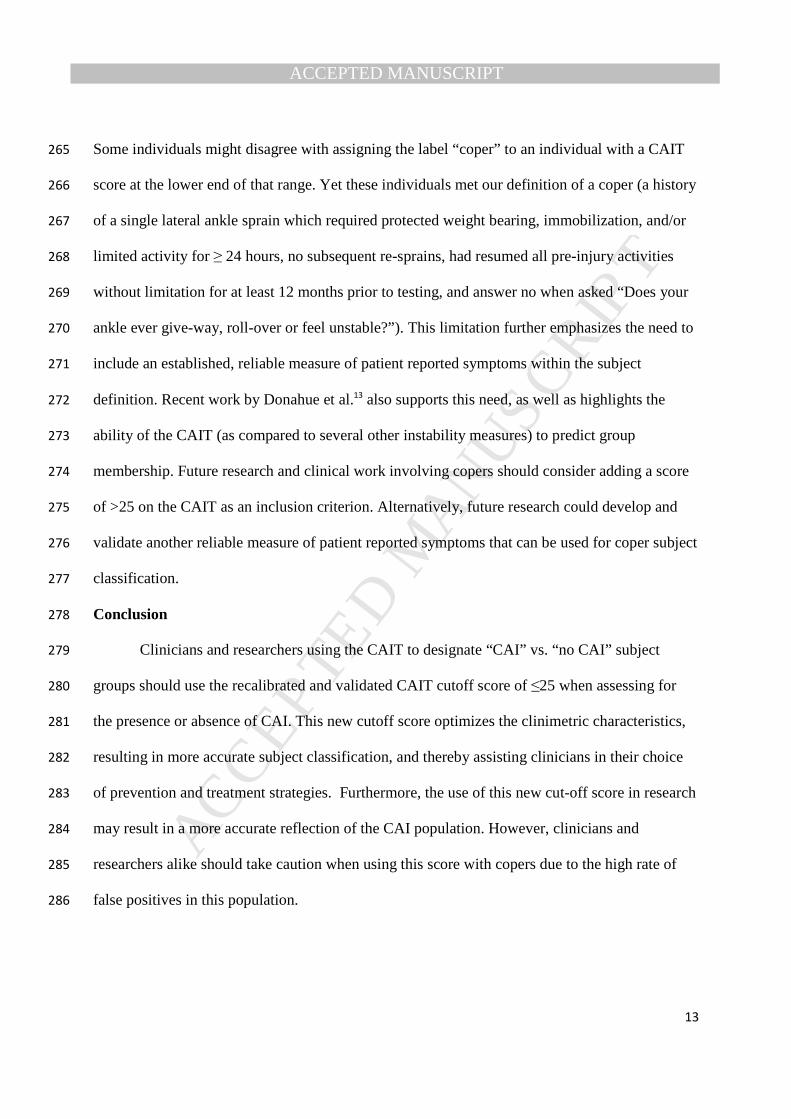
Some individuals might disagree with assigning the label “coper” to an individual with a CAIT 265
score at the lower end of that range. Yet these individuals met our definition of a coper (a history 266
of a single lateral ankle sprain which required protected weight bearing, immobilization, and/or 267
limited activity for ≥ 24 hours, no subsequent re-sprains, had resumed all pre-injury activities 268
without limitation for at least 12 months prior to testing, and answer no when asked “Does your 269
ankle ever give-way, roll-over or feel unstable?”). This limitation further emphasizes the need to 270
include an established, reliable measure of patient reported symptoms within the subject 271
definition. Recent work by Donahue et al.13 also supports this need, as well as highlights the 272
ability of the CAIT (as compared to several other instability measures) to predict group 273
membership. Future research and clinical work involving copers should consider adding a score 274
of >25 on the CAIT as an inclusion criterion. Alternatively, future research could develop and 275
validate another reliable measure of patient reported symptoms that can be used for coper subject 276
classification. 277
Conclusion 278
Clinicians and researchers using the CAIT to designate “CAI” vs. “no CAI” subject 279
groups should use the recalibrated and validated CAIT cutoff score of ≤25 when assessing for 280
the presence or absence of CAI. This new cutoff score optimizes the clinimetric characteristics, 281
resulting in more accurate subject classification, and thereby assisting clinicians in their choice 282
of prevention and treatment strategies. Furthermore, the use of this new cut-off score in research 283
may result in a more accurate reflection of the CAI population. However, clinicians and 284
researchers alike should take caution when using this score with copers due to the high rate of 285
false positives in this population. 286
MANUSCRIP
T
ACCEPTED
ACCEPTED MANUSCRIPT
14
REFERENCES 287
1. Anandacoomarasamy A, Barnsley L. Long term outcomes of inversion ankle injuries. Br J Sports Med 288
2005;39(3):14-7. 289
2. Braun BL. Effects of ankle sprain in a general clinic population 6 to 18 months after medical evaluation. 290
Arch Fam Med 1999;8(2):143-8. 291
3. Konradsen L, Bech L, Ehrenbjerg M, Nickelsen T. Seven years follow-up after ankle inversion trauma. 292
Scand J Med Sci Sports 2002;12(3):129-35. 293
4. Hertel J. Functional anatomy, pathomechanics, and pathophysiology of lateral ankle instability. J Athl 294
Train 2002;37(4):364-75. 295
5. Hiller CE, Kilbreath SL, Refshauge KM. Chronic ankle instability: Evolution of the model. Journal of 296
Athletic Training 2011;46(2):133-41. 297
6. Delahunt E, Coughlan GF, Caulfield B, Nightingale EJ, Lin CW, Hiller CE. Inclusion criteria when 298
investigating insufficiencies in chronic ankle instability. Med Sci Sports Exerc 2010;42(11):2106-21. 299
7. Wright CJ, Arnold BL, Ross SE, Ketchum JM, Ericksen JJ, Pidcoe PE. Clinical exam results differ 300
among individuals with functional ankle instability and ankle sprain copers. J Athl Train 2012;In 301
Press. 302
8. de Noronha M, Refshauge KM, Crosbie J, Kilbreath SL. Relationship between functional ankle 303
instability and postural control. J Orthop Sports Phys Ther 2008;38(12):782-9. 304
9. Arnold BL, Wright CJ, Ross SE. Functional ankle instability and health-related quality of life. J Athl 305
Train 2011;46(6):634-41. 306
10. Shields CA, Needle AR, Rose WC, Swanik CB, Kaminski TW. Effect of elastic taping on postural 307
control deficits in subjects with healthy ankles, copers, and individuals with functional ankle 308
instability. Foot Ankle Int 2013;34(10):1427-35. 309
11. De Noronha M, Refshauge KM, Kilbreath SL, Figueiredo VG. Cross-cultural adaptation of the 310
brazilian-portuguese version of the cumberland ankle instability tool (CAIT). Disabil Rehabil 311
2008;30(26):1959-65. 312
12. Cruz-Díaz D, Hita-Contreras F, Lomas-Vega R, Osuna-Pérez MC, Martínez-Amat A. Cross-cultural 313
adaptation and validation of the spanish version of the cumberland ankle instability tool (CAIT): An 314
instrument to assess unilateral chronic ankle instability. Clin Rheumatol 2013;32(1):91-8. 315
13. Donahue M, Simon J, Docherty CL. Critical review of self-reported functional ankle instability 316
measures. Foot Ankle Int 2011;32(12):1140-6. 317
14. Hiller CE, Refshauge KM, Bundy AC, Herbert RD, Kilbreath SL. The cumberland ankle instability tool: 318
A report of validity and reliability testing. Arch Phys Med Rehabil 2006;87(9):1235-41. 319
15. Hiller CE, Refshauge KM, Herbert RD, Kilbreath SL. Balance and recovery from a perturbation are 320
impaired in people with functional ankle instability. Clin J Sport Med 2007;17(4):269-75. 321
MANUSCRIP
T
ACCEPTED
ACCEPTED MANUSCRIPT
15
16. de Noronha M, Refshauge KM, Kilbreath SL, Crosbie J. Loss of proprioception or motor control is not 322
related to functional ankle instability: An observational study. Aust J Physiother 2007;53(3):193-8. 323
17. Gribble PA, Delahunt E, Bleakley C, Caulfield B, Docherty CL, Fourchet F, Fong D, Hertel J, Hiller C, 324
Kaminski TW, et al. Selection criteria for patients with chronic ankle instability in controlled research: 325
A position statement of the international ankle consortium. J Orthop Sports PhyS Ther 326
2013;43(8):585-91. 327
18. Brown C, Padua D, Marshall SW, Guskiewicz K. Individuals with mechanical ankle instability exhibit 328
different motion patterns than those with functional ankle instability and ankle sprain copers. Clin 329
Biomech 2008;23(6):822-31. 330
19. Hubbard TJ. Ligament laxity following inversion injury with and without chronic ankle instability. Foot 331
Ankle Int 2008;29(3):305-11. 332
20. Wikstrom EA, Tillman MD, Chmielewski TL, Cauraugh JH, Naugle KE, Borsa PA. Self-assessed 333
disability and functional performance in individuals with and without ankle instability: A case control 334
study. J Orthop Sports Phys Ther 2009;39(6):458-67. 335
21. Wikstrom EA, Fournier KA, McKeon PO. Postural control differs between those with and without 336
chronic ankle instability. Gait Posture 2010;32(1):82-6. 337
22. Wikstrom EA, Tillman MD, Chmielewski TL, Cauraugh JH, Naugle KE, Borsa PA. Dynamic postural 338
control but not mechanical stability differs among those with and without chronic ankle instability. 339
Scand J Med Sci Sports 2010;20(1):e137-44. 340
23. Brown C. Foot clearance in walking and running in individuals with ankle instability. Am J Sports Med 341
2011;39(8):1769-76. 342
24. Wikstrom, E.A., Hass, C.J. Gait termination strategies differ between those with and without ankle 343
instability. Clin Biomech 2012;27(6):619-24. 344
25. Croy T, Saliba SA, Saliba E, Anderson MW, Hertel J. Differences in lateral ankle laxity measured via 345
stress ultrasonography in individuals with chronic ankle instability, ankle sprain copers, and healthy 346
individuals. J Orthop Sports Phys Ther 2012;42(7):593-600. 347
26. Wikstrom EA, Tillman MD, Chmielewski TL, Cauraugh JH, Naugle KE, Borsa PA. Discriminating 348
between copers and people with chronic ankle instability. J Athl Train 2012;47(2):136-42. 349
27. Youden WJ. Index for rating diagnostic tests. Cancer 1950;3(1):32-5. 350
28. Jaeschke R, Guyatt GH, Sackett DL. Users' guides to the medical literature. III. how to use an article 351
about a diagnostic test. B. what are the results and will they help me in caring for my patients? the 352
evidence-based medicine working group. JAMA 1994;271(9):703-7. 353
29. Freeman MR, Dean ME, Hanham IF. The etiology and prevention of functional instability of the foot. J 354
Bone Joint Surg Br 1965;47(4):678-85. 355
30. Arnold BL, Linens SW, de la Motte SJ, Ross SE. Concentric evertor strength differences are 356
associated with functional ankle instability: A meta-analysis. J Athl Train 2009;44(6):653-62. 357

MANUSCRIP
T
ACCEPTED
ACCEPTED MANUSCRIPT
16
31. Hiller CE, Nightingale EJ, Raymond J, Kilbreath SL, Burns J, Black DA, Refshauge KM. Prevalence 358
and impact of chronic musculoskeletal ankle disorders in the community. Arch Phys Med Rehabil 359
2012;93(10):1801-7. 360
MANUSCRIP
T
ACCEPTED
ACCEPTED MANUSCRIPT
17
LEGEND TO FIGURES 361
362
Figure 1. Receiver operating characteristic (ROC) curve for Dataset 1 Cumberland Ankle Instability Tool 363
(CAIT) scores. Solid line = ROC curve, Doted line = reference line for significant ROC curve. *Cutoff value 364
with highest Youden Index 365
366
Figure 2. Receiver operating characteristic (ROC) curve for Dataset 2 Cumberland Ankle Instability Tool 367
(CAIT) scores. Solid line = ROC curve, Doted line = reference line for significant ROC curve. *Cutoff value 368
with highest Youden Index in Dataset 2. †Cutoff value identified in Dataset 1. 369
370
MANUSCRIP
T
ACCEPTED
ACCEPTED MANUSCRIPT
18
LEGEND TO TABLES 371
372
Table 1. Subject Demographics Dataset 1 373
374
Table 2. Subject Demographics Dataset 2 375
376
Table 3. Clinimetric properties at each potential CAIT cutoff using Dataset 1 377
378
Table 4. Clinimetric properties at each potential CAIT cutoff using Dataset 2 379
Table 5. Comparison of CAIT clinimetric properties between datasets 380

MANUSCRIP
T
ACCEPTED
ACCEPTED MANUSCRIPT
Table 1. Subject Demographics Dataset 1 Descriptor CAI Uninjured t-statistic df P-value Gender 26 males
35 females 20 males,
37 females - - -
Age, yrs 25.52 ± 6.31 25.02 ± 5.49 -0.464 116 0.643 Height, m 1.71 ± 0.08 1.69 ± 0.08 -1.057 116 0.293 Weight, kg 77.07 ± 16.02 69.16 ± 13.06 -2.931 116 0.004* Abbreviations: CAI = Chronic Ankle Instability, CAIT = Cumberland Ankle Instability Tool. Values are mean ± standard deviation. *Significant difference in weight between CAI and uninjured subjects

MANUSCRIP
T
ACCEPTED
ACCEPTED MANUSCRIPT
Table 2. Subject Demographics Dataset 2 Descriptor CAI Coper Uninjured F-statistic P-Value Gender 15 males,
14 females 12 males,
14 females 14 males,
13 females - -
Age, yrs 23.31 ± 3.53 23.35 ± 3.50 22.89 ± 3.78 F2,79=0.135 0.874 Height, m 1.72 ± 0.10 1.71 ± 0.07 1.71 ± 0.08 F2,79=0.166 0.847 Weight, kg 75.12 ± 19.52 69.81 ± 13.65 69.33 ± 13.90 F2,79=1.128 0.329 Abbreviations: CAI = Chronic Ankle Instability, CAIT = Cumberland Ankle Instability Tool. Values are mean ± standard deviation.
MANUSCRIP
T
ACCEPTED
ACCEPTED MANUSCRIPT
Table 3. Clinimetric properties at each potential CAIT cutoff using Dataset 1.
CAIT Sn 1-Sp Sp Youden Index LR+ LR-
7.0 0.000 0.000 1.000 0.000 - 1.000
8.5 0.016 0.000 1.000 0.016 - 0.984
9.5 0.033 0.000 1.000 0.033 - 0.967
11.0 0.049 0.000 1.000 0.049 - 0.951
13.0 0.066 0.000 1.000 0.066 - 0.934
14.5 0.098 0.000 1.000 0.098 - 0.902
15.5 0.164 0.000 1.000 0.164 - 0.836
16.5 0.246 0.000 1.000 0.246 - 0.754
17.5 0.328 0.000 1.000 0.328 - 0.672
18.5 0.377 0.000 1.000 0.377 - 0.623
19.5 0.475 0.000 1.000 0.475 - 0.525
20.5 0.590 0.000 1.000 0.590 - 0.410
21.5 0.656 0.000 1.000 0.656 - 0.344
22.5 0.754 0.000 1.000 0.754 - 0.246
23.5 0.820 0.000 1.000 0.820 - 0.180
24.5 0.918 0.000 1.000 0.918 - 0.082
25.5 0.951 0.000 1.000 0.951 - 0.049
26.5 0.951 0.035 0.965 0.916 27.171 0.051
27.5 0.984 0.070 0.930 0.914 14.057 0.017
28.5 1.000 0.158 0.842 0.842 6.329 0.000
29.5 1.000 0.211 0.789 0.789 4.739 0.000
31.0 1.000 1.000 0.000 0.000 1.000 -
Abbreviations: CAIT = Cumberland Ankle Instability Tool, Sn = sensitivity, Sp = Specificity, LR+ = Positive likelihood ratio, LR- = Negative Likelihood ratio
MANUSCRIP
T
ACCEPTED
ACCEPTED MANUSCRIPT
Table 4. Clinimetric properties at each potential CAIT cutoff using Dataset 2.
CAIT Sn 1-Sp Sp Youden Index LR+ LR-
5.0 0.000 0.000 1.000 0.000 - 1.000
9.0 0.034 0.000 1.000 0.034 - 0.966
13.0 0.069 0.000 1.000 0.069 - 0.931
15.0 0.103 0.000 1.000 0.103 - 0.897
16.5 0.207 0.000 1.000 0.207 - 0.793
17.5 0.241 0.000 1.000 0.241 - 0.759
18.5 0.310 0.000 1.000 0.310 - 0.690
19.5 0.379 0.000 1.000 0.379 - 0.621
20.5 0.483 0.000 1.000 0.483 - 0.517
21.5 0.655 0.000 1.000 0.655 - 0.345
22.5 0.759 0.000 1.000 0.759 - 0.241
23.5 0.931 0.038 0.962 0.893 24.500 0.072
24.5 0.931 0.057 0.943 0.874 16.333 0.073
25.5 0.966 0.132 0.868 0.834 7.318 0.039
26.5 1.000 0.189 0.811 0.811 5.291 0.000
27.5 1.000 0.458 0.542 0.542 2.183 0.000
28.5 1.000 0.472 0.528 0.528 2.119 0.000
29.5 1.000 0.623 0.377 0.377 1.605 0.000
31.00 1.000 1.000 0.000 0.000 1.000 -
Abbreviations: CAIT = Cumberland Ankle Instability Tool, Sn = sensitivity, Sp = Specificity, LR+ = Positive likelihood ratio, LR- = Negative Likelihood ratio
MANUSCRIP
T
ACCEPTED
ACCEPTED MANUSCRIPT
Table 5. Comparison of CAIT clinimetric properties between datasets
Test Characteristic Hiller 2006 (cutoff: ≤27)
Dataset 1 (cutoff: ≤25)
Dataset 2 (cutoff: ≤25)
Sensitivity 0.860 0.951 0.966
Specificity 0.830 1.000 0.868
Positive Likelihood ratio 4.890 27.171a 7.318
Negative Likelihood ratio 0.180 0.051 0.039 Abbreviations: CAIT = Cumberland Ankle Instability Tool a Due to perfect specificity, the positive likelihood ratio could not be calculated at the ≤25 cutoff, the value given is for the next closest value (≤26) where it could be calculated.
MANUSCRIP
T
ACCEPTED
ACCEPTED MANUSCRIPT
Figure 1.
25.5*
MANUSCRIP
T
ACCEPTED
ACCEPTED MANUSCRIPT
Figure 2.
23.5*
25.5†