
Mason Trouchet, Rainstorm Dust Control - Action to Prevent Fugitive Dust
Upload
jolene-williamsonCategory
view
166download
5description
WRAP Fugitive Dust Handbook
Richard Countess Countess Environmental
Westlake Village, CA
WRAP WorkshopMay 24, 2006
Sacramento, CA
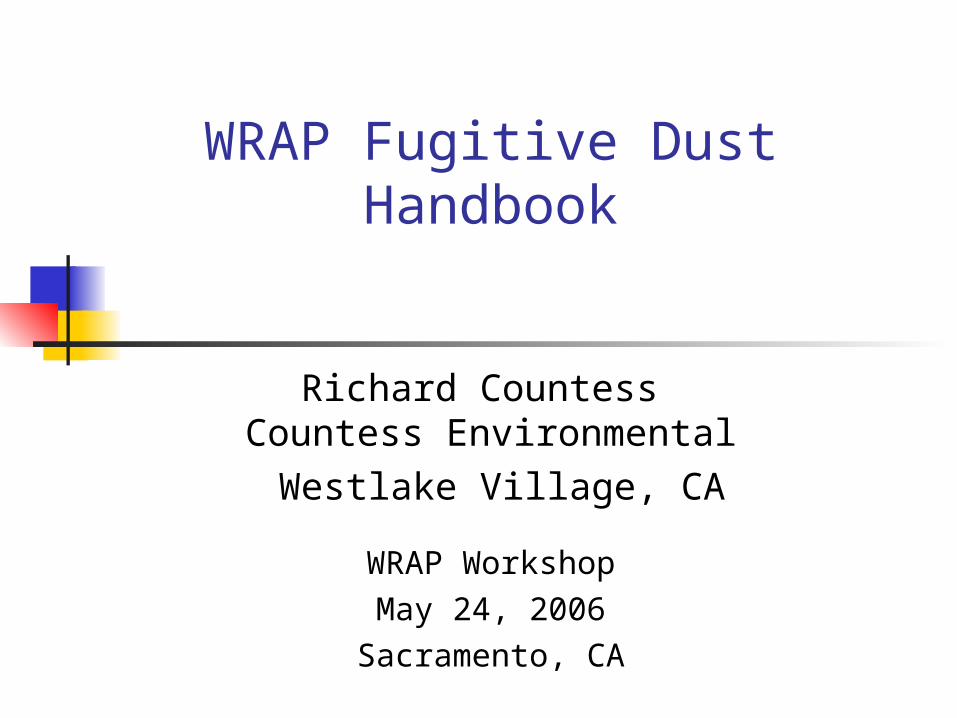
Fugitive Dust Originates from Many Different Source Categories
Overview
The handbook is intended to be a comprehensive resource on emission estimation methodologies and control measures to reduce fugitive dust emissions.
The methods for estimating dust emissions rely on AP-42 and alternative methods adopted by air quality agencies in the WRAP region.
Because many formulae and factors incorporate default values that have been derived for average US conditions, area-specific factors should be used when available.
The handbook and associated website will be updated as new information becomes available.
Handbook Features
Comprehensive documentation of emission estimation methods adopted by federal and state agencies plus methods in the developmental stage
Detailed discussion of demonstrated control measures
Lists of published control efficiencies for a large number of fugitive dust control measures for each fugitive dust source category
Handbook Features (continued)
Sample regulatory formats adopted by state and local agencies in the WRAP region
Sample compliance tools to assure that the regulations are being followed
Detailed methodology for calculating the cost-effectiveness of different control measures
Sample calculations for control measure cost-effectiveness for each fugitive dust source category
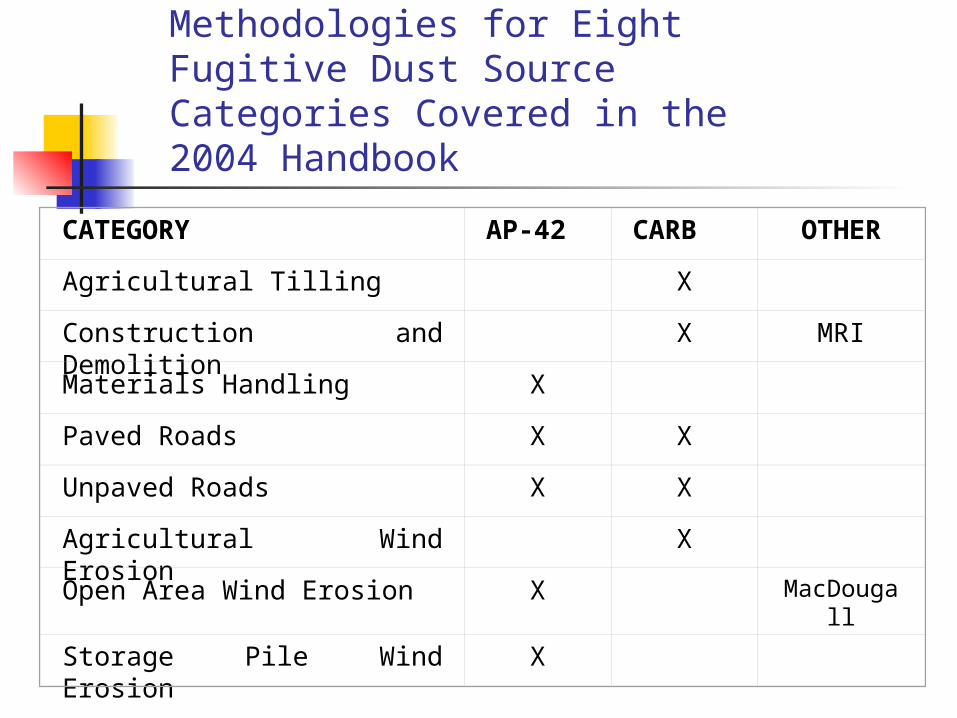
Emission Estimation Methodologies for Eight Fugitive Dust Source Categories Covered in the 2004 Handbook
CATEGORY AP-42 CARB OTHER
Agricultural Tilling X
Construction and Demolition
X MRI
Materials Handling X
Paved Roads X X
Unpaved Roads X X
Agricultural Wind Erosion X
Open Area Wind Erosion X MacDougall
Storage Pile Wind Erosion X
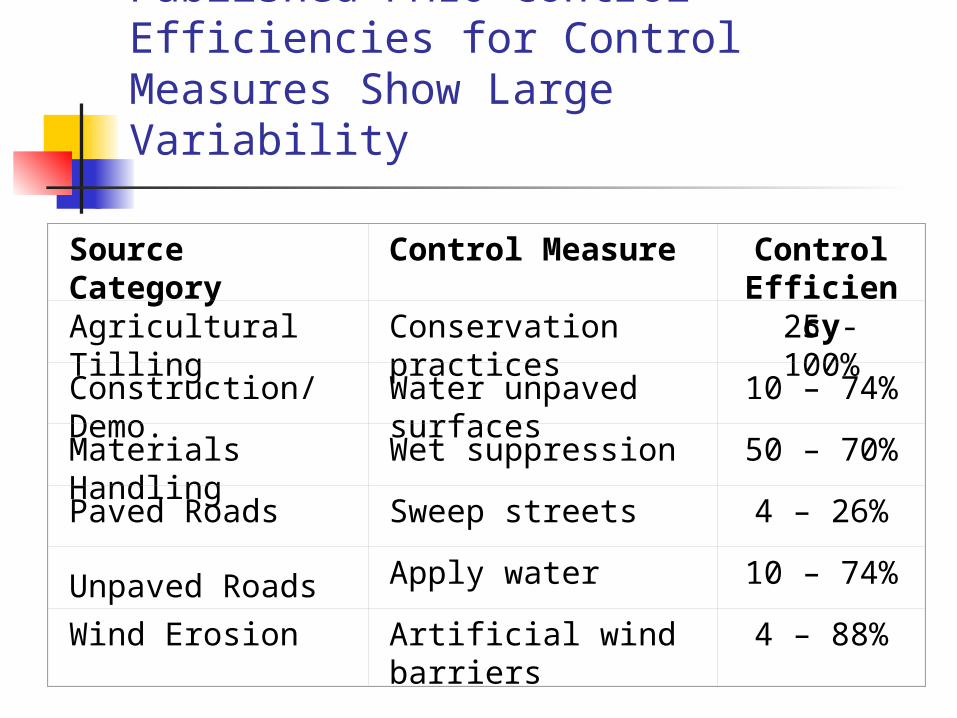
Published PM10 Control Efficiencies for Control Measures Show Large Variability
Source Category Control Measure Control Efficiency
Agricultural Tilling Conservation practices 25 - 100%
Construction/Demo. Water unpaved surfaces 10 – 74%
Materials Handling Wet suppression 50 – 70%
Paved Roads Sweep streets 4 – 26%
Unpaved Roads Apply water 10 – 74%
Wind Erosion Artificial wind barriers 4 – 88%
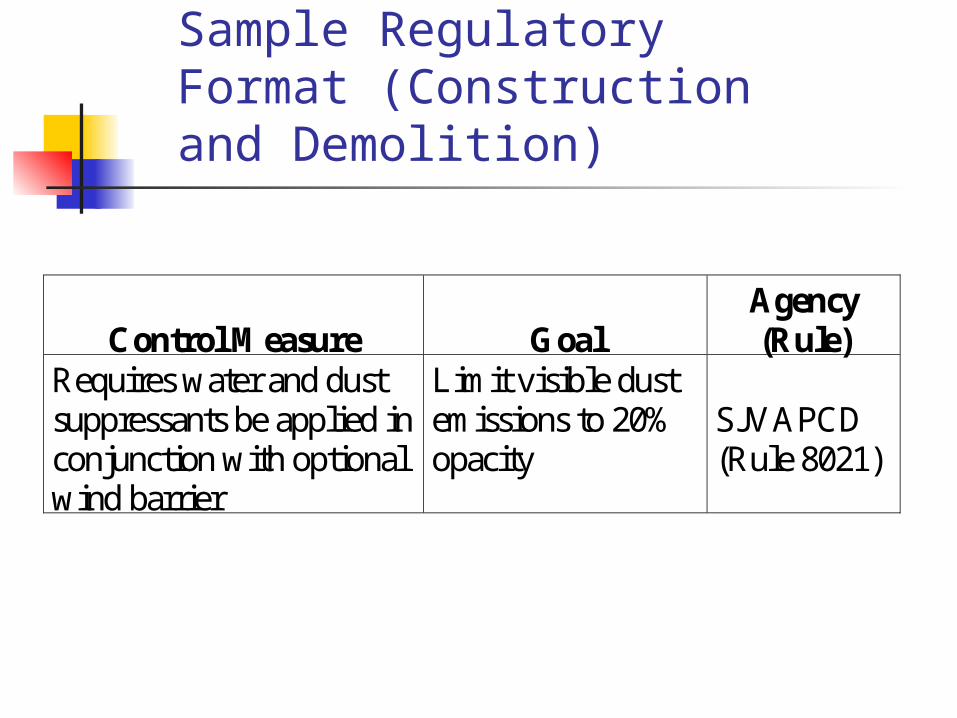
Sample Regulatory Format (Construction and Demolition)
Control Measure Goal Agency (Rule)
Requires water and dust suppressants be applied in conjunction with optional wind barrier
Limit visible dust emissions to 20% opacity
SJVAPCD (Rule 8021)
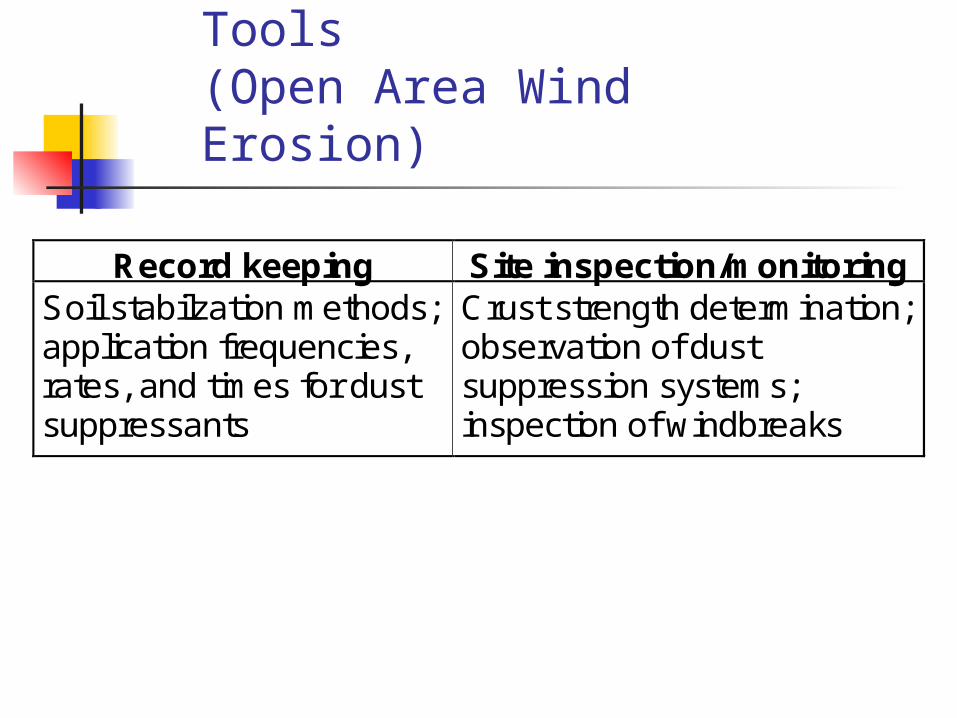
Sample Compliance Tools (Open Area Wind Erosion)
Record keeping Site inspection/monitoring Soil stabilzation methods; application frequencies, rates, and times for dust suppressants
Crust strength determination; observation of dust suppression systems; inspection of windbreaks
Evaluation of Fugitive Dust Control Measure Options
Due to large uncertainties in published control cost-effectiveness estimates, which range over several orders of magnitude, a standardized methodology was developed to calculate the cost-effectiveness of fugitive dust control measures rather than presenting published estimates.
Technical Approach for Calculating Cost-Effectiveness of Control Measures
Developed a uniform step-by-step methodology for calculating the cost-effectiveness for different control measures
Provided a generic sample calculation for each fugitive dust source category
Included lists of published control efficiencies for different control measures
Evaluation of control measure options should be based on cost data and assumptions applicable to the specific situation (location, season, etc.)
Steps to Calculate Cost-Effectiveness of Specific Control Measures
Identify applicable emission factor equation Select a specific control measure for the fugitive
dust source Specify the basic parameters required to calculate
uncontrolled and controlled emissions parameters used in the emission factor equation source extent (activity level) control measure implementation schedule
(freq./application rate) Calculate emission factor from the applicable
emission factor equation
Cost-Effectiveness Calculation (continued)
Calculate the annual uncontrolled emission rate as the product of the emission factor and the source extent
Determine the control efficiency of the control measure Calculate annual controlled emission rate Calculate emissions reduction due to control measure
(uncontrolled minus controlled emission rate) Gather cost estimates for implementing control measure
annualized capital costs annual O&M/overhead/enforcement/compliance costs
Cost-Effectiveness Calculation (continued)
Calculate annualized capital investment cost Calculate total annualized cost (sum of
annualized capital investment cost plus annual O&M/overhead/enforcement/compliance costs)
Calculate cost-effectiveness ($/ton PM10 reduction) of selected control measure (total annualized costs divided by the emissions reduction)
2006 Revisions to the Handbook
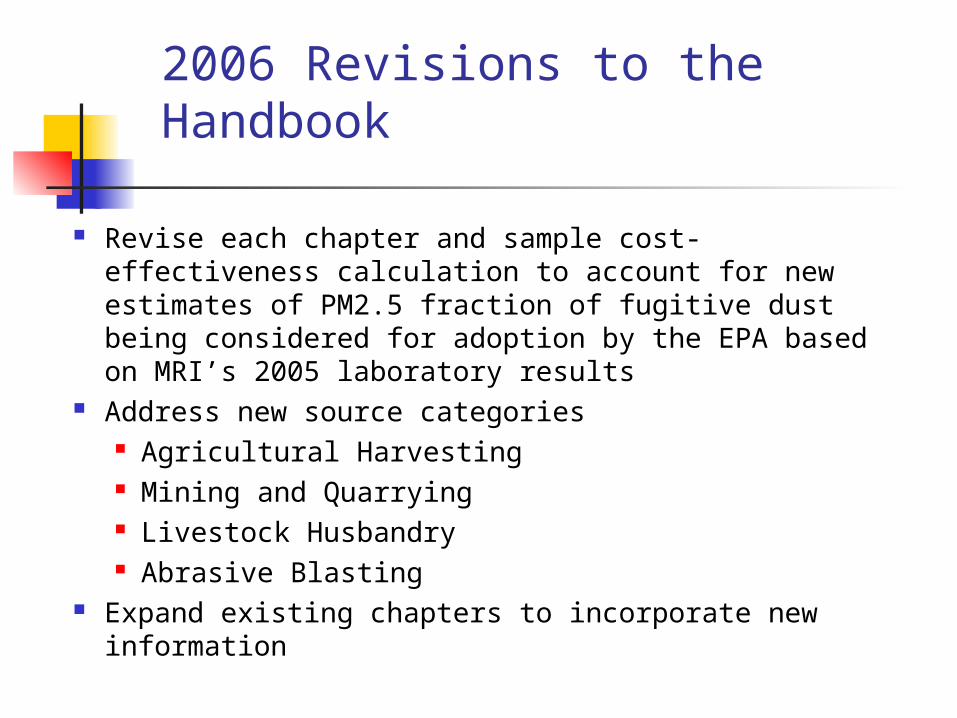
Revise each chapter and sample cost-effectiveness calculation to account for new estimates of PM2.5 fraction of fugitive dust being considered for adoption by the EPA based on MRI’s 2005 laboratory results
Address new source categories Agricultural Harvesting Mining and Quarrying Livestock Husbandry Abrasive Blasting
Expand existing chapters to incorporate new information
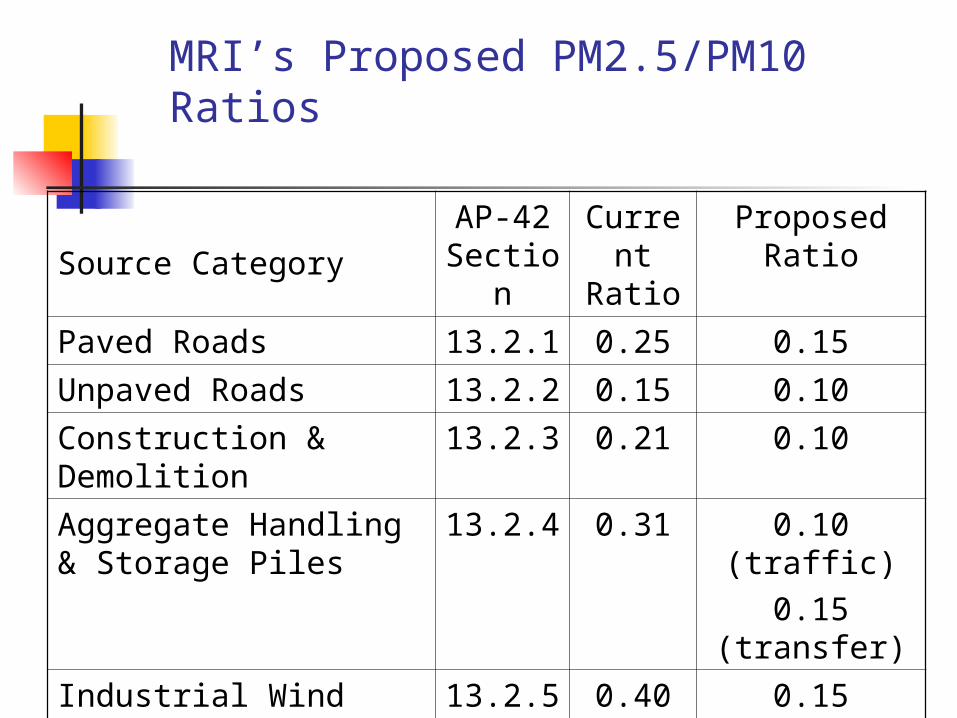
MRI’s Proposed PM2.5/PM10 Ratios
Source CategoryAP-42 Sectio
n
Current
Ratio
Proposed Ratio
Paved Roads 13.2.1 0.25 0.15
Unpaved Roads 13.2.2 0.15 0.10
Construction & Demolition
13.2.3 0.21 0.10
Aggregate Handling & Storage Piles
13.2.4 0.31 0.10 (traffic)0.15
(transfer)
Industrial Wind Erosion
13.2.5 0.40 0.15
Agricultural Tilling - - 0.20
Open Area Wind Erosion
- - 0.15
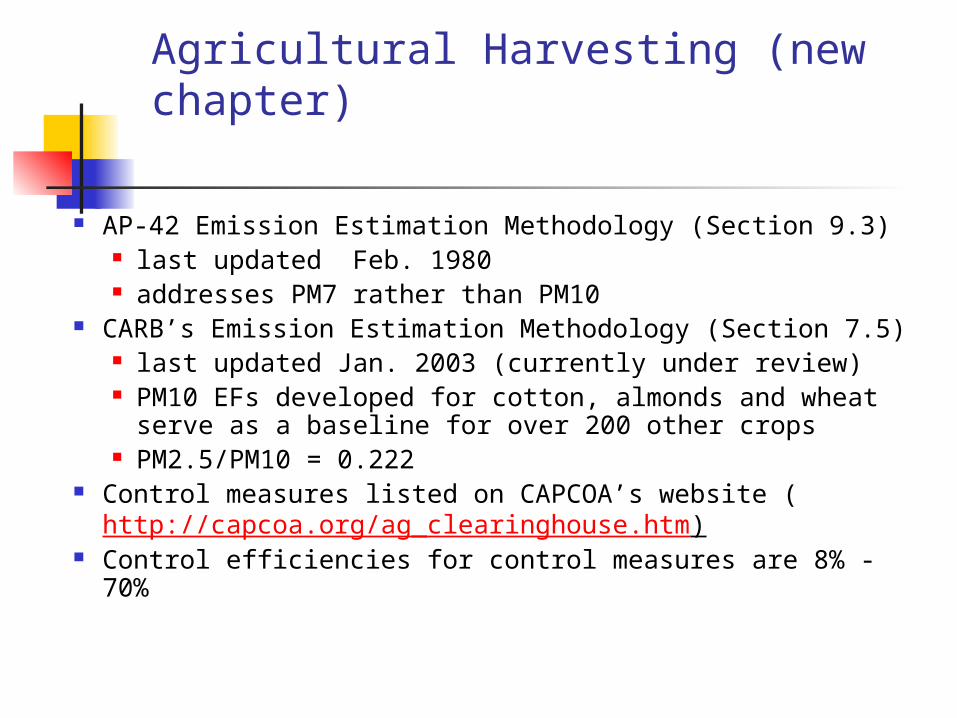
Agricultural Harvesting (new chapter)
AP-42 Emission Estimation Methodology (Section 9.3) last updated Feb. 1980 addresses PM7 rather than PM10
CARB’s Emission Estimation Methodology (Section 7.5) last updated Jan. 2003 (currently under review) PM10 EFs developed for cotton, almonds and wheat
serve as a baseline for over 200 other crops PM2.5/PM10 = 0.222
Control measures listed on CAPCOA’s website (http://capcoa.org/ag_clearinghouse.htm)
Control efficiencies for control measures are 8% - 70%
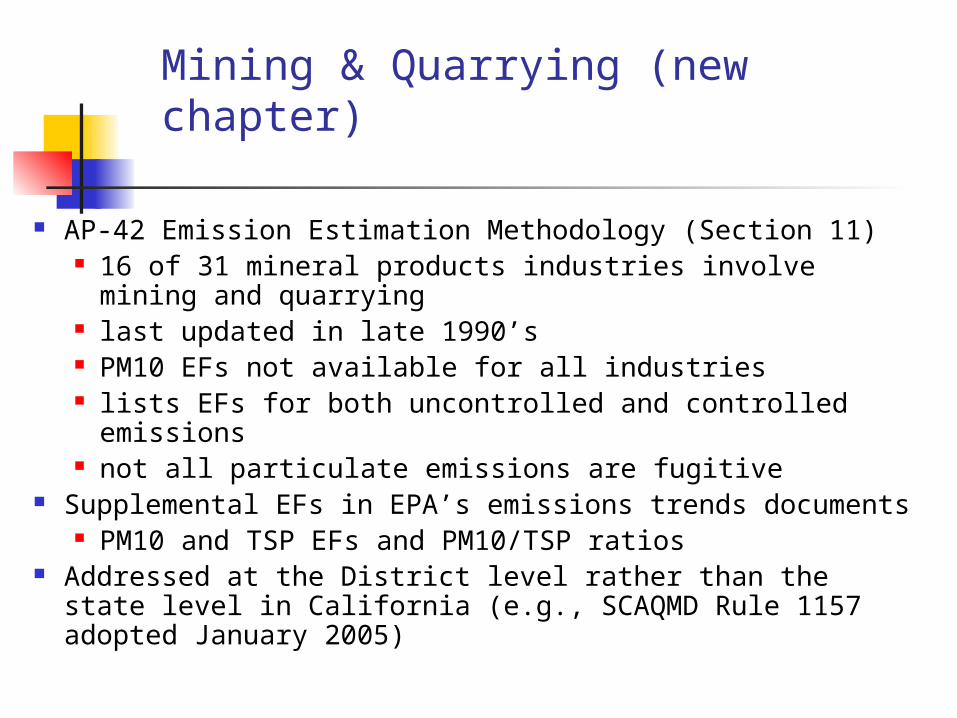
Mining & Quarrying (new chapter)
AP-42 Emission Estimation Methodology (Section 11) 16 of 31 mineral products industries involve mining
and quarrying last updated in late 1990’s PM10 EFs not available for all industries lists EFs for both uncontrolled and controlled
emissions not all particulate emissions are fugitive
Supplemental EFs in EPA’s emissions trends documents PM10 and TSP EFs and PM10/TSP ratios
Addressed at the District level rather than the state level in California (e.g., SCAQMD Rule 1157 adopted January 2005)
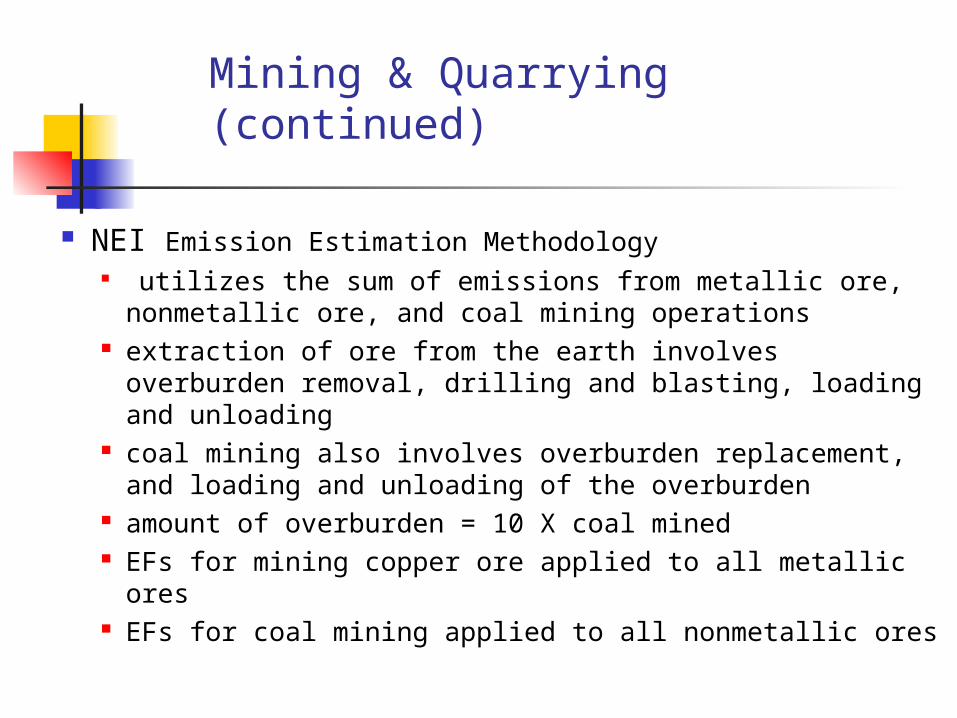
Mining & Quarrying (continued)
NEI Emission Estimation Methodology utilizes the sum of emissions from metallic ore,
nonmetallic ore, and coal mining operations extraction of ore from the earth involves overburden
removal, drilling and blasting, loading and unloading coal mining also involves overburden replacement,
and loading and unloading of the overburden amount of overburden = 10 X coal mined EFs for mining copper ore applied to all metallic ores EFs for coal mining applied to all nonmetallic ores
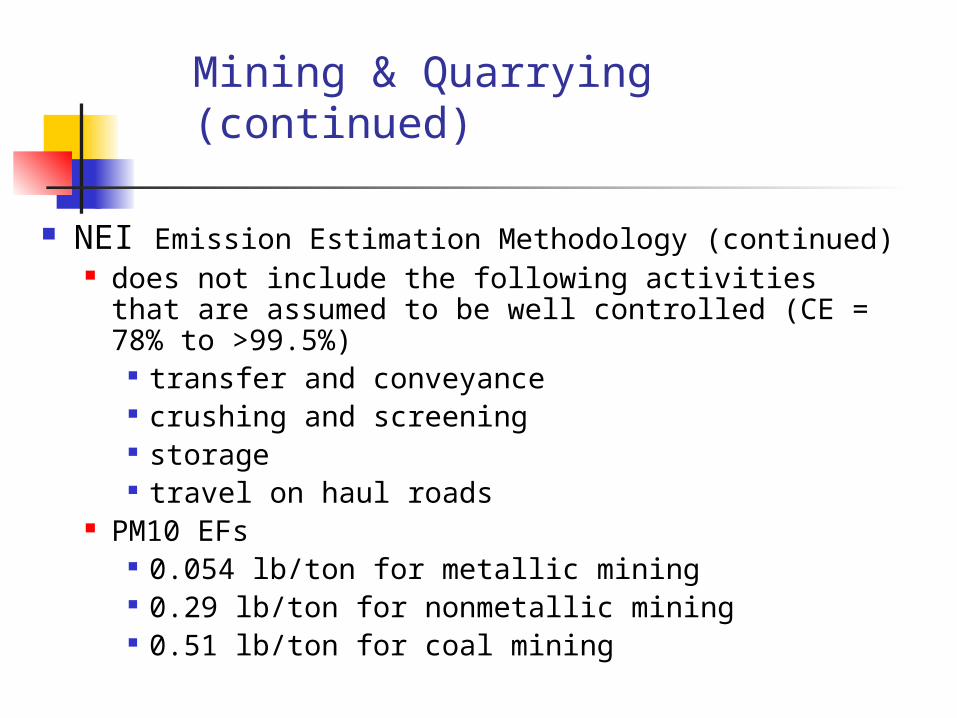
Mining & Quarrying (continued)
NEI Emission Estimation Methodology (continued) does not include the following activities that are
assumed to be well controlled (CE = 78% to >99.5%)
transfer and conveyance crushing and screening storage travel on haul roads
PM10 EFs 0.054 lb/ton for metallic mining 0.29 lb/ton for nonmetallic mining 0.51 lb/ton for coal mining
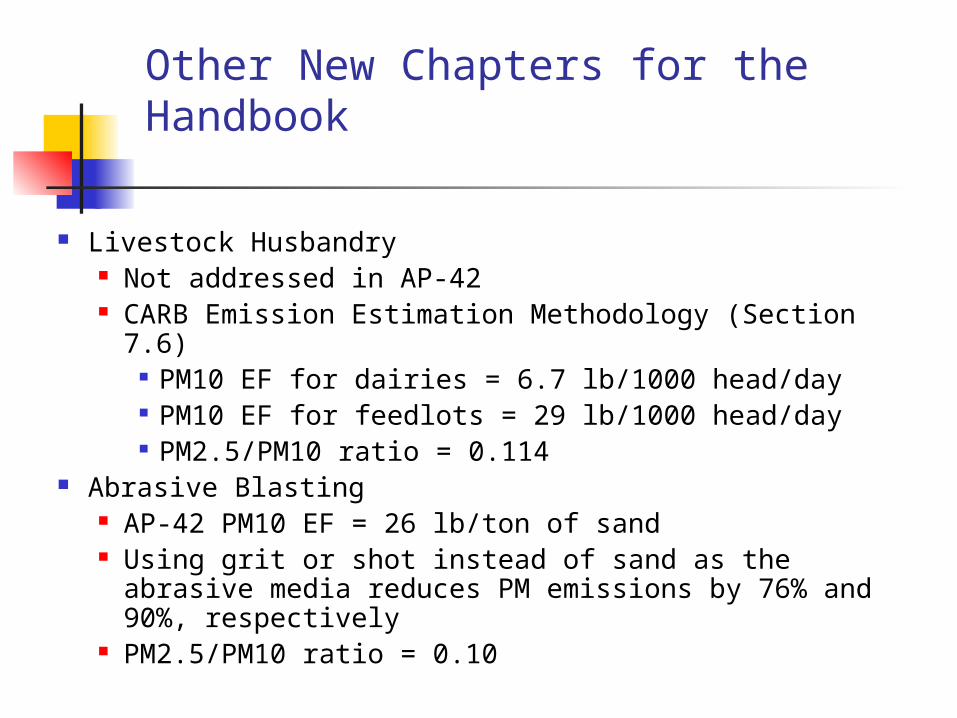
Other New Chapters for the Handbook
Livestock Husbandry Not addressed in AP-42 CARB Emission Estimation Methodology (Section 7.6)
PM10 EF for dairies = 6.7 lb/1000 head/day PM10 EF for feedlots = 29 lb/1000 head/day PM2.5/PM10 ratio = 0.114
Abrasive Blasting AP-42 PM10 EF = 26 lb/ton of sand Using grit or shot instead of sand as the abrasive
media reduces PM emissions by 76% and 90%, respectively
PM2.5/PM10 ratio = 0.10
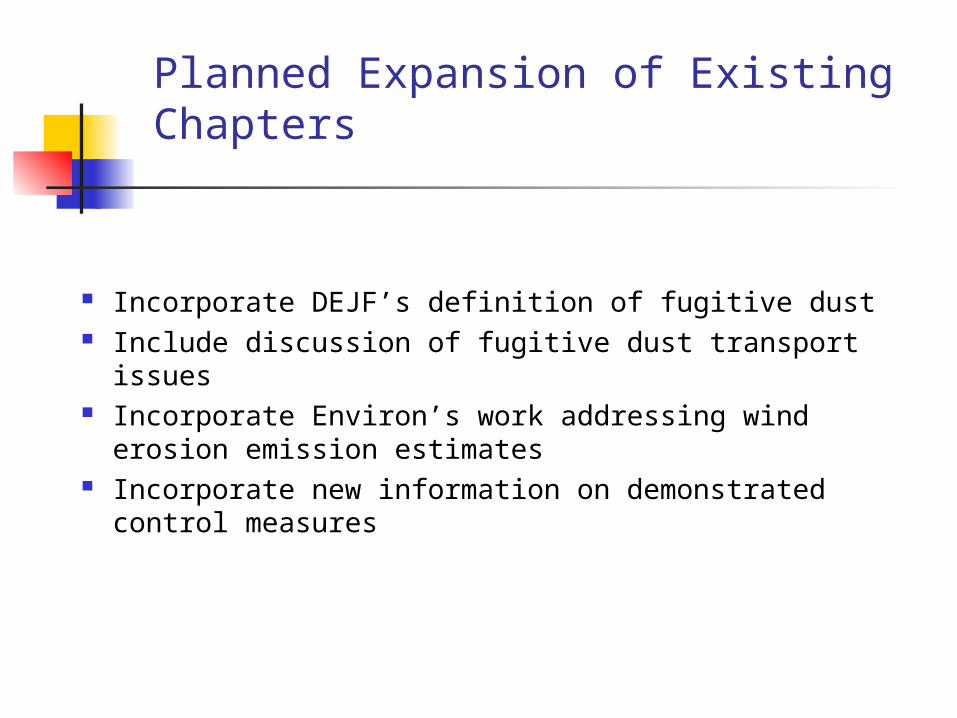
Planned Expansion of Existing Chapters
Incorporate DEJF’s definition of fugitive dust Include discussion of fugitive dust transport issues Incorporate Environ’s work addressing wind
erosion emission estimates Incorporate new information on demonstrated
control measures
Fugitive Dust Website www.wrapair.org/forums/dejf/fdh
Website populated with material from the handbook primary menu laid out by source category includes links to other useful resources
Downloadable files include: Word & PDF text files for each source category
plus for the entire handbook Interactive Excel cost-effectiveness calculation
spreadsheets with lookup tables of default values for different parameters for each source category
History of revisions