WR $VFHUWDLQ &DXVHV RI 1HRQWDO 'HDWKV LQ...
58
$ 5HSRUW RQ 9HUEDO $XWRSV\ WR $VFHUWDLQ &DXVHV RI 1HRQWDO 'HDWKV LQ 1HSDO
Transcript of WR $VFHUWDLQ &DXVHV RI 1HRQWDO 'HDWKV LQ...


Submitted to:
United States Agency for International Development, Offi ce of Acquisition and Assistance,
Maharajgunj, Kathmandu, Nepal
Submitted by:
Integrated Rural Health Development Training Centre (IRHDTC), Maharajgunj, Kathmandu, Nepal
Study Team Members
Dr. Jyoti Ratna Dhakwa, Team Leader (Principal Investigator)Dr. Nitin Nischal Bhandari, Co-InvestigatorDr. Purushotam Raj Shedain, Local Expert
Ms. Sirjana Khanal, M & E Offi cer Prof. Dr. Amita Pradhan, Biostatistician
Dr. Binod Man Shrestha, Consultant PhysicianDr. Bal Krishna Kalakheti, Consultant Physician
Solicitation Number: SOL-367-13-000014


Newborn Care Verbal Autopsy Program was carried out in six CBNCP implemented districts – Dolpa, Jumla, Palpa, Salyan, Morang & Chitwan. The primary objective of this survey was to gather data and information
about the causes of deaths among neonates in these districts and also shed light on service utilization by families of the deceased. Since there is a lack of vital registration system in our country, deaths of most of the babies are not recorded due to which information on causes of deaths are generally not available. Death certifi cates are almost non -existent and those that are available are not representative of the entire population. It was, therefore, deemed necessary to conduct the study to meet this objective.
The research was undertaken in guidance of the Child Health Division/Ministry of Health & Population, funded by the United States Agency for International Development (USAID). Technical assistance was provided by Integrated Rural Health Development Training Centre (IRHDTC/Nepal). This report presents fi ndings from Newborn Verbal Autopsy Research Program from the above-mentioned districts.
In this regard, we express our deep sense of appreciation to the Oversight members for their valuable input throughout the period. We would like to extend our appreciation to Ms. Jessica Healey and Ms. Naramaya Limbu, USAID/Nepal for their constant input and support. We would also like to thank H4L Nepalgunj Offi ce for providing support in Jumla and Salyan districts. Similarly, we would like to acknowledge the support provided by One Heart World in Dolpa district.
Special thanks goes to the core staff , Dr. Jyoti Ratna Dhakhwa, Team Leader; Dr. Nitin Nischal Bhandari, Dr. Purusotam Raj Shedain, Ms. Sirjana Khanal, Prof. Dr. Amita Pradhan and all the other staff of IRHDTC for managing technical, administrative and logistic needs of the study. Our special thanks go to the fi eld coordinators and enumerators for their untiring eff ort in making the study a success. We are also grateful to Dr. Binod Man Shrestha and Dr. Bal Krishna Kalakheti for meticulously reviewing the neonatal verbal autopsy forms.
Similarly, we would like to acknowledge offi cials of respective District Health Offi ces, Health Posts, Sub-health Posts, District Development Committees and Village Development Committees for their support. Our sincere thanks to FCHVs, local leaders and community members for their support during data collection. Finally, we extend our deepest gratitude to all the respondents whose participation was critical to the successful completion of this survey.
______________________Ram Bhandari Executive Director, IRHDTC
______________________Dr. Shyam Raj Upreti
Director, CHD

AHW Assistant Health WorkerANC Antenatal CareANM Auxiliary Nurse MidwifeBPP Birth Preparedness PlanCB-IMCI Community Based Integrated Management of Childhood Illness CBNCP Community Based Newborn Care ProgramCDK Clean Delivery KitCHD Child Health DivisionCOD Cause of DeathCSMR Cause Specifi c Mortality RateENC Essential Newborn CareFCHV Female Community Health VolunteerFHD Family Health DivisionHMIS Health Management Information SystemIRHDTC Integrated Rural Health Development Training CentreIMR Infant Mortality RateMCHW Maternal Child Health WorkerMDG Millennium Development GoalMGM Mothers Group MeetingMOHP Ministry of Health and PopulationNDHS Nepal Demographic Health SurveyNHRC Nepal Health Research CouncilNHSP-II Nepal Health Sector Program-IINMR Neonatal Mortality RatePHCC Primary Health Care CentreSBA Skilled Birth AttendantTT Tetanus ToxoidU5MR Under-fi ve Mortality RateUN IGME United Nations Inter-agency Group for Child Mortality EstimationUSAID United States Agency for International Development VA Verbal AutopsyVHW Village Health WorkerVR Vital Registration

1. Introduction 1-31.1 Background ...........................................................................................................................................................21.2 Objectives of the Study .......................................................................................................................................3
2. Methodology 4-52.1 Study Sites .............................................................................................................................................................42.2 Study Design, Study Population and Sample Size............................................................................................42.3 Study Tools .............................................................................................................................................................42.4 Data Collection, Processing and Analysis ..........................................................................................................52.5 Quality Assurance .................................................................................................................................................52.6 Ethical Approval ....................................................................................................................................................5
3. Characteristics of Study Population 6-83.1 Respondents ..........................................................................................................................................................63.2 Mothers Age ..........................................................................................................................................................63.3 Mothers Education ...............................................................................................................................................63.4 Caste/ Ethnicity/ Religion ....................................................................................................................................63.5 Presence of Respondents ....................................................................................................................................63.6 Awareness of Essential Newborn Care (ENC) Messages .................................................................................7
4. Vital Information of Deceased Babies 9-13
5. ANC and Pregnancy History of Mothers 105.1 Utilization of Services During ANC ...................................................................................................................105.2 TT Vaccination During Pregnancy ....................................................................................................................105.3 Consumption of Deworming Tablets During Pregnancy ..............................................................................115.4 FCHV Services ......................................................................................................................................................125.5 Birth Preparedness .............................................................................................................................................125.6 Complications during third trimester of pregnancy ......................................................................................13
6. Causes of Deaths 14-166.1 Causes of Deaths .................................................................................................................................................146.2 Time of Neonatal Deaths ...................................................................................................................................146.3 Distribution of Causes of Deaths by Selected Variables ................................................................................15
7. Labor and Delivery History 17-197.1 Places of Delivery ...............................................................................................................................................177.2 Seeking Care ........................................................................................................................................................187.3 Reaching Care .....................................................................................................................................................187.4 Receiving Care .....................................................................................................................................................19
8. Practice of Essential Newborn Care 20-258.1 Assistance During Delivery ................................................................................................................................208.2 Reasons for Home Delivery ...............................................................................................................................208.3 Delivery Practices ................................................................................................................................................21

8.4 Crying at Birth .....................................................................................................................................................228.5 Practice of Essential Newborn Care in Non-institutional Delivery ...............................................................228.6 Birth Weight .........................................................................................................................................................238.7 Breastfeeding Practices ......................................................................................................................................238.8 First Health Check-Up of Mothers By Place Of Delivery .................................................................................248.9 First Health Check-Up of Newborn Babies By Place Of Birth ........................................................................248.10 Newborn Assessment By Health Worker .........................................................................................................25
9. Care Seeking at Time of Illness 26-30
10. Review of Managed Asphyxia Cases 2810.1 Condition of the Baby And Procedure Done At the Time of Birth ................................................................2810.2 Physicians Assessment of Asphyxiated Babies ..............................................................................................2910.3 Procedures Versus Outcomes ............................................................................................................................2910.4 Illness History .....................................................................................................................................................30
11. Case Studies 31-3211.1 Delay in Receiving Services ...............................................................................................................................3111.2 Baby saved by the use of Bag & Mask: 1 ..........................................................................................................3111.3 Baby saved by the use of Bag & Mask: 2 .........................................................................................................3111.4 Baby saved by the use of Bag & Mask: 3 ..........................................................................................................3211.5 Baby saved by the use of Dee Le Suction tube ...............................................................................................32
12. Discussion 33-36
Annexes 37-38
Additional Analysis 39-43
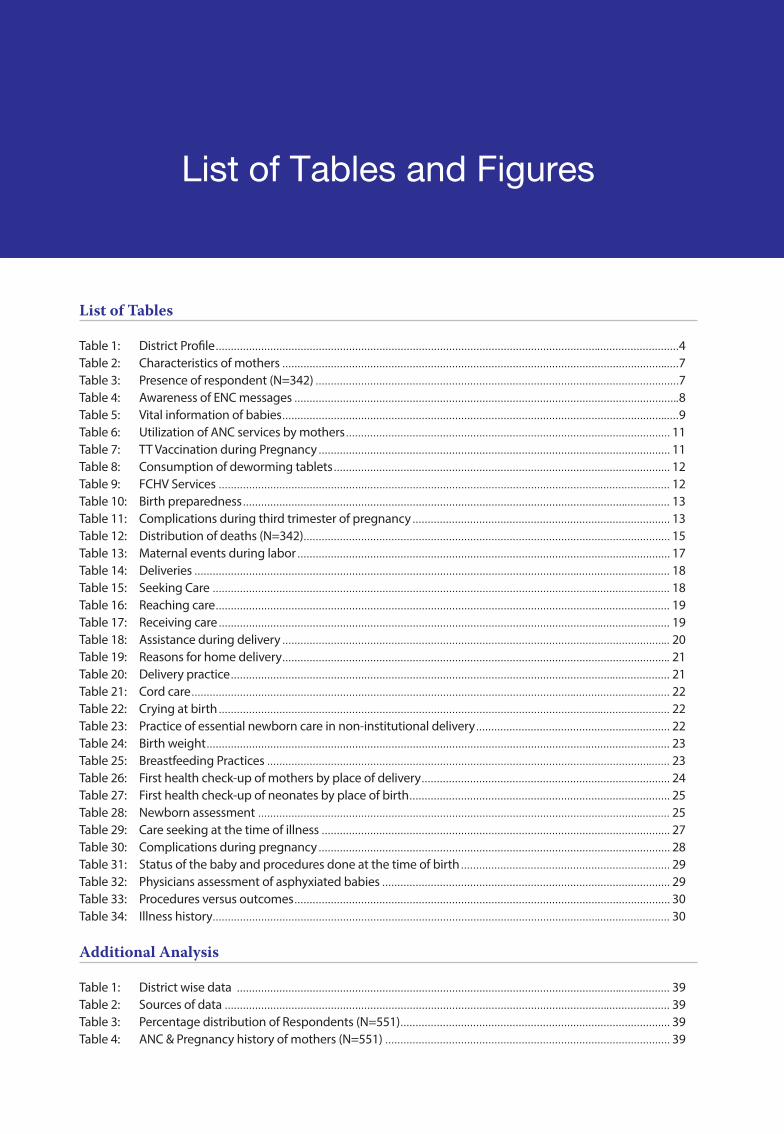
List of Tables
Table 1: District Profi le .........................................................................................................................................................4Table 2: Characteristics of mothers ...................................................................................................................................7Table 3: Presence of respondent (N=342) ........................................................................................................................7Table 4: Awareness of ENC messages ...............................................................................................................................8Table 5: Vital information of babies ...................................................................................................................................9Table 6: Utilization of ANC services by mothers ........................................................................................................... 11Table 7: TT Vaccination during Pregnancy .................................................................................................................... 11Table 8: Consumption of deworming tablets ............................................................................................................... 12Table 9: FCHV Services ..................................................................................................................................................... 12Table 10: Birth preparedness ............................................................................................................................................. 13Table 11: Complications during third trimester of pregnancy ..................................................................................... 13Table 12: Distribution of deaths (N=342) ......................................................................................................................... 15Table 13: Maternal events during labor ........................................................................................................................... 17Table 14: Deliveries ............................................................................................................................................................. 18Table 15: Seeking Care ....................................................................................................................................................... 18Table 16: Reaching care ...................................................................................................................................................... 19Table 17: Receiving care ..................................................................................................................................................... 19Table 18: Assistance during delivery ................................................................................................................................ 20Table 19: Reasons for home delivery ................................................................................................................................ 21Table 20: Delivery practice ................................................................................................................................................. 21Table 21: Cord care .............................................................................................................................................................. 22Table 22: Crying at birth ..................................................................................................................................................... 22Table 23: Practice of essential newborn care in non-institutional delivery ................................................................ 22Table 24: Birth weight ......................................................................................................................................................... 23Table 25: Breastfeeding Practices ..................................................................................................................................... 23Table 26: First health check-up of mothers by place of delivery .................................................................................. 24Table 27: First health check-up of neonates by place of birth ...................................................................................... 25Table 28: Newborn assessment ........................................................................................................................................ 25Table 29: Care seeking at the time of illness ................................................................................................................... 27Table 30: Complications during pregnancy .................................................................................................................... 28Table 31: Status of the baby and procedures done at the time of birth ..................................................................... 29Table 32: Physicians assessment of asphyxiated babies ............................................................................................... 29Table 33: Procedures versus outcomes ............................................................................................................................ 30Table 34: Illness history ....................................................................................................................................................... 30
Additional Analysis
Table 1: District wise data ............................................................................................................................................... 39Table 2: Sources of data ................................................................................................................................................... 39Table 3: Percentage distribution of Respondents (N=551) ......................................................................................... 39Table 4: ANC & Pregnancy history of mothers (N=551) .............................................................................................. 39

Table 5: Number of live births prior to the deceased child (N=299) ......................................................................... 40Table 6: Birth Spacing in relation to the Previous child (N=273) ............................................................................... 40Table 7: Tobacco consumption by Mothers during Pregnancy (N=71) .................................................................... 40Table 8: Alcohol Consumption by Mothers during Pregnancy (N=88) ..................................................................... 40Table 9: Smoking By other family members (N=348) ................................................................................................. 40Table 10: Main fuel used for cooking (N=551) ................................................................................................................ 40Table 11: Place for Cooking (N=551) ................................................................................................................................ 41Table 12: Gestational age (N=551) .................................................................................................................................... 41Table 13: Duration of labor (N=551) ................................................................................................................................. 41Table 14: Fetal movement before labor (N = 529) .......................................................................................................... 41Table 15: Fetal movement after labor (N= 529) .............................................................................................................. 41Table 16: Complications during delivery (N=345) ......................................................................................................... 41Table 17: Material used for hand washing (N= 138) ...................................................................................................... 41Table 18: Use of CDK (N=265) ............................................................................................................................................ 42Table 19: Object on which the stump was placed (N=265) .......................................................................................... 42Table 20: Procedures done to make baby breath (N=230) .......................................................................................... 42Table 21: Condition of delivery room (N=551) ............................................................................................................... 42Table 22: Room heating (N=551) ...................................................................................................................................... 42Table 23: Baby bathed (N=250) ......................................................................................................................................... 42Table 24: Additional visit by HWs for babies who were very small (N=68) ................................................................. 43Table 25: Advise given by FCHV for babies with low birth weight (N=27) ................................................................. 43Table 26: Time before death, when the baby stopped sucking (N=127) ................................................................... 43Table 27: Distribution of probable causes of neonatal deaths as per age of mothers (N=342) .............................. 43
List of Figures
Figure 1: Causes of deaths ..................................................................................................................................................14Figure 2: Distribution of reported neonatal deaths by age in days .............................................................................15

In Nepal, deaths of most of the neonates are not recorded due to lack of vital registration system, as a result the causes of death are not known. Neonatal verbal autopsy was conducted in six districts of the country in an
eff ort to explore the probable causes of neonatal deaths; in addition the study also explored stillbirths and the growth and development of survived asphyxiated babies. The districts surveyed were Dolpa, Jumla, Palpa, Salyan, Chitwan and Morang. The districts were selected purposively from each ecological region where CB-NCP program have been implemented for at least a year. The mothers of the deceased or the next of kin were interviewed using a standard verbal autopsy questionnaire developed by the WHO, the causes of death was ascertained using physician’s review. Measurement of developmental milestones (gross motor, fi ne motor, language and social behavior) and anthropometric measurement of survived babies along with a questionnaire on illness history helped to recognize wellbeing, growth and development status of survived asphyxiated babies.
The main objectives of the study were to: Carry out neonatal verbal autopsies to ascertain causes of neonatal deaths in selected CBNCP implemented districts, Assess the outcome of asphyxia cases managed in the study district,Recognize delays in identifi cation of illness and care seeking at the time of illness of neonates.
Findings on stillbirths and neonatal deaths
Seventy-seven percent of respondents in the study were mothers and the remaining were relatives, non-relatives and fathers. A majority of respondents (84 percent) were with the sick newborn during the entire period i.e. from illness till death. Only two thirds (66 percent) of mothers were aware about messages of essential newborn care and only half received the message through FCHV (51 percent). Utilization of services was found to be very promising with 90 percent of mothers utilizing ANC services and with 50 percent making four or more Antenatal care visits.
A total of 551 deaths were recorded, among which 342 were live births and 209 stillbirths. The majority of deaths occurred at home (53 percent) and among males (58 percent). The three leading causes of neonatal mortality in our study were: neonatal sepsis (48 percent), birth asphyxia (16 percent) and prematurity related (13 percent). Mortality was observed to be high on the day of birth and most deaths were attributed to birth asphyxia, deaths due to neonatal sepsis was found to be particularly high on the third day of birth, and more common in the hilly region. The majority of neonatal deaths (39 percent) were among disadvantaged ethnic groups (Disadvantaged Janajatis). Thirty eight percent of total deaths were attributed to stillbirths, of which, 73 percent were fresh stillbirth, highlighting a strong need for interventions directed towards intra-partum stillbirths. Findings on survived asphyxiated neonates
The study, in addition to verbal autopsy, tracked babies who had birth asphyxia and received care at home or at a health facility. The result shows the developmental outcomes in babies successfully managed by health workers (including FCHV) trained on resuscitation of asphyxiated newborns.
A total of 72 cases were tracked, among which 68 percent were males. Ninety percent of respondents were mothers and in average, all mothers reported experiencing some form of complications during their last

pregnancy (blurring of vision, convulsions, abnormal delivery etc.). A majority, 92 percent of mothers reported that the baby did not cry at the time of birth and were provided with initial stimulation followed by the use of Dee Lee Suction tube, while only 85 percent of babies were provided with Bag and Mask ventilation. Intervention was carried out ‘immediately’ in 49 percent of the cases, whereas in 17 percent of the cases the health worker initiated the intervention ‘more than 20 minutes’ after birth.
The illness history of the survived baby as responded by the mother revealed that illness is common in survived children. Eighty-one percent of mothers responded that the child became ill at least once in the fi rst month of life, with more than 50 percent of mothers giving a history of either chest in-drawing, fever or cough. More than half of mothers reported hearing either stridor or grunting or wheezing and fl aring of nostrils at the time of illness.
Based on anthropometric measurements and developmental milestones, more than two-thirds (71 percent) were found to be developing normally, one-tenths (11 percent) were delayed development while the remaining (18 percent) needs further assessment to arrive at any conclusive opinion.
Limitations of the study
Every attempt has been made to maintain quality, however, some limitations cannot be discounted. Recall bias of the respondents, missed cases in the community during the study, and misclassifi cation during assignment of causes of death could be some of the limitations of the study.
Conclusions
Causes of neonatal mortality varied widely by district, ecological region, ethnicity, education, health care seeking behavior, and access and availability of health care services. Sepsis and birth asphyxia were the major causes of neonatal death.Half of all deaths (including stillbirths) occur by day 3, suggesting a need for proper coverage of antepartum, intra partum and early postnatal interventions.All mothers of survived asphyxiated newborns reported experiencing some form of complications during their last pregnancy (blurring of vision, convulsions, abnormal delivery etc.)
Recommendations
Contextual exploration of causes of the neonatal deaths and planning of appropriate interventions are crucial to reduce the neonatal deaths in the country, the focus should be on neonatal sepsis, asphyxia and prematurity related conditions.Developing a mechanism to understand the behavior of mothers or service recipients, and ensuring that the health worker provides rapid and appropriate care should be a priority. Percentage of stillbirths is high; therefore, it is necessary to come up with interventions and monitor changes accordingly.
Focus should be on improvement of the quality of perinatal health care.Promotion of institutional delivery along with strengthening of services at the health facility.
Birth preparedness plan as shown by the study is less than satisfactory, considering the programmatic highlights on BPP and the study fi ndings, it has become necessary to further assess the program and to fi nd out what has worked well and what has not. Identifi cation of an appropriate referral center for neonatal care (in case of survived asphyxiated newborns) and provision of neonatal care unit should be prioritized for further reduction in neonatal mortality and morbidity.Care seeking behavior should be promoted and existing links between communities and health facilities should be strengthened in areas with high neonatal mortality and low service utilization. Further assessment and follow-up intervention is required for babies with developmental delay and those needing further assessment. It is impractical and impossible to expect rapid attainment of good quality vital registration system in low-income countries. Even so, countries such as Nepal, should have a long-term goal to have a good Vital Registration data.
1
1A Report on Verbal Autopsy to Ascertain Causes of Neontal Deaths in Nepal
The history of verbal autopsy, to search for probable causes of death dates back to the 17th Century London where enquiries about deaths were made by the so-called death searchers, who visited houses of people who
had died. Later, after the development of modern systems of death registration, 19th Century Europe witnessed the end of this practice. However, later during the 1950s and 1960s, the practice was adopted in Asia (Khanna and Narangwal in India, Companiganj in Bangladesh) and Africa (Keneba in the Gambia). Unlike death searchers, it was physicians trained on this method, were to assess the probable causes of death by using systematic interviews. This new technique was named “verbal autopsy” by workers at the Narangwal project.1
Verbal Autopsy is a method of fi nding out the probable cause of death based on an interview with the next of kin or other caregivers. In many countries, where deaths occur at home, most deaths go unrecorded due to non-existent of a civil registration system and in such cases verbal autopsies have been used to provide information on distribution and trend of causes of death.2, 3 Such information provides policy makers with information that is crucial for public health planning, resource allocation and measurement of impact of intervention.
Over the years, several methods have been introduced to identify the probable cause of deaths in the general population, some of which includes vital registration systems, population-based reporting systems and demographic surveys. Since vital registration systems collect information as events occur and cover the entire population, they are preferred over the other methods for collecting information on events such as death.4
Less than 3 percent of neonatal deaths take place in countries that have high quality vital registration system. For Countries with poor quality Vital Registration System (97 percent) estimation is the only option, results in inherent uncertainty due to the limited quantity and quality of the input data.5 At present, North American, Central America, European and high-income Asia-Pacifi c countries have the highest quality Vital Registration (VR) data while South Asian and east Asian countries are estimated to have lower quality Vital Registration data. There is still no available VR data in many sub-Saharan Africa and Southeast Asian countries.6 However, given the socio economic circumstances of these low-income countries, rapid attainment of good quality vital registration system is not possible and at times may not even be practical for many countries. Countries without a proper VR data should have a long term goal to attain the status of having a good VR data.7
There are various uses of verbal autopsy, some of which are mentioned below:
It provides information on the distribution of causes of death It is used in the evaluation of public health interventions that are aimed at reducing death due to specifi c
causes. It is used to fi nd out factors associated with mortality (cultural, social and behavioral) It is also used in the investigation of infectious disease outbreaks and risk factors for certain diseases.
The verbal autopsy questionnaire ideally consists of 10-100 questions about symptoms, the question is asked to the caretaker of the deceased, which afterward is analyzed to infer the cause of death. There are three approaches to concluding the cause of death. Physician review, the most widely used approach involves a panel of physicians who study the reported symptoms and assign cause of death, the cause of death is reached if two physicians agree on an underlying cause. The result is later summed up to give the Cause Specifi c Mortality Rate (CSMR) estimates. The predefi ned expert algorithm where a decision tree is constructed, provides a systematic means
1

2 A Report on Verbal Autopsy to Ascertain Causes of Neontal Deaths in Nepal
to arrive at a cause of death. An expert algorithm gives a pre-defi ned diagnostic criteria and are based on the symptoms considered essential by the physician for the diagnosis of a particular cause of death. The symptoms however may not be the most discriminating ones. Data derived algorithm on the other hand utilizes standard statistical methods on VA data to come to a conclusion about the CSMR.7-9
Global Mortality Rate
According to the 2012 Lancet report, 52.8 million deaths were recorded globally in 2010. Among these, 24.9 percent are attributed to communicable, maternal, neonatal and nutritional causes. The percentage of deaths have decreased since 1990 when 15.9 million (34.1 percent) out of 46.5 million deaths were attributed to above mentioned causes. Reduction in mortality from diarrheal diseases, lower respiratory infections, neonatal disorders, measles and tetanus largely contributed to this decrement.10
Under-five Mortality
The under-fi ve mortality rate in the population of the developing world paints a grim yet a promising picture. About half of deaths among children under fi ve years, occur in fi ve countries: India, Nigeria, Democratic Republic of the Congo, Pakistan and China.11 The United Nations Inter-agency Group for Child Mortality Estimation (UN IGME) latest estimate indicates that 6.6 million (12.6 million in 1990) children die before they reach their fi fth birthday.4 Compared to the 1990 data, this shows a drop in the mortality rate by 47 percent - from 90 to 48 deaths per 1000 live births in children younger than 5 years. The average annual rate of reduction in under-fi ve mortality has increased from 1.2 percent (1990-1995) to 3.9 percent (2005-2012). Even so, this rate of reduction is still insuffi cient to reach MDG 4 and would require a reduction in under-fi ve mortality rate to rise to 15.6 percent if we are to achieve MDG 4 goal.
Neonatal Mortality
Neonatal death has been defi ned as deaths among live births during the fi rst 28 days of life. This is further subdivided into early neonatal deaths, occurring during the fi rst seven days, and late neonatal deaths, occurring after the seventh day but before 28 completed days of life. 12
Exploration of mortality in the neonatal population shows that neonatal deaths attribute 40% to the overall Under-fi ve mortality each year. Around two-thirds of deaths in this group occur in just 10 countries and India accounts for more than a quarter of deaths. Sub-Saharan Africa, which has the highest rates of child mortality, is among the regions showing the least progress in reduction in neonatal mortality rate. A multidisciplinary approach is required to understand the complex relation between causes of death and social, behavioral, biological, economical and environmental factors. 4 11, 13, 14 15
1.1 Background
Globally, the main causes of neonatal death are preterm birth (28 percent), severe infection (26 percent), asphyxia (23 percent), and neonatal tetanus.5, 16, 17 In the South East Asia Region, according to WHO, 30 percent of neonatal deaths are attributed to preterm birth, 27 percent to sepsis or pneumonia, 23 percent to birth asphyxia, 6 percent to congenital abnormalities, 4 percent to tetanus, 3 percent to diarrhea and 7 percent to other causes. 16
Country Context
Over the past 20 years from 1990 to 2011, Nepal’s child mortality rate has decreased at a considerable rate. The infant mortality rate (IMR) has decreased from 108 to 46 deaths per thousand live births and the under-fi ve mortality (U5MR) rate from 162 to 54 deaths per thousand live births, with rates of reduction of 57.4 and 66.6 percent respectively. Even so, one in 22 children die before their fi rst birthday and one in 19 die before their fi fth birthday. Nepal is currently on track to achieve the Millennium Development Goal (MDG) on child health, but this progress has been hindered due to the sluggish decline in the infant mortality rate (IMR) which impacts the neonatal mortality rate (NMR). The IMR dropped considerably between 1990 and 2006 but it did not decline at the

3A Report on Verbal Autopsy to Ascertain Causes of Neontal Deaths in Nepal
same rate between 2006 and 2011.18, 19 At the current rate, it is very diffi cult to reach the target for IMR by 2015, the Nepal Health Sector Program-II (NHSP-II) has lowered the target to 32 so that the fi rst indicator of the MDG 4 can be attainable.
The Nepal Demographic Health Survey 2011 (NDHS) shows variations in mortality between various ecological and developmental regions. IMR and U5MR are highest in the mountains (73 and 87 deaths per thousand live births) and lowest in the hills (50 and 58 deaths per thousand live births). The mid-western and far-western development regions show the highest IMR and U5MR. Despite of various challenges, such as unavailable and inaccessible health services, understaffi ng and lack of trained human resources, program such as immunization, CB-IMCI, vitamin A supplementation, and CB-NCP has contributed signifi cantly to decrease child mortality. 20
However, due to the absence of VR, information about the causes of neonatal death is limited in Nepal. Based on newborn Verbal autopsy fi ndings of NDHS 2006, major causes of deaths were found to be associated with infections (39 percent), birth asphyxia/ birth injury (33 percent), congenital anomalies (8 percent), pre-maturity or low birth weight (6 percent), and other causes (13 percent).18 Drawing on global, regional and national evidence, the Government of Nepal initiated a series of policies and programs to address neonatal mortality in Nepal. These programs were delivered through the governmental health system, its hospitals and peripheral health facilities as well as through the workforce of 48,000 female community health volunteers.
A pilot program was developed on the base of CB-IMCI with new set of interventions with the aim to improve the health and survival of newborn babies. The package was designed refl ecting evolving evidence and experience, globally, regionally and in the context of Nepal. Behavior Change Communication (BCC), promotion of institutional delivery and clean delivery practices in case of home delivery, postnatal care, community case management of pneumonia/possible serious bacterial infection, care of low birth weight newborns, prevention and management of hypothermia, recognition of asphyxia and initial stimulation and resuscitation of newborn baby are the key interventions of the program.21-24 The program was initiated in 2008 and is currently ongoing in 39 districts (Dec 2013). The program has a system to report neonatal deaths at the community level by FCHVs and at health facilities by Health Workers using specifi c CB-NCP forms. This process has facilitated in building a systematic registration system, which has subsequently assisted in identifying the major causes of deaths.
However, recent information on causes of neonatal deaths are not available as verbal autopsy was not a part of the 2011 NDHS and other information available are from a limited geographic area and research sites. The study, therefore, is an-add up to the existing database of verbal autopsies conducted and at a level large enough to be generalizable in the context of the country. The study, in addition, tries to explore the social, behavioral and health systems contributors to neonatal death by conducting social autopsy. Social autopsy is often combined with verbal autopsy interviews and it consists of questions on modifi able social, cultural, and health system factors that contribute to deaths investigated by verbal autopsy.25
The results of the study will help guide program planners and policymakers to identify and prioritize the prime cause of death and infer the role of the various neonatal intervention programs implemented.
1.2 Objectives of the Study
To carry out neonatal verbal autopsy to ascertain causes of neonatal deaths in selected CB-NCP implemented districts.
To assess the outcome of asphyxia cases managed in the study district. To recognize delays in identifi cation of illness and care seeking at the time of illness of neonates.

2
4 A Report on Verbal Autopsy to Ascertain Causes of Neontal Deaths in Nepal
2.1 Study Sites
The study was carried out in Six CB-NCP implemented districts of Nepal. The surveyed districts included Dolpa and Jumla (mountain region); Palpa and Salyan (hilly region); Chitwan and Morang (Terai region). The district profi le is provided below in Table 1.
Table 1: District Profi leDistrict Population No. of VDC Total no. of health
institutions2
Population per health institution1
Expected Pregnancy
FY 69/70
Expected Live Birth
69/703
Dolpa 36700 23 24 1252 1003 842Jumla 108921 30 31 3030 2970 2583Palpa 261180 65 70 4060 6820 7938Salyan 242444 47 48 4520 6738 6344Chitwan 579984 36 41 11565 17648 15924Morang 965370 65 68 12680 28843 27327
1,2 District profi le, Central Bureau of Statistics, http://cbs.gov.np/?page_id=12993 DHO data from respective districts
2.2 Study Design, Study Population and Sample Size
The study, descriptive in nature was conducted over a period of three months from September-December, 2013. The study population consisted of all neonatal deaths and stillbirths recorded in Six CB-NCP implemented districts during FY 2069/70. District selection was purposive; those districts were selected that were implementing CB-NCP program for at least a year. To ensure external validity, two districts each were selected from the Mountain, Hilly and the Terai regions.
As per CB-NCP recording form, the total neonatal deaths and stillbirths recorded in the proposed districts during FY 2068/69 were 397. Due to the lack of exact recording of neonatal deaths of the FY 2069/70, the numbers obtained from the DHO/DPHO of the respective district were tallied with the data from the health facility. In case of any miss-match, the case was explored to confi rm. Similarly, assuming there be unreported cases, the study also explored to trace and identify the un-reported cases. Various sources such as FCHV, community health workers, mothers group members (MGM), informal leaders, school teachers and local leaders were asked if they knew about any other neonatal deaths within their community. Enumerators then matched the unreported deaths with the record available at the respective health facility, if found unrecorded they visited the household and carried out interviews, the case was then reported to the health facility for update and recording of the case. A total of 551 deaths were recorded during the period of the study.
2.3 Study Tools
Before commencing the study, a two day (7-8th August, 2013) planning workshop was organized in consultation with representatives from the Ministry of Health and Population (MOHP), Family Health Division (FHD), Child
2
5A Report on Verbal Autopsy to Ascertain Causes of Neontal Deaths in Nepal
Health Division (CHD), HMIS Section, USAID, H4L and SNL/Save the Children. The inputs helped the team to design sets of questionnaires, which were fi nalized after thorough discussion and pre-testing.
The study consisted of two sets of questionnaires, fi rst, a verbal autopsy questionnaire to ascertain the causes of neonatal deaths in afore mentioned CB-NCP districts, and included both an open-ended narrative and closed ended questions. It was developed using the standard verbal autopsy method developed by the WHO.2 Second, consisted of questions for case studies to review asphyxia managed cases. The questionnaire in addition, contained questions on socio-demography, utilization of services, the three delays during the illness of neonates and questions to assess the developmental milestones of the baby.
2.4 Data Collection, Processing and Analysis
For data collection, fi eld enumerators with a minimum bachelor level education in health fi eld were recruited. Preference was given to those who had prior training and work experience in CB-NCP, and it was ensured that at least one of the fi eld enumerators recruited in the district be CB-NCP trained. For data collection in Dolpa, considering its geography, those with prior experience in the district were recruited. The enumerators underwent four days training followed by a fi eld trip to Kavre for pre-testing of the tools. During training they were familiarized with the aim and objectives of the study, ethics, methodology, tools, data collection procedures, components of CB-NCP, assessment of developmental milestones etc. All the team members were present throughout and pediatricians conducted orientation on components: assessment of developmental milestones, newborn care and illness. Role-playing was done on the third day and pre-testing of the tools was carried out in Kavre on the fourth day. The feedbacks received from participants after pre-testing helped further to make appropriate changes in the tools.
During data collection, to ensure there is no language barrier, assistance from local community health workers was solicited. The fi eld coordinator cross-checked at least 10 percent of the cases for accuracy, completeness and consistency in the data. The completed questionnaires were thoroughly examined to ensure that all components were duly fi lled. In case of confusion, doubts were cleared with the person in charge of data collection. The completed questionnaire after coding were sent to the two consultant pediatricians who validated the Cause of Death (COD), in case of confl ict, the case was resolved through discussions, if not, the third pediatrician validated the COD.
The data was entered using Epi-data software version 3.1. Prior to data analysis, data cleaning was done to ensure that the responses were within the specifi ed range, the data was then transferred to SPSS version 20 for analysis.
2.5 Quality Assurance
To collect reliable data, it is imperative to have a proper quality assurance system, and the study has attempted to ensure that all necessary procedures have been followed. For e.g., use of validated and standard study protocol and tools, proper training of fi eld enumerators, safety precautions, fi eld coordinators to check the correctness of data collection, monitoring and evaluation from the central level including visits to the study sites, use of appropriate software for data entry and analysis. In addition, regular support and feedbacks were received from the Oversight team members. Similarly, to ensure adequacy of procedures in the study sites representatives from CHD, USAID and IRHDTC conducted combined supervisory fi eld visits.
2.6 Ethical Approval
Key Helsinki principles were followed in the conduct of this study, all participants (caretaker/next of kin) were informed in detail about the study. Due to the nature of the study, a written consent was obtained from participants and only those who agreed to take part in the study and complied with a written consent were enrolled. Utmost care has been taken to ensure the confi dentiality of respondents. Ethical approval was obtained from the Nepal Health Research Council (NHRC) before undertaking the study.

3
6 A Report on Verbal Autopsy to Ascertain Causes of Neontal Deaths in Nepal
This section provides the socio-demographic characteristics of the population studied. Socio demographic characteristics: current age of mothers, literacy status, level of education, caste and ethnicity, religion, and
awareness about essential new born care messages are presented below.
3.1 Respondents
Information was collected from mothers/ care-takers/ next of kin, where available; preference was given to the mother or to the person who was with the baby during the entire period of illness (i.e. from start of illness till death). The respondents were mothers (423), relatives (81), non-relatives (26), and father (21).
3.2 Mothers Age
Age distribution of mothers, shown on table 2 depicts more than one thirds (40 percent) of the mothers were between 20-24 years of age. About one in fi ve mothers were between 15-19, and about one in 14 were above 35 years of age.
3.3 Mothers Education
Approximately 44 percent of mothers were able to read a complete sentence, 18 percent of mothers were able to read only part of a sentence while 38 percent of mothers were not able to read. Comparing their literacy status, 35 percent of mothers had never been to school and among those mothers who had attended school, one in four mothers had education less than grade 5 and two out of three mothers had an education of more than grade 6.
3.4 Caste/ Ethnicity/ Religion
More than a third (37.4 percent) belonged to Disadvantaged Janajatis followed by Upper Castes (34 percent), Dalits (16 percent), Disadvantaged Non Dalit Terai Castes (6 percent), Relatively Advantaged Janajatis (4 percent) and Religious Minorities (2.2 percent). An overwhelming percentage of mothers (90 percent) followed Hinduism, one of the main religion of Nepal, followed by Buddhism (3.6 percent).
3

7A Report on Verbal Autopsy to Ascertain Causes of Neontal Deaths in Nepal
Table 2: Characteristics of mothersMothers’ age distribution (n=551) Frequency Percent15 -19 111 20.120-24 218 39.625-34 182 33>35 40 7.3Total 551 100Mother’s literacy status(n=423)Not able to read 160 37.8Able to read part of a sentence 75 17.7Able to read whole sentence 188 44.4Total 423 100Mothers’ education (n=423)Never been to school 149 35.2Ever been to school 274 64.8
≤5 class 77 28.1 > 6 class 197 71.9
Mothers’ Caste/Ethnicity (n=551)Dalits (1) 90 16.3Disadvantaged Janajatis (2) 206 37.4Disadvantaged non Dalit Terai castes 33 6Religious minorities (4) 12 2.2Relatively advantaged Janajatis (5) 22 4Upper Castes (6) 188 34.1Total 551 100Mothers’ religion (n=551)Hindu 496 90Buddhist 20 3.6Muslim 13 2.4Kirat 1 0.2Christian 20 3.6Others 1 0.2Total 551 100
3.5 Presence of Respondents
Table 3 shows the presence of respondents during the period of illness of their newborn. Among total live births (N=342), More than two thirds (84 percent) of the respondents said that they were present the entire duration; from illness till death, compared to 8.2 percent and 3.8 percent of respondents who were present during the initial and last stages of illness.
Table 3: Presence of respondent (N=342)Frequency Percent
Initial stage of illness 28 8.2Illness to death 287 83.9At the last stage 13 3.8Not present 14 4.1
3.6 Awareness of Essential Newborn Care (ENC) Messages
The respondents were asked if they were aware about essential newborn care messages. Almost two-third of the respondents (66 percent) said that they are aware about the messages, and relatively a large percentage of

8 A Report on Verbal Autopsy to Ascertain Causes of Neontal Deaths in Nepal
respondents were able to recite key messages; such as wipe with dry cloth (51 percent), immediate breastfeeding (50 percent) and delay bathing (49 percent). When asked about the source of information, 51 percent of the respondents said that they got the information through FCHV, with doctors accounting for only 6 percent.
Table 4: Awareness of ENC messagesRespondents aware about Essential Newborn Care Messages Frequency PercentYes 362 65.7No 189 34.3Total 551 100Key messages (N=362)Wipe with dry cloth 279 50.6Dry clean cord 204 37Immediate breast feeding 275 49.9Skin to skin contact 143 26Delay bathing 270 49Any Four 42 11.6All 100 27.6Source of information*Doctor 32 5.8Nurse/ANM 147 26.7HA 27 4.9AHW 0 0FCHV 280 50.8Radio 29 5.3TV 10 1.8Local FM 4 0.7Magazines 10 1.8
*multiple responses
4
9A Report on Verbal Autopsy to Ascertain Causes of Neontal Deaths in Nepal
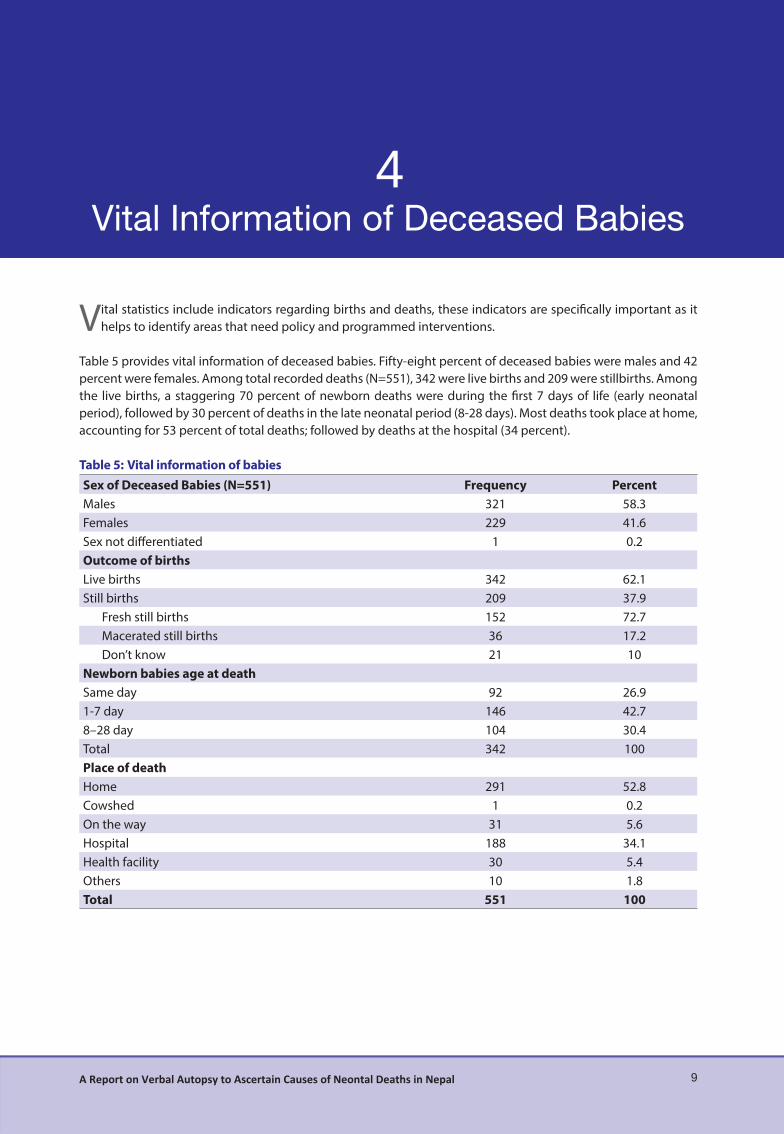
Vital statistics include indicators regarding births and deaths, these indicators are specifi cally important as it helps to identify areas that need policy and programmed interventions.
Table 5 provides vital information of deceased babies. Fifty-eight percent of deceased babies were males and 42 percent were females. Among total recorded deaths (N=551), 342 were live births and 209 were stillbirths. Among the live births, a staggering 70 percent of newborn deaths were during the fi rst 7 days of life (early neonatal period), followed by 30 percent of deaths in the late neonatal period (8-28 days). Most deaths took place at home, accounting for 53 percent of total deaths; followed by deaths at the hospital (34 percent).
Table 5: Vital information of babiesSex of Deceased Babies (N=551) Frequency PercentMales 321 58.3Females 229 41.6Sex not diff erentiated 1 0.2Outcome of birthsLive births 342 62.1Still births 209 37.9
Fresh still births 152 72.7Macerated still births 36 17.2Don’t know 21 10
Newborn babies age at deathSame day 92 26.91-7 day 146 42.78–28 day 104 30.4Total 342 100Place of deathHome 291 52.8Cowshed 1 0.2On the way 31 5.6Hospital 188 34.1Health facility 30 5.4Others 10 1.8Total 551 100
4

5
10 A Report on Verbal Autopsy to Ascertain Causes of Neontal Deaths in Nepal
5
Antenatal care refers to caring of women during pregnancy, which ideally should begin soon after conception and continue throughout pregnancy. The primary aim of antenatal care is to achieve at the end of the
pregnancy, a healthy mother and a healthy baby. In this regard, the National Safe Motherhood Program has set out to reduce maternal and neonatal mortalities by addressing factors related to morbidity and mortality caused by complications of pregnancy and childbirth. It does so by creating an environment where a woman is able to make decisions regarding pregnancy, receive care for prevention and treatment of pregnancy complications, and ensure that she has access to skilled birth attendance including emergency obstetric care and postnatal care.
This section presents the level of knowledge and practices about ANC, including types of services received by mothers during their last pregnancy.
5.1 Utilization of Services During ANC
Table 6 shows utilization of services by mothers. Ninety percent of the mothers said that they had received ANC services during their last pregnancy. As per WHO, a pregnant woman is recommended to have at least four ANC visits. The fi ndings shown in table 6 depicts that more than 50 percent of pregnant women made four or more antenatal care visits with 10 percent of mothers making no visits at all. More than two-third (87 percent) of pregnant women reported receiving antenatal care from a skilled provider (a doctor, or a nurse), in addition, 39 percent pregnant women received antenatal care from trained health workers such as a health assistant or auxiliary health worker (AHW), maternal and child health worker (MCHW), or a village health worker (VHW). Thirty-one percent of pregnant women received antenatal care from a female community health volunteer (FCHV).
Overall, health posts, sub-health posts and private health facilities were the three major sources of ANC services among pregnant women. Similarly, the result also show that among mothers who sought ANC services, 95 percent had their weight taken, 94 percent had their blood pressure measured, 52 percent had their urine tested and only 38 percent had their blood tested.

11A Report on Verbal Autopsy to Ascertain Causes of Neontal Deaths in Nepal
Table 6: Utilization of ANC services by mothersStatus of ANC services received Frequency PercentYes 496 90.0No 55 10.0Total 551 100.0No of ANC visitNo ANC 55 10.0< 4 ANC 219 39.74 or more ANC 277 50.3Total 551 100Antenatal care provider*Doctor 102 20.6Nurse 331 66.7HA/AHW 63 12.7Promoted AHW/ANM (the then MCHW/VHW) 129 26.0FCHV 156 31.5Others 4 0.8Place from where ANC services was received*Home 10 2.0Hospital 76 15.3PHCC 55 11.1Health posts 206 41.5Sub health posts 147 29.6Outreach clinics 57 11.5Private health facility 83 16.7Others 9 1.8Components of antenatal care*Weight taken 471 95.0Blood pressure measured 467 94.2Urine test 259 52.2Blood test 190 38.3All 4 test done 178 35.9
*Based on multiple responses
5.2 TT Vaccination During Pregnancy
Neonatal tetanus is now comparatively rare in developed countries, but in developing countries where large number of deliveries takes place at home or other locations where hygiene is poorly maintained, it has resulted in large number of deaths. Tetanus Toxoid (TT) vaccine is given during pregnancy to prevent deaths in infants due to neonatal tetanus, for full protection, pregnant women should receive at least two doses of TT vaccine during each delivery. If a woman has been vaccinated during previous pregnancy or during maternal and neonatal tetanus campaigns, she may require only one dose for the current pregnancy. Five doses are considered to provide lifetime protection (NDHS, 2011).
Table 7 presents the percentage of pregnant women receiving TT vaccine during their last pregnancy. More than half of the mothers received two or more tetanus vaccine, 35 percent of mothers received one tetanus vaccine, while one out of 20 mothers reported that they did not receive any tetanus vaccine during their last pregnancy.
Table 7: TT Vaccination during PregnancyFrequency Percent
1 175 31.762 263 47.733 8 1.45Don’t know 80 14.51Not taken 25 4.5Total 551 100

12 A Report on Verbal Autopsy to Ascertain Causes of Neontal Deaths in Nepal
5.3 Consumption of Deworming Tablets During Pregnancy
Deworming of pregnant women after completion of the fi rst trimester along with supplementation of iron tablets from the second trimester to 45 days following delivery are some of the key interventions to address anemia in women. Table 8 presents the frequency and percentage of women who have consumed deworming tablets in their last pregnancy, as shown, 87 percent of mothers consumed deworming tablets during their last pregnancy.
Table 8: Consumption of deworming tabletsFrequency Percent
Yes 430 86.7No 36 7.3Don't know 30 6.0Total 496 100.0
5.4 FCHV Services
As envisaged by the Government of Nepal, FCHV plays a major role in the promotion of safe motherhood, child and neonatal health, family planning, and other community based services to promote health and healthy behavior of mothers and the community. There remains the fact that a large number of mothers still have not been able to come in contact with FCHV, a large percentage of mothers are left out of services that could and may help to improve their current health status. This study collected information about mothers who came in contact with FCHV during pregnancy. As shown in Table 9, a majority of mothers (73 percent) had discussed their pregnancy with an FCHV. More than 80 percent of mothers reported receiving advice on four ANC visits (87 percent), consumption of iron tablets (95 percent), consumption of deworming tablets (85 percent), and TT vaccination (81 percent). Ninety fi ve percent reported that FCHV had provided information on the place/person to go to in order to obtain ANC services. When mothers were asked about particular information provided by FCHV on the presence of a health worker in case of delivery at home, a staggering 95 percent responded with a “yes”.
Table 9: FCHV ServicesDiscussed with FCHV regarding present pregnancy Frequency PercentYes 404 73.3No 147 26.7Total 551 100.0Pregnancy related advise given by FCHV (N=551)Advised Four ANC 353 87.4Intake of Iron 384 95.0Intake of Deworming 343 84.9TT vaccination 327 80.9Nutritious food 204 50.5Delivery services from SBA 154 38.1Others 12 3.0Any fi ve response 69 17.1FCHV provided information about the place for ANC visitYes 386 95.5No 18 4.5Total 404 100Information regarding the presence of HWs in case of delivery at homeYes 386 95.5No 18 4.5Total 404 100

13A Report on Verbal Autopsy to Ascertain Causes of Neontal Deaths in Nepal
5.5 Birth Preparedness
The Ministry of Health and Population (MOHP) implemented the birth preparedness package to prevent unnecessary delays to delivery care. According to the guidelines, it is recommended that families save money for emergencies, arrange transportation beforehand, identify persons who can and are eligible to donate blood if required, identify and contact health facilities and health workers who can provide services, and have a clean delivery kit handy. It outlines steps mothers should take to prepare for birth to avoid delays in accessing delivery services, one of the key components of the three delay model. Table 10 shows that more than half (63 percent) of the mothers interviewed reported that they had saved money for delivery. Mothers making arrangements for CDK, skilled birth attendant and a blood donor were found to be comparatively less. Only 3 percent of mothers had prepared for any fi ve of the components.
Table 10: Birth preparednessBirth Preparedness Frequency PercentFinancial preparations for delivery 345 62.6Identifi ed emergency transportation option 157 28.5Arranged for a blood donor 34 6.2Identifi ed skilled/trained birth attendant 53 9.6Arranged for a CDK 41 7.4Arranged for food 177 32.1Arranged for clothes 223 40.5Other 10 1.8Any fi ve 17 3.1Any Six 11 2.0Did not prepare at all 65 11.8
5.6 Complications during third trimester of pregnancy
Mothers were also asked whether they experienced complications (high blood pressure, antepartum hemorrhage, blurring of vision, convulsions, or abnormal delivery) during their third trimester of pregnancy. Twenty-eight percent respondents said that they had blurring of vision, another 17 percent reported convulsions during third trimester of pregnancy.
Table 11: Complications during third trimester of pregnancyComplications during third trimester Frequency PercentHigh blood pressure 26 4.7Antepartum hemorrhage 54 9.8Blurring of vision 156 28.3Convulsions 92 16.7Abnormal delivery 51 9.3Other complications 52 9.4
*Multiple responses

6
14 A Report on Verbal Autopsy to Ascertain Causes of Neontal Deaths in Nepal
6
6.2 Time of Neonatal Deaths
Global mortality indicators show that most newborn deaths occur between 0-6 days (early neonatal period). The results obtained from this study as shown in fi gure 2 is consistent with global mortality data and shows a similar pattern. Among the causes of deaths, birth asphyxia was found to be the most frequent in neonates dying on the day of birth, similarly, neonatal sepsis was the frequent cause of deaths in neonates more than 3 days old.
Neonatal Sepsis, 47.7
Birth Asphyxia, 16.4
Prematurity Related, 13.2
LBW Related, 5
Others, 17.8
Figure 1: Causes of deaths
Verbal Autopsy for neonatal deaths was conducted over a period of three months from September-December, 2013. A total of 551 deaths were recorded during the period of study, information on the deceased child
was obtained through the health facilities (55 percent) of the study district, remaining deaths were identifi ed through FCHV (34 percent) and 10 percent were traced using diff erent sources such as community health workers, mothers group members (MGM), informal leaders, school teachers and local leaders. More than two-thirds of the respondents (77 Percent) were mothers followed by relatives (15 percent) and the remaining fathers (4 percent) or other non-relatives (4 percent).
6.1 Causes of Deaths
As shown in fi gure 1 the greatest proportion of deaths in neonates was due to neonatal sepsis (47.7 percent), birth asphyxia (16.4 percent), prematurity related (13.2 percent), low birth weight related (5 percent) and others (17.8 percent). The other category includes causes such as congenital anomaly (2 percent), hypothermia (1.2 percent), birth injury (0.6 percent), meconium aspiration syndrome (1.5 percent), respiratory distress syndrome (1.8 percent), severe jaundice (0.3 percent), others (3.5 percent), and unclassifi able causes (7 percent).

15A Report on Verbal Autopsy to Ascertain Causes of Neontal Deaths in Nepal
Figure 2: Distribution of reported neonatal deaths by age in days
6.3 Distribution of Causes of Deaths by Selected Variables
SexTable 12 shows the distribution of causes of death (live births) among males and females. The study shows a higher (12.3) percentage of death among males, deaths due to neonatal sepsis and birth asphyxia were much more common among males than females. Table 12: Distribution of deaths (N=342)
Ecological regionNeonatal
SepsisBirth
AsphyxiaPrematurity
relatedLBW
relatedOthers Total
Mountain 22(44.9) 12(24.5) 8(16.3) 1(2.0) 6(12.2) 49 (14.3)Hill 53(52.5) 14(13.9) 9(8.9) 6(5.9) 19(18.8) 101 (29.5)Terai 88(45.8) 30(15.6) 28(14.6) 10(5.2) 36(18.8) 192 (56.1)EthnicityDalits 26(51.0) 9(17.6) 6(11.8) 3(5.9) 7(13.7) 51(14.9)Disadvantaged Janajatis 63(47.4) 20(15.0) 18(13.5) 7(5.3) 25(18.8) 133 (38.8)Disadvantaged non Dalits Terai
5(23.8) 6(28.6) 4(19.0) 0 6(28.6) 21 (6.14)
Religious Minorities 5(55.6) 3(33.3) 0 0 1(11.1) 9 (2.63)Relatively Advantaged Janajatis
7(53.8) 1(7.7) 0 0 5(38.5) 13 (3.8)
Upper castes 57(49.6) 17(14.8) 17(14.8) 7(6.1) 17(14.8) 115 (4.3)Age at deathSame day 5(5.4) 35(38.0) 23(25.0) 5(5.4) 24(26.1) 92 (26.9)1-7 days 76(52.1) 19(13.0) 13(8.9) 10(6.8) 28(19.2) 146 (42.6)8-28 days 82(78.8) 2(1.9) 9(8.7) 2(1.9) 9(8.7 104 (30.4)SexMales 97(50.5) 33(17.2) 23(12.0) 8(4.2) 31(16.1) 192 (56.1)Females 66(44.0) 23(15.3) 22(14.7) 9(6.0) 30(20.0 150 (43.8)ANC visit by mothersNo ANC 21(63.6) 2(6.1) 5(15.2) 1(3.0) 4(12.1) 33 (9.6)<4 ANC 63(46.3) 16(11.8) 25(18.4) 6(4.4) 26(19.1) 136 (39.7)4 or more ANC 79(45.7) 38(22.0) 15(8.7) 10(5.8) 31(17.9) 173 (50.5)Place of deliveryHome 78(49.1) 23(14.5) 22(13.8) 3(1.9) 33(20.8) 159 (46.4)Health facility 82(46.9) 32(18.3) 23(13.1) 12(6.9) 26(14.9) 175 (51.1)Others 3(37.5) 1(12.5) 0 2(25.0) 2(25.0) 8 (2.3)
*Percentage in Parentheses
Num
ber o
f Dea
ths
Age at death in days0 1 2 3 4 5 6 7 8 9 10 11 12 13 14 15 16 17 18 19 20 22 23 24 25 26 27 28
35
30
25
20
15
10
5
0
Neonatal Sepsis Birth Asphyxia Prematurity related LBW related Others

16 A Report on Verbal Autopsy to Ascertain Causes of Neontal Deaths in Nepal
Ecological RegionsThe mortality pattern by ecological regions shows that a majority of deaths due to neonatal sepsis was higher in the hilly regions (52 percent), similarly birth asphyxia, the second most common cause of death was higher in the mountain regions with 12 deaths (24.5 percent) out of 45.
Ethnicity Distribution of causes of deaths by ethnicity shows a interesting pattern. A large number of deaths to neonatal sepsis were recorded among Disadvantaged Janajatis (Magars, Tamangs, Rais, Limbus, Tharus, Rajbansis etc) followed by upper castes (Brahmans, Chhetris, Thakuris etc). Overall, Disadvantaged Janajatis were found to have a large percentage of deaths with neonatal sepsis, birth asphyxia and prematurity related deaths as the most common causes of deaths.
Places of Delivery
Neonatal deaths due to neonatal sepsis and birth asphyxia were slightly higher in deliveries at health facilities.
7
17A Report on Verbal Autopsy to Ascertain Causes of Neontal Deaths in Nepal
7
Childbirth is one of the most crucial periods in a women’s life, series of changes take place in the women’s body that results in the expulsion of a viable product of conception. Although childbirth is a normal physiological
process, complications may arise during pregnancy, delivery and postnatal period. Evidence shows that obstetric emergencies are associated with three key delays: (i) delay in seeking care, (ii) delay in reaching care, and (iii) delay in receiving care. Hence, it is an absolute necessary to take every child-birth seriously; negligence in any part of the process can lead to serious consequences on both mothers and baby’s health.
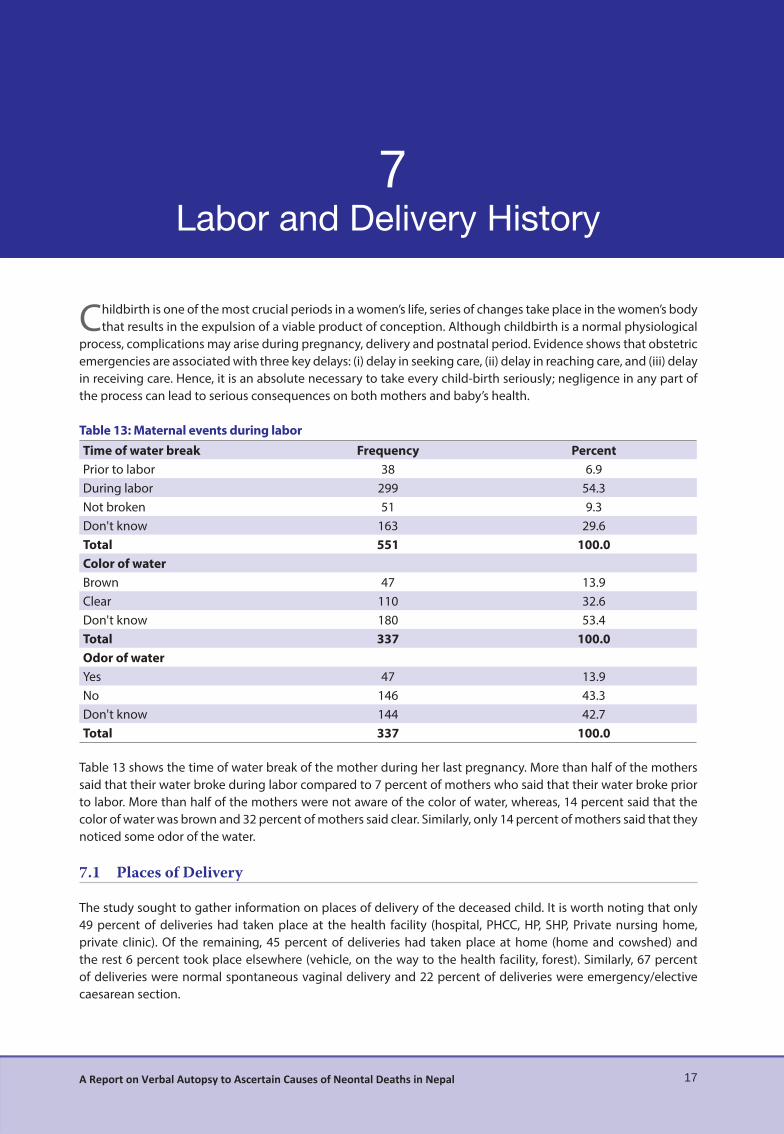
Table 13: Maternal events during laborTime of water break Frequency PercentPrior to labor 38 6.9During labor 299 54.3Not broken 51 9.3Don't know 163 29.6Total 551 100.0Color of waterBrown 47 13.9Clear 110 32.6Don't know 180 53.4Total 337 100.0Odor of waterYes 47 13.9No 146 43.3Don't know 144 42.7Total 337 100.0
Table 13 shows the time of water break of the mother during her last pregnancy. More than half of the mothers said that their water broke during labor compared to 7 percent of mothers who said that their water broke prior to labor. More than half of the mothers were not aware of the color of water, whereas, 14 percent said that the color of water was brown and 32 percent of mothers said clear. Similarly, only 14 percent of mothers said that they noticed some odor of the water.
7.1 Places of Delivery
The study sought to gather information on places of delivery of the deceased child. It is worth noting that only 49 percent of deliveries had taken place at the health facility (hospital, PHCC, HP, SHP, Private nursing home, private clinic). Of the remaining, 45 percent of deliveries had taken place at home (home and cowshed) and the rest 6 percent took place elsewhere (vehicle, on the way to the health facility, forest). Similarly, 67 percent of deliveries were normal spontaneous vaginal delivery and 22 percent of deliveries were emergency/elective caesarean section.

18 A Report on Verbal Autopsy to Ascertain Causes of Neontal Deaths in Nepal
Table 14: DeliveriesPlaces of delivery Frequency PercentHome 246 44.6Health Institution 273 49.5Others 32 5.8Total 551 100Mode of delivery Frequency PercentNormal 182 66.7Forceps 3 1.1Vacuum 5 1.8CS 60 22.0Breech 8 2.9Others 4 1.5Don't know 11 4.0Total 273 100.0
7.2 Seeking Care
Table 15 shows care seeking behavior of pregnant mothers during their last pregnancy. The fi rst component of the three-delay model shows the duration of time after which they initiated to seek care from the health facility. The mothers were asked how long after initiation of labor did they actually decide to go to the health facility. Forty three percent of mothers said that they went to the health facility 1-3 hours after the start of labor. Similarly, 22 percent of the mothers went to the health facility less than 1 hour after the start of labor and 35.5 percent of mother after 4 hours of start of labor.
Table 15: Seeking CareService received at HF Frequency Percent< 1 hour 49 21.81-3 hours 96 42.74-6 hours 36 16.07-9 hours 10 4.410-12 hours 18 8.013-24 hours 7 3.1> a day 9 4.0Total 225 100.0
7.3 Reaching Care
The mode of transport varied widely by districts. Those mothers who went for delivery at the health facility and those who delivered at a place other than their own home, one out of fi ve mothers said that they went on foot, 14 percent said that they went by taxi and 55 percent said that they took other modes of transportation (ambulance, bus etc.). A quarter (33 percent) of mothers said that the distance between their home and the health facility was more than 20 kilometers and only 16 percent of mothers said that the distance was less than 5 kilometers. Factors such as topography, connection with motor-able roads and availability of transportation facilities, all play a role in accessibility and in reaching the health facility. More than half of the mothers (57 percent) mentioned that it took them 1-5 hours to reach the health facility/provider and one out of three mothers said that it took them less than an hour.

19A Report on Verbal Autopsy to Ascertain Causes of Neontal Deaths in Nepal
Table 16: Reaching careModes of transportation Frequency PercentWalking 58 19.0Taxi 42 13.8Motorcycle 12 3.9Ekka or cart 8 2.6Rickshaw 8 2.6Horse/Donkey 4 1.3Cycle 4 1.3Others 169 55.4Total 305 100Distance of HF from home Frequency Percent
5 kilometers 46 16.86-10 kilometers 17 6.211-15 kilometers 16 5.916-20 kilometers 21 7.7>20 kilometers 91 33.3Don't know 82 30.0Total 273 100.0Time taken to reach health facility< 1 hour 97 35.51-5 hours 156 57.15-10 hours 8 2.9> 10 hours 8 2.9Don't know 4 1.5
7.4 Receiving Care
The mothers were asked about the time it took to receive care after reaching the health facility. A staggering 91 percent of the mothers responded that they received care within half an hour of reaching the health facility, one out of 11 mothers responded that it took them more than 30 minutes to receive care.
Table 17: Receiving careReceiving care Frequency PercentageWithin half an hour 248 90.8Half an hour to one hour 11 4.0More than one hour 6 2.2Don't know 8 2.9Total 273 100.0

8
20 A Report on Verbal Autopsy to Ascertain Causes of Neontal Deaths in Nepal
8
The fi rst week of life is the most challenging in the life of a newborn. This is because the newborn has to adopt itself to a new environment; this poses grave risks as the newborn is exposed to all kinds of pathogens and
environmental conditions for the fi rst time. The problem is more serious in rural areas where most of the deliveries take place at home. This section explores the condition of postnatal care along with practice of essential newborn care in the study districts.
8.1 Assistance During Delivery
Obstetric care during delivery by a skilled health worker is considered critical for the reduction of maternal and neonatal mortality. Table 17, shows delivery assistance at home by types of providers, one in two (47 percent) births took place with assistance from relatives. Skilled Birth Attendants (SBA) accounted a negligible percent (3.0 percent) of total delivery, similarly, 13 percent of mothers conducted delivery on their own without assistance. Table 18: Assistance during deliveryAssistance during delivery Frequency PercentSBA 8 3.0HA/AHW 7 2.6VHW 10 3.8Relatives 124 46.8FCHV 36 13.6Self 36 13.6Others* 44 16.6Total 265 100.0
*Sudeni, traditional birth attendants etc.
8.2 Reasons for Home Delivery
As mentioned above, Forty fi ve percent of deliveries are carried out at home in the study districts. Reasons were ascertained from mothers who had delivered at home as to why they had not used the health facility for their last delivery. Thirty eight percent of the respondents said that the baby was born while preparing to visit the health facility. Another 32 percent said that they gave birth to the baby on the way to the health facility. About 14 percent of mothers are reluctant to visit the HF for delivery.

21A Report on Verbal Autopsy to Ascertain Causes of Neontal Deaths in Nepal
Table 19: Reasons for home deliveryReasons for home delivery Frequency PercentageHead of the house did not permit 10 3.8The baby was born while preparing to visit HF 101 38.1Financial reasons 14 5.3Reluctant to visit HF 36 13.6On the way 15 5.7Other* 84 31.7Missing Data 5 1.9Total 265 100.0
*Cultural barriers, Shyness, round the clock availability of Sudeni, unavailability of care taker to accompany them to the HF, HF located
at far distance, transportation, unavailability of HWs at the HF
8.3 Delivery Practices
Table 19 shows the percentage of home deliveries attended by FCHV as mentioned by respondents. Despite major emphasis given to the presence of FCHV in home delivery, the percentage of deliveries attended is low, as only 20 percent of home deliveries were attended by FCHV. Similarly, the percentage of birth attendants washing hands before assisting with delivery was found to be 60 percent and the use of CDK in home delivery was 24 percent. Thirty percent of respondents were not aware that birth attendants washed their hands before delivery and 11 percent of the respondents were not aware that birth attendants used CDK for delivery. Among those birth attendants who washed their hands, 71 percent said that they used soap and water while 25 percent washed their hands with water only.
Table 20: Delivery practiceYes No Don’t Know
Presence of FCHV in home delivery 52(19.6) 209 (78.9) 4(1.5)Hand washing by birth attendant 138(60.3) 23(10) 68(29.7)Use of CDK 64(24.2) 171(64.5) 30(11.3)
*Percentage in Parentheses
Tetanus is considered as the leading cause of death in neonates, it is mostly prevalent in rural areas where non-sterilized instruments are used to cut the umbilical cord and where deliveries are carried out under poor hygienic conditions. Current recommendation suggests the use of Navi Malam in the cord stump and that nothing be applied if Navi Malam is unavailable. The study asked mothers with non-institutional delivery about newborn care practices they adopted. When mothers were asked about the instruments used to cut the umbilical cord during delivery (in deliveries other than health facility), 28 percent of mothers said that a new blade was used to cut the umbilical cord, 3.4 percent said that a boiled new blade was used and 13 percent of mothers were unaware about the instrument used to cut the cord. Similarly, 13 percent of mothers said that they used instruments such as used blade, knife, sickle and khukuri. Fifty percent of the mothers were unaware as to where the cord was placed while cutting and 14 percent of mothers said that a piece of wood was used. Similarly, only 44 percent of mothers reported that the room where the delivery was carried out was clean.
When mothers were asked about cord care immediately after cutting, more than one third of mothers said that nothing was applied, while 8 percent mentioned the application of Navi Malam and 7 percent of mothers mentioned the application of Oil.

22 A Report on Verbal Autopsy to Ascertain Causes of Neontal Deaths in Nepal
Table 21: Cord careInstruments used for cutting the cord Frequency PercentCDK 64 24.2New blade 74 27.9Boiled new blade 9 3.4Others* 35 13.3Don't know 35 13.3Total 265 100.0Application on the cord stumpOil 19 7.2Medicated ointment 4 1.5Navi Malam 21 7.9Nothing 95 35.8Others 1 0.4Don't know 125 47.2Total 265 100.0
*Includes bamboo stick
8.4 Crying at Birth
More than 50 percent of mothers reported that the deceased child breathed normally after birth. Similarly, 48 percent of mothers said that the baby cried immediately after birth. About 10 percent (one in ten) of newborns required some sort of help to induce normal breathing or crying. Initial stimulation was the most applied (5 percent) intervention to make the baby cry/ breathe. Ten percent of the newborns required Bag and Mask ventilation.
Table 22: Crying at birthBabies breathing immediately after birth Frequency PercentYes 316 57.4No 230 41.7Don't know 5 0.9Total 551 100.0Babies crying immediately after birthYes 265 48.1No 281 51.0Don't know 5 0.9Total 551 100.0
8.5 Practice of Essential Newborn Care in Non-institutional Delivery
The study collected information regarding the practices of essential newborn care in non-institutional deliveries. In addition to the use of clean delivery kit (CDK) and cord cutting practices, information regarding drying and wrapping of the newborn baby, skin to skin contact, bathing practices etc. were also collected.
Table 23: Practice of essential newborn care in non-institutional deliveryEssential new born care immediately after birth (n=33) Frequency PercentDried & wiped with soft, clean clothes 31 93.9Skin to skin contact 22 66.7Wrapped baby 28 84.8
Hypothermia among newborns is one of the principal causes of neonatal death, and a large number of deaths can be prevented if adequate measures are taken to keep the baby warm. In this study, more than ninety percent

23A Report on Verbal Autopsy to Ascertain Causes of Neontal Deaths in Nepal
of mothers/caretakers reported that the baby was dried and wiped with soft, clean clothes before the placenta was delivered. Similarly, 67 percent of mothers mentioned that their babies were placed in skin-to-skin contact, while 84 percent mentioned that their babies were wrapped. Room temperature plays an important role in preventing hypothermia in newborns, if not, newborns can lose heat in a very short span of time by convection and evaporation. The study shows, 64 percent of non-institutional delivery was carried out in a room that was not heated during the time of the delivery.
8.6 Birth Weight
Birth weight is an important indicator of the child’s susceptibility to illness and chances of survival. Children with birth weight less than 2.5 kilograms or those considered “very small” or “smaller than average” are more prone to complications than those with birth weight more than 2.5 kilograms or those considered “appropriate for age”. In this study, among babies weighed in home delivery, more than one-thirds (43 percent) of the babies weighed between 2.5 to 3 kilograms, 30 percent were between 1 to 2.49 kilograms and 6 percent were less than 1 kilogram. Despite the advice to avoid bathing within 24 hours of delivery, one in ten newborns (11 percent), as shown by the study, were bathed on the day of delivery.
Table 24: Birth weightBirth Weight Frequency Percent< 1 kilogram 13 5.81- 2.49 kilograms 68 30.22.5-3 kilograms 97 43.1> 3 kilograms 31 13.8Don't know 16 7.1Total 225 100.0
8.7 Breastfeeding Practices
Breast milk is the ideal food for the newborn and breastfeeding is recommended within an hour of birth. Breastfeeding is not only benefi cial for the baby but also to the mother in terms of production of milk, contraction of uterus to reduce post partum hemorrhage, emotional attachment etc. Table 24 shows the percentage of deceased babies that began breastfeeding, and whether they were fed anything other than breast milk prior to breastfeeding. Forty-nine percent of babies were breastfed immediately after birth and six percent were breastfed within an hour of birth. The practice of providing pre-lacteal feed although discouraged was found to be widely prevalent among communities with low education status and among certain ethnic groups. In this study, 9 percent of babies were given pre-lacteal feed, half (50 percent) gave milk other than mothers milk and the remaining gave other feeds such as plain water, sugar water, honey etc.
Table 25: Breastfeeding PracticesTime of initiation of breastfeeding Frequency PercentImmediately 169 49.4Within one hour 22 6.4> 1 hour 43 12.5Don't know 108 31.5Total 342 100Feeding other than breast milk (pre-lacteal feed)Yes 30 8.8No 276 80.7Don't know 11 3.2Not reported 25 7.3Total 342 100.0

24 A Report on Verbal Autopsy to Ascertain Causes of Neontal Deaths in Nepal
8.8 First Health Check-Up of Mothers By Place Of Delivery
Care of the mothers during postpartum period is mainly focused to prevent complications, provide care for the rapid restoration of the mother to optimum health, check adequacy of breastfeeding, provide family planning services and basic health education to mother and the family. Table 25 shows the practice of postpartum check-up of mothers in the study districts. Mothers were enquired if any health check-up was done before health care provider left the house/health facility after delivery. Postpartum check-up of mothers among deliveries carried out at home (non-institutional) was low (20 percent) compared to institutional delivery, which was as high, 86 percent. Accordingly, 73 percent of mothers responded that they were checked within a day. Similarly, 8 percent of mothers reported that they received a second health check up the following day and 15 percent of mothers within a week of delivery.
Table 26: First health check-up of mothers by place of deliveryNon-institutional delivery Frequency PercentYes 53 20.0No 18 6.8No one present 194 73.2Total 265 100.0Institutional deliveryYes 236 86.4No 22 8.1No one present 1 0.4Don’t Know 14 5.1Total 265 100.0
8.9 First Health Check-Up of Newborn Babies By Place Of Birth
The fi rst week of life is the most crucial in the life of an infant. Since risk of death is highest during the fi rst 24-48 hours after birth, check up of newborn babies during this crucial time helps to check for normal functions, body temperature, establish feeding practices, early detection of congenital disorders and infections, and gives adequate time for proper referral and treatment. The Government of Nepal recommends at least three postnatal checkups for the newborn within seven days of delivery. Table 26 Shows the practice of postnatal check-up of babies in the study districts. Mothers were enquired if any health check-up of newborn was done before health care provider left the house/health facility after delivery. The practice of postnatal check-up of newborns among babies delivered at home (non-institutional) was low (32 percent) compared to institutional delivery, which was as high, 77 percent. Accordingly, 79 percent of mothers responded that the babies were checked within a day and only 23 percent of mothers said that babies received two or more health check in the fi rst month.

25A Report on Verbal Autopsy to Ascertain Causes of Neontal Deaths in Nepal
Table 27: First health check-up of neonates by place of birthNon-institutional delivery Frequency PercentYes 51 32.1No 12 7.5Not present 92 57.9Don't know 4 2.5Total* 159 100.0Institutional delivery (n=175)Yes 134 76.6No 8 4.6Don't know 33 18.8Total 175 100.0Number of times health check received in the fi rst monthNot done 173 50.6One time 90 26.3Two to fi ve times 72 21.1More than 5 times 7 2.0Total 342 100
*Excludes deliveries carried out at other places (on the road, jungle etc).
8.10 Newborn Assessment By Health Worker
When mothers were asked about the types of examination conducted on the baby, more than half of the mothers mentioned body examination, weight measurement and cord assessment to be the commonest examination conducted on the baby. Seventeen percent of mothers reported being referred to health centers.
Table 28: Newborn assessment
Newborn assessment performed Frequency PercentBody examination 128 69.2Weight taken 104 56.2Cord assessment 95 51.4Watched breastfeeding 58 31.4Referred to health center 32 17.3Nothing done 3 1.6Not present during examination 10 5.4Total 185 100.0
9
26 A Report on Verbal Autopsy to Ascertain Causes of Neontal Deaths in Nepal
9
It is always diffi cult for health workers to understand why people who need a particular service are least likely to use it or fail to take any benefi t at all. Therefore, it is challenging for the community health workers and program
planners to understand the question “why do people behave as they do?” Understanding such human behavior is a prerequisite for the design of an eff ective program to change behavior of benefi ciaries and to improve health care practices.
In this section, we try to present care-seeking behavior of mothers during the illness of neonates. This section highlights the components necessary to explain the three-delay model viz delay in seeking care, delay in reaching care and delay in receiving care. Mothers were asked about their practice regarding time of initiation of home-based therapy, seeking care, reaching care and receiving care during the illness of their baby.
Table 28 shows that more than one third of mothers initiated some form of home-based therapy/treatment between 1-7 days of illness of the baby. Only 14 percent of mothers reported to have initiated therapy immediately on identifi cation of the illness, while 20 percent of mothers did not initiate any form of home based therapy. It is worth noting to fi nd that only 43 percent of the mothers sought care during illness. Among mothers who sought care, more than fi fty percent (54 percent) reported that they sought care within 1 hour of illness, another 28 percent reported that they sought care 2-5 hours after the start of the illness.
A majority of mothers said that they went to the health facility for treatment. When mothers were asked about the time it took them to reach the health facility, 40 percent of mothers responded that it took them less than an hour. Forty-four percent of mothers walked to the health facility while 12 percent used a Taxi as mode of transport. This however varied according to the districts. During transport, only 9 percent of mothers kept their babies close to their chest (skin to skin contact).
Fifty-nine percent of mothers reported that the health facility was open and 95 percent of mothers reported the presence of a health worker.

27A Report on Verbal Autopsy to Ascertain Causes of Neontal Deaths in Nepal
Table 29: Care seeking at the time of illnessTime of initiation of treatment/care of the sick baby at home
Neonatal sepsis
Birth Asphyxia
Prematurity related
LBW related
Others Total
Immediately 51.2% 23.3% 9.3% 2.3% 14.0% 43(14.4)1-7 days 62.4% 7.3% 11.0% 2.8% 16.5% 109(36.5)after a week 100.0% 0 0 0 0 6(2)Don't know 43.2% 16.0% 12.3% 9.9% 18.5% 81(27.1)Treatment not done 47.5% 10.2% 16.9% 3.4% 22.0% 59(19.8)Total* 53.4% 12.4% 12.1% 4.7% 17.4% 298(100)Seeking careYes 64.0% 15.1% 7.9% 2.2% 10.8% 139(43.3)No 40.0% 16.2% 18.1% 2.9% 22.9% 105(32.7)Don't know 39.0% 10.4% 15.6% 13.0% 22.1% 77(23.9)Total** 50.2% 14.3% 13.1% 5.0% 17.4% 321(100)Time of seeking care< 1 hour 54.7% 21.3% 10.7% 2.7% 10.7% 75(53.9)2-5 hours 74.4% 5.1% 7.7% 0 12.8% 39(28)> = 6 hours 89.5% 5.3% 0 0 5.3% 19(13.6)Don't know 33.3% 33.3% 0 16.7% 16.7% 6(4.32)Total 64.0% 15.1% 7.9% 2.2% 10.8% 139(100)Treatment sought fromHospital 50.0% 21.1% 15.8% 0 13.2% 38(27.3)Health facility 63.6% 18.2% 4.5% 4.5% 9.1% 44(31.6)Private clinic 59.1% 18.2% 9.1% 4.5% 9.1% 22(15.8)AHW ANM 100.0% 0 0 0 0 6(4.3)FCHV 60.0% 0 0 0 40.0% 5(3.6)Dhami 90.9% 0 0 0 9.1% 11(7.9)Pharmacy 100.0% 0 0 0 0 2(1.4)Other 72.7% 9.1% 9.1% 0 9.1% 11(7.9)Total 64.0% 15.1% 7.9% 2.2% 10.8% 139(100)Time to reach the facility< 1 hour 67.9% 10.7% 7.1% 1.8% 12.5% 56(40.2)1-2 hours 74.4% 11.6% 7.0% 0 7.0% 43((30.9)> 2 hours 64.3% 7.1% 14.3% 0 14.3% 14(10)Don't know 38.5% 34.6% 17.7% 7.7% 11.5% 26(18.7)Total 64.0% 15.1% 7.9% 2.2% 10.8% 139(100)Types of care provided to the baby en route to the health facilityKept close to chest 66.7% 8.3% 16.7% 0 8.3% 12(8.6)Wrapped in cloths 70.0% 11.3% 7.5% 1.3% 10.0% 80(57.5)Keep breastfeeding 75.0% 0 25.0% 0 0 4(2.8)Nothing 73.3% 13.3% 6.7% 0 6.7% 15(10.8)Others 100.0% 0 0 0 0 1(0.72)Don't know 37.0% 33.3% 3.7% 7.4% 18.5% 27(19.4)Total 64.0% 15.1% 7.9% 2.2% 10.8% 139(100)Was the health facility open? Yes 69.5%o 11.0% 11.0% 0 8.5% 82(59)Was the health worker present? Yes 69.2% 11.5% 10.3% 0 9.0% 78(95)No 75.0% 25.0% 0 4(4.8)Total 69.5% 11.0% 11.0% 0 8.5% 82(100)
*Percentage in Parentheses
**Excludes neonates delivered at the HF who died on the same day
*** Excludes neonates delivered at the HF who died on the same day but answered either “Yes” or “No”
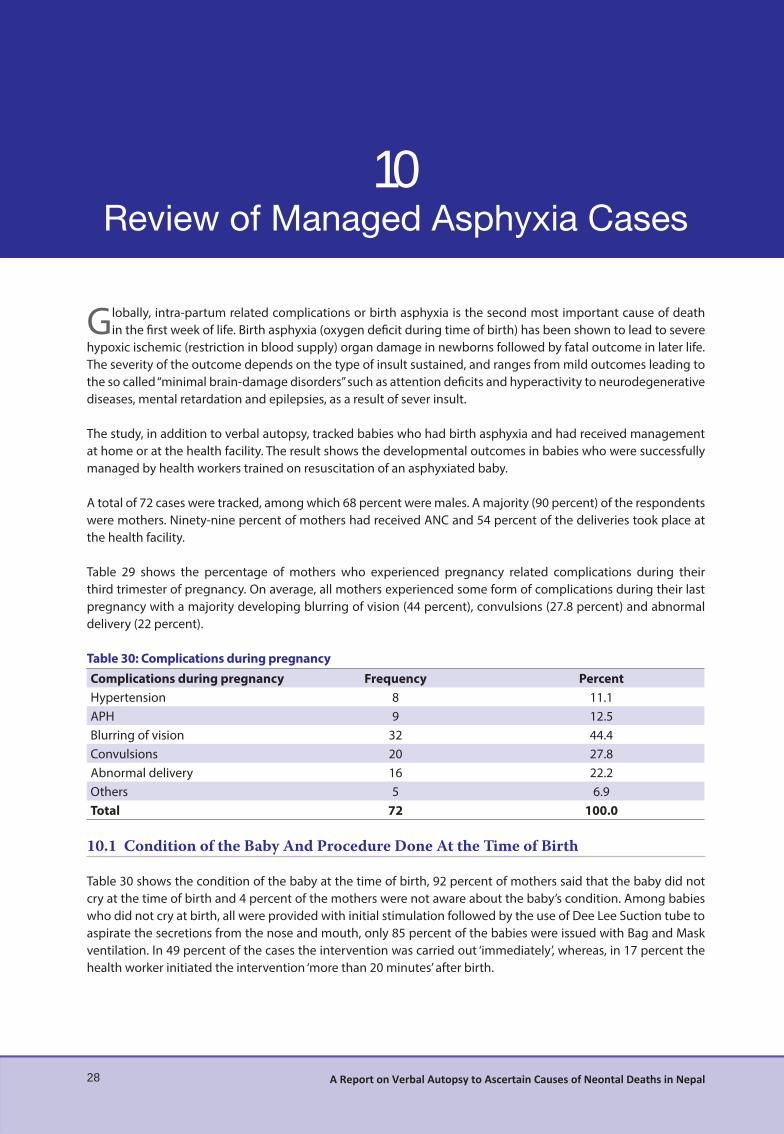
10
28 A Report on Verbal Autopsy to Ascertain Causes of Neontal Deaths in Nepal
10
Globally, intra-partum related complications or birth asphyxia is the second most important cause of death in the fi rst week of life. Birth asphyxia (oxygen defi cit during time of birth) has been shown to lead to severe
hypoxic ischemic (restriction in blood supply) organ damage in newborns followed by fatal outcome in later life. The severity of the outcome depends on the type of insult sustained, and ranges from mild outcomes leading to the so called “minimal brain-damage disorders” such as attention defi cits and hyperactivity to neurodegenerative diseases, mental retardation and epilepsies, as a result of sever insult.
The study, in addition to verbal autopsy, tracked babies who had birth asphyxia and had received management at home or at the health facility. The result shows the developmental outcomes in babies who were successfully managed by health workers trained on resuscitation of an asphyxiated baby.
A total of 72 cases were tracked, among which 68 percent were males. A majority (90 percent) of the respondents were mothers. Ninety-nine percent of mothers had received ANC and 54 percent of the deliveries took place at the health facility.
Table 29 shows the percentage of mothers who experienced pregnancy related complications during their third trimester of pregnancy. On average, all mothers experienced some form of complications during their last pregnancy with a majority developing blurring of vision (44 percent), convulsions (27.8 percent) and abnormal delivery (22 percent).
Table 30: Complications during pregnancyComplications during pregnancy Frequency PercentHypertension 8 11.1APH 9 12.5Blurring of vision 32 44.4Convulsions 20 27.8Abnormal delivery 16 22.2Others 5 6.9Total 72 100.0
10.1 Condition of the Baby And Procedure Done At the Time of Birth
Table 30 shows the condition of the baby at the time of birth, 92 percent of mothers said that the baby did not cry at the time of birth and 4 percent of the mothers were not aware about the baby’s condition. Among babies who did not cry at birth, all were provided with initial stimulation followed by the use of Dee Lee Suction tube to aspirate the secretions from the nose and mouth, only 85 percent of the babies were issued with Bag and Mask ventilation. In 49 percent of the cases the intervention was carried out ‘immediately’, whereas, in 17 percent the health worker initiated the intervention ‘more than 20 minutes’ after birth.
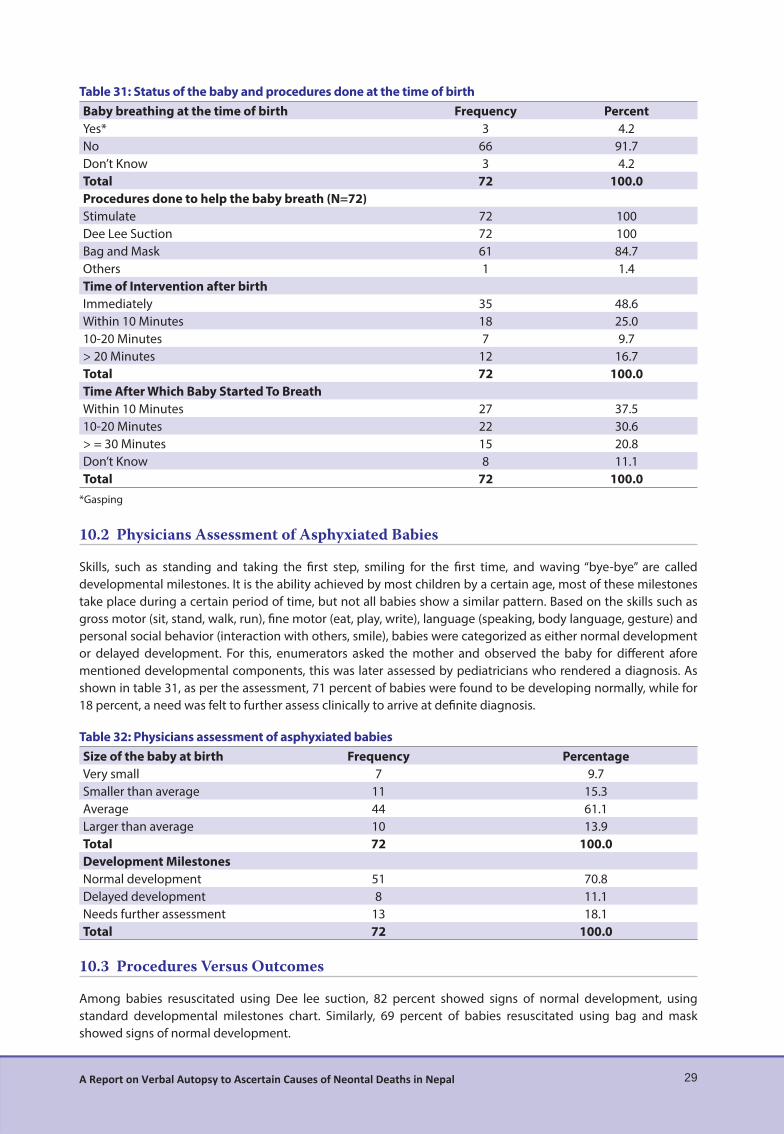
29A Report on Verbal Autopsy to Ascertain Causes of Neontal Deaths in Nepal
Table 31: Status of the baby and procedures done at the time of birthBaby breathing at the time of birth Frequency PercentYes* 3 4.2No 66 91.7Don’t Know 3 4.2Total 72 100.0Procedures done to help the baby breath (N=72)Stimulate 72 100Dee Lee Suction 72 100Bag and Mask 61 84.7Others 1 1.4Time of Intervention after birthImmediately 35 48.6Within 10 Minutes 18 25.010-20 Minutes 7 9.7> 20 Minutes 12 16.7Total 72 100.0Time After Which Baby Started To BreathWithin 10 Minutes 27 37.510-20 Minutes 22 30.6> = 30 Minutes 15 20.8Don’t Know 8 11.1Total 72 100.0
*Gasping
10.2 Physicians Assessment of Asphyxiated Babies
Skills, such as standing and taking the fi rst step, smiling for the fi rst time, and waving “bye-bye” are called developmental milestones. It is the ability achieved by most children by a certain age, most of these milestones take place during a certain period of time, but not all babies show a similar pattern. Based on the skills such as gross motor (sit, stand, walk, run), fi ne motor (eat, play, write), language (speaking, body language, gesture) and personal social behavior (interaction with others, smile), babies were categorized as either normal development or delayed development. For this, enumerators asked the mother and observed the baby for diff erent afore mentioned developmental components, this was later assessed by pediatricians who rendered a diagnosis. As shown in table 31, as per the assessment, 71 percent of babies were found to be developing normally, while for 18 percent, a need was felt to further assess clinically to arrive at defi nite diagnosis.
Table 32: Physicians assessment of asphyxiated babiesSize of the baby at birth Frequency PercentageVery small 7 9.7Smaller than average 11 15.3Average 44 61.1Larger than average 10 13.9Total 72 100.0Development MilestonesNormal development 51 70.8Delayed development 8 11.1Needs further assessment 13 18.1Total 72 100.0
10.3 Procedures Versus Outcomes
Among babies resuscitated using Dee lee suction, 82 percent showed signs of normal development, using standard developmental milestones chart. Similarly, 69 percent of babies resuscitated using bag and mask showed signs of normal development.

30 A Report on Verbal Autopsy to Ascertain Causes of Neontal Deaths in Nepal
Table 33: Procedures versus outcomesNormal development Delayed development Needs further assessment Total
DLST 9 (81.8) 0 2 (18.2) 11Bag & Mask 42 (68.9) 8 (13.1) 11 (18) 61
Total 51 (70.8) 8 (11.1) 13 (18.1) 72*Percentage in Parentheses
10.4 Illness History
Table 33 shows the illness history of babies as responded by mothers. Eighty-one percent of mothers responded that the child became ill at least once, with more than 50 percent giving a history of chest in-drawing, fever and cough. Similarly, more than 50 percent reported hearing either stridor or grunting or wheezing and fl aring of nostrils at the time of illness.
Table 34: Illness historyFrequency Percent
History of illness after management of asphyxiaYes 58 80.6No 14 19.4Total 72 100.0Danger signs during illnessFast breathing 27 46.6Chest in-drawing 30 51.7Lethargic/unconscious/less movement 17 29.3Unable to suck 22 37.9Hypothermia 7 12.1Fever 45 77.6Infected umbilical stump 5 8.6Diarrhea 20 34.5Cough 40 69.0Others** 9 15.5Total 58 100Types of noises during illness (n=58)Stridor 30 51.7Grunting 29 50.0Wheezing 41 70.7Flaring of nostrils during breathingYes 29 50No 29 50Total 58 80.6Place from where treatment was received Hospital 14 24.1HF 38 65.5Private clinic 26 44.8Promoted AHW/ANM 1 1.7FCHV 14 24.1Dhami 6 8.3Pharmacy 8 13.8Others 3 5.2
58 100.0
** The respondents under “other” category mentioned Pneumonia

11
31A Report on Verbal Autopsy to Ascertain Causes of Neontal Deaths in Nepal
11
11.1 Delay in Receiving Services
Sapana Praja, a resident of Korak -5 (Rongling), Chitwan is a chepang, one of the indigenous groups of Nepal. When she was pregnant with her fi rst baby she was 22 and the delivery was presumed to be normal as she was receiving ANC services from FCHV and also from the Bhandara Health Facility. On 18th Shrawah 2068, when she was 7 months pregnant she went into labor, which lasted for about one hour. As the gestation was unexpected, she was not taken to the HF. With assistance of her friends and neighbors, she gave birth to a baby girl at home who cried loudly. A sterilized blade was used to cut the cord. However, the baby weighed 1000 grams, a very low birth weight and was cold, she was rushed to the government hospital (Bharatpur hospital) in an ambulance and reached there around 11 am. Unfortunately the hospital was going through routine cleaning, and only the mother was able to enter the hospital while the baby carried by her aunt was stopped by the security guard outside. The family pleaded with the guard to let the baby in immediately, however, the security personnel did not let his guard down and due to the delay in the treatment, the baby died. The baby died due to unwanted delay by security personnel. Physicians diagnosed the cause of death as prematurity related.
11.2 Baby saved by the use of Bag & Mask: 1
Kamala B.K, a resident of Damachour – 3,Salyan, delivered her fi rst baby at SHP on 15th Bhadra 2069 B.S. She had received ANC services from nurses and ANM and no pregnancy related complications was predicted, however, she went into labor for approximately 10 hours and was taken to a Sub Health Post where she had a normal delivery. However, the baby did not cry at birth, therefore, Birth Asphyxia Management protocol was followed and after the use of Bag & Mask, the baby started to cry. The weight of the baby at birth was 3.5 kilograms. The baby was given all the mandated vaccinations, but the baby frequently became sick (10 times from the time of birth till the day of observation) and even showed signs of fast breathing, severe chest in-drawing, lethargic. Similarly, stridor, grunting and wheezing was also noticed, as reported by the mother. She was taken to HF and to a private clinic for treatment. While assessing milestone development of the baby, it was found delayed for her age.
11.3 Baby saved by the use of Bag & Mask: 2
Rajpura Nepali, a resident of Raralihi -5 (Dundeli),Jumla is 15 years old, she is illiterate and she delivered her fi rst baby at home on 28th Shrawan 2070 B.S. She was receiving ANC services from ANM and the delivery was anticipated to be normal. When she went into labor, she was taken to a Health Post where her labor lasted for almost 18 hours; during the entire period she did not feel any fetal movement. At the Health Post, an ANM was attending when she had a breech delivery. Rajpura gave birth to a baby girl, who did not cry at birth and turned blue. The baby’s body temperature was not consistent as some parts was hot and had shades of red. The ANM managed the baby following asphyxia management protocol. After using Bag & Mask, the baby cried and the color of the body also changed. The weight of the baby at birth was 3 kilograms. Within a month, the baby had 4 episodes of illness, symptoms such as fever, lethargic, frequent stool and was even diagnosed with an ear infection. Stridor, grunting and wheezing was also noticed. While observing the baby, her physical performance was found to be slow compared to babies of her own age. Her milestone development could not be assessed. Further assessment is needed of the baby.

32 A Report on Verbal Autopsy to Ascertain Causes of Neontal Deaths in Nepal
11.4 Baby saved by the use of Bag & Mask: 3
Manju Oli is a resident of Shivrath -5 (Khurkhure), Salyan. She was 25 years old when she became pregnant with her fi rst baby. She had received ANC services and was expecting a normal delivery. She did not go into labor even after her expected due date. She was taken to Lumbini Zonal Hospital and was induced, and the following day a vacuum delivery was done. A baby boy was delivered on 24th Magh 2069, who was asphyxiated. The mother was unconscious and the baby was taken to Bhairahawa Hospital by family members. Asphyxia management was done in Bhairahawa hospital and the baby was saved. The baby is eating well and as for milestone development, normal growth was observed in language while some degree of delay in development was observed in gross motor, fi ne motor, personal and social skills.
11.5 Baby saved by the use of Dee Le Suction tube
Maili Rawat, a resident of Tamti -2 (Surki),Jumla, is 20 years old. Maili Rawat delivered a baby boy at home on 27th Chaitra 2068 B.S. It was her fi rst baby. During pregnancy, she had shown some danger signs such as intra-partum hemorrhage, convulsions and blurring of vision. Even though she had taken ANC services from an ANM, she had not prepared for delivery, and was attended by her relatives and FCHV. When the baby was born, the baby did not cry and the attendants supposed that the baby had died, but after three hours, when FCHV used Dee lee suction Tube the baby started to cry. The weight of the baby at birth was 3.5 kg.
At present, the baby seems slow compared to children of his age. His milestone development was assessed as delayed.

12
33A Report on Verbal Autopsy to Ascertain Causes of Neontal Deaths in Nepal
12
Accurate estimates of neonatal death plays a fundamental role for program planners and policy makers to prioritize public health intervention. Among the various approaches to concluding the causes of death,
physician’s review approach was used to arrive at the diagnosis. Physician’s review is the most widely used approach and the major advantage is that all sections of the VA questionnaire, even open ended questions and comments are utilized to arrive at the diagnosis.7, 9
In our study, the majority of deaths occurred at home, among males, and the day of birth accounted for the highest number of deaths. The three leading causes of neonatal mortality in our study were: neonatal sepsis, birth asphyxia, and prematurity related. Mortality was observed to be high on the day of birth and most deaths were attributed to birth asphyxia. In the context of the study districts, with community health workers/ volunteers skilled in resuscitation of asphyxiated newborns, the death toll is still high, highlighting an urgent need to improve and make available new born care services through skill birth attendants. Recently, birth asphyxia has been proposed as “intrapartum-related deaths” since the former has been expressed as a poorly defi ned term. 26 27 11
Death due to neonatal sepsis was found to be particularly high on the third day of birth, and more common in the hilly region. A verbal autopsy conducted in rural Nepal using physicians review along with algorithm based cause of death assignment, show similar fi ndings with algorithm based cause of death assignment.28 The fi ndings is also consistent with similar studies conducted by Khanal et al29 and Bang et al30. Similarly, a study conducted in rural India showed 32, 50 and 71 percent of deaths to take place during the day of birth, fi rst three days of life and during the fi rst week respectively. The primary cause of death on the fi rst day of life was birth asphyxia or injury with preterm birth and sepsis or pneumonia being the commonest cause during days 1-6.31
A substantial proportion of deaths due to sepsis was observed after day 2, showing a declining trend afterwards. Most of the early infections are due to pathogens acquired from the mother, 32 but the rise in deaths due to sepsis on day 3 could possibly hint towards infection linked to environmental exposures and practices during delivery at home and at the health facility. 33 Use of chlorhexidine, improved hygiene (hand washing and clean delivery) and neonatal care practices may reduce the incidence of neonatal infection,33-36 and has been used in the current newborn care strategy, but further exploration is required to see whether the interventions are working in programmatic perspective. The examination of causes of deaths by number of days gives a useful insight for health program planning and thus highlights the need for a continuum of care.37 Similarly, neonatal deaths due to neonatal sepsis and birth asphyxia were slightly higher in deliveries at health facilities. It is possible that only those pregnancies considered serious by family members reached the health facility, hence delivering high-risk cases, and thus accounting for a higher mortality at the health facility.
Global estimates suggest that stillbirths occur at about the same rate as neonatal deaths2, 38 and in our study stillbirths accounted for 38 percent of the total deaths, of which, 73 percent were fresh still births. Globally, Acute intra-partum events is estimated to account for 26 percent of still births and compared to the number of fresh still births in our study suggests a strong need in terms of intervention directed towards intra-partum stillbirths.
A majority of neonatal deaths (39 percent) were among disadvantaged ethnic groups (Disadvantaged Janajatis), this highlights for a rapid identifi cation along with strategic implementation of intervention targeted towards the group.

34 A Report on Verbal Autopsy to Ascertain Causes of Neontal Deaths in Nepal
Similarly, almost two-thirds of mothers were aware about essential newborn care messages and only half received the message through FCHV. In the study districts, CB-NCP was initiated at least a year before the study and ideally all mothers should have been exposed to the messages and the numbers are disappointing, considering the fact that still a very large number of mothers have no contact with FCHV. Such intervention plays a very important role in reducing neonatal mortality and should be started during pregnancy and the target audience should not only include mothers but also family members, traditional birth attendants’ even gatekeepers of health facilities. 39
Service utilization has been found to be very promising with 90 percent of mothers utilizing ANC services and 50 percent among them making four or more Antenatal care visits. Nurse/ Midwife were found to be the major providers of ANC services, this along with TT vaccination and consumption of deworming tablets, are found to be consistent with the NDHS, 2011. 19 The role of FCHV in service provision has been found to be promising with more than two thirds (73 percent) of mothers found to have discussed their present pregnancy.
Exploration of the three delays during pregnancy suggests that a majority of mothers waited 1-3 hours (median time), before they decided to go to the health facility for delivery, when they decided to go, for most it took them 1-5 hours (median time), to reach the health facility. At the health facility, 90 percent of the mothers were attended within half an hour of arrival. On average, the study suggests that it takes a pregnant mother almost 5 hours to decide, travel and receive the services at the health facility.
The VA approach is not without limitations. (i) Recall bias: it is one of the key limitations of this study. Since the study tried to explore the causes of deaths among deaths within a one-year duration, there exists a time delay between interview and death and it is possible that the fi ndings of some of the interviews is limited due to recall bias. However, a recall period of 1 to 12 months is generally considered to be acceptable. 7, 40, 41 (ii) Missed cases: neonatal deaths in this study has been identifi ed using district data along with contact tracing to supplement the missed cases, and it is possible that the team may not have been successful to trace total deaths. (iii) Erroneous classifi cation of a disease is a possibility due to lack of gold standard to compare the fi ndings42, and assignment of single cause of death can lead to overestimation of a particular cause. 2, 43, 44 It is possible that the baby suff ered from two separate conditions, and it is likely that it was the combination of the two that ultimately led to death. (iv) Other minor limitations could be related to the approach, physician’s review, in addition to being cost ineff ective and time consuming often faces the challenge of being inconsistent in terms of physician’s diagnosis.
Conclusions
Causes of neonatal mortality varied widely by district, ecological region, ethnicity, education, health care seeking behavior, and access and availability of health care services.
Sepsis and birth asphyxia were the major causes of neonatal death. Half of all deaths (including stillbirths) occur by day 3, suggesting a need for proper coverage of antepartum,
intra partum and early postnatal interventions. All mothers of survived asphyxiated newborns reported experiencing some form of complications during
their last pregnancy (blurring of vision, convulsions, abnormal delivery etc.)
Recommendations
Contextual exploration of causes of the neonatal deaths and planning of appropriate interventions are crucial to reduce the neonatal deaths in the country, the focus should be on neonatal sepsis, asphyxia and prematurity related conditions.Developing a mechanism to understand the behavior of mothers or service recipients, and ensuring that the health worker provides rapid and appropriate care should be a priority. Percentage of stillbirths is high; therefore, it is necessary to come up with interventions and monitor changes accordingly.
Focus should be on improvement of the quality of perinatal health care.Promotion of institutional delivery along with strengthening of services at the health facility.
Birth preparedness plan as shown by the study is less than satisfactory, considering the programmatic highlights on BPP and the study fi ndings, it has become necessary to further assess the program and to fi nd out what has worked well and what has not.

35A Report on Verbal Autopsy to Ascertain Causes of Neontal Deaths in Nepal
Identifi cation of an appropriate referral center for neonatal care (in case of survived asphyxiated newborns) and provision of neonatal care unit should be prioritized for further reduction in neonatal mortality and morbidity.Care seeking behavior should be promoted and existing links between communities and health facilities should be strengthened in areas with high neonatal mortality and low service utilization. Further assessment and follow-up intervention is required for babies with developmental delay and those needing further assessment. It is impractical and impossible to expect rapid attainment of good quality vital registration system in low-income countries. Even so, countries such as Nepal, should have a long-term goal to have a good Vital Registration data.
Citations
1. Garenne M, Fauveau V. Potential and limits of verbal autopsies. Bull World Health Organ. 2006; 84:164.2. Anker M, Black RE, Coldham C, Kalter HD, Quigley MA, Ross D, et al. A Standard Verbal Autopsy Method for
Investigating Causes of Death in Infants and Children: World Health Organization.3. Baiden F, Bawah A, Biai S, Binka F, Boerma T, Byass P, et al. Setting international standards for verbal autopsy.
Bull World Health Organ. 2007; 85:570-1.4. Levels and Trends in Child Mortality: The Inter-agency Group for Child Mortality Estimation (UN IGME)2013
Contract No.: 23rd Nov.5. Lawn JE, Cousens S, Zupan J. 4 million neonatal deaths: when? Where? Why? Lancet. 2005; 365:891-900.6. Phillips DE, Gonzalez-Medina D, Atkinson C, Lopez AD, Lozano R, Murray CJL, et al. Worldwide data on causes
of death: a systematic assessment of quality and availability of vital registration. The Lancet. 2013; 381:S112.7. Soleman N, Chandramohan D, Shibuya K. Verbal autopsy: current practices and challenges. Bull World Health
Organ. 2006; 84:239-45.8. King G, Lu Y, Shibuya K. Designing verbal autopsy studies. Population Health Metrics. 2010; 8:19.9. Quigley MA, Chandramohan D, Rodrigues LC. Diagnostic accuracy of physician review, expert algorithms and
data-derived algorithms in adult verbal autopsies. International Journal of Epidemiology. 1999; 28:1081-7.10. Lozano R, Naghavi M, Foreman K, Lim S, Shibuya K, Aboyans V, et al. Global and regional mortality from 235
causes of death for 20 age groups in 1990 and 2010: a systematic analysis for the Global Burden of Disease Study 2010. Lancet. 2012; 380:2095-128.
11. Liu L, Johnson HL, Cousens S, Perin J, Scott S, Lawn JE, et al. Global, regional, and national causes of child mortality: an updated systematic analysis for 2010 with time trends since 2000. Lancet. 2012; 379:2151-61.
12. WHO. ICD-10. International statistical classifi cation of dieases and related health problems. Instruction manual. 2010 edition ed: World Health Organization; 2010.
13. Black RE, Cousens S, Johnson HL, Lawn JE, Rudan I, Bassani DG, et al. Global, regional, and national causes of child mortality in 2008: a systematic analysis. The Lancet. 2010; 375:1969-87.
14. Ten great public health achievements--worldwide, 2001-2010. MMWR Morb Mortal Wkly Rep. 2011; 60:814-8.15. Kahn K Fau - Tollman SM, Tollman Sm Fau - Garenne M, Garenne M Fau - Gear JS, Gear JS. Who dies from what?
Determining cause of death in South Africa’s rural north-east.16. Bryce J, Boschi-Pinto C, Shibuya K, Black RE. WHO estimates of the causes of death in children. Lancet. 2005;
365:1147-52.17. Lawn JE, Wilczynska-Ketende K, Cousens SN. Estimating the causes of 4 million neonatal deaths in the year
2000. International Journal of Epidemiology. 2006; 35:706-18.18. Ministry of Health and Population (MOHP) N, ERA N, Inc MI. Nepal Demographic and Health Survey 2006.
Kathmandu, NepalMay 2007.19. Ministry of Health and Population (MOHP) N, ERA N, Inc II. Nepal Demographic and Health Survey 2011.
Kathmandu, NepalMarch 2012.20. Nepal Go, Commission NP, Nepal UNCTo. Nepal Millennium Development Goals Progress Report 2013.
Kathmandu, Nepal September 2013.21. Kc A, Thapa K, Pradhan YV, Kc NP, Upreti SR, Adhikari RK, et al. Developing community-based intervention
strategies and package to save newborns in Nepal. J Nepal Health Res Counc. 2011; 9:107-18.22. Pradhan YV, Upreti SR, Kc NP, Thapa K, Shrestha PR, Shedain PR, et al. Fitting Community Based Newborn Care
Package into the health systems of Nepal. J Nepal Health Res Counc. 2011; 9:119-28.23. Pradhan YV, Upreti SR, Pratap KCN, K CA, Khadka N, Syed U, et al. Newborn survival in Nepal: a decade of

36 A Report on Verbal Autopsy to Ascertain Causes of Neontal Deaths in Nepal
change and future implications. Health Policy Plan. 2012; 27 Suppl 3:iii57-71.24. Poudel DC, Acharya B, Pant S, Paudel D, Pradhan YV. Developing, piloting and scaling-up of Nepal’s neonatal
care program. J Nepal Health Res Counc. 2012; 10:95-100.25. Kalter HD, Salgado R, Babille M, Koffi AK, Black RE. Social autopsy for maternal and child deaths: a
comprehensive literature review to examine the concept and the development of the method. Popul Health Metr. 2011; 9:45.
26. Goldenberg RL, McClure EM. Reducing intrapartum stillbirths and intrapartum-related neonatal deaths. Int J Gynaecol Obstet. 2009; 107 Suppl 1:S1-3.
27. Darmstadt GL, Lee AC, Cousens S, Sibley L, Bhutta ZA, Donnay F, et al. 60 Million non-facility births: who can deliver in community settings to reduce intrapartum-related deaths? Int J Gynaecol Obstet. 2009; 107 Suppl 1:S89-112.
28. Freeman JV, Christian P, Khatry SK, Adhikari RK, LeClerq SC, Katz J, et al. Evaluation of neonatal verbal autopsy using physician review versus algorithm-based cause-of-death assignment in rural Nepal. Paediatr Perinat Epidemiol. 2005; 19:323-31.
29. Khanal S, Gc VS, Dawson P, Houston R. Verbal autopsy to ascertain causes of neonatal deaths in a community setting: a study from Morang, Nepal. JNMA J Nepal Med Assoc. 2011; 51:21-7.
30. Bang AT, Paul VK, Reddy HM, Baitule SB. Why do neonates die in rural Gadchiroli, India? (Part I): primary causes of death assigned by neonatologist based on prospectively observed records. J Perinatol. 2005; 25 Suppl 1:S29-34.
31. Baqui AH, Darmstadt GL, Williams EK, Kumar V, Kiran TU, Panwar D, et al. Rates, timing and causes of neonatal deaths in rural India: implications for neonatal health programmes. Bull World Health Organ. 2006; 84:706-13.
32. Judith R. Bale BJS, Adetokunbo O. Lucas. Improving Birth Outcomes Meeting the Challenge in The Developing World.
33. Bhutta ZA, Darmstadt GL, Hasan BS, Haws RA. Community-based interventions for improving perinatal and neonatal health outcomes in developing countries: a review of the evidence. Pediatrics. 2005; 115:519-617.
34. Taha TE, Biggar RJ, Broadhead RL, Mtimavalye LA, Justesen AB, Liomba GN, et al. Eff ect of cleansing the birth canal with antiseptic solution on maternal and newborn morbidity and mortality in Malawi: clinical trial. BMJ. 1997; 315:216-9; discussion 20.
35. Vergnano S, Sharland M, Kazembe P, Mwansambo C, Heath PT. Neonatal sepsis: an international perspective. Archives of disease in childhood Fetal and neonatal edition. 2005; 90:F220-4.
36. Mullany LC, Darmstadt GL, Tielsch JM. Role of antimicrobial applications to the umbilical cord in neonates to prevent bacterial colonization and infection: a review of the evidence. The Pediatric infectious disease journal. 2003; 22:996-1002.
37. Tinker A, ten Hoope-Bender P, Azfar S, Bustreo F, Bell R. A continuum of care to save newborn lives. Lancet. 2005; 365:822-5.
38. Awasthi S, Pande VK. Cause-specifi c mortality in under fi ves in the urban slums of Lucknow, north India. J Trop Pediatr. 1998; 44:358-61.
39. Neonatal Mortality Formative Research Working G. Developing community-based intervention strategies to save newborn lives: lessons learned from formative research in fi ve countries. J Perinatol. 2008; 28 Suppl 2:S2-8.
40. Chandramohan D, Maude GH, Rodrigues LC, Hayes RJ. Verbal autopsies for adult deaths: issues in their development and validation. Int J Epidemiol. 1994; 23:213-22.
41. Mirza NM, Macharia WM, Wafula EM, Agwanda RO, Onyango FE. Verbal autopsy: a tool for determining cause of death in a community. East Afr Med J. 1990; 67:693-8.
42. Anker M. The eff ect of misclassifi cation error on reported cause-specifi c mortality fractions from verbal autopsy. Int J Epidemiol. 1997; 26:1090-6.
43. Marsh DR, Sadruddin S, Fikree FF, Krishnan C, Darmstadt GL. Validation of verbal autopsy to determine the cause of 137 neonatal deaths in Karachi, Pakistan. Paediatr Perinat Epidemiol. 2003; 17:132-42.
44. Kalter HD, Gray RH, Black RE, Gultiano SA. Validation of postmortem interviews to ascertain selected causes of death in children. Int J Epidemiol. 1990; 19:380-6.

37A Report on Verbal Autopsy to Ascertain Causes of Neontal Deaths in Nepal
Newborn Verbal Autopsy Oversight Team Members
Director, Child Health DivisionDirector, Family Health DivisionChief, CBIMCI Section, Child Health DivisionSenior Co-coordinator, Saving Newborn Lives, Save the ChildrenProgram Management Specialist, USAID Nepal
Participants, Newborn Verbal Autopsy Planning Meeting
Dr. Kiran Regmi, Director, FHDDr. Shilu Aryal, Senior Consultant, FHDMr. Ram Chandra Khanal, Sr. PHA, MoHPMr. Krishna Bahadur Chand, IMCI- Chief, CHDMr. Deepak Adhikari, IMCI – Section, CHDDr. Anjana KC Thapa, Coordinator, Save the ChildrenMr. Bharat Ban, M & E Specialist, Save the childrenMr. Sitaram Devkota, SIA/H4LMs. Sabita Tuladhar, SIA/ H4LMs. Nara Maya Limbu, USAIDMs. Jessica Healey, USAIDMr. Ram Bhandari, Executive Director, IRHDTC/NepalDr. Jyoti Ratna Dhakhwa, Team Leader Verbal Autopsy Program, Dr. Nitin Nischal Bhandari, Team Member, IRHDTC/NepalDr. Purusotam Raj Shedain, Team Member, Ms. Sirjana Khanal, Team Member, IRHDTC/NepalDr. Binod Man Shrestha, Consultant Physician, Dr. Amita Pradhan, Biostatistician, Mr. Yadu Sudan Kunwar, IRHDTC/Nepal Mr. Surya Bhatta, Project Director, One Heart WorldMs. Tenzing Y Sherpa, M & E, One Heart World
Newborn Verbal Autopsy Study Team Members
Dr. Jyoti Ratna Dhakhwa, Team Leader (Principal Investigator)Dr. Nitin Nischal Bhandari, Co-InvestigatorDr. Purushotam Shedain, Local ExpertMs. Sirjana Khanal, M & E Offi cer Prof. Dr. Amita Pradhan, BiostatisticianDr. Binod Man Shrestha, Consultant PhysicianDr. Bal Krishna Kalakheti, Consultant Physician

38 A Report on Verbal Autopsy to Ascertain Causes of Neontal Deaths in Nepal
Field Enumerators
Mr. Yuvraj YogiMr. Deependra Kaji ShresthaMr. Krishna SapkotaMr. Amul ShresthaMr. Rajan BhujelMs. Geeta PandeyMs. Sabina KhadkaMs. Amrita GhimireMr. Bir Bahadur BohoraMr. Pravin TiwariMr. Asfaq Raja MicraniMs. Bhumika ThapaMr. Nagendra PokhrelMr. Anup Khadka
Technical working group
Planning Meeting
Pretesting of tools in KavreIn house capacity building
Assessment of asphyxiated baby
Physicians discussions
Interview with mother of deceased baby
Monitoring visit in Chitwan

39A Report on Verbal Autopsy to Ascertain Causes of Neontal Deaths in Nepal
Table 1: District wise data
DistrictsNeonatal deaths and
still birth (as per district record)
Managed asphyxia cases (as per district record)
Neonatal deaths & still births cases
identifi ed
Managed Asphyxia cases tracked
Dolpa 5 1 27 7Jumla 41 9 52 6Palpa 23 6 68 12Salyan 87 27 103 17Morang** 380 11 157 12Chitwan 180 31 144 18Total 716 85 *** 551 72
** CBNCP report was not available, based on HMIS reporting.
*** Asphyxiated babies below 1 month not included in the study.
Table 2: Sources of dataSource Frequency PercentHF 304 55.2FCHV report 189 34.3Others # 58 10.5Total 551 100.0
# Others include traced cases (those not reported in CBNCP forms and HF).
Table 3: Percentage distribution of Respondents (N=551)Respondent Frequency PercentMothers 423 76.8Fathers 21 3.8Relatives 81 14.7Non relatives 26 4.7
Table 4: ANC & Pregnancy history of mothers (N=551)Gravida Frequency Percent0 252 45.71 140 25.42 81 14.73 42 7.64 12 2.25 7 1.36 7 1.3> 6 7 1.3Don't know 3 0.5

40 A Report on Verbal Autopsy to Ascertain Causes of Neontal Deaths in Nepal
Table 5: Number of live births prior to the deceased child (N=299)No of live births prior to deceased baby Frequency Percentage0 26 8.71 145 48.52 67 22.43 30 10.04 14 4.7>4 10 4.0Don't know 5 1.7
Table 6: Birth Spacing in relation to the Previous child (N=273)Birth Spacing Frequency Percentage< 2 years 98 35.9> 2 years 120 44.0Don’t Know 55 20.1
Birth spacing is calculated for mothers who had previous live birth prior to the deceased baby.
Table 7: Tobacco consumption by Mothers during Pregnancy (N=71)Tobacco consumption Frequency PercentDaily 51 71.8Once a week 14 19.7Monthly 3 4.2Sometimes 3 4.2
Table 8: Alcohol Consumption by Mothers during Pregnancy (N=88)Alcohol consumption Frequency PercentEveryday 19 21.6Once a week 45 51.1Monthly 22 25.0Sometimes 2 2.3
Table 9: Smoking By other family members (N=348) Smoking By other family members Frequency PercentEveryday 329 94.5Once a week 15 4.3Monthly 1 0.3Sometimes 3 0.9
Table 10: Main fuel used for cooking (N=551)Main fuel used for cooking Frequency PercentElectricity 1 0.2LPG 51 9.3Natural gas 2 0.4Biogas 7 1.3Coal 2 0.4Wooden coal 2 0.4Firewood 482 87.5Straw 1 0.2Guintha (Cow dung cake) 2 0.4Others 1 0.2Total 551 100
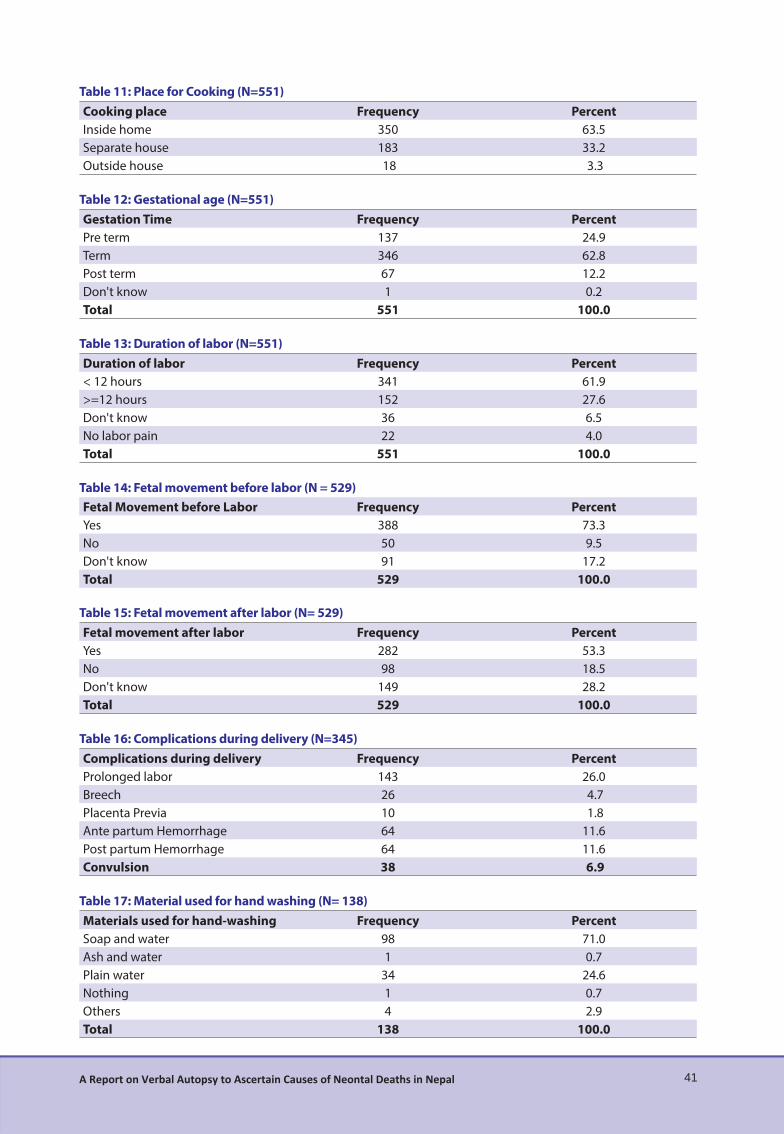
41A Report on Verbal Autopsy to Ascertain Causes of Neontal Deaths in Nepal
Table 11: Place for Cooking (N=551)Cooking place Frequency PercentInside home 350 63.5Separate house 183 33.2Outside house 18 3.3
Table 12: Gestational age (N=551)Gestation Time Frequency PercentPre term 137 24.9Term 346 62.8Post term 67 12.2Don't know 1 0.2Total 551 100.0
Table 13: Duration of labor (N=551)Duration of labor Frequency Percent< 12 hours 341 61.9>=12 hours 152 27.6Don't know 36 6.5No labor pain 22 4.0Total 551 100.0
Table 14: Fetal movement before labor (N = 529)Fetal Movement before Labor Frequency PercentYes 388 73.3No 50 9.5Don't know 91 17.2Total 529 100.0
Table 15: Fetal movement after labor (N= 529)Fetal movement after labor Frequency PercentYes 282 53.3No 98 18.5Don't know 149 28.2Total 529 100.0
Table 16: Complications during delivery (N=345) Complications during delivery Frequency PercentProlonged labor 143 26.0Breech 26 4.7Placenta Previa 10 1.8Ante partum Hemorrhage 64 11.6Post partum Hemorrhage 64 11.6Convulsion 38 6.9
Table 17: Material used for hand washing (N= 138)Materials used for hand-washing Frequency PercentSoap and water 98 71.0Ash and water 1 0.7Plain water 34 24.6Nothing 1 0.7Others 4 2.9Total 138 100.0
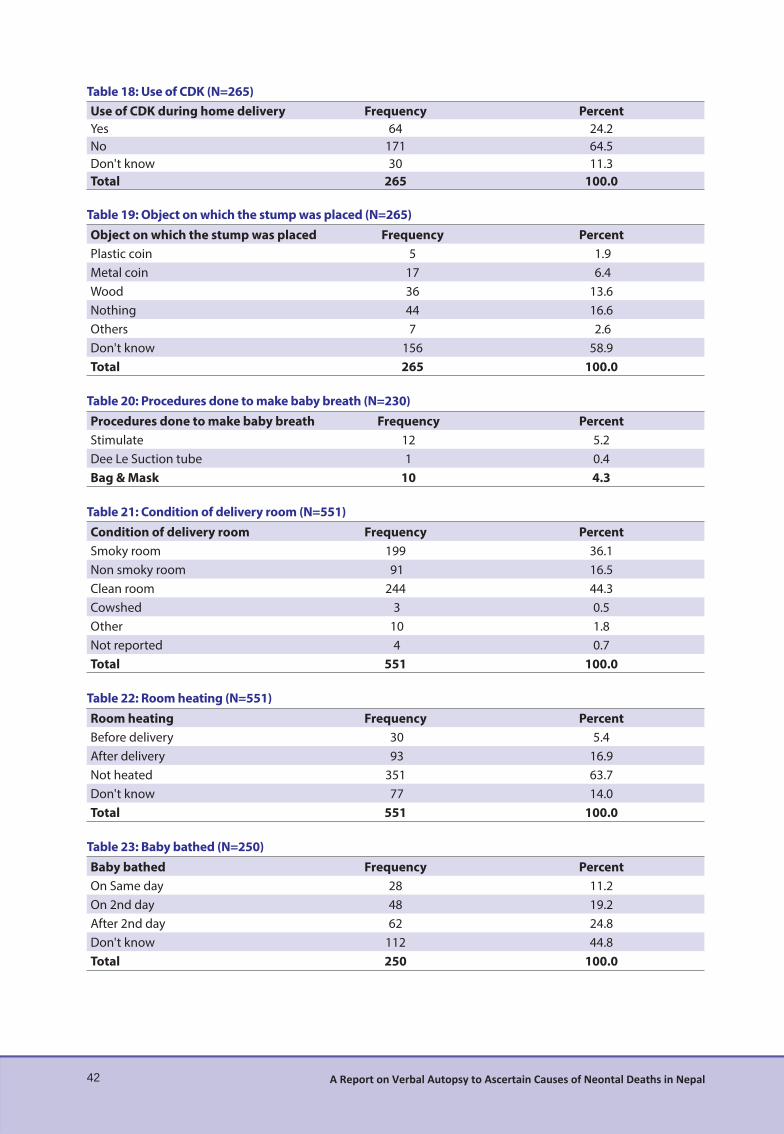
42 A Report on Verbal Autopsy to Ascertain Causes of Neontal Deaths in Nepal
Table 18: Use of CDK (N=265)Use of CDK during home delivery Frequency PercentYes 64 24.2No 171 64.5Don't know 30 11.3Total 265 100.0
Table 19: Object on which the stump was placed (N=265)Object on which the stump was placed Frequency PercentPlastic coin 5 1.9Metal coin 17 6.4Wood 36 13.6Nothing 44 16.6Others 7 2.6Don't know 156 58.9Total 265 100.0
Table 20: Procedures done to make baby breath (N=230) Procedures done to make baby breath Frequency PercentStimulate 12 5.2Dee Le Suction tube 1 0.4Bag & Mask 10 4.3
Table 21: Condition of delivery room (N=551)Condition of delivery room Frequency PercentSmoky room 199 36.1Non smoky room 91 16.5Clean room 244 44.3Cowshed 3 0.5Other 10 1.8Not reported 4 0.7Total 551 100.0
Table 22: Room heating (N=551)Room heating Frequency PercentBefore delivery 30 5.4After delivery 93 16.9Not heated 351 63.7Don't know 77 14.0Total 551 100.0
Table 23: Baby bathed (N=250)Baby bathed Frequency PercentOn Same day 28 11.2On 2nd day 48 19.2After 2nd day 62 24.8Don't know 112 44.8Total 250 100.0
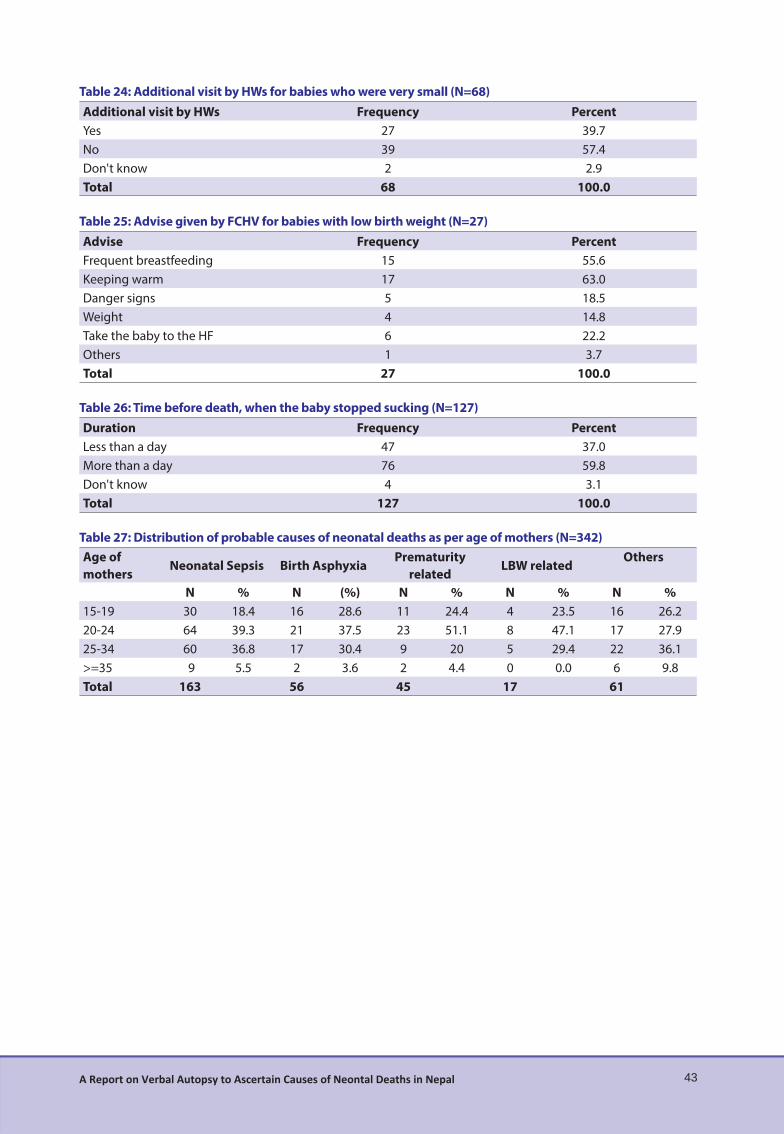
43A Report on Verbal Autopsy to Ascertain Causes of Neontal Deaths in Nepal
Table 24: Additional visit by HWs for babies who were very small (N=68)Additional visit by HWs Frequency PercentYes 27 39.7No 39 57.4Don't know 2 2.9Total 68 100.0
Table 25: Advise given by FCHV for babies with low birth weight (N=27)Advise Frequency PercentFrequent breastfeeding 15 55.6Keeping warm 17 63.0Danger signs 5 18.5Weight 4 14.8Take the baby to the HF 6 22.2Others 1 3.7Total 27 100.0
Table 26: Time before death, when the baby stopped sucking (N=127)Duration Frequency PercentLess than a day 47 37.0More than a day 76 59.8Don't know 4 3.1Total 127 100.0
Table 27: Distribution of probable causes of neonatal deaths as per age of mothers (N=342)Age of mothers
Neonatal Sepsis Birth AsphyxiaPrematurity
relatedLBW related
Others
N % N (%) N % N % N %15-19 30 18.4 16 28.6 11 24.4 4 23.5 16 26.220-24 64 39.3 21 37.5 23 51.1 8 47.1 17 27.925-34 60 36.8 17 30.4 9 20 5 29.4 22 36.1>=35 9 5.5 2 3.6 2 4.4 0 0.0 6 9.8Total 163 56 45 17 61


Integrated Rural Health Development Training Centre (IRHDTC),Maharajgunj, Kathmandu, Nepal
GPO Box: 8975, EPC 4090, Tel: 01-4721538, 4721587Email: [email protected], Website: www.irhdtc.org.np

![Welcome [dohs.gov.np]](https://static.fdocuments.in/doc/165x107/6209f84d534dc24b160f4ae9/welcome-dohsgovnp.jpg)