WR Report Summary: RMC 2009 V2 Enterprise Videoconferencing ...
12
Rich Media Conferencing - 2009 Volume 2 Enterprise Videoconferencing Endpoints & Infrastructure
Transcript of WR Report Summary: RMC 2009 V2 Enterprise Videoconferencing ...
Rich Media Conferencing - 2009 Volume 2
Enterprise Videoconferencing Endpoints & Infrastructure

WAINHOUSE RESEARCH ORDER FORM
Wainhouse Research, 34 Duck Hill Terrace, Duxbury MA 02332 USA Sara Fargo – Client Services P: +1 781.934.6165 F: +1 781.559.0790
2009 Rich Media Conferencing Order Form
Option I – Individual Reports Volume 1 – Audio, Web, and IM Conferencing Servers (RE-RMC09-V1) $4,995 USD Electronic copy with limited organizational use license (Adobe Acrobat .pdf file) Volume 2 – Enterprise Group Videoconferencing Products (RE-RMC09-V2) $4,995 USD Electronic copy with limited organizational use license (Adobe Acrobat .pdf file) Volume 3 – Audio, Video, Web Conferencing Services (RE-RMC09-V3) $4,995 USD Electronic copy with limited organizational use license (Adobe Acrobat .pdf file)
Option II – Report Bundle - (RE-RMC09-SUB)
2009 Rich Media Conferencing Subscription includes: Volume 1, Volume 2 and Volume 3 $12,995 USD Electronic copies with limited organizational use license (Adobe Acrobat .pdf file)
Order Total: $ Payment Options
Company P.O. #:_____________________________________ Credit Card: VISA MasterCard AMEX
Credit Card #________________________________________________ Exp. Date: _____/_____
Name on Card:_______________________________________________ Verification Code:___________
Signature:_____________________________________________________
Marketing Contact Billing Address (if different)
______________________________________Contact Name
______________________________________ Contact Name
______________________________________Contact Title
______________________________________ Contact Title
______________________________________Company
______________________________________ Company
______________________________________Address Line 1
______________________________________ Address Line 1
______________________________________Address Line 2
______________________________________ Address Line 2
______________________________________City, State, Zip or Postal Code
______________________________________ City, State, Zip or Postal Code
______________________________________Contact Phone Number
______________________________________ Contact Phone Number
______________________________________Contact Email
______________________________________ Contact Email
______________________________________Contact Signature
A facsimile copy of a signature on this document shall have the same force and effect as an original document with signature. ________________________________________________________________________________________________________
PLEASE return to Sara Fargo at fax number: +1 781.559.0790
Or fill in, save and email return to [email protected]
Rich Media Conferencing – 2009
Volume 2: Enterprise Videoconferencing
Endpoints & Infrastructure
October 2009
Publication RE-RMC09-V2

Rich Media Conferencing 2009 Volume 2: Enterprise Videoconferencing
Page - 2 © 2009 Wainhouse Research LLC
About the Authors
Andrew W. Davis is a researcher, analyst, and opinion leader in the field of collaboration and conferencing. Prior to founding Wainhouse Research, he held senior marketing positions with several large and small high-technology companies. Andrew has published over 250 trade journal articles and opinion columns on multimedia communications, videoconferencing, and corporate strategies as well as numerous market research reports and is the principal editor of the Wainhouse Research Bulletin. Andrew specializes in strategy consulting and new business development for Wainhouse Research. A well-known industry guest speaker, Mr. Davis holds B.S. and M.S. degrees in engineering from Cornell University and a Masters of Business Administration from Harvard University. He can be reached at [email protected]. Ira M. Weinstein is a Senior Analyst & Partner at Wainhouse Research. Prior to joining Wainhouse Research, Ira was the VP of Marketing and Business Development at IVCi, and ran the global conferencing department for a Fortune 50 investment bank. A frequent industry speaker, Ira has authored and contributed to dozens of articles, white papers, and reports on rich media communications, videoconferencing, streaming, audio-visual design and integration, and general business practices. Mr. Weinstein holds a B.S. in Electrical Engineering from Lehigh University. He can be reached at [email protected].
Stacy Austin Li specializes in market research and consulting related to Asia and China. Based in Beijing and fluent in Chinese, Stacy has worked more than ten years with the Asian marketplace accumulating expertise in localization of sales & marketing strategies, cross-cultural communication, and training. She consults with both China-based companies who are expanding into new markets and foreign companies entering the China market. Prior to joining Wainhouse Research, Stacy was global product marketing manager with VisionNex Technologies, a Beijing-based videoconferencing middleware provider. Stacy holds an M.A. in International Relations from the University of Hawaii. She can be reached at [email protected].
About Wainhouse Research Wainhouse Research is an independent market research firm focused on critical issues in IP communications. The company conducts research studies, provides strategy advice to vendors and end users, publishes a variety of reports, white papers, and a free newsletter, and organizes conferences on collaboration and conferencing solutions. Visit www.wainhouse.com for more information.
License Restrictions This report has been licensed to your organization only.
Transmittal to others outside your immediate organization including partners, resellers, external consultants, or clients is strictly prohibited. Posting on a web site accessible to others outside your immediate organization or reproducing this report for sale is strictly prohibited. This publication is protected by United States copyright laws and international copyright treaties. Unauthorized distribution or reproduction of this publication or any portion thereof may result in severe civil and criminal penalties and will be prosecuted to the maximum extent necessary to protect the rights of the publisher.
COPYRIGHT NOTICE Copyright 2009 by Wainhouse Research, LLC. All rights, including that of translation into other languages are specifically reserved. No part of this publication may be reproduced in any form, stored in a retrieval system, or transmitted by any method or means, electrical, mechanical, photographic, or otherwise, without the express written permission of Wainhouse Research, 34 Duck Hill, Duxbury, MA 02445 (Tel 617-975-0297) www.wainhouse.com. NOTE: The material presented in this report is based on both primary and secondary market data coupled with our professional interpretation of the facts. We believe that the information and recommendations provide a basis for sound business decisions, but no warranty as to completeness or accuracy is implied. All market estimates and forecasts are those of the authors, except as noted. We welcome your comments on this report.
Rich Media Conferencing 2009 Volume 2: Enterprise Videoconferencing
© 2009 Wainhouse Research LLC Page - 3
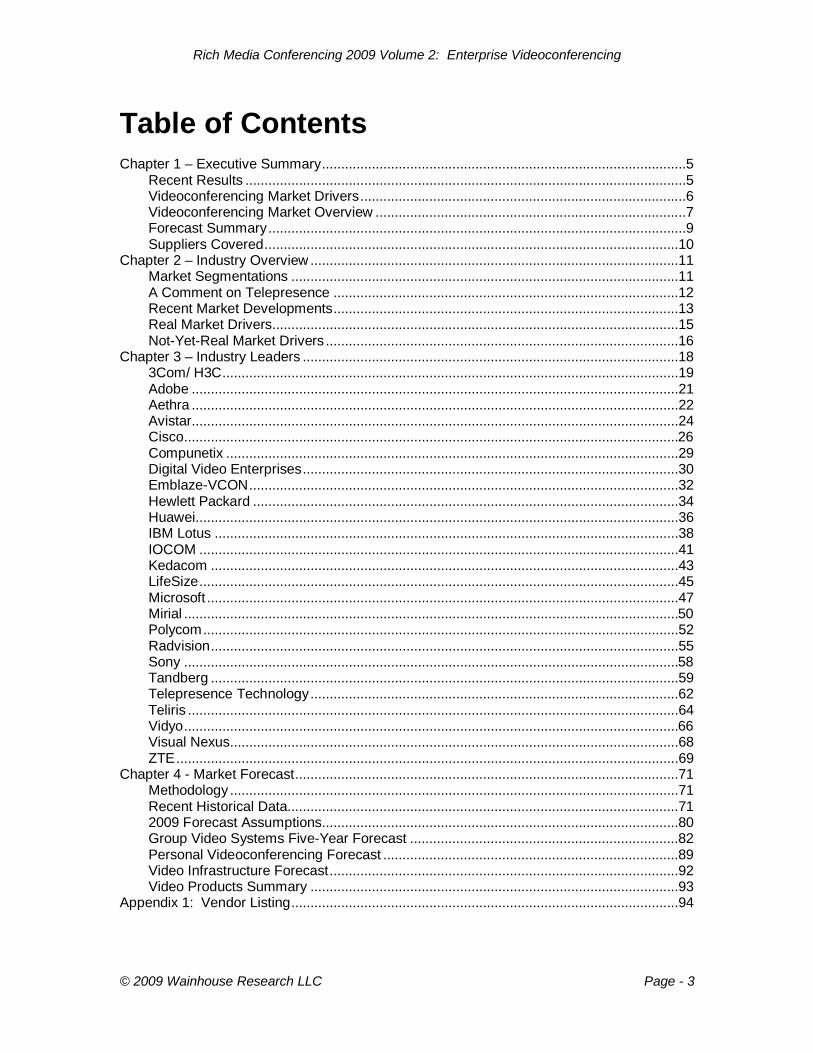
Table of Contents Chapter 1 – Executive Summary ............................................................................................... 5
Recent Results ................................................................................................................... 5 Videoconferencing Market Drivers ..................................................................................... 6 Videoconferencing Market Overview ................................................................................. 7 Forecast Summary ............................................................................................................. 9 Suppliers Covered ............................................................................................................10
Chapter 2 – Industry Overview ................................................................................................11 Market Segmentations .....................................................................................................11 A Comment on Telepresence ..........................................................................................12 Recent Market Developments ..........................................................................................13 Real Market Drivers ..........................................................................................................15 Not-Yet-Real Market Drivers ............................................................................................16
Chapter 3 – Industry Leaders ..................................................................................................18 3Com/ H3C .......................................................................................................................19 Adobe ...............................................................................................................................21 Aethra ...............................................................................................................................22 Avistar ...............................................................................................................................24 Cisco .................................................................................................................................26 Compunetix ......................................................................................................................29 Digital Video Enterprises ..................................................................................................30 Emblaze-VCON ................................................................................................................32 Hewlett Packard ...............................................................................................................34 Huawei ..............................................................................................................................36 IBM Lotus .........................................................................................................................38 IOCOM .............................................................................................................................41 Kedacom ..........................................................................................................................43 LifeSize .............................................................................................................................45 Microsoft ...........................................................................................................................47 Mirial .................................................................................................................................50 Polycom ............................................................................................................................52 Radvision ..........................................................................................................................55 Sony .................................................................................................................................58 Tandberg ..........................................................................................................................59 Telepresence Technology ................................................................................................62 Teliris ................................................................................................................................64 Vidyo .................................................................................................................................66 Visual Nexus.....................................................................................................................68 ZTE ...................................................................................................................................69
Chapter 4 - Market Forecast ....................................................................................................71 Methodology .....................................................................................................................71 Recent Historical Data......................................................................................................71 2009 Forecast Assumptions .............................................................................................80 Group Video Systems Five-Year Forecast ......................................................................82 Personal Videoconferencing Forecast .............................................................................89 Video Infrastructure Forecast ...........................................................................................92 Video Products Summary ................................................................................................93
Appendix 1: Vendor Listing .....................................................................................................94
Rich Media Conferencing 2009 Volume 2: Enterprise Videoconferencing
Page - 4 © 2009 Wainhouse Research LLC
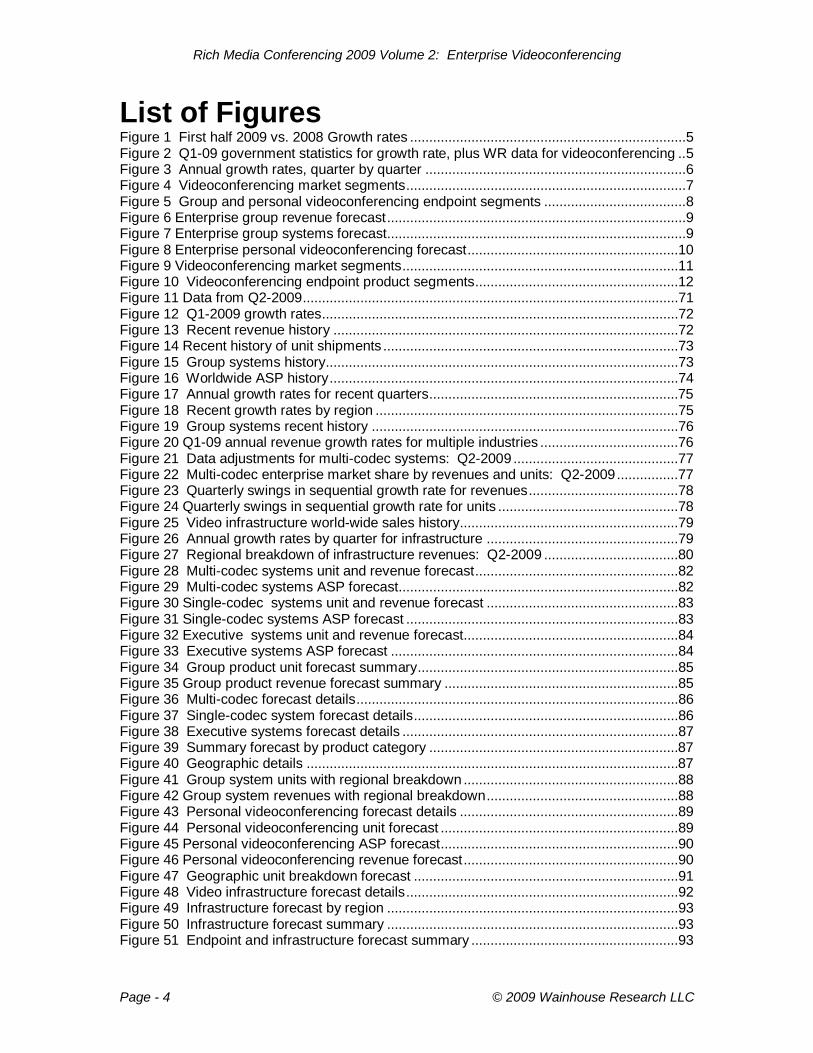
List of Figures Figure 1 First half 2009 vs. 2008 Growth rates ........................................................................ 5 Figure 2 Q1-09 government statistics for growth rate, plus WR data for videoconferencing .. 5 Figure 3 Annual growth rates, quarter by quarter .................................................................... 6 Figure 4 Videoconferencing market segments ......................................................................... 7 Figure 5 Group and personal videoconferencing endpoint segments ..................................... 8 Figure 6 Enterprise group revenue forecast .............................................................................. 9 Figure 7 Enterprise group systems forecast .............................................................................. 9 Figure 8 Enterprise personal videoconferencing forecast .......................................................10 Figure 9 Videoconferencing market segments ........................................................................11 Figure 10 Videoconferencing endpoint product segments .....................................................12 Figure 11 Data from Q2-2009 ..................................................................................................71 Figure 12 Q1-2009 growth rates .............................................................................................72 Figure 13 Recent revenue history ..........................................................................................72 Figure 14 Recent history of unit shipments .............................................................................73 Figure 15 Group systems history ............................................................................................73 Figure 16 Worldwide ASP history ...........................................................................................74 Figure 17 Annual growth rates for recent quarters .................................................................75 Figure 18 Recent growth rates by region ...............................................................................75 Figure 19 Group systems recent history ................................................................................76 Figure 20 Q1-09 annual revenue growth rates for multiple industries ....................................76 Figure 21 Data adjustments for multi-codec systems: Q2-2009 ...........................................77 Figure 22 Multi-codec enterprise market share by revenues and units: Q2-2009 ................77 Figure 23 Quarterly swings in sequential growth rate for revenues .......................................78 Figure 24 Quarterly swings in sequential growth rate for units ...............................................78 Figure 25 Video infrastructure world-wide sales history.........................................................79 Figure 26 Annual growth rates by quarter for infrastructure ..................................................79 Figure 27 Regional breakdown of infrastructure revenues: Q2-2009 ...................................80 Figure 28 Multi-codec systems unit and revenue forecast .....................................................82 Figure 29 Multi-codec systems ASP forecast.........................................................................82 Figure 30 Single-codec systems unit and revenue forecast ..................................................83 Figure 31 Single-codec systems ASP forecast .......................................................................83 Figure 32 Executive systems unit and revenue forecast........................................................84 Figure 33 Executive systems ASP forecast ...........................................................................84 Figure 34 Group product unit forecast summary ....................................................................85 Figure 35 Group product revenue forecast summary .............................................................85 Figure 36 Multi-codec forecast details ....................................................................................86 Figure 37 Single-codec system forecast details .....................................................................86 Figure 38 Executive systems forecast details ........................................................................87 Figure 39 Summary forecast by product category .................................................................87 Figure 40 Geographic details .................................................................................................87 Figure 41 Group system units with regional breakdown ........................................................88 Figure 42 Group system revenues with regional breakdown ..................................................88 Figure 43 Personal videoconferencing forecast details .........................................................89 Figure 44 Personal videoconferencing unit forecast ..............................................................89 Figure 45 Personal videoconferencing ASP forecast ..............................................................90 Figure 46 Personal videoconferencing revenue forecast ........................................................90 Figure 47 Geographic unit breakdown forecast .....................................................................91 Figure 48 Video infrastructure forecast details .......................................................................92 Figure 49 Infrastructure forecast by region ............................................................................93 Figure 50 Infrastructure forecast summary ............................................................................93 Figure 51 Endpoint and infrastructure forecast summary ......................................................93
Rich Media Conferencing 2009 Volume 2: Enterprise Videoconferencing
© 2009 Wainhouse Research LLC Page - 5
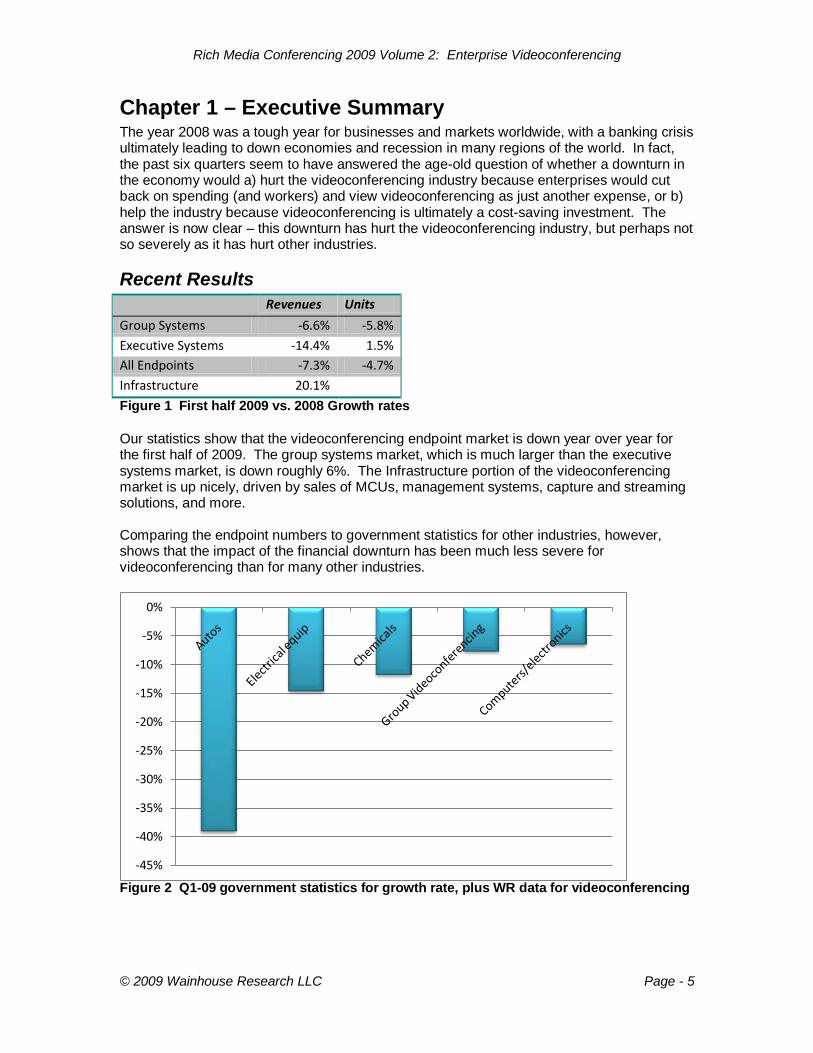
Chapter 1 – Executive Summary The year 2008 was a tough year for businesses and markets worldwide, with a banking crisis ultimately leading to down economies and recession in many regions of the world. In fact, the past six quarters seem to have answered the age-old question of whether a downturn in the economy would a) hurt the videoconferencing industry because enterprises would cut back on spending (and workers) and view videoconferencing as just another expense, or b) help the industry because videoconferencing is ultimately a cost-saving investment. The answer is now clear – this downturn has hurt the videoconferencing industry, but perhaps not so severely as it has hurt other industries.
Recent Results Revenues Units Group Systems -6.6% -5.8% Executive Systems -14.4% 1.5% All Endpoints -7.3% -4.7% Infrastructure 20.1% Figure 1 First half 2009 vs. 2008 Growth rates Our statistics show that the videoconferencing endpoint market is down year over year for the first half of 2009. The group systems market, which is much larger than the executive systems market, is down roughly 6%. The Infrastructure portion of the videoconferencing market is up nicely, driven by sales of MCUs, management systems, capture and streaming solutions, and more. Comparing the endpoint numbers to government statistics for other industries, however, shows that the impact of the financial downturn has been much less severe for videoconferencing than for many other industries.
Figure 2 Q1-09 government statistics for growth rate, plus WR data for videoconferencing
-45%
-40%
-35%
-30%
-25%
-20%
-15%
-10%
-5%
0%
Rich Media Conferencing 2009 Volume 2: Enterprise Videoconferencing
Page - 6 © 2009 Wainhouse Research LLC
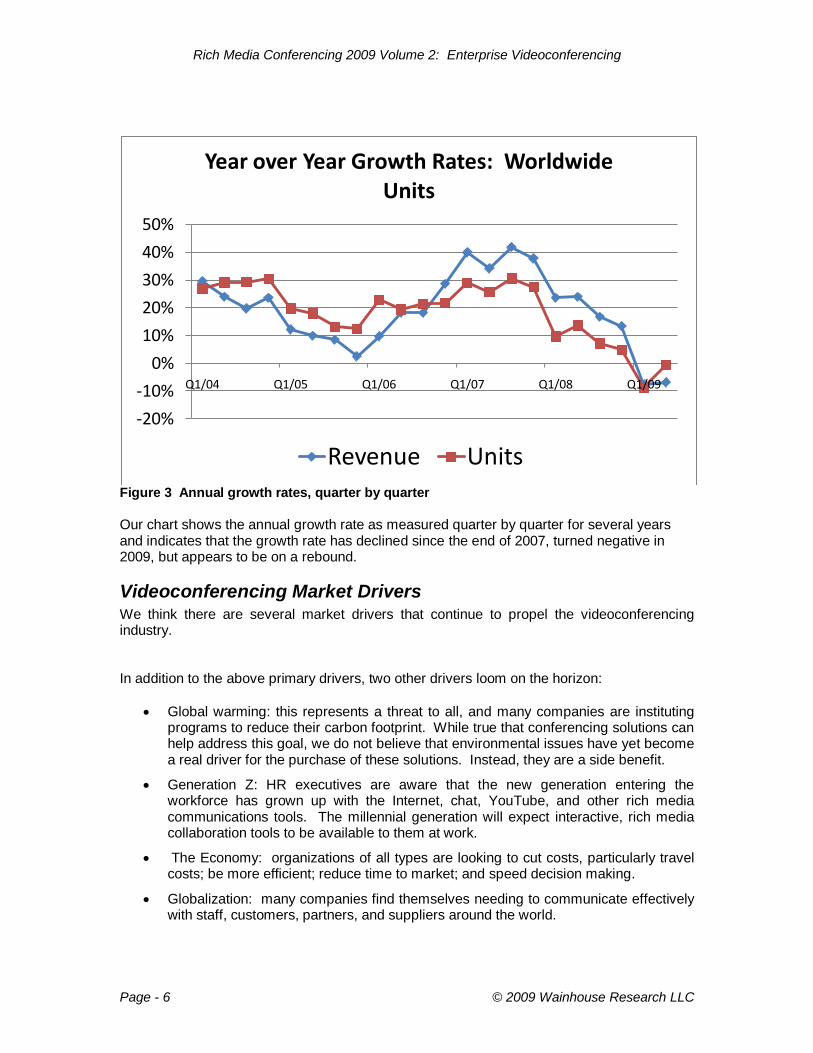
Figure 3 Annual growth rates, quarter by quarter Our chart shows the annual growth rate as measured quarter by quarter for several years and indicates that the growth rate has declined since the end of 2007, turned negative in 2009, but appears to be on a rebound.
Videoconferencing Market Drivers We think there are several market drivers that continue to propel the videoconferencing industry. In addition to the above primary drivers, two other drivers loom on the horizon:
• Global warming: this represents a threat to all, and many companies are instituting programs to reduce their carbon footprint. While true that conferencing solutions can help address this goal, we do not believe that environmental issues have yet become a real driver for the purchase of these solutions. Instead, they are a side benefit.
• Generation Z: HR executives are aware that the new generation entering the workforce has grown up with the Internet, chat, YouTube, and other rich media communications tools. The millennial generation will expect interactive, rich media collaboration tools to be available to them at work.
• The Economy: organizations of all types are looking to cut costs, particularly travel costs; be more efficient; reduce time to market; and speed decision making.
• Globalization: many companies find themselves needing to communicate effectively with staff, customers, partners, and suppliers around the world.
-20%-10%
0%10%20%30%40%50%
Q1/04 Q1/05 Q1/06 Q1/07 Q1/08 Q1/09
Year over Year Growth Rates: Worldwide Units
Revenue Units
Rich Media Conferencing 2009 Volume 2: Enterprise Videoconferencing
© 2009 Wainhouse Research LLC Page - 7
• Business Continuity Planning: executives and managers are increasingly concerned about how they can keep their teams functioning if their employees cannot come to work for any of a variety of reasons including H1N1, man-made or natural disasters, or an energy crisis.
• Cisco-IBM-Microsoft: these three companies have done much to generate interest in the space and demand for conferencing solutions by convincing C-level executives that they can run their organizations more efficiently with advanced conferencing and collaboration solutions.
• Equipment price/performance: today’s videoconferencing solutions provide higher performance at lower cost. Many customers and prospects are only now realizing that videoconferencing today is not like it was just a few years ago
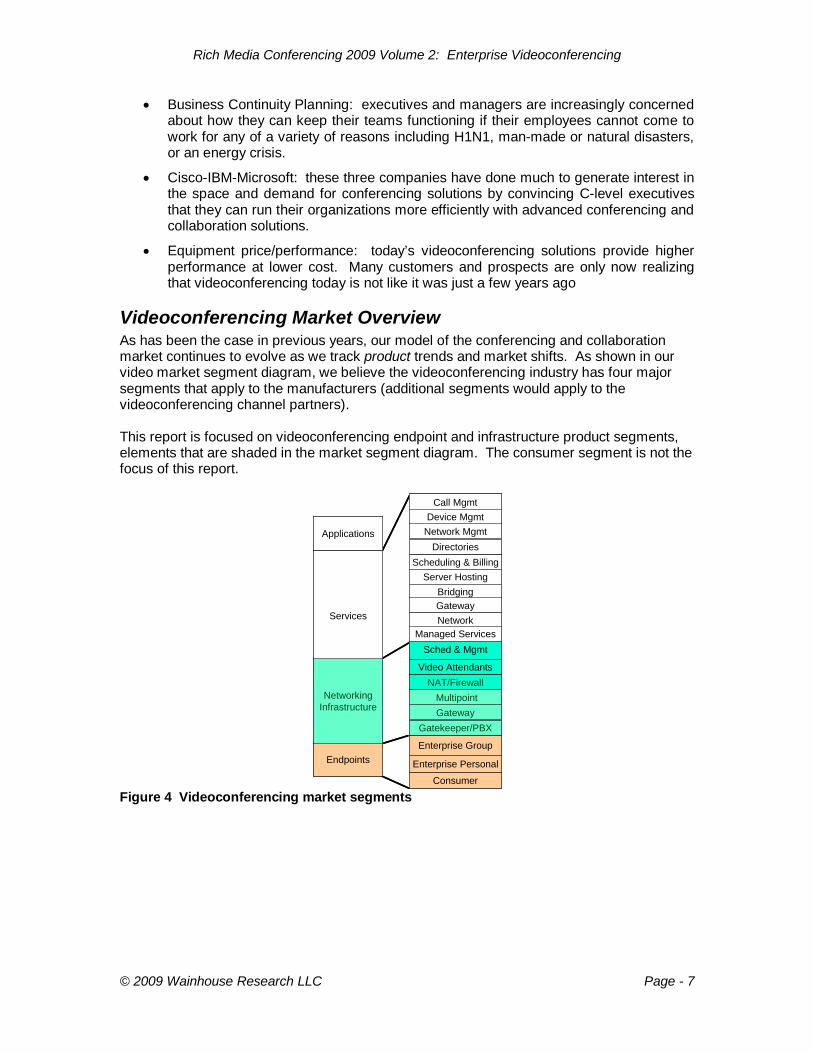
Videoconferencing Market Overview As has been the case in previous years, our model of the conferencing and collaboration market continues to evolve as we track product trends and market shifts. As shown in our video market segment diagram, we believe the videoconferencing industry has four major segments that apply to the manufacturers (additional segments would apply to the videoconferencing channel partners). This report is focused on videoconferencing endpoint and infrastructure product segments, elements that are shaded in the market segment diagram. The consumer segment is not the focus of this report.
Figure 4 Videoconferencing market segments
Enterprise Group
Enterprise Personal
Consumer
Call MgmtDevice Mgmt
Network MgmtDirectories
Scheduling & BillingServer Hosting
BridgingGatewayNetwork
Video Attendants
GatewayGatekeeper/PBX
MultipointNAT/Firewall
Endpoints
Services
Applications
Sched & MgmtManaged Services
NetworkingInfrastructure
Enterprise Group
Enterprise Personal
Consumer
Call MgmtDevice Mgmt
Network MgmtDirectories
Scheduling & BillingServer Hosting
BridgingGatewayNetwork
Video Attendants
GatewayGatekeeper/PBX
MultipointNAT/Firewall
Endpoints
Services
Applications
Sched & MgmtManaged Services
NetworkingInfrastructure

Rich Media Conferencing 2009 Volume 2: Enterprise Videoconferencing
Page - 8 © 2009 Wainhouse Research LLC
Multi-Codec
PC Desktop
Videophones
Executive
Single-Codec / Room-Based
GROUP
PERSONAL
Telepresence
Videoconferencing
MeetingRooms
Meeting Rooms / Offices
ConsumerHomes
ENTERPRISE
HOME
Offices
Experience Segments / Products Location
Figure 5 Group and personal videoconferencing endpoint segments
Enterprise Group Products We have revised our definition of the enterprise group product segments to include multi-codec and single-codec systems, as well as the all-in-one executive desktops. Rather than engage in a never-ending philosophical debate about which systems are actually telepresence systems, we have defined telepresence as an experience instead of a product or solution. We believe that a telepresence experience can be delivered by a variety of hardware types. It is worth noting that the major vendors have yet to fully embrace our definition. Hence, Telepresence is an experience based on videoconferencing that gives participants the feeling that they are physically in the same space as the remote participants. In order to provide the telepresence effect, systems must: a) provide life-size images of the face and upper body of the remote participants b) maintain the proper visual positioning and proximity perspective that allows the remote participants to appear to be sitting on the other side of a conference room table c) provide high quality audio and video Telepresence-capable systems generally cost from $80 to $500k per system and are often deployed in rooms where lighting and sound are carefully controlled.
Enterprise Personal Products Enterprise personal conferencing systems are products intended for single-person use. These are often dubbed “desktop videoconferencing” or DVC solutions, and we use all three terms interchangeably. There are four types of endpoints in this market segment: videophone appliances, executive system appliances, PC-based client-client software, and PC-based client-server software. Because the executive systems are relatively expensive and flow into both personal and group applications, and because the vendors report their data that way, we have chosen to track them as part of the group market statistics.
Videoconferencing Infrastructure Today, the vast majority of videoconferencing deployments are taking place on IP networks. Over the years, vendors have developed comprehensive suites of infrastructure products to support both videoconferencing in general, and specifically video over IP. The infrastructure
Rich Media Conferencing 2009 Volume 2: Enterprise Videoconferencing
© 2009 Wainhouse Research LLC Page - 9
market segment is also dynamic. Recently added solutions / capabilities include support for high definition video, the ability to host and manage multi-codec sessions, configurable video attendants, and automated streaming/archiving appliances. This report provides a forecast for the video infrastructure elements as well as a window into the regional breakdown.
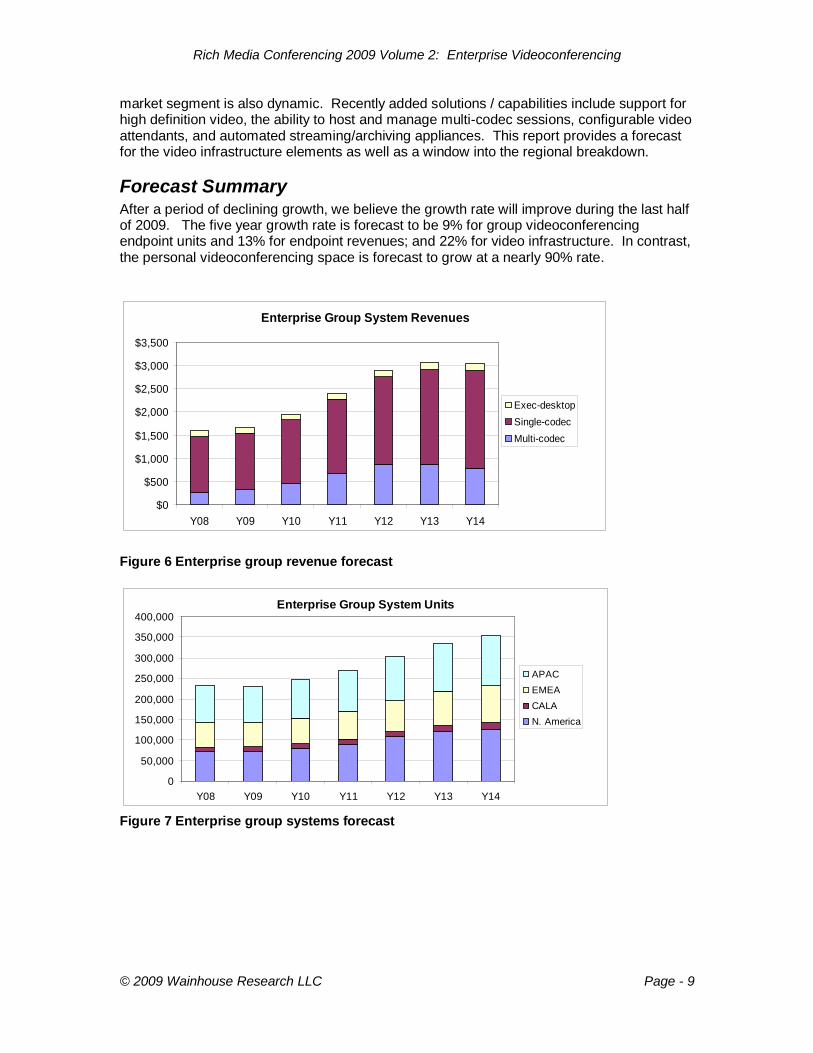
Forecast Summary After a period of declining growth, we believe the growth rate will improve during the last half of 2009. The five year growth rate is forecast to be 9% for group videoconferencing endpoint units and 13% for endpoint revenues; and 22% for video infrastructure. In contrast, the personal videoconferencing space is forecast to grow at a nearly 90% rate.
Figure 6 Enterprise group revenue forecast
Figure 7 Enterprise group systems forecast
Enterprise Group System Revenues
$0
$500
$1,000
$1,500
$2,000
$2,500
$3,000
$3,500
Y08 Y09 Y10 Y11 Y12 Y13 Y14
Exec-desktopSingle-codecMulti-codec
Enterprise Group System Units
0
50,000
100,000
150,000
200,000
250,000
300,000
350,000
400,000
Y08 Y09 Y10 Y11 Y12 Y13 Y14
APACEMEACALAN. America
Rich Media Conferencing 2009 Volume 2: Enterprise Videoconferencing
Page - 10 © 2009 Wainhouse Research LLC
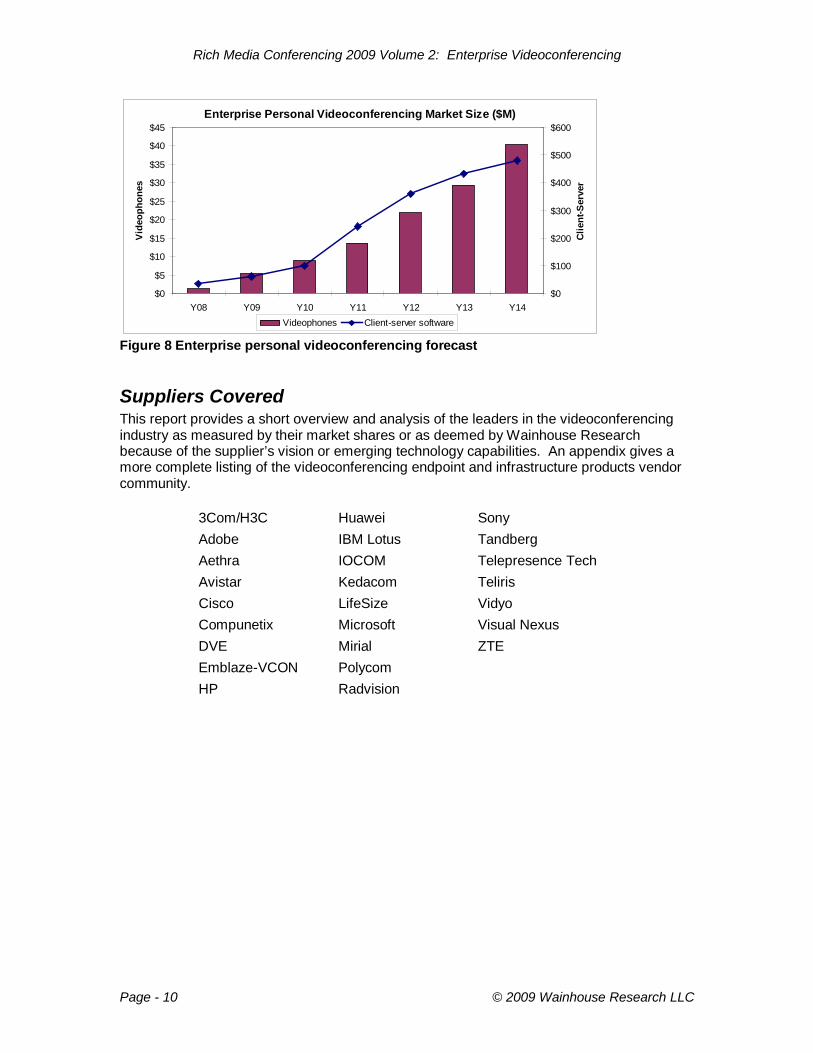
Figure 8 Enterprise personal videoconferencing forecast
Suppliers Covered This report provides a short overview and analysis of the leaders in the videoconferencing industry as measured by their market shares or as deemed by Wainhouse Research because of the supplier’s vision or emerging technology capabilities. An appendix gives a more complete listing of the videoconferencing endpoint and infrastructure products vendor community.
3Com/H3C Huawei Sony Adobe IBM Lotus Tandberg Aethra IOCOM Telepresence Tech Avistar Kedacom Teliris Cisco LifeSize Vidyo Compunetix Microsoft Visual Nexus DVE Mirial ZTE Emblaze-VCON Polycom HP Radvision
Enterprise Personal Videoconferencing Market Size ($M)
$0
$5
$10
$15
$20
$25
$30
$35
$40
$45
Y08 Y09 Y10 Y11 Y12 Y13 Y14
Vide
opho
nes
$0
$100
$200
$300
$400
$500
$600
Clie
nt-S
erve
r
Videophones Client-server software


![F] F] IYæ— F] ECO F] @ ) RMC-HP2K RMC-HP3KD/RMC-HP3K RMC-HP3 MITSIBISHI @ (Blffi) ...](https://static.fdocuments.in/doc/165x107/5ae590b77f8b9a8b2b8c0615/f-f-iy-f-eco-f-rmc-hp2k-rmc-hp3kdrmc-hp3k-rmc-hp3-mitsibishi-blffi.jpg)