WP1201ska Financial Crisis Investigation - Economic … · crisis has been a transformative moment...
34
No. 2012/01 March 2012 Rabobank Working Paper Series Titel Author: Shahin Kamalodin The views expressed in this paper are his own and not necessarily those of Rabobank Contact: [email protected] Editors: Wim Boonstra, chief economist Allard Bruinshoofd, head of International Economic Research Hans Visser, Professor Emeritus of International Economics (Vrije Universiteit Amsterdam) Joke Mooij, Company historian Financial Crisis Investigation What were the causes of the global financial crisis in 2008/09?
Transcript of WP1201ska Financial Crisis Investigation - Economic … · crisis has been a transformative moment...
No. 2012/01 March 2012
Rabobank Working Paper Series
Titel
Author: Shahin Kamalodin
The views expressed in this paper are his own and not necessarily those of Rabobank
Contact: [email protected]
Editors:
Wim Boonstra, chief economist
Allard Bruinshoofd, head of International Economic Research
Hans Visser, Professor Emeritus of International Economics (Vrije Universiteit Amsterdam)
Joke Mooij, Company historian
Financial Crisis Investigation What were the causes of the global financial crisis in 2008/09?
2
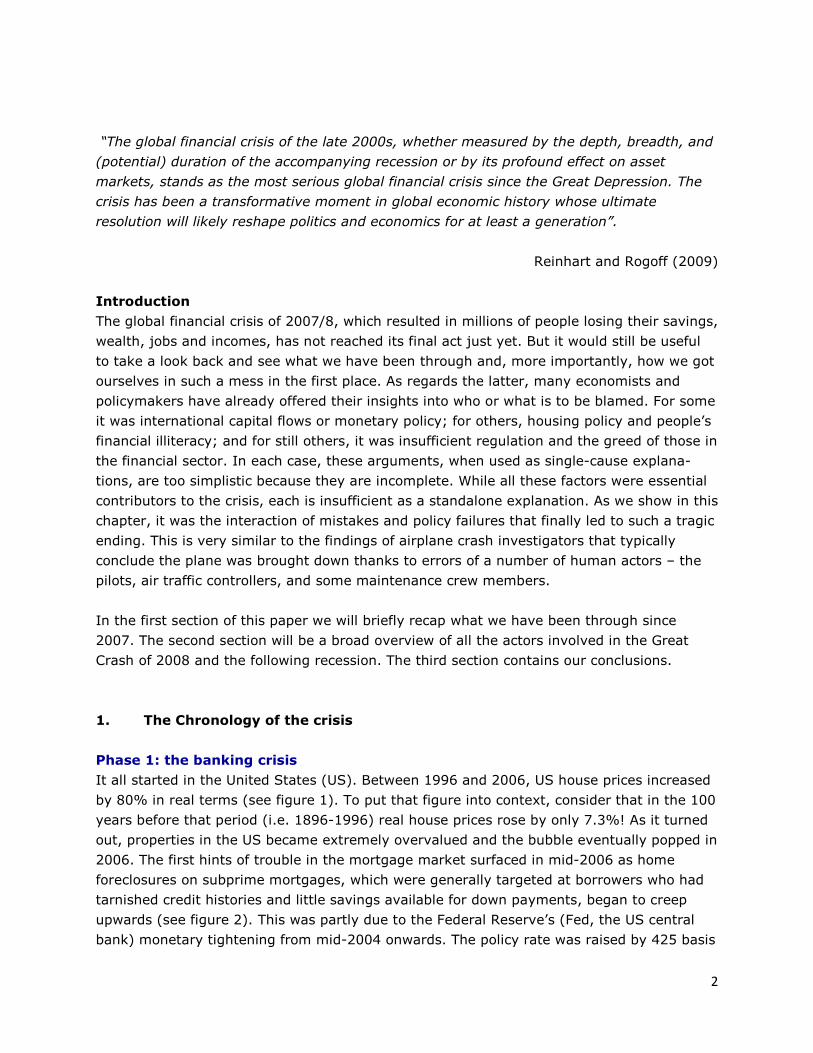
“The global financial crisis of the late 2000s, whether measured by the depth, breadth, and
(potential) duration of the accompanying recession or by its profound effect on asset
markets, stands as the most serious global financial crisis since the Great Depression. The
crisis has been a transformative moment in global economic history whose ultimate
resolution will likely reshape politics and economics for at least a generation”.
Reinhart and Rogoff (2009)
Introduction
The global financial crisis of 2007/8, which resulted in millions of people losing their savings,
wealth, jobs and incomes, has not reached its final act just yet. But it would still be useful
to take a look back and see what we have been through and, more importantly, how we got
ourselves in such a mess in the first place. As regards the latter, many economists and
policymakers have already offered their insights into who or what is to be blamed. For some
it was international capital flows or monetary policy; for others, housing policy and people’s
financial illiteracy; and for still others, it was insufficient regulation and the greed of those in
the financial sector. In each case, these arguments, when used as single-cause explana-
tions, are too simplistic because they are incomplete. While all these factors were essential
contributors to the crisis, each is insufficient as a standalone explanation. As we show in this
chapter, it was the interaction of mistakes and policy failures that finally led to such a tragic
ending. This is very similar to the findings of airplane crash investigators that typically
conclude the plane was brought down thanks to errors of a number of human actors – the
pilots, air traffic controllers, and some maintenance crew members.
In the first section of this paper we will briefly recap what we have been through since
2007. The second section will be a broad overview of all the actors involved in the Great
Crash of 2008 and the following recession. The third section contains our conclusions.
1. The Chronology of the crisis
Phase 1: the banking crisis
It all started in the United States (US). Between 1996 and 2006, US house prices increased
by 80% in real terms (see figure 1). To put that figure into context, consider that in the 100
years before that period (i.e. 1896-1996) real house prices rose by only 7.3%! As it turned
out, properties in the US became extremely overvalued and the bubble eventually popped in
2006. The first hints of trouble in the mortgage market surfaced in mid-2006 as home
foreclosures on subprime mortgages, which were generally targeted at borrowers who had
tarnished credit histories and little savings available for down payments, began to creep
upwards (see figure 2). This was partly due to the Federal Reserve’s (Fed, the US central
bank) monetary tightening from mid-2004 onwards. The policy rate was raised by 425 basis

3
points to 5.25% in just two years. Since many mortgages granted in 2005 and 2006 had
up-front ‘teaser rates’ (i.e. interest rates were low for a very short period to attract
borrowers), they were being reset at much higher levels.
Figure 1: US real house prices (1890=100) Figure 2: Home foreclosures in the US
40
60
80
100
120
140
160
180
200
40
60
80
100
120
140
160
180
200
Index Index
Growth = 7.3%
Growth = 80%
Source: Robert Shiller dataset
0
5
10
15
20
25
30
0
5
10
15
20
25
30
99 00 01 02 03 04 05 06 07 08 09 10
Prime mortgages
Subprime mortgages
Subprime (adjustable rate) mortgages
% of residential
mortgage loans
% of residential
mortgage loans
Source: IMF
The first bank to acknowledge losses on its subprime loan portfolio was HSBC (the largest
subprime lender in the US), which announced on February 22, 2007 that it had lost USD
10.5 billion. A month later, US subprime lender Accredited Home Lenders sold USD 2.7
billion worth of subprime loans at a heavy discount. This prompted the New York Attorney
General to open an investigation into subprime lending. In May 2007, GMAC, the finance
arm of General Motors, reported losses amounting to USD 1 billion. Meanwhile, UBS decided
to close its US subprime business. Later that month, rating agencies issued comprehensive
rating downgrades and credit watch warnings on an array of residential mortgage–backed
securities. This, in turn, led to a deterioration in the prices of mortgage-related products in
the financial markets. But it was not until the USD 3.2 billion injection of funds by Bear
Stearns into two of its hedge funds1 (June 22, 2007) that international investors took note
of the growing troubles in the US subprime mortgage market. Figure 3 clearly demonstrates
that the interest in the word ‘subprime crisis’ in the Google search engine only started from
this period. Interestingly, the broader repercussions from the declining housing market were
still not clear to the US authorities. ‘I don’t think [the subprime mess] poses any threat to
the overall economy’, Treasury Secretary Henry Paulson told Bloomberg on July 26, 2007
(FCIC, 2011).
As we now know, this event was just the tip of a very large iceberg. In July 2007, amid
widespread concern about how to value complex structured finance products and an erosion
1 The funds were suffering from falling CDO prices (amid difficulty meeting margin calls) and were shuttered within
a month after losing over 90% of their value (Acharya et al., 2010).

4
of confidence in the reliability of ratings given by the rating agencies, the market for short-
term asset-backed corporate paper (ABCP)2 began to dry up (see figure 4). There was, in
fact, a complete re-pricing of all credit instruments. Credit spreads on investment grade
bonds, high yield bonds, leverage loans, CDOs backed by commercial and subprime
mortgages all began to widen.
Figure 3: Google trend Figure 4: ABCP market started shrinking in 2007
0
5
10
15
20
25
30
0
2
4
6
8
10
12
14
Subprime crisis (l) Economic crisis (l) Debt crisis (r)
Index, avg=1 Index, avg=1
Interpretation: if value is 5, this means the search
traffic in google.com for the given term is 5 times the average.
Terms searched:
Source: Google
0
200
400
600
800
1000
1200
1400
0
200
400
600
800
1000
1200
1400
01 02 03 04 05 06 07 08 09 10 11 12
Asset-backed corporate paper
USD bn USD bn
Source: Reuters EcoWin
IKB3, a small German bank, was the first European casualty of the crisis. Its conduit was
unable to roll-over ABCP and IKB proved unable to provide the promised credit line. By the
end of the month, American Home Mortgage Investment Corp. announced its inability to
fund lending obligations, and it subsequently declared bankruptcy on August 6. A day later,
the French bank BNP Paribas froze redemptions for three investment funds4, citing its
inability to value securitised products. This event informed investors that ABCPs and SIVs
were not necessarily safe short-term vehicles. As a result, the first ‘illiquidity wave’ on the
interbank market started as the increased opaqueness of bank balance sheets made it
difficult to separate healthy from unhealthy institutions. In response to the freezing up of
the interbank market, the European Central Bank (ECB) injected EUR 95 billion in overnight
credit into the market (August 9). The Fed followed suit, injecting USD 24 billion. But the
measures did not help much since liquidity provision could not enhance transparency. The
evaporation of confidence resulted in the simultaneous global freezing up of virtually all
wholesale capital markets, including the interbank markets (see figure 5), CDO markets,
markets for ABCP and markets for all but the very best mortgage-backed securities (MBS)
2 The financial markets’ jargon is explained in the end of this piece. 3 Since its foundation in 1924, IKB had focused on lending to midsize German businesses (Mittelstand), but in the
past decade, management diversified. In 2002, IKB purchased a portfolio of structured finance securities. It made
money by using less expensive short-term commercial paper to purchase higher-yielding long-term structured fi-
nance products. 4 Total assets in those funds were USD 2.2 billion, with a third of that amount in subprime securities rated AA or
higher.
5
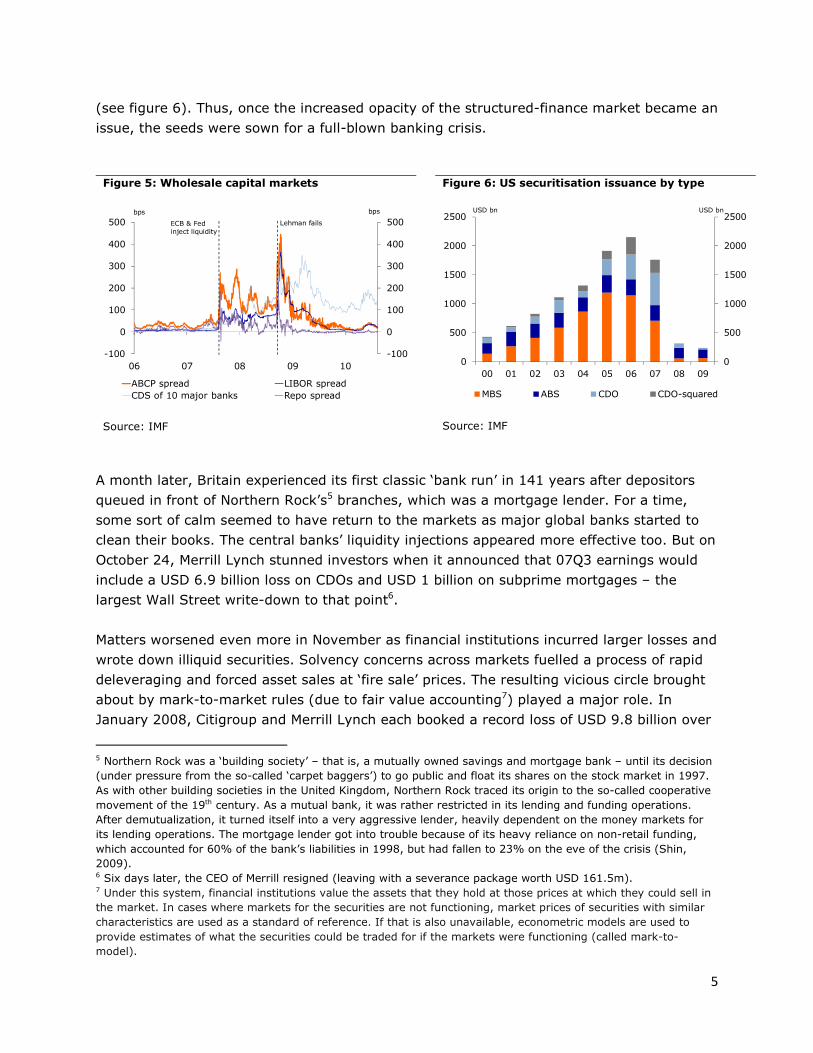
(see figure 6). Thus, once the increased opacity of the structured-finance market became an
issue, the seeds were sown for a full-blown banking crisis.
Figure 5: Wholesale capital markets Figure 6: US securitisation issuance by type
-100
0
100
200
300
400
500
-100
0
100
200
300
400
500
06 07 08 09 10
ABCP spread LIBOR spread
CDS of 10 major banks Repo spread
bps bps
ECB & Fed
inject liquidity
Lehman fails
Source: IMF
0
500
1000
1500
2000
2500
0
500
1000
1500
2000
2500
00 01 02 03 04 05 06 07 08 09
MBS ABS CDO CDO-squared
USD bn USD bn
Source: IMF
A month later, Britain experienced its first classic ‘bank run’ in 141 years after depositors
queued in front of Northern Rock’s5 branches, which was a mortgage lender. For a time,
some sort of calm seemed to have return to the markets as major global banks started to
clean their books. The central banks’ liquidity injections appeared more effective too. But on
October 24, Merrill Lynch stunned investors when it announced that 07Q3 earnings would
include a USD 6.9 billion loss on CDOs and USD 1 billion on subprime mortgages – the
largest Wall Street write-down to that point6.
Matters worsened even more in November as financial institutions incurred larger losses and
wrote down illiquid securities. Solvency concerns across markets fuelled a process of rapid
deleveraging and forced asset sales at ‘fire sale’ prices. The resulting vicious circle brought
about by mark-to-market rules (due to fair value accounting7) played a major role. In
January 2008, Citigroup and Merrill Lynch each booked a record loss of USD 9.8 billion over
5 Northern Rock was a ‘building society’ – that is, a mutually owned savings and mortgage bank – until its decision
(under pressure from the so-called ‘carpet baggers’) to go public and float its shares on the stock market in 1997.
As with other building societies in the United Kingdom, Northern Rock traced its origin to the so-called cooperative
movement of the 19th century. As a mutual bank, it was rather restricted in its lending and funding operations.
After demutualization, it turned itself into a very aggressive lender, heavily dependent on the money markets for
its lending operations. The mortgage lender got into trouble because of its heavy reliance on non-retail funding,
which accounted for 60% of the bank’s liabilities in 1998, but had fallen to 23% on the eve of the crisis (Shin,
2009). 6 Six days later, the CEO of Merrill resigned (leaving with a severance package worth USD 161.5m). 7 Under this system, financial institutions value the assets that they hold at those prices at which they could sell in
the market. In cases where markets for the securities are not functioning, market prices of securities with similar
characteristics are used as a standard of reference. If that is also unavailable, econometric models are used to
provide estimates of what the securities could be traded for if the markets were functioning (called mark-to-
model).
6
the fourth quarter of 2007 after writing down USD 18 billion and USD 17 billion of assets,
respectively. Almost a month later, ING wrote down USD 1 billion of its US mortgage-
related assets.
In early March 2008, events (such as the bankruptcy of Carlyle Capital, a hedge fund) put
pressure on Bear Stearns, which was a prime candidate; it was the smallest of the major
investment banks, had the most leverage, and was exposed quite significantly to the
subprime mortgage market (Acharya et al. 2010). During the course of a weekend,
JPMorgan Chase & Co. acquired Bear Stearns for USD 2 per share (ultimately increased to
USD 10) after the Fed decided to guarantee USD 30 billion of Bear Stearns’ toxic assets. By
comparison, Bear’s shares had traded at around USD 150 less than a year before and USD
60 just a week before. The rescue of Bear Stearns was a relief for the markets as it was a
major player in the USD 2.5 trillion repo market, as well as being the leading prime broker
on Wall Street to hedge funds and a significant participant in the credit default swap (CDS)
market. Stocks rallied once the news broke and banks got a chance once again to repair
their balance sheets.
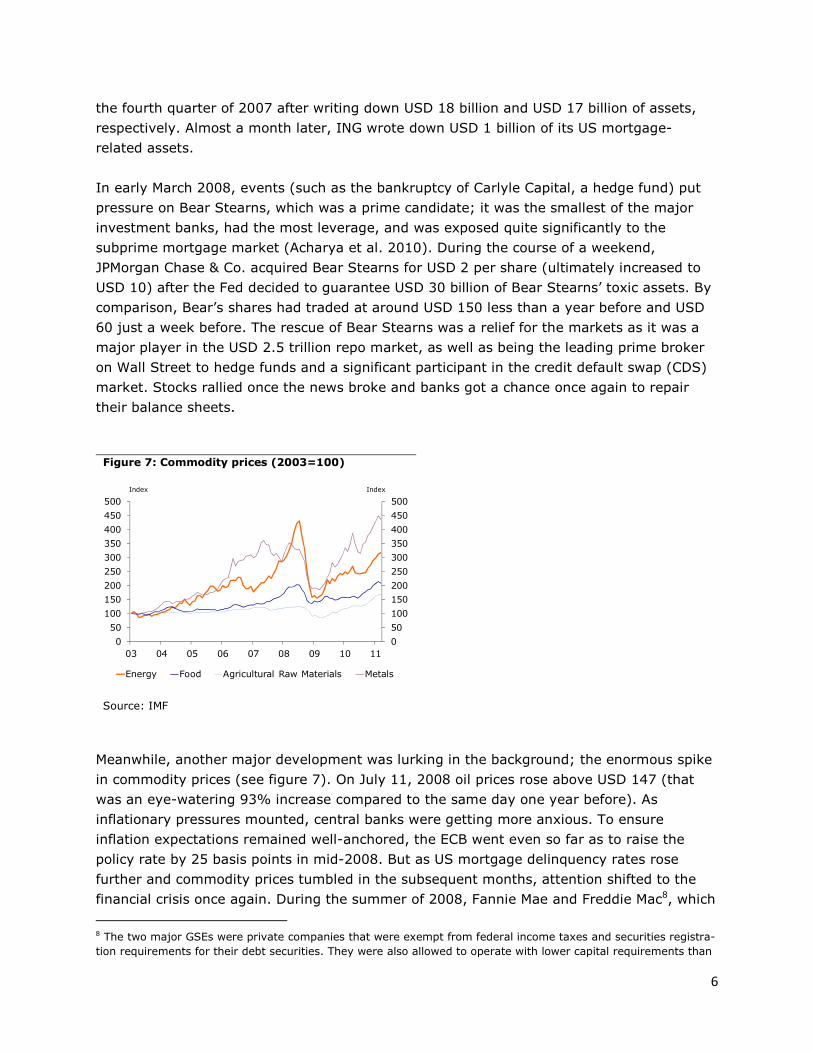
Figure 7: Commodity prices (2003=100)
0
50
100
150
200
250
300
350
400
450
500
0
50
100
150
200
250
300
350
400
450
500
03 04 05 06 07 08 09 10 11
Energy Food Agricultural Raw Materials Metals
Index Index
Source: IMF
Meanwhile, another major development was lurking in the background; the enormous spike
in commodity prices (see figure 7). On July 11, 2008 oil prices rose above USD 147 (that
was an eye-watering 93% increase compared to the same day one year before). As
inflationary pressures mounted, central banks were getting more anxious. To ensure
inflation expectations remained well-anchored, the ECB went even so far as to raise the
policy rate by 25 basis points in mid-2008. But as US mortgage delinquency rates rose
further and commodity prices tumbled in the subsequent months, attention shifted to the
financial crisis once again. During the summer of 2008, Fannie Mae and Freddie Mac8, which
8 The two major GSEs were private companies that were exempt from federal income taxes and securities registra-
tion requirements for their debt securities. They were also allowed to operate with lower capital requirements than
7
were two publicly traded but government-sponsored enterprises (GSEs) that securitised a
large fraction of US mortgages and had about USD 1.5 trillion in bonds outstanding, got into
financial trouble. Eventually, both firms were brought into Federal conservatorship on
September 7, 2008.
At the same time, Lehman Brothers – the fourth largest US investment bank at the time
with over USD 600 billion in assets and 25,000 employees – came under severe financial
stress. By the end of 2007, Lehman had amassed USD 111 billion in commercial and
residential real estate holdings and securities, which was more than four times its total
equity (FCIC, 2011). As it became clear that the Korea Development Bank would not buy
the firm (September 9), shares of Lehman plunged by 45%. The Fed convened a weekend
meeting with all major banks’ most senior executives on September 12–14 to secure the
future of Lehman. Initially, Barclays and Bank of America (BoA) were named as possible
suitors. However, they both refused to take over Lehman without a government guarantee.
The US Treasury and Fed officials decided, however, not to offer a guarantee. This gave
Lehman no option but to declare bankruptcy9 early Monday morning (September 15, 2008).
On the same day, investors read on the newswires that Merrill Lynch had been purchased
by BoA for USD 50 billion. The bankruptcy of Lehman sent shockwaves throughout the
global financial markets as the shared belief that no systemically relevant bank would be
allowed to go bust was proven false. What’s more, when Lehman failed, it had close to one
million derivatives contracts on its books with hundreds of financial firms. As such, there
was a colossal amount of uncertainty in the marketplace as to how the counterparties of
these contracts would be affected. The contagion effect led to a surge in systemic risk and
global stock markets plummeted as a result. Meanwhile, interbank spreads and volatility in
the financial markets went through the roof causing a massive tightening in financial
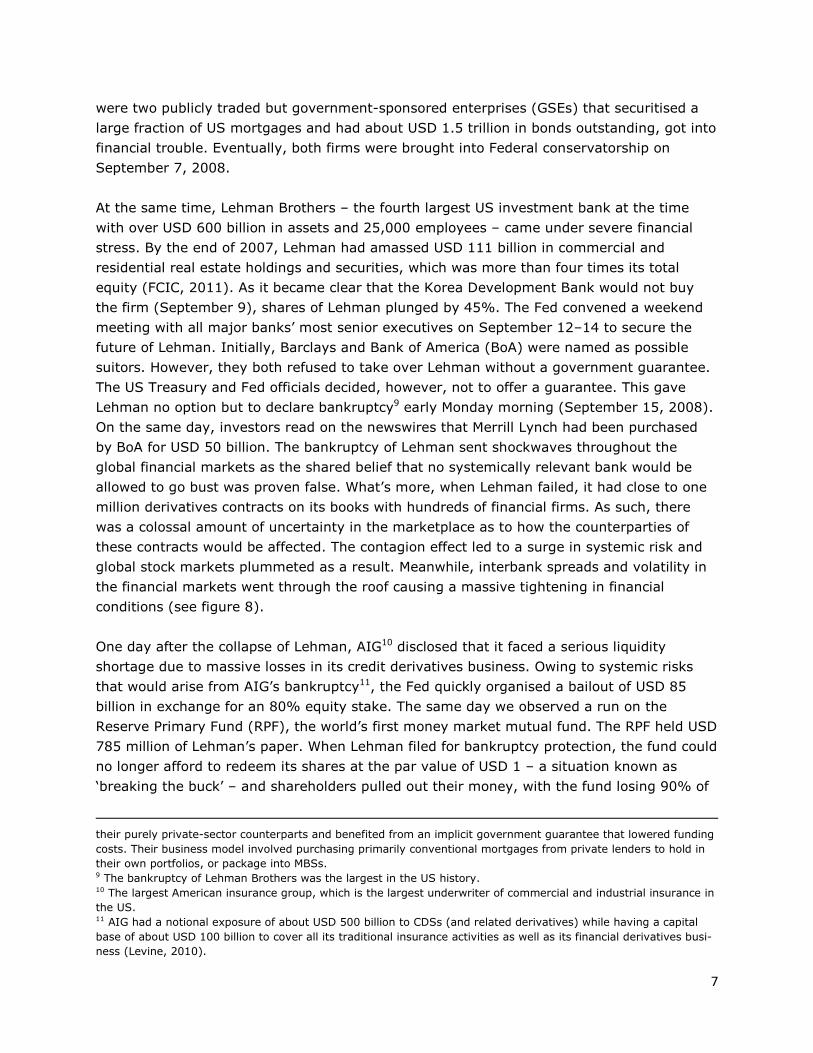
conditions (see figure 8).
One day after the collapse of Lehman, AIG10 disclosed that it faced a serious liquidity
shortage due to massive losses in its credit derivatives business. Owing to systemic risks
that would arise from AIG’s bankruptcy11, the Fed quickly organised a bailout of USD 85
billion in exchange for an 80% equity stake. The same day we observed a run on the
Reserve Primary Fund (RPF), the world’s first money market mutual fund. The RPF held USD
785 million of Lehman’s paper. When Lehman filed for bankruptcy protection, the fund could
no longer afford to redeem its shares at the par value of USD 1 – a situation known as
‘breaking the buck’ – and shareholders pulled out their money, with the fund losing 90% of
their purely private-sector counterparts and benefited from an implicit government guarantee that lowered funding
costs. Their business model involved purchasing primarily conventional mortgages from private lenders to hold in
their own portfolios, or package into MBSs. 9 The bankruptcy of Lehman Brothers was the largest in the US history. 10 The largest American insurance group, which is the largest underwriter of commercial and industrial insurance in
the US. 11 AIG had a notional exposure of about USD 500 billion to CDSs (and related derivatives) while having a capital
base of about USD 100 billion to cover all its traditional insurance activities as well as its financial derivatives busi-
ness (Levine, 2010).
8
its assets. A run on money market funds followed. Even those with no direct Lehman
exposure were hit hard. By the middle of the following week, prime money market mutual
fund investors had withdrawn USD 350 billion (FCIC, 2011). In turn, this run exerted further
pressure on the banks given that a significant amount of their funding was coming from
commercial paper and certificates of deposits held by money market mutual funds.
Figure 8: Financial conditions
-3
-2
-1
0
1
2
3
-3
-2
-1
0
1
2
3
03 04 05 06 07 08 09 10 11 12
US UK Eurozone
Index IndexThe Rabo Financial Conditions Index (RFCI)
(standard deviations from average; all indicators carry equal weight)
Tightening conditions
RFCI incorporates: • TED spread (interbank rate minus T-bill rate - 3m)
• Swap spread (swap rate minus gov. bond yield - 10yr)• Corporate bond spread (yield on BBB-rated firms over gov. bonds - 10yr)
• Stock exchange (S&P500, FTSE100, ESTOXX50)• Trade-weighted exchange rate
Source: Reuters EcoWin, Rabobank
In a desperate attempt to stave off a depression-like scenario, the US Treasury Secretary,
Hank Paulson, and the Fed Chairman, Ben Bernanke, delivered their Troubled Asset Relief
Programme (TARP) in an infamous three-page document to the US Congress on September
19, 2008. In its original form, the TARP would have authorised the Treasury to spend USD
700 billion purchasing subprime mortgage assets from troubled financial institutions without
any accountability to the Congress. Unsurprisingly, the Congress voted down the bill on
September 29. On the same day, Washington Mutual (WaMu), the largest US savings bank,
was placed in receivership by the Federal Deposit Insurance Corporation (FDIC), and then
sold to JPMorgan Chase & Co. Consequently, stock markets crashed worldwide with the Dow
Jones Industrial Average falling by 777.6 points (or 7%) – the biggest point-drop since
records began (1896). Eventually the TARP bill was passed12 on October 3, but passage
required numerous ‘Christmas-tree’ provisions such as a tax break for makers of toy
wooden arrows (Mishkin, 2010). Note that the TARP was subsequently used to inject capital
into financial institutions, thereby shoring up their balance sheets more directly.
The enormous amount of uncertainty in late September and early October sent the financial
markets into a tailspin. In the following months the interbank market remained shut,
meaning that banks with liquidity shortages were fully dependent on the central banks for
12 As of September 2010 – two years after TARP’s creation.– Treasury had allocated USD 395 billion of the USD
700 billion authorised. Of that amount, USD 204 billion had been repaid, USD 185 billion remained outstanding,
and USD 3.9 billion in losses had been incurred (FCIC, 2011).
9
liquidity. At this stage of the crisis, the US was not the only country facing a banking crisis.
According to the dataset provided by Reinhart and Rogoff (2010) and Laeven and Valencia
(2010), 15 advanced countries, including the US, experienced a banking crisis in 200813. In
other words, only 8 countries in the industrialised world managed to avoid an outright
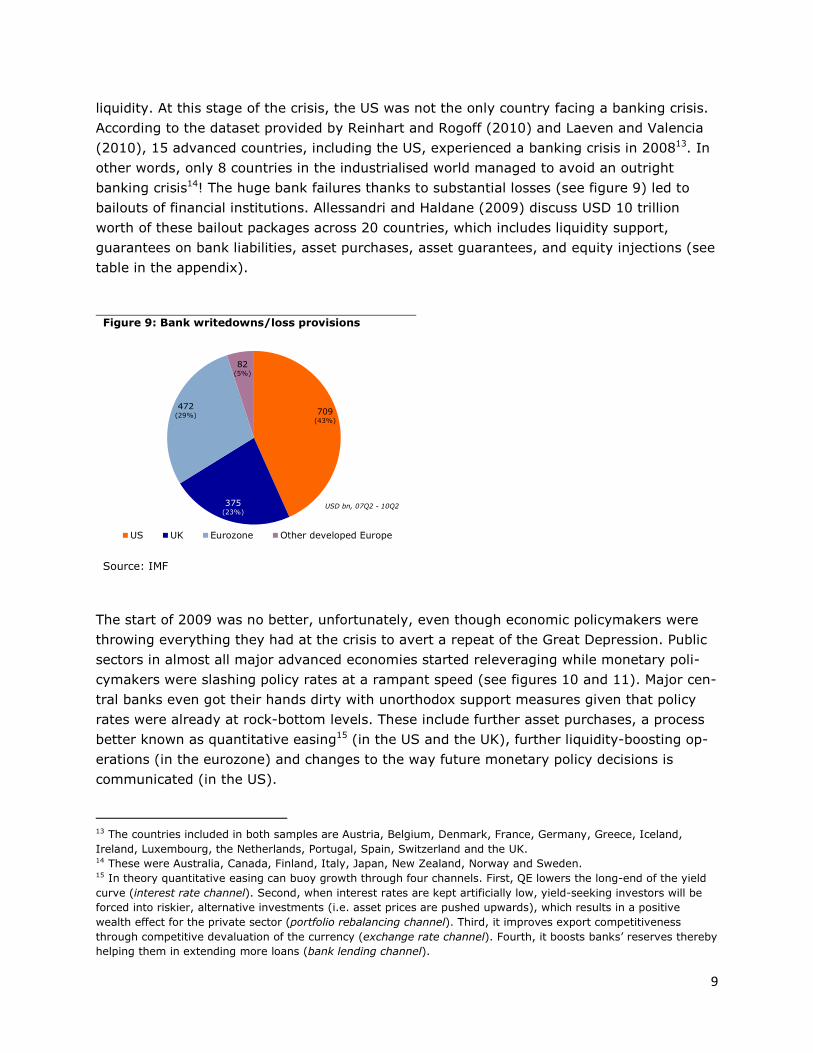
banking crisis14! The huge bank failures thanks to substantial losses (see figure 9) led to
bailouts of financial institutions. Allessandri and Haldane (2009) discuss USD 10 trillion
worth of these bailout packages across 20 countries, which includes liquidity support,
guarantees on bank liabilities, asset purchases, asset guarantees, and equity injections (see
table in the appendix).
Figure 9: Bank writedowns/loss provisions
709(43%)
375(23%)
472(29%)
82(5%)
US UK Eurozone Other developed Europe
USD bn, 07Q2 - 10Q2
Source: IMF
The start of 2009 was no better, unfortunately, even though economic policymakers were
throwing everything they had at the crisis to avert a repeat of the Great Depression. Public
sectors in almost all major advanced economies started releveraging while monetary poli-
cymakers were slashing policy rates at a rampant speed (see figures 10 and 11). Major cen-
tral banks even got their hands dirty with unorthodox support measures given that policy
rates were already at rock-bottom levels. These include further asset purchases, a process
better known as quantitative easing15 (in the US and the UK), further liquidity-boosting op-
erations (in the eurozone) and changes to the way future monetary policy decisions is
communicated (in the US).
13 The countries included in both samples are Austria, Belgium, Denmark, France, Germany, Greece, Iceland,
Ireland, Luxembourg, the Netherlands, Portugal, Spain, Switzerland and the UK. 14 These were Australia, Canada, Finland, Italy, Japan, New Zealand, Norway and Sweden. 15 In theory quantitative easing can buoy growth through four channels. First, QE lowers the long-end of the yield
curve (interest rate channel). Second, when interest rates are kept artificially low, yield-seeking investors will be
forced into riskier, alternative investments (i.e. asset prices are pushed upwards), which results in a positive
wealth effect for the private sector (portfolio rebalancing channel). Third, it improves export competitiveness
through competitive devaluation of the currency (exchange rate channel). Fourth, it boosts banks’ reserves thereby
helping them in extending more loans (bank lending channel).

10
Figure 10: Fiscal policy turned expansionary… Figure 11: …similar to monetary policy
-2.5
-2.0
-1.5
-1.0
-0.5
0.0
0.5
1.0
1.5
-2.5
-2.0
-1.5
-1.0
-0.5
0.0
0.5
1.0
1.5
08 09 10 11
Advanced economies Emerging economies
% of GDP % of GDPFiscal impulse*
Fiscal tightening
*Defined as the change in the primary budget balance (cycl. adj., % of potential GDP)
Source: IMF
0
1
2
3
4
5
6
7
0
1
2
3
4
5
6
7
99 00 01 02 03 04 05 06 07 08 09 10 11 12
ECB BoE Fed
% %Monetary policy rates
Source: Reuters EcoWin
Phase 2: the economic crisis
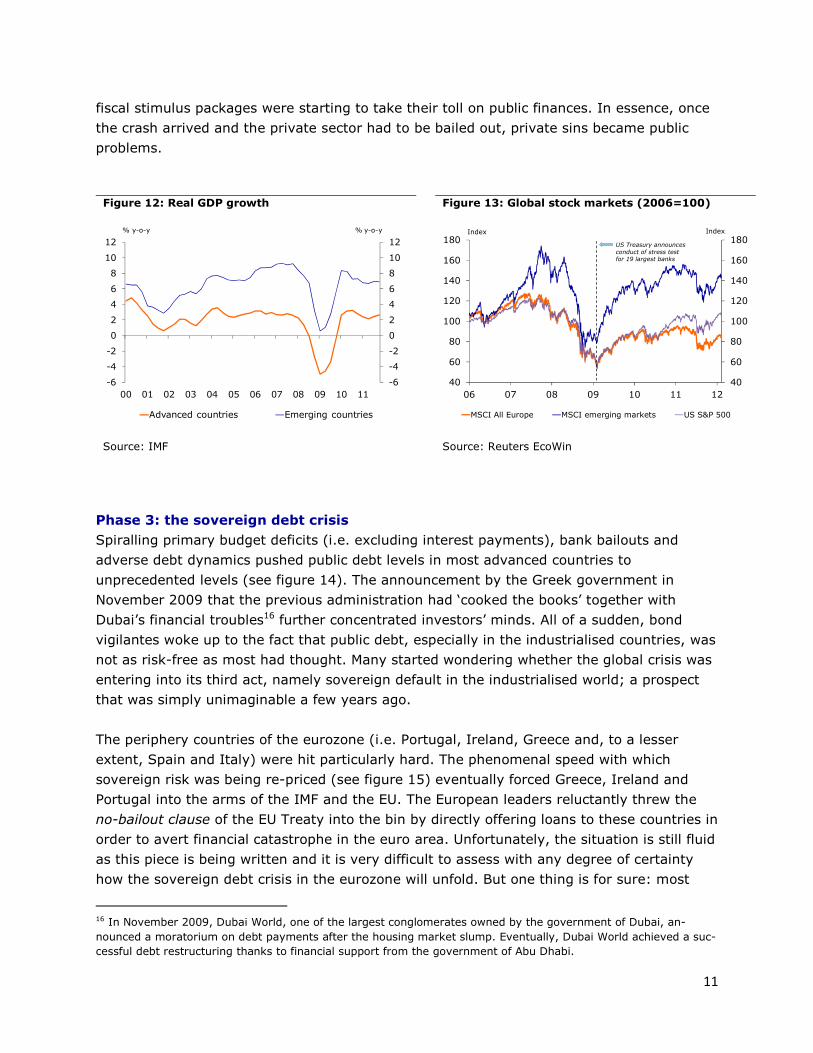
Regrettably, none of these measures managed to prevent the global economy from going
into free fall (see figure 12). From the bankruptcy of Lehman until March 2009 the global
economy entered the deepest recession since at least the 1930s. Tightening credit
conditions led to a sharp compression in consumer spending in most advanced countries.
With households deleveraging and net assets at historic lows, financial constraints imposed
by banks under stress in many countries directly translated into reduced consumer
spending, leading to declines in corporate sector profitability, layoffs and rising
unemployment, slowing economies and more foreclosures.
Banks continued to book heavy losses while governments took various measures to shore
up bank balance sheets (by ring-fencing their toxic assets and recapitalising them) and prop
up their economies. But it was not until the US stress tests, announced in February 2009,
that the financial markets decidedly turned the corner. The Treasury required the 19 largest
banking institutions to undergo stress tests to ensure that they had sufficient capital to
withstand adverse macroeconomic shocks. The results, published in early May 2009, were
very well received by market participants, allowing these institutions to raise substantial
amounts of capital from the private sector. In essence, the stress tests were a key factor
that helped increase the amount of information in the marketplace, thereby reducing
asymmetric information problems. Another helpful ingredient was the change in accounting
rules that allowed US banks to ignore the market value of their distressed assets.
Throughout 2009 calm was somewhat restored to the financial markets. Not only did stocks
rally (see figure 13) but risk premiums started falling too. However, the investors’ hope for
things getting back to ‘normal’ soon came to an end. This was because the severe economic
contraction combined with falling asset prices, shrinking financial sector profits and sizeable
11
fiscal stimulus packages were starting to take their toll on public finances. In essence, once
the crash arrived and the private sector had to be bailed out, private sins became public
problems.
Figure 12: Real GDP growth Figure 13: Global stock markets (2006=100)
-6
-4
-2
0
2
4
6
8
10
12
-6
-4
-2
0
2
4
6
8
10
12
00 01 02 03 04 05 06 07 08 09 10 11
Advanced countries Emerging countries
% y-o-y % y-o-y
Source: IMF
40
60
80
100
120
140
160
180
40
60
80
100
120
140
160
180
06 07 08 09 10 11 12
MSCI All Europe MSCI emerging markets US S&P 500
Index Index
US Treasury announces
conduct of stress test for 19 largest banks
Source: Reuters EcoWin
Phase 3: the sovereign debt crisis
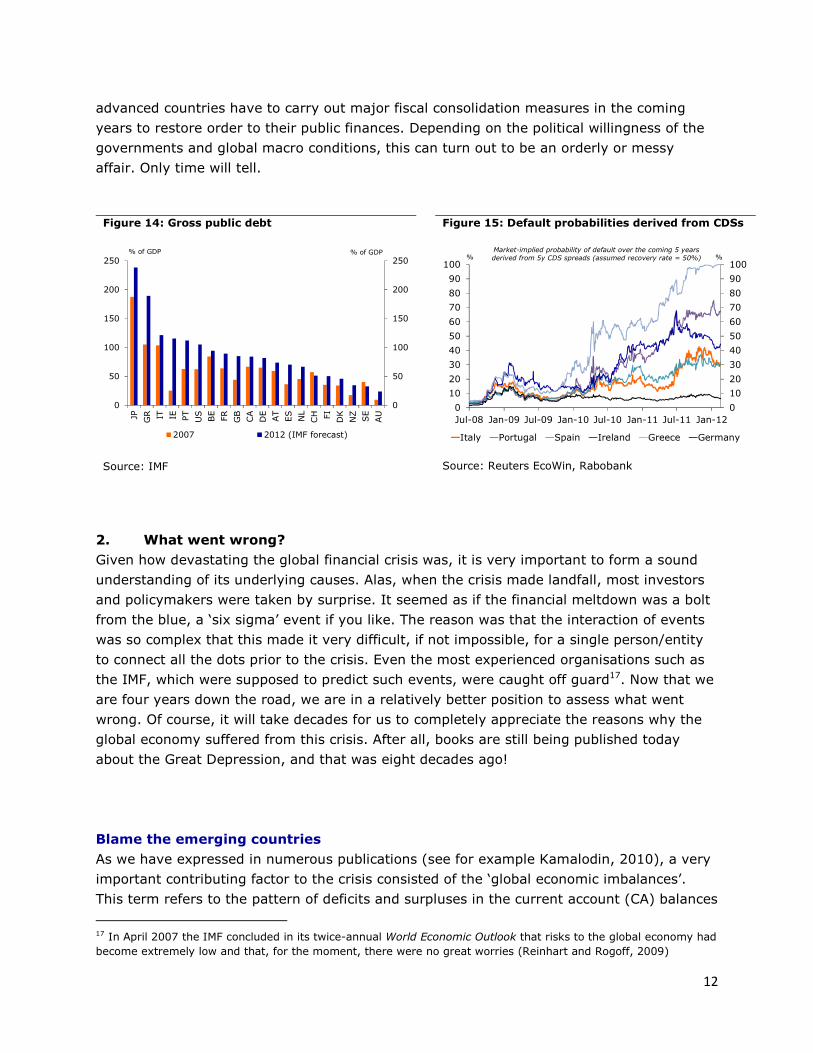
Spiralling primary budget deficits (i.e. excluding interest payments), bank bailouts and
adverse debt dynamics pushed public debt levels in most advanced countries to
unprecedented levels (see figure 14). The announcement by the Greek government in
November 2009 that the previous administration had ‘cooked the books’ together with
Dubai’s financial troubles16 further concentrated investors’ minds. All of a sudden, bond
vigilantes woke up to the fact that public debt, especially in the industrialised countries, was
not as risk-free as most had thought. Many started wondering whether the global crisis was
entering into its third act, namely sovereign default in the industrialised world; a prospect
that was simply unimaginable a few years ago.
The periphery countries of the eurozone (i.e. Portugal, Ireland, Greece and, to a lesser
extent, Spain and Italy) were hit particularly hard. The phenomenal speed with which
sovereign risk was being re-priced (see figure 15) eventually forced Greece, Ireland and
Portugal into the arms of the IMF and the EU. The European leaders reluctantly threw the
no-bailout clause of the EU Treaty into the bin by directly offering loans to these countries in
order to avert financial catastrophe in the euro area. Unfortunately, the situation is still fluid
as this piece is being written and it is very difficult to assess with any degree of certainty
how the sovereign debt crisis in the eurozone will unfold. But one thing is for sure: most
16 In November 2009, Dubai World, one of the largest conglomerates owned by the government of Dubai, an-
nounced a moratorium on debt payments after the housing market slump. Eventually, Dubai World achieved a suc-
cessful debt restructuring thanks to financial support from the government of Abu Dhabi.
12
advanced countries have to carry out major fiscal consolidation measures in the coming
years to restore order to their public finances. Depending on the political willingness of the
governments and global macro conditions, this can turn out to be an orderly or messy
affair. Only time will tell.
Figure 14: Gross public debt Figure 15: Default probabilities derived from CDSs
0
50
100
150
200
250
0
50
100
150
200
250
JP GR IT IE PT
US
BE
FR
GB
CA
DE
AT
ES
NL
CH FI
DK
NZ
SE
AU
2007 2012 (IMF forecast)
% of GDP % of GDP
Source: IMF
0
10
20
30
40
50
60
70
80
90
100
0
10
20
30
40
50
60
70
80
90
100
Jul-08 Jan-09 Jul-09 Jan-10 Jul-10 Jan-11 Jul-11 Jan-12
Italy Portugal Spain Ireland Greece Germany
% %Market-implied probability of default over the coming 5 years
derived from 5y CDS spreads (assumed recovery rate = 50%)
Source: Reuters EcoWin, Rabobank
2. What went wrong?
Given how devastating the global financial crisis was, it is very important to form a sound
understanding of its underlying causes. Alas, when the crisis made landfall, most investors
and policymakers were taken by surprise. It seemed as if the financial meltdown was a bolt
from the blue, a ‘six sigma’ event if you like. The reason was that the interaction of events
was so complex that this made it very difficult, if not impossible, for a single person/entity
to connect all the dots prior to the crisis. Even the most experienced organisations such as
the IMF, which were supposed to predict such events, were caught off guard17. Now that we
are four years down the road, we are in a relatively better position to assess what went
wrong. Of course, it will take decades for us to completely appreciate the reasons why the
global economy suffered from this crisis. After all, books are still being published today
about the Great Depression, and that was eight decades ago!
Blame the emerging countries
As we have expressed in numerous publications (see for example Kamalodin, 2010), a very
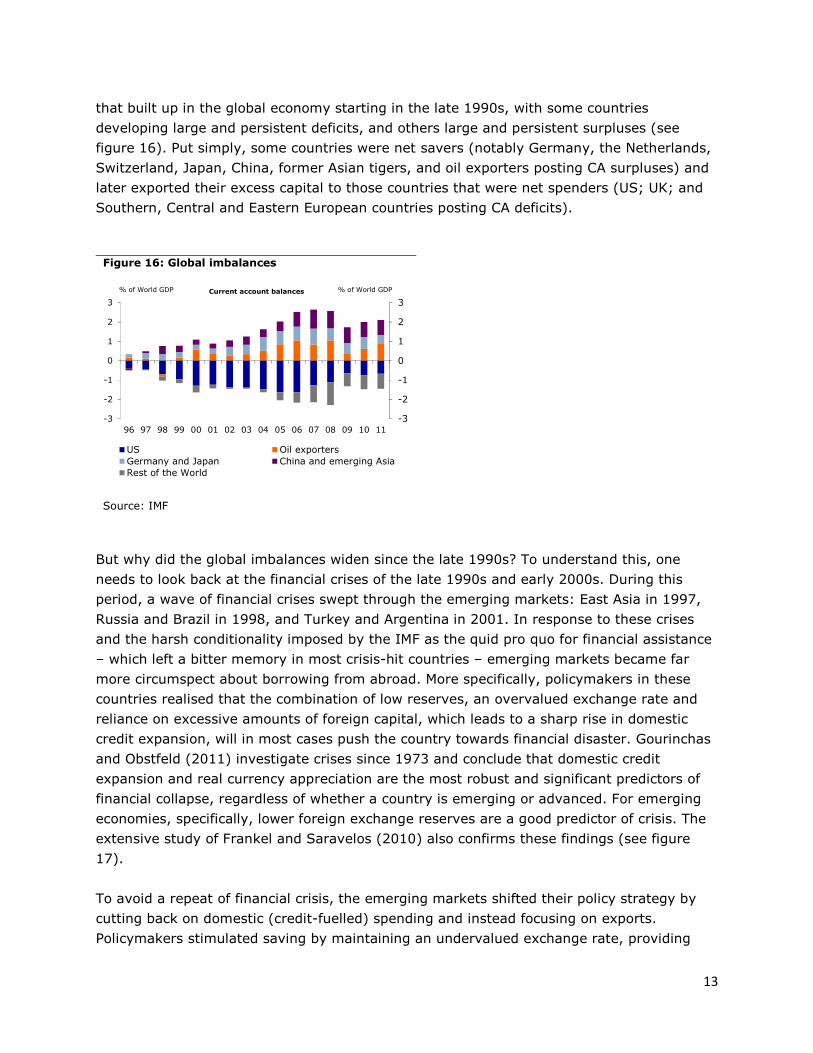
important contributing factor to the crisis consisted of the ‘global economic imbalances’.
This term refers to the pattern of deficits and surpluses in the current account (CA) balances
17 In April 2007 the IMF concluded in its twice-annual World Economic Outlook that risks to the global economy had
become extremely low and that, for the moment, there were no great worries (Reinhart and Rogoff, 2009)
13
that built up in the global economy starting in the late 1990s, with some countries
developing large and persistent deficits, and others large and persistent surpluses (see
figure 16). Put simply, some countries were net savers (notably Germany, the Netherlands,
Switzerland, Japan, China, former Asian tigers, and oil exporters posting CA surpluses) and
later exported their excess capital to those countries that were net spenders (US; UK; and
Southern, Central and Eastern European countries posting CA deficits).
Figure 16: Global imbalances
-3
-2
-1
0
1
2
3
-3
-2
-1
0
1
2
3
96 97 98 99 00 01 02 03 04 05 06 07 08 09 10 11
US Oil exporters
Germany and Japan China and emerging Asia
Rest of the World
% of World GDP % of World GDPCurrent account balances
Source: IMF
But why did the global imbalances widen since the late 1990s? To understand this, one
needs to look back at the financial crises of the late 1990s and early 2000s. During this
period, a wave of financial crises swept through the emerging markets: East Asia in 1997,
Russia and Brazil in 1998, and Turkey and Argentina in 2001. In response to these crises
and the harsh conditionality imposed by the IMF as the quid pro quo for financial assistance
– which left a bitter memory in most crisis-hit countries – emerging markets became far
more circumspect about borrowing from abroad. More specifically, policymakers in these
countries realised that the combination of low reserves, an overvalued exchange rate and
reliance on excessive amounts of foreign capital, which leads to a sharp rise in domestic
credit expansion, will in most cases push the country towards financial disaster. Gourinchas
and Obstfeld (2011) investigate crises since 1973 and conclude that domestic credit
expansion and real currency appreciation are the most robust and significant predictors of
financial collapse, regardless of whether a country is emerging or advanced. For emerging
economies, specifically, lower foreign exchange reserves are a good predictor of crisis. The
extensive study of Frankel and Saravelos (2010) also confirms these findings (see figure
17).
To avoid a repeat of financial crisis, the emerging markets shifted their policy strategy by
cutting back on domestic (credit-fuelled) spending and instead focusing on exports.
Policymakers stimulated saving by maintaining an undervalued exchange rate, providing

14
export levies, subsidising energy prices and directing bank lending to the industrial sector.
The lack of adequate social safety nets as well as inadequate pension, healthcare and
education systems also contributed to higher savings in the household sector. All of these
resulted in a rapid increase in the global pool of savings in the EMs, which found its way into
mature economies given their ability to create safe and liquid financial assets (Caballero,
2006). The US was a particular beneficiary of the ‘savings glut’ in the East as it was able to
attract the most amount of capital (in absolute terms) due to the dollar’s unique position
and the depth of its financial markets (Bernanke, 2005).
Figure 17: Early warning indicators Figure 18: Gross inflows to advanced economies
0 10 20 30 40 50 60 70
Low levels of international reserves
Appreciation of real exchange rate
Sharp drop in GDP
Rapid credit expansion
Large current account deficit
Surge in money supply
Change in exports/imports
High inflation
Sharp drop in equity returns
Strong rise in real interest rate
Unfavourable debt composition
Large budget deficit
Worsening terms of trade
Contagion
Weak political/legal infrastructure
Surge in capital flows
High external debt
Percentage of academic studies where
"leading indicator" was found to be a relatively good predictor of financial crisis.
No. of studies=83, covering 1950-2009
Source: Frankel and Saravelos (2010)
-15
-10
-5
0
5
10
15
20
25
30
-20
-15
-10
-5
0
5
10
15
20
25
30
80 84 88 92 96 00 04 08H1 10H1
Derivatives Other bank & private
Other government Portfolio
FDI Total
% of aggregate GDP % of aggregate GDP
Source: IMF
The ensuing flows of capital into western financial markets (see figure 18) eased financial
conditions in capital importing countries18 and exerted significant downward pressure on
world interest rates.19 This encouraged risk-taking on an extraordinary scale as Western
financial institutions expanded their balance sheets20 and created new instruments to satisfy
the search for yield. Thus, the fact that emerging markets became a new source of capital
helped to fuel a credit boom in many advanced economies, particularly in the US, thereby
laying the groundwork for the current crisis21. The sheer size of the US economy meant that
a problem in the United States would quickly take on global proportions.
18 In the run-up to the crisis, credit aggregates grew extremely fast in the UK, Spain, Iceland, and several Eastern
European countries. As in the United States, these credit expansions fueled real estate booms. 19 Estimates by Krishnamurthy and Vissing-Jorgensen (2008) and Warnock and Warnock (2006) suggest that offi-
cial foreign demand for US government debt depressed Treasury yields by at least 50 basis points. 20 The size of the US financial sector rose from an average of 4% of GDP in the mid-1970s to almost 8% of GDP in
2007 (Reinhart and Rogoff, 2009). 21 Many other observers have singled out global imbalances as a key factor contributing to the turmoil. For exam-
ple, Bernanke (2009), Council of Economic Advisers (2009), Dunaway (2009), Eichengreen (2009), King (2010),
Kohn (2010), Krugman (2009) and Portes (2009).
15
Blame the monetary authorities
Normally, an abundance of credit fuels inflation, which results in a tightening of monetary
policy. However, in the period 2000-2007, inflation in the advanced economies was actually
very low by historical standards. This was to large extent due to the emergence of China as
the ‘manufacturer for the world’ following its inclusion in the World Trade Organisation in
2001. The excess supply of labour in the East depressed consumer prices globally. The
absence of visible (and narrowly defined) inflationary pressures allowed inflation-targeting
central banks to keep monetary policy very loose after the collapse of the dot-com bubble.
The accommodative monetary stance worldwide certainly boosted even more liquidity into
the global monetary system. With an artificially low policy rate, banks could gorge
themselves on cheap funding and boost their leverage ratios further. Not everyone is
convinced though. The impact of accommodative monetary policy on house prices could
have been overstated according to some scholars. Del Negro and Otrok (2007) found that
the low Fed funds rate had a small influence on the overall housing price increase in the US.
Merrouche and Nier (2010) likewise do not find that differences in monetary policy had an
effect on the build-up of financial imbalances when capital flows are accounted for. Looking
across countries, the IMF found that while in many economies policy rates had been low by
historical standards, there was virtually no association between measures of the monetary
policy stance and house price increases across advanced economies (Kamalodin, 2010).
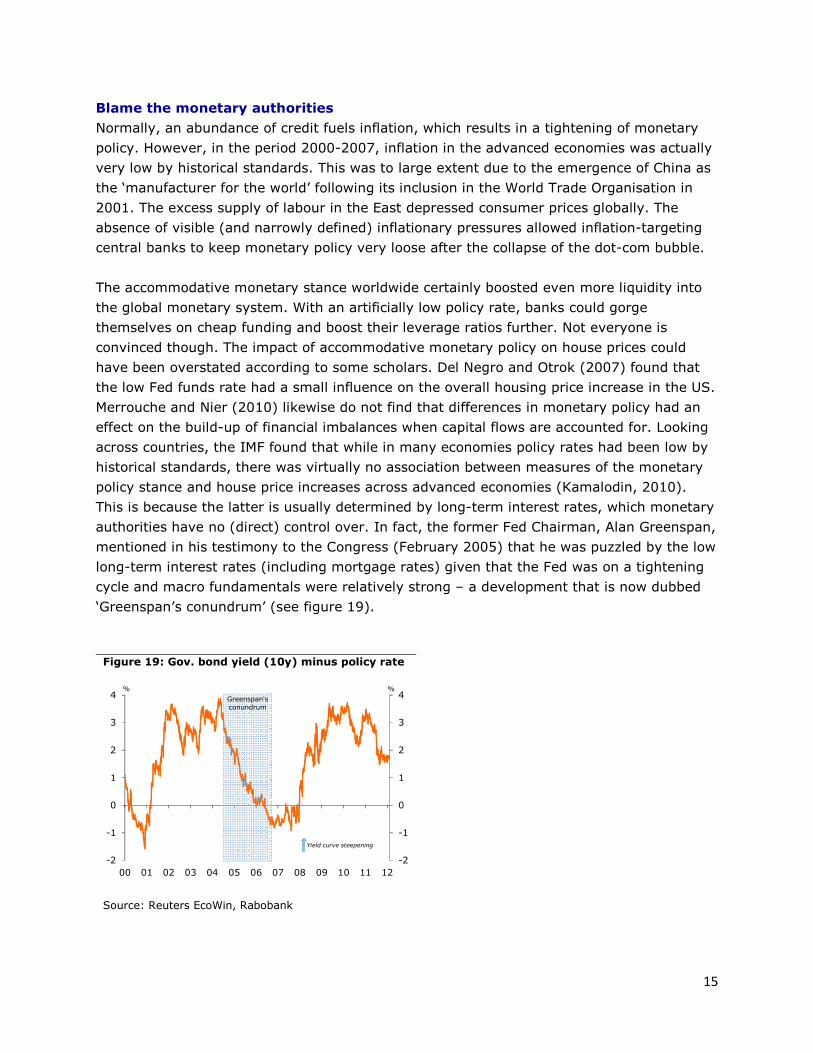
This is because the latter is usually determined by long-term interest rates, which monetary
authorities have no (direct) control over. In fact, the former Fed Chairman, Alan Greenspan,
mentioned in his testimony to the Congress (February 2005) that he was puzzled by the low
long-term interest rates (including mortgage rates) given that the Fed was on a tightening
cycle and macro fundamentals were relatively strong – a development that is now dubbed
‘Greenspan’s conundrum’ (see figure 19).
Figure 19: Gov. bond yield (10y) minus policy rate
-2
-1
0
1
2
3
4
-2
-1
0
1
2
3
4
00 01 02 03 04 05 06 07 08 09 10 11 12
% %
Yield curve steepening
Greenspan's
conundrum
Source: Reuters EcoWin, Rabobank
16
Blame the regulators and bankers
The drop in yields to historic lows during the 2000s did not need to end in financial
catastrophe per se. The decision of recipients of capital (i.e. the deficit countries) to
frontload consumption or invest in unprofitable/risky areas such as real estate was a key
contributing factor to the crisis. And this is where banks come into the picture. So the
question that needs to be asked is the following: why were banks engaging in such risky
lending with borrowed money? To answer this we will first focus on the policy failures of the
financial watchdogs and then turn our attention to banks’ inappropriate risk management
practices.
a. The failure of regulators
In many ways the collapse of the global financial system reflects a systemic failure of the
governance of financial regulation – the system associated with designing, enacting,
implementing, and reforming financial policies (Levine, 2010). As memories of the Great
Depression dimmed, the advantages of liberalising financial markets and encouraging
financial innovation acquired more weight in policy discussions. This was to a large extent
pushed by the powerful financial industry (Igan and Mishra, 2011). In the US alone, the
financial sector expended USD 2.7 billion in reported federal lobbying costs between 1999
and 2008; individuals and political action committees in the sector made more than USD 1
billion in campaign contributions (FCIC, 2011).
The rapid process of deregulation allowed financial institutions to significantly boost their
leverage ratios. In the US, some of the financial institutions were levered 35:1 or higher.22
This meant that every USD 35 of assets was financed with USD 1 of equity capital and USD
34 of debt. This made these firms enormously profitable when times were good23, but
incredibly sensitive to even a small loss, as their entire capital stock would be wiped out.
With hindsight, we can safely argue that allowing banks to lever-up their bets in order to
maximise profits during tranquil times was a huge policy error. As Claessens et al. (2010)
note, the build-up of an unusually high degree of leverage in financial institutions strongly
contributed to the propagation of shocks across the global financial system.
On top of higher leverage, banks were permitted to reduce the capital that they held by
shifting assets to various legal entities (e.g. conduits and SIVs) that they did not own.
Regulators did not seem to care about, or they simply ignored, the implicit contingent
liabilities that this entailed for banks. Part of the blame, according to Coval et al. (2009),
22 In 2007, the leverage ratios of Bank of America, Citigroup, Morgan Stanley, Goldman Sachs and Lehman
Brothers were 35:1, 48:1, 40:1, 32:1 and 40:1, respectively. But the kings of leverage were Fannie Mae and
Freddie Mac. By the end of 2007, their combined leverage ratio stood at 75:1. 23 Consider the following the example: if an investor uses EUR 100 of his own money to purchase a security that
increases in value by 10%, he earns EUR 10. However, if he borrows another EUR 900 and invests 10 times as
much (EUR 1,000), the same 10% increase in value yields a profit of EUR 100 (i.e. his return would be 100%).
There is a catch though. If the investment sours, leverage magnifies the loss just as much. A decline of 10% costs
the unleveraged investor EUR 10, leaving him with EUR 90, but wipes out the leveraged investor’s EUR 100.

17
lies with the minimum capital requirements set forth in Basel I and II. Under these
guidelines, banks could bundle shaky loans into investment products that seemed to offer
investors the best of both worlds – high-yield, risk-free assets (it was later discovered that
in many cases, these assets were actually loaded with systemic risk and which was
inadequately rewarded). Most of these securities acquired the highest rating from the three
largest rating agencies. Banks holding AAA-rated securities were required to hold only half
as much capital as was required to support other investment-grade securities. The small
yield advantage in AAA-rated structured finance securities (compared to AAA-rated public
debt) during a period of very low interest rates led to a dramatic increase in the demanded
quantity. In essence, the structured finance machinery enabled the creation of securities
that had a yield advantage over government bonds while, according to the rating agencies,
carrying the same risk. To this end, financial institutions were more than willing to supply
these highly demanded assets. Between 1990 and 2006, triple-A assets across the world
rose from a little over 20% of total rated fixed-income issues to almost 55%. This was
mostly thanks to the securitisation process. Specifically, during this period, asset-backed
securities (ABSs) accounted for 64% of the total growth of gross issues of long-term fixed-
income AAA-rated assets, compared with 27% attributable to the growth in public debt, 2%
to corporate debt and 8% to other products (BIS, 2011).
The shared belief of regulators was that securitisation would disperse the risks associated
with bank lending as deep-pocketed investors who were better able to absorb losses would
share the risks. The huge lesson learnt from the crisis was that securitisation actually
managed to concentrate risks in the banking sector as banks and other financial institutions
maintained a significant exposure to mortgages, MBSs, and CDOs (Acharya et al. 2010).
The reason was that the structured finance business offered enormous short-run payoffs,
which seemed too compelling to ignore. By 2006, structured finance issuance led Wall
Street to record revenue and compensation levels24 (Coval et al., 2009). When the
structured finance market came crashing down in late 2007, banks found themselves
holding hundreds of billions of dollars of toxic waste they could not easily dispose of.
Regulators also missed the fact that the originate-to-distribute model brought about by
securitisation reduced the incentives for the originator of the claims to monitor the
creditworthiness of the borrower (Keys et al., 2008). This was not too difficult to assume
because the originator had little or no skin in the game. In the securitisation food chain,
every intermediary in the chain was making a fee; eventually the credit risk got transferred
to a structure that was so opaque even the most sophisticated investors had no real idea
what they were holding. The mortgage broker; the home appraiser; the bank originating the
mortgages and repackaging them into MBSs; the investment bank repackaging the MBSs
into CDOs, CDOs of CDOs (CDO-squared), and even CDO-cubed – each of these
intermediaries was earning income from charging fees for their step of the intermediation
24 The top employees of the five largest investment banks in the US divided a bonus pool of over USD 36 billion in
2007 (Reinhart and Rogoff, 2009).
18
process and transferring the credit risk down the line. This is why mortgage brokers in the
US started offering teaser rates, interest-only mortgages, no-documentation mortgages,
piggyback mortgages (a combination of two mortgages that eliminates the need for a down
payment), and NINJA (‘no income, no job or assets’) mortgages to entice people to buy
homes. Indeed, the Federal Bureau of Investigation (FBI) publicly warned in 2004 of an
epidemic of fraud in subprime lending (Levine, 2010). Lower lending standards were
perhaps tolerated amid the fast rate of house price appreciation, which was consistent with
the notion that not only house-buyers, but regulators as well were gambling on a continuing
housing boom. We now know that the reduction in credit quality ultimately added to the
fragility of the financial system.
Supervisory authorities not only did not discourage the build-up of off-balance sheet risk
exposure, they almost completely neglected the relevance of liquidity risk in the financial
markets. As Goodhart (2008) notes, until about the end of the 1960s, commercial banks in
the UK, and indeed around much of the rest of the industrialised world, held some 25%, or
more, of their assets in real liquid assets. These were largely government debt. Ever since,
the share of claims on the public sector in bank assets has been going down steadily and
has been replaced by private sector assets (e.g. MBSs and CDOs). These were liquid so long
as investors trusted them. Once confidence evaporated in a puff of smoke, these assets
became highly illiquid. Financial institutions were also increasingly reliant on wholesale
funding and on the short-term credit market, which made them vulnerable to liquidity
crunches and disruptions to their funding (Bologna, 2011). The liability structure of Bear
Stearns was an extreme example of this. At the end of 2007, Bear Stearns had USD 11.8
billion in equity and USD 383.6 billion in liabilities and was borrowing as much as USD 70
billion in the overnight market (FCIC, 2011). The funding structure of the financial sector
was very different during the 1960s and 1970s whereby banks mostly funded their assets
on the basis of relatively more stable retail deposits (Goodhart, 2008).
The final shortcoming on the part of the regulators was their lack of appreciation of how
complex the global financial markets had become. In particular, counterparty risk in the
market place was fully ignored. To make this point clearer, consider the decision of
regulators to permit banks to use CDSs25 to reduce capital reserves. Hedging risks of, say,
mortgage defaults via CDSs makes perfect sense if the counterparty, that is deemed
reliable, simply assumes that role. However, given the active trading of CDSs, it was at
times almost impossible to indentify the actual counterparty legally responsible for
compensating a bank if an ‘insured’ security failed. This pass-the-hot-potato game went on
and on until it became impossible for anyone to know where risk was eventually parked. At
the end of the day, as the executive director of the financial stability department of the
Bank of England argues, knowing your ultimate counterparty’s risk became like solving a
high-dimension Sudoku puzzle given the complexity of the financial system (Haldane,
25 Based on survey data from the BIS, the total notional amount of the CDS market was USD 6 trillion in 2004 and
reached USD 57 trillion by June 2008 (Stulz, 2010).

19
2009). Moreover, the counterparty could decide to hedge many other positions without
asking anyone’s permission. For example, AIG assumed the role of hedger-of-last-resort by
betting that nothing would go wrong at once. This is similar to insuring all houses in your
neighbourhood against damage. You are bound to make quick and easy money until
disaster strikes. The supervisors only noticed this and took action when it was too late.
b. The failure of bankers
It is not fair to put the blame squarely on financial regulators. Financial institutions needed
to conduct prudent risk management in order to minimise potential costs and thereby
maximise returns for their shareholders. So why did they utterly fail in recognising
limitations in risk management practices?
One explanation is that banks were encouraged by the development of risk models
(Eichengreen, 2008). Physicists and mathematicians were increasingly hired by Wall Street
(and later in other advanced countries) to develop computer models that ‘managed’ to
quantify and hedge risks. These rigorous models, which almost no bank CEO understood
completely, promised to provide ‘exact’ information and this, in effect, emboldened bankers
to believe that the additional leverage was safe since they now used scientific techniques to
manage risk (Schneider and Kirchgässner, 2009). However, these so-called quants did not
realise that their models could not incorporate counterparty risk. Designing CDSs and other
complicated insurance contracts is not enough if the counterparty has insufficient capital to
make good on its promise.
Another explanation is the banking sector’s poor due diligence practices (Tabellini, 2008),
including excessive and misplaced reliance on credit rating agencies (CRAs). This was partly
because the readily available information was sometimes useless. Bankers, for example,
would need to read 30,300 pages worth of information for every CDO purchased to be
aware of everything that was being acquired. For understanding the risks of a CDO-squared,
1,250,000,300 pages had to be read (Haldane, 2009). Since no one had the time nor the
inclination to read so many pages, banks decided to blindly believe the ratings given by
CRAs. They did not realise at the time that the structured finance market could dry up very
fast if the ratings given by CRAs were not accurately reflecting the risks they were taking.
Acharya et al. (2010) believe that the role of poor governance in the banking sector was
also non-negligible. More specifically, the remuneration system in many banks in most
countries rewarded myopic risk-taking behaviour. Since a large fraction of payment was in
the form of bonuses tied to short-term profits, and because such bonuses were asymmetric
(substantial and positive when times were good and at worst zero when returns were poor),
bankers had a huge incentive to take larger risks than warranted by the goal of
shareholders’ long-run value maximisation. The wrong remuneration scheme persuaded
bank CEOs to make the wrong choices. Specifically, the career of many CEOs would be very
short if they would generate earnings that were low compared to their peers. Against this
20
backdrop, when a number of leading banks made high returns by investing in questionable
assets, the CEOs of other banks were placed under intense pressure to follow suit (Diamond
and Rajan, 2009). This point was made painfully clear in the remark of the then-CEO of
Citigroup, Chuck Prince, in July 2007. He acknowledged that the credit-fuelled boom would
eventually end, but that in the meantime, his firm would continue to participate in the
structured finance market (as reported in Nakamoto and Wighton, 2007): “When the music
stops, in terms of liquidity, things will get complicated. As long as the music is playing,
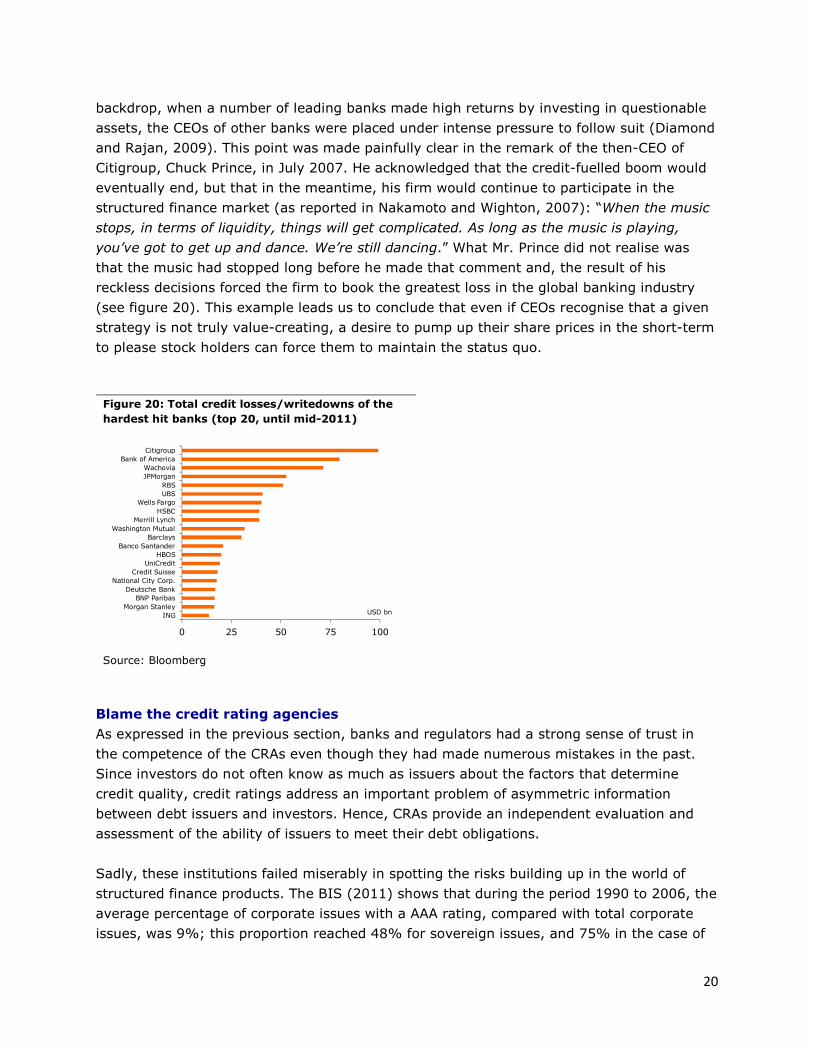
you’ve got to get up and dance. We’re still dancing.” What Mr. Prince did not realise was
that the music had stopped long before he made that comment and, the result of his
reckless decisions forced the firm to book the greatest loss in the global banking industry
(see figure 20). This example leads us to conclude that even if CEOs recognise that a given
strategy is not truly value-creating, a desire to pump up their share prices in the short-term
to please stock holders can force them to maintain the status quo.
Figure 20: Total credit losses/writedowns of the
hardest hit banks (top 20, until mid-2011)
0 25 50 75 100
Citigroup
Bank of America
Wachovia
JPMorgan
RBS
UBS
Wells Fargo
HSBC
Merrill Lynch
Washington Mutual
Barclays
Banco Santander
HBOS
UniCredit
Credit Suisse
National City Corp.
Deutsche Bank
BNP Paribas
Morgan Stanley
INGUSD bn
Source: Bloomberg
Blame the credit rating agencies
As expressed in the previous section, banks and regulators had a strong sense of trust in
the competence of the CRAs even though they had made numerous mistakes in the past.
Since investors do not often know as much as issuers about the factors that determine
credit quality, credit ratings address an important problem of asymmetric information
between debt issuers and investors. Hence, CRAs provide an independent evaluation and
assessment of the ability of issuers to meet their debt obligations.
Sadly, these institutions failed miserably in spotting the risks building up in the world of
structured finance products. The BIS (2011) shows that during the period 1990 to 2006, the
average percentage of corporate issues with a AAA rating, compared with total corporate
issues, was 9%; this proportion reached 48% for sovereign issues, and 75% in the case of
21
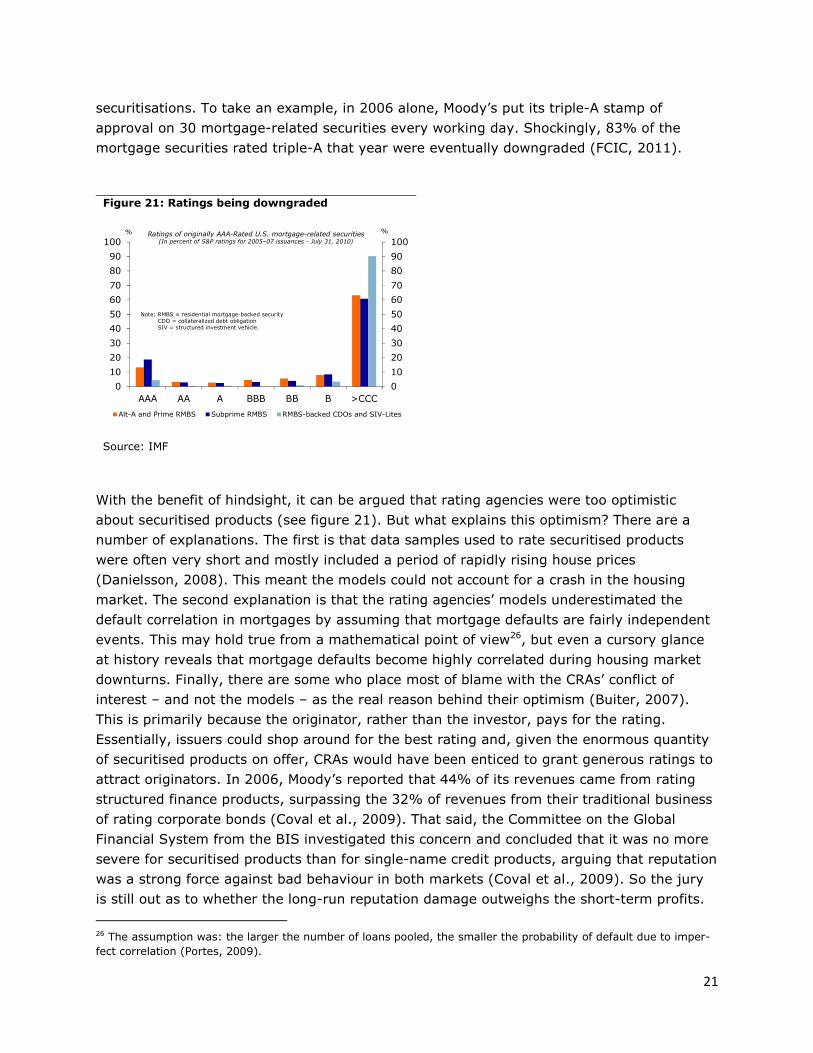
securitisations. To take an example, in 2006 alone, Moody’s put its triple-A stamp of
approval on 30 mortgage-related securities every working day. Shockingly, 83% of the
mortgage securities rated triple-A that year were eventually downgraded (FCIC, 2011).
Figure 21: Ratings being downgraded
0
10
20
30
40
50
60
70
80
90
100
0
10
20
30
40
50
60
70
80
90
100
AAA AA A BBB BB B >CCC
Alt-A and Prime RMBS Subprime RMBS RMBS-backed CDOs and SIV-Lites
% %Ratings of originally AAA-Rated U.S. mortgage-related securities(In percent of S&P ratings for 2005–07 issuances - July 31, 2010)
Note: RMBS = residential mortgage-backed security CDO = collateralized debt obligationSIV = structured investment vehicle.
Source: IMF
With the benefit of hindsight, it can be argued that rating agencies were too optimistic
about securitised products (see figure 21). But what explains this optimism? There are a
number of explanations. The first is that data samples used to rate securitised products
were often very short and mostly included a period of rapidly rising house prices
(Danielsson, 2008). This meant the models could not account for a crash in the housing
market. The second explanation is that the rating agencies’ models underestimated the
default correlation in mortgages by assuming that mortgage defaults are fairly independent
events. This may hold true from a mathematical point of view26, but even a cursory glance
at history reveals that mortgage defaults become highly correlated during housing market
downturns. Finally, there are some who place most of blame with the CRAs’ conflict of
interest – and not the models – as the real reason behind their optimism (Buiter, 2007).
This is primarily because the originator, rather than the investor, pays for the rating.
Essentially, issuers could shop around for the best rating and, given the enormous quantity
of securitised products on offer, CRAs would have been enticed to grant generous ratings to
attract originators. In 2006, Moody’s reported that 44% of its revenues came from rating
structured finance products, surpassing the 32% of revenues from their traditional business
of rating corporate bonds (Coval et al., 2009). That said, the Committee on the Global
Financial System from the BIS investigated this concern and concluded that it was no more
severe for securitised products than for single-name credit products, arguing that reputation
was a strong force against bad behaviour in both markets (Coval et al., 2009). So the jury
is still out as to whether the long-run reputation damage outweighs the short-term profits.
26 The assumption was: the larger the number of loans pooled, the smaller the probability of default due to imper-
fect correlation (Portes, 2009).

22
Blame the government
Governments around the world have been big cheerleaders of increased home-ownership.
This strategy was a sure-shot way to win the hearts and minds of potential voters while
boosting job creation, as the construction sector is very labour intensive. The conviction that
everyone must be able to become home-owners was particularly strong in the US. In a
famous remark in Atlanta, Georgia in 2002, the former US president, George W. Bush,
claimed: “I do believe in the American Dream…Owning a home is a part of that dream; it
just is.” No wonder that Americans believed they were simply realising the American Dream
by buying houses they could not afford. Of course, the Bush administration did not try to
boost home-ownership through fancy statements only. They ensured that this ‘dream’ would
come true by encouraging GSEs such as Fannie Mae and Freddie Mac to purchase
mortgages originated by local banks and mortgage brokers. Subsequently, mortgages were
repackaged into MBSs, and resold in capital markets with the implicit (that later became
explicit) guarantee of the US government, which made them highly attractive to global
investors.
In 1996, the department of Housing and Urban Development (HUD) required that 12% of all
mortgage purchases by the GSEs to be ‘special affordable’ loans, typically to borrowers with
incomes less than 60% of their area’s median income. That number was increased to 22%
in 2005 and the 2008 goal was 28%. Against this background, origination of subprime
mortgages grew from USD 96.8 billion in 1996 to roughly USD 600 billion in 2006,
accounting for around one quarter of all mortgages issued that year in the US (Coval et al.,
2009). Mind you, the GSEs also managed to purchase hundreds of billions of dollars’ worth
of subprime securities for their own portfolios to make money and help satisfy the
government’s affordable housing goals. In any case, demanding that GSEs do more to
increase home-ownership among less well-ff allowed the administration to subsidise low-
income housing outside of the budget. Arguably, a very smart strategy to win votes in the
short-term. What the government failed to realise was that they were on the hook if the
housing market turned for the worse.
Blame the borrowers
If you ask people on the streets what the causes of the current crisis are, you will most
probably get answers that associate it with some mix of bankers’ greed (i.e. predatory
lending), regulators’ incompetence, and overly loose credit conditions. This is quite strange
as no one seems to blame those who have borrowed money in the first place. After all, if it
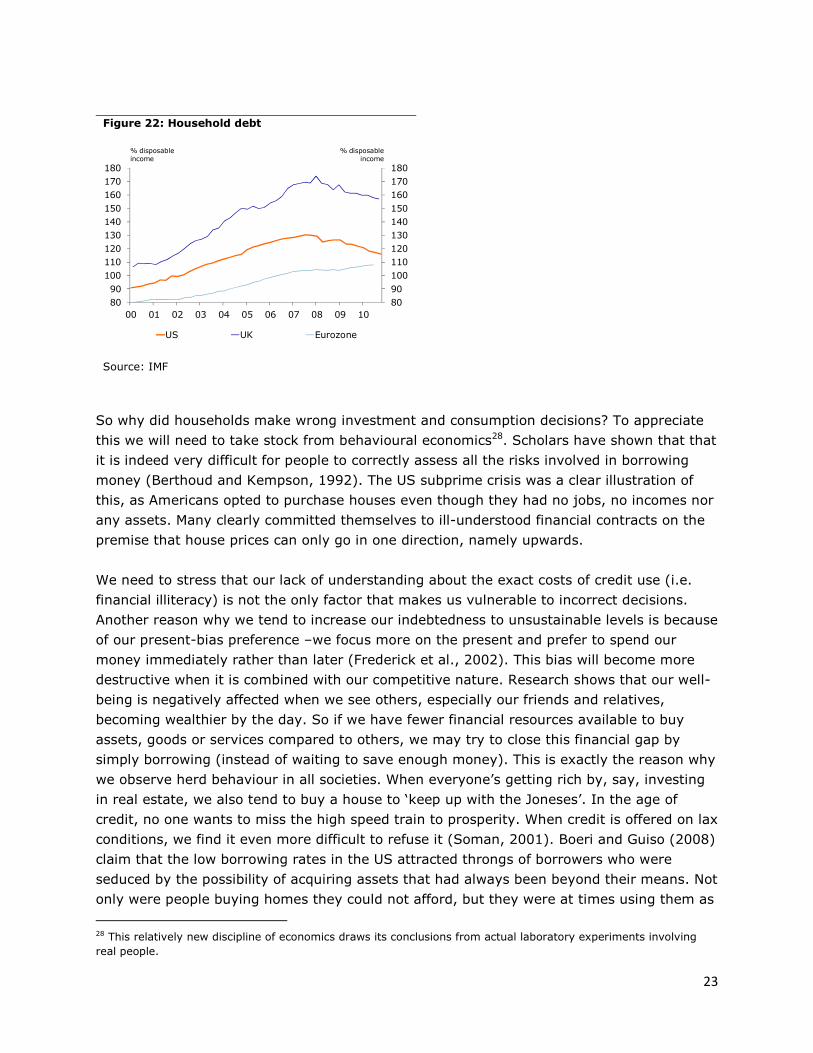
was not for households’ decision to increase their indebtedness27 (see figure 22) in order to
frontload consumption and/or purchase assets, there would be no financial crisis. To
paraphrase Shakespeare, the fault lies not in the stars, but in us.
27 The mortgage debt of American households rose almost as much in the six years from 2001 to 2007 as it had
over the course of the country’s more than 200-year history (FCIC, 2011).
23
Figure 22: Household debt
80
90
100
110
120
130
140
150
160
170
180
80
90
100
110
120
130
140
150
160
170
180
00 01 02 03 04 05 06 07 08 09 10
US UK Eurozone
% disposable
income
% disposable
income
Source: IMF
So why did households make wrong investment and consumption decisions? To appreciate
this we will need to take stock from behavioural economics28. Scholars have shown that that
it is indeed very difficult for people to correctly assess all the risks involved in borrowing
money (Berthoud and Kempson, 1992). The US subprime crisis was a clear illustration of
this, as Americans opted to purchase houses even though they had no jobs, no incomes nor
any assets. Many clearly committed themselves to ill-understood financial contracts on the
premise that house prices can only go in one direction, namely upwards.
We need to stress that our lack of understanding about the exact costs of credit use (i.e.
financial illiteracy) is not the only factor that makes us vulnerable to incorrect decisions.
Another reason why we tend to increase our indebtedness to unsustainable levels is because
of our present-bias preference –we focus more on the present and prefer to spend our
money immediately rather than later (Frederick et al., 2002). This bias will become more
destructive when it is combined with our competitive nature. Research shows that our well-
being is negatively affected when we see others, especially our friends and relatives,
becoming wealthier by the day. So if we have fewer financial resources available to buy
assets, goods or services compared to others, we may try to close this financial gap by
simply borrowing (instead of waiting to save enough money). This is exactly the reason why
we observe herd behaviour in all societies. When everyone’s getting rich by, say, investing
in real estate, we also tend to buy a house to ‘keep up with the Joneses’. In the age of
credit, no one wants to miss the high speed train to prosperity. When credit is offered on lax
conditions, we find it even more difficult to refuse it (Soman, 2001). Boeri and Guiso (2008)
claim that the low borrowing rates in the US attracted throngs of borrowers who were
seduced by the possibility of acquiring assets that had always been beyond their means. Not
only were people buying homes they could not afford, but they were at times using them as
28 This relatively new discipline of economics draws its conclusions from actual laboratory experiments involving
real people.

24
their own ATM machines. This was particularly problematic in the US as people used their
houses as collateral to seek extra credit which was used to send their kids to college, pay
medical bills, install designer kitchens, or purchase cars. Survey evidence from the Fed
shows that about 5% of US homeowners pulled out equity to buy a car and over 40% spent
the cash on a catchall category including clothing, gifts, tax payments, and living expenses
(FCIC, 2011).
It is important to note though that overconsumption and, especially asset price bubbles,
occur even when credit is not readily available. The long history of bubbles and manias
show that excessive euphoria concerning a specific asset class (e.g. tulips in the 1630s, IT
shares in the 1990s or houses in the 2000s) is enough to push prices into bubble territory.
This is due to our optimism bias and illusory superiority (or hubris), which makes us buy
assets with the intent of selling at a profit to ‘‘a bigger fool’’ who is expected to come along
soon (Akerlof and Shiller, 2009). In the meantime, we concentrate solely on the news that
vindicates our original thought while trying to ignore all contradictory information (this is
known as confirmation bias or ‘the ostrich effect’).
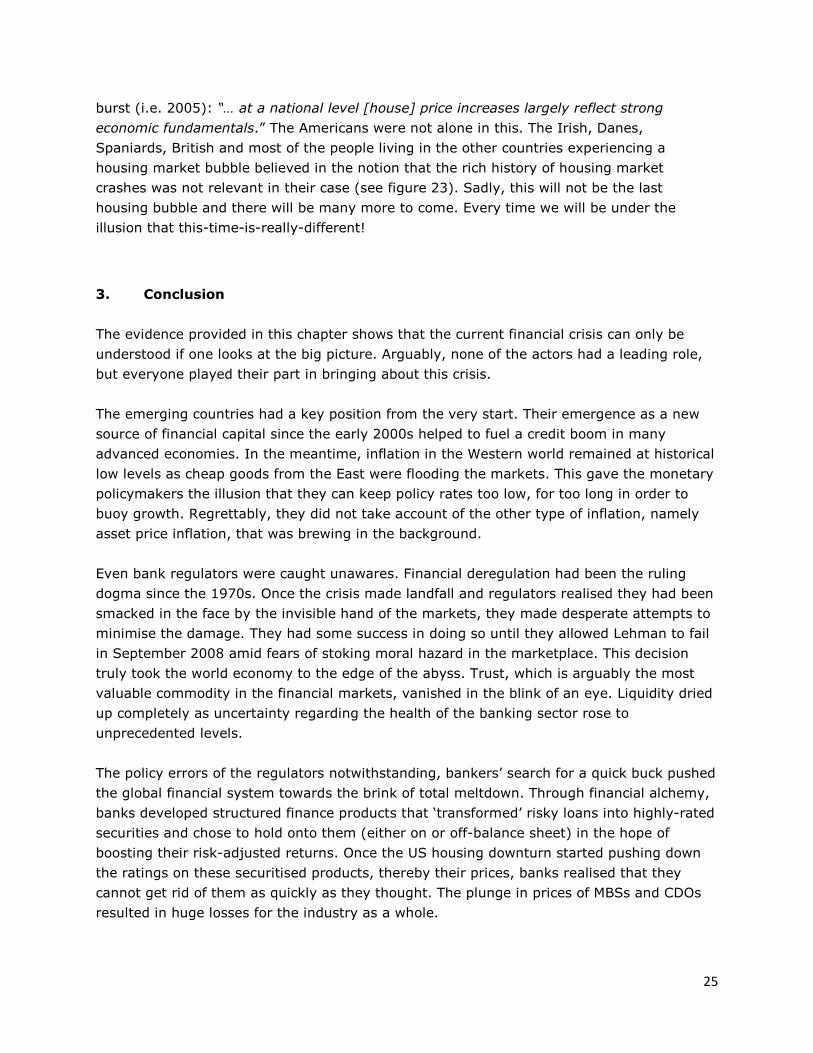
Figure 23: Household debt
-60 -50 -40 -30 -20 -10 0
Hong Kong (1997)Philippines (1997)Colombia (1998)Finland (1991)Indonesia (1997)Ireland (2007)Norway (1987)Japan (1992)US (2007)Spain (1977)Sweden (1991)Argentina (2001)Norway (1899)Korea (1997)Thailand (1997)Malaysia (1997)Spain (2007)US (1929)UK (2007)
%-pts
Blue bars: housing crisis is still unfolding
Real house price declines (peak-to-trough) following financial crises
Source: Reinhart and Rogoff (2009), Reuters EcoWin
We also tend to make the wrong choices due to our short memories (or ignorance of
history) that regularly makes us oblivious of previous financial disasters. In their extensive
work on financial crises over the past 800 years, Reinhart and Rogoff (2009) show that
people permanently suffer from the so-called ‘this-time-is-different’ syndrome –the belief
that financial crises are something that happens to other countries at other times because
their country has the right policies, has learnt from its mistakes and is built on sound
fundamentals. Put differently, American home-buyers thought that the collapse of house
prices throughout the world on numerous occasions in the past was completely irrelevant.
Their housing market was supposedly on a solid footing. At least that is what they believed
after having listened to Ben Bernanke’s testimony to the Congress a year before the bubble
25
burst (i.e. 2005): “… at a national level [house] price increases largely reflect strong
economic fundamentals.” The Americans were not alone in this. The Irish, Danes,
Spaniards, British and most of the people living in the other countries experiencing a
housing market bubble believed in the notion that the rich history of housing market
crashes was not relevant in their case (see figure 23). Sadly, this will not be the last
housing bubble and there will be many more to come. Every time we will be under the
illusion that this-time-is-really-different!
3. Conclusion
The evidence provided in this chapter shows that the current financial crisis can only be
understood if one looks at the big picture. Arguably, none of the actors had a leading role,
but everyone played their part in bringing about this crisis.
The emerging countries had a key position from the very start. Their emergence as a new
source of financial capital since the early 2000s helped to fuel a credit boom in many
advanced economies. In the meantime, inflation in the Western world remained at historical
low levels as cheap goods from the East were flooding the markets. This gave the monetary
policymakers the illusion that they can keep policy rates too low, for too long in order to
buoy growth. Regrettably, they did not take account of the other type of inflation, namely
asset price inflation, that was brewing in the background.
Even bank regulators were caught unawares. Financial deregulation had been the ruling
dogma since the 1970s. Once the crisis made landfall and regulators realised they had been
smacked in the face by the invisible hand of the markets, they made desperate attempts to
minimise the damage. They had some success in doing so until they allowed Lehman to fail
in September 2008 amid fears of stoking moral hazard in the marketplace. This decision
truly took the world economy to the edge of the abyss. Trust, which is arguably the most
valuable commodity in the financial markets, vanished in the blink of an eye. Liquidity dried
up completely as uncertainty regarding the health of the banking sector rose to
unprecedented levels.
The policy errors of the regulators notwithstanding, bankers’ search for a quick buck pushed
the global financial system towards the brink of total meltdown. Through financial alchemy,
banks developed structured finance products that ‘transformed’ risky loans into highly-rated
securities and chose to hold onto them (either on or off-balance sheet) in the hope of
boosting their risk-adjusted returns. Once the US housing downturn started pushing down
the ratings on these securitised products, thereby their prices, banks realised that they
cannot get rid of them as quickly as they thought. The plunge in prices of MBSs and CDOs
resulted in huge losses for the industry as a whole.

26
The rating agencies’ lack of understanding of the complexity of securitised products further
exacerbated the problem. Although these agencies constantly remind us that their role is
merely ‘advisory’, their judgment is highly respected by regulators and bankers alike. The
fact that the CRAs believed that the US housing market would never experience a downturn
nationwide is extremely disappointing given their knowledge about past housing busts
across the world. Had they acknowledged this earlier (i.e. given lower ratings to securitised
products), they could have minimised the losses in the financial industry.
Governments contributed to the crisis in two ways. Firstly, they boosted the confidence of
potential home-buyers by making them believe that everyone deserves to have their own
home regardless of their financial situation. Secondly, they supported the housing market
through numerous measures. These include social housing policies to benefit low-income
and first-time homebuyers; tax incentives; state-owned financial institutions that originate
mortgage loans; and state-sponsored housing finance agencies that (mostly) provide
liquidity facilities for the mortgage markets. Had governments left the housing market to its
own devices, prices might have dropped at an earlier stage or never have appreciated in an
unsustainable pace in the first place, thereby limiting the damage to the private sector.
Thus, meddling with the housing market through direct and indirect policies was a rather big
mistake on their part.
Finally, home-buyers were under the false impression that houses have only way to go: up.
As some got wealthier by investing in real estate, others decided that they also wanted a
piece of the pie. No one cared that valuations were out of whack. Euphoria got the best of
us once again. What made matters worse this time round was that the housing bubble was
fuelled by rapid credit expansion. The sudden surge in jobless rates and drop in real
incomes in the aftermath of Lehman bankruptcy meant the painful deleveraging process had
to take place at a far faster speed than was desirable.
To be sure, this will not be the last crisis the world will ever see. To be sure, we are still
grappling with the hangover in terms of a sovereign debt crisis in the eurozone. Still, we can
draw a broad lesson from this horrendous crisis, which is that the complex interaction of
mistakes and policy failures makes financial crises extremely difficult to predict, especially in
terms of their timing. All we can hope for is to put in place better/smarter policies to reduce
their frequency and severity. There is a lot of work to be done and we probably won’t have
much time before the next one hits.

27
Bibliography
Acharya, V.V., Philippon, T., Richardson, M. and Roubini, N. (2010). The financial crisis of
2007-2009: Causes and remedies. In: Acharya, V. and Richardson, T., editors, Restoring
financial stability. Wiley Finance.
Akerlof, G.A. and Shiller, R.J. (2009). Animal Spirits. Princeton University Press.
Allessandri, P. and Haldane, A.G. (2009). Banking on the state. The Bank of England
Speeches.
Bernanke, B.S. (2005). The global saving glut and the US current account deficit. The San-
dridge Lecture, Virginia Association of Economists, Richmond, VA.
Bernanke, B. S. (2009). The crisis and the policy response. Stamp Lecture, London School
of Economics.
Berthoud, R. and Kempson, E. (1992). Credit and debt: the PSI report. London: Policy Stud-
ies Institute.
Bank for International Settlements (2011). Report on asset securitisation incentives. Report
prepared for the Basel Committee on Banking Supervision.
Boeri, T. and Guiso, L. (2008). The subprime crisis. Greenspan’s legacy. In the Voxeu.org
publication: The First Global Financial Crisis of the 21st Century.
Bologna, P. (2011). Is there a role for funding in explaining recent US banks’ failures?. IMF
Working Paper, No. 180.
Buiter, W. (2007). Lessons from the 2007 financial crisis. Unpublished manuscript. Paper
submitted to the UK Treasury Select Committee.
Caballero, R. (2006). On the macroeconomics of asset shortages. Forthcoming: The Fourth
European Central Banking Conference 2006 Volume.
Cecchetti, S.G. (2010). Strengthening the financial system: comparing costs and benefits.
Korea-FSB Financial Reform Conference, Seoul.
Claessens, S., Dell’Ariccia, G., Igan, D. and Laeven, L. (2010). Lessons and policy implica-
tions from the global financial crisis. IMF Working Paper, No. 44.
Council of Economic Advisers (2009). Economic Report of the President, Jan. 2009, Wash-
ington D.C.
28
Coval, J., Jurek, J. and Stafford, E. (2009). The economics of structured finance. Journal of
Economic Perspectives, Vol. 23, No. 1.
Danielsson, J. (2008). Blame the models. In the Voxeu.org publication: The First Global Fi-
nancial Crisis of the 21st Century.
Dell’Ariccia, G., Igan, D. and Laeven, L. (2008). Credit booms and lending standards: evi-
dence from the subprime mortgage market. CEPR Discussion Paper, No. 6683.
Del Negro, M. and Otrok, C. (2007). 99 Luftballons: Monetary policy and the house price
boom across US states. Journal of Monetary Economics No. 54.
Diamond, D.W. and Rajan, R.G. (2009). The credit crisis: Conjectures about causes and
remedies. NBER Working Paper, No. 14739.
Dunaway, S. (2009). Global imbalances and the financial crisis. Council on foreign Relations
Special Report, No. 44.
Eichengreen, B. (2008). Origins and responses to the crisis. Unpublished manuscript, Uni-
versity of California, Berkeley.
Eichengreen, B. (2009). The financial crisis and global policy reforms. Federal Reserve
Bank of San Francisco Asia Economic Policy Conference.
The Financial Crisis Inquiry Commission (2011). Final report of the National Commission on
the causes of the financial and economic crisis in the United States, Chaired by Phil An-
gelides.
Frankel, J. and Saravelos, G. (2010). Are leading indicators of financial crises useful for as-
sessing country vulnerability? Evidence from the 2008-09 global crisis. NBER Working Pa-
per, No. 16047.
Frederick, S., Loewenstein, G.F. and O’Donoghue, T. (2002). Time discounting and time
preference: A critical review. Journal of Economic Literature, No. 40.
Goodhart, C.A.E. (2008). The background to the 2007 financial crisis. Journal of Interna-
tional Economics and Economic Policy, Vol. 4, No.4.
Gourinchas, P.O. and Obstfeld, M. (2011). Stories of the Twentieth Century for the Twenty-
First. NBER Working Paper, No. 17252.

29
Haldane, A. (2009). Rethinking the financial network. Speech delivered at the Financial Stu-
dent Association (FSA), Amsterdam.
Igan, D. and Mishra, P. (2011). Three’s company: Wall Street, Capitol Hill and K Street.
VoxEU.org publication.
International Monetary Fund (2009a). Initial lesson of the crisis. Washington DC.
International Monetary Fund (2009b). Lessons of the global crisis for macroeconomic policy.
Washington DC.
Institute of International Finance (2010). Interim report on the cumulative impact on the
global economy of proposed changes in the banking regulatory framework. Washington DC.
Kamalodin, S.A. (2010). Globalisation at a cross roads. Rabobank Outlook 2010.
Keen, M. (2011). The taxation and regulation of banks. IMF Working Paper, No. 206.
Keys, B.J., Mukherjee, T.K., Seru, A. and Vig, V. (2008). Did securitization lead to lax
screening? Evidence from subprime Loans.
King, M. (2010). Speech delivered to the University of Exeter Business Leaders.
Kohn, D. (2010). Global imbalances. Speech delivered at the High-Level Conference on the
International Monetary System, Zurich, Switzerland.
Krishnamurthy, A. and Vissing-Jorgensen, A. (2008). The aggregate demand for treasury
debt. Unpublished manuscript, Northwestern University, Evanston, IL.
Krugman, P. (2009). Revenge of the glut. The New York Times.
Laeven, L. and Valencia, F. (2010). Resolution of banking crises: The good, the bad, and the
ugly. IMF Working Paper, No. 46.
Levine, R. (2010). An autopsy of the US financial system. NBER Working Paper, No.15956.
Merrouche, O. and Nier, E. (2010). What caused the global financial crisis? Evidence on the
drivers of financial imbalances 1999–2007. IMF Working Paper, No. 265.
Mishkin, F.S. (2010). Over the cliff: From the subprime to the global financial crisis. NBER
Working Paper, No. 16609.

30
Nakamoto, M. and Wighton, D. (2007). Citigroup chief stays bullish on buy-outs. The Finan-
cial Times.
Portes, R. (2009). Global imbalances. In Mathias Dewatripont, Xavier Freixas, and
Richard Portes, editors, Macroeconomic Stability and Financial Regulation: Key Issues for
the G20.
Reinhart, C. and Rogoff, K. (2010). From financial crash to debt crisis. NBER Working Paper,
No. 15795.
Reinhart, C.M. and Rogoff, K. (2009). This time is different: Eight centuries of financial folly.
Princeton University Press. Princeton and Oxford.
Schneider, F. and Kirchgässner, G. (2009). Financial and world economic crisis: What did
economists contribute? Public Choice, No. 140.
Shin, H. (2009). Global imbalances, twin crises and the financial stability role of monetary
policy. Paper prepared for the KIEP/CEPR conference, The World Economy with the G20.
Soman, D. (2001). Effects of payment mechanism on spending behavior: the role of re-
hearsal and immediacy of payments. Journal of Consumer Research, No. 27.
Stulz, R.M. (2010). CDSs and the credit crisis. Journal of Economic Perspectives, Vol. 24,
No. 1.
Tabellini, G. (2008). Why did bank supervision fail? In the Voxeu.org publication: The First
Global Financial Crisis of the 21st Century.
Warnock, F., and Warnock, V. (2006). International capital flows and U.S. interest rates.
Journal of International Money and Finance, 28 (6).

31
Appendix
Countries
DI raised from €20,000 to €100,000.
Deposit-like insurance instruments.
Interbank loans and short-term debt
Specific guarantees on Dexia
Denmark
Unlimited coverage of household deposits.
Interbank loans and bank debt (capped at €400
billion).
DI raised from €20,000 to €100,000.
€4.5 billion guarantee on Dexia’s debt.
DI raised to €100,000.
Interbank loans of solvent banks.#N/A
Fortis bonds (€5 bn) and ING bonds (€10 bn).#N/A
DI raised from £35,000 to 50,000.
Guarantee on short- to medium-term debt
(capped at £250 billion).
Blanket guarantee on Northern Rock and
Bradford & Bingley wholesale deposits
#N/A
DI raised from $100,000 to $250,000 (until end-
2009).
Money market funds (capped at 50 billion).
Full guarantee on transaction deposits.
Newly issued senior unsecured debt
DI already higher than EU new limit.
€360 billion in guarantees for refinancing credit
institutions.
€55 billions Dexia’s debt
DI raised from €20,000 to €100,000.
Funding guarantees up to €15 billion.
DI raised from €25,000 to €100,000.
Debt securities issued by credit institutions
(up to 12% of GDP)
Italy
Unlimited coverage until 9/29/10 to most
liabilities of 10 banks
DI raised from €20,000 to €100,000.
Credit Institutions New Debt Issues (capped at
€200 billion)
DI raised from SEK 250,000 to SEK 500,000.
Medium-term debt of banks and mortgage
institutions (up to SEK 1.5 trillion).
DI raised from SFr 30,000 to SFr 100,000 until
12/31/11.
Japan
United States 4.6 3.5 9.0Fannie Mae, Freddie Mac, AIG
France 6.4
Fortis and Dexia’s subsidiaries
Netherlands 3.3 6.5 3.3 ABN AMRO/Fortis
Unlimited coverage to domestic deposits13.02.4Iceland
Ireland 13.3 7.6
Luxembourg 4.3 7.7
Hypo Group Alpe Adria
Fortis
Hypo Real Estate
Anglo Irish Bank
Northern Rock, RBS
Banco Portugues de Negócios
Greece 18.3 1.7
Portugal 5.5
Fionia Bank
Kaupthing, Landsbanki, Glitnir,
Straumur-Burdaras, SPRON and
Sparisjódabankinn
United Kingdom 5.5 5.1 13.4 14.5
Nationalisation
State takes control over
institutions
2.5 0.8
Liquidity support Gross restructuring costs Asset purchases Asset guarantees
Banking crises policy responses in the advanced economies (2007-09)
1.1 0.1 1.1 2.6
% of deposits and
liabilities to
10.5
4.1Spain
non-residents
Recapitalization and other
restructuring costs, excluding
in % of GDP
liquidity and asset purchases,
2.8
5.014.0
1.2
13.1 0.7
1.1
Sweden
6.72.8Switzerland
Funded by treasury and
and central bank
% of GDP
Funded by treasury and
and central bank
% of GDP
7.7
0.2
0.6
Guarantees on liabilities
Significant guarantees on
bank liabilities in addition
to increasing deposit
insurance ceilings
Unlimited coverage to depositors
Deposits and unsecured claims of PCA banks
Bank and non-bank bond issues
2.8Germany
Belgium
Austria 8.2 2.1
Source: Laeven and Valencia (2010)

32
Jargon buster
Asset backed corporate paper (ABCP): is a form of commercial paper that is collateralized by oth-
er financial assets. Commercial Paper is a money-market security issued by large banks and corpora-
tions to get money to meet short term debt obligations and is only backed by an issuing bank or cor-
poration's promise to pay the face amount on the maturity date specified on the note.
Breaking the buck: Under SEC regulations, money market funds that serve retail investors must
keep two sets of accounting books, one reflecting the price they paid for securities and the other the
fund’s mark-to-market value (the ‘shadow price’, in market parlance). Funds do not have to disclose
the shadow price unless their net asset value (NAV) falls to USD 0.995 per share. Such a decline in
market value is known as ‘breaking the buck’ and generally leads to a fund’s collapse.
Certificates of deposits (CD): Is a time deposit, a financial product commonly offered to consumers
in the US by banks. CDs are similar to savings accounts in that they are insured and thus virtually
risk-free. They are different from savings accounts in that the CD has a specific, fixed term (often 3
months, 6 months, or 1-5 years), and, usually, a fixed interest rate.
Collateralised debt obligation (CDO): Despite the relatively high returns of MBSs, tranches rated
other than triple-A were sometimes hard to sell. Wall Street came up with a solution: they would buy
these low investment-grade tranches, largely rated BBB or A, from many MBSs and repackage them
into the new securities called CDOs. Approximately 80% of these CDO tranches would be rated triple-
A despite the fact that they generally comprised the lower-rated tranches of MBSs. CDOs would be
sold in tranches as well, with the risk-averse investors, again, paid first and the risk-seeking investors
paid last.
Common equity (or core Tier 1 capital): is the first buffer to absorb unexpected losses and is al-
ways available. It consists of common shares (commercial banks) or member certificates/cooperative
shares (cooperative banks) and retained earnings.
Conduits and special investment vehicles (SIVs): They are finance companies established to earn
a spread between their assets and liabilities; much like a traditional bank. Their strategy is to borrow
money by issuing short-term securities, at low interest rates and then lend that money by buying
longer term securities at higher interest rates. Long term assets could include, among other things,
mortgage backed securities (MBS), bank bonds, and corporate bonds. Conduits are 100% bank liquidi-
ty backed, commercial paper (CP) financed vehicles that invest in assets. So the CP investor is ex-
posed to the bank that pays under the liquidity facility if CP cannot be rolled. SIVs, in contrast, are
only partially backed by bank liquidity. Therefore, CP investors are exposed both to the bank liquidity
providers, and potentially to asset values, should bank liquidity not be sufficient to cover CP maturing.
Current account balance: This is the sum of the exports minus imports of goods and services, net
factor income (such as interest and dividends) and net transfer payments (such as foreign aid). When
a country runs a current account surplus, it increases its net foreign assets by the corresponding

33
amount. A current account deficit does the reverse. Both government and private payments are in-
cluded in the calculation.
Credit default Swap (CDS): is a bilateral contract under which one counterparty (‘protection buyer’)
agrees to compensate another counterparty (‘protection seller’) if a particular company (‘reference
entity’) experiences one of a number of defined ‘credit events’, such as bankruptcy or failure to meet
its obligations. Although there are important legal distinctions, a CDS contract has some similar eco-
nomic characteristics to an insurance contract under which the seller insures the buyer against default
of the reference entity.
Credit spreads: is the yield spread, or difference in yield between different securities.
Deposit guarantee scheme (DGS): has three functions. First, it aims to improve financial stability
by preventing unnecessary bank runs. Second, by covering most small deposits it also protects con-
sumers. It does not need to hamper competition, if only a limited part of the amount of savings is
guaranteed, leaving a large market open for competition between banks. In fact, and that is the third
function, a DGS improves the competitive position of small, systemically irrelevant banks relative to
systemically relevant banks (which always operate under the umbrella of an implicit state guarantee).
Money market mutual funds: They invest depositors’ money in short-term, safe securities such as
government bonds and highly rated corporate debt. These funds differed from bank deposits in one
important respect: they are not protected by deposit insurance.
Mortgage backed security (MBS): Is an asset-backed security (ABS) that represents a claim on the
cash flows from mortgage loans through securitization.
Originate-to-distribute model: This is a model whereby banks use borrowed money to make loans
and then package, repackage, slice and dice them and later sell them as debt securities to investors.
This is very different from the traditional originate-to-hold model: banks borrow to make loans and
hold them until maturity.
Quantitative easing: In theory quantitative easing can buoy growth through four channels. First, QE
lowers the long-end of the yield curve (interest rate channel). Second, when interest rates are kept
artificially low, yield-seeking investors will be forced into riskier, alternative investments (i.e. asset
prices are pushed upwards), which results in a positive wealth effect for the private sector (portfolio
rebalancing channel). Third, it improves export competitiveness through competitive devaluation of
the currency (exchange rate channel). Fourth, it boosts banks’ reserves thereby helping them in ex-
tending more loans (bank lending channel).
Repo: A repurchase agreement, also known as a repo, is the sale of securities together with an
agreement for the seller to buy back the securities at a later date. The repurchase price should be
greater than the original sale price, the difference effectively representing interest, also called the re-

34
po rate. The party that originally buys the securities effectively acts as a lender. The original seller is
effectively acting as a borrower, using their security as collateral for a secured cash loan at a fixed
rate of interest.
Securitisation: is the process by which securities are created by a special investment vehicle (SIV)
and issued to investors with a right to payments supported by the cash flows from a pool of financial
assets held by the SIV. For banks, the benefits of securitisation are large. By moving loans off their
books, banks can reduce the amount of capital they hold as protection against losses, thereby improv-
ing their earnings. Securitisation also lets banks rely less on deposits for funding, because selling se-
curities generates cash that could be used to make loans. Banks can also keep parts of the securities
on their books as collateral for borrowing (particularly from central banks). Prior to the crisis, fees
from securitisation were an important source of revenue.
Wholesale capital markets: is a market in which banks lend money to or borrow money from each
other for short periods.
Country codes:
PT: Portugal; GR: Greece; ES: Spain; US: United States; ZA: South Africa; IE: Ireland; GB: Great
Britain; IT: Italy; IN: India; India; FR: France; BR: Brazil; BE: Belgium; AT: Austria; JP: Japan; DE:
Germany; FI: Finland; CN: China; NL: Netherlands; RU: Russia; CH: Switzerland.