From leaves to livelihoods: Villagers of Minwoho, Cameroon harvesting Okok
Upload
nguyenhanhCategory
view
214download
0
Farmer Livelihoods in the Humid Forest and Moist Savannah Zones of
Cameroon
Ann Degrande, Kate Schreckenberg, Charlie Mbosso and Chimène Mfoumou
LIMITED CIRCULATION Correct citation: Degrande A, Schreckenberg K, Mbosso C and Mfoumou C. 2007. Farmer Livelihoods in the Humid Forest and Moist Savannah zones of Cameroon. Working Paper nr 47 . Yaoundé, ICRAF-WCA/HT. 61p Titles in the Working Paper Series aim to disseminate interim results on agroforestry research and practices and stimulate feedback from the scientific community. Other publication series from the World Agroforestry Centre include: Agroforestry Perspectives, Technical Manuals and Occasional Papers. Published by the World Agroforestry Centre West and Central Africa Humid Tropics Programme P.O. Box 16317, Yaoundé Cameroon Tel: +237 22 21 50 84 / 22 23 75 60 Fax: +237 22 21 50 89 / 22 23 74 40 Email: [email protected] Internet: www.worldagroforestry.org/aht © World Agroforestry Centre 2007 Working Paper nr 47 The views expressed in this publication are those of the authors and not necessarily those of the World
Agroforestry Centre.
Articles appearing in this publication may be quoted or reproduced without charge, provided the source
is acknowledged.
The geographic designation employed and the presentation of material in this publication do not imply
the expression of any opinion whatsoever on the part of the World Agroforestry Centre concerning the
legal status of any country, territory, city or area or its authorities, or concerning the delimitation of its
frontiers or boundaries.
i
About the authors
Ann DEGRANDE Socio-Economist (PhD) at the World Agroforestry
Centre, West and Central Africa Humid Tropics Programme in Yaoundé, Cameroon. Ann’s main interest is in evaluating diffusion and adoption of agroforestry technologies. [email protected]
Kathrin SCHRECKENBERG Kathrin is a research fellow (PhD) at the Overseas
Development Institute, London. Her principal
interest is in understanding how farmers can obtain
greater benefits from the trees on their land both
individually and through community forestry.
Charlie MBOSSO Charlie is a research assistant (MSc Socio-
economics) with the marketing team at the World
Agroforestry Centre, West and Central Africa Humid
Tropics Programme in Yaoundé, Cameroon.
Chimène MFOUMOU Chimène (Ir agronome) has carried out many farmer
surveys with the ICRAF-team in Yaoundé as a
research assistant. [email protected]
ii
Abstract
Tree-crop or forest-based farming systems in the humid forest and savannah areas of Cameroon were, until recently, highly dependent on cocoa and coffee. This made farmers extremely vulnerable to fluctuations in world market prices. Consequently, farmers turned their attention to food cropping, thereby opening up new forest land where possible and shortening fallow periods elsewhere. This inevitably led to soil fertility problems, whereas rural households were still suffering from seasonality effects and cash shortages, due to the low added value of food crops. To address these two problems, poverty reduction strategies must thus focus on: (1) raising agricultural and natural resource productivity through the generation and dissemination of improved technologies and, (2) diversifying income sources in order to reduce dependency on few crops that are prone to price fluctuations and to smoothen seasonal fluctuations in income and consumption. However, the Central African region in general and southern Cameroon in particular, faces some major weaknesses that impede or, at least slow down research and development efforts. These include a weak human capital base, degradation of the natural resource base, insufficient and poorly maintained rural infrastructure and inappropriate pro-poor policies and institutions.
iii
Résumé
Dans les zones de forêt et savane humides du Cameroun, les systèmes de production arboricole ont longtemps été basés sur quelques cultures de rente, telles que le café et le cacao. Ceci a rendu les paysans extrêmement vulnérables aux fluctuations des prix de ces cultures au marché mondial. En réponse, les paysans se sont tournés vers les cultures vivrières en défrichant plus de forêt pour ouvrir de nouveaux champs la où cela était encore possible, et en réduisant les périodes de jachères ailleurs. Cette évolution inévitablement cause des problèmes de baisse de fertilité des sols, sans résoudre les problèmes de vulnérabilité des ménages ruraux qui continuent à souffrir des périodes de soudure alimentaire et financière. Afin de résoudre ces deux problèmes, les stratégies de réduction de la pauvreté dans la région doivent se focaliser sur : (1) augmenter la productivité de l’agriculture et des ressources naturelles par la génération et la dissémination des technologies améliorées et, (2) diversifier les sources de revenus pour réduire la dépendance de quelques cultures dont les prix fluctuent beaucoup et pour alléger les effets saisonniers dans la consommation et les revenus des ménages. Cependant, la région de l’Afrique Centrale entière et le Sud du Cameroun en particulier, est victime d’un nombre de faiblesses qui freinent, ou au moins ralentissent, les efforts de recherche et de développement. Nous constatons un capital humain faible, une dégradation accrue des ressources naturelles, une infrastructure rurale insuffisante et mal entretenue et des politiques et institutions de lutte contre la pauvreté, mal adaptées au contexte actuel.
Keywords
Cameroon, poverty reduction, sustainable livelihoods framework, well-being
iv
Acknowledgements
The authors would like to thank the Forestry Research Project (FRP), UK, the International
Fund for Agricultural Development (IFAD), Rome, the Flemish Association for Cooperation
and Technical Assistance (VVOB), Belgium and the Government of Cameroon for their
financial contribution to the field research that led to this paper. We are also indebted to the
farmer communities for their patience and collaboration during the numerous meetings and
surveys.
v
Contents
About the authors............................................................................................................i Abstract ..........................................................................................................................ii Résumé......................................................................................................................... iii Keywords ..................................................................................................................... iii Acknowledgements.......................................................................................................iv Contents .........................................................................................................................v Introduction....................................................................................................................1 Methodology..................................................................................................................2 Results............................................................................................................................7
1. Presentation of the Humid Forest and Moist Savannah Zones of Cameroon ........7 1.1 Socio-economic Context..................................................................................7
1.2 Biophysical Context.......................................................................................13 Humid Forest .......................................................................................................13 Moist Savannah....................................................................................................13
2. Farmer Livelihoods..............................................................................................14 2.1 The Sustainable Livelihoods Framework Approach......................................14 2.2 Vulnerability Context.....................................................................................16 2.3 Livelihood Assets...........................................................................................22 2.4 Transforming Structures and Processes .........................................................39 2.5 Livelihood Strategies .....................................................................................42 2.6 Livelihood Outcomes.....................................................................................46
Conclusion and Recommendations..............................................................................50 References....................................................................................................................57 Working Paper Series ..................................................................................................62

1
Introduction
The forests of West and Central Africa, rich in flora and fauna, are degrading rapidly due to timber exploitation and devastating slash and burn agriculture from farmers in search of new farm land to respond to ever increasing population numbers (ASB 2003). For the specific case of Cameroon, UNDP (2003) recorded that 33.4 % of the Cameroonian population is living below the poverty line of USD 1 a day. In the forest areas, this proportion rises to 66 % of the population. Rural poverty was exacerbated in the early 1990s by the devaluation of the CFA franc and slumping coffee and cocoa prices in the world market, until then major income generators for farmers in the region (ASB 2003). Traditional slash and burn cultivation, although it has shown its worth in the past, is becoming increasingly unsustainable today with the growth in population. According to MINEF (1996), slash-and-burn agriculture is considered responsible for almost 85 % of annually deforested surface area in Cameroon. Moreover, average yearly increase in Cameroon’s population now stands at 2.2 % (World Bank 2002). In the context of unchanged farming systems, this growth rate implies that in the near future more land will have to be made available to farmers if they are to continue to produce enough food to feed the growing population. Responding to this land pressure, farmers have shortened their fallow period from 15-20 years to 3-4 years and less (Tonye et al. 1988), leading to soil degradation, declining soil fertility and thus crop yields and increasing weed infestation. Technologies are therefore urgently needed to sustain production systems based on short fallows. In response to these evolutions, the ‘International Centre for Research in Agroforestry’ (ICRAF), now called ‘World Agroforestry Centre’, has been looking for agroforestry technologies that can reduce deforestation and soil depletion in the humid tropics of West and Central Africa (ICRAF 2000a). From 1987 to 1998, research was oriented towards the development of improved fallow management methods (ICRAF 1995; ICRAF 1996). The techniques that were tested and evaluated in collaboration with farmers included planting of fast-growing and nitrogen-fixing trees and shrubs that replenish soil fertility quicker than the natural vegetation (ICRAF 1995; ICRAF 1996). However, soon it became clear that tackling the problems of shortening fallows and declining soil fertility alone would not raise farmers of the region out of poverty. This concern was much in accordance with the growing consensus among researchers and policy makers
2
worldwide that poverty alleviation in the tropics can only be achieved through combining increased agricultural production with increased and diversified income for rural households (IFAD 2001a). In 1999, ICRAF reoriented its research towards the domestication of indigenous fruit and medicinal tree species (Tchoundjeu et al. 1999; ICRAF 2003). The main objective of this research programme was to increase, stabilise and diversify farmers’ income and to improve health care in rural areas, while at the same time encouraging the development of sustainable agroforestry practices that rehabilitate degraded farmland, sequester carbon and other greenhouse gases and enhance both biodiversity and the functioning of agroecosystems (ICRAF-AHT 2002; ICRAF-AHT 2003; Leakey et al. 2003). The research approach also emphasised farmers’ active involvement in the development of new technologies in order to facilitate their adoption. However, understanding the diversity of livelihood portfolios and the options rural people develop by integrating new opportunities in order to grow out of poverty is becoming increasingly complex. Furthermore, farmers in the tropics make decisions regarding a given field or a given practice, such as soil fertility management and agroforestry within the context of the whole farm and of the totality of resources and assets available to them, and not in isolation (Izac 2003). This paper therefore focuses on understanding issues at the level of households and villages, and on understanding the broader context in which farmers earn their living. It examines existing land-use systems and farmers’ livelihood strategies in order to determine entry points for the proposed innovations.
Methodology
“Rural households operate complex farming systems, allocating their limited resources
among many enterprises in a manner determined by their priorities, preferences and their biophysical and socio-economic circumstances and constraints”. (Franzel et al. 2002) In assessing the adoption potential of agroforestry technologies therefore, a systems approach is required. To unravel the complexities in which farmers operate and make choices, we used the sustainable livelihood analysis method as developed by DFID (1999). This method recognises that households pursue a range of livelihood strategies based on the assets (natural, financial, social, human and physical capital) they have to draw on and the livelihood outcomes they wish to achieve, be it enhancing household income, food security, health, social networks and savings (DFID 1999). In its simplest form, the framework views people as operating in a context of vulnerability. Within this context, they have access to certain assets or poverty reducing factors. These gain their meaning and value through the prevailing social, institutional and organisational environment. This environment also influences the
3
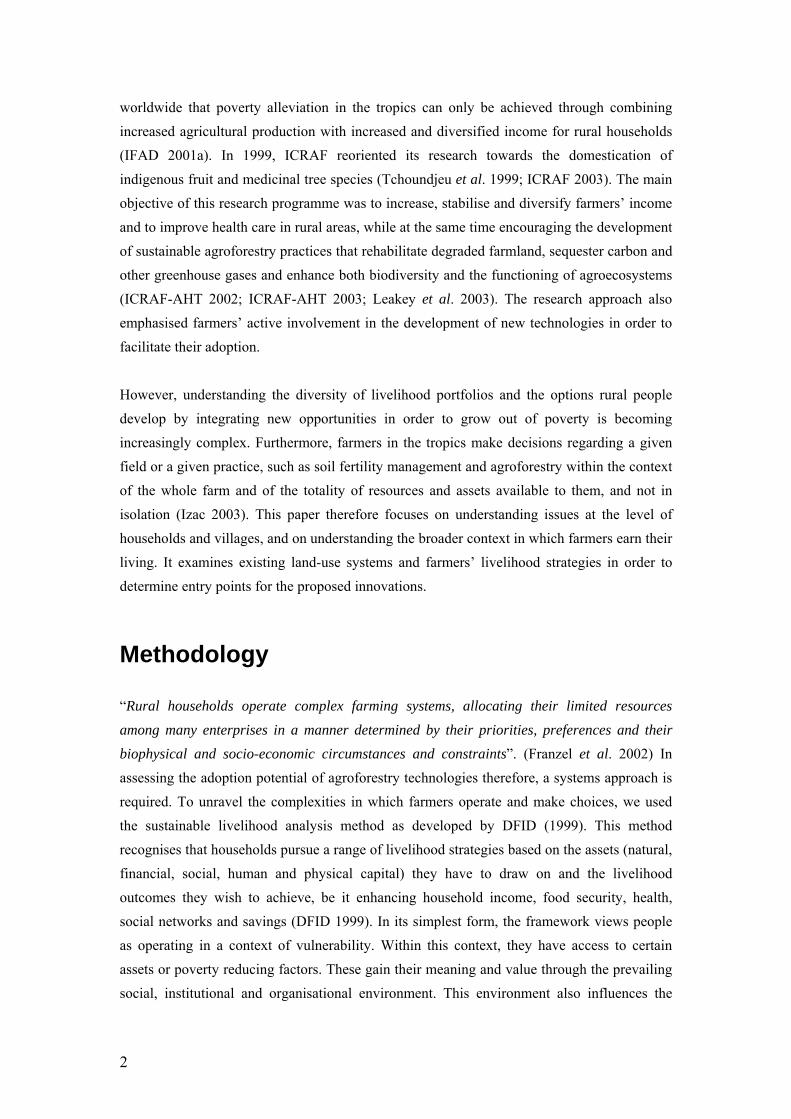
livelihood strategies – ways of combining and using assets – that are open to people in pursuit of beneficial livelihood outcomes that meet their own livelihood objectives (DFID 1999). Although the sustainable livelihoods framework was used to synthesise findings, the analysis itself incorporated a variety of tools, as presented in Table 1. We used a combination of quantitative and qualitative data collection methods (IISD 1995; FAO 2003). We also opted to involve the communities as much as possible in the gathering and analysis of information by using participatory survey tools, carried out with focus groups, such as village mapping, historical profile and Venn diagram. The study was carried out in 8 sites (ICRAF’s pilot villages: Abondo, Bandjoun, Belo, Elig-Nkouma, Ngoumou, Nkolfep, Nkom-Efoufoum and Ting-Melen; Fig 1) in 2002-03.
Table 1: Participatory methods and their uses (inspired by IISD 1995; FAO 2003)
Method Brief description Used to collect data on: Timeline Historical profile of longer-
term events or trends Vulnerability context; changes in land use and agricultural activities; importance of trees
Resource maps Maps identifying natural and other resources
Natural capital; land use systems; existence of and access to services and infrastructure
Venn diagrams Diagrammatic representation of key institutional features and their interactions
Social capital; relations between social groups, institutional and policy environment
Wealth ranking Assigning households to wealth categories
Socio-economic characterisation of pilot sites; strategies and assets needed to exit from poverty, relations between social groups
Agricultural calendars
Graphical depiction of agricultural activities
Knowledge on farming system; strategies; vulnerability context (peak and lean periods in labour); human capital
Household income & expenditure
Graphical depiction of income and expenditure
Vulnerability context (dearth periods); presence of financial capital
Research on livelihoods started with a complete household inventory in the 8 study sites (Fig 1). We recorded for each household in the community: age and sex of the head of household, household composition (number and age of spouse(s) and children), wealth level and type of livelihood strategy.

4
In the light of this study and based on previous work, we identified livelihood categories that reflect the household’s main sources of income in ICRAF’s pilot villages:
1. cocoa or coffee dominant. Households that generate their revenues mainly
from the “traditional” cash crops, mainly cocoa in the forest zone and coffee in the savannah zone.
2. cocoa or coffee + food crops. Households that generate an important part of their revenues from cocoa or coffee, but complement this income with food crops.
3. cocoa or coffee + market gardening. Households that generate an important part of their revenues from cocoa or coffee, but complement this income with market gardening (e.g. tomatoes, okra, green maize, green vegetables).
4. food crops dominant. Households that generate revenues mainly from food crops
5. market gardening. Households that generate revenues mainly from market gardening
Figure 1: Location of study sites, humid forest and moist savannah zones of Cameroon (drawn by
Makak 2005)
Nkom-Efoufoum is bordering Elig-Nkouma and is not shown on the map
5
6. other perennials. Households that generate their revenues mainly from perennial crops other than cocoa and coffee; these may include oil palm, fruit trees, etc.
7. non-agricultural. Households that generate their revenues mainly from non-agricultural activities, such as petty trade, pension, casual labour, etc.
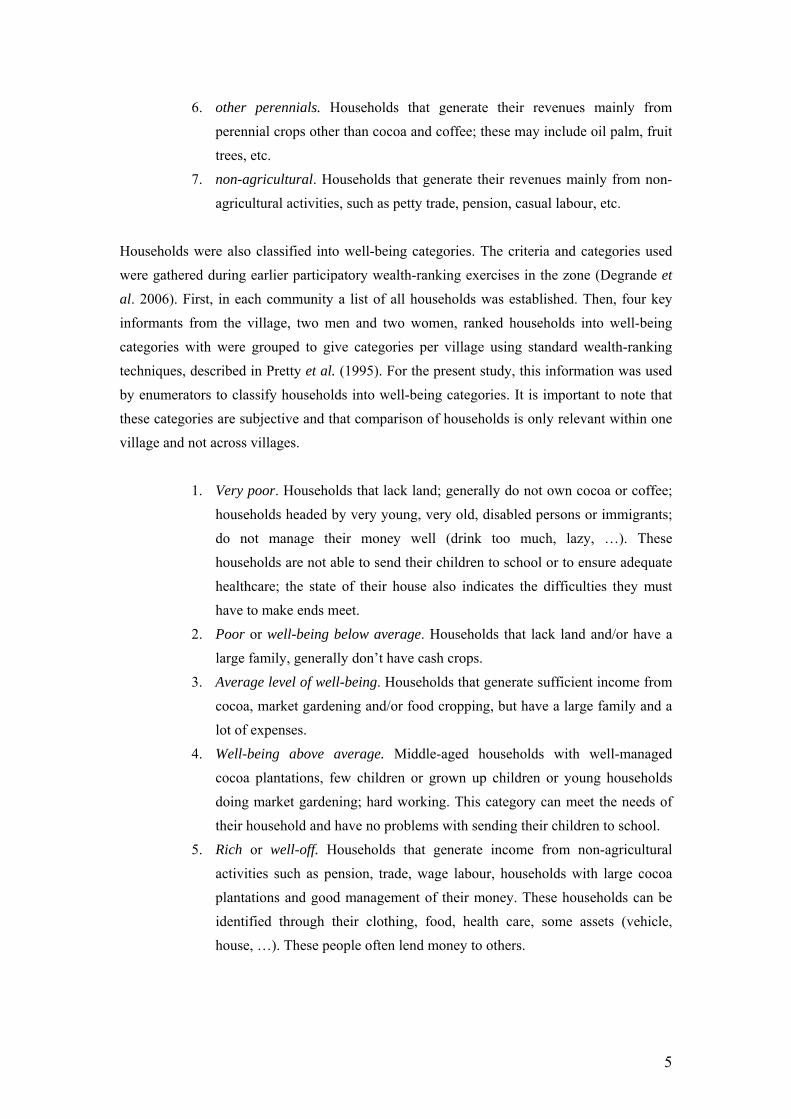
Households were also classified into well-being categories. The criteria and categories used were gathered during earlier participatory wealth-ranking exercises in the zone (Degrande et al. 2006). First, in each community a list of all households was established. Then, four key informants from the village, two men and two women, ranked households into well-being categories with were grouped to give categories per village using standard wealth-ranking techniques, described in Pretty et al. (1995). For the present study, this information was used by enumerators to classify households into well-being categories. It is important to note that these categories are subjective and that comparison of households is only relevant within one village and not across villages.
1. Very poor. Households that lack land; generally do not own cocoa or coffee;
households headed by very young, very old, disabled persons or immigrants; do not manage their money well (drink too much, lazy, …). These households are not able to send their children to school or to ensure adequate healthcare; the state of their house also indicates the difficulties they must have to make ends meet.
2. Poor or well-being below average. Households that lack land and/or have a large family, generally don’t have cash crops.
3. Average level of well-being. Households that generate sufficient income from cocoa, market gardening and/or food cropping, but have a large family and a lot of expenses.
4. Well-being above average. Middle-aged households with well-managed cocoa plantations, few children or grown up children or young households doing market gardening; hard working. This category can meet the needs of their household and have no problems with sending their children to school.
5. Rich or well-off. Households that generate income from non-agricultural activities such as pension, trade, wage labour, households with large cocoa plantations and good management of their money. These households can be identified through their clothing, food, health care, some assets (vehicle, house, …). These people often lend money to others.
6
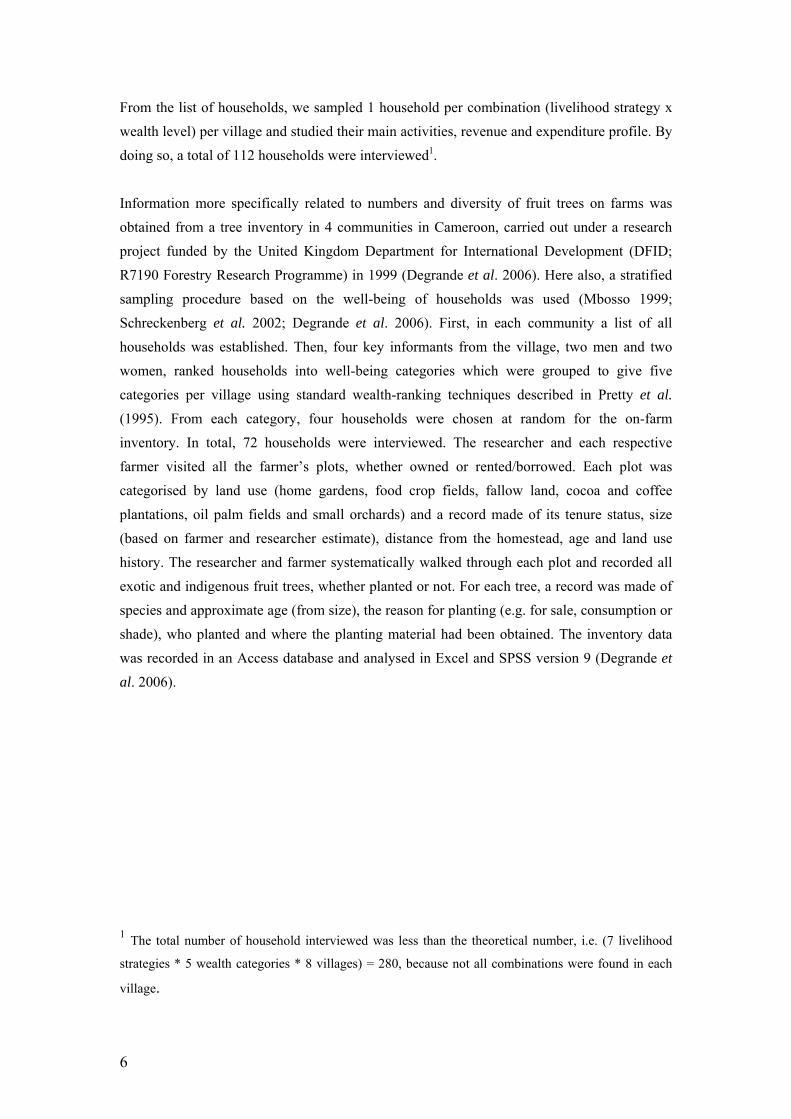
From the list of households, we sampled 1 household per combination (livelihood strategy x wealth level) per village and studied their main activities, revenue and expenditure profile. By doing so, a total of 112 households were interviewed1. Information more specifically related to numbers and diversity of fruit trees on farms was obtained from a tree inventory in 4 communities in Cameroon, carried out under a research project funded by the United Kingdom Department for International Development (DFID; R7190 Forestry Research Programme) in 1999 (Degrande et al. 2006). Here also, a stratified sampling procedure based on the well-being of households was used (Mbosso 1999; Schreckenberg et al. 2002; Degrande et al. 2006). First, in each community a list of all households was established. Then, four key informants from the village, two men and two women, ranked households into well-being categories which were grouped to give five categories per village using standard wealth-ranking techniques described in Pretty et al. (1995). From each category, four households were chosen at random for the on-farm inventory. In total, 72 households were interviewed. The researcher and each respective farmer visited all the farmer’s plots, whether owned or rented/borrowed. Each plot was categorised by land use (home gardens, food crop fields, fallow land, cocoa and coffee plantations, oil palm fields and small orchards) and a record made of its tenure status, size (based on farmer and researcher estimate), distance from the homestead, age and land use history. The researcher and farmer systematically walked through each plot and recorded all exotic and indigenous fruit trees, whether planted or not. For each tree, a record was made of species and approximate age (from size), the reason for planting (e.g. for sale, consumption or shade), who planted and where the planting material had been obtained. The inventory data was recorded in an Access database and analysed in Excel and SPSS version 9 (Degrande et al. 2006).
1 The total number of household interviewed was less than the theoretical number, i.e. (7 livelihood
strategies * 5 wealth categories * 8 villages) = 280, because not all combinations were found in each
village.
7
Results
1. Presentation of the Humid Forest and Moist Savannah Zones of Cameroon
1.1 Socio-economic Context
Population and Social Organisation (www.iss.co.za)
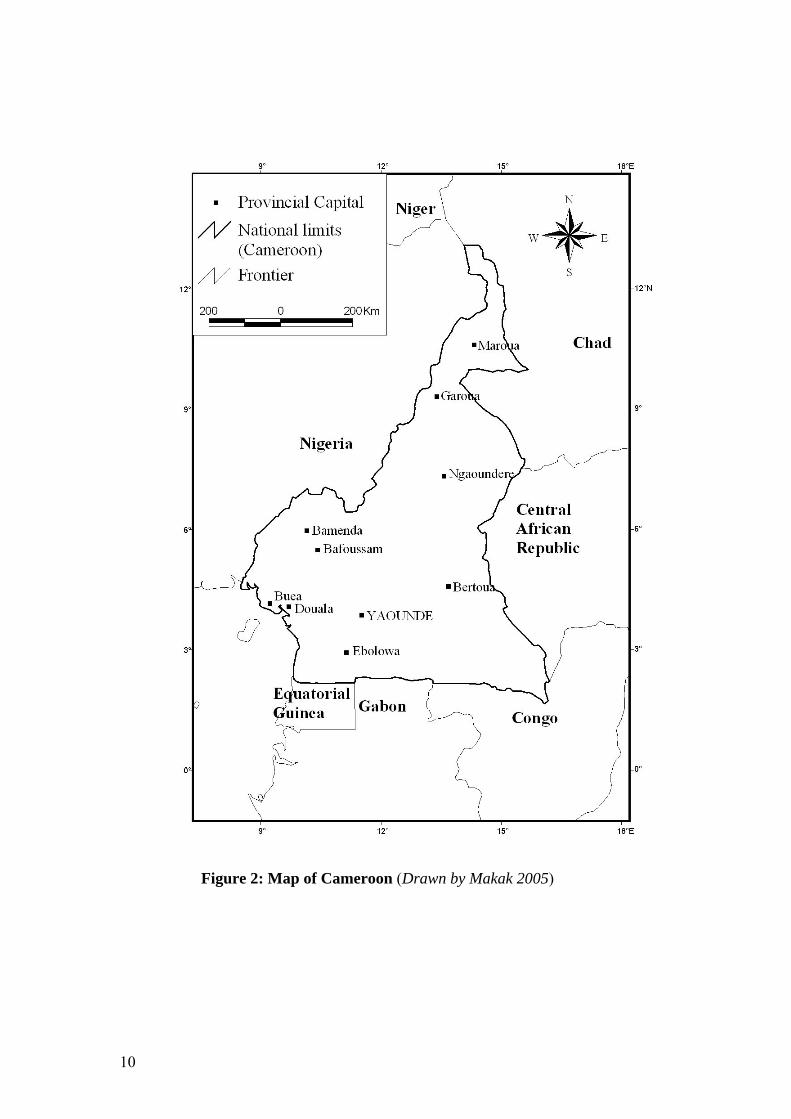
Cameroon is situated in western Africa, bordering the Bight of Biafra (6o00’ N, 12o00’ E). Neighbouring countries are Equatorial Guinea, Gabon and the Republic of the Congo (Congo-Brazaville) in the south, Central African Republic in the east, Chad in the northeast and Nigeria in the northwest and west (Fig 2). Cameroon has a total area of 475,440 km2 and is inhabited by various ethnic groups. The largest group are the Cameroon highlanders who comprise 31% of the population. Other major groups are the Equatorial Bantu (19 %), Kirdi (11 %), Fulani (10 %) and Northwestern Bantu (9 %). Total population was estimated at 16.2 million in July 2002 with an annual growth rate of 2.36 %. Forty-two percent of the population falls in the age category 0-14 years. Linguistically diverse with more than 200 local languages classified in 24 major African language groups, Cameroon has both English and French as official languages. While the people of the south and west have been profoundly influenced by Christianity, the people of the north are either Muslim or animist and have largely retained their traditional modes of life. One other major contrast in the social geography of Cameroon is between Anglophone northwest and southwest Cameroon, and the much larger, more populous Francophone area of former East Cameroon. The contrasting influences of British and French rule remain evident in many aspects of life.
Economy (www.isss.co.za)
Cameroon has a rich and diversified commodity-based economy. Agriculture was the sole engine of growth and foreign-exchange earning until the late 1970s when oil became the primary source of income. Food and export crops, livestock, fishing and forestry are the mainstay of the economy, accounting for about 29 % of GDP, employing some 50 % of the active population and generating more than half of total export earnings. The petroleum and manufacturing sectors represent 20 % of GDP. The secondary sector contributes 31 % of
8
GDP and employs 15 % of the population. Cameroon is the most important market in the Communauté Economique et Monétaire de l’Afrique Centrale (CEMAC). Most agricultural production comes from smallholders, with the exception of rubber and oil palm, which are run under a plantation system. Millet, sorghum, rice, yam, cassava and plantain are produced for both domestic consumption and for exports to countries within the central African region. The main cash crops, which provide about 40 % of Cameroon’s exports, are cocoa (Cameroon is the world’s sixth-largest producer; FAOSTAT 2003), coffee and cotton. With forests and woodland covering nearly 78 % of the country, the forestry sector is the country’s second largest export earner after oil, generating around 20 % of export revenues and employing some 55,000 people. There is, however, a great untapped potential in the forestry sector – Cameroon could be one of the major exporters of timber and other wood products but is constrained by the lack of basic transport infrastructure, especially in the tropical rainforest region of the country. Five species, Ayous (Triplochiton scleroxylon), Azobe (Lophira alata), Iroko (Milicia excelsa), Sapelli (Entandrophragma cylindricum), and Sipo (Entandrophorma utile), traditionally accounted for more than 75 % of Cameroon’s timber exports (Ndoye and Kaimowitz 2000). Logging is quite selective and rarely involves clearing of forests. Nevertheless, it significantly disturbs the forests affected, often reduces the availability of commercial timber species, and sometimes encourages hunting and agricultural activities in nearby areas.
Land Tenure
Cameroon’s postcolonial land policy, established through the 1974 reform and currently still in force, has instituted the principle of the national land domain. “The State shall be the
keeper of all the lands. In that capacity, it can intervene in order to ensure a rational use or in order to take into account the imperatives defence of economic options of the nation” (law 74-1 of 6 July 1974). The land law institutes only one judicial form, i.e. absolute and exclusive private property, and one procedure, i.e. the registration. The land title is the official testimony of land property. It can be obtained in many ways: purchase by mutual agreement, donation inter vivos, legacy or State’s attribution with an obligation to land development. However, in spite of the compulsory aspect of land registration, the majority of farming lands remains under customary occupation (Bigombe and Bikie 1998). In 1987, less than 30,000 of the 1,145,700 rural farms in Cameroon were registered lands (Cameroon Agricultural Census 1987). Customary land rights are usually based on lineage (Stienbarger 1990). Original rights to land were gained through settlement or clearing. Settlers on formerly unclaimed land
9
“founded lineages”, which would exercise control over the land in the area. Access to land and generational transfer of property rights are determined by the type of descent groups. In most areas of Cameroon, property rights are passed from father to son. If a man has more than one wife, each wife with sons may be allotted an equal share of the father’s land to be distributed among the sons, although the wife may continue to work on the lands she worked while her husband lived. If a man dies without male heirs, his eldest brother will usually get control over the land. It is critical to realise that women are rarely allocators of land rights. Their right to use land generally comes through men, either from a husband as part of his holdings or from other male family members.
Poverty
Similar to most countries in the region, Cameroon has significant natural resources but many poor people. From 1977 to 1985, Cameroon enjoyed an export-led boom based on petroleum, coffee and cocoa (ASB 2003). This boom came to an end in the second half of the 1980s, as the country’s oil ran out and international prices of its main export commodities slumped. The fall in export revenues forced the government to stop subsidizing agricultural inputs and to cut the prices of coffee and cocoa offered to farmers. This was followed, in the early 1990s by serious cuts in public-sector employment and wages. Finally, Cameroon’s currency, the franc CFA, was devalued in 1994 (ASB 2003). Cash crops, which had earned 123 billion FCFA for rural households in 1984-85, only generated 6.3 billion FCFA in 1992-93 (Amin and Dubois 1999). Food crop production also fell in value from 417 billion CFA in 1984-85 to 378 billion in 1992-93 (Amin and Dubois 1999). Average consumption fell by 30 % from 1983/84 to 1996 (Cida 2000). Education was hard hit by financial constraints faced by the government in the early 1990s. School participation fell from full attendance in 1990 to 81 % by 1996 (Cida 2000). As a result, 29 % of young men and 46 % of young women in rural areas did not finish primary school. Poorly maintained health infrastructure and services – also a consequence of budget cuts since the early 1990s – have led to sharp increases in infant and child mortality rates and a decline in life expectancy.
10
Figure 2: Map of Cameroon (Drawn by Makak 2005)
11
The macro-economic context has improved since 1995: annual economic growth is stabilized around 5.0 %, inflation was reduced from 5.2 % to 2.8 % per annuum, and the external deficit is maintained at about 2.4 % of GDP (Amin and Dubois 1999). Nevertheless, Cameroon is still beset with an unsustainably high level of foreign debt - an estimated USD 10.9 billion in 2000 (www.iss.co.za). In January 2001, the Paris Club creditors agreed to restructure Cameroon’s public external debt under the enhanced Heavily Indebted Poor Countries (HIPC) initiative bringing a reduction in total debt services. The overall improvement of Cameroon’s economy remains fragile because it is facing strong competition from outside, fluctuations of world prices for exports, and weak confidence on the part of investors, both national and foreign, in the country’s future. The weak confidence is in large part due to the country’s extremely poor ratings on indices of corruption, human rights, and democracy. Despite increases in GDP and private consumption per capita, poverty still remains significant. Today, measures of relative and absolute poverty thresholds show not only increasing poverty but also increasing inequality. About 5.6 million of Cameroon’s 6.5 million poor live in rural areas, with the most intense poverty occurring in the plateau and forest zones (Cida 2000). In the forest areas, this proportion rises to 66 % of total forest population (Cida 2000). While GDP per capita was USD 559 in 2001, UNDP (2003) recorded that 33.4 % of Cameroon’s population was living below the poverty line of USD 1 a day. Table 2 summarises some development indicators for Cameroon.
Table 2: Some development indicators for Cameroon
Population, total (millions) in 2003 16.1 Population growth (annual %) in 2003 2.0 Rural population (% of total) 51 Forest area (sq. km) 2,386,000 Annual deforestation (% of change, 1990-2000) 0.9
Source: The World Bank, World Development Indicators database, 2003
12
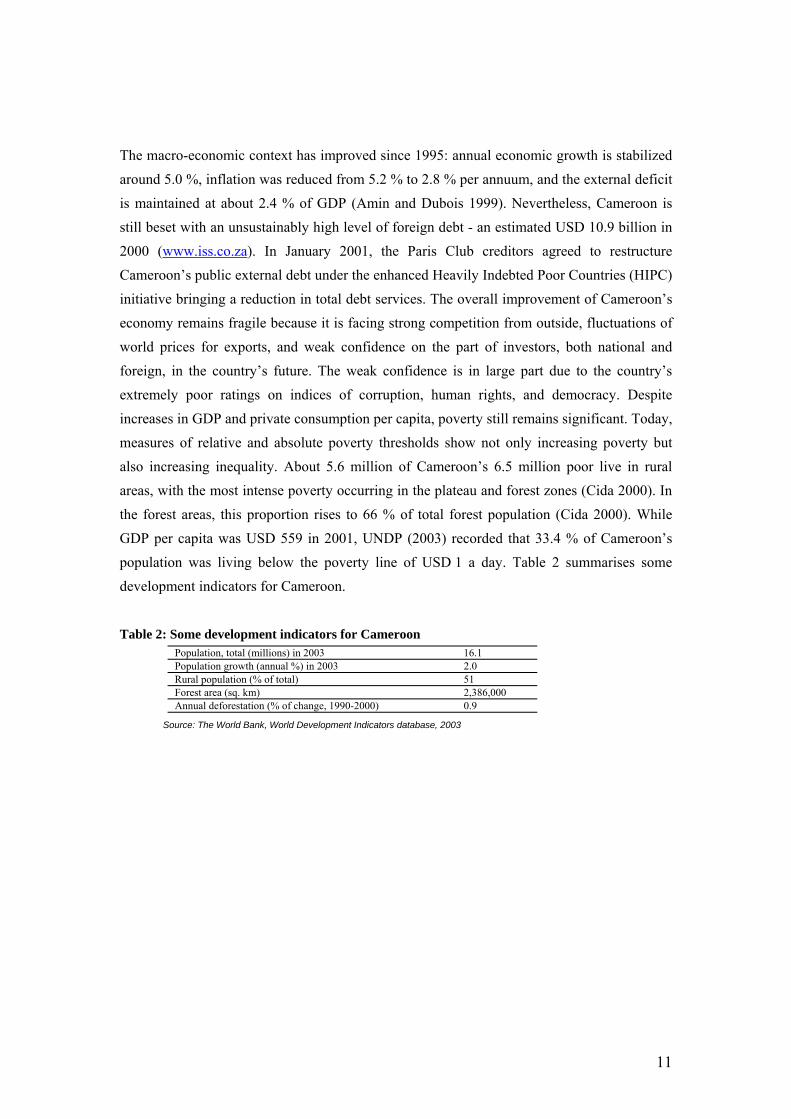
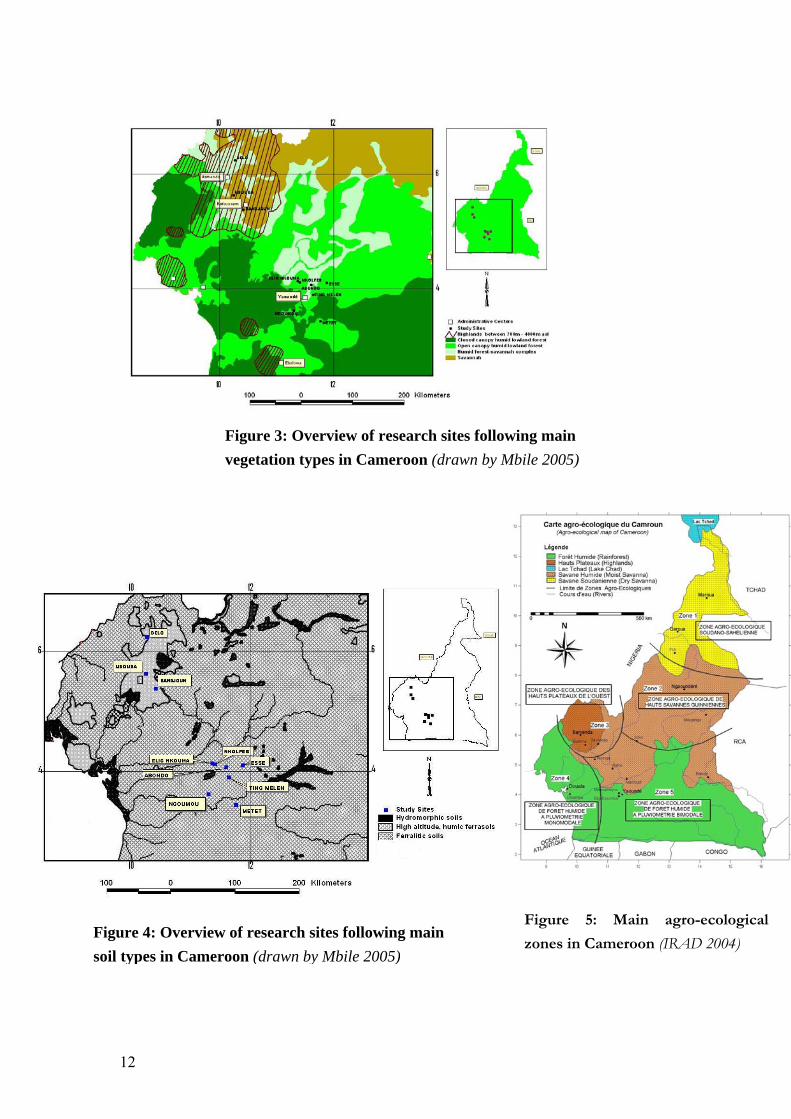
Figure 3: Overview of research sites following main vegetation types in Cameroon (drawn by Mbile 2005)
Figure 4: Overview of research sites following main soil types in Cameroon (drawn by Mbile 2005)
Figure 5: Main agro-ecological
zones in Cameroon (IRAD 2004)
13
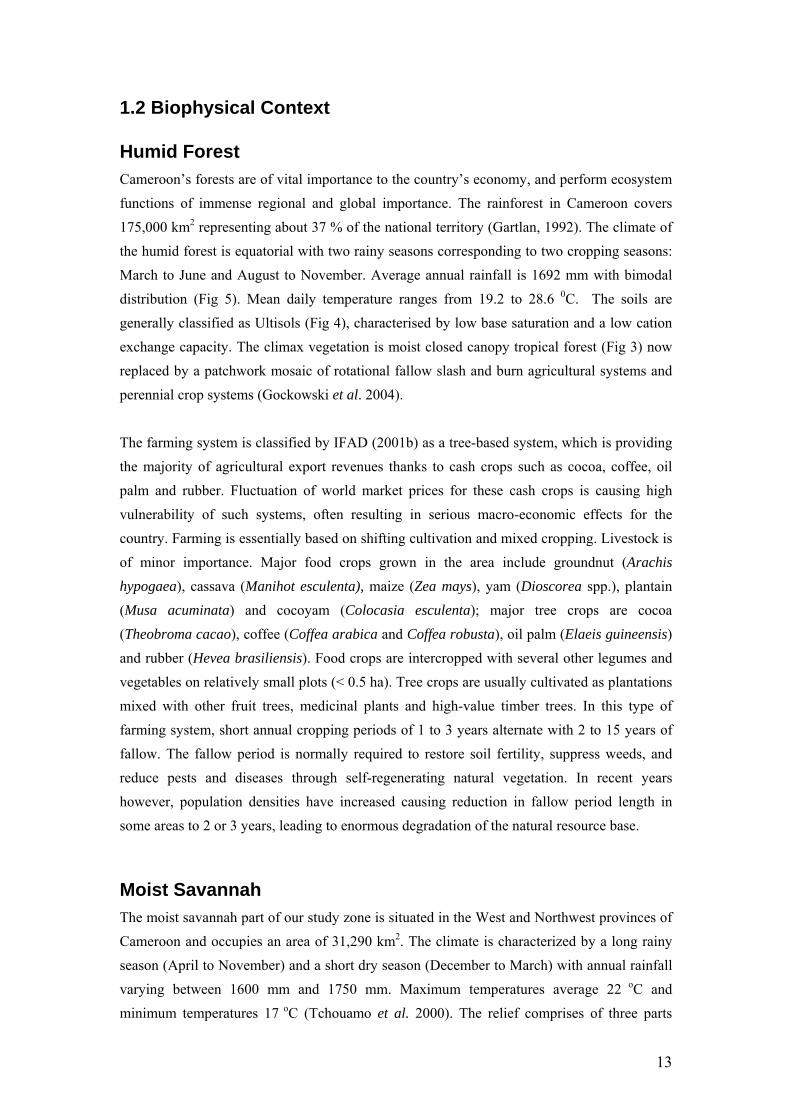
1.2 Biophysical Context
Humid Forest Cameroon’s forests are of vital importance to the country’s economy, and perform ecosystem functions of immense regional and global importance. The rainforest in Cameroon covers 175,000 km2 representing about 37 % of the national territory (Gartlan, 1992). The climate of the humid forest is equatorial with two rainy seasons corresponding to two cropping seasons: March to June and August to November. Average annual rainfall is 1692 mm with bimodal distribution (Fig 5). Mean daily temperature ranges from 19.2 to 28.6 0C. The soils are generally classified as Ultisols (Fig 4), characterised by low base saturation and a low cation exchange capacity. The climax vegetation is moist closed canopy tropical forest (Fig 3) now replaced by a patchwork mosaic of rotational fallow slash and burn agricultural systems and perennial crop systems (Gockowski et al. 2004). The farming system is classified by IFAD (2001b) as a tree-based system, which is providing the majority of agricultural export revenues thanks to cash crops such as cocoa, coffee, oil palm and rubber. Fluctuation of world market prices for these cash crops is causing high vulnerability of such systems, often resulting in serious macro-economic effects for the country. Farming is essentially based on shifting cultivation and mixed cropping. Livestock is of minor importance. Major food crops grown in the area include groundnut (Arachis hypogaea), cassava (Manihot esculenta), maize (Zea mays), yam (Dioscorea spp.), plantain (Musa acuminata) and cocoyam (Colocasia esculenta); major tree crops are cocoa (Theobroma cacao), coffee (Coffea arabica and Coffea robusta), oil palm (Elaeis guineensis) and rubber (Hevea brasiliensis). Food crops are intercropped with several other legumes and vegetables on relatively small plots (< 0.5 ha). Tree crops are usually cultivated as plantations mixed with other fruit trees, medicinal plants and high-value timber trees. In this type of farming system, short annual cropping periods of 1 to 3 years alternate with 2 to 15 years of fallow. The fallow period is normally required to restore soil fertility, suppress weeds, and reduce pests and diseases through self-regenerating natural vegetation. In recent years however, population densities have increased causing reduction in fallow period length in some areas to 2 or 3 years, leading to enormous degradation of the natural resource base.
Moist Savannah The moist savannah part of our study zone is situated in the West and Northwest provinces of Cameroon and occupies an area of 31,290 km2. The climate is characterized by a long rainy season (April to November) and a short dry season (December to March) with annual rainfall varying between 1600 mm and 1750 mm. Maximum temperatures average 22 oC and minimum temperatures 17 oC (Tchouamo et al. 2000). The relief comprises of three parts
14
(FAO-UNDP 1979): plains and valleys below 800 m, highlands with altitudes between 800 m and 1500 m and mountains. The soils of the highlands are classified as Ferralitic, whereas the rest are old volcanic soils. Originally, the whole area was covered with forests, but due to human activities, such as agriculture, pasture, and bush fire, the area is now covered with different types of moist savannah vegetation (FAO-UNDP 1979). The only witnesses of the original forest vegetation, at present, are sacred groves and gallery forests along rivers. However, the population has re-afforested the area with timber (Eucalyptus) and fruit trees (Cola acuminata, Dacryodes edulis, Persea americana, Mangifera indica, Canarium schweinfurthii).
In 1987, its population was estimated at 2,577,129 habitants with an average density of 82 habitants km-2 (Tchouamo et al. 2000). This population puts a lot of pressure on the land, resulting in 2 cropping seasons per year with fallow periods of less than 6 months. Main food crops include maize, plantain, beans, yam and cocoyam, often cultivated in association. The principal cash crop is coffee, which is cultivated in an agroforestry system with fruit trees in the upper layer and shade-tolerant crops in the under-storey.
2. Farmer Livelihoods
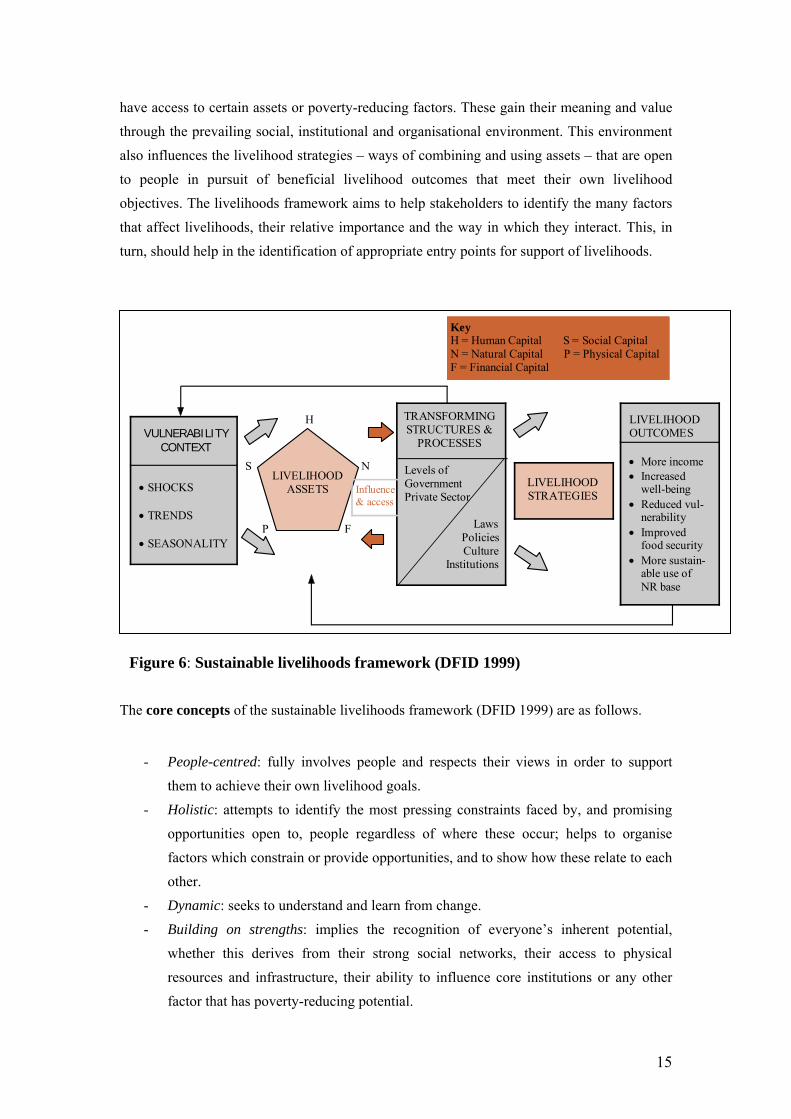
2.1 The Sustainable Livelihoods Framework Approach The concept of livelihoods has moved analysis away from narrow parameters of production, employment and income to a much more holistic view which embraces social and economic dimensions, reduced vulnerability and environmental sustainability, all within the context of building on local strengths and priorities (Shackleton et al. 2000). This approach recognises that households pursue a range of livelihood strategies based on the assets (natural, financial, social, human and physical capital) they have to draw on and the livelihood outcomes they wish to achieve. The ability to access various combinations of assets helps to determine how vulnerable or robust a livelihood may be. The livelihoods of the poor are complex and dynamic, typified by a diverse portfolio of activities that not only enhance household income but also food security, health, social networks and savings. The sustainable livelihoods framework (Figure 6; DFID 1999) is a tool to help understand and analyse these so-called livelihoods, particularly of the poor. Like all schematic representations, it is a simplification of the diversity and richness of livelihoods. The framework views people as operating in a context of vulnerability. Within this context they
15
have access to certain assets or poverty-reducing factors. These gain their meaning and value through the prevailing social, institutional and organisational environment. This environment also influences the livelihood strategies – ways of combining and using assets – that are open to people in pursuit of beneficial livelihood outcomes that meet their own livelihood objectives. The livelihoods framework aims to help stakeholders to identify the many factors that affect livelihoods, their relative importance and the way in which they interact. This, in turn, should help in the identification of appropriate entry points for support of livelihoods.
The core concepts of the sustainable livelihoods framework (DFID 1999) are as follows.
- People-centred: fully involves people and respects their views in order to support
them to achieve their own livelihood goals. - Holistic: attempts to identify the most pressing constraints faced by, and promising
opportunities open to, people regardless of where these occur; helps to organise factors which constrain or provide opportunities, and to show how these relate to each other.
- Dynamic: seeks to understand and learn from change. - Building on strengths: implies the recognition of everyone’s inherent potential,
whether this derives from their strong social networks, their access to physical resources and infrastructure, their ability to influence core institutions or any other factor that has poverty-reducing potential.
VULNERABILITY CONTEXT
• SHOCKS • TRENDS • SEASONALITY
LIVELIHOOD ASSETS
TRANSFORMING STRUCTURES &
PROCESSES Levels of Government Private Sector
Laws
Policies Culture
Institutions
Influence & access
LIVELIHOOD STRATEGIES
LIVELIHOOD OUTCOMES • More income • Increased
well-being • Reduced vul-
nerability • Improved
food security • More sustain-
able use of NR base
H
S
P F
N
Key H = Human Capital S = Social Capital N = Natural Capital P = Physical Capital F = Financial Capital
Figure 6: Sustainable livelihoods framework (DFID 1999)
16
- Macro-micro links: emphasises the importance of macro-level policy and institutions to the livelihood options of communities and individuals.
- Sustainability: stresses the importance of livelihoods that are resilient in the face of external shocks and stresses, are not dependent upon external support, maintain the long-term productivity of the natural resources and do not undermine the livelihoods of, or compromise the livelihood options open to, others.
2.2 Vulnerability Context The Vulnerability Context (DFID 1999) frames the external environment in which people exist. People’s livelihoods are fundamentally affected by critical trends (population, resource, economic, governance, technological) as well as shocks (human health, natural, economic, conflict, crop/livestock health) and seasonality (of prices, production, health or employment opportunities) – over which they have limited or no control. Analysing the vulnerability context comprises of identifying those trends, shocks and aspects of seasonality that are of particular importance to livelihoods.
Historical Trends
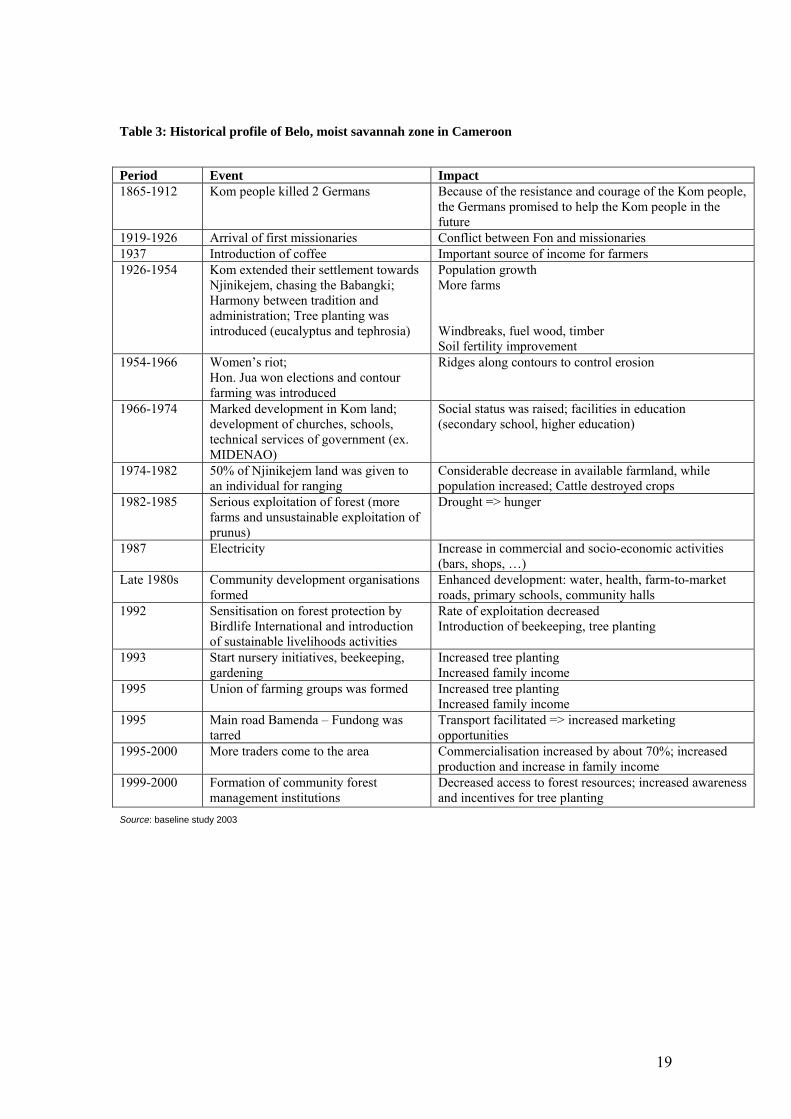
Table 3 demonstrates the historical profile of one of the study sites. Overall in Cameroon, 4 main historical periods have shaped the economies of rural households as they are today.
1) 1880-1930: German colonisation, settling of population Most of the villages in the Centre province (forest zone) were created late nineteenth century, when people from the ‘Sanaga area’ migrated in. The area was still under dense forest and people opened up small plots for subsistence farming. Hunting was also an important activity at that time. With German colonialism and the creation of roads, the population was asked to settle along these axes; the current pattern of houses in most villages is still witness of this movement. Agriculture was not diversified and consisted principally of the traditional groundnut field (afup owondo), associated with maize, plantain and cassava for home consumption. However, the Germans introduced some fruit trees like mango, citrus and banana, as well as cocoa and coffee.
17
2) 1930-1960: French colonisation; intensification of cash cropping and monetisation Under the French mandate, cocoa farming was intensified as a means of levying taxes. Farmers, faced with the possibility of generating cash, now entered the market economy. The end of forced labour (to build the railway) in the ’50s resulted in a rapid expansion of the population in rural areas. Young people stayed in the village and formed families. This phenomenon, together with growing demand for food in urban areas, generated the creation of periodic markets in rural areas. Consequently, food cropping was intensified with the objective of commercialisation.
3) 1960-1990: Independence and economic prosperity Independence took place rather smoothly and did not much affect rural populations in the forest zone. Agriculture and especially cash crops benefited from government support. The creation of SODECAO (Société de Développement de la Cacaoculture) and the emergence of cooperatives boosted prosperity in the villages. It was also during that period that a lot of primary schools were built in the rural areas. This changed life in the villages completely because children could go to school close to home, leaving time free to help the parents in their farms and significantly increasing the number of children attending school.
4) 1990-to date: economic crisis and liberalisation Things started to become hard for farmers from the mid-80s. The oil crisis and the launching of the structural adjustment programmes increased urban unemployment. A lot of young people came back to the villages and had no other option than to farm. This increased pressure on the land and some farmers had to look for new farmland elsewhere. In addition, cocoa and coffee prices fell drastically and government support stopped abruptly resulting in liberalisation of the sector. Farmers had difficulties in buying chemicals and fertilisers, and in negotiating prices for their cocoa and coffee with the multitude of traders. In 1992, the government (law 92/006) encouraged farmers to group themselves in “Common Initiative Groups” (CIG). The creation of CIGs however was often used with the sole intention of obtaining assistance from NGOs or government services, rather than as a motor to development (Oyono and Temple 2001). As a result of the problems in the cash crop sector, farmers progressively intensified food cropping. This change also affected the traditional distribution of tasks. Men no longer only concentrated on cash crops, but likewise engaged in food cropping for commercial purposes. To date, this intensification of agriculture still continues, although cocoa prices have gone up again in recent years. This is unlike the situation for coffee, which continues to fetch very
18
low prices in world markets. According to IFAD (2001), the demographic growth rate in urban areas of Cameroon has reached 6 % annually between 1960 and 1990. While the growth rate will probably not remain as high as 6 %, urbanisation will continue in the years ahead. To feed urban populations, farmers will have to intensify their food production, employing new techniques.
This historical perspective clearly shows that households adjust to changes in their environment by changing their livelihood strategies. First, farmers increased their food production to cope with population growth. In colonial times, farmers adopted the introduced cash crops (cocoa and coffee) to mark their land and to enter the market economy. Then, responding to ever increasing demand for food in urban areas, households started selling production surpluses and later engaged in commercial food cropping. Confronted with slumping prices of cash crops in the late 1980s, farmers were forced to diversify their activities in order to make ends meet and to keep their living standards. Farmers also formed common initiative groups with an aim of attracting technical or financial support for group or community projects. However, these efforts have often been in vain because of lack of focus in group objectives, lack of group cohesion and inefficient management.
Seasonality Aspects
Farming in the forest and humid savannah zones of Cameroon is characterised by peaks and slacks in labour demand. Tasks such as weeding and harvesting of food crops are very labour-demanding and generally do not allow for much flexibility. Therefore, the months of April-May-June are the busiest for farm households. In terms of food supply, most (81 %) farmer households in the forest zone are self-sufficient all year round (baseline survey 2003). Those who are not, generally buy tubers and cereals in the months of March and April. In the savannah zone on the other hand, half (50 %) of the rural households were not food self-sufficient all year round (baseline survey 2003). Periods of food scarcity are the same as in the forest zone. These periods correspond to the inter-harvest, when food from the previous cropping season is finished and crops from the current season are not yet ready to be harvested. It should be noted that, unless the household has extra-agricultural activities (salary or pension, temporary jobs, trade), the period of food scarcity generally coincides with the period of income scarcity, hereby increasing household’s
19
Table 3: Historical profile of Belo, moist savannah zone in Cameroon
Period Event Impact 1865-1912 Kom people killed 2 Germans Because of the resistance and courage of the Kom people,
the Germans promised to help the Kom people in the future
1919-1926 Arrival of first missionaries Conflict between Fon and missionaries 1937 Introduction of coffee Important source of income for farmers 1926-1954 Kom extended their settlement towards
Njinikejem, chasing the Babangki; Harmony between tradition and administration; Tree planting was introduced (eucalyptus and tephrosia)
Population growth More farms Windbreaks, fuel wood, timber Soil fertility improvement
1954-1966 Women’s riot; Hon. Jua won elections and contour farming was introduced
Ridges along contours to control erosion
1966-1974 Marked development in Kom land; development of churches, schools, technical services of government (ex. MIDENAO)
Social status was raised; facilities in education (secondary school, higher education)
1974-1982 50% of Njinikejem land was given to an individual for ranging
Considerable decrease in available farmland, while population increased; Cattle destroyed crops
1982-1985 Serious exploitation of forest (more farms and unsustainable exploitation of prunus)
Drought => hunger
1987 Electricity Increase in commercial and socio-economic activities (bars, shops, …)
Late 1980s Community development organisations formed
Enhanced development: water, health, farm-to-market roads, primary schools, community halls
1992 Sensitisation on forest protection by Birdlife International and introduction of sustainable livelihoods activities
Rate of exploitation decreased Introduction of beekeeping, tree planting
1993 Start nursery initiatives, beekeeping, gardening
Increased tree planting Increased family income
1995 Union of farming groups was formed Increased tree planting Increased family income
1995 Main road Bamenda – Fundong was tarred
Transport facilitated => increased marketing opportunities
1995-2000 More traders come to the area Commercialisation increased by about 70%; increased production and increase in family income
1999-2000 Formation of community forest management institutions
Decreased access to forest resources; increased awareness and incentives for tree planting
Source: baseline study 2003
20
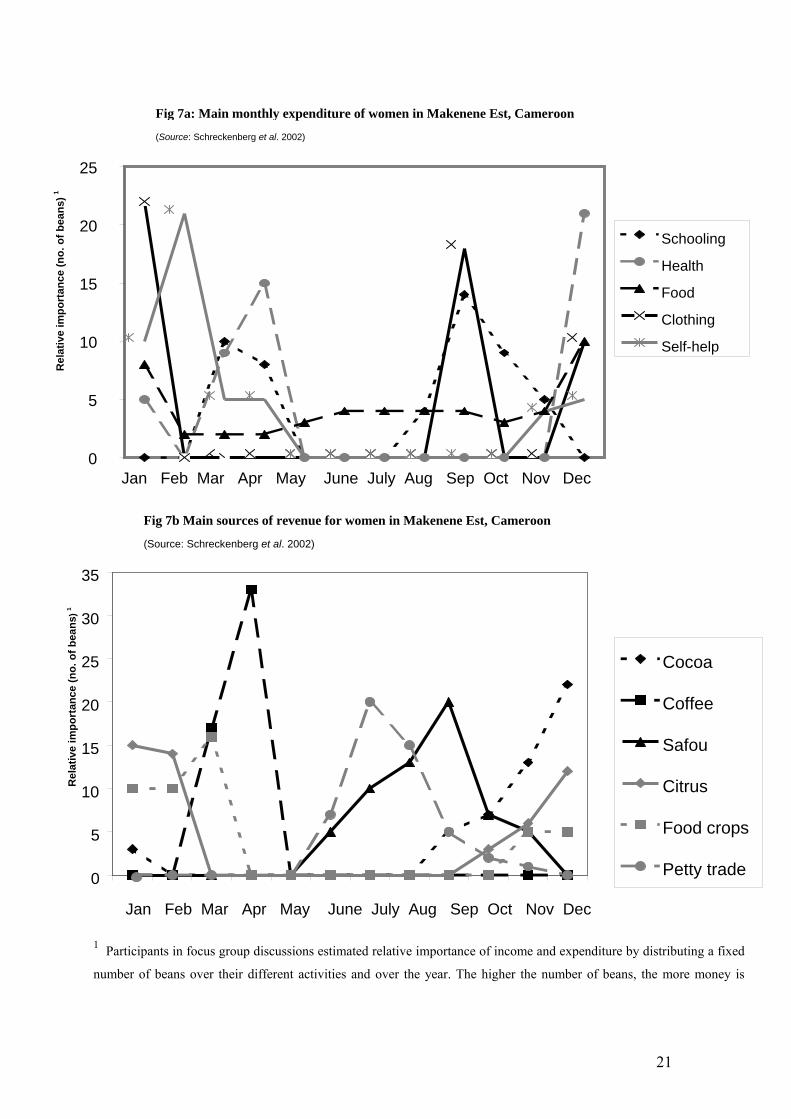
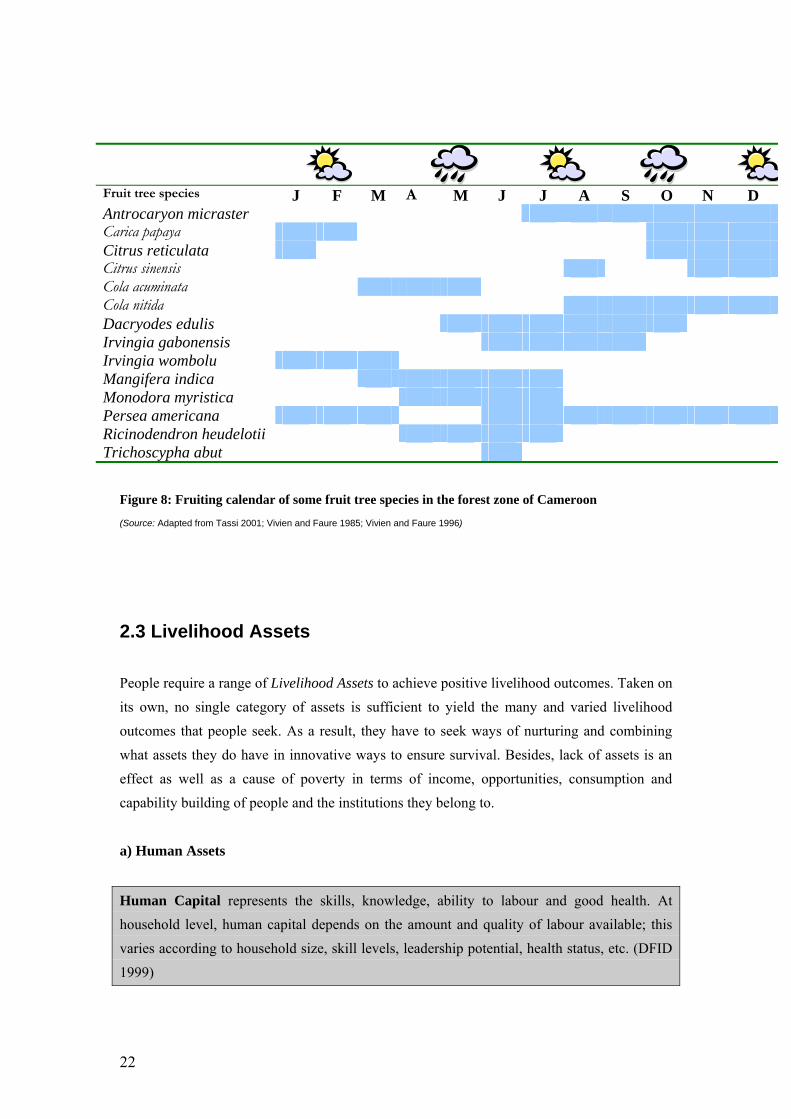
vulnerability. As shown in an example from Makenene, southern Cameroon (Figure 7; Schreckenberg et al. 2002), income and expenditure of rural households also follow seasonal trends. The seasonal pattern of income flows, however, differs fundamentally between men and women. Men primarily rely on income from their cocoa and coffee crops, which are harvested around November. Women tend to have a range of activities including food crops (particularly tubers and bananas) that bring them a steady stream of income throughout the year (Guyer 1989). Fruit trees, although often not fully exploited because of conflicting farming activities when fruit harvesting is due, also play an important role in household income generation. Often their total absolute contribution to household income is not very high, but the income is generated at a period where other revenues are rare and/or expenses are high. For example, the period of greatest expense in the year in Cameroon is generally considered to be September/October when school fees and related costs are due. For men this is a particularly difficult period as they rely primarily on income from their cocoa and coffee crops, which are harvested around November. The timing of income from Dacryodes edulis (Schreckenberg et al. 2002) is such that it covers the cost of school fees when few other income sources are available. Figure 4-7 shows the fruiting period for a number of fruit trees in forest zone in Southern Cameroon. In most cases, fruit trees play a more important role within the women’s portfolio than for the men because it is women who take fruit to market for sale. The resulting income is used to pay for the family’s daily needs including soap, salt and kerosene. Except for daily household needs and health, households adjust their expenses to their income flow. Because of lack of saving and credit facilities, major expenses (such as clothing, building and family celebrations) usually are scheduled immediately after cocoa or coffee sales.
21
Fig 7a: Main monthly expenditure of women in Makenene Est, Cameroon
(Source: Schreckenberg et al. 2002)
0
5
10
15
20
25
Rel
ativ
e im
port
ance
(no.
of b
eans
) 1
Schooling
Health
Food
Clothing
Self-help
Jan Feb Mar Apr May June July Aug Sep Oct Nov Dec
Fig 7b Main sources of revenue for women in Makenene Est, Cameroon
(Source: Schreckenberg et al. 2002)
0
5
10
15
20
25
30
35
Rel
ativ
e im
port
ance
(no.
of b
eans
) 1
Cocoa
Coffee
Safou
Citrus
Food crops
Petty trade
1 Participants in focus group discussions estimated relative importance of income and expenditure by distributing a fixed
number of beans over their different activities and over the year. The higher the number of beans, the more money is
Jan Feb Mar Apr May June July Aug Sep Oct Nov Dec
22
Fruit tree species J F M A M J J A S O N D Antrocaryon micraster Carica papaya Citrus reticulata Citrus sinensis Cola acuminata Cola nitida Dacryodes edulis Irvingia gabonensis Irvingia wombolu Mangifera indica Monodora myristica Persea americana Ricinodendron heudelotii Trichoscypha abut
Figure 8: Fruiting calendar of some fruit tree species in the forest zone of Cameroon
(Source: Adapted from Tassi 2001; Vivien and Faure 1985; Vivien and Faure 1996)
2.3 Livelihood Assets People require a range of Livelihood Assets to achieve positive livelihood outcomes. Taken on its own, no single category of assets is sufficient to yield the many and varied livelihood outcomes that people seek. As a result, they have to seek ways of nurturing and combining what assets they do have in innovative ways to ensure survival. Besides, lack of assets is an effect as well as a cause of poverty in terms of income, opportunities, consumption and capability building of people and the institutions they belong to.
a) Human Assets
Human Capital represents the skills, knowledge, ability to labour and good health. At household level, human capital depends on the amount and quality of labour available; this varies according to household size, skill levels, leadership potential, health status, etc. (DFID
1999)
23
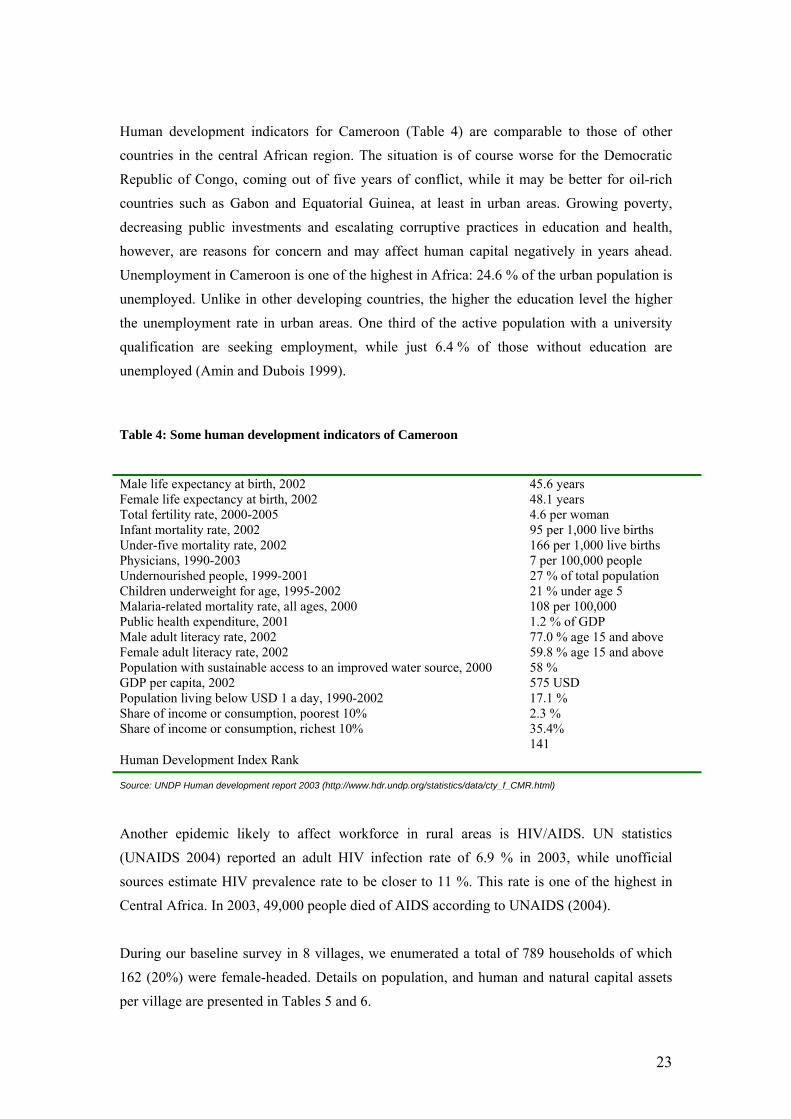
Human development indicators for Cameroon (Table 4) are comparable to those of other countries in the central African region. The situation is of course worse for the Democratic Republic of Congo, coming out of five years of conflict, while it may be better for oil-rich countries such as Gabon and Equatorial Guinea, at least in urban areas. Growing poverty, decreasing public investments and escalating corruptive practices in education and health, however, are reasons for concern and may affect human capital negatively in years ahead. Unemployment in Cameroon is one of the highest in Africa: 24.6 % of the urban population is unemployed. Unlike in other developing countries, the higher the education level the higher the unemployment rate in urban areas. One third of the active population with a university qualification are seeking employment, while just 6.4 % of those without education are unemployed (Amin and Dubois 1999).
Table 4: Some human development indicators of Cameroon
Male life expectancy at birth, 2002 45.6 years Female life expectancy at birth, 2002 48.1 years Total fertility rate, 2000-2005 4.6 per woman Infant mortality rate, 2002 95 per 1,000 live births Under-five mortality rate, 2002 166 per 1,000 live births Physicians, 1990-2003 7 per 100,000 people Undernourished people, 1999-2001 27 % of total population Children underweight for age, 1995-2002 21 % under age 5 Malaria-related mortality rate, all ages, 2000 108 per 100,000 Public health expenditure, 2001 1.2 % of GDP Male adult literacy rate, 2002 77.0 % age 15 and above Female adult literacy rate, 2002 59.8 % age 15 and above Population with sustainable access to an improved water source, 2000 58 % GDP per capita, 2002 575 USD Population living below USD 1 a day, 1990-2002 17.1 % Share of income or consumption, poorest 10% 2.3 % Share of income or consumption, richest 10% 35.4%
Human Development Index Rank 141
Source: UNDP Human development report 2003 (http://www.hdr.undp.org/statistics/data/cty_f_CMR.html)
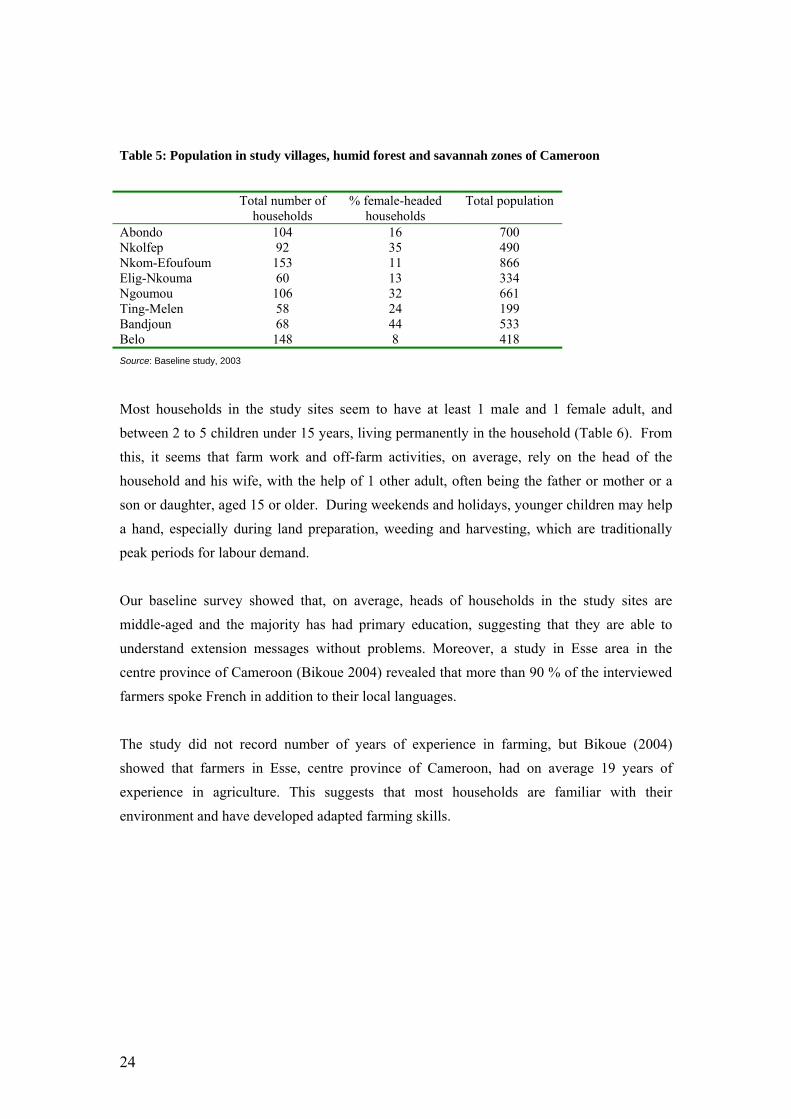
Another epidemic likely to affect workforce in rural areas is HIV/AIDS. UN statistics (UNAIDS 2004) reported an adult HIV infection rate of 6.9 % in 2003, while unofficial sources estimate HIV prevalence rate to be closer to 11 %. This rate is one of the highest in Central Africa. In 2003, 49,000 people died of AIDS according to UNAIDS (2004). During our baseline survey in 8 villages, we enumerated a total of 789 households of which 162 (20%) were female-headed. Details on population, and human and natural capital assets per village are presented in Tables 5 and 6.
24
Table 5: Population in study villages, humid forest and savannah zones of Cameroon
Total number of
households % female-headed
households Total population
Abondo 104 16 700 Nkolfep 92 35 490 Nkom-Efoufoum 153 11 866 Elig-Nkouma 60 13 334 Ngoumou 106 32 661 Ting-Melen 58 24 199 Bandjoun 68 44 533 Belo 148 8 418 Source: Baseline study, 2003
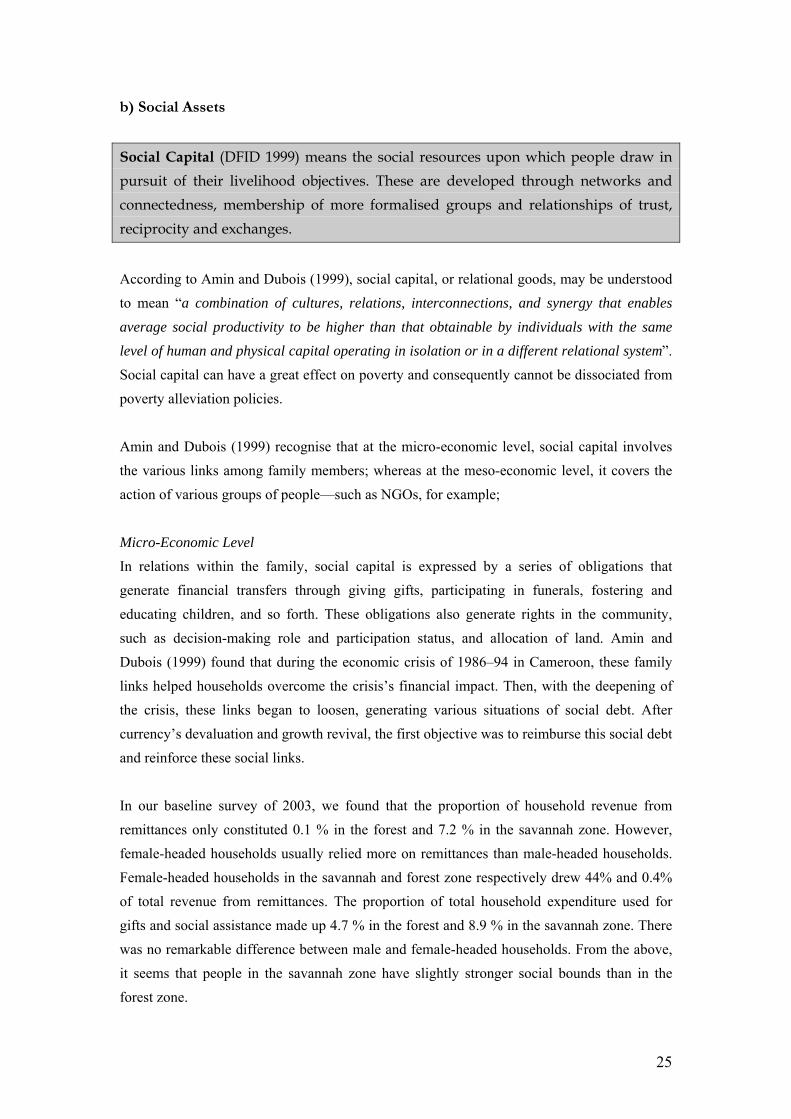
Most households in the study sites seem to have at least 1 male and 1 female adult, and between 2 to 5 children under 15 years, living permanently in the household (Table 6). From this, it seems that farm work and off-farm activities, on average, rely on the head of the household and his wife, with the help of 1 other adult, often being the father or mother or a son or daughter, aged 15 or older. During weekends and holidays, younger children may help a hand, especially during land preparation, weeding and harvesting, which are traditionally peak periods for labour demand. Our baseline survey showed that, on average, heads of households in the study sites are middle-aged and the majority has had primary education, suggesting that they are able to understand extension messages without problems. Moreover, a study in Esse area in the centre province of Cameroon (Bikoue 2004) revealed that more than 90 % of the interviewed farmers spoke French in addition to their local languages. The study did not record number of years of experience in farming, but Bikoue (2004) showed that farmers in Esse, centre province of Cameroon, had on average 19 years of experience in agriculture. This suggests that most households are familiar with their environment and have developed adapted farming skills.
25
b) Social Assets
Social Capital (DFID 1999) means the social resources upon which people draw in pursuit of their livelihood objectives. These are developed through networks and connectedness, membership of more formalised groups and relationships of trust, reciprocity and exchanges.
According to Amin and Dubois (1999), social capital, or relational goods, may be understood to mean “a combination of cultures, relations, interconnections, and synergy that enables
average social productivity to be higher than that obtainable by individuals with the same level of human and physical capital operating in isolation or in a different relational system”. Social capital can have a great effect on poverty and consequently cannot be dissociated from poverty alleviation policies. Amin and Dubois (1999) recognise that at the micro-economic level, social capital involves the various links among family members; whereas at the meso-economic level, it covers the action of various groups of people—such as NGOs, for example;
Micro-Economic Level In relations within the family, social capital is expressed by a series of obligations that generate financial transfers through giving gifts, participating in funerals, fostering and educating children, and so forth. These obligations also generate rights in the community, such as decision-making role and participation status, and allocation of land. Amin and Dubois (1999) found that during the economic crisis of 1986–94 in Cameroon, these family links helped households overcome the crisis’s financial impact. Then, with the deepening of the crisis, these links began to loosen, generating various situations of social debt. After currency’s devaluation and growth revival, the first objective was to reimburse this social debt and reinforce these social links. In our baseline survey of 2003, we found that the proportion of household revenue from remittances only constituted 0.1 % in the forest and 7.2 % in the savannah zone. However, female-headed households usually relied more on remittances than male-headed households. Female-headed households in the savannah and forest zone respectively drew 44% and 0.4% of total revenue from remittances. The proportion of total household expenditure used for gifts and social assistance made up 4.7 % in the forest and 8.9 % in the savannah zone. There was no remarkable difference between male and female-headed households. From the above, it seems that people in the savannah zone have slightly stronger social bounds than in the forest zone.
26
Table 6: Human and natural capital assets in study villages, humid forest and savannah zones of Cameroon Forest study villages Savannah study villages
Mean figures
Abondo Nkom-Efoufoum
Ting-Melen Elig-Nkouma
Ngoumou Nkolfep Bandjoun Belo
No of households interviewed 16 12 11 16 17 10 15 15
Household size 7.44 7.33 4.55 5.88 5.06 6.00 8.27 5.93
No of adult males 1.69 1.50 1.27 1.69 1.18 0.90 1.27 1.47
No of adult females 1.56 1.33 1.36 1.25 1.41 1.30 1.87 1.67
No of male children 2.50 2.58 0.91 1.63 1.76 2.60 2.73 1.60
No of female children 1.69 1.92 1.00 1.31 0.71 1.20 2.40 1.20
Age of household head 44.38 46.50 56.27 42.56 51.59 51.60 59.80 53.07
% of household heads with education
level of CEPE (primary school) or
above
31.2 58.3 54.5 75 76.5 80 33.3 64.3
Total farm size2 (ha) 11.13 2.87 8.16 8.92 6.20 4.94 1.74 4.72
- Area under perennial crops 3.03 1.09 1.68 2.58 1.62 1.06 0.13 2.02
- Area under food crops 3.63 0.82 1.25 2.05 0.93 1.31 1.01 1.53
- Area under fallow 4.47 0.96 5.23 4.07 3.65 2.58 0.60 1.17
Average fallow period (years) 3.13 2.17 4.55 3.86 4.06 2.78 0.33 0.94
% of households that have purchased
or rented land
12.5 0 0 6.3 11.8 10.0 35.4 14.3
% of households that are food self-
sufficient all year round
93.8 75.0 100.0 68.8 64.7 80.0 53.3 46.7
Source: baseline study 2003
2 Farm size was estimated by the farmer with help of the enumerator. For each farming system, dimensions of all the fields were estimated and summed to obtain total area under perennial crops, area under food crops and area under fallow.
27
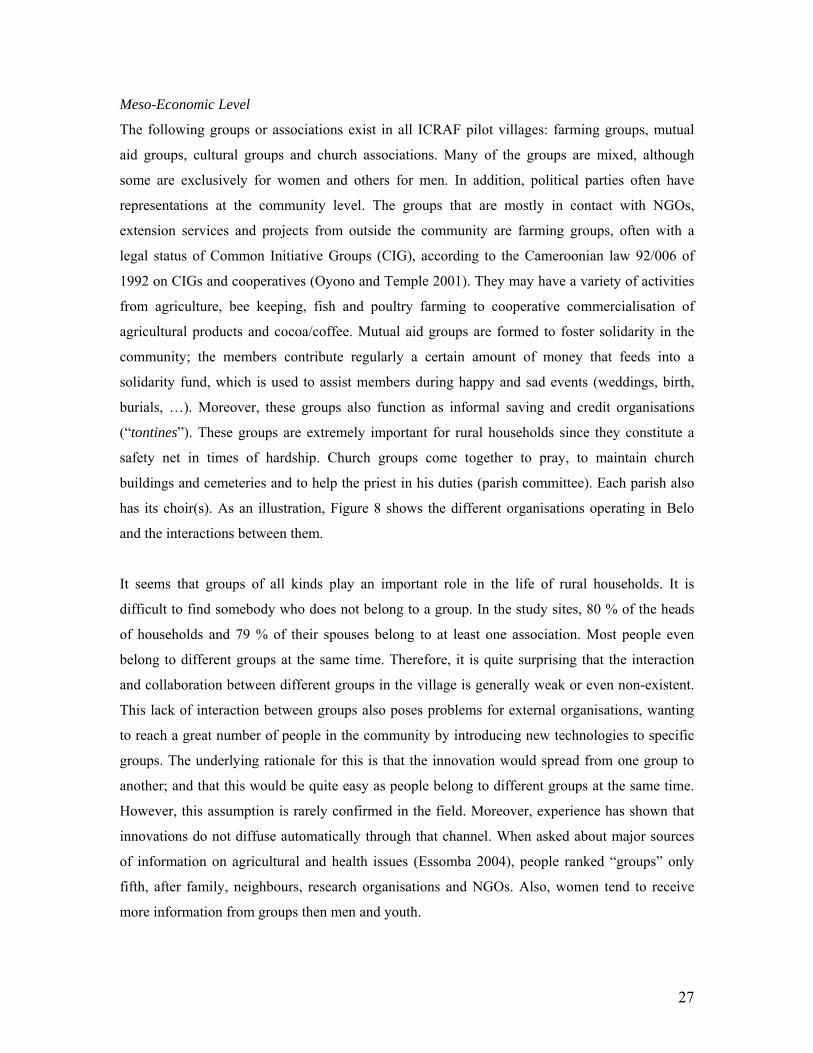
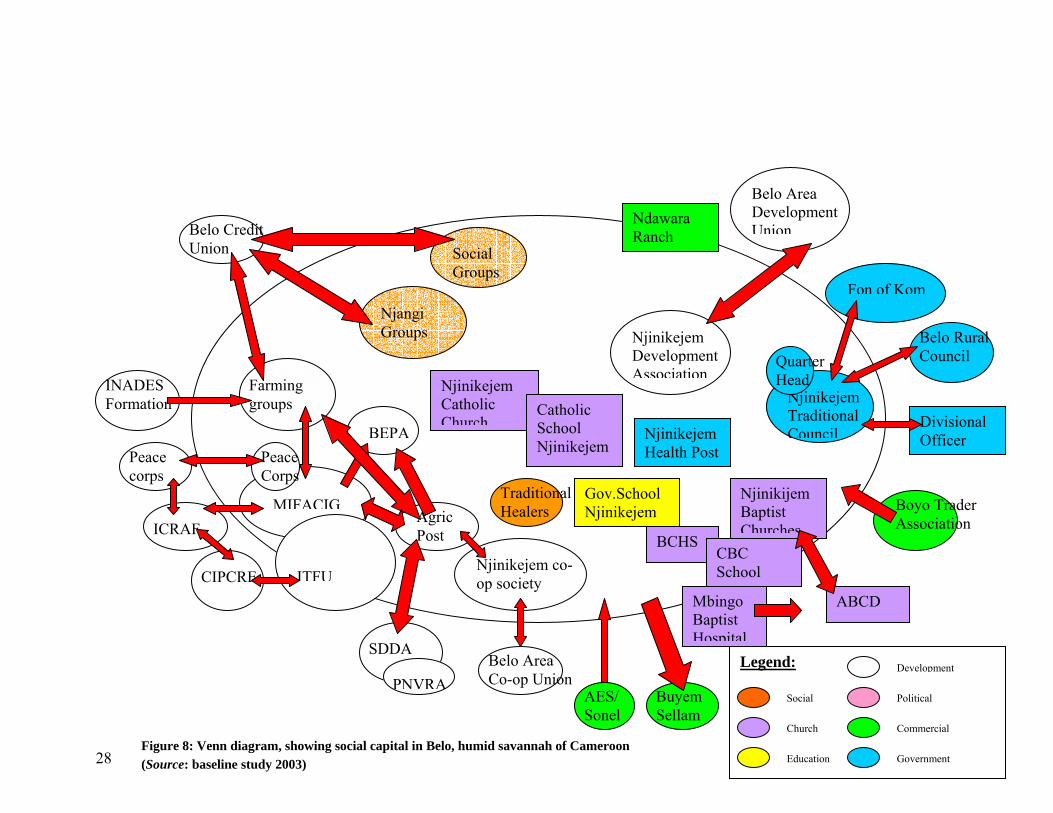
Meso-Economic Level
The following groups or associations exist in all ICRAF pilot villages: farming groups, mutual
aid groups, cultural groups and church associations. Many of the groups are mixed, although
some are exclusively for women and others for men. In addition, political parties often have
representations at the community level. The groups that are mostly in contact with NGOs,
extension services and projects from outside the community are farming groups, often with a
legal status of Common Initiative Groups (CIG), according to the Cameroonian law 92/006 of
1992 on CIGs and cooperatives (Oyono and Temple 2001). They may have a variety of activities
from agriculture, bee keeping, fish and poultry farming to cooperative commercialisation of
agricultural products and cocoa/coffee. Mutual aid groups are formed to foster solidarity in the
community; the members contribute regularly a certain amount of money that feeds into a
solidarity fund, which is used to assist members during happy and sad events (weddings, birth,
burials, …). Moreover, these groups also function as informal saving and credit organisations
(“tontines”). These groups are extremely important for rural households since they constitute a
safety net in times of hardship. Church groups come together to pray, to maintain church
buildings and cemeteries and to help the priest in his duties (parish committee). Each parish also
has its choir(s). As an illustration, Figure 8 shows the different organisations operating in Belo
and the interactions between them.
It seems that groups of all kinds play an important role in the life of rural households. It is
difficult to find somebody who does not belong to a group. In the study sites, 80 % of the heads
of households and 79 % of their spouses belong to at least one association. Most people even
belong to different groups at the same time. Therefore, it is quite surprising that the interaction
and collaboration between different groups in the village is generally weak or even non-existent.
This lack of interaction between groups also poses problems for external organisations, wanting
to reach a great number of people in the community by introducing new technologies to specific
groups. The underlying rationale for this is that the innovation would spread from one group to
another; and that this would be quite easy as people belong to different groups at the same time.
However, this assumption is rarely confirmed in the field. Moreover, experience has shown that
innovations do not diffuse automatically through that channel. When asked about major sources
of information on agricultural and health issues (Essomba 2004), people ranked “groups” only
fifth, after family, neighbours, research organisations and NGOs. Also, women tend to receive
more information from groups then men and youth.
28
MIFACIG
Peace Corps
ITFUCIPCRE
ICRAF
Peace corps
Farming groups
INADES Formation
Belo Credit Union
BEPA
Agric Post
SDDA
PNVRA
Njinikejem co-op society
Belo Area Co-op Union
AES/Sonel
Buyem Sellam
BCHS CBC School
Mbingo Baptist Hospital
ABCD
Njinikijem Baptist Churches
Traditional Healers
Gov.School Njinikejem
Njinikejem Catholic Church
Catholic School Njinikejem
Njinikejem Health Post
Njinikejem Development Association
Njinikejem Traditional Council
Fon of Kom
Belo Rural Council
Divisional Officer
Boyo Trader Association
Quarter Head
Belo Area Development Union
Ndawara Ranch
Social Groups
Njangi Groups
Figure 8: Venn diagram, showing social capital in Belo, humid savannah of Cameroon (Source: baseline study 2003)
Legend:
Social
Church
Education
Political
Commercial
Government
Development
29
c) Natural Assets Natural Capital is the term used for natural resource stocks from which resource flows and
services are derived; examples are: land, forests, natural resources, water, erosion protection,
biodiversity degree and rate of change (DFID 1999).
In agrarian societies, natural resources are key assets. Therefore, wealth is intricately linked to
property rights over natural resources. Abondo, Nkolfep, Nkom-Efoufoum, Elig-Nkouma,
Ngoumou and Ting-Melen are located in the forest zone of Cameroon, characterised by semi-
deciduous forest vegetation, orthic ferralsols and a bimodal rainfall pattern (April-July and
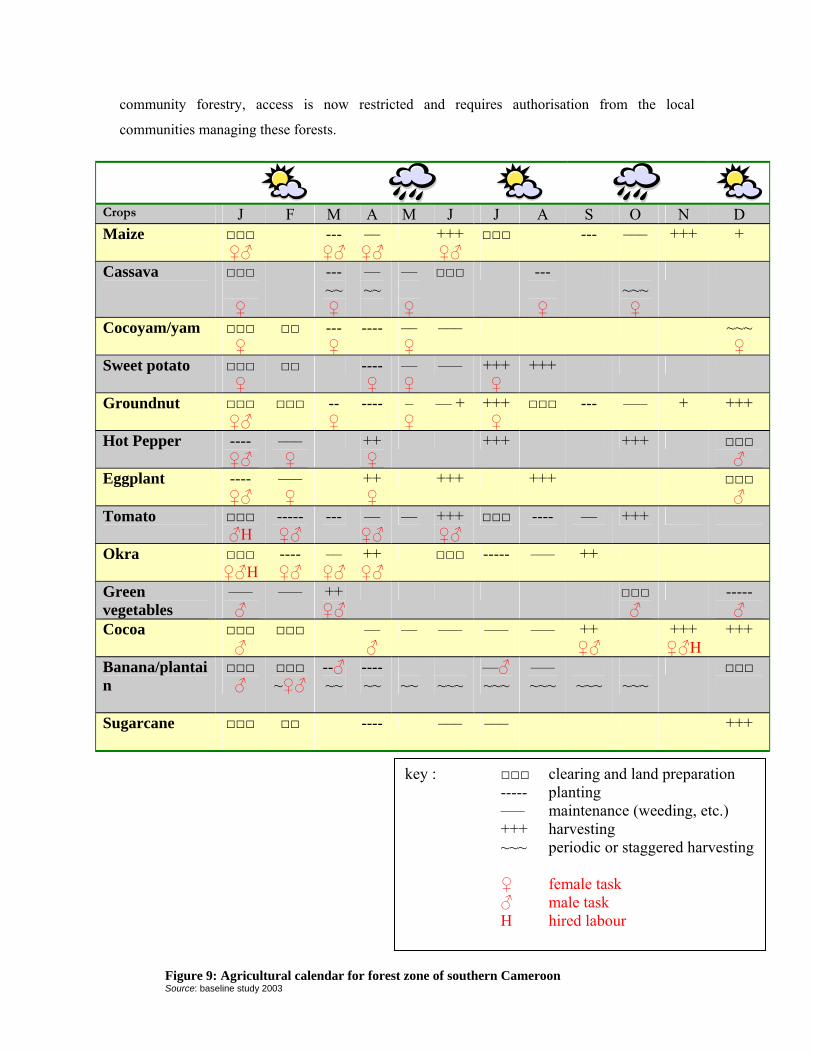
September-November) allowing cultivation of a diversity of crops twice a year (Figure 9).
Natural forests have disappeared almost completely in these villages, although some patches of
secondary forest or old fallows still subsist (Figure 11). Almost all the land in these villages is
under private ownership, this means that land is owned by households or families and is inherited
from father to son. Tree ownership is closely linked to land ownership. Where land is rented,
farmers usually do not have the right to plant perennial crops except in agreement with the
landlord. Generally, if land is sold, the purchaser obtains all rights to trees on that land. Land-use
systems comprise of homegardens, cocoa plantations, food crop fields and fallows. The main cash
crop in the study sites in the forest zone is cocoa. Farming is characterised by mixed food
cropping based on groundnut, cassava, plantain and more intensive monocropping of horticultural
crops and maize, especially where market access is good. Dry season cropping (mainly of
vegetables and maize) is practiced in the swampy areas along streams. Despite increasing
population pressure, short fallows (2-4 years) are still commonly practiced and form practically
the only means of soil fertility management in these areas.
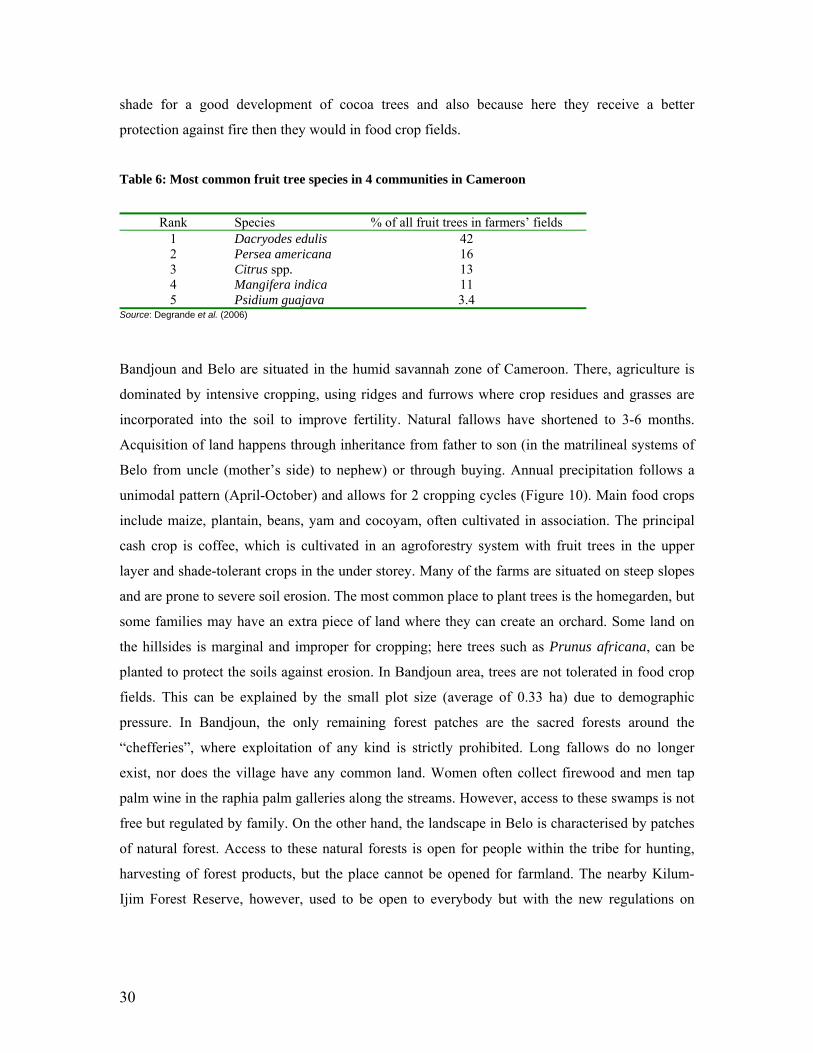
Most fruit trees are found in cocoa fields and in homegardens. A full-farm fruit tree inventory
(Degrande et al. 2006) in 4 communities (3 in the forest and 1 in the forest-savannah transition
zone of Cameroon) identified 34 fruit tree species, of which 22 were indigenous. Table 6 shows
the most common species, i.e. safou (Dacryodes edulis), mango (Mangifera indica), avocado
(Persea americana), Citrus spp. and guava (Psidium guajava). Cocoa-coffee plots, cocoa plots,
homegardens and coffee plots had the highest number of fruit tree species. Taken together, this
group of land-uses had a mean number of species of 7.09 ± 0.23, which is significantly different
(one-way ANOVA: F = 94.715; p = 0.000) from the other major grouping of land-uses (food
crop, fallows, oil palms and orchards), which taken together had a mean number of species of
3.8 ± 0.25. Reasons for integrating trees in cocoa agroforests is that they provide the necessary
30
shade for a good development of cocoa trees and also because here they receive a better
protection against fire then they would in food crop fields.
Table 6: Most common fruit tree species in 4 communities in Cameroon
Rank Species % of all fruit trees in farmers’ fields
1 Dacryodes edulis 42 2 Persea americana 16 3 Citrus spp. 13 4 Mangifera indica 11 5 Psidium guajava 3.4
Source: Degrande et al. (2006)
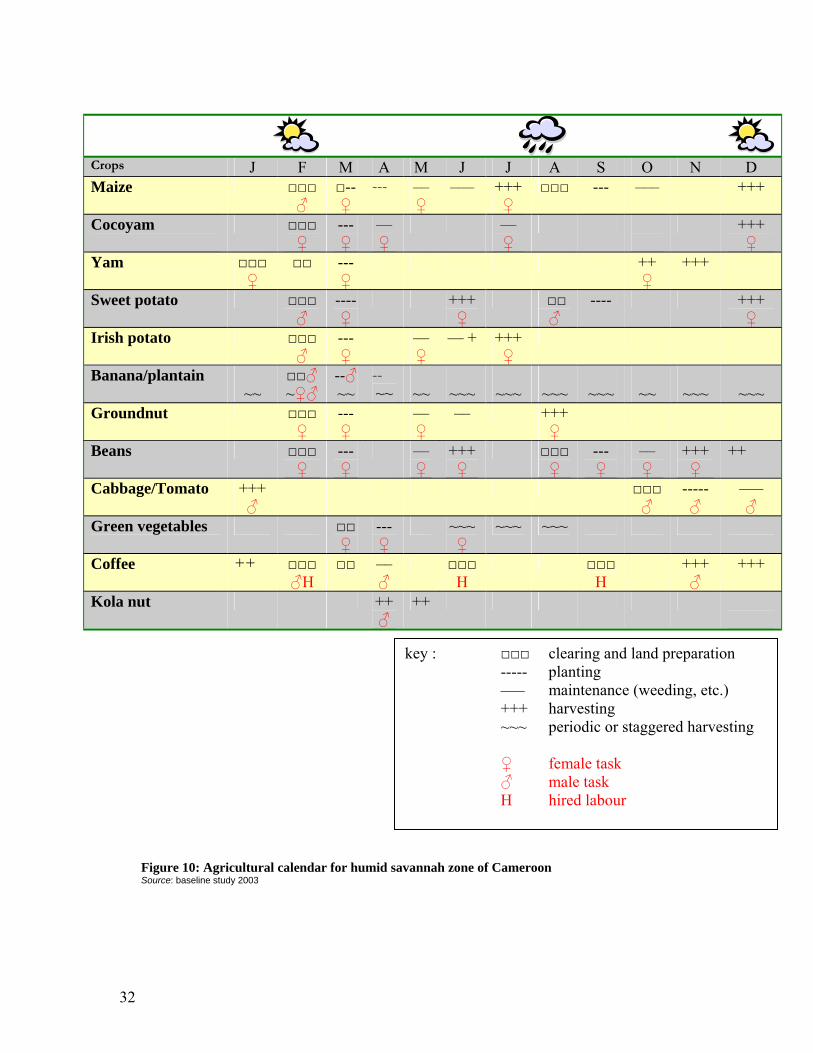
Bandjoun and Belo are situated in the humid savannah zone of Cameroon. There, agriculture is
dominated by intensive cropping, using ridges and furrows where crop residues and grasses are
incorporated into the soil to improve fertility. Natural fallows have shortened to 3-6 months.
Acquisition of land happens through inheritance from father to son (in the matrilineal systems of
Belo from uncle (mother’s side) to nephew) or through buying. Annual precipitation follows a
unimodal pattern (April-October) and allows for 2 cropping cycles (Figure 10). Main food crops
include maize, plantain, beans, yam and cocoyam, often cultivated in association. The principal
cash crop is coffee, which is cultivated in an agroforestry system with fruit trees in the upper
layer and shade-tolerant crops in the under storey. Many of the farms are situated on steep slopes
and are prone to severe soil erosion. The most common place to plant trees is the homegarden, but
some families may have an extra piece of land where they can create an orchard. Some land on
the hillsides is marginal and improper for cropping; here trees such as Prunus africana, can be
planted to protect the soils against erosion. In Bandjoun area, trees are not tolerated in food crop
fields. This can be explained by the small plot size (average of 0.33 ha) due to demographic
pressure. In Bandjoun, the only remaining forest patches are the sacred forests around the
“chefferies”, where exploitation of any kind is strictly prohibited. Long fallows do no longer
exist, nor does the village have any common land. Women often collect firewood and men tap
palm wine in the raphia palm galleries along the streams. However, access to these swamps is not
free but regulated by family. On the other hand, the landscape in Belo is characterised by patches
of natural forest. Access to these natural forests is open for people within the tribe for hunting,
harvesting of forest products, but the place cannot be opened for farmland. The nearby Kilum-
Ijim Forest Reserve, however, used to be open to everybody but with the new regulations on
31
community forestry, access is now restricted and requires authorisation from the local
communities managing these forests.
Crops J F M A M J J A S O N D Maize
□□□ ♀♂
--- ♀♂
–– ♀♂
+++ ♀♂
□□□
---
–––
+++
+
Cassava
□□□ ♀
--- ~~ ♀
–– ~~
–– ♀
□□□ --- ♀
~~~ ♀
Cocoyam/yam □□□ ♀
□□ --- ♀
---- –– ♀
––– ~~~ ♀
Sweet potato □□□ ♀
□□ ---- ♀
–– ♀
––– +++ ♀
+++
Groundnut □□□ ♀♂
□□□ -- ♀
---- – ♀
–– + +++ ♀
□□□ --- ––– + +++
Hot Pepper ---- ♀♂
––– ♀
++ ♀
+++ +++ □□□ ♂
Eggplant ---- ♀♂
––– ♀
++ ♀
+++
+++ □□□ ♂
Tomato □□□ ♂H
----- ♀♂
--- –– ♀♂
–– +++ ♀♂
□□□ ---- –– +++
Okra □□□ ♀♂H
---- ♀♂
–– ♀♂
++ ♀♂
□□□ ----- ––– ++
Green vegetables
––– ♂
––– ++ ♀♂
□□□ ♂
----- ♂
Cocoa □□□ ♂
□□□ –– ♂
–– ––– ––– ––– ++ ♀♂
+++ ♀♂H
+++
Banana/plantain
□□□ ♂
□□□ ~♀♂
--♂ ~~
---- ~~
~~
~~~
––♂ ~~~
––– ~~~
~~~
~~~
□□□
Sugarcane □□□
□□ ---- ––– ––– +++
key : □□□ clearing and land preparation
----- planting ––– maintenance (weeding, etc.) +++ harvesting ~~~ periodic or staggered harvesting
♀ female task ♂ male task H hired labour
Figure 9: Agricultural calendar for forest zone of southern Cameroon Source: baseline study 2003
32
Crops J F M A M J J A S O N D Maize
□□□ ♂
□-- ♀
--- –– ♀
––– +++ ♀
□□□ ---
–––
+++
Cocoyam
□□□ ♀
--- ♀
–– ♀
–– ♀
+++ ♀
Yam □□□ ♀
□□ --- ♀
++ ♀
+++
Sweet potato □□□ ♂
---- ♀
+++ ♀
□□ ♂
---- +++ ♀
Irish potato □□□ ♂
--- ♀
–– ♀
–– + +++ ♀
Banana/plantain
~~
□□♂ ~♀♂
--♂ ~~
-- ~~
~~
~~~
~~~
~~~
~~~
~~
~~~
~~~
Groundnut □□□ ♀
--- ♀
–– ♀
–– +++ ♀
Beans □□□ ♀
--- ♀
–– ♀
+++ ♀
□□□ ♀
--- ♀
–– ♀
+++ ♀
++
Cabbage/Tomato +++ ♂
□□□ ♂
----- ♂
––– ♂
Green vegetables □□ ♀
--- ♀
~~~ ♀
~~~ ~~~
Coffee ++ □□□♂H
□□
–– ♂
□□□H
□□□H
+++ ♂
+++
Kola nut ++ ♂
++
Figure 10: Agricultural calendar for humid savannah zone of Cameroon Source: baseline study 2003
key : □□□ clearing and land preparation ----- planting ––– maintenance (weeding, etc.) +++ harvesting ~~~ periodic or staggered harvesting
♀ female task ♂ male task H hired labour
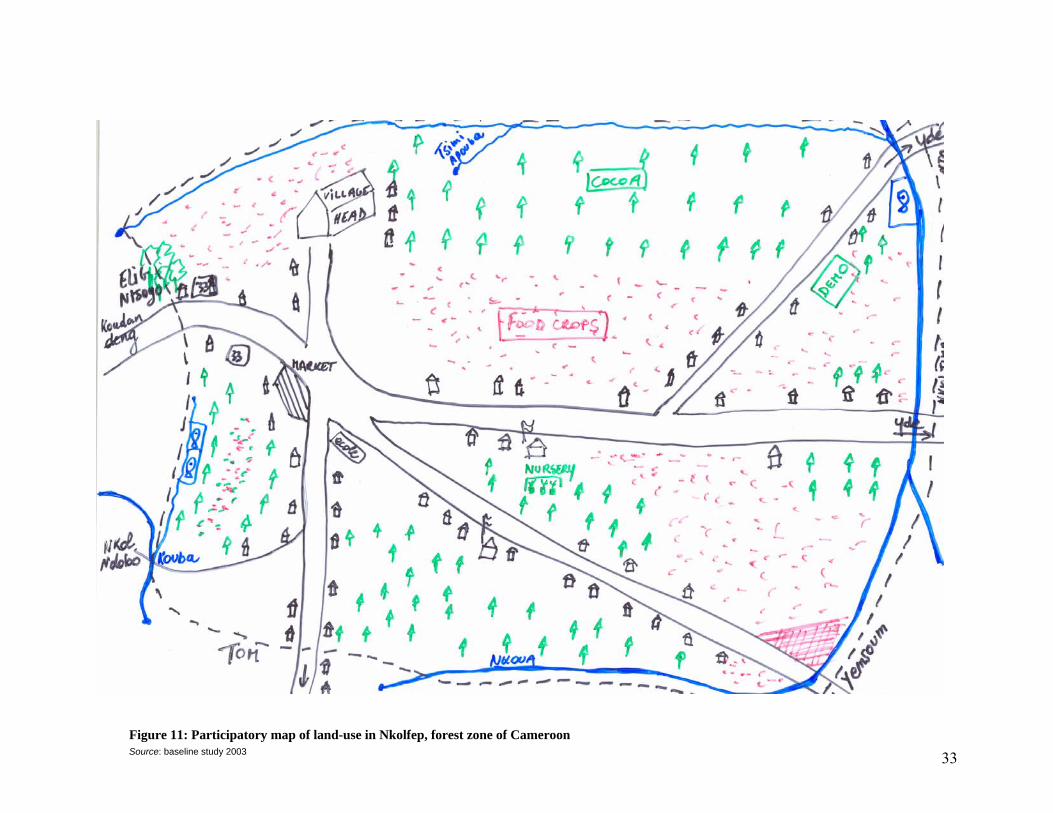
33Figure 11: Participatory map of land-use in Nkolfep, forest zone of Cameroon Source: baseline study 2003
34
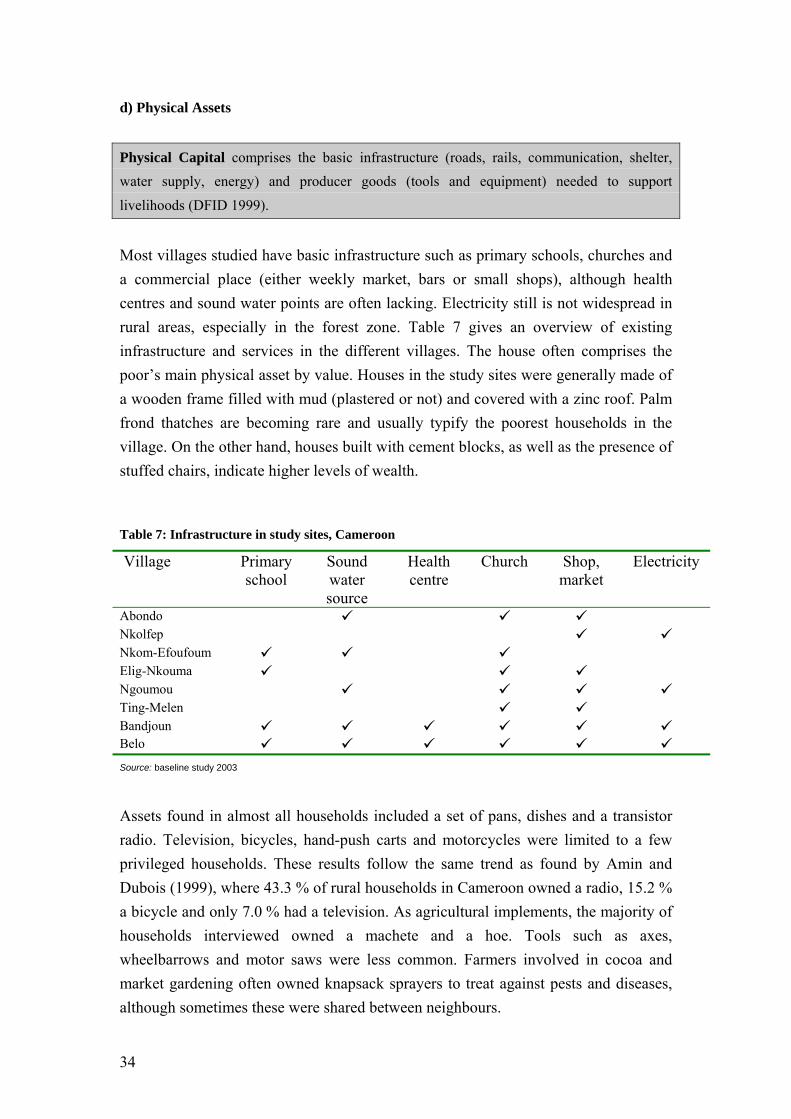
d) Physical Assets
Physical Capital comprises the basic infrastructure (roads, rails, communication, shelter, water supply, energy) and producer goods (tools and equipment) needed to support
livelihoods (DFID 1999).
Most villages studied have basic infrastructure such as primary schools, churches and a commercial place (either weekly market, bars or small shops), although health centres and sound water points are often lacking. Electricity still is not widespread in rural areas, especially in the forest zone. Table 7 gives an overview of existing infrastructure and services in the different villages. The house often comprises the poor’s main physical asset by value. Houses in the study sites were generally made of a wooden frame filled with mud (plastered or not) and covered with a zinc roof. Palm frond thatches are becoming rare and usually typify the poorest households in the village. On the other hand, houses built with cement blocks, as well as the presence of stuffed chairs, indicate higher levels of wealth.
Table 7: Infrastructure in study sites, Cameroon
Village Primary school
Sound water source
Health centre
Church Shop, market
Electricity
Abondo Nkolfep Nkom-Efoufoum Elig-Nkouma Ngoumou Ting-Melen Bandjoun Belo Source: baseline study 2003
Assets found in almost all households included a set of pans, dishes and a transistor radio. Television, bicycles, hand-push carts and motorcycles were limited to a few privileged households. These results follow the same trend as found by Amin and Dubois (1999), where 43.3 % of rural households in Cameroon owned a radio, 15.2 % a bicycle and only 7.0 % had a television. As agricultural implements, the majority of households interviewed owned a machete and a hoe. Tools such as axes, wheelbarrows and motor saws were less common. Farmers involved in cocoa and market gardening often owned knapsack sprayers to treat against pests and diseases, although sometimes these were shared between neighbours.
35
5.6%
5.1%
11.4%
5.8%
39.9%
9.5%
22.8%
Other
PREVTREE
PREVWAG
PREVTRAD
PREVCASH
PREVJOB
PREVFOOD
2.1%
7.0%
7.4%
16.1%
16.3% 25.3%
12.3%
13.7%
Other
PREVTREE
PREVWAG
PREVCASH
PREVREMI PREVJOB
PREVLIVE
PREVFOOD
16.6%
5.6%
10.3%
33.4%
13.7%
20.4%
Other
PREVTREE
PREVWAG
PREVCASH
PREVJOB
PREVFOOD
Sites in forest zone
Sites in moist savannah zone
All sites
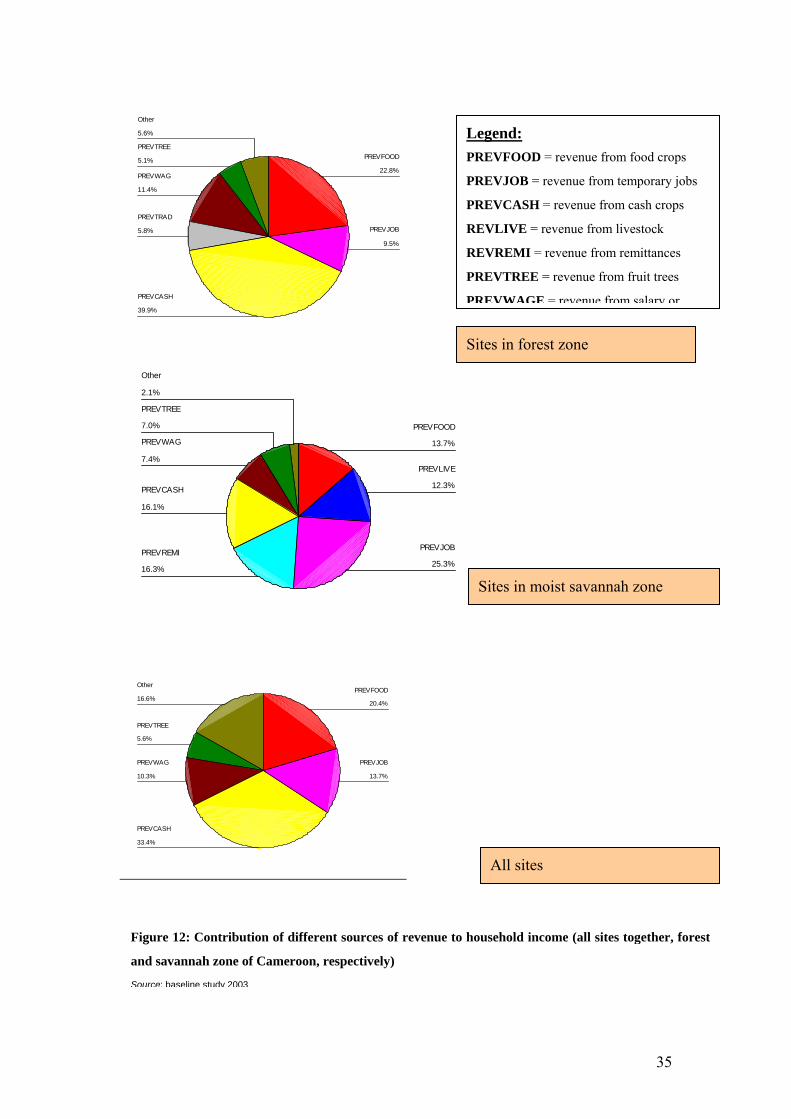
Figure 12: Contribution of different sources of revenue to household income (all sites together, forest
and savannah zone of Cameroon, respectively)
Source: baseline study 2003
Legend: PREVFOOD = revenue from food crops
PREVJOB = revenue from temporary jobs
PREVCASH = revenue from cash crops
REVLIVE = revenue from livestock
REVREMI = revenue from remittances
PREVTREE = revenue from fruit trees
PREVWAGE = revenue from salary or
36
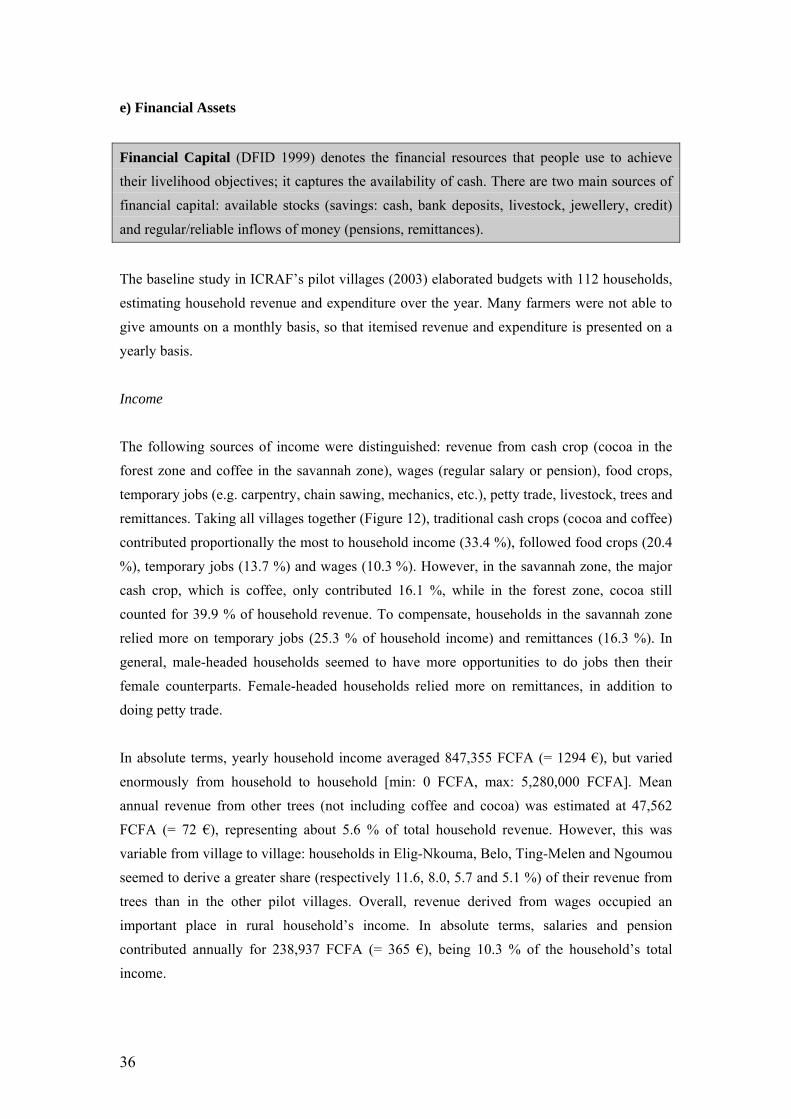
e) Financial Assets
Financial Capital (DFID 1999) denotes the financial resources that people use to achieve their livelihood objectives; it captures the availability of cash. There are two main sources of financial capital: available stocks (savings: cash, bank deposits, livestock, jewellery, credit)
and regular/reliable inflows of money (pensions, remittances).
The baseline study in ICRAF’s pilot villages (2003) elaborated budgets with 112 households, estimating household revenue and expenditure over the year. Many farmers were not able to give amounts on a monthly basis, so that itemised revenue and expenditure is presented on a yearly basis.
Income The following sources of income were distinguished: revenue from cash crop (cocoa in the forest zone and coffee in the savannah zone), wages (regular salary or pension), food crops, temporary jobs (e.g. carpentry, chain sawing, mechanics, etc.), petty trade, livestock, trees and remittances. Taking all villages together (Figure 12), traditional cash crops (cocoa and coffee) contributed proportionally the most to household income (33.4 %), followed food crops (20.4 %), temporary jobs (13.7 %) and wages (10.3 %). However, in the savannah zone, the major cash crop, which is coffee, only contributed 16.1 %, while in the forest zone, cocoa still counted for 39.9 % of household revenue. To compensate, households in the savannah zone relied more on temporary jobs (25.3 % of household income) and remittances (16.3 %). In general, male-headed households seemed to have more opportunities to do jobs then their female counterparts. Female-headed households relied more on remittances, in addition to doing petty trade. In absolute terms, yearly household income averaged 847,355 FCFA (= 1294 €), but varied enormously from household to household [min: 0 FCFA, max: 5,280,000 FCFA]. Mean annual revenue from other trees (not including coffee and cocoa) was estimated at 47,562 FCFA (= 72 €), representing about 5.6 % of total household revenue. However, this was variable from village to village: households in Elig-Nkouma, Belo, Ting-Melen and Ngoumou seemed to derive a greater share (respectively 11.6, 8.0, 5.7 and 5.1 %) of their revenue from trees than in the other pilot villages. Overall, revenue derived from wages occupied an important place in rural household’s income. In absolute terms, salaries and pension contributed annually for 238,937 FCFA (= 365 €), being 10.3 % of the household’s total income.
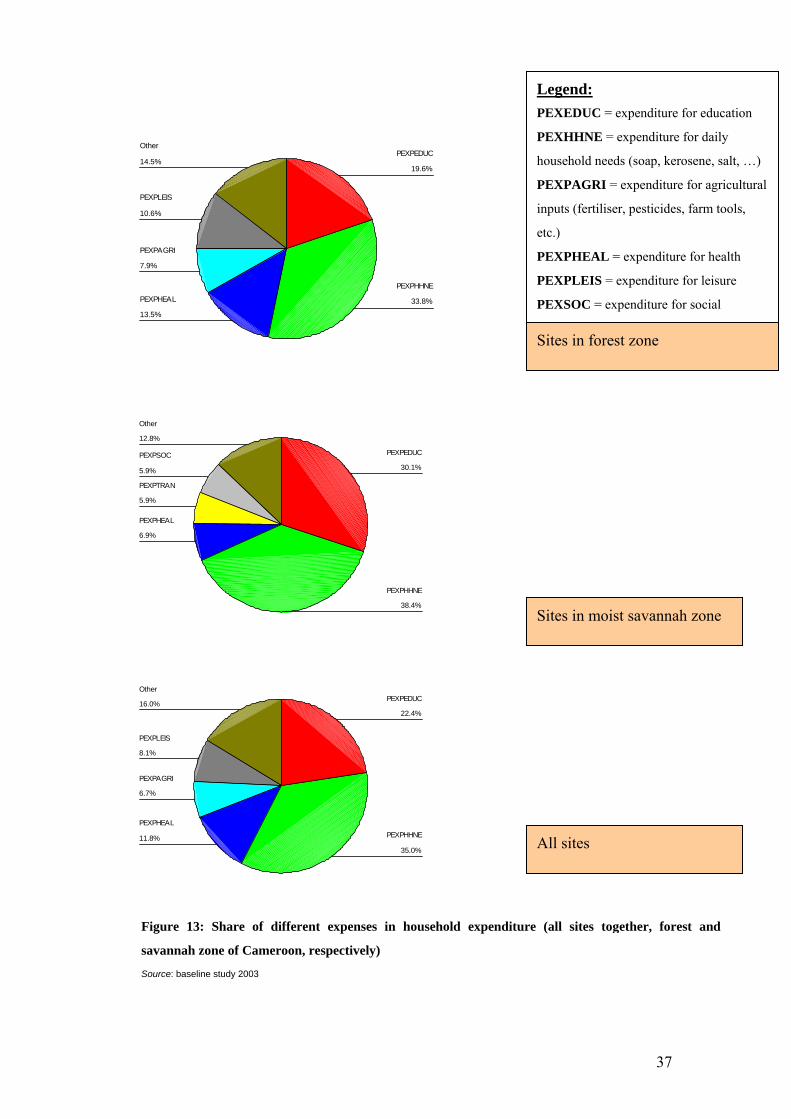
37
14.5%
10.6%
7.9%
13.5%
33.8%
19.6%
Other
PEXPLEIS
PEXPAGRI
PEXPHEAL
PEXPHHNE
PEXPEDUC
12.8%
5.9%
5.9%
6.9%
38.4%
30.1%
Other
PEXPSOC
PEXPTRAN
PEXPHEAL
PEXPHHNE
PEXPEDUC
16.0%
8.1%
6.7%
11.8%35.0%
22.4%
Other
PEXPLEIS
PEXPAGRI
PEXPHEALPEXPHHNE
PEXPEDUC
Sites in forest zone
Sites in moist savannah zone
All sites
Figure 13: Share of different expenses in household expenditure (all sites together, forest and
savannah zone of Cameroon, respectively)
Source: baseline study 2003
Legend: PEXEDUC = expenditure for education
PEXHHNE = expenditure for daily
household needs (soap, kerosene, salt, …)
PEXPAGRI = expenditure for agricultural
inputs (fertiliser, pesticides, farm tools,
etc.)
PEXPHEAL = expenditure for health
PEXPLEIS = expenditure for leisure
PEXSOC = expenditure for social
38
Expenditure Household expenditure was divided up in expenses for daily household needs (soap, kerosene, salt, etc.), education, health, agricultural inputs, livestock inputs, transport, social events, leisure, clothes and building. As shown in Figure 13, households spent proportionally most money on daily household needs (35.0 %), followed by educational expenses (22.4 %), health care (11.8 %), agricultural inputs (6.7 %) and leisure (8.1 %). This expenditure pattern was not remarkably different in the forest compared to the savannah zone, even though households in the savannah zone appeared to spend more on education and social matters and slightly less on health and agricultural inputs. As opposed to income patterns, expenditure patterns of male and female-headed households were quite similar. In absolute terms, households spent on average 622,288 FCFA (= 950 €) per year, which is approximately three quarters of their income, though this varied much from household to household. From the baseline study (2003), it was not clear whether interviewed households effectively had surplus and how they saved or invested this money, although literature (IFAD 2001a) shows that households around the world have always saved: as insurance against emergencies, to meet religious and social obligations and for investment and future consumption. The importance of savings in Cameroon is also demonstrated by the proliferation of local rotating savings and credit associations (tontines or njangi). On the other hand, Essomba (2004) asked farmers from the same study area what they would do in case their income doubled. Building or improving their house was first on the list (40 %), followed by paying better education for the children (21.1 %), investing in a small business (11.5 %) and buying land (7.7 %). Saving money was only mentioned by 5.8 % of the interviewed households. This indicates that less than 20 % of the households thought of making productive investments (small business, land purchase), although investment in education can also be seen as a productive investment in the long term, provided it leads to employment. This can be explained by the fact that the saving mechanisms currently at the disposal of poor people often fail to meet their needs in a convenient, cost-effective and secure way. There exists evidence that if a poor household is given a safe, accessible opportunity, its capacity to save and the amounts it manages to save are remarkable (IFAD 2001a), opening a window of opportunities to smoothen consumption and later acquire assets.
39
2.4 Transforming Structures and Processes Transforming Structures and Processes (DFID 1999) within the livelihoods framework are the institutions, organisations, policies and legislation that shape livelihoods. They operate at all levels, from the household to the international arena, and in all spheres, from the most private to the most public. They effectively determine access to various types of capital; terms of exchange between different types of capital; and returns to any given livelihood strategy. Because culture is included in this area they also account for other ‘unexplained’ differences
in the ‘way things are done’ in different societies.
Participation allows the poor to have a voice, and through transfer of responsibilities gives them the power to discover and determine ways to improve their lives. Empowering the poor is the foundation of rural poverty alleviation. IFAD (2001) suggests three institutional approaches to empowering the rural poor in their quest for poverty reduction:
(1) a blend of devolution and collective action for natural resource management; (2) delivery of financial services to the poor to enable them to access and secure financial
assets; and (3) developing linkages with NGOs and the private sector as partners for service
delivery.
Devolution of Responsibilities According to Oyono (2003), devolution or ‘democratic decentralisation’ implies that authorities or entities representing local populations are elected and - because of their easier access to local information and greater sensitivity to local needs - are more accountable to the local community. However, the claim that local institutions are accountable to the poor is controversial, as decentralised institutions may be controlled by powerful elites that reduce community programmes’ efficiency. Decentralisation efforts in Cameroon have to be viewed in the light of its double colonial heritage. At independence in 1960, a federal structure of government was adopted, but this had changed into a highly centralized, one-party state by 1972. These institutional developments did not allow sufficient participation by the poor, and consequently their energy was not catalysed enough to increase their opportunities for self-fulfilment. With the economic crisis, the tension and fragmentation - brought about by the previous institutional
40
development - degenerated into much social violence through the “dead cities” operations. This forced the government to accommodate the rising political opposition and the law instituted political pluralism in November 1990. This was still not enough, as was shown by the civil unrest that followed in 1991–92; violent protest against the political regime and its ‘governance practices’ including corruption, nepotism and social injustice. Further reforms were then put in place to allow more freedom and liberalization—for example, the 1990 law on association, the 1993 law on cooperatives, measures concerning the media, and so forth (Amin and Dubois 1999). By doing so, the government declared its interest in the strengthening of local governments. Yet, the central state continued to control them and worked towards their authoritarian deconstruction (Oyono 2003). One example of decentralisation in Cameroon is the forestry code reform in 1994 that transfers powers to peripheral actors for the management of forestry fees in order to foster community development, Council Forests and Community Forests (Oyono 2003). The introduction of Community Forests was hailed by all local communities in Cameroon’s dense forest zone as the beginning of an era of equity in intra-generational access to natural resources. Unfortunately, the results are not as tangible as all that and local communities still seem vulnerable and captive. For example, Oyono (2003) views the slowness of the administration in treating applications for Community Forests as indicative of the central state’s wish to keep full control over the process or to even block it and maintain the status quo. Furthermore, senior civil servants and politicians, in their capacity of ‘local elites’, tend to hijack the management committees and hence contribute to the decline of the decentralisation process and the retention of powers at the centre. Based on the above analysis of forest management decentralisation, two facts emerge (Oyono 2003). First, regional-level administrative authorities and national-level bureaucrats tend to withdraw powers and resources devolved to elected bodies and to other local actors. Second, the organisational infrastructure set up at village level to support devolutions seems immature, and incapable of promoting and controlling a collective effort like that required for local management. It certainly means that the way leading to democratic decentralisation in Cameroon needs effective change in policy and practice.
Delivering Financial Services While it is increasingly recognised that microfinance alone is not a magic bullet for poverty reduction, finance for investment helps the poor if basic consumption can be assured and
41
technology (or market access) enables them to earn a decent return on assets (IFAD 2001). Yet, investment by the rural poor is often constrained because they cannot borrow. As a whole, access to credit in Cameroon is very difficult, especially for those in the informal sector. The poor financial situation of the Cameroon banks accounts for the difficult credit conditions imposed on customers, and these conditions are generally not favourable to the poor, especially those in agriculture or the informal sector. These difficulties have pushed people, particularly women, to create solidarity funds with which they can start income-generating activities to satisfy monetary needs or solve financial problems. Njangis provide start-up capital for activities started by their members. The present role of a few non-governmental organizations in the fight to increase credit accessibility for the poor and the more vulnerable cannot be overlooked. To help solve this issue of credit inaccessibility in rural areas, the government, with the help of the World Bank, put in place a specific institution: Fond d’Investissements pour les Micro-réalisations Agricoles et Communaitaires (FIMAC), to disburse investment funds for micro-projects. FIMAC provides financial assistance in the form of collective loans (Amin and Dubois 1999).
Developing Linkages with NGOs and Private Sector With the law No 90/05 of December 19th, 1990, on the liberalization of associations in Cameroon, many community-based associations, common initiative groups (CIGs) and, more generally, NGOs came to life. Besides many other things, they help develop human capacities. As of 1998, about 7,000 CIGs had been registered and some 3,000 applications were still pending approval. Recent experiences in the poverty-reduction program show that these NGOs have a comparative advantage over other development partners (Amin and Dubois 1999). This advantage comes from their proximity, flexibility in approach, technical competence, and, often, international backing. Even though there is not enough evidence to show the extent of their aid to the poor, there is a general belief that their predominant location in rural areas brings them nearer to the poor. Oyono and Temple (2001), however, questioned the capacity of CIGs to play a role in agricultural development because of their diversity and the blurred motivation of their promoters (governmental and non-governmental organisations).
42
2.5 Livelihood Strategies Livelihood Strategies (DFID 1999) is the overarching term used to denote the range and combination of activities and choices that people make/undertake in order to achieve their livelihood goals (including productive activities, investment strategies, reproductive choices,
etc.).
In the light of the baseline study in ICRAF’s pilot villages (2003) and based on previous work in the area, we identified livelihood categories that reflect the household’s main sources of income in ICRAF’s pilot villages.
1. Cocoa/coffee dominant. Households that generate their revenues mainly from
“traditional” cash crops, i.e. cocoa in the forest zone (Abondo, Nkolfep, Nkom-Efoufoum, Elig-Nkouma, Ngoumou and Ting-Melen) and coffee in the savannah zone (Bandjoun and Belo).
2. Cocoa/coffee + food crops. Households that generate an important part of their revenues from cocoa or coffee, but complement this income with food crops.
3. Cocoa/coffee + market gardening. Households that generate an important part of their revenues from cocoa or coffee, but complement this income with market gardening (i.e. tomatoes, okra, green maize, green vegetables).
4. Food crops dominant: households that generate revenues mainly from food crops.
5. Market gardening. Households that generate revenues mainly from market gardening.
6. Other perennials. Households that generate their revenues mainly from perennial crops other than cocoa and coffee, these may include oil palm, fruit trees, etc.
7. Non-agricultural. Households that generate their revenues mainly from non-agricultural activities, such as petty trade, pension, casual labour, etc.
Taking the sites of the forest zone together (Figure 14), the most important livelihood strategy was the system that combines cocoa with food crops, which concerned 28 % of all households. The second most important category (24 %) was made up of households that generate the majority of their income from cocoa alone. Food cropping constituted the main income generating activity for 23 % of forest households overall, but is the main source of
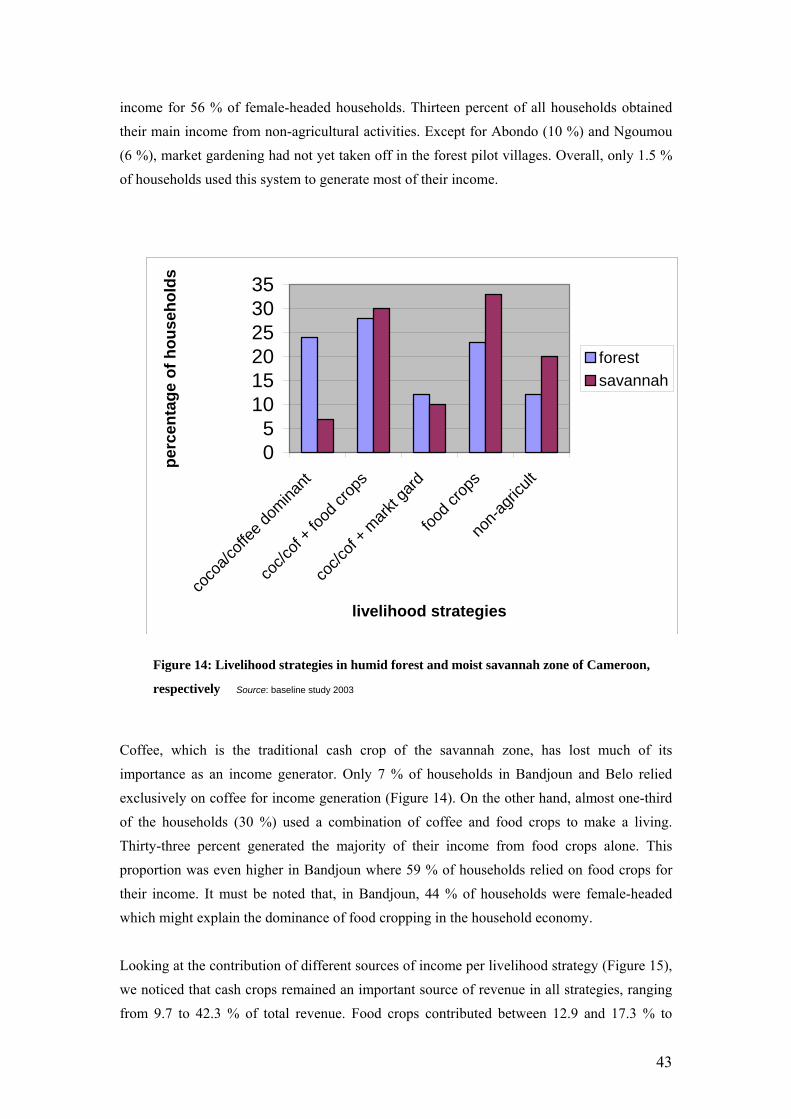
43
income for 56 % of female-headed households. Thirteen percent of all households obtained their main income from non-agricultural activities. Except for Abondo (10 %) and Ngoumou (6 %), market gardening had not yet taken off in the forest pilot villages. Overall, only 1.5 % of households used this system to generate most of their income.
Coffee, which is the traditional cash crop of the savannah zone, has lost much of its importance as an income generator. Only 7 % of households in Bandjoun and Belo relied exclusively on coffee for income generation (Figure 14). On the other hand, almost one-third of the households (30 %) used a combination of coffee and food crops to make a living. Thirty-three percent generated the majority of their income from food crops alone. This proportion was even higher in Bandjoun where 59 % of households relied on food crops for their income. It must be noted that, in Bandjoun, 44 % of households were female-headed which might explain the dominance of food cropping in the household economy. Looking at the contribution of different sources of income per livelihood strategy (Figure 15), we noticed that cash crops remained an important source of revenue in all strategies, ranging from 9.7 to 42.3 % of total revenue. Food crops contributed between 12.9 and 17.3 % to
05
101520253035
coco
a/coff
ee do
minant
coc/c
of + f
ood c
rops
coc/c
of + m
arkt g
ard
food c
rops
non-a
gricu
lt
livelihood strategies
perc
enta
ge o
f hou
seho
lds
forestsavannah
Figure 14: Livelihood strategies in humid forest and moist savannah zone of Cameroon,
respectively Source: baseline study 2003
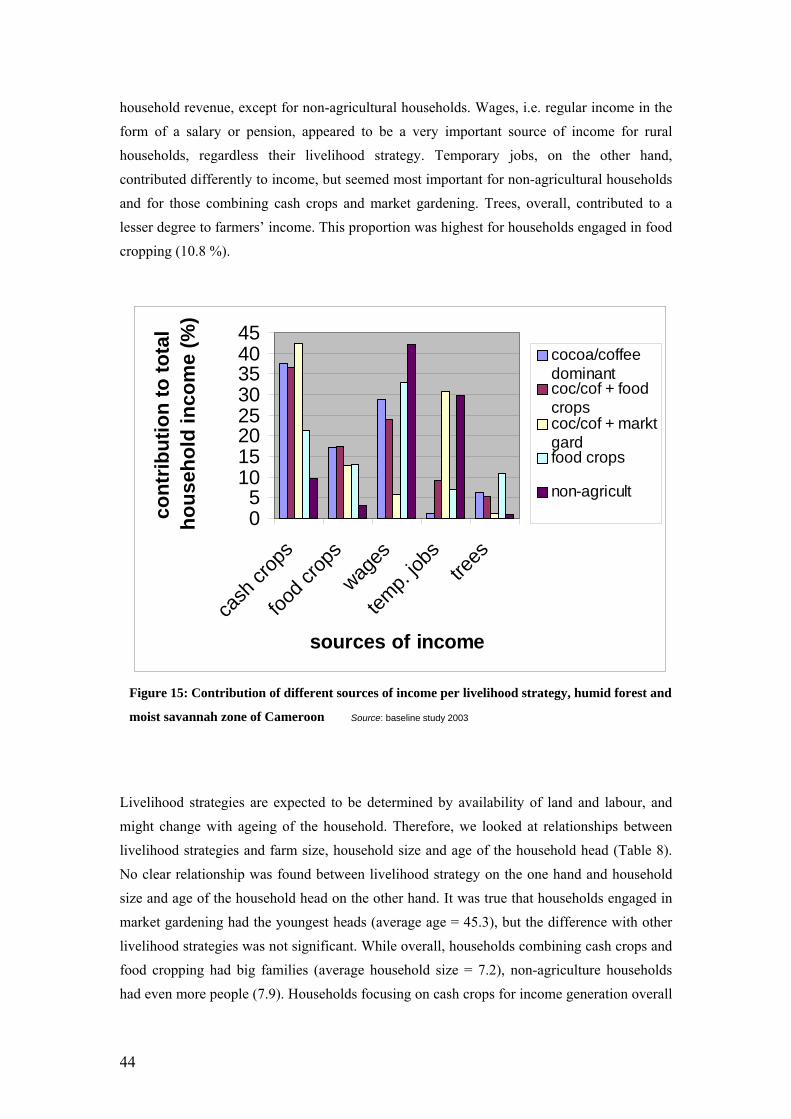
44
household revenue, except for non-agricultural households. Wages, i.e. regular income in the form of a salary or pension, appeared to be a very important source of income for rural households, regardless their livelihood strategy. Temporary jobs, on the other hand, contributed differently to income, but seemed most important for non-agricultural households and for those combining cash crops and market gardening. Trees, overall, contributed to a lesser degree to farmers’ income. This proportion was highest for households engaged in food cropping (10.8 %).
Livelihood strategies are expected to be determined by availability of land and labour, and might change with ageing of the household. Therefore, we looked at relationships between livelihood strategies and farm size, household size and age of the household head (Table 8). No clear relationship was found between livelihood strategy on the one hand and household size and age of the household head on the other hand. It was true that households engaged in market gardening had the youngest heads (average age = 45.3), but the difference with other livelihood strategies was not significant. While overall, households combining cash crops and food cropping had big families (average household size = 7.2), non-agriculture households had even more people (7.9). Households focusing on cash crops for income generation overall
Figure 15: Contribution of different sources of income per livelihood strategy, humid forest and
moist savannah zone of Cameroon Source: baseline study 2003
05
1015202530354045
cash
crop
s
food c
rops
wages
temp.
jobs
trees
sources of income
cont
ribut
ion
to to
tal
hous
ehol
d in
com
e (%
)
cocoa/coffeedominantcoc/cof + foodcropscoc/cof + marktgardfood crops
non-agricult
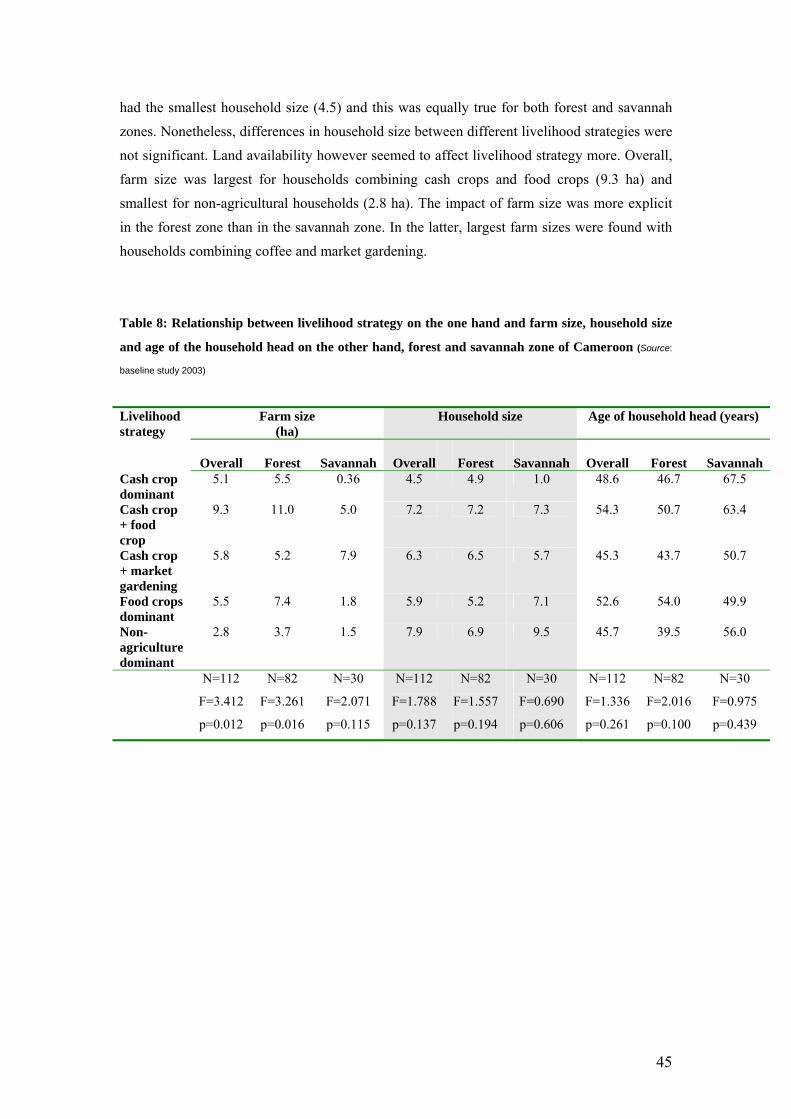
45
had the smallest household size (4.5) and this was equally true for both forest and savannah zones. Nonetheless, differences in household size between different livelihood strategies were not significant. Land availability however seemed to affect livelihood strategy more. Overall, farm size was largest for households combining cash crops and food crops (9.3 ha) and smallest for non-agricultural households (2.8 ha). The impact of farm size was more explicit in the forest zone than in the savannah zone. In the latter, largest farm sizes were found with households combining coffee and market gardening. Table 8: Relationship between livelihood strategy on the one hand and farm size, household size
and age of the household head on the other hand, forest and savannah zone of Cameroon (Source:
baseline study 2003)
Farm size
(ha) Household size Age of household head (years) Livelihood
strategy
Overall
Forest
Savannah
Overall
Forest
Savannah
Overall
Forest
Savannah Cash crop dominant
5.1 5.5 0.36 4.5 4.9 1.0 48.6 46.7 67.5
Cash crop + food crop
9.3 11.0 5.0 7.2 7.2 7.3 54.3 50.7 63.4
Cash crop + market gardening
5.8 5.2 7.9 6.3 6.5 5.7 45.3 43.7 50.7
Food crops dominant
5.5 7.4 1.8 5.9 5.2 7.1 52.6 54.0 49.9
Non-agriculture dominant
2.8 3.7 1.5 7.9 6.9 9.5 45.7 39.5 56.0
N=112
F=3.412
p=0.012
N=82
F=3.261
p=0.016
N=30
F=2.071
p=0.115
N=112
F=1.788
p=0.137
N=82
F=1.557
p=0.194
N=30
F=0.690
p=0.606
N=112
F=1.336
p=0.261
N=82
F=2.016
p=0.100
N=30
F=0.975
p=0.439
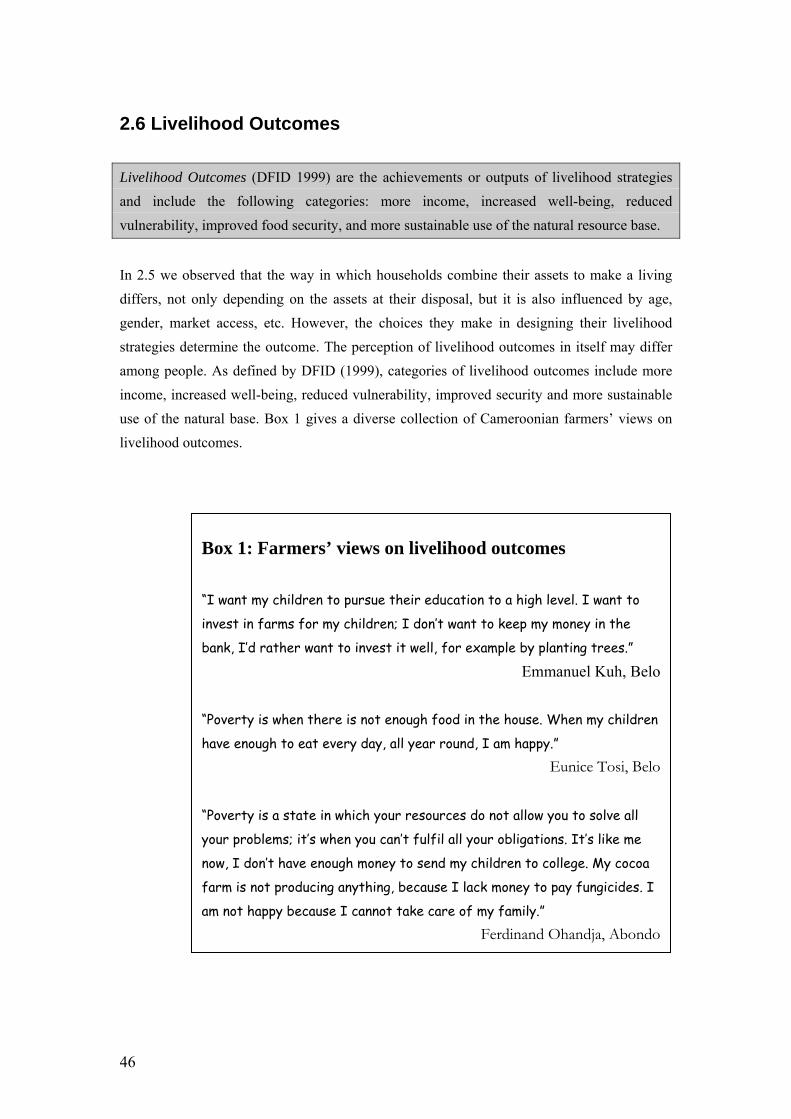
46
2.6 Livelihood Outcomes Livelihood Outcomes (DFID 1999) are the achievements or outputs of livelihood strategies and include the following categories: more income, increased well-being, reduced
vulnerability, improved food security, and more sustainable use of the natural resource base.
In 2.5 we observed that the way in which households combine their assets to make a living differs, not only depending on the assets at their disposal, but it is also influenced by age, gender, market access, etc. However, the choices they make in designing their livelihood strategies determine the outcome. The perception of livelihood outcomes in itself may differ among people. As defined by DFID (1999), categories of livelihood outcomes include more income, increased well-being, reduced vulnerability, improved security and more sustainable use of the natural base. Box 1 gives a diverse collection of Cameroonian farmers’ views on livelihood outcomes.
Box 1: Farmers’ views on livelihood outcomes “I want my children to pursue their education to a high level. I want to
invest in farms for my children; I don’t want to keep my money in the
bank, I’d rather want to invest it well, for example by planting trees.”
Emmanuel Kuh, Belo “Poverty is when there is not enough food in the house. When my children
have enough to eat every day, all year round, I am happy.” Eunice Tosi, Belo
“Poverty is a state in which your resources do not allow you to solve all
your problems; it’s when you can’t fulfil all your obligations. It’s like me
now, I don’t have enough money to send my children to college. My cocoa
farm is not producing anything, because I lack money to pay fungicides. I
am not happy because I cannot take care of my family.” Ferdinand Ohandja, Abondo
47
In our baseline study (2003), sample households were classified into well-being categories, using local indicators that reflect different perceptions of livelihood outcome (income, food security, well-being). Based on experience with participatory wealth-ranking exercises in our study zone (Schreckenberg et al. 2002; Degrande et al. 2006), 5 categories were retained. Enumerators classified households into well-being categories using the criteria below. It is important to note that these categories are subjective and that comparison of households is only relevant within one village and not across villages.
1. Very poor. Households that lack land and generally do not own cocoa or coffee. Households headed by very young, very old, disabled persons or immigrants. Household that do not manage their money well (drink too much, lazy, …). These households are not able to send their children to school or to ensure adequate healthcare. The state of their house also indicates the difficulties they must have to make ends meet.
2. Poor/well-being below average. Households that lack land and/or have a large family. They generally do not have cash crops.
3. Average level of well-being. Households that generate sufficient income from cocoa, market gardening and/or food cropping, but have a large family and a lot of expenses.
4. Well-being above average. Middle-aged households with well-managed cocoa plantations, few children or grown up children, or hard working young households doing market gardening. This category can meet the needs of their household and have no problems with sending their children to school.
5. Rich or well-off. Households that generate income from non-agricultural activities such as trade or wage labour, or that benefit from a pension. Households with large cocoa plantations and good management of their money. These households can be identified through their clothing, food, health care, some assets (vehicle, house, …). These people often lend money to others.
In most villages, the well-being pattern followed a normal distribution curve with few people in the extreme categories of ‘very poor’ on one side or ‘rich’ on the other side, and close to half of households in the category of ‘average well-being’ (Figure 16). Nevertheless, some differences were found between villages. Abondo and Elig-Nkouma, for example, had a larger proportion of ‘very poor’ households, respectively 18 % and 15 %, while Ting-Melen and Nkolfep apparently had no households in the poorest category. The latter have good access to Yaoundé, which favours interactions with relatives working in town and offers job
48
opportunities. In Bandjoun, 37 % of households were classified as ‘very poor’ and 35 % as ‘poor’. In Ting-Melen 41 % of households were categorised as ‘well-off’, which was significantly higher than for the rest of the villages (17 % overall). The sampling procedure used in the study did not allow us to determine whether there was a link between livelihood strategy and level of well-being (too small sample size). However, looking at sources of revenue per well-being category (Figure 17) may give us insights in strategies that permit households to move out of poverty. We noticed that the poorest categories had fewer sources of revenue than better-off categories. Households with average well-being disposed of the most diversified income portfolio with 6 different sources of revenue (only sources contributing more then 5 % were counted) against only 3 for the poorest categories and 4 for the richest categories. Generally, we noticed an increase in the proportion of revenue coming from wages (0 % in the poorest category and 62.3 % for the wealthiest category). At the same time, the contribution of food crops and jobs (temporary work) decreased respectively from 26.3 % to 7.4 % and from 25 % to 9 %. Interestingly, the share of trees in income generation was much larger for households in the average wealth category (15.3 %) than in any other category. These results are in agreement with literature on rural livelihood diversity and agriculture. Ellis and Mdoe (2003) found that income from non-farm sources in Tanzania was higher for upper income groups than for the lowest income quartile. A study of 11 countries in Latin America (Reardon et al. 2001) indicated that non-farm income constituted approximately 40 % of rural incomes. Surprisingly, the highest levels were found in the zones where agriculture was successful, suggesting that rising farm productivity is a driver of the rural non-farm economy with linkages both from production (processing and agro-industries) and consumption (increased demand for manufactured products and inputs) (Chapman and Tripp 2004). We also examined the balance between household revenue and household expenditure and tried to find relationships with livelihood strategies on the one hand and well-being categories on the other hand. Differences in yearly balance between livelihood strategies were not significant. Although there was a clear trend of increasing yearly balance as one moved from poorest category (40,285 FCFA), over average wealth category (74,924 FCFA) to richest (794,252 FCFA), the difference was only significant between the richest category and all other categories.
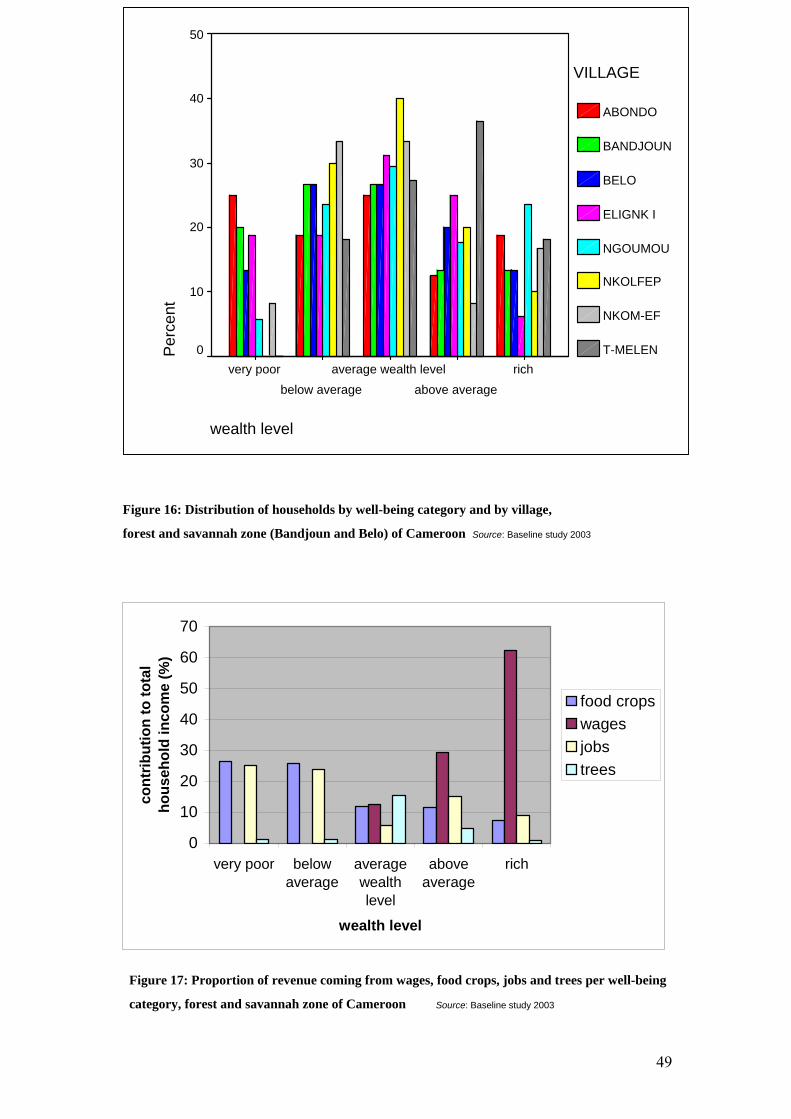
49
0
10
20
30
40
50
60
70
very poor belowaverage
averagewealthlevel
aboveaverage
rich
wealth level
cont
ribut
ion
to to
tal
hous
ehol
d in
com
e (%
)
food cropswagesjobstrees
Figure 17: Proportion of revenue coming from wages, food crops, jobs and trees per well-being
category, forest and savannah zone of Cameroon Source: Baseline study 2003
Figure 16: Distribution of households by well-being category and by village,
forest and savannah zone (Bandjoun and Belo) of Cameroon Source: Baseline study 2003
wealth level
richabove average
average wealth levelbelow average
very poor
Per
cent
50
40
30
20
10
0
VILLAGE
ABONDO
BANDJOUN
BELO
ELIGNK I
NGOUMOU
NKOLFEP
NKOM-EF
T-MELEN
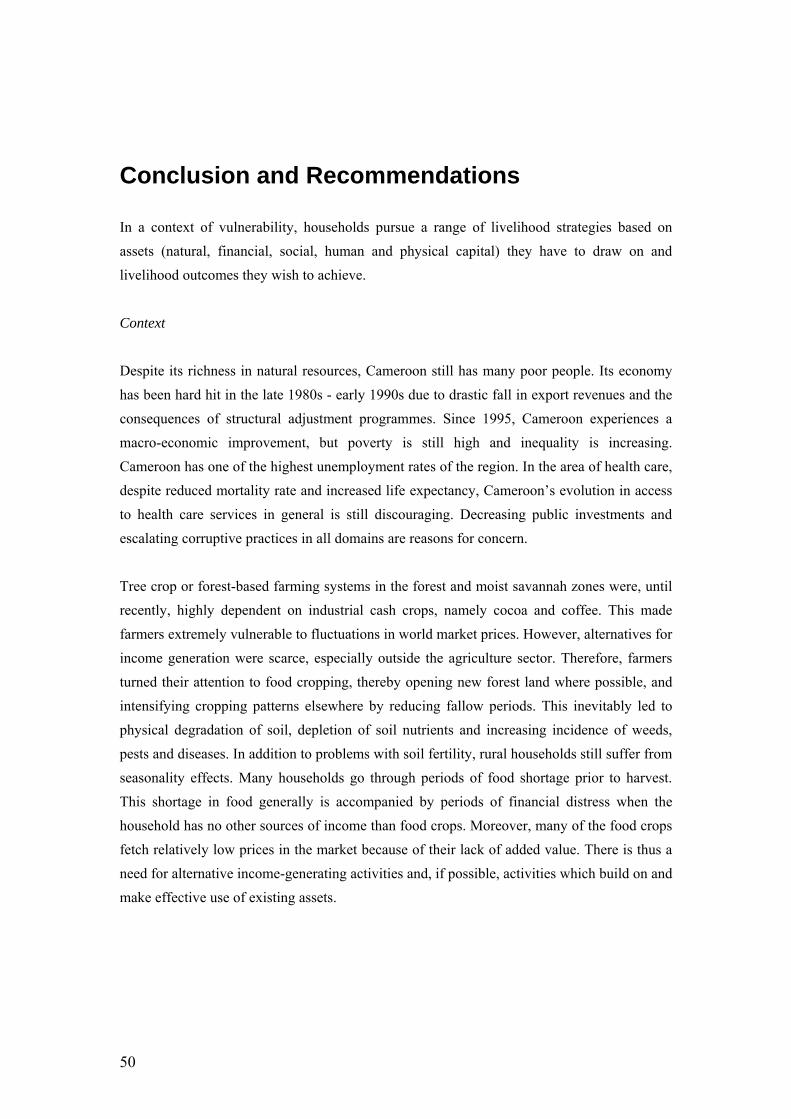
50
Conclusion and Recommendations
In a context of vulnerability, households pursue a range of livelihood strategies based on assets (natural, financial, social, human and physical capital) they have to draw on and livelihood outcomes they wish to achieve.
Context Despite its richness in natural resources, Cameroon still has many poor people. Its economy has been hard hit in the late 1980s - early 1990s due to drastic fall in export revenues and the consequences of structural adjustment programmes. Since 1995, Cameroon experiences a macro-economic improvement, but poverty is still high and inequality is increasing. Cameroon has one of the highest unemployment rates of the region. In the area of health care, despite reduced mortality rate and increased life expectancy, Cameroon’s evolution in access to health care services in general is still discouraging. Decreasing public investments and escalating corruptive practices in all domains are reasons for concern. Tree crop or forest-based farming systems in the forest and moist savannah zones were, until recently, highly dependent on industrial cash crops, namely cocoa and coffee. This made farmers extremely vulnerable to fluctuations in world market prices. However, alternatives for income generation were scarce, especially outside the agriculture sector. Therefore, farmers turned their attention to food cropping, thereby opening new forest land where possible, and intensifying cropping patterns elsewhere by reducing fallow periods. This inevitably led to physical degradation of soil, depletion of soil nutrients and increasing incidence of weeds, pests and diseases. In addition to problems with soil fertility, rural households still suffer from seasonality effects. Many households go through periods of food shortage prior to harvest. This shortage in food generally is accompanied by periods of financial distress when the household has no other sources of income than food crops. Moreover, many of the food crops fetch relatively low prices in the market because of their lack of added value. There is thus a need for alternative income-generating activities and, if possible, activities which build on and make effective use of existing assets.
51
Assets
• Improving human capital increases the skills and capabilities of people, enabling them to overcome various shocks in life and escape from poverty gaps. Education also speeds adoption of new rewarding technologies, eases access to new information, facilitates access to others with information (health professionals and extension agents) and improves ability to make sense of new information. In our study sites, households are comprised of 1 male and 1 female adult and 2-5 children, on average. Most heads of households have had primary education and have substantial experience in agriculture. Although we have no information on health status of households in our study sites, general data for Cameroon raise reasons for concern. Health care coverage as a whole has been poor, especially because a number of health care facilities are poorly equipped or absent. On average, the distance to the nearest health care facility is still long, and services are still poor because of lack of drugs and low motivation of personnel. Only 2 out of 8 study sites had a health centre and 3 had no potable water source at all.
• Strong social organization makes it possible for the poor to gain access to resources and knowledge within their communities and to develop links with external partners. In our study site, groups of all kinds (farming groups, cultural groups, mutual aid groups, savings and credit associations, church associations) occupy an important place in daily life. Credit and savings associations (tontines or njangi) are almost the only financial services accessible to rural households in Cameroon and often provide start-up capital for income generating activities or to buy agricultural inputs or tools. However, their capacity to finance investment for small-scale business is rather low, because of the small amounts involved. Common Initiative Groups (CIGs), because of their legal character, have most contact with NGOs, extension services and projects, but their contribution to development depends a lot on group objectives and cohesion, and dynamism of their leader. Our study revealed very little interaction and collaboration between groups within villages, neither did the households indicate groups as an important source of information about agricultural innovations. Remittances, gifts and transfers are also indications for social bounds. In our study sites, remittances constituted only a small proportion of household income. Overall, the contribution of remittances was higher for female-headed households. We therefore conclude that social capital in our study sites is potentially strong. To be able to become real motors of development however, groups will need training and assistance to mature.
52
• Natural capital is an extremely important asset for agricultural households. This is demonstrated by the fact that it is an important criterion in participatory wealth ranking. It is also the most important reason for conflicts in the village. Most land in the study sites is privately owned. The general rule is that property rights are passed from father to son. Women’s access to land generally comes through men. Primary forests have disappeared in all study sites, although patches of secondary forests or old fallows exist. The latter are owned by families. This implies that, in most villages, open access to natural resources does no longer exist. The predominant farming type is mixed food cropping based on groundnut, cassava, maize and plantain in the forest zone and a combination of beans and maize in the moist savannah area. Perennial cropping systems are dominated by cocoa in the forest and coffee in the moist savannah zone. Most fruit trees are found in these perennial systems. A tree inventory in the study area (Degrande et al. 2006) identified Dacryodes edulis, Mangifera indica, Persea americana, Citrus spp. and Psidium guajava as most common fruit tree species. The results also confirmed that farmers do compensate for loss of access to trees in the wild by planting more trees on their farms. Their tree planting pattern also responds to market incentives.
• It is known that rural areas in developing countries often lack basic infrastructure, such as health centers, schools, markets, roads, electricity, etc., even though better access to this type of physical capital allows the poor to benefit more from innovations. In our study, only half of the sites had a primary school, 2 out of 8 disposed of a health centre and 5 had potable water. Household furniture and equipment was scanty and agricultural tools in most households were limited to hoes and machetes. Three out of the 8 sites were located near a tarred road, while access to the other villages is difficult in the rainy season. Bad roads make the gap between farm and market prices high. This problem is especially acute for roots and tubers, which are quite bulky and perishable. Households in remote places can therefore benefit less from improved incentives and liberalization. Also, apart from easier trips to schools, clinics, extension and so on, better transport facilities can relieve drudgery and save time.
• Financial assets comprise of savings and inflows of money. In our study sites, traditional cash crops (cocoa and coffee) contributed proportionally the most to household income (33.4 %), followed by food crops (20.4 %), temporary jobs (13.7 %) and wages (10.3 %). Household’s average yearly income was 847,355 FCFA (1294 €) with big variations from household to household. Average annual revenue from trees was estimated at 47,562 FCFA per household, being 5.6 % of total
53
revenue. Nonetheless, this proportion was as much as 11.6 % in one of the sites. Irrespective of livelihood strategy or wealth category, temporary jobs contributed an important share to household revenue, being the first and third source of income in the savannah and forest zones respectively. The study also found that about three quarters of the income was spent, which represents an average yearly expenditure of 622,288 FCFA. Households spent proportionally most money on daily household needs (35.0 %), followed by educational expenses (22.4 %), health care (11.8 %), leisure (8.1 %) and agricultural inputs (6.7 %).
Transforming Structures and Processes The study also looked at how policies and processes contribute to development at local level. Three approaches to empowering people in their quest to reduce poverty were highlighted.
(1) Devolution and collective action for natural resource management. In Cameroon, reforms to strengthen participation of people at the community level, illustrated by decentralization of forest management, are at serious risk because administrative authorities and bureaucrats tend to take back powers and resources devolved to elected bodies and to other local actors. Another constraint is that the organisational infrastructure set up at village level to support these devolutions seems immature, and incapable of promoting and controlling a collective effort like that required for local management.
(2) Delivery of financial services. In general, access to credit in Cameroon is difficult. This situation of poor financial services has led to formation of local rotative savings and credit associations that provide start-up capital for activities of their members, but they generally generate rather small amounts of money, lack flexibility and convenience.
(3) Developing linkages with NGOs and private sector. After the 1992 law on liberalization of associations, there has been a boom of NGOs and CBOs that got actively involved in development and poverty reduction. Because of their proximity to the poor, they are expected to respond better to local needs. However, their diversity and lack of funds impedes many of them to contribute effectively to development of the poor.
54
Livelihood Strategies Rural households in southern Cameroon undertake a combination of activities and make choices in order to achieve their livelihood goals. These livelihood strategies are categorised based on the household’s main source of income. In the forest zone, 37 % of the households combine cocoa and food crops to earn a living, whereas 24 % rely on cocoa and 18 % on food crops alone for the majority of their income. Fifteen percent of the households obtain their main income from non-agricultural activities. In the moist savannah, coffee, which is the traditional cash crop, has lost much of its importance; only 2 % of the households still consider it as their main source of income. Almost half of all households combine coffee and food crops, while food crops alone constitute the biggest share of revenues for 35 % of households. A larger proportion of female-headed households generate their revenues mainly from food crops. The results confirm the diversification of farmers in southern Cameroon into food cropping as from the mid-1990s. Whereas cocoa and coffee remain important income generators, many households combine them with food crops to increase revenues. From the study, it appears that land availability mostly affects livelihood strategies. Households that combine cash crops with food crops had largest farm sizes, while those with non-agricultural activities as main income generator were characterised by smaller farms. Age of the household head and family size - a proxy for labour availability - does not seem to affect livelihood strategies significantly, although younger household heads opted more for market gardening, big households were more into cash crops combined with food crops, whereas small households were more involved in cash crops alone.
Livelihood Outcomes Using local indicators of well-being, sample households were categorised from very poor to well-off. The sample size was too small to permit us to determine a relationship between well-being and livelihood strategies, but looking at main sources of revenue we noticed that poorest categories had fewer sources of revenue than better-off categories. Households with average well-being disposed of most diversified income portfolios with 6 different sources of revenue. We also remarked a steady increase in proportion of revenue coming from wages as one moves from the poorest category to the wealthiest, while the contrary was true for the contribution of food crops and jobs. The share of trees in income was much larger for households in the average wealth category than in any other category.
55
Implications for Poverty Reduction Strategies Poverty reduction strategies need to be situated in the context of the Central African region in general, and southern Cameroon in particular. These include: a weak human capital base; inappropriate or insufficiently pro-poor policies and institutions; low agricultural productivity combined with degradation of the natural resource base; insufficient and poorly maintained rural infrastructure; and the need to operate more effectively in the global market place. First of all, the capacity of the rural poor and their organizations to develop adequate livelihood strategies needs to be strengthened. Although in Cameroon, social, human and physical capital are improving, respectively through more NGO networks and social links, better health and education policies and improvements in the banking sector, the rural poor need to have greater access to a variety of interdependent assets – human and social, natural, infrastructural and financial. Our study revealed that development policies and institutions, despite decentralization processes, have not been able to meet the needs of the poor. Therefore, emphasis must be put on building the technical, organizational, and administrative capacity of local governments, communities and civil-society organizations to take on roles previously held by central authorities in this domain. Another priority for development is to raise agricultural and natural resource productivity and to improve access to technology. Intensification and diversification of agriculture call for the generation and dissemination of improved agricultural and natural resource technologies. These technologies should concentrate on areas where population pressure has increased incentives for intensification, and on promotion of community-based natural resource management activities. As IFAD (2001b) suggests, there should be a specific focus on technologies that: (i) use locally available inputs; (ii) build upon indigenous knowledge and practices; (iii) take into account existing systems and their gradual evolution, as well as present constraints in terms of labour, gender division of labour and decision-making, access to finance, access to support services, markets and policies; (iv) are sustainable and environmentally friendly with locally reproducible resources; and (v) can be disseminated through cost-effective client-driven institutions. Diversification of income sources should address two constraints in particular: (1) current high dependence on few crops that are prone to price fluctuations on the world market, and (2) seasonal fluctuations in income and consumption. This can be achieved either through production and marketing of non-traditional crops or by more fully exploiting off-farm opportunities. Indeed, rural non-farm activities may provide steadier streams of cash income
56
than agriculture alone (which is highly seasonal) and are already part and parcel of rural livelihoods (Chapman and Tripp 2004). From our study it also appears that households with non-agricultural activities seem to be better off. However, among the most important rural non-farm activities are those directly linked to agricultural outputs (food processing and marketing) and inputs (blacksmith construction and repair of agricultural implements). Indeed, it is often overlooked that a dynamic smallholder agricultural economy forms the backbone of a vibrant rural non-farm sector. Due to multiplier effects, developing smallholder agriculture is more likely to stimulate off-farm employment than either large-scale agricultural development or industrial development. Nevertheless, rural poor have special problems in exploiting non-farm employment opportunities, because of their limited human and social capital, insufficient access to markets, and lack of credit for working and investment capital. It appears that while the poorest diversify to supplement income and the poor to mitigate risk, only the rich are able to further increase income through diversification (Chapman and Tripp 2004). In the case of non-timber forest products (NTFPs) for example, Ruiz-Perez et al. (2004), based on 61 case studies from Asia, Africa and Latin America, demonstrate that NTFP-specialised households, i.e. cash-oriented households that rely on a forest product as their main source of income, tend to have higher household incomes than the local average. On the other hand, where NTFPs provide income to households that earn the bulk of their income from agriculture or off-farm sources, income equals the local average. Hence, income potential of commercial NTFP production is linked to the existence of infrastructure, access to skills and services, and other enabling conditions that are often lacking in rural Africa. Moreover, because of reasons of food supply, farmers often prefer a mix of activities including both agriculture and micro-enterprises. This was illustrated by Orr and Orr (2002) showing that amongst farmers in Malawi, faced with options to either further specialise in commercial agricultural niches or diversify into other micro-enterprises, a key factor was not to disrupt household food supply. Therefore, targeting the rural poor for diversification and micro-enterprise development requires specialized institutions.
57
References
Amin AA and Dubois J-L 1999. A 1999 Update of the Cameroon Poverty Profile. World Bank Washington DC. (accessed on 25 May 2005) htpp:// www.worldbank.org/afr/poverty/pdf/internal/docnov/01794.pdf
ASB. 2003. Forces driving tropical deforestation. ASB Policy Briefs November 2003. Alternatives to Slash-and-Burn, Nairobi, Kenya.
Baseline study in ICRAF’s pilot villages. 2003. Survey report. World Agroforestry Centre - African Humid Tropics Regional Programme, Yaoundé, Cameroon
Bigombe Logo P and Bikie EH. 1998. Women and Land in Cameroon: Questioning women’s land status and claims for change. The Women and Land Studies. School of Law, Emory University, Atlanta, Georgia, USA. www.Law.emory.edu/WAL/Wal-studies/Cameroon.htm [Accessed on 7 January 2005]
Bikoue MC. 2004. Caractérisation des ménages membres de la filière Ricinodendron
heudelotii dans le cadre du projet « Farmer Enterprise Development » : cas des villages pilotes de l’ICRAF dans la zone ADEAC, province du Centre Cameroun. Rapport de stage de pré-insertion professionnelle. Faculté d’Agronomie et des Sciences Agricoles, Université de Dschang, Cameroun.
Chapman R and Tripp R. 2004. Background Paper on Rural Livelihood Diversity and Agriculture. Paper prepared for the 2004 AgREN electronic conference on the Implications of Rural Livelihood Diversity for Pro-poor Agricultural Initiatives.
CIDA. 2000. Cameroon Poverty Profile. www.acdi-cida.gc.ca/cidaweb/webcountry.nsf/ Degrande A, Schreckenberg K, Mbosso C, Anegbeh P, Okafor V and Kanmegne J. 2006.
Farmers’ fruit tree growing strategies in the humid forest zone of Cameroon and Nigeria. Agroforestry Systems.
DFID. 1999. Sustainable Livelihoods guidance sheets. Department for International Development, UK.
Ellis F and Mboe N. 2003. Livelihoods and rural poverty reduction in Tanzania. World Development Vol 31(8): 1367-1384
Essomba HB. 2004. Participation des groupes vulnérables et des catégories les plus pauvres à la domestication des arbres fruitiers locaux dans les villages pilotes de l’ICRAF au Cameroun. Mémoire de fin d’études présenté en vue de l’obtention du diplôme d’Ingénieur Agronome, option: Economie et Sociologie Rurales. Université de Dschang, Faculté d’Agronomie et des Sciences Agricoles. Dschang, Cameroun.
58
FAO-UNDP. 1979. Soil Science Project. Soil survey and Land Evaluation for the Selection of land for a seed multiplication farm. UCAO-World Bank Development Project. Haut plateau de L'Ouest Technical Report No 9. Soil Science Department IRAF-ONAREST ELOMA (Cameroon).
FAO. 2003. A Handbook for Trainers on Participatory Local Development. http://www.fao.org/documents/show_cdr.asp?url_file=/DOCREP/006/AD346E/ad346eof.htm
FAOSTAT 2003. Major food and agricultural commodities and producers for 2003. FAO The Statistics Division. http://www.fao.org/ess/top/commodity.jsp?commodity=661&lang=EN&year=2003 [accessed on 20 July 2005)
Franzel S, Scherr SJ, Coe R, Cooper PJM and Place F. 2002. Methods for assessing agroforestry adoption potential. In: Franzel S and Scherr SJ (eds.) 2002. Trees on the Farm. Assessing the Adoption Potential of Agroforestry Practices in Africa. CAB International in association with ICRAF. p 11-36
Gartland JS 1992. Analyses of critical natural resources and environmental issues in terms of economic development: biodiversity and wildlife. Unpublished report to USAID.
Gockowski J, Baker D, Tonye J, Weise S, Ndoumbé M, Tiki-Manga T, Fouaguégué A and Tchienkoua M. 1998. Characterization and diagnosis of farming systems in the forest margins Benchmark of Southern Cameroon. Report prepared for the Alternatives to Slash and Burn System-wide Initiative of the CGIAR. IITA, Yaoundé, Cameroon.
Gockowski J, Weise S, Sonwa D, Tchatat M and Ngobo M. 2004. Conservation Because It Pays: Shaded Cocoa Agroforests in West Africa. Paper presented at the "Theobroma cacao: Ancient Crop, Medicinal Plant, Surprising Future Symposium" held February 10, 2004 at the National Academies, Washington, DC.
Guyer J. 1989. From seasonal income to daily diet in a partially commercialised rural economy (Southern Cameroon). In: Sahn DE (ed). 1989. Seasonal Variability in Third World Agriculture: The Consequences for Food Security. IFPRI. John Hopkins University Press. p. 137-150. www.ifpri.org/pubs/books/sahn89/sahn89ch09.pdf [Accessed on 18 July 2005]
ICRAF. 1995. Annual Report 1995. International Centre for Research in Agroforestry, Nairobi, Kenya: 288 p.
ICRAF 1996. Annual Report 1996. International Centre for Research in Agroforestry, Nairobi, Kenya. 340 p
ICRAF. 2000. Paths to prosperity through agroforestry. ICRAF’s Corporate Strategy 2001-2010. International Centre for Research in Agroforestry, Nairobi, Kenya. September 2000. 43p.
59
ICRAF. 2003. Working Trees for Working People. Annual Report 2003. World Agroforestry Centre, Nairobi, Kenya. 54p.
ICRAF-AHT. 2002. Annual Report 2001-2002. International Centre for Research in Agroforestry-African Humid Tropics Regional Programme. Yaoundé, Cameroon.
ICRAF-AHT. 2003. Annual Report. World Agroforestry Centre, ICRAF-African Humid Tropics Regional Programme. Yaoundé, Cameroon.
IFAD. 2001a. Rural Poverty Report. The challenge of ending rural poverty. IFAD, Rome. 268 p.
IFAD. 2001b. Assessment of rural poverty: Western and Central Africa. IFAD, Rome. 116p. IISD. 1995. Participatory Research for sustainable livelihoods. A guide for field projects on
adaptive strategies. International Institute for Sustainable Development. http://www.iisd.org/casl/CASLGuide/guidebook-home.htm Izac AM. 2003. Economic Aspects of Soil Fertility Management and Agroforestry Practices.
In: Schroth G and Sinclair FF (eds.) Trees, Crops and Soil Fertility. CABI Publishing. p 13-37
Leakey RRB, Schreckenberg K and Tchoundjeu Z. 2003. The participatory domestication of West African indigenous fruits. International Forestry Review 5(4): 338-347
Mbosso C. 1999. Opportunités et contraintes socio-économiques liées à la culture des arbres fruitiers locaux dans les basses terres humides du Cameroun : Dacryodes edulis et Irvingia gabonensis. Mémoire de fin d’études présenté en vue de l’obtention du diplôme d’Ingénieur Agronome. Université de Dschang, Faculté d’Agronomie et des Sciences Agricoles, Dschang, Cameroun.
MINEF (Ministère de l’Environnement et des Forêts du Cameroun). 1996. Conservation, gestion et valorisation de la biodiversité et des ressources forestières au Cameroun. Unpublished study report. MINEF-Yaoundé.
Ndoye O and Kaimowitz D. 2000. Macro-Economics, Markets, and the Humid Forests of Cameroon, 1967-1997. http://www.wrm.org.uy/deforestation/Africa/Cameroon2.html [Accessed on 22 November 2005]
Orr A and Orr S. 2002. Agriculture and micro-enterprise in Malawi’s rural south. Agricultural Research and Extension Network Paper Number 122. ODI.
Oyono PR and Temple L. 2001 Métamorphose des organisations rurales au Cameroun. Implications pour la recherche-développement et la gestion des ressources naturelles. Revue Internationale de l’Economie Sociale No 288 : 68-79
Oyono PR. 2003. One step forward, two steps back? Paradoxes of natural resources management decentralization in Cameroon. Journal of Modern African Studies 42 (1): 91-111.
60
Pretty JN, Guijt I, Thompson J and Scoones I. 1995. A trainer’s guide for participatory learning and action. IIED Participatory Methodology series. IIED, London.
Reardon T, Berdegue J and Escobar G. 2001. Rural Non-farm Employment and Incomes in Latin America: Overview and Policy Implications. World Development 29(3): 359-409.
Ruiz-Perez M, Belcher B, Achdiawan R, Alexiades M, Aubertin C, Caballero J, Campbell B, Clement C, Cunningham T, Fantini A, de Foresta H, Carcia Fernandez C, Gautam KH, Hersch MP, de Jong W, Kusters K, Govindan KM, Lopex C, Fu M, Martinez Alfaro MA, Raghavan Nair TK, Ndoye O, Ocampo R, Rai N, Ricker M, Schreckenberg K, Shackleton S, Shanley P, Sunderland T and Youn Y-C. 2004. Markets drive the specialisation strategies of forest peoples. Ecology and Society 9(2): 4 [online] URL: http://www.ecologyandsociety.org/vol9/iss2/art4 [Accessed on 30 September 2005]
Schreckenberg K, Degrande A, Mbosso C, Boli Baboule Z, Boyd C, Enyong L, Kanmegne J and Ngong C. 2002. The Social and Economic Importance of Dacryodes edulis in Southern Cameroon. Forests, Trees and Livelihoods. Vol 12 Nos 1, 2: 15-40
Shackleton S, Shackleton C and Cousins B. 2000. Re-Valuing the communal lands of southern Africa: New understandings of rural livelihoods. ODI NRP, Number 62, November 2000
Stienbarger DM. 1990. Tenure and Alley Farming: A literature review with particular reference to the West African Humid Zone. Land Tenure Centre Paper 138. University of Wisconsin-Madinson. 36p.
Tassi SA. 2001. Proposition de stratégies d’exploitation des arbres fruitiers et plantes médicinales pour la stabilisation du profil du revenu net des ménages ruraux : cas des ménages de Bitzogman et Nkum Ekye. Mémoire de fin d’études présenté en vue de l’obtention du diplôme d’Ingénieur Agronome. Université de Dschang, Faculté d’Agronomie et des Sciences Agricoles, Dschang, Cameroun.
Tchoundjeu Z, Duguma B, Tientcheu M.L. and Ngo-Mpeck M.L. 1999. Domestication of indigenous agroforestry trees: ICRAF’s strategy in the humid tropics of West and Central Africa. In: Sunderland T.C.H., Clark L.E. and Vantomme P. (eds) 1999. Non-
wood forest products of Central Africa. Current research issues and prospects for conservation and development. Based on the outcome of the International Expert Meeting on NWFP in Central Africa, held at Limbe Botanic Garden, Cameroon. 10-15 May 1998. p 161-170.
Tonye J, Ambassa-Kiki R and Nsangou M. 1988. Description des systèmes d’utilisation des terres dans la zone forestière du Cameroun. Possibilités d’amélioration. Science et Technique 3(1) : 31-43.
UNAIDS 2004. 2004 report on global AIDS.
61
UNDP 2003. Human Development Indicators for Cameroon.
http://www.undp.org/hdr2003/indicator/cty_f_CMR.html Vivien J and Faure JJ. 1985. Arbres des forets denses d’Afrique Centrale. Ministère des
Relations Extérieures, Agence de Développement et de Coopération Culturelle et Technique, Paris.
Vivien J and Faure JJ. 1996. Fruitiers sauvages d’Afrique (espèces du Cameroun). CTA and Nguilou-Kerou Paris, France. 416p.
World Bank. 2002. World Bank Development Indicators Database.
62
Working Paper Series
1. Agroforestry in the drylands of eastern Africa: a call to action 2. Biodiversity conservation through agroforestry: managing tree species diversity
within a network of community-based, nongovernmental, governmental and research organizations in western Kenya.
3. Invasion of prosopis juliflora and local livelihoods: Case study from the Lake Baringo area of Kenya
4. Leadership for change in Farmers Organizations: Training report: Ridar Hotel, Kampala, 29th March to 2nd April 2005
5. Domestication des espèces agroforestières au Sahel : situation actuelle et perspectives
6. Relevé des données de biodiversité ligneuse: Manuel du projet biodiversité des parcs agroforestiers au Sahel
7. Improved Land Management in the Lake Victoria Basin: TransVic Project’s Draft Report
8. Livelihood capital, strategies and outcomes in the Taita hills of Kenya 9. Les espèces ligneuses et leurs usages: Les préférences des paysans dans le Cercle
de Ségou, au Mali 10. La biodiversité des espèces ligneuses: Diversité arborée et unités de gestion du
terroir dans le Cercle de Ségou, au Mali 11. Bird diversity and land use on the slopes of Mt. Kilimanjaro and the adjacent
plains, Tanzania 12. Water, women and local social organization in the Western Kenya Highlands 13. Highlights of ongoing research of the World Agroforestry Centre in Indonesia 14. Prospects of adoption of tree-based systems in a rural landscape and its likely
impacts on carbon stocks and farmers’ welfare: the FALLOW Model Application in Muara Sungkai, Lampung, Sumatra, in a ‘Clean Development Mechanism’ context
15. Equipping Integrated Natural Resource Managers for Healthy Agroforestry Landscapes.
16. Are they competing or compensating on farm? Status of indigenous and exotic tree species in a wide range of agro-ecological zones of Eastern and Central Kenya, surrounding Mt. Kenya.
17. Agro-biodiversity and CGIAR tree and forest science: approaches and examples from Sumatra.
63
18. Improving land management in eastern and southern Africa: A review of polices. 19. Farm and Household Economic Study of Kecamatan Nanggung, Kabupaten Bogor,
Indonesia: A Socio-economic base line study of Agroforestry Innovations and Livelihood Enhancement
20. Lessons from eastern Africa’s unsustainable charcoal business. 21. Evolution of RELMA’s approaches to land management: Lessons from two decades
of research and development in eastern and southern Africa 22. Participatory watershed management: Lessons from RELMA’s work with farmers in
eastern Africa. 23. Strengthening farmers’ organizations: The experience of RELMA and ULAMP. 24. Promoting rainwater harvesting in eastern and southern Africa. 25. The role of livestock in integrated land management. 26. Status of carbon sequestration projects in Africa: Potential benefits and challenges to
scaling up. 27. Social and Environmental Trade-Offs in Tree Species Selection: A Methodology for
Identifying Niche Incompatibilities in Agroforestry [Appears as AHI Working Paper
no. 9] 28. Managing Trade-Offs in Agroforestry: From Conflict to Collaboration in Natural
Resource Management. [Appears as AHI Working Paper no. 10] 29. Essai d'analyse de la prise en compte des systemes agroforestiers pa les legislations
forestieres au Sahel: Cas du Burkina Faso, du Mali, du Niger et du Senegal. 30. Etat de la Recherche Agroforestière au Rwanda. Etude bibliographique, période
1987-2003 31. Science and Technological Innovations for Improving Soil fertility and Management
in Africa: A report for NEPAD’s Science and Technology Forum. 32. Compensation and-Rewards for Environmental Services in the Developing World:
Framing Pan-Tropical Analysis and Comparison 33. Report on the Latin American Regional Workshop on Compensation for
Environmental Services and Poverty Alleviation in Latin America 34. Asia Regional Workshop on Compensation for Ecosystems Services. A component of
the Global Scoping Study on Compensation for Ecosystem services 35. African Regional Workshop on Compensation for Ecosystem Services (CES) 36. Exploring the inter-linkages among and between Compensation and Rewards for
Ecosystems Services (CRES) and human well-being: CES Scoping Study Issue Paper no. 1
37. Criteria and indicators for environmental service compensation and reward mechanism: realistic, voluntary, conditional and pro-poor: CES Scoping Study Issue Paper no. 2.
64
38. The conditions for effective mechanisms of Compensation and Rewards for Environmental Services (CRES): CES Scoping Study Issue Paper no. 3.
39. Organisation and governance for fostering pro-poor Compensation for Environmental Services: CES Scoping Study Issue Paper no.4.
40. How important will different types of Compensation and Reward Mechanisms be in shaping poverty and ecosystem services across Africa, Asia and Latin America over the next two decades? CES Scoping Study Issue Paper no. 5.
41. Risk mitigation in contract farming: Learning from practice: The case of poultry, cotton, woodfuel and cereals in East Africa
42. The RELMA savings and credit experiences: sowing the seed of sustainability 43. Policy and Institutional Context for NRM in Kenya: Challenges and Opportunities
for Landcare. 44. Nina-Nina Adoung Nasional di So! Field Test of Rapid Land Tenure Assessment
(RATA) in the Batang Toru Watershed, North Sumatra. 45. Is Hutan Tanaman Rakyat a new paradigm in community based tree planting in
Indonesia? 46. Socio-Economic Aspects of Brackish Water Aquaculture (Tambak) Production in
Nanggroe Aceh Darrusalam.