
WP 7: System Integration & Assessment · Document Author(s) Juha Schweighofer (via donau), Dávid...
76
D7.3 Environmental Impact 1/76 WP 7: System Integration & Assessment D7.3 Environmental Impact Final Report Creation Date: 2013 - 11 - 05 Revision Date: 2013 - 11 - 05 Project: MoveIT! WP: 7 Responsible: via donau - Juha Schweighofer
Transcript of WP 7: System Integration & Assessment · Document Author(s) Juha Schweighofer (via donau), Dávid...

D7.3 Environmental Impact
1/76
WP 7: System Integration & Assessment
D7.3 Environmental Impact Final Report
Creation Date: 2013 - 11 - 05 Revision Date: 2013 - 11 - 05 Project: MoveIT! WP: 7 Responsible: via donau - Juha Schweighofer

D7.3 Environmental Impact
2/76
ABSTRACT The environmental assessment of the MoVe IT! vessels and the EU fleet is one major objective of the MoVe IT! project. The environmental assessment is carried out for five vessels, comprising a container vessel, three pushers and a motor cargo vessel being operated together with a lighter. The vessels are being operated on the Rhine, the Danube and the Seine. Full information on the operation of the vessels was made available by the ship owners, providing a real-life basis for the environmental assessment. The emissions considered comprise the carbon dioxide (CO2), nitrogen oxide (NOX), particulate matter (PM), hydrocarbon (HC), carbon monoxide (CO) and sulphur dioxide (SO2) emissions. The emissions are estimated using the fuel consumption recorded, as well as emission factors referred to the mass of fuel. The emissions are presented as yearly values, and values related to the transport performance in tonne kilometre (tkm). The effects of the different technologies to be applied in the vessels are taken into account by the resulting reduction of the fuel consumption or directly the respective emissions in per cent. The emissions referred to tkm are compared with the ones of road transport carried out with trucks complying with emissions standards EURO III up to Euro VI, as well as the East European emission standard (EE). On European level, the yearly total emissions of the EU fleet are considered. Due to their significance in the evaluation of the external costs caused by air pollutants and greenhouse gasses, and the current discussion on stricter emission standards for inland waterway transport (IWT), only the CO2, NOX and PM emissions are taken into account. The reduction in the yearly emissions of the EU fleet as well as the associated reduction in the external costs is evaluated. The retrofit solutions with a great impact on NOX and PM emissions turn out to have the greatest impact on the external costs caused by air pollutants and greenhouse gasses.

D7.3 Environmental Impact
3/76
Document Properties Document Name: D7.3 Environmental Impact
Document Author(s) Juha Schweighofer (via donau), Dávid György, Csaba Hargitai, István Hillier, László Sábitz, Győző Simongáti (all BME)
Document Editor(s) Juha Schweighofer (via donau)
Date of delivery 2013-11-05
Nature of Deliverable Report Prototype Demonstrator Other
Circulation
Security Status CONFIDENTAL
Document Status Draft Final Approved by SG Steering (or SP meeting type-D) Approved by reviewer Acknowledged by MOVEIT! Steering Issued to EC
Keywords Environmental analysis, inland waterway transport, emissions, external costs
Related MoVeIT! Reports D 7.1, D 7.2

D7.3 Environmental Impact
4/76
Partners involved No. Organisation Name Name Email
1 MARIN Karola van der
Meij
Meeuwis van
Wirdum
3 via donau Juha Schweighofer [email protected]
4 DUT Robert
Hekkenberg
Milinko Godjevac [email protected]
5 CMT Timo Wilcke wilcke@cmt:net.org
Lars Molter Molter@cmt:net.org
8 ECORYS Johan Gille [email protected]
Linette deSwart [email protected]
12 UGAL Ionel Chirica [email protected]
13 S.S. Laurent Mermier [email protected]
Christian Gaudin [email protected]
15 CFT Steve Labeylie [email protected]
16 SDG Vasile Giuglea [email protected]
19 TKV Be Boneschansker [email protected]
20 Hlog Tibor Matyas Tibor.matyas@ddsg:mahart.com
21 Plimsoll Bela Szalma [email protected]
22 BME Dávid György
Csaba Hargitai
István Hillier
László Sábitz
Győző Simongáti
23 M.M. Alain Bourcier a.bourcier@masson:marine.com
Document history Version Date of delivery Changes Author(s)
Editor(s)
Reviewed by
v.01 18.10.2013 Juha Schweighofer
(via donau), Dávid
György, Csaba
Hargitai, István
Hillier, László
Sábitz, Győző
Simongáti (all BME)
Khalid Tachi (SPB)
v.02 31.10.2013 Editorial changes,
abstract, introduction,
summary
Juha Schweighofer
(via donau)
Robert Hekkenberg
(DUT)
Khalid Tachi (SPB)
v.03 05.11.2013 Editorial changes,
summary
Juha Schweighofer
(via donau)
Robert Hekkenberg
(DUT)
D7.3 Environmental Impact
5/76
Table of Contents
1. INTRODUCTION ................................................................................................................................... 7
2. METHODOLOGY OF EMISSION CALCULATION ..................................................................... 8
3. ENVIRONMENTAL ANALYSIS OF THE CARPE DIEM .......................................................... 13
3.1. DESCRIPTION OF THE VESSEL ........................................................................ 13
3.2. AVAILABLE DATA AND OPERATIONAL CONDITIONS ....................................... 14
3.3. DESCRIPTION OF TECHNOLOGICAL IMPROVEMENTS ...................................... 15
3.3.1. New rudder concept ........................................................................ 15
3.3.2. Shortening of gondolas .................................................................... 15
3.4. ASSESSMENT OF EMISSIONS ........................................................................... 16
4. ENVIRONMENTAL ANALYSIS OF THE DUNAFÖLDVAR .................................................... 21
4.1. DESCRIPTION OF THE VESSEL ........................................................................ 21
4.2. AVAILABLE DATA AND OPERATIONAL CONDITIONS ....................................... 22
4.3. DESCRIPTION OF TECHNOLOGICAL IMPROVEMENTS ...................................... 23
4.3.1. Removal of flanking rudders and installation of bow thruster .................. 23
4.3.2. Replacement of propulsion engines ................................................... 24
4.4. ASSESSMENT OF EMISSIONS ........................................................................... 26
5. ENVIRONMENTAL ANALYSIS OF THE HERSO 1 .................................................................. 31
5.1. DESCRIPTION OF THE VESSEL ........................................................................ 31
5.2. AVAILABLE DATA AND OPERATIONAL CONDITIONS ....................................... 33
5.3. DESCRIPTION OF TECHNOLOGICAL IMPROVEMENTS ...................................... 34
5.4. ASSESSMENT OF EMISSIONS ........................................................................... 35
6. ENVIRONMENTAL ANALYSIS OF THE INFLEXIBLE ............................................................. 39
6.1. DESCRIPTION OF THE VESSEL ........................................................................ 39
6.2. AVAILABLE DATA AND OPERATIONAL CONDITIONS ....................................... 40
6.3. DESCRIPTION OF TECHNOLOGICAL IMPROVEMENTS ...................................... 41
6.3.1. Ship Studio solution for improved propulsion ....................................... 41

D7.3 Environmental Impact
6/76
6.3.2. Redesign of the stern, propeller and rudder arrangement ...................... 42
6.4. ASSESSMENT OF EMISSIONS ........................................................................... 43
7. ENVIRONMENTAL ANALYSIS OF THE VEERHAVEN X ....................................................... 48
7.1. DESCRIPTION OF THE VESSEL ........................................................................ 48
7.2. AVAILABLE DATA AND OPERATIONAL CONDITIONS ....................................... 49
7.3. DESCRIPTION OF TECHNOLOGICAL IMPROVEMENTS ...................................... 50
7.3.1. Application of SCR catalysts and particulate matter filters ..................... 50
7.4. ASSESSMENT OF EMISSIONS ........................................................................... 52
8. ENVIRONMENTAL ANALYSIS OF THE EUROPEAN FLEET ............................................... 56
8.1. DESCRIPTION OF THE EUROPEAN FLEET ......................................................... 56
8.2. ASSESSMENT OF EMISSIONS ........................................................................... 58
8.2.1. Scenario definition – assumptions .............................................. 58
8.2.2. Emissions and external costs ..................................................... 59
9. SUMMARY ............................................................................................................................................. 65
10. BIBLIOGRAPHY AND REFERENCES ......................................................................................... 71
11. INDEXES ............................................................................................................................................. 72
11.1. INDEX OF FIGURES ........................................................................................ 72
11.2. INDEX OF TABLES .......................................................................................... 73
11.3. LIST OF ABBREVIATIONS ................................................................................ 74

D7.3 Environmental Impact
7/76
1. Introduction On November 1st, 2011, the MoVe IT! project - Modernisation of Vessels for Inland Waterway Freight Transport – started. Co-funded through the Seventh Framework Programme of the European Union, the project aims at a modernisation of inland waterway vessels with focus on retrofitting of existing vessels and technology transfer from new buildings and other transport modes. The topics of the project refer to the improvement of energy efficiency and environmental behaviour of inland waterway vessels, as well as the implementation of alternative energy sources to gasoil. Concerning safety, the adaption to the ADN regulations related to the transportation of dangerous goods is considered. During the course of the project, a variety of different retrofit solutions for improving the economic and environmental performance of inland waterway transport (IWT) was identified and investigated. Consultation with experts of and, in particular, the representatives of the ship owners of the project lead to a selection of retrofit solutions regarded as worth to be investigated further with respect to their practical implementation. These solutions were considered in detail in the project, comprising technical elaborations, as well as economic and environmental performance assessments. As improving the environmental performance of the MoVe IT! vessels is one major objective of the project, the environmental assessment plays an important role in the evaluation of the technologies developed. The environmental assessment is carried out for five vessels, comprising a container vessel, three pushers and a motor cargo vessel being operated together with a lighter. The vessels are being operated on the Rhine, the Danube and the Seine. Full information on the operation of the vessels was made available by the ship owners, providing a real-life basis for the environmental assessment. The emissions considered comprise the carbon dioxide (CO2), nitrogen oxide (NOX), particulate matter (PM), hydrocarbon (HC), carbon monoxide (CO) and sulphur dioxide (SO2) emissions. The emissions are estimated using the fuel consumption recorded, as well as emission factors referred to the mass of fuel. The emissions are presented as yearly values, and values related to the transport performance in tonne kilometre (tkm). The effects of the different technologies to be applied in the vessels are taken into account by the resulting reduction of the fuel consumption or directly the respective emissions in per cent. The emissions referred to tkm are compared with the ones of road transport carried out with trucks complying with emissions standards EURO III up to Euro VI, as well as the East European emission standard (EE). On European level, the yearly total emissions of the EU fleet are considered. Due to their significance in the evaluation of the external costs caused by air pollutants and greenhouse gasses, and the current discussion on stricter emission standards for IWT, only the CO2, NOX and PM emissions are taken into account. The reduction in the yearly emissions of the EU fleet as well as the associated reduction in the external costs is evaluated. The retrofit solutions with a great impact on NOX and PM emissions turn out to have the greatest impact on the external costs caused by air pollutants and greenhouse gasses.
D7.3 Environmental Impact
8/76
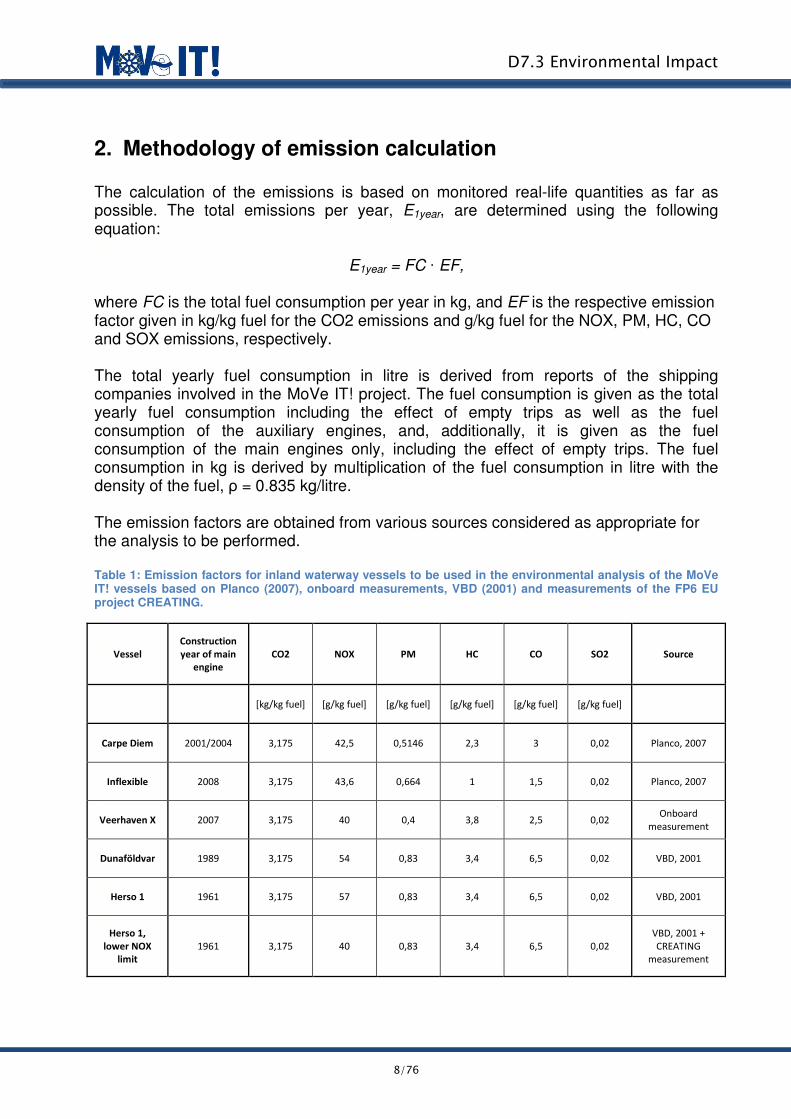
2. Methodology of emission calculation The calculation of the emissions is based on monitored real-life quantities as far as possible. The total emissions per year, E1year, are determined using the following equation:
E1year = FC · EF,
where FC is the total fuel consumption per year in kg, and EF is the respective emission factor given in kg/kg fuel for the CO2 emissions and g/kg fuel for the NOX, PM, HC, CO and SOX emissions, respectively. The total yearly fuel consumption in litre is derived from reports of the shipping companies involved in the MoVe IT! project. The fuel consumption is given as the total yearly fuel consumption including the effect of empty trips as well as the fuel consumption of the auxiliary engines, and, additionally, it is given as the fuel consumption of the main engines only, including the effect of empty trips. The fuel consumption in kg is derived by multiplication of the fuel consumption in litre with the density of the fuel, ρ = 0.835 kg/litre. The emission factors are obtained from various sources considered as appropriate for the analysis to be performed. Table 1: Emission factors for inland waterway vessels to be used in the environmental analysis of the MoVe IT! vessels based on Planco (2007), onboard measurements, VBD (2001) and measurements of the FP6 EU project CREATING.
Vessel
Construction
year of main
engine
CO2 NOX PM HC CO SO2 Source
[kg/kg fuel] [g/kg fuel] [g/kg fuel] [g/kg fuel] [g/kg fuel] [g/kg fuel]
Carpe Diem 2001/2004 3,175 42,5 0,5146 2,3 3 0,02 Planco, 2007
Inflexible 2008 3,175 43,6 0,664 1 1,5 0,02 Planco, 2007
Veerhaven X 2007 3,175 40 0,4 3,8 2,5 0,02 Onboard
measurement
Dunaföldvar 1989 3,175 54 0,83 3,4 6,5 0,02 VBD, 2001
Herso 1 1961 3,175 57 0,83 3,4 6,5 0,02 VBD, 2001
Herso 1,
lower NOX
limit
1961 3,175 40 0,83 3,4 6,5 0,02
VBD, 2001 +
CREATING
measurement

D7.3 Environmental Impact
9/76
Table 2: Emission factors for inland waterway vessels to be used alternatively in the environmental analysis of the MoVe IT! vessels based on TNO (2010), onboard measurements and measurements of the FP6 EU project CREATING.
Vessel
Construction
year of main
engine
CO2 NOX PM10 VOC (HC) CO SO2 Source
[kg/kg fuel] [g/kg fuel] [g/kg fuel] [g/kg fuel] [g/kg fuel] [g/kg fuel]
Carpe Diem 2001/2004 3,173 46 1,38 1,5 7,5 0,02 TNO, 2010
Inflexible 2008 3,173 46 1,38 1,5 7,5 0,02 TNO, 2010
Veerhaven X 2007 3,173 40 0,4 3,8 2,5 0,02 Onboard
measurement
Dunaföldvar 1989 3,173 46 2,116 2,7 11,8 0,02 TNO, 2010
Herso 1 1961 3,173 46 2,116 5,1 19 0,02 TNO, 2010
Herso 1,
lower NOX
limit
1961 3,173 40 2,116 5,1 19 0,02
TNO, 2010 +
CREATING
measurement
In Table 1, the emission factors for inland waterway vessels to be used in the environmental analysis of the MoVe IT! vessels are given. The emission factors are based on Planco (2007), onboard measurements (ThyssenKrupp Veerhaven X), VBD (2001) and NOX measurements carried out onboard a Danube pusher within the FP6 EU project CREATING. The construction year of the engines of the Danube pusher is 1973. The emission factors for the Carpe Diem and the Inflexible are assumed to correspond to a technical optimum in 2006 as it is defined in Planco (2007) for motor cargo vessels and pushers. The emission factors for the Carpe Diem and the Inflexible take into account differences between motor cargo vessels and pushers, as well as the installed power of the respective vessels. In Table 1, the emission factors for particulate matter were corrected for the usage of low sulphur fuel with a maximum sulphur content of 10 ppm. The correction applied accounts for 17 %, corresponding to a reduction of the sulphur content of the fuel from 2000 ppm to 10 ppm. The emission factors for SO2 correspond to the ones of fuel with 10 ppm sulphur content. In Table 2, the emission factors for inland waterway vessels to be used alternatively in the environmental analysis of the MoVe IT! vessels are given. The emission factors are based on TNO (2010). The transfer of the emission factors presented in g/kWh to factors given in g/kg fuel is performed on the basis of the specific fuel consumption and construction year of the engine listed in TNO (2010). For the Veerhaven X, the emission factors derived from onboard measurements are used (see also Table 1). The lower NOX limit for the Herso 1 was obtained from onboard measurements within the FP6 EU project CREATING (see also Table 1). The emission factors of TNO (2010) are officially used in the creation of the emission inventory of the Netherlands. They were used in the impact assessment of measures for reducing emissions of inland navigation on European level (Panteia, 2013), constituting the basis for the analysis of the impact of

D7.3 Environmental Impact
10/76
the MoVe IT! measures on European level, to be described in this report. Therefore, these emission factors are used as alternative to the ones presented in Table 1. It has to be noted that the emission factors for particulate matter derived from TNO (2010) show significant deviations from the ones presented in Table 1. Reasons for the deviations are the great uncertainty associated with particulate matter measurements, as well as the fact that the emission factors in Table 2 are average values over different power classes of engines, including the impact of high particulate matter emissions of engines with much lower power than the one of the engines of the MoVe IT! vessels. The emission factors for particulate matter were corrected for the usage of low sulphur fuel with a maximum sulphur content of 10 ppm. The correction applied accounts for 8.5 %, corresponding to a reduction of the sulphur content of the fuel from 1000 ppm to 10 ppm. The total yearly emissions are related to the yearly transport performance given in tkm. The transport performance is defined as average cargo load per voyage multiplied with the total distance sailed with cargo. The emissions are presented in g/tkm, allowing a comparison with other modes of transport. The emission factors for road transport to be used in the environmental comparison of road transport with the MoVe IT! vessels are derived from HBEFA 3.1 (2010), which is considered to provide the most up-to-date information on this issue. The emission factors are presented in g/km. The total emissions, E, are derived from:
E = distanceempty·EFempty + distanceloaded ·EFloaded,
where distanceempty and distanceloaded are the total distances in km travelled without and with cargo. EFempty and EFloaded are the emission factors for an empty and a loaded truck. The emissions referred to tkm, Etkm, are derived from:
Etkm=E
cargo load ·distanceloaded ,
where cargo load is the amount of cargo transported by the truck in t. For all vessel cases, it is assumed that the goods are transported by a 34-40 t truck trailer with a cargo load of 25 t (except Carpe Diem: 19.6 t, and EE standard: 18.4 t). For the Dunaföldvar and the Herso 1, transportation using truck trailers of East European standard (EE) are considered additionally. The truck trailers of EE standard are slightly smaller and belong to the weight class of 28-34 t with a cargo load of 18.4 t. For the Carpe Diem, it is assumed that the 34-40 t truck trailer carries two TEUs with a total mass of 19.6 t according to the ones transported by the Carpe Diem. As the Carpe Diem is sailing always with cargo, it is assumed that the respective truck is also running always with cargo. For all other vessels, it is assumed that heavy goods are transported and the truck trailers are moving with cargo only in the same direction as the respective vessels. For the Dunaföldvar, it is assumed that the truck trailer is transporting iron ore in the upstream direction, and it is moving downstream empty, although the vessel itself is transporting e.g. grain in this direction. A vessel can be used very flexibly. A truck designed for the purpose of transporting e.g. iron ore cannot be used for another purpose, due to its particular design. The emissions and emission factors for road

D7.3 Environmental Impact
11/76
transport are given for EURO III, EURO IV SCR, EURO V SCR and EURO VI trucks. Additionally, for the Herso 1 and the Dunaföldvar, the East European standard (EE) is considered. The emission factors for the Herso 1 and the Dunaföldvar are related to the ones derived for trucks moving on Austrian motorways. The emission factors for the Veerhaven X, the Inflexible and the Carpe Diem are related to the ones derived for trucks moving on German motorways, whereby for the Carpe Diem, emission factors for trucks moving on German urban motorways in saturated traffic situations are additionally considered, as the vessel is being operated in the Rotterdam area where saturated traffic situations are expected. According to the statistics, the most common road transportation unit is the 34-40 t truck trailer of EURO V SCR standard, followed by EURO III. For simplicity, it is assumed that the trucks are travelling the same distances as the vessels, which in reality can be different as the routes are different.

D7.3 Environmental Impact
12/76
Table 3: Emission factors for road transport to be used in the environmental comparison of road transport with the MoVe IT! vessels based on HBEFA 3.1 (2010).
D7.3 Environmental Impact
13/76
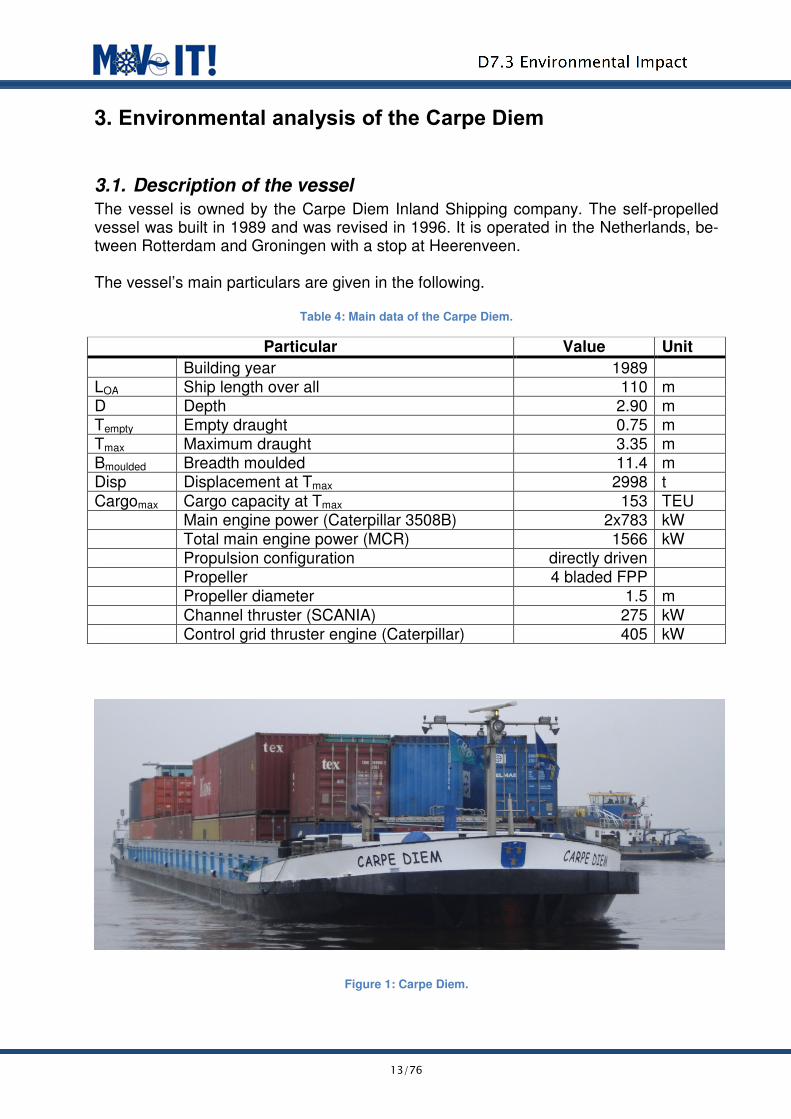
3. Environmental analysis of the Carpe Diem
3.1. Description of the vessel
The vessel is owned by the Carpe Diem Inland Shipping company. The self-propelled vessel was built in 1989 and was revised in 1996. It is operated in the Netherlands, be-tween Rotterdam and Groningen with a stop at Heerenveen. The vessel’s main particulars are given in the following.
Table 4: Main data of the Carpe Diem.
Particular Value Unit
Building year 1989 LOA Ship length over all 110 m D Depth 2.90 m Tempty Empty draught 0.75 m Tmax Maximum draught 3.35 m Bmoulded Breadth moulded 11.4 m Disp Displacement at Tmax 2998 t Cargomax Cargo capacity at Tmax 153 TEU Main engine power (Caterpillar 3508B) 2x783 kW Total main engine power (MCR) 1566 kW Propulsion configuration directly driven Propeller 4 bladed FPP Propeller diameter 1.5 m Channel thruster (SCANIA) 275 kW Control grid thruster engine (Caterpillar) 405 kW
Figure 1: Carpe Diem.

D7.3 Environmental Impact
14/76
3.2. Available data and operational conditions
Upon consultation with the operator, data have been collected regarding the operational conditions of the vessel. The table below contains the yearly distance sailed with cargo, the yearly fuel consumption and the amount of cargo transported per voyage. Based on these data, it is possible to determine the relative fuel consumption of the vessel. The vessel carries containers on the Rotterdam-Heerenveen-Groningen route, with a crew of 4-6 persons. The vessel makes three to-and-from voyages in two weeks, making up for a yearly average of 78 round trips. The cargo capacity of the vessel is 156 TEU, but the average load is ca. 80 %, meaning that 124 containers per trip are transported. Calculating with an average mass of 9.8 t per container, the average load is 1215 t. The vessel sails according to a regular schedule: Monday in Rotterdam, arriving Wednesday in Groningen, then back in Rotterdam on Friday and arriving in Groningen the next Monday. The trip from Rotterdam to Heerenveen takes 18 hours and from Heerenveen to Groningen 8 hours. The prime movers of the vessel are two Caterpillar 3508B engines of 783 kW each, and the ship is also equipped with a channel thruster of 275 kW, and a control grid thruster of 405 kW. Due to speed limitations in the Rotterdam-Groningen corridor, the vessel is often operated slow steaming (approximately 8 km/h), and full speed operation is not used. The mass of fuel consumed by the main engines and auxiliary equipment is 303.9 t yearly. The transport performance is 6.2 Mio TEU km. The transport performance–specific fuel consumption is 49.02 g/TEU km. Taking into consideration an average container mass of 9.8 t, the transport performance can be expressed also as 61 Mio tkm per year, while the specific fuel consumption is identified as 5.0 g/tkm.
Table 5: Operational data of the Carpe Diem.
Vessel Carpe Diem
Reference year -
Cargo per voyage [t] 1215,2
Containers per voyage [TEU] 124
Distance sailed with cargo [km] 50000
Transport performance per year [tkm] 60760000
Transport performance per year [TEU km] 6200000
Total amount of fuel consumed per year [l] 364000
Total amount of fuel consumed by main engines per year [l] 301600
Total amount of fuel consumed per year [kg] 303940
Total amount of fuel consumed by main engines per year [kg] 251836
Relative fuel consumption [g/tkm] 5,00
Relative fuel consumption of main engines [g/tkm] 4,14
Relative fuel consumption [g/TEU km] 49,02
Relative fuel consumption of main engines [g/TEU km] 40,62

D7.3 Environmental Impact
15/76
3.3. Description of technological improvements
For the Carpe Diem, the following retrofit options were considered by the owner:
• Replacement of the single fishtail rudders with 2 rudder blades per propeller optimised for minimum power requirement
• Shortening of the gondolas • Softening of the fore shoulder
However, in WP2 (Hydrodynamics), softening of the fore shoulder already proved to have very little benefit for this particular ship. Therefore, this option is not considered anymore. The technological improvements of the other two options are discussed in the following sections.
3.3.1. New rudder concept
Rudders have an impact on the required propulsion power of a ship, especially for inland waterway vessels, which sometimes have multiple large rudders. However, the design of rudders as well as research into rudder properties is principally focussed on achieving good manoeuvring characteristics, while little is known about their impact on the ship’s required power. As a result, data on which to base estimates of any improvement is scarce. Furthermore, CFD-calculation methods still have great difficulties to accurately predict the complex flow around the stern of inland waterway vessels in shallow water including an operational propeller. As a result, in order to make an accurate estimate of the benefits of a different rudder configuration, it would be necessary to run model tests with the Carpe Diem and to measure rudder angles during actual operation to translate test results to ‘real life’ cases. Since MoVe IT! has no funding for such measurements and the measurement of rudder angles during normal operation was not part of the trials performed, a cruder estimate was done in the task 7.1. This estimate used the outcomes of several tests performed at MARIN on a similar reference ship as well as a report on full scale performance from a magazine. The 7.1 report stated that the replacement of rudders can probably result in a 3.5 - 4 % fuel consumption reduction. However, it has an effect on the manoeuvrability of the vessel that cannot be predicted within the MoVe IT! framework. Regarding the environmental impacts, the emissions can be lower proportionally to this fuel consumption reduction. Since the cargo carrying capacity is not affected, the relative values are changing accordingly with reduction in fuel consumption.
3.3.2. Shortening of gondolas
In WP2 (Hydrodynamics), it was investigated that shortening the gondolas significantly reduces their frictional resistance. It does, however, lead to a larger area of flow separation. All in all, the calculations from WP2 show a reduction in required thrust of 12 %, which is quite significant. The report however also states that this benefit will not actually be reached due to an increase in wake fraction and an unknown change in open water efficiency. Furthermore, the calculations did not include the effect of a longer exposed propeller shaft and the support struts that are required to support the propeller once the gondolas have been shortened. Their negative impact is expected to be significant. As a result,

D7.3 Environmental Impact
16/76
the exact reduction of required propulsion power is unknown but expected to be in the range of 0 to 3 %. This option has also an effect on the power demand and hence on the fuel consumption. As emissions depend on fuel consumption, it can be stated that the change in all kind of emissions is proportional to that. A summary of the retrofit option effects is given in the next table.
Table 6: Retrofit options of the vessel Carpe Diem and their effects.
Carpe Diem Retrofit option Change in fuel
consumption
Change in cargo
carrying capacity
Softening of the fore shoulder
1 2-rudder solution 3-4 % reduction
2 Removal/shortening of gondola 0-3 % reduction
3.4. Assessment of emissions
The assessment was carried out according to the methodology presented in Chapter 2. In the next tables the results are summarised. The annual fuel consumption of the retrofitted vessel is calculated then using the values of fuel consumption change indicated in the previous sub-chapter.
Table 7: Annual fuel consumption and transport performance of the Carpe Diem.
Retrofit option
Annual fuel consumption
Annual total fuel consumption
Annual transport
performance
Total amount of fuel consumed
per tkm
main engine [kg]
aux. engine [kg] [kg/year] [%] [tkm/year] [g/tkm] [%]
Without retrofitting 251 836,0 52 104,0 303 940 100,00 60 760 000 5,002 100,0
Option No.1 2 rudder solution 243 021,7 52 104,0 295 125 97,10 60 760 000 4,857 97,1
Option No. 2 Redesign gondola 248 058,5 52 104,0 300 162 98,76 60 760 000 4,940 98,7
Next, the emissions are calculated for one operational year, for each option. In the following tables, both absolute and relative-to-tkm values are provided. For a better overview, graphs are also plotted for every retrofitting option.

D7.3 Environmental Impact
17/76
Table 8: Annual emissions of the Carpe Diem in kg.
Retrofit option Calculation
source
CO2 NOX PM HC CO SO2
[kg/year] [kg/year] [kg/year] [kg/year] [kg/year] [kg/year]
Without retrofitting Planco, 2007 965 010 12 917 156 699 912 6,08
TNO report, 2010 964 402 13 981 419 456 2 280 6,08
Option No.1 2 rudder solution
Planco, 2007 937 024 12 543 152 679 885 5,90
TNO report, 2010 936 434 13 576 407 443 2 213 5,90
Option No. 2 Redesign gondola
Planco, 2007 953 016 12 757 154 690 900 6,00
TNO report, 2010 952 415 13 807 414 450 2 251 6,00
Figure 2: Annual emissions of the Carpe Diem.
0
200
400
600
800
1000
1200
1400
CO2
[1000kg/year]
NOX
[10kg/year]
PM
[kg/year]
HC
[kg/year]
CO
[10kg/year]
SO2
[10g/year]
Without retrofitting
acc. to Planco, 2007
Option No.1.
acc. to Planco, 2007
Option No.2.
acc. to Planco, 2007

D7.3 Environmental Impact
18/76
Table 9: Emissions of Carpe Diem retrofit options in g/tkm.
Retrofit option Calculation
source
CO2 NOX PM HC CO SO2 Annual
transport performance
[g/tkm] [g/tkm] [g/tkm] [g/tkm] [g/tkm] [g/tkm] [tkm/year]
Without retrofitting
Planco, 2007 15,882 0,213 0,003 0,012 0,015 0,000100
60 760 000 TNO report,
2010 15,872 0,230 0,007 0,008 0,038 0,000100
Option No.1 2 rudder solution
Planco, 2007 15,422 0,206 0,002 0,011 0,015 0,000097
60 760 000 TNO report,
2010 15,412 0,223 0,007 0,007 0,036 0,000097
Option No. 2 Redesign gondola
Planco, 2007 15,685 0,210 0,003 0,011 0,015 0,000099
60 760 000 TNO report,
2010 15,675 0,227 0,007 0,007 0,037 0,000099
Figure 3: Emissions of Carpe Diem retrofit options in g/tkm.
From the above, one can conclude that, in the case of the Carpe Diem, the indicated retrofit options have minor effects regarding the emissions. As the retrofit options change only the fuel consumption, and they have an influence neither on the emission factors that should be used for the calculation of the options nor on the cargo carrying capacity, it is obvious that the emissions change proportionally with the fuel consumption.
0
0,005
0,01
0,015
0,02
0,025
0,03
CO2
[1000g/tkm]
NOX
[10g/tkm]
PM
[g/10tkm]
HC
[g/tkm]
CO
[g/tkm]
SO2
[g/100tkm]
Without retrofitting
acc. to Planco, 20071
Option No.1.
acc. to Planco, 2007
Option No.2.
acc. to Planco, 2007

D7.3 Environmental Impact
19/76
Finally, the emissions of trucks are given in tabular form. Here, in the case of the Carpe Diem, two approaches are used: trucks transporting goods on motorways, and trucks in urban areas with saturated traffic.
Table 10: Truck emissions in g/tkm by the same travel distance with cargo as the one of the Carpe Diem.
Truck engine standard
Calculation source
CO2 NOX PM HC CO SO2
[g/tkm] [g/tkm] [g/tkm] [g/tkm] [g/tkm] [g/tkm]
EURO III HBEFA 3.1
(2010) motorway
43,387 0,380 0,0073 0,0139 0,060 0,000235
EURO IV SCR 42,457 0,162 0,0009 0,0012 0,072 0,000233
EURO V SCR 42,252 0,101 0,0009 0,0012 0,072 0,000229
EURO VI 42,774 0,018 0,0002 0,0012 0,039 0,000233
EURO III HBEFA 3.1 (2010)
Urban, city, motorw., saturated
traffic
43,338 0,407 0,0078 0,0148 0,084 0,000233
EURO IV SCR 42,366 0,189 0,0015 0,0013 0,087 0,000231 EURO V SCR 42,292 0,124 0,0015 0,0013 0,088 0,000231
EURO VI 42,614 0,016 0,0002 0,0012 0,044 0,000231
The emissions of the Carpe Diem, including the retrofit solutions considered, are compared with the ones resulting from road transport in the following figures. For road transport, different emission standards and traffic situations are taken into account.
Figure 4: Comparison of Carpe Diem emissions with different truck emissions (truck only on motorway).
0
0,01
0,02
0,03
0,04
0,05
0,06
0,07
0,08
CO2
[1000g/tkm]
NOX
[10g/tkm]
PM
[g/10tkm]
HC
[g/tkm]
CO
[g/tkm]
SO2
[g/100tkm]
Without retrofitting
acc. to Planco, 20071
Option No.1.
acc. to Planco, 2007
Option No.2.
acc. to Planco, 2007
EURO III
acc. to HBEFA 3.1 motorway
EURO IV SCR
acc. to HBEFA 3.1 motorway
EURO V SCR
acc. to HBEFA 3.1 motorway
EURO VI
acc. to HBEFA 3.1 motorway

D7.3 Environmental Impact
20/76
Figure 5: Comparison of Carpe Diem emissions with different truck emissions (truck on saturated traffic).
From the figures, it can be seen that the emissions of the Carpe Diem (with and without retrofitting) are lower than the ones of EURO III trucks, and in the case of CO2, CO and SO2 emissions IWT performs better than any of the trucks. The reason for this is that the relative fuel consumption of the vessel is always lower than the one of trucks and, hence, in case of those emissions that depend on nothing else but the amount and type of fuel consumed, this advantage can be maintained. Regarding NOX, PM and HC, the truck engines of higher standard than EURO III, equipped with special devices for emission reduction e.g. SCR, perform better than the vessel engines, being not equipped with such devices.
0
0,01
0,02
0,03
0,04
0,05
0,06
0,07
0,08
0,09
0,1
CO2
[1000g/tkm]
NOX
[10g/tkm]
PM
[g/10tkm]
HC
[g/tkm]
CO
[g/tkm]
SO2
[g/100tkm]
Without retrofitting
acc. to Planco, 20071
Option No.1.
acc. to Planco, 2007
Option No.2.
acc. to Planco, 2007
EURO III
acc. to HBEFA 3.1 urban, city, motorway area
EURO IV SCR
acc. to HBEFA 3.1 urban, city, motorway area
EURO V SCR
acc. to HBEFA 3.1 urban, city, motorway area
EURO VI
acc. to HBEFA 3.1 urban, city, motorway area

D7.3 Environmental Impact
21/76
4. Environmental analysis of the Dunaföldvar
4.1. Description of the vessel
The pusher Dunaföldvar is shown in Figure 6. The vessel was built in 1989, in the Óbuda Shipyard of Ganz – Danubius Ship & Crane Factory, in Hungary as a G02-type pusher for Lower-Danube navigation conditions. Vessels of the G02 type can push a convoy configuration of up to 12 lighters. The vessel is equipped with a three-screw propulsion configuration, with nozzles and with flanking rudders for better manoeuvrability.
Figure 6: Pusher Dunaföldvar.

D7.3 Environmental Impact
22/76
The main particulars of the Dunaföldvar are shown in the table below.
Table 11: Main particulars of the Dunaföldvar.
Particular Value Unit
Building year 1989 LOA Ship length over all 37.20 m LWL Length of waterline 36.30 m D Depth 3.20 m Tempty Empty draught 1.70 m Tmax Maximum draught 2.10 m Bmoulded Breadth moulded 12.20 m
v Speed over ground of the vessel – with 6 lighters fully loaded, upstream
5-6 km/h
Disp. Displacement at Tmax 624.0 t Main engine power(3xSkoda S6 27.5 A2L) 515 kW Total main engine power (MCR) 1545 kW Maximum engine RPM 620 1/min Propulsion configuration Gearbox Gearbox type VSR 10B - Gearbox reduction ratio 1:1.96 - Number of propellers 3 - Propeller 5 bladed FPP Propeller diameter 1.725 m Auxiliary engines (2xIFA) 2x70 kW Emergency Auxiliary engine 35 kW The auxiliary system of the G02 type contains two identical main generator sets, both have 70 kW power, and an emergency generator which has 35 kW power.
4.2. Available data and operational conditions
Upon consultation with the operator, data have been collected regarding the operational conditions of the vessel. The table below contains the yearly distance sailed with cargo, the yearly fuel consumption and the amount of cargo transported per voyage. Based on these data, it is possible to determine the relative fuel consumption of the vessel. The pusher sails typically between Izmail, Ukraine, and Budapest, Hungary, with six lighters carrying cargo in both directions. The typical cargoes transported are iron ore and grain. With a crew of 7 persons, the vessel makes one voyage a month. Typically, the vessel is operated at the highest possible velocity. When sailing on the river Danube downstream, the maximum velocity over ground of the convoy is around 15 km/h, while the upstream velocity over ground is around 5-6 km/h. A downstream trip takes approx. 7 days (including waiting times), while an upstream trip takes about 14 days. Between Budapest and Izmail, there is one possible intermediate stop in Serbia. The lighters have a cargo capacity of 1800 t each, that makes up for a total cargo capacity of 10 800 t.

D7.3 Environmental Impact
23/76
The prime movers of the vessel are three diesel engines of type Skoda S6 27.5 A2L, with output power of 515 kW each. The main engines were built in 1989. The latest revision of the engines was in 2011. The pusher has no bow thrusters. The main engines are not fitted with any emission reduction technology. The remaining economic lifetime of the ship and the equipment is estimated to be 20 years. The mass of fuel consumed by the main engines and auxiliary equipment is ca. 1330 t yearly. Other important data is presented in the following table.
Table 12: Operational data of the Dunaföldvar.
Vessel Dunaföldvar
Reference year
2010
Cargo per voyage [t] 7700
Distance sailed with cargo [km] 34000
Transport performance per year [tkm] 261800000
Total amount of fuel consumed per year [l] 1597540
Total amount of fuel consumed by main engines per year [l] 1540600
Total amount of fuel consumed per year [kg] 1333946
Total amount of fuel consumed by main engines per year [kg] 1286401
Relative fuel consumption [g/tkm] 5,10
Relative fuel consumption of main engines [g/tkm] 4,91
4.3. Description of technological improvements
For the Dunaföldvar, the following retrofit options were considered by the owner:
• Use of shaft generator • Improvement of propellers, nozzles and rudders. Elimination of the need for
flanking rudders • Reduction of drag from the bow thruster gondola
The second option was simplified to consideration of flanking rudders removal and bow thruster installation. The third option was replaced by consideration of new engines as the investigation of the operational profiles carried out in WP4 (Power) revealed a very high potential in reduction of the fuel consumption by installation of new engines and gearboxes. The shaft generator installation option was investigated, but no reasonable retrofitting solution was found.
4.3.1. Removal of flanking rudders and installation of bow thruster
The vessel Dunaföldvar has a special rudder system for manoeuvring, both in forward and backward direction. The original flanking rudder system is used when side forces are needed and the propellers provide astern thrust. In D2.1 CFD CALCULATIONS, Deliverable: 2.1 of the MoVe IT! project, a 3 % thrust reduction was calculated for the optimal setting of flanking rudders. Alteration from the optimal setting obviously causes more thrust reduction. Moreover, “the end plates of the flanking rudders are not aligned

D7.3 Environmental Impact
24/76
with the flow and therefore generate vortices that are ingested by the thrusters. These probably cause extra cavitation and vibrations of the propeller.” Due to these effects and the rather uncertain aligning procedure, the expert group including the vessel operator has decided to investigate the removal of the flanking rudders from the vessel. As the ship still has to comply with the requirement regarding astern manoeuvring, removing the flanking rudders has to be combined with an alternative device for creation of side forces, e.g. a bow thruster. The first step of the flanking rudder removal process is: the vessel has to be taken out of water. As the removal has to be combined with an installation of a bow thruster, a practical way to do this is to use either a slipway or a dry dock. Before the vessel is re-launched, the holes on the bottom structure have to be patched by a plate with a thickness equal to that of the bottom plates. This work is estimated to take approximately several days. Because of that, the work is to be done in parallel with the bow thruster installation. Therefore, no extra docking time is needed since the installation of the thruster takes much more time. The removal of the flanking rudders causes the lack of astern manoeuvrability of the vessel/convoy. Safety and certification issues invoked the installation of for example the bow thruster. The bow thruster installation on inland pushers can be considered as most widely used solution for improving backward manoeuvrability. Due to the inclined bow of most pushers, both thruster types can be used only with an additional structure (bow thruster gondola). As it was mentioned before, a channel thruster sucks water from beneath. As in shallow waters this can cause inefficient operation, for the Dunaföldvar, a tunnel thruster with a gondola has been used. The power demand derived from experience is in accordance with the maximum tunnel diameter. For operating the thruster, high speed diesel engines with the appropriate power can be selected. Various types are available on the market. In accordance with the operator’s preferences a SCANIA DC13 071A was chosen with direct mechanical drive. The fuel consumption of the vessel can be lower due to the positive effect of the flanking rudders removal. In the previously quoted report of MARIN, Delivery of WP2 of the MoVe IT! project, an increase of forward thrust of 3 % as a minimum can be obtained. According to the experts this can be translated to an average 5-7 % reduction of yearly fuel consumption. On the other hand, the newly installed bow thruster also consumes fuel, however, the amount of this is reported by the ship operator as negligible compared to the total. The gondola can increase the resistance, the power demand and, therefore, the fuel consumption only in cases when the pusher sails alone. According to the operator, this formation is very rare, so the negative effect can be neglected as well.
4.3.2. Replacement of propulsion engines
The evaluation of the operational profile of the vessel showed that the specific fuel consumption of the main engines is above 300 g/kWh in general (instead of a modern engine, which has around 200-220 g/kWh). During operation, over-loading of the engines are common, this is clearly seen in the WP4 report (Schweighofer and Vidic, 2013). As a result, the investigation of installing new engines was decided. According to the operator’s wish, the power of the vessel was increased from 3x515 kW to 3x750 kW, because the ship operator stated that in the case of new engines it is intended to increase the cargo carrying capacity, too.

D7.3 Environmental Impact
25/76
The replacement of the engines has an effect on a variety of systems of the ship. Generally, an engine replacement (with effect on drive train) may require modifications to the structure, machinery, auxiliary and other systems. As a result, an engine room rearrangement may be needed as well. Due to this, the weight distribution may also change, and, hence, flotation and stability has to be checked. It can be seen that important parts of the drive train are to be modified due to the engine change. All this may cause vibration, which is, therefore, to be examined. In the case of the Dunaföldvar, the engine replacement is not feasible without the complete rebuild of the electrical system. The engines to be installed require special maintenance equipment and training of the crew. For example specific maintenance service could be changed. This could lead to a maintenance cost change, e.g. an increase, while the crew could be less experienced on maintaining the engine systems. The fuel system reconstruction is inevitable; in spite of the lower specific fuel consumption, due to the higher power, the 750 kW engines’ total fuel consumption is supposed to be a bit higher at the design condition. Cooling of the engines, piping and pumps would also be altered, even if some piping elements can be left, depending on the actual conditions (corrosion). However, taking the future maintenance demand into consideration, it is practical to change all of the old pipes. The engine replacement and power increase have an effect on the ventilation of the engine room as well. The exhaust system and the engine room cooling system should be revised. A heat exchanger is used in the vessel, built in the exhaust pipe system. After engine replacement a new heat exchanger – possibly with higher power – can also be installed to take over the role of the boiler while the engines are running. Moreover, not only engine but typical conditions of the vessel, e.g. vessel speed and/or at least loading (resistance) are also expected to be altered as nine barges are to be used instead of six. Due to these effects, when replacing the engines, the whole propulsion system including propellers and nozzles have to be optimized in order to match the operational characteristics of the new engines and the new operational conditions. The increased cargo carrying capacity results in a higher resistance, higher propeller power demand at the speed on which the measurements were made and the operational profile was derived. Assuming that this higher power can be delivered by the new engines at the nominal working point of the engine and that the operational profile of the vessel measured in WP4 is valid for the vessel with new engines too, a 44 % increase in power can be considered. Combining this with the 30 % lower specific fuel consumption means that the absolute yearly fuel consumption would remain the same (1.44 x 0.7 = 1.01). In this theoretical case, the real gain is on the pushing capacity, which can be increased from six lighters to 9 lighters as it was requested by the operator. This means that approximately 50 % more cargo can be transported with nearly the same amount of fuel, and this results in a lower fuel consumption relative to tkm. However, the economy of the business case can be greatly influenced by the factors relating to the technical modifications and maintenance demand mentioned earlier. This has to be taken into account when examining the results of the economic assessment.
D7.3 Environmental Impact
26/76
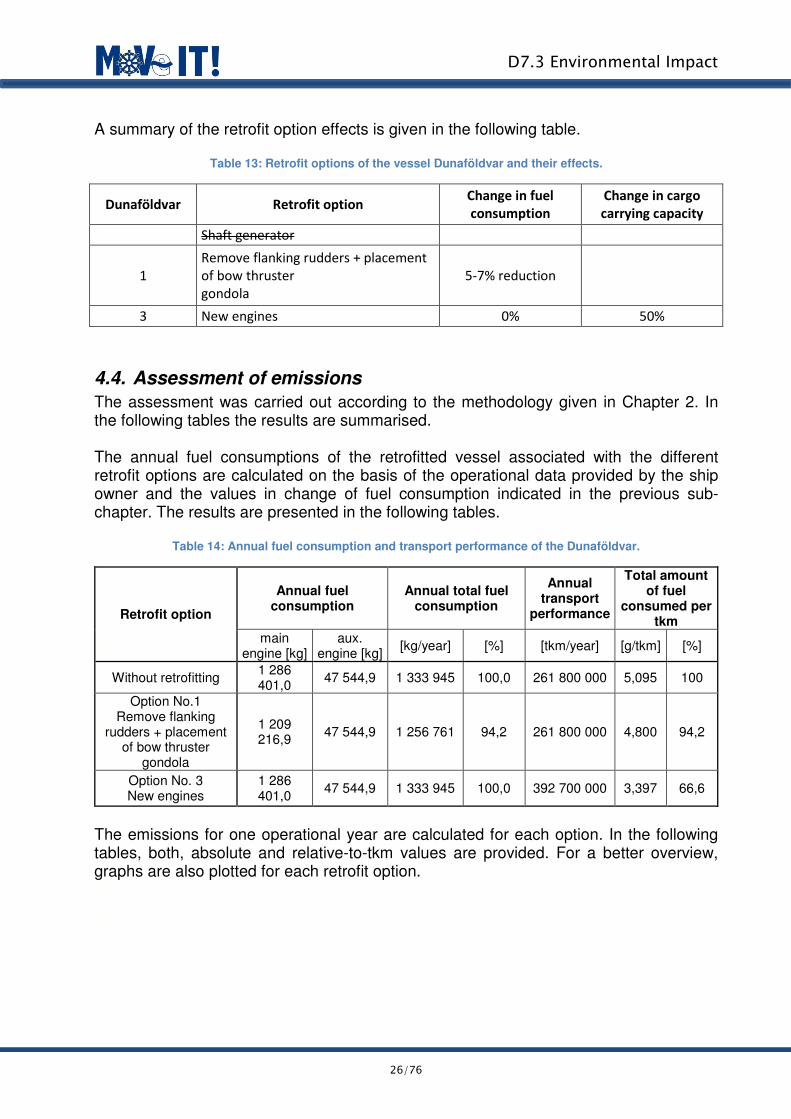
A summary of the retrofit option effects is given in the following table.
Table 13: Retrofit options of the vessel Dunaföldvar and their effects.
Dunaföldvar Retrofit option Change in fuel
consumption
Change in cargo
carrying capacity
Shaft generator
1
Remove flanking rudders + placement
of bow thruster
gondola
5-7% reduction
3 New engines 0% 50%
4.4. Assessment of emissions
The assessment was carried out according to the methodology given in Chapter 2. In the following tables the results are summarised. The annual fuel consumptions of the retrofitted vessel associated with the different retrofit options are calculated on the basis of the operational data provided by the ship owner and the values in change of fuel consumption indicated in the previous sub-chapter. The results are presented in the following tables.
Table 14: Annual fuel consumption and transport performance of the Dunaföldvar.
Retrofit option
Annual fuel consumption
Annual total fuel consumption
Annual transport
performance
Total amount of fuel
consumed per tkm
main engine [kg]
aux. engine [kg] [kg/year] [%] [tkm/year] [g/tkm] [%]
Without retrofitting 1 286 401,0 47 544,9 1 333 945 100,0 261 800 000 5,095 100
Option No.1 Remove flanking
rudders + placement of bow thruster
gondola
1 209 216,9 47 544,9 1 256 761 94,2 261 800 000 4,800 94,2
Option No. 3 New engines
1 286 401,0 47 544,9 1 333 945 100,0 392 700 000 3,397 66,6
The emissions for one operational year are calculated for each option. In the following tables, both, absolute and relative-to-tkm values are provided. For a better overview, graphs are also plotted for each retrofit option.

D7.3 Environmental Impact
27/76
Table 15: Annual emissions of the Dunaföldvar in kg.
Retrofit option Calculation
source
CO2 NOX PM HC CO SO2
[kg/year] [kg/year] [kg/year] [kg/year] [kg/year] [kg/year]
Without retrofitting
VBD study, 2001 4 235 278 72 033 1 107 4 535 8 671 26,68
TNO report, 2010 4 232 610 61 362 2 823 3 602 15 741 26,68
Option No.1 Remove flanking
rudders + placement of bow thruster
gondola
VBD study, 2001 3 990 219 67 865 1 043 4 273 8 169 25,14
TNO report, 2010
3 987 705 57 811 2 659 3 393 14 830 25,14
Option No. 21 New engines
CCNR 2 engine + VBD study 4 232 705 39 897 941 4 550 9 506 26,68
CCNR 2 engine + TNO report 4 232 610 39 517 1 002 4 517 9 758 26,68
Figure 7: Annual absolute emissions of the Dunaföldvar per year.
1 The emissions of the main engines are based on measured emission factors of an existing
CCNR II engine. The emissions of the auxiliary engines are estimated using either the emission
factors of the VBD study, 2001 or the TNO report, 2010.
0
500
1000
1500
2000
2500
3000
3500
4000
4500
5000
5500
6000
6500
7000
7500
CO2
[1000kg/year]
NOX
[10kg/year]
PM
[kg/year]
HC
[kg/year]
CO
[10kg/year]
SO2
[10g/year]
Without retrofitting
acc. to VBD study, 2001
Option No.1.
acc. to VBD study, 2001
Option No.2.
acc. to CCNR2
engine+VBD study

D7.3 Environmental Impact
28/76
Table 16: Emissions in g/tkm associated with the Dunaföldvar retrofit options.
Retrofit option Calculation
source
CO2 NOX PM HC CO SO2 Annual
transport performance
[g/tkm] [g/tkm] [g/tkm] [g/tkm] [g/tkm] [g/tkm] [tkm/year]
Without retrofitting VBD study, 2001 16,178 0,275 0,004 0,017 0,033 0,000102
261 800 000 TNO report, 2010 16,167 0,234 0,011 0,014 0,060 0,000102
Option No.1 Remove flanking
rudders + placement of bow thruster gondola
VBD study, 2001 15,241 0,259 0,004 0,016 0,031 0,000096
261 800 000 TNO report, 2010 15,232 0,221 0,010 0,013 0,057 0,000096
Option No. 2 New engines
CCNR 2 engine + VBD study 10,778 0,102 0,002 0,012 0,024 0,000068
392 700 000 CCNR 2 engine
+ TNO report 10,778 0,101 0,003 0,012 0,025 0,000068
Figure 8: Emissions in g/tkm associated with the Dunaföldvar retrofit options.
From the above, one can conclude that in the case of the Dunaföldvar, the indicated retrofit options have obvious effects regarding the emissions. The first retrofit option changes only the fuel consumption and has an influence neither on the emission factors that should be used for the calculation nor on the cargo carrying capacity. As a result, the emissions change proportionally with the fuel consumption. Contrary, the option No. 2 has both above mentioned effects: the new engines comply with CCNR 2 regulations and have lower emission factors (which were taken from test-bed measurement reports
0
0,0025
0,005
0,0075
0,01
0,0125
0,015
0,0175
0,02
0,0225
0,025
0,0275
0,03
CO2
[1000g/tkm]
NOX
[10g/tkm]
PM
[g/tkm]
HC
[g/tkm]
CO
[10g/tkm]
SO2
[g/100tkm]
Without retrofitting
acc. to VBD study, 2001
Option No.1.
acc. to VBD study, 2001
Option No.2.
acc. to CCNR2
engine+VBD study

D7.3 Environmental Impact
29/76
issued for the engine to be installed), and since cargo carrying capacity is increased, the performance-specific emissions are further improved. The positive effect is given for all emission types. Finally, the relative-to-tkm emissions of trucks are given in tabular form.
Table 17: Truck emission in g/tkm by the same travel distance upstream with cargo as the Dunaföldvar.
Truck engine standard
Calculation source
CO2 NOX PM HC CO SO2
[g/tkm] [g/tkm] [g/tkm] [g/tkm] [g/tkm] [g/tkm]
EURO III
HBEFA 3.1 (2010)
motorway
60,944 0,548 0,0118 0,0222 0,114 0,000420
EURO IV SCR 58,868 0,275 0,0017 0,0018 0,114 0,000408
EURO V SCR 58,672 0,182 0,0017 0,0018 0,115 0,000408
EURO VI 59,400 0,030 0,0003 0,0018 0,060 0,000408
EE standard 81,571 1,437 0,0616 0,1309 0,234 0,000560
The emissions of the Dunaföldvar, including the retrofit solutions considered, are compared with the ones resulting from road transport in the following figures. For road transport, different emission standards are taken into account.
Figure 9: Comparison of Dunaföldvar emissions with different truck emissions.
0
0,01
0,02
0,03
0,04
0,05
0,06
0,07
0,08
0,09
0,1
0,11
0,12
0,13
0,14
0,15
CO2
[1000g/tkm]
NOX
[10g/tkm]
PM
[g/tkm]
HC
[g/tkm]
CO
[10g/tkm]
SO2
[g/100tkm]
Without retrofitting
acc. to VBD study, 2001
Option No.1.
acc. to VBD study, 2001
Option No.2.
acc. to CCNR2 engine+VBD study
EURO III
acc. to HBEFA 3.1 motorway
EURO IV SCR
acc. to HBEFA 3.1 motorway
EURO V SCR
acc. to HBEFA 3.1 motorway
EURO VI
acc. to HBEFA 3.1 motorway
EE standard
acc. to HBEFA 3.1 motorway

D7.3 Environmental Impact
30/76
From the diagram, it can be seen that the Dunaföldvar solutions give lower emission values than the EURO III and EE standard trucks, and in the case of CO2, CO and SO2 emissions IWT performs better than any of the trucks. The reason for this is, the relative fuel consumption of the vessel is always better than the one of the trucks and, hence, in the case of those emissions that depend on nothing else but the amount and type of fuel consumed, this advantage can be maintained. Regarding NOX, PM and HC emissions. The option No. 2, with the modern CCNR 2 engines can compete with modern EURO V SCR trucks. In the case of HC emissions, it performs only poorer than trucks with EURO V SCR engines. As it was be expected, option No. 1 has only a minor effect on the emissions.

D7.3 Environmental Impact
31/76
5. Environmental analysis of the Herso 1
5.1. Description of the vessel
The inland waterway vessel MV Herso 1 belongs to the fleet of the Hungarian shipping company Plimsoll which is member of the MoVeIT! project. Plimsoll runs a couple of self-propelled dry-bulk cargo vessels mainly in the Danube area. The Herso 1 is a self-propelled vessel of the EUROPE-type (CEMT Class IV), which is based on the so-called Johann Welker ship type. The vessel’s machinery contains one main engine (construction year 1961), two auxiliary engines, and an engine for the bow thruster built in 1989. Both engines use “Diesel EN590” as fuel. The engines neither comply with any emission standard nor have an emission reduction device. One single dry-bulk cargo hold with a length of 57.50 m reaches from the engine-room front bulkhead to the forward hold bulkhead. The hold itself is covered with stackable hatch covers. The cargo carrying capacity amounts to 1382 t. The vessel operates a lighter, “SL Leonie”, which has a capacity of 1427 t at its maximum draught. Regarding the resistance of the convoy, it should be noted that unfortunately the lighter is a bit wider than the vessel itself, this further increases the resistance and the fuel consumption of the convoy.
Figure 10: MV Herso 1 at the Port of Dunaföldvár.

D7.3 Environmental Impact
32/76
Figure 11: MV Herso 1 pushing the lighter SL Leonie.
Table 18: Main particulars of the MV Herso 1.
Particular Value Unit
Building year 1961 LOA Ship length over all 84.95 m LPP Length between perpendiculars 83.50 m LWL Length of waterline 84.50 m D Depth 2.90 m Tempty Empty draught 0.81 m Tmax Maximum draught 2.70 m Bmoulded Breadth moulded 9.5 m v Speed of the vessel – with lighter fully loaded 11 km/h Disp. Displacement at Tmax 1977.5 t LSW Light ship weight 596.0 t Cargomax Cargo capacity at Tmax 1381.5 t Cargo2.5 Cargo capacity at T2.5 m 1185.0 t Cargo2.0 Cargo capacity at T2.0 m 813.0 t Cargo1.6 Cargo capacity at T1.6 m 520.0 t Weight of supplies & outfitting 130.8 t Main engine power (Deutz RBV 8M 545) 780 kW Max. main engine power in trial (MoVe IT!) 920 kW Max. engine RPM in trial (MoVe IT!) 393 1/min Propulsion configuration directly driven Propeller 5 bladed FPP Propeller diameter 1.55 m Auxiliary engines (2xDeutz 912) 2x30 kW Bow thruster engine (DAF 1160) 212 kW

D7.3 Environmental Impact
33/76
Table 19: Main particulars of the lighter SL Leonie.
Particular Value Unit
LOA Ship length over all 70.75 m Bmoulded Breadth moulded 10.44 m Tmax Maximum draught 2.47 m Cargomax Cargo capacity at Tmax 1427 t
5.2. Available data and operational conditions
Upon consultation with the operator, data have been collected regarding the operational conditions of the vessel. The table below contains the yearly distance sailed with cargo, the yearly fuel consumption and the amount of cargo transported per voyage. Based on these data, it is possible to determine the relative fuel consumption of the vessel. The vessel sails typically between Regensburg, Germany, and Constanta, Romania. The home port is Dunaújváros. The cargo transported is typically bulk cargo (mostly agricultural products), in some cases general cargo is also transported. One lighter is attached to the ship in order to provide additional capacity in most of the trips. The total cargo capacity of the convoy is approximately 2800 t. Due to the frequently occurring low water levels on the Danube, the average mass of cargo transported is significantly less than the maximum (approx. 60 %). The crew comprises a master and three engineers/crew members. The prime mover of the vessel is a diesel engine of type Deutz RBV 8M 545 with output power of 780 kW. The engine was built in 1961 and has no emission standard classifications. The last revision was made in 2011. The majority of time, the engine is used at an average revolution speed between 320 and 380 rpm, with the fuel consumption ranging from 130 l/h up to 190 l/h. Fast steaming operation is used only temporarily, for not more than 30 minutes, when sailing upstream at the following places: Austrian – Slovakian border (DEVEN), near the Vienna Airport (East Vienna), Schönbühel an der Donau (near Melk) and Isar (junction between Danube and Isar). Under fast steaming operational conditions, the fuel consumption is 260 l/h. The type of fuel used is EN590. The ship is equipped with a bow thruster of type DAF 1160 with a power of 212 kW. The auxiliary engine that drives the bow thruster was constructed in 1989. The auxiliary engine has no emission standard classification. The bow thruster is used for manoeuvring, sailing in ports and near locks. Neither the main engines nor the auxiliary engines are fitted with emission reduction devices. The remaining economic lifetime of the ship and the equipment is estimated to be 50 years. The average speed of the vessel is 10-12 km/h. A round trip to Regensburg takes 12 days of sailing, while a round trip to Constanta takes 24 days of sailing. Loading and unloading lasts 2 days respectively, and the waiting time is often added to the duration of a trip. The mass of fuel consumed by the main engines and auxiliary equipment is

D7.3 Environmental Impact
34/76
approx. 310 t yearly. The cargo performance is 36.3 Mio tkm. The cargo performance–specific fuel consumption is 8.5 g/tkm.
Table 20: Operational data of the Herso 1.
Vessel Herso 1
Reference year 2012
Cargo per voyage [t] 1939
Distance sailed with cargo [km] 18713
Transport performance per year [tkm] 36284507
Total amount of fuel consumed per year [l] 370295
Total amount of fuel consumed by main engines per year [l] 342935
Total amount of fuel consumed per year [kg] 309196
Total amount of fuel consumed by main engines per year [kg] 286350
Relative fuel consumption [g/tkm] 8,52
Relative fuel consumption of main engines [g/tkm] 7,89
5.3. Description of technological improvements
For the Herso 1, the following retrofit options were considered by the owner:
• Improved propulsion, using the Ship Studio solution • Lengthening by 20 % • Application of ‘trapezes’ for sailing in coupled formation
In Task 7.1, calculations were made to find the effect of the various retrofit options for each vessel. These are summarised in the following table.
Table 21: Retrofit options of the vessel Herso 1 and their effects.
Herso 1 Retrofit option Change in fuel
consumption
Change in cargo
carrying capacity
1 Lengthening 20 % 6-9 % increase 14 % increase
2 Trapezes 7-11 % reduction
3 Ship Studio Solution 10-11 % reduction
In general, it can be stated that the Ship Studio solution and the application of a trapeze have a similar effect, as both reduce the yearly fuel consumption of the vessel. As a result, the emissions will be reduced as well with the same ratio. In Task 7.1, for the Ship Studio solution and the trapeze application, a 10-11 % and 7-11 % reduction were estimated, respectively. Since emissions are calculated on the basis of the fuel consumption and the emission factors (in kg/kg fuel), it is obvious that a 10-11 % and 7-11 % emission reduction can be expected. In the case of lengthening, the situation is a bit more complicated. With lengthening of the vessel not only the annual fuel consumption changes, but also the cargo carrying capacity is increased significantly as well. The change in fuel consumption is an increase by 6-9 %, resulting also in more total emissions. Taking only this into account would mean that this option is not desirable from the environmental point of view.

D7.3 Environmental Impact
35/76
However, due to the increased cargo carrying capacity, the relative values (kg emission/tkm) can be much lower than without retrofitting. This can make this option more favourable and more environmentally-friendly.
5.4. Assessment of emissions
The assessment was carried out according to the methodology given in Chapter 2. In the following tables the results are summarised. The annual fuel consumptions of the retrofitted vessel are calculated on the basis of the operational data, using the values of fuel consumption change indicated in the previous sub-chapter.
Table 22: Annual fuel consumption and transport performance of the Herso 1.
Retrofit option
Annual fuel consumption
Annual total fuel consumption
Annual transport
performance
Total amount of fuel consumed
per tkm
main engine [kg]
aux. engine [kg] [kg/year] [%] [tkm/year] [g/tkm] [%]
Without retrofitting 286 350,7 22 845,6 309 196,3 100,00 36 284 507 8,521 100
Option No.1 Lengthening 20% 297 088,9 22 845,6 319 934,5 103,47 41 383 800 7,731 91
Option No. 2 Trapezes 273 464,9 22 845,6 296 310,5 95,83 36 284 507 8,166 96
Option No. 3 Ship Studio
solution 256 283,9 22 845,6 279 129,5 90,28 36 284 507 7,693 90
The emissions in one operational year are calculated for each option. In the following tables, both absolute and relative-to-tkm values are provided. For a better overview, graphs are also plotted for every retrofit option.
Table 23: Annual emissions of the Herso 1 in kg.
Retrofit option Calculation
source
CO2 NOX PM HC CO SO2
[kg/year] [kg/year] [kg/year] [kg/year] [kg/year] [kg/year]
Without retrofitting
VBD study, 2001 981 698 17 624 257 1 051 2 010 6,18
TNO report, 2010 981 080 14 223 654 1 577 5 875 6,18
Option No.1 Lengthening 20%
VBD study, 2001 1 015 792 17 276 266 1 088 2 080 6,40
TNO report, 2010 1 015 152 14 717 677 864 3 775 6,40
Option No. 2 Trapezes
VBD study, 2001 940 786 16 001 246 1 007 1 926 5,93
TNO report, 2010 940 193 13 630 627 800 3 496 5,93
Option No. 3 Ship Studio
Solution
VBD study, 2001 886 236 15 910 232 949 1 814 5,58
TNO report, 2010 885 678 12 840 591 1 424 5 303 5,58

D7.3 Environmental Impact
36/76
Figure 12: Annual emissions of the Herso 1 in kg.
Table 24: Emissions in g/tkm associated with the Herso 1 retrofit options.
Retrofit option Calculation
source
CO2 NOX PM HC CO SO2 Annual
transport performance
[g/tkm] [g/tkm] [g/tkm] [g/tkm] [g/tkm] [g/tkm] [tkm/year]
Without retrofitting
VBD study, 2001 27,056 0,486 0,007 0,029 0,055 0,000170
36 284 507 TNO report,
2010 27,039 0,392 0,018 0,043 0,162 0,000170
Option No.1 Lengthening
20%
VBD study, 2001 24,546 0,417 0,006 0,026 0,050 0,000155
41 383 800 TNO report,
2010 24,530 0,356 0,016 0,021 0,091 0,000155
Option No. 2 Trapezes
VBD study, 2001 25,928 0,441 0,007 0,028 0,053 0,000163
36 284 507 TNO report,
2010 25,912 0,376 0,017 0,022 0,096 0,000163
Option No. 3 Ship Studio
solution
VBD study, 2001 24,425 0,438 0,006 0,026 0,050 0,000154
36 284 507 TNO report,
2010 24,409 0,354 0,016 0,039 0,146 0,000154
0
200
400
600
800
1000
1200
1400
1600
1800
2000
CO2
[1000kg/year]
NOX
[10kg/year]
PM
[kg/year]
HC
[kg/year]
CO
[10kg/year]
SO2
[10g/year]
Without retrofitting
acc. to VBD study, 2001
Option No.1.
acc. to VBD study, 2001
Option No.2.
acc. to VBD study, 2001
Option No.3.
acc. to VBD study, 2001

D7.3 Environmental Impact
37/76
Figure 13: Emissions in g/tkm associated with the Herso 1 retrofit options.
From the above one can conclude that in spite of the circumstance that the retrofit option No. 1 (lengthening) increases the fuel consumption, its performance-specific emissions are rather good due to the positive influence on the additional cargo carrying capacity. In the case of the other options, the emissions change proportionally with the fuel consumption. Finally, the relative-to-tkm emissions of trucks are given in tabular form.
Table 25: Truck emission in g/tkm by the same travel distance with cargo as the one of the Herso 1.
Truck engine standard
Calculation source
CO2 NOX PM HC CO SO2
[g/tkm] [g/tkm] [g/tkm] [g/tkm] [g/tkm] [g/tkm]
EURO III
HBEFA 3.1 (2010)
motorway
59,136 0,531 0,0114 0,0214 0,110 0,000408
EURO IV SCR 57,187 0,265 0,0017 0,0018 0,110 0,000396
EURO V SCR 56,996 0,175 0,0017 0,0017 0,111 0,000396
EURO VI 57,690 0,029 0,0003 0,0017 0,058 0,000396
EE standard 79,004 1,393 0,0596 0,1257 0,226 0,000542
The emissions of the Herso 1, including the retrofit solutions considered, are compared with the ones resulting from road transport in the following figures. For road transport, different emission standards are taken into account.
00,0025
0,0050,0075
0,010,0125
0,0150,0175
0,020,0225
0,0250,0275
0,030,0325
0,0350,0375
0,040,0425
0,0450,0475
0,050,0525
CO2
[1000g/tkm]
NOX
[10g/tkm]
PM
[g/tkm]
HC
[g/tkm]
CO
[10g/tkm]
SO2
[g/100tkm]
Without retrofitting
acc. to VBD study, 2001Option No.1.
acc. to VBD study, 2001Option No.2.
acc. to VBD study, 2001Option No.3.
acc. to VBD study, 2001

D7.3 Environmental Impact
38/76
Figure 14: Comparison of the Herso 1 emissions with different truck emissions.
From the figure above, it can be seen that the Herso 1 solutions always result in better environmental performance than EURO III and EE standard trucks, and in the case of CO2, CO and SO2 emissions the Herso 1 performs better than any of the trucks. The reason for this is that the relative fuel consumption of the vessel is always lower than the one of the trucks and, hence, in the case of those emissions that depend on nothing else but the amount and type of fuel consumed, this advantage can be maintained. Regarding NOX, PM and HC, unfortunately, no retrofit option results in lower relative emissions than the ones of modern truck engines. Only EE standard truck engines result in higher relative emissions for all emission types considered.
0
0,01
0,02
0,03
0,04
0,05
0,06
0,07
0,08
0,09
0,1
0,11
0,12
0,13
0,14
0,15
CO2
[1000g/tkm]
NOX
[10g/tkm]
PM
[g/tkm]
HC
[g/tkm]
CO
[10g/tkm]
SO2
[g/100tkm]
Without retrofitting
acc. to VBD study, 2001
Option No.1.
acc. to VBD study, 2001
Option No.2.
acc. to VBD study, 2001
Option No.3.
acc. to VBD study, 2001
EURO III
acc. to HBEFA 3.1 motorway
EURO IV SCR
acc. to HBEFA 3.1 motorway
EURO V SCR
acc. to HBEFA 3.1 motorway
EURO VI
acc. to HBEFA 3.1 motorway
EE standard
acc. to HBEFA 3.1 motorway

D7.3 Environmental Impact
39/76
6. Environmental analysis of the Inflexible
6.1. Description of the vessel
The pusher Inflexible is being operated in a container service between Le Havre and Gennevillier. The waterway allows convoys up to 180 m x 12 m limited by the locks. The vessel is able to push 2 lighters, in a row. The vessel has two main engines with 736 kW each and only one auxiliary one with 360 kW. The vessel is equipped with an elevator wheelhouse, and a bow thruster for manoeuvring assistance. Both engines use “Diesel EN590” as fuel. The engines comply with CCNR I standard. The engines do not have any emission reduction devices.
Figure 15: The pusher Inflexible.

D7.3 Environmental Impact
40/76
Table 26: Main data of the Inflexible.
Particular Value Unit
Main maintenance year 2008 LOA Ship length over all 22.20 m D Depth 2.50 m Tempty Empty draught 1.70 m TAIR Air draft 5.40 m Bmoulded Breadth moulded 9.45 m v Speed of the vessel – lighters fully loaded >12 km/h Main engine power(2xBaudoin) 736 kW Total main engine power (MCR) 1472 kW Maximum engine RPM >1400 1/min Propulsion configuration Gearbox Number of propellers 2 - Propeller 5 bladed FPP Propeller diameter 1.850 m Auxiliary engines (1xBaudoin) 360 kW
6.2. Available data and operational conditions
Upon consultation with the operator, data have been collected regarding the operational conditions of the vessel. The table below contains the yearly distance sailed with cargo, the yearly fuel consumption and the amount of cargo transported per voyage. Based on these data, it is possible to determine the relative fuel consumption of the vessel. The pusher sails on the river Seine, between Le Havre and Gennevilliers, near Paris, with two lighters. One possible intermediate stop is in Rouen. Typical cargo types transported are containers, cars, liquid bulk and dry bulk, so practically all types of cargo. With a crew of five persons, the vessel makes one round trip each week. The total cargo capacity is 5000 t. The average cargo load depends on the type of cargo transported: in the case of dry bulk, it varies between 4000 and 5000 t; in the case of liquid bulk, it varies between 4000 and 4500 t; in the case of containers, an average of 280 TEUs per voyage is transported. The vessel sails 130 km a day, a complete round trip is between 600 and 700 km. The schedule of the ship is more or less regular: leaving Le Havre Monday evening, arriving in Paris Wednesday morning, leaving Paris Wednesday evening and arriving in Le Havre Friday morning. Loading/unloading takes six hours. When cars are transported, the ship is not involved in loading/unloading, so the time duration of a trip is reduced – sometimes two round trips a week can be made. The prime movers of the pusher are two diesel engines of 736 kW each. The vessel is equipped with an auxiliary engine of 360 kW. Both main and auxiliary engines were built in 2008. The engines comply with the emission standard CCNR I. The type of fuel used is fuel with maximum sulphur content of 10 ppm. The main and auxiliary engines are always operating together. The pusher is fitted with a bow thruster. The bow thruster is used for manoeuvring only.

D7.3 Environmental Impact
41/76
Neither the main engines nor the auxiliary engines are fitted with emission reduction devices. The remaining economic lifetime of the ship and the equipment is estimated to be 20 years. The most economical operation of the engine is at a rotation speed of 1400 rpm, with an average vessel speed of 12 km/h. Fast steaming is used approximately in 5 % of the time of sailing, slow steaming is used in approx. 15 % of the time of operation. The mass of fuel consumed by the main engines and the auxiliary equipment is approx. 420 t per year.
Table 27: Operational data of the Inflexible.
Vessel Inflexible
Reference year 2012
Cargo per voyage [t] 3500
Distance sailed with cargo [km] 20000
Transport performance per year [tkm] 70000000
Total amount of fuel consumed per year [l] 500000
Total amount of fuel consumed by main engines per year [l] 420000
Total amount of fuel consumed per year [kg] 417500
Total amount of fuel consumed by main engines per year [kg] 350700
Relative fuel consumption [g/tkm] 5,96
Relative fuel consumption of main engines [g/tkm] 5,01
6.3. Description of technological improvements
For the Inflexible, the following retrofit options were considered by the owner:
• Improved power management and application of waste heat recovery • Redesign of the stern, propeller and rudder arrangement • Ship Studio solution for improved propulsion
In the further course of the investigation, the waste heat recovery solution is not considered as the time for return on the investment turned out to be too long.
6.3.1. Ship Studio solution for improved propulsion
In WP2 (Hydrodynamics) of the MoVe IT! project, it was assessed that Ship Studio’s stator system will lead to roughly 14 % reduction in fuel consumption. Since the stern tube of the Inflexible is non-detachable from the hull, it needs to be dismantled. As a result, the system cannot be integrated in a stator that includes the support struts of the existing nozzle. This in turn implies that it is necessary to opt for a more comprehensive and optimized solution. The Pre-swirl is placed in front of the propeller and ensures a more balanced inflow of the water. The propeller is becoming more efficient, due to the balanced inflow of water.

D7.3 Environmental Impact
42/76
Because the water is equally divided between the blades, the propeller needs less energy to move the vessel forward. A second advantage of the Pre-swirl is the elimination of struts and bossings which often cause vibrations on board a vessel. A disadvantage of the system is the difficulty of operating in shallow waters, because the material erosion will increase due to more sediment transportation in shallow water, and the balanced inflow of water is no longer guaranteed. It is expected that the improved propulsion will not lead to any changes in the logistical operations. To install the Ship Studio solution, the vessel needs to stay in a dry-dock, and it is, therefore, unable to operate for a few days.
6.3.2. Redesign of the stern, propeller and rudder arrangement
6.3.2.1. Propeller shaft redesign
The propeller shafts of the Inflexible are kept in place by three struts that are connected to the propeller nozzles. These struts lead to increased resistance as well as a disturbance of the propeller inflow. As a result, it is deemed beneficial to investigate the possibility to remove the lower strut. It is expected that this will reduce fuel consumption by nearly 5 %. However, there is significant concern that the removal of the strut will lead to excessive vibrations which will reduce comfort levels and may be harmful to the ship. In case it is possible to just remove one strut, the modernization can be done quite cheaply. However, according to a shipyard that was interviewed, it is likely that casting of a new strut is required. It may be possible to cut the propeller shaft just aft of the strut, put a bearing in the strut and re-weld the shaft together. Otherwise, the entire propeller shaft might need to be replaced.
6.3.2.2. Rudder rearrangement
Rudders have an impact on the required propulsion power of a ship, especially for inland waterway vessels, which sometimes have multiple large rudders. The replacement of the single rudders by twin rudder arrangements will however require replacement of the entire rudder installation, costing roughly 200 000 – 300 000 EUR and requiring the ship to be out of commission for roughly two weeks, according to an estimate of a Dutch shipyard. There does appear to be sufficient space to install a system with twin rudders. An alternative would be to only replace the rudders themselves by more streamlined ones such as those of the vessel Veerhaven XI. An initial estimate is that this would lead to roughly 2 % reduction in fuel consumption, but at a much lower replacement cost of around 50 000 EUR and probably a much shorter upgrade time. From the above, two options are chosen for further consideration:
• Replace the entire rudders, including steering gear at a cost of around 300 000 EUR, leading to a fuel reduction of 3.5 to 4 %
• Only replace the rudders themselves at a cost of around 50 000 EUR, leading to a saving of 2 % in fuel consumption
However, it is stressed that these are estimates based on limited available data, and they are to be taken with caution.

D7.3 Environmental Impact
43/76
In reality, propeller-rudder interaction has a large effect and manoeuvrability, which also needs to be estimated. It is therefore recommended to perform further research before making a final choice for a new rudder configuration. A summary of the retrofit option effects is given in the following table.
Table 28: Retrofit options of the vessel Inflexible and their effects.
Inflexible Retrofit option Change in fuel
consumption
Change in cargo
carrying capacity
Waste heat recovery
1 Ship Studio solution 13-15 % reduction
2 Redesign of stern, rudders etc. total: 11-13 % reduction
Replacement of the rudders 3-4 % reduction
Removal of strut from
propeller nozzle 5 % reduction
Better propeller design 2 % reduction
Bossing & bow thruster gondola 1,5 % reduction
6.4. Assessment of emissions
The assessment was carried out according to the methodology given in Chapter 2. In the following tables the results are summarised. The annual fuel consumption of the retrofitted vessel is calculated on the basis of the operational data, using the values of fuel consumption change indicated in the previous sub-chapter. The results are presented in the following tables.
Table 29: Annual fuel consumption and transport performance of the Inflexible.
Retrofit option
Annual fuel consumption
Annual total fuel consumption
Annual transport
performance
Total amount of fuel consumed per
tkm
main engine [kg]
aux. engine [kg] [kg/year] [%] [tkm/year] [g/tkm] [%]
Without retrofitting 350 700 66 800 417 500 100,0 70 000 000 5,964 100,0
Option No.1 Ship Studio solution 301 602 66 800 368 402 88,2 70 000 000 5,263 88,2
Option No. 2 Redesign propeller, nozzle, rudders and
bow thruster
308 616 66 800 375 416 89,9 70 000 000 5,363 89,9
The emissions in one operational year are calculated for each option. In the following tables, both absolute and relative-to-tkm values are provided. For a better overview, graphs are also plotted for every retrofit option.

D7.3 Environmental Impact
44/76
Table 30: Annual emissions of the Inflexible in kg.
Retrofit option Calculation
source
CO2 NOX PM HC CO SO2
[kg/year] [kg/year] [kg/year] [kg/year] [kg/year] [kg/year]
Without retrofitting
Planco, 2007 1 325 563 18 203 277 418 626 8,350
TNO report, 2010 1 324 728 19 205 576 626 3 131 8,350
Option No.1 Ship Studio solution
Planco, 2007 1 169 676 16 062 245 368 553 7,368
TNO report, 2010 1 168 940 16 946 508 553 2 763 7,368
Option No. 2 Redesign propeller, nozzle, rudders and
bow thruster
Planco, 2007 1 191 946 16 368 249 375 563 7,508
TNO report, 2010 1 191 195 17 269 518 563 2 816 7,508
Figure 16: Annual emissions of the Inflexible in kg.
0
200
400
600
800
1000
1200
1400
1600
1800
2000
CO2
[1000kg/year]
NOX
[10kg/year]
PM
[kg/year]
HC
[kg/year]
CO
[kg/year]
SO2
[10g/year]
Without retrofitting
acc. to Planco, 2007
Option No.1.
acc. to Planco, 2007
Option No.2.
acc. to Planco, 2007

D7.3 Environmental Impact
45/76
Table 31: Emissions in g/tkm associated with the different Inflexible retrofit options.
Retrofit option Calculation
source
CO2 NOX PM HC CO SO2 Annual
transport performance
[g/tkm] [g/tkm] [g/tkm] [g/tkm] [g/tkm] [g/tkm] [tkm/year]
Without retrofitting
Planco, 2007 18,937 0,260 0,004 0,006 0,009 0,000119
70 000 000 TNO report,
2010 18,925 0,274 0,008 0,009 0,045 0,000119
Option No.1 Ship Studio
solution
Planco, 2007 16,710 0,229 0,003 0,005 0,008 0,000105
70 000 000 TNO report,
2010 16,699 0,242 0,007 0,008 0,039 0,000105
Option No. 2 Redesign
propeller, nozzle, rudders and bow
thruster
Planco, 2007 17,028 0,234 0,004 0,005 0,008 0,000107
70 000 000 TNO report,
2010 17,017 0,247 0,007 0,008 0,040 0,000107
Figure 17: Emissions in g/tkm of the Inflexible retrofit options.
From the above one can conclude that, in the case of the Inflexible, the indicated retrofit options have obvious effects regarding the emissions. As the retrofit options change only the fuel consumption, and they have an influence neither on the emission factors that should be used for the calculation of the options nor on the cargo carrying capacity, it is obvious that the emissions change proportionally with the fuel consumption.
0
0,01
0,02
0,03
0,04
0,05
0,06
0,07
CO2
[1000g/tkm]
NOX
[10g/tkm]
PM
[g/10tkm]
HC
[g/10tkm]
CO
[g/tkm]
SO2
[g/100tkm]
Without retrofitting
acc. to Planco, 2007
Option No.1.
acc. to Planco, 2007
Option No.2.
acc. To Planco, 2007

D7.3 Environmental Impact
46/76
Finally, the relative-to-tkm emissions of trucks are given in tabular form.
Table 32: Truck emission in g/tkm by the same travel distance with cargo as the Inflexible.
Truck engine standard
Calculation source
CO2 NOX PM HC CO SO2
[g/tkm] [g/tkm] [g/tkm] [g/tkm] [g/tkm] [g/tkm]
EURO III HBEFA 3.1
(2010) motorway
60,644 0,526 0,0112 0,0220 0,090 0,000328
EURO IV SCR 58,480 0,248 0,0012 0,0017 0,108 0,000320
EURO V SCR 58,228 0,160 0,0012 0,0017 0,108 0,000316
EURO VI 59,136 0,026 0,0002 0,0018 0,058 0,000320
The emissions of the Inflexible, including the retrofit solutions considered, are compared with the ones resulting from road transport in the following figures. For road transport, different emission standards are taken into account.
Figure 18: Comparison of Inflexible emissions with different truck emissions.
From the diagrams above, it can be seen that the Inflexible solutions give lower values than the ones for EURO III trucks, and in the case of CO2, CO and SO2 emissions the Inflexible performs better than any of the trucks. The reason for this is: the relative fuel consumption of the vessel is always lower than the one of the trucks and, hence, in case
0
0,05
0,1
0,15
0,2
0,25
CO2
[1000g/tkm]
NOX
[10g/tkm]
PM
[g/10tkm]
HC
[g/10tkm]
CO
[g/tkm]
SO2
[g/100tkm]
Without retrofitting
acc. to Planco, 2007
Option No.1.
acc. to Planco, 2007
Option No.2.
acc. To Planco, 2007
EURO III
acc. to HBEFA 3.1 motorway
EURO IV SCR
acc. to HBEFA 3.1 motorway
EURO V SCR
acc. to HBEFA 3.1 motorway
EURO VI
acc. to HBEFA 3.1 motorway

D7.3 Environmental Impact
47/76
of those emissions that depend on nothing else but the amount and type of fuel consumed, this advantage can be maintained. Regarding NOX, PM and HC emissions the modern truck engines equipped with special devices perform better than the vessel engines, having no similar devices. However, the engines of the Inflexible perform very similar to truck engines of EURO IV standard with regard to NOX emissions, but in the case of PM and HC emissions, the emissions are still not equivalent to the ones of trucks complying with standard EURO IV and higher.

D7.3 Environmental Impact
48/76
7. Environmental analysis of the Veerhaven X
7.1. Description of the vessel
The Veerhaven X is a triple screw propeller pusher operating on the Rhine as a part of a liner service to transport iron ore and steel products between Schwelgern (Germany) and Dutch harbours (95 % Rotterdam). One round trip takes between 40 - 42 hours. The vessel is coupled to 4-6 lighters (each with a capacity of 2800 tonnes) with steel wires, and has a powerful auxiliary system which can produce around 300 kVA power to the electrical system. Both engines use “Diesel EN590” as fuel. The engines comply with CCNR I standard, however, the vessel received a Green Award, because the emissions are on CCNR 2 standard level. The CCNR 2 standard is achieved by hydrogen injection. The engines do not have any further emission reduction devices. The vessel has no flanking rudders but it has twin-bow thrusters to improve the manoeuvrability in harbours and restricted waterways. Otherwise, the vessel has a ballast system to reach the minimum air draught under bridges when the water levels require it.
Figure 19: The Veerhaven XI – sister ship of the Veerhaven X.

D7.3 Environmental Impact
49/76
Table 33: Veerhaven X main particulars.
Particular Value Unit
Building year 2007 LOA Ship length over all 39. 98 m LWL Length of waterline 36.30 m D Depth 3.20 m Tmax Maximum draught 1.90 m Bmoulded Breadth moulded 15.00 m Ad Air draught 9.00 m v Speed of the vessel – lighters fully loaded 17 km/h Disp. Displacement at Tmax 1076.6 t Capacity with 4 lighters (4x 76,5x11,45x4) 11200 t Capacity with 6 lighters (6x 76,5x11,45x4) 16800 t Main engine power(3x MAK 8M20) 1360 kW Total main engine power (MCR) 4080 kW Maximum engine RPM 1000 1/min Propulsion configuration Gearbox Number of propellers 3 - Propeller 5 bladed FPP Propeller diameter 2.05 m Auxiliary engines (2xScania) 2x315 kW Harbor generator set 80 kW Bow thruster engine 2x400 kW
7.2. Available data and operational conditions
Upon consultation with the operator, data have been collected regarding the operational conditions of the vessel. The table below contains the yearly distance sailed with cargo, the yearly fuel consumption and the amount of cargo transported per voyage. Based on these data, it is possible to determine the relative fuel consumption of the vessel. The pusher sails in a convoy comprising four or six lighters from Rotterdam, the Netherlands, to Schwelgern, Germany. The characteristic cargo transported by the pusher is iron ore which is transported upstream to Germany. The crew varies from five to seven persons. The amount of cargo carried on board depends on the number of lighters: in the case of a pusher-and-4-lighters convoy, the capacity is 11 200 t and the average load is 9200 t; in the case of a pusher-and-6-lighters convoy, the capacity is 16 800 t and the average load is 13 000 t. A complete round trip takes 500 km, and lasts two days (40-42 hours). Approximately 200 round trips are made by the ship each year, and 80 round trips are made by each lighter. The prime movers of the pusher are three diesel engines of the type MAK 8M20 with an output power of 1360 kW each. The vessel is equipped with four auxiliary engines of 300 kW each (type: Scania). The main and auxiliary engines were built in 2007. The engines comply with the emission standard CCNR I, but the emission levels of the vessel are on CCNR 2 level, achieved by hydrogen injection. The type of fuel used is Diesel EN590 (max. 10 ppm sulphur content).

D7.3 Environmental Impact
50/76
The pusher has two electrically-driven bow thrusters of 400 kW power, each. The bow thrusters are used only when manoeuvring in port. Neither the main engines, nor the auxiliary engines are fitted with emission reduction devices. The remaining economic lifetime of the ship and the equipment is estimated to be 24 years. The speed of the convoy varies depending on the number of lighters and the combination used. Typically, the vessel is operated at the highest possible velocity. When sailing downstream, the maximum velocity of the pushed convoy is 20-22 km/h, while the upstream velocity is 17 km/h. The mass of fuel consumed by the main engines and auxiliary equipment is approx. 3200 t yearly.
Table 34: Operational data of the Veerhaven X.
Vessel Veerhaven X
Reference year 2011/2012
Cargo per voyage [t] 10656
Distance sailed with cargo [km] 46822
Transport performance per year [tkm] 498935232
Total amount of fuel consumed per year [l] 3815526
Total amount of fuel consumed by main engines per year [l] 3624749,7
Total amount of fuel consumed per year [kg] 3185964
Total amount of fuel consumed by main engines per year [kg] 3026666
Relative fuel consumption [g/tkm] 6,39
Relative fuel consumption of main engines [g/tkm] 6,07
7.3. Description of technological improvements
The Veerhaven X is the latest addition to the fleet of ThyssenKrupp Veerhaven. It is the result of many model tests and a lot of experience. Therefore, finding significant improvements is a challenge. However, several potential solutions were identified, namely:
• Improvement of the flow around the bow thruster gondola • Improvement of the rudders and the stern shape • Application of SCR catalysts and PM filters and comparison of these systems
with the performance of a hydrogen injection system
However, after the investigations carried out in Task 7.1, it became clear that the first two options will give no further improvements, therefore, they are not considered here.
7.3.1. Application of SCR catalysts and particulate matter filters
Since inland waterway transport is characterized by vessels which are operated for a long time (30 years or more), it is obvious that reducing the engine emissions implies retrofitting of the engines. Since inland waterway vessels operate on gasoil, the most important emissions for inland waterway vessels are PM and NOX emissions. PM

D7.3 Environmental Impact
51/76
emissions can be abated by the use of filters. However, since filters are bulky and expensive, and they have a short lifespan, they have been discarded preliminarily as a desirable option after some discussion with the ship owner. The reduction of NOX emissions can be achieved using selective catalytic reduction (SCR). Available literature sources are used to analyse the performance of SCR systems with the focus on Veerhaven vessels. The SCR technology is based on the reduction of nitrogen oxides by means of a reductant (typically ammonia, generated from urea) at the surface of a catalyst. For this purpose, the exhaust gas is led through a reactor, containing a sufficiently large number of catalyst blocks for providing the catalyst surface area required. The temperature of the exhaust gas (and hence also the catalyst) is thereby subject to constraints both on the upper side (in order to avoid oxidation of the reductant) and the lower side (for preventing the formation of undesired by-products such as ammonium sulphates, which may subsequently clog and deactivate the catalyst). The latter is not particularly an issue for inland waterway vessels since they operate on gasoil. One of the vital parts of an SCR system is its reactor. One SCR reactor is installed per engine and exhaust gas pipe. The reactor is a steel casing consisting of an inlet and an outlet cone, catalyst layers, a steel structure for supporting the catalyst layers and a soot blowing system. Compressed air connections for soot blowing are installed at each catalyst layer. Pressure and temperature are two main parameters governing the operating conditions and limitations. Regarding the reduction of soot and particulate matter (PM) emissions, particulate filters reduce soot emissions by 90 per cent and more. They are proven technological solutions and they can be combined with SCR devices to meet the CCNR 2 or even CCNR IV standards. In order to show that the Veerhaven X can achieve superior environmental performance compared with a EURO VI truck, PM filters are included in the further investigation. A summary of the retrofit option effects is given in the following table.
Table 35: Retrofit options of the vessel Veerhaven X and their effects.
Veerhaven X Retrofit option Change in fuel
consumption Change in emission factors
Improvement of stern
Reduction of negative effect of
bow thruster gondola
Hydrogen injection
Installation of SCR and PM filters 2% increase 90% reduction in NOx and PM

D7.3 Environmental Impact
52/76
7.4. Assessment of emissions
The assessment was carried out according to the methodology given in Chapter 2. In the following tables the results are summarised. The annual fuel consumption of the retrofitted vessel is calculated on the basis of the operational data, using the values of fuel consumption change indicated in the previous sub-chapter. The results are presented in the following tables.
Table 36: Annual fuel consumption and transport performance of the Veerhaven X.
Retrofit option
Annual fuel consumption
Annual total fuel consumption
Annual transport
performance
Total amount of fuel consumed
per tkm
main engine [kg]
aux. engine [kg] [kg/year] [%] [tkm/year] [g/tkm] [%]
Without retrofitting 3 026 666 159 298 3 185 964 100,0 498 935 232 6,386 100,0 Option No.1
Installation of SCR and PM filter
3 087 199 159 298 3 246 498 101,9 498 935 232 6,507 101,9
The emissions in one operational year are calculated for each option. In the following tables, both absolute and relative-to-tkm values are provided. For a better overview, graphs are also plotted for every retrofit option.
Table 37: Annual emissions of the Veerhaven X in kg.
Retrofit option Calculation
source
CO2 NOX PM HC CO SO2
[kg/year] [kg/year] [kg/year] [kg/year] [kg/year] [kg/year]
Without retrofitting On board measurement 10 115 436 127 439 1 274 12 107 7 965 63,72
Option No.1 Installation of SCR
and PM filter
MoVe IT! WP4 Study
on SCR 10 307 630 12 986 130 12 337 8 116 64,93

D7.3 Environmental Impact
53/76
Figure 20: Annual emissions of the Veerhaven X in kg.
Table 38: Emissions in g/tkm associated with the Veerhaven X retrofit options.
Retrofit option Calculation
source
CO2 NOX PM HC CO SO2 Annual
transport performance
[g/tkm] [g/tkm] [g/tkm] [g/tkm] [g/tkm] [g/tkm] [tkm/year]
Without retrofitting On board measurement 20,274 0,255 0,0026 0,024 0,016 0,000128 498 935 232
Option No.1 Installation of SCR
and PM filter
MoVe IT! WP4 Study
on SCR 20,659 0,026 0,0003 0,025 0,016 0,000130 498 935 232
0
2000
4000
6000
8000
10000
12000
14000
CO2
[1000kg/year]
NOX
[10kg/year]
PM
[100g/year]
HC
[kg/year]
CO
[kg/year]
SO2
[10g/year]
Without retrofitting
acc. to on board
measurement
Option No. 1.
acc. to on board
measurement

D7.3 Environmental Impact
54/76
Figure 21: Emissions in g/tkm associated with the Veerhaven X retrofit options.
As it was expected, due to the slight increase in fuel consumption, the Veerhaven X retrofitted with SCR and PM filters has a bit higher emissions of CO2, HC, CO and SO2. However, due to the SCR and the PM filters, the NOX and PM emissions are significantly reduced.
Finally, the relative-to-tkm emissions of trucks are given in tabular form.
Table 39: Truck emissions in g/tkm by the same travel distance with cargo as the Veerhaven X.
Truck engine standard
Calculation source
CO2 NOX PM HC CO SO2
[g/tkm] [g/tkm] [g/tkm] [g/tkm] [g/tkm] [g/tkm]
EURO III HBEFA 3.1
(2010) motorway
60,644 0,526 0,0112 0,0220 0,090 0,000328
EURO IV SCR 58,480 0,248 0,0012 0,0017 0,108 0,000320
EURO V SCR 58,228 0,160 0,0012 0,0017 0,108 0,000316
EURO VI 59,136 0,026 0,0002 0,0018 0,058 0,000320
The emissions of the Veerhaven X, including the retrofit solutions considered, are compared with the ones resulting from road transport in the following figure. For road transport, different emission standards are taken into account.
0
0,0025
0,005
0,0075
0,01
0,0125
0,015
0,0175
0,02
0,0225
0,025
0,0275
CO2
[1000g/tkm]
NOX
[10g/tkm]
PM
[g/10tkm]
HC
[g/tkm]
CO
[g/tkm]
SO2
[g/100tkm]
Without retrofitting
Option No. 1.

D7.3 Environmental Impact
55/76
Figure 22: Comparison of Veerhaven X emissions with different truck emissions.
From the figure above, it can be seen that the Veerhaven X retrofitted with SCR and PM filters is performing much better than most of the truck types. An exception is observed for the HC emissions. Only EURO VI standard trucks have similar NOX and PM values. With regard to the CO2, CO and SO2 emissions even the vessel without retrofitting is superior to the EURO VI truck. The reason for this is the significantly lower fuel consumption related to tkm.
0
0,02
0,04
0,06
0,08
0,1
0,12
CO2
[1000g/tkm]
NOX
[10g/tkm]
PM
[g/10tkm]
HC
[g/tkm]
CO
[g/tkm]
SO2
[g/100tkm]
Without
retrofitting
Option No. 1.
EURO III
EURO IV SCR
EURO V SCR
EURO VI

D7.3 Environmental Impact
56/76
8. Environmental analysis of the European fleet The environmental analysis of the European fleet is performed using results obtained from the study: Contribution to impact assessment of measures for reducing emissions of inland navigation, which was recently carried out on behalf of the European Commission‘s Directorate-General for Transport (Panteia, 2013). Containing an environmental impact analysis for a number of policy options, the study aims at provision of information to be used in impact assessments (IA) for reducing emissions of inland navigation. The focus is on the main engines for propulsion of inland waterway vessels. Due to their small share of the total fuel consumption and emissions, auxiliary engines are not considered. However, it is noted that, due to installation of bow thrusters with more power since 2003, more research is needed on the effects of auxiliary engines to the emission of air pollutants. The study was carried out by Panteia/NEA, Stichting Projecten Binnenvaart (SPB)/ Expertise- en InnovatieCentrum Binnenvaart (EICB), Planco, via donau and the Central Commission for the Navigation of the Rhine (CCNR), supported by a Common Expert Group comprising Member State authorities, engine and ship manufacturers, engine retrofitting industry, as well as independent experts and representatives of the IWT sector and ports.
8.1. Description of the European fleet
On European level, the actual environmental performance of the European fleet is not exactly known due to the lack of registered comprehensive data on the engine composition and performance of the fleet, as well as the presence of a large variety of operational conditions, having an impact on the emission profiles. In this investigation, the data used is based on the IVR2 database, containing adjustments based on interviews with ship owners and engine manufacturers, consistency checks with fleet registers from the Netherlands, as well as in-depth analyses by Panteia/NEA on the IVR database. These analyses produced the BAU (business-as-usual) scenario for the development of the emission profile of IWT between 2011 and 2050. In Table 40, the characteristics of the IVR database are presented. The analysis to be performed refers to the BAU scenario 2012 for motor vessels, pushers and tugs, excluding passenger vessels. The number of vessels considered is equal to 11 459 vessels. As already mentioned, the emissions of the main engines only are considered. In Table 41, an overview of the fleet considered is given, whereby a distinction is made between vessel dimensions, engine power installed, number of vessels and number of propulsion engines. In Table 42, the emission factors used for the calculation of the CO2, NOX and PM emissions are listed. The emission factors comply widely with the ones of the Dutch Pollutant Release and Transfer Register (TNO, 2010). Minor deviations occur only with respect to the dates in the last three rows. Due to their significance in creating a proper emission regulation, and their
2 International Association for the representation of the mutual interests of the inland shipping
and the insurance and for keeping the register of inland vessels in Europe

D7.3 Environmental Impact
57/76
major contribution to the external costs caused by air pollutants and greenhouse gasses, the investigation is limited only to these three types of emissions.
Table 40: Characteristics of the IVR database.
IVR databaseIVR databaseIVR databaseIVR database NumberNumberNumberNumber
Total number of vessels (all vessels, barges included) 20 884
Motor vessels, push and tug boats and passenger ships
(excluding barges) 14 803
Motor vessels, push and tug boats (excluding passenger vessels) 11 459
Freight motor vessels only (excluding push boats, tug boats and passenger
vessels) 10 136
Size of average propulsion engine in freight vessels 555 kW
Size of average propulsion engine in freight motor vessels only (excluding push
boats, tug boats and passenger vessels) 473 kW
Table 41: Fleet overview in numbers, situation year 2012.
Fleet category by motor vessel
dimensions and/or kW installed Number of vessels Number of propulsion engines
<38.5*5.05m, 365t, 189 kW 3 461 3 535
55*6.6m, 550t, 274 kW 1 235 1 310
70*7.2m, 860t, 363 kW 711 770
67*8.2m, 913t, 447 kW 1 118 1 209
85*8.2m, 1260t, 547 kW 1 260 1 312
85*9.5m, 1540t, 737 kW 1 528 1 697
110m, 2750t, 1178 kW 1 824 2 087
135m, 5600t, 2097 kW 223 412
Push Boat 1000-2000kW (1331 kW) 73 137
Push Boat >2000 kW (3264 kW) 27 73
Total number in Europe 11 459 12 542
Table 42: Emission factors for diesel engines used for inland waterway transport in the Dutch Pollutant Release and Transfer Register (TNO, 2010). The dates in the last three rows are slightly modified in order to comply with Panteia (2013).
Year of construction of main Year of construction of main Year of construction of main Year of construction of main
engineengineengineengine
CO2CO2CO2CO2
[g/kWh][g/kWh][g/kWh][g/kWh] NOXNOXNOXNOX
[g/kWh][g/kWh][g/kWh][g/kWh]
PMPMPMPM
[g/kWh][g/kWh][g/kWh][g/kWh]
<1974 745.6 10.8 0.6
1975-1979 729.8 10.6 0.6
1980-1984 713.9 10.4 0.6
1985-1989 698.1 10.1 0.5
1990-1994 698.1 10.1 0.4
1995-2002 650.5 9.4 0.3
2003-2007 634.6 9.2 0.3
>2007 634.6 6.0 0.2

D7.3 Environmental Impact
58/76
8.2. Assessment of emissions
The assessment of the emissions is based on the outcome of the study: Contribution to impact assessment of measures for reducing emissions of inland navigation (Panteia, 2013). The assumptions and basic input are described in the following.
8.2.1. Scenario definition – assumptions
It is assumed that the total emissions estimated in Panteia (2013) are representative for the entire EU fleet. In reality the values might be little higher as the IVR database does not cover the entire EU fleet. However, the values can be used in order to arrive at conclusions on minimum amounts of emissions and external costs. Due to their significance in the discussion relating to the establishment of more stringent emission regulations as well as their major contribution to the external costs resulting from air pollutants and greenhouse gasses, the investigation is limited to the consideration of CO2, NOX and PM emissions. The yearly total emissions for the three emission types mentioned are taken as basis for the calculation of the reduction in emissions and external costs by the different MoVe IT! measures to be considered. The reference year is 2012.
Within the MoVe IT! project, a great number of different retrofit measures was identified for application to the five MoVe IT! vessels. However, not all measures can be applied to the entire EU fleet. E.g. the trapeze solution can be mainly applied to vessel configurations comprising a motor cargo vessel and a lighter sailing in longitudinal formation. There is no suitable information available how many vessels are sailing in this formation, as well as how often and where they do so, which would involve significant uncertainties. The choice of the measures to be considered on European level is based on the assumption that, in principle, they can be applied to the majority of vessels of the EU fleet. The technologies selected for improved environmental performance are:
• Ship Studio solution • Improved rudders and flow extender • Redesign of the stern, replacement of rudders, improved nozzles and propellers • Selective Catalytic Reduction (SCR) and particulate matter filters (PM filter) • Hydrogen injection • New engines complying with CCNR 2 standard • New engines complying with CCNR 2 standard, combined with SCR and PM
filter
The yearly total emissions of the EU fleet associated with the usage of the technologies listed are obtained by application of the emission reduction potential given in per cent in Table 43 to the total emissions of the EU fleet in 2012. Dedicated emission reduction potentials were derived for each MoVe IT! vessel and technology to be applied to this vessel. The emission reduction potentials are generalized for application to all vessels of the EU fleet, considering the minimum values derived for the MoVe IT! vessels. Apart from the total emissions, the reduction in yearly emissions is presented in tonnes in Table 43 for each technology considered. The average construction year of the engines in service is assumed to be 1981 (Panteia, 2013). With respect to new engines, the CCNR 2 standard is assumed. The differences in the emission factors for engines of 1981 and new engines of CCNR 2 standard (> 2007 in Table 6) are transferred in

D7.3 Environmental Impact
59/76
emission reduction potentials of new engines in per cent (see Table 43), compared to the emissions of engines in service with an average construction year of 1981. The calculation of the external costs resulting from the NOX and PM emissions is based on the respective unit values used by the Marco Polo external cost calculator. The unit values for the NOX emissions are complemented in order to account for biodiversity losses according to NEEDS (2006). The unit values used refer to the price level of the year 2011:
• 12 545 EUR per tonne NOX • 104 291 EUR per tonne PM
The climate change costs are estimated based on a study by Kuik et al. (2009). Through a meta-analysis of 62 studies, the study by Kuik et al. presents the avoidance costs of policies aiming at the long-term stabilisation of greenhouse gases in the atmosphere (2005 value in EUR per tonne CO2). There can be a large bandwidth in the external climate change (avoidance) costs. With regards to a long-term target of 450 ppm CO2 eq. (in order to keep global temperature rise below 2°C) the avoidance cost in 2025 is estimated to be 129 EUR per tonne CO2 (bandwidth: 69 EUR - 241 EUR). For 2050 the central value is estimated to be 225 EUR per tonne CO2 (bandwidth: 128 EUR – 396 EUR). Due to the uncertainties in forecasting long-term climate change costs (e.g. due to changes in oil price and discount rates), the middle was selected. It is generally assumed that climate costs increase over time. Extrapolating the cost values of 2025 and 2050 from Kuik et al. (2009) back to 2011 and adjusting the cost values from price levels in 2005 to levels current in 2011, results in a value of 86.60 EUR per tonne CO2 (price level 2011), which is used in the further analysis. The external costs of the EU fleet caused by the emission of CO2, NOX and PM, as well as the reduction in external costs resulting from the usage of the technologies to be implemented are derived by multiplication of the respective emissions and reduction in emissions in tonnes with the unit values for CO2, NOX and PM.
8.2.2. Emissions and external costs
In Table 43, the emissions, the reduction in emissions and the reduction in external costs per year are presented for the EU fleet considering the different retrofit options of the MoVe IT! project selected. A value with a negative sign indicates a reduction of emissions and external costs, a positive one an increase. All technologies with the exception of SCR and PM filters and hydrogen injection provide a clear benefit in reduction of fuel consumption and CO2 emissions amounting to approximately 10 %. The most efficient measure for reduction of NOX and PM emissions is the application of SCR and PM filters, resulting in an emission reduction of approximately 90 %. However, due to the increased back pressure, an increase of fuel consumption and CO2 emissions amounting to 2 % is the consequence. The greatest impact on the reduction of the overall emissions is achieved by installation of a new engine of CCNR 2 standard in combination with SCR and PM filters. The CO2, NOX and PM emissions are reduced by 8 %, 94 % and 97 % respectively. The installation of a new engine of CCNR 2 standard has also a significant impact on the reduction of the overall emissions. The CO2, NOX and PM emissions are reduced by 10 %, 40 % and 66 % respectively compared with an unregulated engine of 1981 (average construction

D7.3 Environmental Impact
60/76
year of the engines considered in Panteia, 2013, see also Section 8.2.1). In the case the comparison is performed between more recent unregulated engines and engines of CCNR 2 standard, there may be no reduction in CO2 emissions as the specific fuel consumption did not change starting from approximately year 2000, due to the change from fuel-consumption optimised operation to emission-optimised (NOX optimised) operation of engines. The technologies presented in Table 43 have different impacts on the CO2, NOX and PM emissions. Some have a noticeable impact on CO2 emissions, others have a noticeable impact on NOX or PM emissions. Is 10 % reduction in CO2 emissions of greater importance than 90 % reduction in NOX emissions? From the point of view of a ship owner, assuming that there is no incentive or regulative pressure to invest in devices for reduction of NOX emissions, the reduction in fuel consumption and CO2 emissions is most likely of greater importance as the operational costs may be reduced and a part of the investment costs may be recovered. However, from the point of view of the society, the reduction of NOX emissions may be more important. The significance of the different emission types is described by the costs they cause to the society, called external costs. Using the reduction in external costs associated with the application of the different technologies considered, a comparison can be made with respect to the choice of the technology with the greatest impact on the costs to the society. This information can be used also as reference for the evaluation of the order of magnitude of possible incentives to be provided for the implementation of promising technologies. The reduction in external costs per year associated with the implementation of the different MoVe IT! technologies is presented in Table 43, and it is displayed in Fig. 23. The greatest impact is achieved by the application of a new engine of CCNR 2 standard in combination with SCR and PM filters. A similar impact is achieved by the application of only SCR and PM filters to existing engines. The result is a consequence of the extremely high unit prices for the external costs of NOX and PM emissions. In the year 2012, the external costs due to CO2, NOX and PM emissions caused by the EU fleet under consideration are estimated approximately as 2 200 Mio EUR. The application of SCR and PM filters to all existing engines of the EU fleet is estimated to reduce the external costs by approximately 1 500 Mio EUR per year. If a new engine of CCNR 2 standard combined with SCR and PM filter is applied to all vessels, the reduction in external costs due to CO2, NOX and PM emissions will be even more significant. The total reduction of external costs per year due to CO2, NOX and PM emissions is divided by the number of freight vessels amounting to 11 459 vessels. In this way, the average reduction in external costs per year and vessel is obtained in association with the application of the different retrofit technologies. The results are presented in Fig. 24. On average, a reduction of fuel consumption by 10 % results in a reduction of external costs due to CO2, NOX and PM emissions by 20 000 EUR per year. It is stressed that this value is an average value. The real value associated with a particular vessel can deviate significantly from the average. However, assuming an emission level of the year 2012 and around 200 000 EUR investment in technologies decreasing the fuel consumption by 10 %, the benefit to the society will amount to 200 000 EUR on average per vessel within 10 years, justifying the provision of incentives for the implementation of such technologies, if such are to be provided. Certainly, for more exact statements, a proper, more comprehensive cost-benefit analysis has to be carried out, taking into account the development of the emissions and technology, as well as the unit prices of

D7.3 Environmental Impact
61/76
the emissions. The conclusion given here is more of an indicative nature. When considering the technologies with significant impact on the reduction of NOX and PM emissions e.g. SCR and PM filters, the reduction in external costs per year and vessel may amount to approximately 150 000 EUR on average. Again, it is stressed that this value is an average value. The real value associated with a particular vessel can deviate significantly from the average. However, the reduction in the average costs presented is certainly a good indication for the meaningfulness of providing proper incentives to the ship owners for the implementation of technologies with a significant impact on the reduction of NOX and PM emissions, e.g. SCR, PM filters or/and new engines.

D7.3 Environmental Impact
62/76
Table 43: Emissions, reduction in emissions and reduction in external costs per year presented for the EU fleet considering different retrofit options of the MoVe IT! project (a negative sign indicates a reduction of emissions and external costs, a positive one an increase).
Emissions Emissions 2012Ship Studio
solution
Rudders and flow
extender
Redesign of stern,
replacement of
rudders, improved
nozzles and
propellers
SCR + PM filter Hydrogen injection New enginesNew engines + SCR
+ PM filter
[t] [t] [t] [t] [t] [t] [t] [t]
CO2 5119000 4607100 4607100 4607100 5221380 5119000 4607100 4709480
NOX 94350 84915 84915 84915 9435 77838,75 56610 5661
PM 5271 4743,9 4743,9 4743,9 527,1 5271 1792,14 158,13
[%] [%] [%] [%] [%] [%] [%]
CO2 -10 -10 -10 2 0 -10 -8
NOX -10 -10 -10 -90 -17,5 -40 -94
PM -10 -10 -10 -90 0 -66 -97
Emissions 2012
[t] [t] [t] [t] [t] [t] [t] [t]
CO2 5119000 -511900 -511900 -511900 102380 0 -511900 -409520
NOX 94350 -9435 -9435 -9435 -84915 -16511,25 -37740 -88689
PM 5271 -527,1 -527,1 -527,1 -4743,9 0 -3478,86 -5112,87
External costs 2012
[EUR] [EUR] [EUR] [EUR] [EUR] [EUR] [EUR] [EUR]
CO2 443305400 -44330540 -44330540 -44330540 8866108 0 -44330540 -35464432
NOX 1183620750 -118362075 -118362075 -118362075 -1065258675 -207133631 -473448300 -1112603505
PM 549717861 -54971786 -54971786 -54971786 -494746075 0 -362813788 -533226325
Sum 2176644011 -217664401 -217664401 -217664401 -1551138642 -207133631 -880592628 -1681294262
Emissions
Reduction in emissions per year
Reduction in external costs per year
Reduction in emissions

D7.3 Environmental Impact
63/76
Figure 23: Reduction in external costs in million EUR presented for the EU fleet considering different retrofit options of the MoVe IT! project (a negative sign indicates a reduction of emissions and external costs, a positive one an increase, reference year 2012).

D7.3 Environmental Impact
64/76
Figure 24: Average reduction in external costs per year and vessel in thousand EUR presented for different retrofit options of the MoVe IT! project (reference year 2012).

D7.3 Environmental Impact
65/76
9. Summary Backround The MoVe IT! project - Modernisation of Vessels for Inland Waterway Freight Transport, co-funded through the Seventh Framework Programme of the European Union, aims at a modernisation of inland waterway vessels with focus on retrofitting of existing vessels and technology transfer from new buildings and other transport modes. Improving the environmental performance of the vessels considered is one major objective of the project. Therefore, the environmental assessment plays an important role in the evaluation of the technologies developed, with respect to their practical application. Based on consultation with experts and, in particular, the representatives of the ship owners of the project, a number of retrofit solutions regarded as worth to be investigated further with respect to their practical implementation was identified. The solutions are subjected to an environmental assessment, carried out for five vessels, comprising a container vessel, three pushers and a motor cargo vessel being operated together with a lighter. The emissions considered comprise the CO2, NOX, PM, HC, CO and SO2 emissions. The emissions are estimated using the fuel consumption recorded, as well as emission factors related to the mass of fuel. The emissions are presented as yearly values, and values related to the transport performance in tonne kilometres (tkm). The effects of the different technologies to be applied in the vessels are taken into account by the resulting reduction of the fuel consumption or directly by the reduction of the respective emissions in per cent. The emissions referred to tkm are compared with the ones of road transport carried out with trucks complying with emission standards EURO III up to Euro VI, as well as the East European emission standard (EE). On European level, the yearly total emissions of the EU fleet are considered. Due to their significance in the evaluation of the external costs caused by air pollutants and greenhouse gasses, and the current discussion on stricter emission standards for inland waterway transport (IWT), only the CO2, NOX and PM emissions are taken into account. The reduction in the yearly emissions of the EU fleet as well as the associated reduction in the external costs is evaluated. The analysis on European level is based on Panteia (2013), where the impact of a variety of policy options for improving the environmental performance of the EU fleet was analysed, including a comprehensive cost-benefit analysis. The emission factors for IWT can differ significantly, depending on the source used. Exact agreement between the emission factors derived from the different sources used is obtained for the matter-specific emissions CO2 and SO2. Further, good agreement between the sources is obtained for the NOX emissions. The deviations for NOX are limited to approximately 10-15 %. Therefore, the conclusions derived for these emissions can be drawn with good confidence. For the other emissions (PM, CO, HC), the deviations may account for more than 100 %, making it difficult to arrive at quantitatively valid conclusions. One reason for this circumstance is the way how the emission factors were derived. E.g. the emission factors for particulate matter derived from TNO (2010) show significant deviations from the other sources used. Reasons for the deviations may be the great uncertainty associated with particulate matter measurements in general, as well as the fact that the emission factors are average values over different power classes of engines, including the impact of high particulate

D7.3 Environmental Impact
66/76
matter emissions of engines with much lower power than the one of the engines of the MoVe IT! vessels. In Germanischer Lloyd (2001), it was clearly demonstrated that the emission factors of old engines with low power may be three times higher than the ones of high-powered engines. Therefore, for plausible estimation of the emissions of an inland waterway vessel, it is necessary to consider the power class of the vessel, in addition to the construction year and operation (full load, part load) of the engine. In ship-specific cases, the usage of average values can lead to completely different results, and therefore, the usage of average emission factors derived for a fleet has to be critically evaluated to determine whether this is suitable if a certain vessel is to be investigated. However, for considerations performed on a macro level e.g. EU fleet or national fleet, the usage of average emissions factors is state of the art, and it seems to be a valid option as it cannot be expected that for each vessel of e.g. 10 000 vessels the emissions will be exactly estimated and summed up. Generic conclusions for the MoVe IT! vessels The relative fuel consumption of almost all MoVe IT! vessels is outstandingly low. It accounts for approximately 5.5 g/tkm whereby the effect of auxiliary engines and empty trips is included (relative fuel consumption = [fuel consumption with cargo + fuel consumption without cargo]/transport performance in tkm). The respective CO2 emissions amount to approximately 17 g/tkm. These values are based on real-life operational data, and they can provide a valuable contribution to the discussion of the plausibility of the CO2 emissions derived from commonly used emission calculation tools, which in general give higher values for inland waterway vessels. An exception is observed for the Herso 1, caused by the effect of the difficult nautical conditions in the Upper Danube region (limitation of cargo carrying capacity due to limitations in water depth, and high current velocities of the river). The relative fuel consumption is clearly higher, and it accounts for 8.5 g/tkm, which is close to the average value of vessels operating in the Upper Danube region. The comparison of the emissions of the MoVe IT! vessels with the ones resulting from road transport gives a clear superiority of the vessels to the EURO III truck and the very badly performing truck of East European standard for all emission types. The relative CO2 emissions and SO2 emissions of the vessels in g/tkm are between 25 and 50 % of the ones of the trucks considered, including EURO VI trucks complying with the most stringent emission standard for trucks. With respect to the relative NOX emissions, all vessels except the Herso 1 perform on a similar level as the EURO IV SCR truck (equipped with SCR). With respect to relative PM emissions, the trucks complying with emission standard EURO IV SCR or higher are superior to the vessels considered. Using the statistics of the HBEFA 3.1 (2010), it can be concluded that currently the majority of trucks complies with the EURO V SCR standard, followed by trucks complying with the EURO III standard.

D7.3 Environmental Impact
67/76
Table 44: Summary of the impact of the MoVe IT! technologies on the emissions of the vessels considered, including a comparison with EURO V SCR and EURO VI trucks operating on motorways.
Transport mode Emissions
CO2 NOX PM HC CO SO2
[g/tkm] [g/tkm] [g/tkm] [g/tkm] [g/tkm] [g/tkm]
Carpe Diem
Without retrofit 15,88 0,213 0,003 0,012 0,015 0,0001
2 rudder solution 15,42 0,206 0,002 0,011 0,015 0,0001
Gondola redesign 15,69 0,210 0,003 0,011 0,015 0,0001
EURO IV SCR truck 42,46 0,162 0,0009 0,0012 0,072 0,0002
EURO V SCR truck 42,25 0,101 0,0009 0,0012 0,072 0,0002
EURO VI truck 42,77 0,018 0,0002 0,0012 0,039 0,0002
Dunaföldvar
Without retrofit 16,18 0,275 0,004 0,017 0,033 0,0001
Flanking rudders+bow thruster gondols 15,24 0,259 0,004 0,016 0,031 0,0001
CCNR 2 engine + 9 lighters 10,78 0,102 0,002 0,012 0,024 0,0001
EURO IV SCR truck 58,87 0,275 0,0017 0,0018 0,114 0,0004
EURO V SCR truck 58,67 0,182 0,0017 0,0018 0,115 0,0004
EURO VI truck 59,40 0,03 0,0003 0,0018 0,060 0,0004
Herso 1
Without retrofit 27,06 0,486 0,007 0,029 0,055 0,0002
Lengthening by 20 % 24,55 0,417 0,006 0,026 0,050 0,0002
Trapeze 25,93 0,441 0,007 0,028 0,053 0,0002
Ship Studio solution 24,43 0,438 0,006 0,026 0,050 0,0002
EURO IV SCR truck 57,19 0,265 0,0017 0,0018 0,110 0,0004
EURO V SCR truck 57,00 0,175 0,0017 0,0017 0,111 0,0004
EURO VI truck 57,69 0,029 0,0003 0,0017 0,058 0,0004
Inflexible
Without retrofit 18,94 0,260 0,004 0,006 0,009 0,0001
Ship Studio solution 16,71 0,229 0,003 0,005 0,008 0,0001
Redesign propeller, nozzle, rudders and bow thruster 17,03 0,234 0,004 0,005 0,008 0,0001
EURO IV SCR truck 58,48 0,248 0,0012 0,0017 0,108 0,0003
EURO V SCR truck 58,23 0,16 0,0012 0,0017 0,108 0,0003
EURO VI truck 59,14 0,026 0,0002 0,0018 0,058 0,0003
Veerhaven X
Without retrofit 20,27 0,255 0,0026 0,024 0,016 0,0001
SCR + PM filter 20,66 0,026 0,0003 0,025 0,016 0,0001
EURO IV SCR truck 58,48 0,248 0,0012 0,0017 0,108 0,0003
EURO V SCR truck 58,23 0,160 0,0012 0,0017 0,108 0,0003
EURO VI truck 59,14 0,026 0,0002 0,0018 0,058 0,0003

D7.3 Environmental Impact
68/76
Conclusions with regard to specific retrofits The choice of the technologies to be investigated is based on their capability to reduce the relative fuel consumption of the vessel under consideration, allowing for a return on investment. It became clear during the numerous discussions of the project that the ship owners will invest only in technologies if the investment can be earned back within a relatively short time, e.g. through reductions in fuel costs or capacity increase. Technologies without economic benefit will not be implemented. Most of the technologies considered lead to a reduction in the relative fuel consumption in g/tkm by approximately 10 – 15 %. Therefore, all emission types are reduced by this amount. In the case of the Dunaföldvar, the installation of new engines complying with CCNR 2 standard, as well as the increase of the number of pushed lighters from six up to nine results in a remarkable reduction of the relative fuel consumption and CO2 emissions by 35 %. Additionally, this measure leads to superior overall performance of the Dunaföldvar compared with the EURO V SCR truck. Only the relative HC emissions appear to be clearly higher than the ones of a EURO V SCR truck. The greatest impact on the NOX and PM emissions is achieved by the application of SCR and PM filters. The NOX and PM emissions are estimated to be reduced by 90 %. However, an increase in the fuel consumption and CO2 emissions by 2 % is expected to take place, caused by the increased engine-back pressure. The analysis performed for the Veerhaven X leads to the following result: If the current engines of the Veerhaven X are equipped with SCR catalysts and PM filters, then, with respect to the relative emissions in g/tkm, the overall performance of the vessel will be superior to the one of a EURO VI truck, complying with the strictest emission standard for trucks. SCR catalysts and PM filters are expensive devices, and they need some additional space in the vessel. The operating costs of a vessel are increased due to increased fuel consumption, urea consumption as well as possible additional maintenance. If there is no incentive to use such devices, from an economic point of view, to the ship owner, it makes no sense to make a respective investment, although the effect on the reduction of the NOX and PM emissions is substantial. For the Veerhaven X, it is noted that the relative CO2 emissions are higher than the ones of the Dunaföldvar, although the Veerhaven X can be considered as technical optimum. The Veerhaven X is not worse than the Dunaföldvar, on the contrary, its transport performance is twice as high as the one of the Dunaföldvar at a similar relative CO2 emission level, demanding higher cargo carrying capacity, speed, more power and a higher relative fuel consumption. Amongst the technologies investigated for each vessel, the following ones have the most significant impact on the reduction of the emissions.
Table 45: MoVe IT! technologies with the greatest impact on the emissions of the vessels considered.
Vessel Technology
Carpe Diem 2-rudder solution
Dunaföldvar New engine of CCNR 2 standard + capacity increase from 6 to 9 lighters
Herso 1 Lengthening of the vessel by 20 %
Inflexible Ship Studio solution
Veerhaven X SCR + PM filters

D7.3 Environmental Impact
69/76
Benefits of retrofits on EU level The evaluation of the impact of applying the MoVe IT! technologies to the EU fleet is performed considering the external costs caused by the air pollutants NOX and PM, as well as the greenhouse gas CO2. The technologies have different impacts on the CO2, NOX and PM emissions. Some have a noticeable impact on CO2 emissions, others have a noticeable impact on NOX or PM emissions. Is 10 % reduction in CO2 emissions of greater importance than 90 % reduction in NOX emissions? From the point of view of a ship owner, assuming that there is no incentive or regulative pressure to invest in devices for reduction of NOX emissions, the reduction in fuel consumption and CO2 emissions is most likely of greater importance as the operational costs may be reduced and a part of the investment costs may be recovered. However, from the point of view of the society, a significant reduction of NOX emissions may be more important. The significance of the different emission types is described by the costs they cause to the society, called external costs. Using the reduction in external costs associated with the application of the different technologies considered, a comparison can be made with respect to the choice of the technology with the greatest impact on the costs to the society. This information can be used also as reference for the evaluation of the order of magnitude of possible incentives to be provided for the implementation of promising technologies. In 2012, the external costs caused by the CO2, the NOX and the PM emissions of the majority of the EU fleet are estimated as 450, 1 200 and 550 Mio EUR (Panteia, 2013). A 50 % reduction in specific fuel consumption, which however is extremely difficult to achieve, if at all, is equivalent to a reduction of approximately 100 % of NOX emissions, from the point of view of external costs. With respect to the MoVe IT! technologies considered, the greatest impact on the reduction of the external costs is achieved by usage of a new engine of CCNR 2 standard, combined with SCR and PM filters. The reduction in external costs accounts for approximately 1 500 Mio EUR per year, corresponding to an approximately 75 % reduction of the total external costs caused by the CO2, NOX and PM emissions. Also very effective is the application of SCR and PM filters to existing engines. The cause for the effective reduction in the external costs is the reduction in NOX and PM emissions. It is noted that the technologies to be applied shall not be limited to SCR and PM filters. Other technologies may have a similar potential for reduction of the NOX and PM emissions. Most important is to achieve a significant reduction in these emissions. Important to note is also that retrofitting an existing engine with a new technology may be considered as major conversion, demanding compliance with the most recent emission standards in force, which might not be achieved in the case the emission standards are very stringent (e.g. possibly starting from 2016), depending on the technology. The result will be that the engine cannot be retrofitted, although there would be a significant benefit to the society, still. Considering the average reduction of the external costs per vessel of the EU fleet, a reduction of fuel consumption by 10 % results in a reduction of external costs due to CO2, NOX and PM emissions by 20 000 EUR per year. It is stressed that this value is an average value. The real value associated with a particular vessel can deviate significantly from the average. However, assuming an emission level of the year 2012 and around 200 000 EUR investment in technologies decreasing the fuel consumption by 10 %, the benefit to the society will amount to 200 000 EUR on average per vessel within 10 years, justifying the provision of incentives for the implementation of such technologies, if such are to be provided. Certainly, for more exact statements, a proper,

D7.3 Environmental Impact
70/76
more comprehensive cost-benefit analysis has to be carried out, taking into account the development of the emissions and technology, as well as unit prices of the emissions. The conclusion given here is more of an indicative nature. When considering the technologies with significant impact on the reduction of NOX and PM emissions e.g. SCR and PM filters, the reduction in external costs per year and vessel may amount to approximately 150 000 EUR on average. Again, it is stressed that this value is an average value. The real value associated with a particular vessel can deviate significantly from the average. However, the reduction in the average costs presented is certainly a good indication for the meaningfulness of providing proper incentives to the ship owners for the implementation of technologies with a significant impact on the reduction of NOX and PM emissions, e.g. but not limited to SCR, PM filters or/and new engines.

D7.3 Environmental Impact
71/76
10. Bibliography and references Germanischer Lloyd, Erarbeitung von Verfahren zur Ermittlung der Luftschadstoffemissionen von in Betrieb befindlichen Binnenschiffsmotoren, Bundesanstalt für Gewässerkunde, FE Vorhaben Nr. BfG/M44/2001/968/1142/6/00, 2001. HBEFA 3.1, Handbook Emission Factors for Road Transport 3.1, www.hbefa.net, INFRAS, Switzerland, 2010. Kampfer, A., and Schweighofer, J., Environmental impact of inland navigation, Creating Work Package 6, Final Report, 2006.
O. Kuik, L. Brander, and R.S.J. Tol, Marginal abatement costs of greenhouse gas emissions: A meta-analysis, Energy Policy, vol. 37, Iss. 4 (2009), p. 1395-1403).
NEEDS project documentation, Deliverable D.4.2.-RS 1b/WP4 – Assessment of biodiversity losses, July , 2006, www.needs-project.org
Panteia, Contribution to impact assessment of measures for reducing emissions of inland navigation, Report R20130023/C0019200/RLE/LJO, written on behalf of the European Commission‘s Directorate-General for Transport, June, 2013.
Planco Consulting GmbH, Verkehrswirtschaftlicher und ökologischer Vergleich der Verkehrsträger Straße, Schiene und Wasserstraße, Schlussbericht, Wasser- und Schifffahrtsdirektion Ost (WSD Ost), 2007.
Schweighofer, J. and Vidic, M., Operational profile of the pusher Dunaföldvar, WP4 report, MoVe IT!, 2013.
Van der Gon, D.H. (TNO), and Hulskotte, J. (TNO), BOP report - Methodologies for estimating shipping emissions in the Netherlands - A documentation of currently used emission factors and related activity data, Netherlands Environmental Assessment Agency, 2010.
Versuchsanstalt für Binnenschifffahrt e.V. Duisburg (VBD), Emissionen luftverunreinigender Stoffe durch den Schiffsverkehr in Nordrhein-Westfalen - Ein Modell zur Berechnung der Schadstoffverteilung auf Wasserstraßen, in Schleusen und Häfen, Materialen Nr. 56, Landesumweltamt Nordrhein-Westfalen, 2001.

D7.3 Environmental Impact
72/76
11. Indexes
11.1. Index of figures
Figure 1: Carpe Diem. ................................................................................................... 13
Figure 2: Annual emissions of the Carpe Diem. ............................................................ 17
Figure 3: Emissions of Carpe Diem retrofit options in g/tkm. ......................................... 18
Figure 4: Comparison of Carpe Diem emissions with different truck emissions (truck only on motorway). ................................................................................................................ 19
Figure 5: Comparison of Carpe Diem emissions with different truck emissions (truck on saturated traffic). ............................................................................................................ 20
Figure 6: Pusher Dunaföldvar. ....................................................................................... 21
Figure 7: Annual absolute emissions of the Dunaföldvar per year. ................................ 27
Figure 8: Emissions in g/tkm associated with the Dunaföldvar retrofit options. ............. 28
Figure 9: Comparison of Dunaföldvar emissions with different truck emissions. ........... 29
Figure 10: MV Herso 1 at the Port of Dunaföldvár. ........................................................ 31
Figure 11: MV Herso 1 pushing the lighter SL Leonie. .................................................. 32
Figure 12: Annual emissions of the Herso 1 in kg. ........................................................ 36
Figure 13: Emissions in g/tkm associated with the Herso 1 retrofit options. .................. 37
Figure 14: Comparison of the Herso 1 emissions with different truck emissions. .......... 38
Figure 15: The pusher Inflexible. ................................................................................... 39
Figure 16: Annual emissions of the Inflexible in kg. ....................................................... 44
Figure 17: Emissions in g/tkm of the Inflexible retrofit options. ...................................... 45
Figure 18: Comparison of Inflexible emissions with different truck emissions. .............. 46
Figure 19: The Veerhaven XI – sister ship of the Veerhaven X. .................................... 48
Figure 20: Annual emissions of the Veerhaven X in kg. ................................................ 53
Figure 21: Emissions in g/tkm associated with the Veerhaven X retrofit options. .......... 54
Figure 22: Comparison of Veerhaven X emissions with different truck emissions. ........ 55
Figure 23: Reduction in external costs in million EUR presented for the EU fleet considering different retrofit options of the MoVe IT! project (a negative sign indicates a reduction of emissions and external costs, a positive one an increase, reference year 2012). ............................................................................................................................ 63
Figure 24: Average reduction in external costs per year and vessel in thousand EUR presented for different retrofit options of the MoVe IT! project (reference year 2012). .. 64
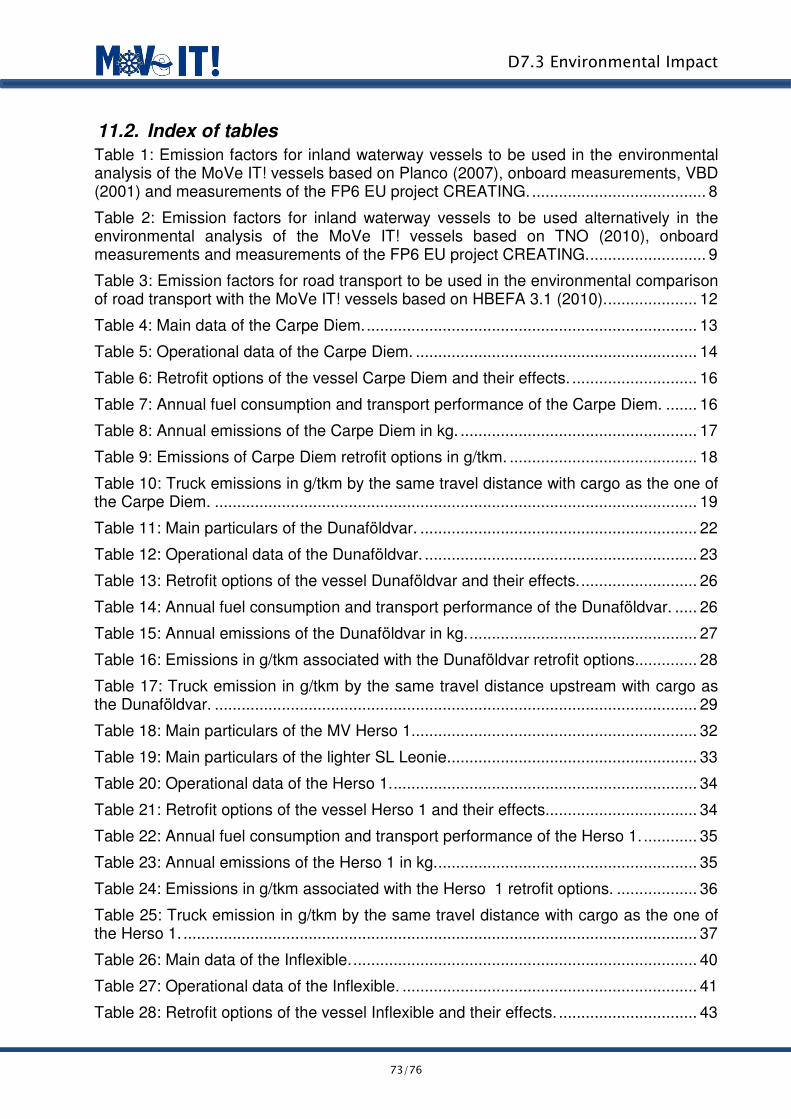
D7.3 Environmental Impact
73/76
11.2. Index of tables
Table 1: Emission factors for inland waterway vessels to be used in the environmental analysis of the MoVe IT! vessels based on Planco (2007), onboard measurements, VBD (2001) and measurements of the FP6 EU project CREATING. ....................................... 8
Table 2: Emission factors for inland waterway vessels to be used alternatively in the environmental analysis of the MoVe IT! vessels based on TNO (2010), onboard measurements and measurements of the FP6 EU project CREATING. .......................... 9
Table 3: Emission factors for road transport to be used in the environmental comparison of road transport with the MoVe IT! vessels based on HBEFA 3.1 (2010). .................... 12
Table 4: Main data of the Carpe Diem. .......................................................................... 13
Table 5: Operational data of the Carpe Diem. ............................................................... 14
Table 6: Retrofit options of the vessel Carpe Diem and their effects. ............................ 16
Table 7: Annual fuel consumption and transport performance of the Carpe Diem. ....... 16
Table 8: Annual emissions of the Carpe Diem in kg. ..................................................... 17
Table 9: Emissions of Carpe Diem retrofit options in g/tkm. .......................................... 18
Table 10: Truck emissions in g/tkm by the same travel distance with cargo as the one of the Carpe Diem. ............................................................................................................ 19
Table 11: Main particulars of the Dunaföldvar. .............................................................. 22
Table 12: Operational data of the Dunaföldvar. ............................................................. 23
Table 13: Retrofit options of the vessel Dunaföldvar and their effects. .......................... 26
Table 14: Annual fuel consumption and transport performance of the Dunaföldvar. ..... 26
Table 15: Annual emissions of the Dunaföldvar in kg. ................................................... 27
Table 16: Emissions in g/tkm associated with the Dunaföldvar retrofit options.............. 28
Table 17: Truck emission in g/tkm by the same travel distance upstream with cargo as the Dunaföldvar. ............................................................................................................ 29
Table 18: Main particulars of the MV Herso 1. ............................................................... 32
Table 19: Main particulars of the lighter SL Leonie. ....................................................... 33
Table 20: Operational data of the Herso 1. .................................................................... 34
Table 21: Retrofit options of the vessel Herso 1 and their effects. ................................. 34
Table 22: Annual fuel consumption and transport performance of the Herso 1. ............ 35
Table 23: Annual emissions of the Herso 1 in kg. .......................................................... 35
Table 24: Emissions in g/tkm associated with the Herso 1 retrofit options. .................. 36
Table 25: Truck emission in g/tkm by the same travel distance with cargo as the one of the Herso 1. ................................................................................................................... 37
Table 26: Main data of the Inflexible. ............................................................................. 40
Table 27: Operational data of the Inflexible. .................................................................. 41
Table 28: Retrofit options of the vessel Inflexible and their effects. ............................... 43

D7.3 Environmental Impact
74/76
Table 29: Annual fuel consumption and transport performance of the Inflexible. .......... 43
Table 30: Annual emissions of the Inflexible in kg. ........................................................ 44
Table 31: Emissions in g/tkm associated with the different Inflexible retrofit options. .... 45
Table 32: Truck emission in g/tkm by the same travel distance with cargo as the Inflexible. ....................................................................................................................... 46
Table 33: Veerhaven X main particulars. ....................................................................... 49
Table 34: Operational data of the Veerhaven X. ............................................................ 50
Table 35: Retrofit options of the vessel Veerhaven X and their effects. ........................ 51
Table 36: Annual fuel consumption and transport performance of the Veerhaven X. .... 52
Table 37: Annual emissions of the Veerhaven X in kg. ................................................. 52
Table 38: Emissions in g/tkm associated with the Veerhaven X retrofit options. ........... 53
Table 39: Truck emissions in g/tkm by the same travel distance with cargo as the Veerhaven X. ................................................................................................................. 54
Table 40: Characteristics of the IVR database. ............................................................. 57
Table 41: Fleet overview in numbers, situation year 2012. ............................................ 57
Table 42: Emission factors for diesel engines used for inland waterway transport in the Dutch Pollutant Release and Transfer Register (TNO, 2010). The dates in the last three rows are slightly modified in order to comply with Panteia (2013). ................................ 57
Table 43: Emissions, reduction in emissions and reduction in external costs per year presented for the EU fleet considering different retrofit options of the MoVe IT! project (a negative sign indicates a reduction of emissions and external costs, a positive one an increase). ....................................................................................................................... 62
Table 44: Summary of the impact of the MoVe IT! technologies on the emissions of the vessels considered, including a comparison with EURO V SCR and EURO VI trucks operating on motorways. ............................................................................................... 67
Table 45: MoVe IT! technologies with the greatest impact on the emissions of the vessels considered. ....................................................................................................... 68
11.3. List of abbreviations
Ad Air draught ADN European Agreement concerning the
International Carriage of Dangerous Goods by Inland Waterways
B breadth moulded BAU business as usual Cargo cargo carrying capacity CEMT European Conference of Ministers of
Transport CFD computational fluid dynamics CCNR Central Commission for the Navigation of
the Rhine

D7.3 Environmental Impact
75/76
CO carbon monoxide CO2 carbon dioxide D depth Disp displacement distanceempty distance travelled without cargo distanceloaded distance travelled with cargo EE East European emission standard for road
transport EF emission factor EN European Standard Etkm emissions referred to tkm EU European Union EUR Euro EURO emission standard for road transport E1year total emissions per year FC total fuel consumption per year FP6 Sixth Framework Programme of the EU FPP fixed pitch propeller g gramme h hour HC hydrocarbon IWT inland waterway transport kg kilogramme km kilometre kW kilowatt kWh kilowatt hour l litre IVR International Association for the
representation of the mutual interests of the inland shipping and the insurance and for keeping the register of inland vessels in Europe
LOA length, overall LPP length between perpendiculars LSW light ship weight LWL length of waterline MCR maximum continuous rating GO gasoil min minute MV motor vessel NOX nitrogen oxide PM particulate matter ppm parts per million RPM revolutions per minute SCR selective catalytic reduction SL (pushed) lighter SO2 sulphur dioxide T draught t tonne TEU twenty-foot equivalent unit

D7.3 Environmental Impact
76/76
tkm tonne kilometre TNO Netherlands Organisation for Applied
Scientific Research ULS ultra-low sulphur v speed of vessel VOC volatile organic compound ρ density


![Cu pasiune pentru - relevance.roRelevance Day] RLV12.pdf · ALBALACT AUTOMOBILE BAVARIA GROUP SUPREMIA SCHWEIGHOFER QII](https://static.fdocuments.in/doc/165x107/5e15e32493d2141919090ca3/cu-pasiune-pentru-relevance-day-rlv12pdf-albalact-automobile-bavaria-group.jpg)


![Inland waterways and extreme weather – EWENT and · PDF fileInland waterways and extreme weather ... Main-Danube Canal ... schweighofer final 04102012.ppt [Kompatibilit tsmodus])](https://static.fdocuments.in/doc/165x107/5aa6bcbd7f8b9ab4788ed091/inland-waterways-and-extreme-weather-ewent-and-inland-waterways-and-extreme.jpg)


