WORTHINGTON INDUSTRIES 2013 ANNUAL REPORT … · To All Worthington Industries Shareholders, Our...
144
GROWING BEYOND INDUSTRY WORTHINGTON INDUSTRIES 2013 ANNUAL REPORT
Transcript of WORTHINGTON INDUSTRIES 2013 ANNUAL REPORT … · To All Worthington Industries Shareholders, Our...

GROWING BEYOND INDUSTRY
WORTHINGTON INDUSTRIES2013 ANNUAL REPORT
134511.indd 1 8/9/13 8:15 AM

FINANCIAL HIGHLIGHTS May 31,
FISCAL YEARS ENDED (In thousands, except per share amounts) 2013 2012 2011
Net sales 1 $ 2,612,244 $ 2,534,701 $ 2,442,624Net earnings attributable to controlling interest 136,442 115,595 115,066
Per share (diluted) $ 1.91 $ 1.65 $ 1.53
Special items included in net earnings attributable to controlling interest: 2
Impairment of long-lived assets (pre-tax) 3 $ 4,501 $ 355 $ 4,386 Restructuring and other expense (pre-tax) 3,293 5,984 2,653 Joint venture transactions (pre-tax) (604) (150 ) (10,436) Non-recurring charges in equity income (pre-tax) 5,780 — — Per share impact of special items (diluted) $ 0.16 $ 0.06 $ (0.03)
Net earnings attributable to controlling interest $ 136,442 $ 115,595 $ 115,066 Interest expense 23,918 19,497 18,756 Income tax expense 64,465 51,904 58,496 Special items (pre-tax) 12,970 6,189 (3,397) Adjusted earnings before interest and taxes (Adjusted EBIT) 4 237,795 193,185 188,921 Depreciation and amortization 66,469 55,873 61,058 Adjusted earnings before interest, taxes, depreciation and amortization (Adjusted EBITDA) 4 $ 304,264 $ 249,058 $ 249,979
Net earnings attributable to controlling interest as a percent of net sales 5.2 % 4.6 % 4.7 %Adjusted EBIT as a percent of net sales 4 9.1 % 7.6 % 7.7 %Adjusted EBITDA as a percent of net sales 4 11.6 % 9.8 % 10.2 %
Capital expenditures $ 44,588 $ 31,713 $ 22,025Capital expenditures (including acquisitions and investments) 219,813 272,349 59,891
Cash dividends declared $ 36,471 $ 33,441 $ 29,411 Per share 0.52 0.48 0.40
1 Excludes sales from unconsolidated affi liates in accordance with accounting principles generally accepted in the United States. Sales from unconsolidated affi liates were as follows: $ 1,753,734 $ 1,685,743 $ 1,034,431
2 We use net earnings attributable to controlling interest, excluding the special items, as a measure of our normal operating performance, which is factored into evaluations and compensation payments.
3 Includes portion attributable to the noncontrolling interest.
4 We believe that Adjusted EBIT and Adjusted EBITDA measures are commonly used by interested parties to evaluate fi nancial performance. They are not measures of fi nancial performance under accounting principles generally accepted in the United States. These measures exclude the impact of the noncontrolling interest, as well as the other charges noted above.
May 31,
AT FISCAL YEAR END (In thousands, except per share amounts) 2013 2012 2011
Net working capital $ 417,969 $ 255,976 $ 366,633Net fi xed assets 459,430 443,077 405,334Total assets 1,950,857 1,877,797 1,667,249Total debt 521,056 533,714 383,210Shareholders’ equity–controlling interest 830,822 697,174 689,910 Per share $ 11.91 $ 10.27 $ 9.62Shares outstanding 69,752 67,906 71,684
Total debt to total capital 5 38.5 % 43.4 % 35.7 %Return on equity 5 17.9 % 16.7 % 16.4 %
5 These measures exclude the impact of the noncontrolling interest.
134511.indd 2 8/9/13 8:15 AM

To All Worthington Industries Shareholders,
Our Company had an excellent fi scal 2013 as we delivered transformational growth and performance improvements across the businesses. Fiscal 2013 was also a great year for our shareholders. We made progress on our primary objective of increasing operating margins while decreasing the volatility of our earnings. We recorded earnings per share of $1.91 in fi scal 2013, the Company’s best ever after excluding restructuring and impairment charges.
The fi rst corporate goal for our Company is to earn money for our shareholders and increase the value of their investment. In fi scal 2013, we delivered with:
• WOR stock price appreciation of 112%;
• $44 million in dividends, including the accelerated payments; and
• $30 million in repurchased shares.
A lot has changed for Worthington Industries over the last fi ve years as we have shifted from a Company best known for its steel processing capabilities, to a more diversifi ed metals manufacturing company. While maintaining a leadership position in fl at rolled steel processing, we have created an expanding growth platform in Pressure Cylinders products for retail, industrial, alternative fuel and energy production and storage markets. We also added a custom-engineered cabs business serving the heavy mobile equipment market. Our equity income from joint ventures has strengthened, led by the excellent results from WAVE, our Worthington Armstrong joint venture. The majority of our other joint ventures in the construction and automotive end-markets were meaningful contributors in fi scal 2013.
“ A lot has changed for Worthington Industries over the last fi ve years as we have shifted from a Company best known for its steel processing capabilities, to a more diversifi ed metals manufacturing company.”
GROWING BEYOND INDUSTRY
134511.indd 3 8/9/13 8:15 AM
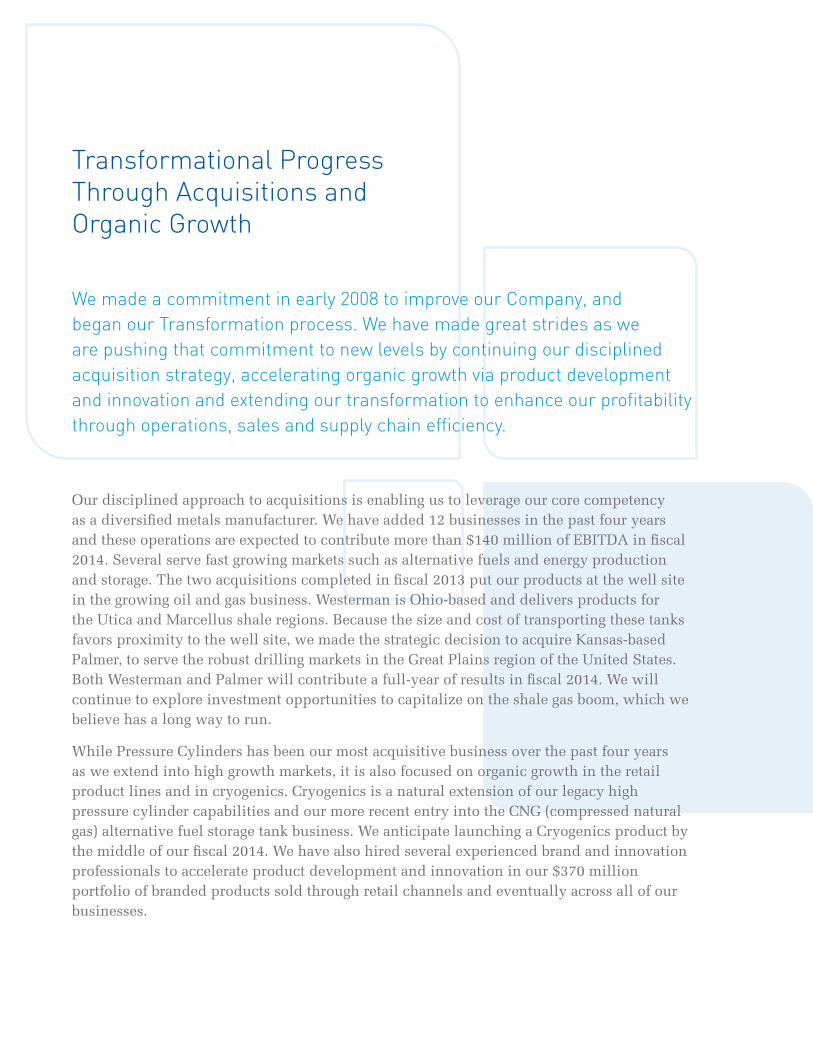
Our disciplined approach to acquisitions is enabling us to leverage our core competency as a diversifi ed metals manufacturer. We have added 12 businesses in the past four years and these operations are expected to contribute more than $140 million of EBITDA in fi scal 2014. Several serve fast growing markets such as alternative fuels and energy production and storage. The two acquisitions completed in fi scal 2013 put our products at the well site in the growing oil and gas business. Westerman is Ohio-based and delivers products for the Utica and Marcellus shale regions. Because the size and cost of transporting these tanks favors proximity to the well site, we made the strategic decision to acquire Kansas-based Palmer, to serve the robust drilling markets in the Great Plains region of the United States. Both Westerman and Palmer will contribute a full-year of results in fi scal 2014. We will continue to explore investment opportunities to capitalize on the shale gas boom, which we believe has a long way to run.
While Pressure Cylinders has been our most acquisitive business over the past four years as we extend into high growth markets, it is also focused on organic growth in the retail product lines and in cryogenics. Cryogenics is a natural extension of our legacy high pressure cylinder capabilities and our more recent entry into the CNG (compressed natural gas) alternative fuel storage tank business. We anticipate launching a Cryogenics product by the middle of our fi scal 2014. We have also hired several experienced brand and innovation professionals to accelerate product development and innovation in our $370 million portfolio of branded products sold through retail channels and eventually across all of our businesses.
We made a commitment in early 2008 to improve our Company, and began our Transformation process. We have made great strides as we are pushing that commitment to new levels by continuing our disciplined acquisition strategy, accelerating organic growth via product development and innovation and extending our transformation to enhance our profi tability through operations, sales and supply chain effi ciency.
Transformational Progress Through Acquisitions and Organic Growth
134511.indd 4 8/9/13 8:15 AM
The Transformation process has changed our Company forever. We are more metric driven and accountable for our performance at all levels, resulting in a higher performing organization. However, we still have a long way to go to reach our goals. Specifi cally, we expect to see further gains in Pressure Cylinders now halfway through transforming their facilities, and improvements in Engineered Cabs where we have just begun. In our Steel Processing business, the Transformation process is mature and we are pursuing better and more effi cient ways to operate so that continuous improvement becomes part of our everyday work. In addition to starting the Transformation process, our Engineered Cabs business also started the new fi scal year with a new leadership team focused on optimizing their performance in safety, quality, delivery, and, of course, bottom-line contribution. While we have seen the Engineered Cabs business slow as a result of pullback by their top customer, this business should improve fi nancially as the volumes return, and we expect to improve many other aspects as well.
2014 OutlookThere is a new level of energy and excitement across our Company as a result of our focus on optimizing performance through transformation, our strategic approach to and effective integration of acquisitions, and organic growth and innovation as a new mind-set. We remain optimistic as we anticipate a strengthening of the broader economy and in particular, the single-family and commercial construction markets. Automotive, where we have our largest concentration of volume, continues to show strength along with some improvement in other markets like agriculture. We are seeing strong growth in two of our newer markets, alternative fuel storage, and oil and gas storage. Still volumes in many of our markets remain below pre-recession levels, including automotive, where volumes are down 20% below the pre-recession peak. Despite the uneven recovery in some parts of the economy, we have produced excellent fi nancial results.
Our strong balance sheet provides us with the ability to fund our future as we are well-positioned to make additional acquisitions, pay our dividend, invest in our businesses and buy-back outstanding shares. All of these are available to us and will be determined by our
“ There is a new level of energy and excitement across our Company as a result of our focus on optimizing performance through transformation, our strategic approach to and effective integration of acquisitions, and organic growth and innovation as a new mind-set.”
134511.indd 5 8/9/13 8:15 AM

set criteria and desired timing. We see numerous growth opportunities and will continue to pursue markets we fi nd attractive, as well as accelerate our innovation and product development efforts to drive organic growth.
Our people remain our most important asset as we build our talent for the future. We have a strong and skilled management team in place that is leading change, driving results and creating excellent momentum. We are developing high performers in the organization and are beginning a robust recruiting and development effort to ensure that we have the top talent available to us as we position the Company into new and exciting areas. We are growing our capability to create, develop and market new products. We see attractive growth opportunities in CNG and liquefi ed propane gas (LPG) fuel tanks, upstream energy production tanks, as well as agriculture and consumer products. Our technical expertise used for the benefi t of our customers and delivery of the products they require are paramount to our success and we are excelling in these areas.
I am very proud of the team here at Worthington Industries and thank our employees for their hard work and focus. Thank you, as shareholders, for your continued loyalty to our Company. We value your investment and hope you are excited about the future because we see great opportunities ahead.
Sincerely,
John P. McConnell, Chairman and CEO
“Our people remain our most important asset as we build our talent for the future.”
134511.indd 6 8/9/13 8:15 AM

UNITED STATESSECURITIES AND EXCHANGE COMMISSION
Washington, D.C. 20549
Form 10-K(Mark One)Í ANNUAL REPORT PURSUANT TO SECTION 13 OR 15(d) OF THE SECURITIES EXCHANGE ACT OF 1934For the fiscal year ended May 31, 2013
or‘ TRANSITION REPORT PURSUANT TO SECTION 13 OR 15(d) OF THE SECURITIES EXCHANGE ACT OF 1934For the transition period from toCommission File Number 1-8399
WORTHINGTON INDUSTRIES, INC.(Exact Name of Registrant as Specified in its Charter)
Ohio 31-1189815
(State or Other Jurisdiction of Incorporation or Organization) (I.R.S. Employer Identification No.)
200 Old Wilson Bridge Road, Columbus, Ohio 43085
(Address of Principal Executive Offices) (Zip Code)
Registrant’s telephone number, including area code: (614) 438-3210
Securities registered pursuant to Section 12(b) of the Act:Title of Each Class Name of Each Exchange on Which Registered
Common Shares, Without Par Value New York Stock ExchangeSecurities registered pursuant to Section 12(g) of the Act: NoneIndicate by check mark if the Registrant is a well-known seasoned issuer, as defined in Rule 405 of the SecuritiesAct. Yes Í No ‘
Indicate by check mark if the Registrant is not required to file reports pursuant to Section 13 or Section 15(d) ofthe Act. Yes ‘ No Í
Indicate by check mark whether the Registrant (1) has filed all reports required to be filed by Section 13 or 15(d)of the Securities Exchange Act of 1934 during the preceding 12 months (or for such shorter period that theRegistrant was required to file such reports), and (2) has been subject to such filing requirements for the past90 days. Yes Í No ‘
Indicate by check mark whether the Registrant has submitted electronically and posted on its corporate Website, if any, every Interactive Data File required to be submitted and posted pursuant to Rule 405 ofRegulation S-T (§232.405 of this chapter) during the preceding 12 months (or for such shorter period that theRegistrant was required to submit and post such files). Yes Í No ‘
Indicate by check mark if disclosure of delinquent filers pursuant to Item 405 of Regulation S-K (§229.405 of thischapter) is not contained herein, and will not be contained, to the best of Registrant’s knowledge, in definitiveproxy or information statements incorporated by reference in Part III of this Form 10-K or any amendment to thisForm 10-K. ‘
Indicate by check mark whether the Registrant is a large accelerated filer, an accelerated filer, a non-acceleratedfiler, or a smaller reporting company. See the definitions of “large accelerated filer,” “accelerated filer” and“smaller reporting company” in Rule 12b-2 of the Exchange Act.Large accelerated filer Í Accelerated filer ‘ Non-accelerated filer ‘ Smaller reporting company ‘
(Do not check if a smaller reporting company)Indicate by check mark whether the Registrant is a shell company (as defined in Rule 12b-2 of theAct). Yes ‘ No Í
The aggregate market value of the Common Shares (the only common equity of the Registrant) held by non-affiliates computed by reference to the closing price on the New York Stock Exchange on November 30, 2012,the last business day of the Registrant’s most recently completed second fiscal quarter, was approximately$1,172,788,263. For this purpose, executive officers and directors of the Registrant are considered affiliates.Indicate the number of shares outstanding of each of the Registrant’s classes of common stock, as of the latestpracticable date. On July 22, 2013, the number of Common Shares issued and outstanding was 69,551,896.
DOCUMENT INCORPORATED BY REFERENCE:Selected portions of the Registrant’s definitive Proxy Statement to be furnished to shareholders of the Registrantin connection with the Annual Meeting of Shareholders to be held on September 26, 2013, are incorporated byreference into Part III of this Annual Report on Form 10-K to the extent provided herein.
TABLE OF CONTENTS
SAFE HARBOR STATEMENT . . . . . . . . . . . . . . . . . . . . . . . . . . . . . . . . . . . . . . . . . . . . . . . . . . . . . . . . . . . . . . . . . . . . . ii
PART I
Item 1. Business . . . . . . . . . . . . . . . . . . . . . . . . . . . . . . . . . . . . . . . . . . . . . . . . . . . . . . . . . . . . . . . . . . . . . 1
Item 1A. Risk Factors . . . . . . . . . . . . . . . . . . . . . . . . . . . . . . . . . . . . . . . . . . . . . . . . . . . . . . . . . . . . . . . . . . 11
Item 1B. Unresolved Staff Comments . . . . . . . . . . . . . . . . . . . . . . . . . . . . . . . . . . . . . . . . . . . . . . . . . . . 22
Item 2. Properties . . . . . . . . . . . . . . . . . . . . . . . . . . . . . . . . . . . . . . . . . . . . . . . . . . . . . . . . . . . . . . . . . . . 22
Item 3. Legal Proceedings . . . . . . . . . . . . . . . . . . . . . . . . . . . . . . . . . . . . . . . . . . . . . . . . . . . . . . . . . . . . 24
Item 4. Mine Safety Disclosures . . . . . . . . . . . . . . . . . . . . . . . . . . . . . . . . . . . . . . . . . . . . . . . . . . . . . . . 24
SupplementalItem. Executive Officers of the Registrant . . . . . . . . . . . . . . . . . . . . . . . . . . . . . . . . . . . . . . . . . . . . . 24
PART II
Item 5. Market for Registrant’s Common Equity, Related Stockholder Matters and IssuerPurchases of Equity Securities . . . . . . . . . . . . . . . . . . . . . . . . . . . . . . . . . . . . . . . . . . . . . . . . 26
Item 6. Selected Financial Data . . . . . . . . . . . . . . . . . . . . . . . . . . . . . . . . . . . . . . . . . . . . . . . . . . . . . . . . 29
Item 7. Management’s Discussion and Analysis of Financial Condition and Results ofOperations . . . . . . . . . . . . . . . . . . . . . . . . . . . . . . . . . . . . . . . . . . . . . . . . . . . . . . . . . . . . . . . . 31
Item 7A. Quantitative and Qualitative Disclosures About Market Risk . . . . . . . . . . . . . . . . . . . . . . . 53
Item 8. Financial Statements and Supplementary Data . . . . . . . . . . . . . . . . . . . . . . . . . . . . . . . . . . 56
Item 9. Changes in and Disagreements With Accountants on Accounting and FinancialDisclosure . . . . . . . . . . . . . . . . . . . . . . . . . . . . . . . . . . . . . . . . . . . . . . . . . . . . . . . . . . . . . . . . . 112
Item 9A. Controls and Procedures . . . . . . . . . . . . . . . . . . . . . . . . . . . . . . . . . . . . . . . . . . . . . . . . . . . . . . 112
Item 9B. Other Information . . . . . . . . . . . . . . . . . . . . . . . . . . . . . . . . . . . . . . . . . . . . . . . . . . . . . . . . . . . . 114
PART III
Item 10. Directors, Executive Officers and Corporate Governance . . . . . . . . . . . . . . . . . . . . . . . . . . 115
Item 11. Executive Compensation . . . . . . . . . . . . . . . . . . . . . . . . . . . . . . . . . . . . . . . . . . . . . . . . . . . . . . 116
Item 12. Security Ownership of Certain Beneficial Owners and Management and RelatedStockholder Matters. . . . . . . . . . . . . . . . . . . . . . . . . . . . . . . . . . . . . . . . . . . . . . . . . . . . . . . . . 116
Item 13. Certain Relationships and Related Transactions, and Director Independence . . . . . . . . 117
Item 14. Principal Accountant Fees and Services . . . . . . . . . . . . . . . . . . . . . . . . . . . . . . . . . . . . . . . . . 117
PART IV
Item 15. Exhibits, Financial Statement Schedules . . . . . . . . . . . . . . . . . . . . . . . . . . . . . . . . . . . . . . . . 118
Signatures
Index to Exhibits E-1
i
SAFE HARBOR STATEMENT
Selected statements contained in this Annual Report on Form 10-K, including, without limitation, in “PART I –Item 1. – Business” and “PART II – Item 7. – Management’s Discussion and Analysis of Financial Condition andResults of Operations,” constitute “forward-looking statements” as that term is used in the Private SecuritiesLitigation Reform Act of 1995 (the “Act”). Forward-looking statements reflect our current expectations, estimates orprojections concerning future results or events. These statements are often identified by the use of forward-lookingwords or phrases such as “believe,” “expect,” “anticipate,” “may,” “could,” “intend,” “estimate,” “plan,” “foresee,”“likely,” “will,” “should” or other similar words or phrases. These forward-looking statements include, withoutlimitation, statements relating to:
• outlook, strategy or business plans;• future or expected growth, performance, sales, volumes, cash flows, earnings, balance sheet strengths,
debt, financial condition or other financial measures;• projected profitability potential, capacity, and working capital needs;• demand trends for us or our markets;• additions to product lines and opportunities to participate in new markets;• pricing trends for raw materials and finished goods and the impact of pricing changes;• anticipated capital expenditures and asset sales;• anticipated improvements and efficiencies in costs, operations, sales, inventory management, sourcing
and the supply chain and the results thereof;• the ability to make acquisitions and the projected timing, results, benefits, costs, charges and
expenditures related to acquisitions, newly-created joint ventures, headcount reductions and facilitydispositions, shutdowns and consolidations;
• the alignment of operations with demand;• the ability to operate profitably and generate cash in down markets;• the ability to maintain margins and capture and maintain market share and to develop or take
advantage of future opportunities, new products and new markets;• expectations for Company and customer inventories, jobs and orders;• expectations for the economy and markets or improvements therein;• expected benefits from transformation plans, cost reduction efforts and other new initiatives;• expectations for increasing volatility or improving and sustaining earnings, earnings potential, margins
or shareholder value;• effects of judicial rulings; and• other non-historical matters.
Because they are based on beliefs, estimates and assumptions, forward-looking statements are inherentlysubject to risks and uncertainties that could cause actual results to differ materially from those projected. Anynumber of factors could affect actual results, including, without limitation, those that follow:
• the effect of national, regional and worldwide economic conditions generally and within major productmarkets, including a prolonged or substantial economic downturn;
• the outcome of negotiations surrounding the United States debt and budget, which may be adverse dueto its impact on tax increases, governmental spending, and customer confidence and spending;
• the effect of conditions in national and worldwide financial markets;• product demand and pricing;• changes in product mix, product substitution and market acceptance of our products;• fluctuations in the pricing, quality or availability of raw materials (particularly steel), supplies,
transportation, utilities and other items required by operations;• effects of facility closures and the consolidation of operations;• the effect of financial difficulties, consolidation and other changes within the steel, automotive,
construction and other industries in which we participate;• failure to maintain appropriate levels of inventories;
ii

• financial difficulties (including bankruptcy filings) of original equipment manufacturers, end-users andcustomers, suppliers, joint venture partners and others with whom we do business;
• the ability to realize targeted expense reductions from headcount reductions, facility closures and othercost reduction efforts;
• the ability to realize other cost savings and operational, sales and sourcing improvements andefficiencies, and other expected benefits from transformation initiatives, on a timely basis;
• the overall success of, and the ability to integrate, newly-acquired businesses and joint ventures,maintain and develop their customers, and achieve synergies and other expected benefits and costsavings therefrom;
• capacity levels and efficiencies, within facilities, within major product markets and within the industry asa whole;
• the effect of disruption in the business of suppliers, customers, facilities and shipping operations due toadverse weather, casualty events, equipment breakdowns, acts of war or terrorist activities or othercauses;
• changes in customer demand, inventories, spending patterns, product choices, and supplier choices;• risks associated with doing business internationally, including economic, political and social instability,
foreign currency exposure and the acceptance of our products in new markets;• the ability to improve and maintain processes and business practices to keep pace with the economic,
competitive and technological environment;• the outcome of adverse claims experience with respect to workers’ compensation, product recalls or
product liability, casualty events or other matters;• deviation of actual results from estimates and/or assumptions used by us in the application of our
significant accounting policies;• level of imports and import prices in our markets;• the impact of the outcome of judicial and governmental agency rulings as well as the impact of
governmental regulations, both in the United States and abroad, including those adopted by the UnitedStates Securities and Exchange Commission and other governmental agencies as contemplated by theDodd-Frank Wall Street Reform and Consumer Protection Act of 2010;
• the effect of changes to healthcare laws in the United States, which may increase our healthcare andother costs and negatively impact our financial results and operations; and
• other risks described from time to time in the filings of Worthington Industries, Inc. with the United StatesSecurities and Exchange Commission, including those described in “PART I – Item 1A. — Risk Factors” ofthis Annual Report on Form 10-K.
We note these factors for investors as contemplated by the Act. It is impossible to predict or identify allpotential risk factors. Consequently, you should not consider the foregoing list to be a complete set of all potentialrisks and uncertainties. Any forward-looking statements in this Annual Report on Form 10-K are based on currentinformation as of the date of this Annual Report on Form 10-K, and we assume no obligation to correct or updateany such statements in the future, except as required by applicable law.
iii
PART I
Item 1. — Business
General Overview
Worthington Industries, Inc. is a corporation formed under the laws of the State of Ohio (individually, the“Registrant” or “Worthington Industries” or, collectively with the subsidiaries of Worthington Industries, Inc.,“we,” “our,” “Worthington” or the “Company”). Founded in 1955, Worthington is primarily a diversified metalsmanufacturing company, focused on value-added steel processing and manufactured metal products. Ourmanufactured metal products include: pressure cylinder products such as propane, oxygen, refrigerant andindustrial cylinders, hand torches, camping cylinders, scuba tanks, compressed natural gas cylinders, heliumballoon kits, and steel and fiberglass tanks and processing equipment for primarily the oil and gas industry;engineered cabs and operator stations and cab components; framing systems for mid-rise buildings; steelpallets and racks; and, through joint ventures, suspension grid systems for concealed and lay-in panel ceilings;laser welded blanks; light gauge steel framing for commercial and residential construction; and current andpast model automotive service stampings.
Worthington is headquartered at 200 Old Wilson Bridge Road, Columbus, Ohio 43085, telephone(614) 438-3210. The common shares of Worthington Industries are traded on the New York Stock Exchangeunder the symbol WOR.
Worthington Industries maintains an Internet web site at www.worthingtonindustries.com. This uniformresource locator, or URL, is an inactive textual reference only and is not intended to incorporate WorthingtonIndustries’ web site into this Annual Report on Form 10-K. Annual Reports on Form 10-K, Quarterly Reports onForm 10-Q, Current Reports on Form 8-K and amendments to those reports, filed or furnished pursuant toSection 13(a) or 15(d) of the Securities Exchange Act of 1934, as amended (the “Exchange Act”), as well asWorthington Industries’ definitive annual meeting proxy materials filed pursuant to Section 14 of theExchange Act, are available free of charge, on or through the Worthington Industries web site, as soon asreasonably practicable after such material is electronically filed with, or furnished to, the Securities andExchange Commission (the “SEC”).
Segments
At the end of the fiscal year ended May 31, 2013 (“fiscal 2013”), we had 36 wholly-owned manufacturingfacilities worldwide and held equity positions in 12 joint ventures, which operated an additional 47manufacturing facilities worldwide.
Our operations are managed principally on a products and services basis and include three reportablebusiness segments: Steel Processing, Pressure Cylinders and Engineered Cabs. The Steel Processingreportable business segment consists of the Worthington Steel business unit (“Worthington Steel”), andincludes Precision Specialty Metals, Inc. (“PSM”), a specialty stainless processor located in Los Angeles,California, and Spartan Steel Coating, LLC (“Spartan”), a consolidated joint venture that operates a cold-rolledhot dipped galvanizing line in Monroe, Michigan. The Pressure Cylinders reportable business segmentconsists of the Worthington Cylinders business unit (“Worthington Cylinders”) and includes India-basedWorthington Nitin Cylinders Limited (“WNCL”), a consolidated joint venture that manufactures high-pressure,seamless steel cylinders for compressed natural gas storage in motor vehicles and for industrial gases. TheEngineered Cabs reportable business segment consists of the Angus Industries business unit (“Angus”), whichwe acquired on December 29, 2011.
All other operating segments are combined and disclosed in the Other category, which also includesincome and expense items not allocated to our operating segments. The Other category includes the SteelPackaging, Construction Services and Worthington Energy Innovations (“WEI”) operating segments.
1
As more fully described in “Item 8. – Financial Statements and Supplementary Data – Notes toConsolidated Financial Statements – Note A – Summary of Significant Accounting Policies” of this AnnualReport on Form 10-K, on March 1, 2011, we contributed certain assets of our former Dietrich Metal Framingbusiness unit (“Dietrich”) to Clarkwestern Dietrich Building Systems LLC (“ClarkDietrich”), an unconsolidatedjoint venture in which we maintain a 25% noncontrolling interest. We retained certain metal framing facilities,which continued to operate in support of the joint venture. As of August 31, 2011, all of the retained facilitieshad ceased operations. We no longer manage our residual metal framing assets in a manner that constitutesan operating segment. Accordingly, the financial results and operating performance of our former MetalFraming operating segment, including activity related to the wind-down of this business, are reported withinthe Other category for segment reporting purposes.
In addition, the former Automotive Body Panels operating segment has been included in the Othercategory, on a historical basis, through May 9, 2011. On May 9, 2011, we closed an agreement to combinecertain assets of The Gerstenslager Company (“Gerstenslager”) and International Tooling Solutions, LLC in anew joint venture, ArtiFlex Manufacturing, LLC (“ArtiFlex”). In exchange for the contributed net assets, wereceived a 50% noncontrolling ownership interest in the new joint venture in addition to certain cash andother consideration.
We hold equity positions in 12 joint ventures, which are further discussed in the Joint Ventures sectionbelow. The WEI, Spartan, and WNCL joint ventures are consolidated with their operating results reportedwithin the Other, Steel Processing and Pressure Cylinders reportable business segments, respectively.
During fiscal 2013, the Steel Processing, Pressure Cylinders and Engineered Cabs operating segmentsserved approximately 1,000, 4,400, and 100 customers, respectively, located primarily in the United States.Foreign operations accounted for approximately 7% of consolidated net sales during fiscal 2013 and werecomprised primarily of sales to customers in Europe. No single customer accounted for over 10% ofconsolidated net sales during fiscal 2013.
Refer to “Item 8. – Financial Statements and Supplementary Data – Notes to Consolidated FinancialStatements – Note N – Segment Data” of this Annual Report on Form 10-K for a full description of ourreportable business segments.
Recent Developments
On August 10, 2012, we issued $150.0 million aggregate principal amount of 12-year Senior Notes due2024 through a private placement with seven entities within the Prudential Capital Group. The Senior Notesbear interest at a fixed rate of 4.6%.
On September 17, 2012, our Pressure Cylinders operating segment acquired 100% of the outstandingcommon shares of Westerman, Inc. (“Westerman”) for cash consideration of approximately $62.7 million andthe assumption of approximately $7.3 million of debt, which was repaid at closing. Westerman manufacturestanks, pressure vessels and other products for the oil and gas and nuclear markets as well as hoists and otherproducts for marine applications. Westerman also leverages its manufacturing competencies to producepressure vessels, atmospheric tanks, controls and various custom machined components for other industrialend markets. Westerman became part of our Pressure Cylinders operating segment upon closing.
On October 31, 2012, our Pressure Cylinders operating segment completed the sale of its European airbrake tank business to Frauenthal Automotive. Based in Hustopece, Czech Republic, Worthington Cylindersa.s. manufactured air brake tank cylinders for the European commercial vehicle market.
On April 9, 2013, our Pressure Cylinders operating segment acquired the business of Palmer Mfg. & Tank,Inc. (“Palmer”) for cash consideration of $113.5 million. Palmer manufactures steel and fiberglass tanks andprocessing equipment for the oil and gas industry, and custom manufactured fiberglass tanks for agricultural,
2
chemical and general industrial applications. The acquired net assets became part of our Pressure Cylindersoperating segment upon closing.
During the fourth quarter of fiscal 2013, we repurchased a total of 925,000 of our common shares for$30.4 million at an average price of $32.88 per share.
On June 21, 2013, we announced the planned consolidation of the BernzOmatic hand torchmanufacturing operations in Medina, New York into our existing facility in Chilton, Wisconsin. The Companyestimates that the consolidation and closure will result in non-recurring restructuring charges in the range of$4.0 million to $5.0 million, primarily due to severance costs, relocation and equipment installation, trainingcosts and other miscellaneous start-up costs. Approximately $2.5 million of severance costs were recognizedin the fourth quarter of fiscal 2013 in connection with this matter. The closure of the Medina operation isexpected to be complete by mid-calendar 2014 to ensure an orderly transition.
On June 26, 2013, the Board of Directors declared a quarterly dividend of $0.15 per share, an increase of$0.02 per share from the previous quarterly dividend rate. The dividend is payable on September 27, 2013 toshareholders of record on September 13, 2013.
Transformation Plan
In our fiscal year ended May 31, 2008 (“fiscal 2008”), we initiated a transformation plan (the“Transformation Plan”) with the overall goal of improving our sustainable earnings potential, asset utilizationand operational performance. The Transformation Plan focuses on cost reduction, margin expansion andorganizational capability improvements and seeks to drive excellence in three core competencies: sales,operations, and supply chain management. The Transformation Plan is comprehensive in scope and includesaggressive diagnostic and implementation phases.
To date, we have completed the transformation phases in each of the core facilities within our SteelProcessing operating segment, including the facilities of our Mexican joint venture. We also substantiallycompleted the transformation phases at our metal framing facilities prior to their contribution to ClarkDietrichin March 2011. Transformation efforts within our Pressure Cylinders operating segment, which began duringthe first quarter of fiscal 2012, are ongoing. In addition, during the first quarter of fiscal 2013, we initiated thediagnostic phase of the Transformation Plan in our Engineered Cabs operating segment.
When this process began, we retained a consulting firm to assist in the development andimplementation of the Transformation Plan. As the Transformation Plan progressed, we formed internalteams dedicated to this effort, and they ultimately assumed full responsibility for executing theTransformation Plan. Although the consulting firm was again engaged as we rolled out the TransformationPlan in our Pressure Cylinders operating segment, all of the work is now led and executed by our internalteams. These internal teams are now an integral part of our business and constitute what we refer to as theCenters of Excellence (“COE”). The COE will continue to monitor the performance metrics and new processesinstituted across our transformed operations and drive continuous improvements in all areas of ouroperations. The majority of the expenses related to the COE will be included in selling, general andadministrative expense going forward, except where they relate to a first time diagnostics phase of theTransformation Plan.
As of May 31, 2013, we have recognized approximately $77.2 million of total restructuring chargesassociated with the Transformation Plan, including charges of $3.3 million, $6.0 million, $2.6 million, $4.2million, $43.0 million and $18.1 million during fiscal 2013, fiscal 2012, fiscal 2011, fiscal 2010, fiscal 2009 andfiscal 2008, respectively. See “Item 8. – Financial Statements and Supplementary Data – Notes to ConsolidatedFinancial Statements – Note D – Restructuring and Other Expense” of this Annual Report on Form 10-K forfurther information regarding our restructuring activities. That information is incorporated herein byreference.
3
Steel Processing
Our Steel Processing operating segment consists of the Worthington Steel business unit, which includesPSM and our consolidated joint venture, Spartan. For fiscal 2013, fiscal 2012 and fiscal 2011, the percentage ofconsolidated net sales generated by our Steel Processing operating segment was approximately 55%, 62%,and 58%, respectively.
Worthington Steel is one of the largest independent intermediate processors of flat-rolled steel in theUnited States. It occupies a niche in the steel industry by focusing on products requiring exact specifications.These products cannot typically be supplied as efficiently by steel mills to the end-users of these products.
Our Steel Processing operating segment serves approximately 1,000 customers, principally in theagricultural, appliance, automotive, construction, hardware, HVAC, lawn and garden, leisure and recreation,and office furniture markets. Automotive-related customers have historically represented approximately halfof this operating segment’s net sales. No single customer represented greater than 10% of net sales for theSteel Processing operating segment during fiscal 2013.
Worthington Steel buys coils of steel from integrated steel mills and mini-mills and processes them to theprecise type, thickness, length, width, shape and surface quality required by customer specifications.Computer-aided processing capabilities include, among others:
• cold reducing, which achieves close tolerances of thickness;
• configured blanking, which stamps steel into specific shapes;
• cutting-to-length, which cuts flattened steel sheets to exact lengths;
• dry-lubing, the process of coating steel with a dry, soap-based lubricant;
• edging, which conditions the edges of the steel by imparting round, smooth or knurled edges;
• hot-dipped galvanizing, which coats steel with zinc and zinc alloys through a hot-dip process;
• hydrogen annealing, a thermal process that changes the hardness and certain metallurgicalcharacteristics of steel;
• pickling, a chemical process using an acidic solution to remove surface oxide which develops onhot-rolled steel;
• primacoat, which is a high-lubricity, acrylic-based coating;
• slitting, which cuts steel coils or steel sheets to specific widths;
• oscillate slitting, a slitting process that spools together several narrow coils welded end to end intoone larger coil;
• temper rolling, which is the process of light cold-rolling sheet steel;
• tension leveling, a method of applying pressure to achieve precise flatness tolerances; and
• non-metallic coating, including acrylic and paint coating.
Worthington Steel also toll processes steel for steel mills, large end-users, service centers and otherprocessors. Toll processing is different from typical steel processing in that the mill, end-user or other partyretains title to the steel and has the responsibility for selling the end product. Toll processing enhancesWorthington Steel’s participation in the market for wide sheet steel and large standard orders, which is amarket generally served by steel mills rather than by intermediate steel processors.
The steel processing industry is fragmented and highly competitive. There are many competitors,including other independent intermediate processors. Competition is primarily on the basis of price, product
4
quality and the ability to meet delivery requirements. Technical service and support for material testing andcustomer-specific applications enhance the quality of products (see “Item 1. – Business – Technical Services”).However, the extent to which technical service capability has improved Worthington Steel’s competitiveposition has not been quantified. Worthington Steel’s ability to meet tight delivery schedules is, in part, basedon the proximity of our facilities to customers, suppliers and one another. The extent to which plant locationhas impacted Worthington Steel’s competitive position has not been quantified. Processed steel products arepriced competitively, primarily based on market factors, including, among other things, market pricing, thecost and availability of raw materials, transportation and shipping costs, and overall economic conditions inthe United States and abroad.
Pressure Cylinders
Our Pressure Cylinders operating segment consists of the Worthington Cylinders business unit and ourconsolidated joint venture, WNCL. For fiscal 2013, fiscal 2012, and fiscal 2011, the percentage of consolidatednet sales generated by our Pressure Cylinders operating segment was approximately 33%, 30%, and 24%,respectively.
Our Pressure Cylinders operating segment manufactures and sells filled and unfilled pressure cylinders,tanks, and various accessories and related products for diversified end-use market applications. The followingis a description of these markets:
• Retail: These products include liquefied petroleum gas (“LPG”) cylinders for barbecue grills andcamping equipment, propane accessories, hand held torches and accessories including fuelcylinders, scuba cylinders, paintball cylinders and Balloon Time® helium balloon kits. These productsare sold primarily to mass merchandisers, cylinder exchangers and distributors. Revenues to thismarket sector totaled $374.8 million and $339.6 million in fiscal 2013 and fiscal 2012, respectively.
• Alternative fuels: This sector includes Type I, II, III and ASME cylinders for containment ofcompressed natural gas and hydrogen for automobiles, buses, and light-duty trucks, as well aspropane/autogas cylinders for automobiles. Revenues to this market sector totaled $76.0 millionand $60.5 million in fiscal 2013 and fiscal 2012, respectively.
• Industrial and Other: This market sector includes industrial, refrigerant, and certain LPG cylinders, aswell as other specialty products. Cylinders in these markets are generally sold to gas producers anddistributors. Industrial cylinders hold fuel for uses such as cutting, welding, breathing (medical,diving and firefighting), semiconductor production, and beverage delivery. Refrigerant gas cylindersare used to hold refrigerant gases for commercial, residential and automotive air conditioning andrefrigeration systems. LPG cylinders hold fuel for recreational vehicle equipment, residential andlight commercial heating systems, industrial forklifts and commercial/residential cooking (the latter,generally outside North America). Specialty products include a variety of fire suppression andchemical tanks. Revenues to this market sector totaled $341.2 million and $370.0 million in fiscal2013 and fiscal 2012, respectively.
• Energy: This sector was formed in fiscal 2013 as a result of the Westerman and Palmer acquisitionsand includes steel and fiberglass tanks, and pressure vessels and other products for global energymarkets, including oil and gas and nuclear, which products are used for a broad variety ofexploration, recovery and production purposes; and hoists and other marine products which areused principally in shipyard lift systems. This sector also leverages its manufacturing competenciesto produce pressure vessels, atmospheric tanks, controls and various custom machinedcomponents for other industrial and agricultural end markets. Revenues to this market sectortotaled $67.3 million in fiscal 2013. As noted in the Recent Developments section above, onSeptember 17, 2012, we acquired Westerman, a manufacturer of tanks and pressure vessels for theoil and gas, nuclear and marine markets with two Ohio locations. On April 9, 2013, we acquired thebusiness of Palmer, a manufacturer of steel and fiberglass tanks and processing equipment for the
5
oil and gas industry, and custom manufactured fiberglass tanks for agricultural, chemical andgeneral industrial applications with one location in Garden City, Kansas. Both of these businessessell into the energy market.
While a large percentage of Pressure Cylinders sales are made to major accounts, this operating segmentserves approximately 4,400 customers. No single customer represented greater than 10% of net sales for thePressure Cylinders operating segment during fiscal 2013.
In the United States and Canada, high-pressure and low-pressure cylinders are primarily manufactured inaccordance with United States Department of Transportation and Transport Canada specifications. Outsidethe United States and Canada, cylinders are manufactured according to European norm specifications, as wellas various other international standards. Other products are produced to applicable industry standardsincluding, as applicable, those standards issued by the American Petroleum Institute, ASME and UL.
In the United States and Canada, Worthington Cylinders has one principal domestic competitor in thelow-pressure non-refillable refrigerant market, one principal domestic competitor in the low-pressure LPGcylinder market, and three principal domestic competitors in the high-pressure cylinder market. There are alsoseveral foreign competitors in these markets. We believe that Worthington Cylinders has the largest domesticmarket share in both of its LPG gas low-pressure cylinder markets. In the European high-pressure cylindermarket, there are also several competitors. We believe that Worthington Cylinders is a leading producer inboth the high-pressure cylinder and low-pressure non-refillable cylinder markets in Europe. WorthingtonCylinders generally has a strong competitive position for its energy, retail and specialty products, butcompetition varies on a product-by-product basis, and geographically for energy products. As with our otheroperating segments, competition is based upon price, service and quality.
The Pressure Cylinders operating segment uses the trade name “Worthington Cylinders” to conductbusiness and the registered trademark “Balloon Time®” to market low-pressure helium balloon kits; theregistered trademark “Bernzomatic®” to market certain fuel cylinders and hand held torches; the trademark“WORTHINGTONTM” to market certain LPG cylinders, hand torches and camping fuel cylinders; the registeredtrademarks “MAP-PRO®” and “Pro-Max®” to market certain hand torch cylinders; the registered trademark SCI®
to market certain cylinders for transportation of compressed gases for inflation of flotation bags and escapeslides; and the tradenames “Westerman,” “Wooster Tool” and “Palmer” to market the tanks and other productsproduced by those operations. The Pressure Cylinders operating segment intends to continue to use andrenew these tradenames and trademarks.
In connection with the acquisition of the propane fuel cylinders business of The Coleman Company, Inc.(“Coleman Cylinders”) in fiscal 2012, we executed a trademark license agreement whereby we are required tomake minimum annual royalty payments of $2.0 million in exchange for the exclusive right to use certainColeman trademarks within the United States and Canada in connection with our operation of the acquiredbusiness.
Engineered Cabs
The Engineered Cabs operating segment consists of the Angus Industries business unit, which wasacquired on December 29, 2011, and includes the Angus-Palm, Angus Engineering and AdvancedComponent Technologies (“ACT®”) brands. Angus is headquartered in Watertown, South Dakota and hasadditional operations in Iowa, South Carolina and Tennessee, which are strategically located near keyassembly locations of original equipment manufacturers. For fiscal 2013 and fiscal 2012, the percentage ofconsolidated net sales generated by our Engineered Cabs operating segment was approximately 9%, and 4%,respectively. On an annualized basis, fiscal 2012 net sales would have represented approximately 10% ofconsolidated net sales.
6
Angus is North America’s leading non-captive designer and manufacturer of high-quality, custom-engineered open and enclosed cabs and operator stations and custom fabrications of heavy mobileequipment used primarily in the agricultural, construction, mining, forestry, military, and various otherindustries. Angus’s product design, engineering support and broad manufacturing capabilities enable it toproduce cabs and structures used in products ranging from small utility equipment to the largestearthmovers.
In addition to its engineered cab products, Angus has the capability to provide a full suite ofcomplementary products such as machined structural components, complex and painted weldments, enginedoors, boom components and complete frames, as well as a complete range of vacuum-formed plastic/acoustical trim components and assemblies under the ACT brand. Angus has the manufacturing capabilityfor:
• Steel laser cutting;
• Steel bending and forming;
• Roll-form tube curving and bending;
• Machining;
• Welding – robotic and manual;
• Automated steel product cleaning and E-coating;
• Top coat painting; and
• Assembly.
Angus produces products for over 150 different equipment platforms for approximately 100 customers.In fiscal 2013, Angus’s top four customers represented approximately 80% of the operating segment’s totalnet sales. Its production levels can run from small and medium production volumes through high volumeproductions.
Angus competes primarily with a handful of primary non-captive producers of engineered cabs in theUnited States, although there are numerous other suppliers who can perform some of the functions suppliedby the Company. Some customers can also produce operator cabs in-house. The Company believes itscompetitive strengths include its design and engineering capabilities and its broad manufacturingcapabilities, which allow it to provide a fully-integrated complete cab, and its ability often to provide cabs at alower cost than customers can produce in-house. Competition is based on price, quality, delivery and service.
Key supplies include steel sheet and plate, steel tubing, hardware, controls, wiper systems, glazingmaterials (glass, polycarbonate), perishables (paint, urethane, caulk), electrical materials, HVAC systems andaesthetic materials (acoustical trim, plastics, foam) which are available from a variety of sources.
Other
Included in the Other category are operating segments that do not meet the applicable aggregationcriteria and materiality tests for purposes of separate disclosure as reportable business segments, as well asother corporate-related entities. These operating segments are: Steel Packaging, Construction Services andWEI. Each of these three operating segments is explained in more detail below.
Steel Packaging. The Steel Packaging operating segment consists of Worthington Steelpac Systems,LLC, an ISO-9001: 2000 certified manufacturer of engineered, recyclable steel packaging solutions for externaland internal movement of product. Steel Packaging operates three facilities, with one facility in each ofIndiana, Ohio and Pennsylvania. Steel Packaging designs and manufactures reusable custom platforms, racksand pallets made of steel for supporting, protecting and handling products throughout the shipping processfor customers in industries such as automotive, lawn and garden and recreational vehicles.
7
Construction Services. The Construction Services operating segment operates a business platform thatincludes the design, supply and building/construction of mid-rise light gauge steel framed commercialstructures, single family and multi-family housing units. The operating segment includes the WorthingtonConstruction Group and the Military Construction business units. Worthington Construction Group includeshigh density mid-rise residential construction in emerging and developed international markets. MilitaryConstruction operates with a focus on domestic military bases.
Worthington Energy Innovations. The WEI Operating segment is comprised of our 75% WEI joint venturewhich is described below under “Joint Ventures.”
Segment Financial Data
Financial information for the reportable business segments is provided in “Item 8. – Financial Statementsand Supplementary Data – Notes to Consolidated Financial Statements – Note N – Segment Data” of thisAnnual Report on Form 10-K. That financial information is incorporated herein by reference.
Financial Information About Geographic Areas
In fiscal 2013, our foreign operations represented 7% of consolidated net sales, 1% of pre-tax earningsattributable to controlling interest and 19% of consolidated net assets. During fiscal 2013, fiscal 2012 andfiscal 2011, we had consolidated operations in Austria, Canada, the Czech Republic (through October 2012),Poland (beginning in fiscal 2012), Portugal, and the United States. Our consolidated and unconsolidated jointventures had operations in China, France, India (beginning in fiscal 2011), Mexico, Spain, the United Kingdomand the United States. Summary information about our foreign operations, including net sales and fixedassets by geographic region, is provided in “Item 8. – Financial Statements and Supplementary Data – Notesto Consolidated Financial Statements – Note A – Summary of Significant Accounting Policies – Risks andUncertainties” and “Note N – Segment Data” of this Annual Report on Form 10-K. That information isincorporated herein by reference.
Suppliers
The primary raw material purchased by Worthington is steel. We purchase steel from major primaryproducers of steel, both domestic and foreign. The amount purchased from any particular supplier varies fromyear to year depending on a number of factors including market conditions, then current relationships andprices and terms offered. In nearly all market conditions, steel is available from a number of suppliers andgenerally any supplier relationship or contract can and has been replaced with little or no significantinterruption to our business. In fiscal 2013, we purchased approximately 1.8 million tons of steel (81% hot-rolled, 4% galvanized and 16% cold-rolled) on a consolidated basis. Steel is purchased in large quantities atregular intervals from major primary producers, both domestic and foreign. In the Steel Processing operatingsegment, steel is primarily purchased and processed based on specific customer orders. The PressureCylinders operating segment purchases steel to meet production schedules. For certain raw materials, thereare more limited suppliers — for example, helium and zinc, which are generally purchased at marketprices. Since there are a limited number of suppliers in the helium and zinc markets, if delivery from a majorsupplier is disrupted due to a force majeure type occurrence, it may be difficult to obtain an alternativesupply. Raw materials are generally purchased in the open market on a negotiated spot-market basis atprevailing market prices. Supply contracts are also entered into, some of which have fixed pricing and someof which are indexed (monthly or quarterly). During fiscal 2013, we purchased steel from the following majorsuppliers, in alphabetical order: AK Steel Corporation; ArcelorMittal; Essar Steel Algoma Inc.; Gallatin SteelCompany; NLMK USA; North Star BlueScope Steel, LLC; Nucor Corporation; RG Steel, LLC; Severstal NorthAmerica, Inc.; Steel Dynamics, Inc.; ThyssenKrupp and United States Steel Corporation (“U.S. Steel”). Majorsuppliers of aluminum to the Pressure Cylinders operating segment in fiscal 2013 were, in alphabetical order:Alcoa; Rio Tinto Alcan; and Sapa Group. Major suppliers of zinc to the Steel Processing operating segment
8
were, in alphabetical order: Considar Metal Marketing Inc. (a/k/a HudBay); Teck Cominco Limited; U.S.Zinc; and Xstrata Zinc Canada. Approximately 24.1 million pounds of zinc were purchased in fiscal 2013. Webelieve our supplier relationships are good.
Technical Services
We employ a staff of engineers and other technical personnel and maintain fully equipped laboratoriesto support operations. These facilities enable verification, analysis and documentation of the physical,chemical, metallurgical and mechanical properties of raw materials and products. Technical service personnelalso work in conjunction with the sales force to determine the types of flat-rolled steel required for customerneeds. Engineers at Angus design cabs and cab manufacturing processes. To provide these services, wemaintain a continuing program of developmental engineering with respect to product characteristics andperformance under varying conditions. Laboratory facilities also perform metallurgical and chemical testingas dictated by the regulations of the United States Department of Transportation, Transport Canada, andother associated agencies, along with International Organization for Standardization (ISO) and customerrequirements. An IASI (International Accreditations Service, Incorporated) accredited product-testinglaboratory supports these design efforts.
Seasonality and Backlog
Sales are generally strongest in the fourth quarter of our fiscal year as our operating segments aregenerally operating at seasonal peaks. Historically, sales have generally been weaker in the third quarter ofour fiscal year, primarily due to reduced activity in the building and construction industry as a result ofinclement weather, as well as customer plant shutdowns in the automotive industry due to holidays. We donot believe backlog is a significant indicator of our business.
Employees
As of May 31, 2013, we had approximately 10,500 employees, including those employed by ourunconsolidated joint ventures. Approximately 7% of these employees are represented by collectivebargaining units. Worthington believes it has good relationships with its employees in general, includingthose covered by collective bargaining units.
Joint Ventures
As part of our strategy to selectively develop new products, markets and technological capabilities andto expand our international presence, while mitigating the risks and costs associated with those activities, weparticipate in three consolidated and nine unconsolidated joint ventures.
Consolidated
• Spartan is a 52%-owned consolidated joint venture with a subsidiary of Severstal North America, Inc.(“Severstal”), located in Monroe, Michigan. It operates a cold-rolled, hot-dipped galvanizing line for tollprocessing steel coils into galvanized and galvannealed products intended primarily for the automotiveindustry. Spartan’s financial results are fully consolidated within our Steel Processing reportable businesssegment. The equity owned by Severstal is shown as noncontrolling interest on our consolidatedbalance sheets and Severstal’s portion of net earnings is included as net earnings attributable tononcontrolling interest in our consolidated statements of earnings.
• WEI is a 75%-owned consolidated joint venture with a subsidiary of Professional Supply, Inc. (20%) andStonehenge Structured Finance Partners, LLC (5%) (together referred to as “WEI Partners”), located inFremont, Ohio. WEI is a professional services company that develops cost-effective energy solutions forentities in North America. WEI designs solutions to minimize energy consumption, manages the energy
9
solution installation, monitors and verifies energy usage, guarantees future energy savings and shares inthese savings. Additionally, WEI utilizes certain patented products to further enhance energy savings.WEI’s financial results are reported within the Other category for segment reporting purposes. The equityowned by the WEI Partners is shown as noncontrolling interest on our consolidated balance sheets andthe WEI Partners’ portion of net earnings is included as net earnings attributable to noncontrollinginterest in our consolidated statements of earnings.
• WNCL is a 60%-owned consolidated joint venture based in India with Nitin Fire Protection IndustriesLimited (“Nitin Fire”). WNCL manufactures high-pressure, seamless steel cylinders for compressed naturalgas storage in motor vehicles, and produces cylinders for compressed industrial gases. WNCL’s financialresults are fully consolidated within our Pressure Cylinders reportable business segment. The equityowned by Nitin is shown as noncontrolling interest on our consolidated balance sheets and Nitin’sportion of net earnings is included as net earnings attributable to noncontrolling interest in ourconsolidated statements of earnings.
Unconsolidated
• ArtiFlex, a 50%-owned joint venture with International Tooling Solutions, LLC, provides an integratedsolution for engineering, tooling, stamping, assembly and other services to customers primarily in theautomotive industry. ArtiFlex operates four owned and two leased manufacturing facilities. Thesefacilities are located in Kentucky, Michigan (3) and Ohio (2).
• ClarkDietrich, a 25%-owned joint venture with ClarkWestern Building Systems, Inc., is the industry leaderin the manufacture and supply of light gauge steel framing products in the United States. ClarkDietrichmanufactures a full line of drywall studs and accessories, structural studs and joists, metal lath andaccessories, shaft wall studs and track, and vinyl products used primarily in residential and commercialconstruction. This joint venture operates 13 manufacturing facilities, one each in Connecticut, Georgia,Hawaii, Illinois, and Maryland and two each in California, Ohio, Florida and Texas.
• Gestamp Worthington Wind Steel, LLC (the “Gestamp JV”) is a 50%-owned joint venture with GestampWind Steel U.S., Inc., that was formed with a focus on producing towers for wind turbines beingconstructed in the North American market. Due to the volatile political environment in the United States,particularly in regards to the Federal Production Tax Credit, the Company is in the processing ofdissolving this joint venture.
• Samuel Steel Pickling Company (“Samuel”), a 31.25%-owned joint venture with Samuel Manu-TechPickling, operates one steel pickling facility in Twinsburg, Ohio, and another in Cleveland, Ohio. Samuelalso performs in-line slitting, side trimming, pickle dry, under winding and the application of dry lubecoatings during the pickling process.
• Serviacero Planos, S. de R.L. de C.V. (“Serviacero Worthington”), a 50%-owned joint venture with Inverzer,S.A. de C.V., operates three facilities in Mexico, one each in Leon, Queretaro and Monterrey. ServiaceroWorthington provides steel processing services such as pickling, slitting, multi-blanking and cutting-to-length to customers in a variety of industries including automotive, appliance, electronics and heavyequipment. Serviacero Worthington commissioned a new pickle line in Monterrey during the latesummer of calendar 2012.
• TWB Company, L.L.C. (“TWB”), a 45%-owned joint venture with ThyssenKrupp Steel North America, Inc., isa leading North American supplier of tailor welded blanks, tailor welded coils and other tailor weldedproducts. TWB produces tailor welded products for use primarily in the automotive industry for productssuch as inner-door panels, body sides, rails and pillars, etc. TWB operates facilities in Monroe, Michigan;Prattville, Alabama; and Smyrna, Tennessee as well as in Puebla, Ramos Arizpe (Saltillo), Hermosillo, andSilao, Mexico.
• Worthington Armstrong Venture (“WAVE”), a 50%-owned joint venture with Armstrong Ventures, Inc., asubsidiary of Armstrong World Industries, Inc., is one of the three largest global manufacturers of ceiling
10
suspension systems for concealed and lay-in panel ceilings used in commercial and residential ceilingmarkets. It competes with the two other global manufacturers and numerous smallermanufacturers. WAVE operates nine facilities in six countries: Aberdeen, Maryland; Benton Harbor,Michigan; and North Las Vegas, Nevada, within the United States; Qingpu, Shanghai, the PeoplesRepublic of China; Sittingbourne and Team Valley, United Kingdom; Prouvy, France; Marval, Pune, India;and Madrid, Spain.
• Worthington Modern Steel Framing Manufacturing Co., Ltd., a 40%-owned joint venture with China-based Hubei Modern Urban Construction & Development Group Co. Ltd., designs, manufactures,assembles and distributes steel framing materials for construction projects in five Central Chineseprovinces and also provides related project management and building design and construction supplyservices. This joint venture operates one facility located in Xiantao City, Hubei Province, China.
• Worthington Specialty Processing (“WSP”), a 51%-owned joint venture with a subsidiary of U.S. Steel,operates three steel processing facilities located in Canton, Jackson and Taylor, Michigan, which aremanaged by Worthington Steel. WSP serves primarily as a toll processor for U.S. Steel and others. Itsservices include slitting, blanking, cutting-to-length, laser welding, tension leveling and warehousing.WSP is considered to be jointly controlled and not consolidated due to substantive participating rights ofthe minority partner.
See “Item 8. – Financial Statements and Supplementary Data – Notes to Consolidated FinancialStatements – Note B – Investments in Unconsolidated Affiliates” for additional information about ourunconsolidated joint ventures.
Environmental Regulation
Our manufacturing facilities, generally in common with those of similar industries making similarproducts, are subject to many federal, state, local and foreign laws and regulations relating to the protectionof the environment. We continually examine ways to reduce emissions and waste and to decrease costsrelated to environmental compliance. The cost of compliance or capital expenditures for environmentalcontrol facilities required to meet environmental requirements are not anticipated to be material whencompared with overall costs and capital expenditures and, accordingly, are not anticipated to have a materialeffect on our financial position, results of operations, cash flows, or the competitive position of Worthingtonor any particular segment.
Item 1A. — Risk Factors
Future results and the market price for Worthington Industries’ common shares are subject to numerousrisks, many of which are driven by factors that cannot be controlled or predicted. The following discussion, aswell as other sections of this Annual Report on Form 10-K, including “PART II—Item 7.— Management’sDiscussion and Analysis of Financial Condition and Results of Operations,” describe certain business risks.Consideration should be given to the risk factors described below as well as those in the Safe HarborStatement at the beginning of this Annual Report on Form 10-K, in conjunction with reviewing the forward-looking statements and other information contained in this Annual Report on Form 10-K. These risks are notthe only risks we face. Our business operations could also be affected by additional factors that are notpresently known to us or that we currently consider to be immaterial in our operations.
Economic or Industry Downturns
The global recession that began in 2008 adversely affected and may continue to adversely affect our businessand our industries, as well as the industries and businesses of many of our customers and suppliers. The volatiledomestic and global recessionary climate had significant negative impacts on our business. The globalrecession, and the sluggish pace of the recovery, resulted in a significant decrease in customer demandthroughout nearly all of our markets, including our largest market — automotive.
11

The impacts of the slow and uneven recovery in customer demand in many of our markets andgovernment measures to aid economic recovery, including various measures intended to provide stimulus tothe economy in general or to certain industries, as well as the growing debt levels of the United States andother countries, especially in Europe, continue to be unknown. Overall, operating levels across many of ourbusinesses may remain at lower levels until economic conditions improve and demand increases. Whilecertain sectors of the economy have stabilized and recovered from the economic downturn, we are unable topredict the strength, pace or sustainability of the economic recovery or the effects of governmentintervention or debt levels. Overall general economic conditions, both domestically and globally, haveimproved from the lows reached during the recession. The automotive market has shown signs ofstrengthening, and the construction market has shown signs of stabilizing. However, global economicconditions, particularly in Europe, remain fragile, and the possibility remains that the domestic or globaleconomies, or certain industry sectors of those economies that are key to our sales, may continue to be slowor could further deteriorate, which could result in a corresponding decrease in demand for our products andnegatively impact our results of operations and financial condition.
The automotive and construction industries account for a significant portion of our net sales, and reduceddemand from these industries have adversely impacted and may continue to adversely affect our business. Theoverall downturn in the economy, the disruption in capital and credit markets, declining real estate values,high unemployment rates, and reduced consumer confidence and spending caused significant reductions indemand from our end markets in general and, in particular, the automotive and construction end markets.The domestic automotive industry has improved from its lows in recent years, but it continues to experience adifficult operating environment, which has resulted in and may continue to result in lower levels of vehicleproduction and an associated decrease in demand for products sold to the automotive industry. Manyautomotive manufacturers and their suppliers have reduced production levels and eliminated manufacturingcapacity, through the closure of facilities, reduction in operations and other cost reduction actions. Theconstruction industry has shown signs of stabilizing from further erosion. However, both the automotive andconstruction markets remain depressed compared to historical norms, and we cannot predict the strength,pace or sustainability of recovery in these markets. The difficulties faced by the automotive and constructionindustries have adversely affected and may continue to adversely affect our business. If demand for theproducts we sell to the automotive or construction markets were to be further reduced, this could negativelyaffect our sales, financial results and cash flows.
Financial difficulties and bankruptcy filings by our customers could have an adverse impact on ourbusiness. In recent years, many of our customers have experienced and continue to experience challengingfinancial conditions. The financial difficulties of certain customers and/or their failure to obtain credit orotherwise improve their overall financial condition could result in numerous changes within the markets weserve, including additional plant closings, decreased production, reduced demand, changes in product mix,unfavorable changes in the prices, terms or conditions we are able to obtain and other changes that mayresult in decreased purchases from us and otherwise negatively impact our business. These conditions alsoincrease the risk that our customers may delay or default on their payment obligations to us. The relativeweakness of the economy continues the risk that some of our customers have further financial difficulties.Economic conditions remain fragile, and the possibility remains that markets may not fully recover, or couldfurther deteriorate. Should the economy or any of our markets not improve, the risk of bankruptcy filings byand financial difficulties of our customers may increase. Such bankruptcy filings or other financial difficultiesmay result not only in a reduction in our sales, but also in a loss associated with our potential inability tocollect outstanding accounts receivable from the affected customers. While we have taken and will continueto take steps intended to mitigate the impact of financial difficulties and potential bankruptcy filings by ourcustomers, these matters could have a negative impact on our business.
Volatility in the United States and worldwide capital and credit markets has significantly impacted and maycontinue to significantly impact our end markets and has resulted and may continue to result in negative impactson demand, increased credit and collection risks and other adverse effects on our business. The domestic and
12
worldwide capital and credit markets, have experienced significant volatility, disruptions and dislocationswith respect to price and credit availability. These factors caused diminished availability of credit and othercapital in our end markets, and for participants in, and the customers of, those markets.
Although domestic credit markets have largely stabilized from the height of the financial crisis, theeffects of the financial crisis continue to present additional risks to us, our customers and suppliers. Inparticular, there is no guarantee that the credit markets or liquidity will not once again be restricted.Additionally, stricter lending standards have made it more difficult and costly for some firms to access thecredit markets. In addition, uncertainties in Europe regarding the financial sector and sovereign debt and thepotential impact on banks in other regions of the world will continue to weigh on global and domesticgrowth. Although we believe we have adequate access to several sources of contractually committedborrowings and other available credit facilities, these risks could temporarily restrict our ability to borrowmoney on acceptable terms in the credit markets and potentially could affect our ability to draw on our creditfacility. In addition, restricted access to the credit markets is also continuing to make it difficult, or in somecases, impossible for our customers to borrow money to fund their operations. Lack of, or limited access to,capital would adversely affect our customers’ ability to purchase our products or, in some cases, to pay for ourproducts on a timely basis.
Raw Material Pricing and Availability
The costs of manufacturing our products and our ability to supply our customers could be negativelyimpacted if we experience interruptions in deliveries of needed raw materials or supplies. If, for any reason, oursupply of flat-rolled steel or other key raw materials, such as aluminum, zinc or helium, is curtailed or we areotherwise unable to obtain the quantities we need at competitive prices, our business could suffer and ourfinancial results could be adversely affected. Such interruptions could result from a number of factors,including a shortage of capacity in the supplier base of raw materials, energy or the inputs needed to makesteel or other supplies, a failure of suppliers to fulfill their supply or delivery obligations, financial difficulties ofsuppliers resulting in the closing or idling of supplier facilities, other significant events affecting supplierfacilities, significant weather events, those factors listed in the immediately following paragraph or otherfactors beyond our control. Further, the number of suppliers has decreased in recent years due to industryconsolidation and the financial difficulties of certain suppliers, and this consolidation may continue.Accordingly, if delivery from a major supplier is disrupted, it may be more difficult to obtain an alternativesupply than in the past.
Our future operating results may be affected by fluctuations in raw material prices, and we may be unable topass on increases in raw material costs to our customers. Our principal raw material is flat-rolled steel, whichwe purchase from multiple primary steel producers. The steel industry as a whole has been cyclical, and attimes availability and pricing can be volatile due to a number of factors beyond our control. These factorsinclude general economic conditions, domestic and worldwide demand, the influence of hedge funds andother investment funds participating in commodity markets, curtailed production from major suppliers dueto factors such as the closing or idling of facilities, accidents or equipment breakdowns, repairs orcatastrophic events, labor costs or problems, competition, new laws and regulations, import duties, tariffs,energy costs, availability and cost of steel inputs (e.g., ore, scrap, coke and energy), currency exchange ratesand other factors described in the immediately preceding paragraph. This volatility, as well as any increases inraw material costs, could significantly affect our steel costs and adversely impact our financial results. If oursuppliers increase the prices of our critical raw materials, we may not have alternative sources of supply. Inaddition, in an environment of increasing prices for steel and other raw materials, competitive conditions mayimpact how much of the price increases we can pass on to our customers. To the extent we are unable to passon future price increases in our raw materials to our customers, our financial results could be adverselyaffected. Also, if steel prices decrease, competitive conditions may impact how quickly we must reduce ourprices to our customers, and we could be forced to use higher-priced raw materials to complete orders forwhich the selling prices have decreased. Decreasing steel prices could also require us to write-down the valueof our inventory to reflect current market pricing.
13
Inventories
Our business could be harmed if we fail to maintain proper inventory levels. We are required to maintainsufficient inventories to accommodate the needs of our customers including, in many cases, short lead timesand just-in-time delivery requirements. Although we typically have customer orders in hand prior toplacement of our raw material orders for Steel Processing, we anticipate and forecast customer demand foreach of our operating segments. We purchase raw materials on a regular basis in an effort to maintain ourinventory at levels that we believe are sufficient to satisfy the anticipated needs of our customers based uponorders, customer volume expectations, historic buying practices and market conditions. Inventory levels inexcess of customer demand may result in the use of higher-priced inventory to fill orders reflecting lowerselling prices, if steel prices have significantly decreased. These events could adversely affect our financialresults. Conversely, if we underestimate demand for our products or if our suppliers fail to supply qualityproducts in a timely manner, we may experience inventory shortages. Inventory shortages could result inunfilled orders, negatively impacting our customer relationships and resulting in lost revenues, which couldharm our business and adversely affect our financial results.
Suppliers and Customers
The loss of significant volume from our key customers could adversely affect us. A significant loss of, ordecrease in, business from any of our key customers could have an adverse effect on our sales and financialresults if we cannot obtain replacement business. Also, due to consolidation in the industries we serve,including the construction, automotive and retail industries, our sales may be increasingly sensitive todeterioration in the financial condition of, or other adverse developments with respect to, one or more of ourtop customers. In addition, certain of our top customers may be able to exert pricing and other influences onus, requiring us to market, deliver and promote our products in a manner that may be more costly to us.Moreover, we generally do not have long-term contracts with our customers. As a result, although ourcustomers periodically provide indications of their product needs and purchases, they generally purchase ourproducts on an order-by-order basis, and the relationship, as well as particular orders, can be terminated atany time.
Many of our key industries, such as automotive and construction, are cyclical in nature. Many of our keyindustries, such as automotive and construction, are cyclical and can be impacted by both market demandand raw material supply, particularly with respect to steel. The demand for our products is directly related to,and quickly impacted by, customer demand in our industries, which can change as the result of changes inthe general United States or worldwide economy and other factors beyond our control. Adverse changes indemand or pricing can have a negative effect on our business.
Significant reductions in sales to any of the Detroit Three automakers could have a negative impact on ourbusiness. Approximately half of the net sales of our Steel Processing operating segment and a significantamount of the net sales of certain joint ventures are to automotive-related customers. Although we do sell tothe domestic operations of foreign automakers and their suppliers, a significant portion of our automotivesales are to Ford, General Motors, and Chrysler (the “Detroit Three automakers”) and their suppliers. Areduction in sales for any of the Detroit Three automakers could negatively impact our business. In addition,in 2011, automobile producers began taking steps toward complying with new Corporate Average FuelEconomy mileage requirements for new cars and light trucks that they produce. As automakers work toproduce vehicles that comply with these new standards, they may reduce the amount of steel used in carsand trucks to improve fuel economy, thereby reducing demand for steel and resulting in further over-supplyof steel in North America.
The closing or relocation of customer facilities could adversely affect us. Our ability to meet deliveryrequirements and the overall cost of our products as delivered to customer facilities are important competitivefactors. If customers close or move their production facilities further away from our manufacturing facilities
14
which can supply them, it could have an adverse effect on our ability to meet competitive conditions, whichcould result in the loss of sales. Likewise, if customers move their production facilities overseas, it could result inthe loss of potential sales for us.
Sales conflicts with our customers and/or suppliers may adversely impact us. In some instances, we maycompete with one or more of our customers and/or suppliers in pursuing the same business. In addition, inthe Engineered Cabs business, our customers often have the option of producing certain cabs in-houseinstead of having them supplied by us or our competition. To the extent they elect to produce such cabs in-house, it could adversely affect our sales. Such conflicts may strain our relationships with those parties, whichcould adversely affect our future business with them.
The closing or idling of steel manufacturing facilities could have a negative impact on us. As steel makershave reduced their production capacities by closing or idling production lines in light of the challengingeconomic conditions, the number of facilities from which we can purchase steel, in particular certain specialtysteels, has decreased. Accordingly, if delivery from a supplier is disrupted, particularly with respect to certaintypes of specialty steel, it may be more difficult to obtain an alternate supply than in the past. These closuresand disruptions could also have an adverse effect on our suppliers’ on-time delivery performance, whichcould have an adverse effect on our ability to meet our own delivery commitments and may have otheradverse effects on our business.
The loss of key supplier relationships could adversely affect us. Over the years, our various manufacturingoperations have developed relationships with certain steel and other suppliers which have been beneficial tous by providing more assured delivery and a more favorable all-in cost, which includes price and shippingcosts. If any of those relationships were disrupted, it could have an adverse effect on delivery times and theoverall cost and quality of our raw materials, which could have a negative impact on our business. In addition,we do not have long-term contracts with any of our suppliers. If, in the future, we are unable to obtainsufficient amounts of steel and other products at competitive prices and on a timely basis from our traditionalsuppliers, we may be unable to obtain these products from alternative sources at competitive prices to meetour delivery schedules, which could have a material adverse affect on our results of operations.
Competition
Our business is highly competitive, and increased competition could negatively impact our financialresults. Generally, the markets in which we conduct business are highly competitive. Our competitorsinclude a variety of both domestic and foreign companies in all major markets. Competition for most of ourproducts is primarily on the basis of price, product quality and our ability to meet delivery requirements.Depending on a variety of factors, including raw material, energy, labor and capital costs, government controlof currency exchange rates and government subsidies of foreign steel producers, our business may bematerially adversely affected by competitive forces. The economic recession has also resulted in significantopen capacity, which could attract increased competitive presence. Competition may also increase ifsuppliers to or customers of our industries begin to more directly compete with our businesses through newfacilities, acquisitions or otherwise. As noted above, we can have conflicts with our customers or suppliersand, in some cases, supply the same products and services as we do. Increased competition could cause us tolose market share, increase expenditures, lower our margins or offer additional services at a higher cost to us,which could adversely impact our financial results.
Material Substitution
If steel prices increase compared to certain substitute materials, the demand for our products could benegatively impacted, which could have an adverse effect on our financial results. In certain applications, steelcompetes with other materials, such as aluminum (particularly in the automobile industry), cement and wood(particularly in the construction industry), composites, glass and plastic. Prices of all of these materials
15

fluctuate widely, and differences between the prices of these materials and the price of steel may adverselyaffect demand for our products and/or encourage material substitution, which could adversely affect pricesand demand for steel products. The high cost of steel relative to other materials may make materialsubstitution more attractive for certain uses.
Freight and Energy
Increasing freight and energy costs could increase our operating costs, which could have an adverse effect onour financial results. The availability and cost of freight and energy, such as electricity, natural gas and dieselfuel, is important in the manufacture and transport of our products. Our operations consume substantialamounts of energy, and our operating costs generally increase when energy costs rise. Factors that may affectour energy costs include significant increases in fuel, oil or natural gas prices, unavailability of electrical poweror other energy sources due to droughts, hurricanes or other natural causes or due to shortages resultingfrom insufficient supplies to serve customers, or interruptions in energy supplies due to equipment failure orother causes. During periods of increasing energy and freight costs, we may be unable to fully recover ouroperating cost increases through price increases without reducing demand for our products. Our financialresults could be adversely affected if we are unable to pass all of the increases on to our customers or if we areunable to obtain the necessary freight and energy. Also, increasing energy costs could put a strain on thetransportation of our materials and products if the increased costs force certain transporters to close.
Information Systems
We are subject to information system security risks and systems integration issues that could disrupt ourinternal operations. We are dependent upon information technology for the distribution of informationinternally and also to our customers and suppliers. This information technology is subject to damage orinterruption from a variety of sources, including, without limitation, computer viruses, security breaches anddefects in design. We could also be adversely affected by system or network disruptions if new or upgradedbusiness management systems are defective, not installed properly or not properly integrated intooperations. Various measures have been implemented to manage our risks related to information system andnetwork disruptions and to prevent attempts to gain unauthorized access through the Internet to ourinformation systems. However, a system failure could negatively impact our operations and financial results.In addition, cyber attacks could threaten the integrity of our trade secrets and sensitive intellectual property.
Business Disruptions
Disruptions to our business or the business of our customers or suppliers could adversely impact ouroperations and financial results. Business disruptions, including increased costs for, or interruptions in, thesupply of energy or raw materials, resulting from shortages of supply or transportation, severe weather events(such as hurricanes, tsunamis, earthquakes, tornados, floods and blizzards), casualty events (such asexplosions, fires or material equipment breakdown), acts of terrorism, pandemic disease, labor disruptions,the idling of facilities due to reduced demand (resulting from a downturn in economic activity or otherwise)or other events (such as required maintenance shutdowns), could cause interruptions to our businesses aswell as the operations of our customers and suppliers. While we maintain insurance coverage that can offsetsome losses relating to certain types of these events, losses from business disruptions could have an adverseeffect on our operations and financial results and we could be adversely impacted to the extent any suchlosses are not covered by insurance or cause some other adverse impact to us.
Foreign Operations
Economic, political and other risks associated with foreign operations could adversely affect our internationalfinancial results. Although the substantial majority of our business activity takes place in the United States,we derive a portion of our revenues and earnings from operations in foreign countries, and we are subject to
16

risks associated with doing business internationally. We have wholly-owned facilities in Austria, Canada,Poland and Portugal and joint venture facilities in China, France, India, Mexico, Spain and the UnitedKingdom, and are active in exploring other foreign opportunities. The risks of doing business in foreigncountries include, among other factors: the potential for adverse changes in the local political climate, indiplomatic relations between foreign countries and the United States or in government policies, laws orregulations; terrorist activity that may cause social disruption; logistical and communications challenges; costsof complying with a variety of laws and regulations; difficulty in staffing and managing geographically diverseoperations; deterioration of foreign economic conditions, especially within Europe; inflation and fluctuationsin interest rates; currency rate fluctuations; foreign exchange restrictions; differing local business practicesand cultural considerations; restrictions on imports and exports or sources of supply, including energy andraw materials; changes in duties, quotas, tariffs, taxes or other protectionist measures; and potential issuesrelated to matters covered by the Foreign Corrupt Practices Act or similar laws. We believe that our businessactivities outside of the United States involve a higher degree of risk than our domestic activities, and any oneor more of these factors could adversely affect our operating results and financial condition. In addition, theglobal recession and the volatility of worldwide capital and credit markets have significantly impacted andmay continue to significantly impact our foreign customers and markets. These factors have resulted indecreased demand in our foreign operations and have had significant negative impacts on our business.Refer to the Economic or Industry Downturns risk factor herein for additional information concerning theimpact of the global recession and the volatility of capital and credit markets on our business.
Joint Ventures
A change in the relationship between the members of any of our joint ventures may have an adverse effect onthat joint venture. We have been successful in the development and operation of various joint ventures, andour equity in net income from our joint ventures, particularly WAVE, has been important to our financialresults. We believe an important element in the success of any joint venture is a solid relationship betweenthe members of that joint venture. If there is a change in ownership, a change of control, a change inmanagement or management philosophy, a change in business strategy or another event with respect to amember of a joint venture that adversely impacts the relationship between the joint venture members, itcould adversely impact that joint venture. In addition, joint ventures necessarily involve special risks. Whetheror not we hold a majority interest or maintain operational control in a joint venture, our partners may haveeconomic or business interests or goals that are inconsistent with our interests or goals. For example, ourpartners may exercise veto rights to block actions that we believe to be in our best interests, may take actioncontrary to our policies or objects with respect to our investments, or may be unable or unwilling to fulfilltheir obligations or commitments to the joint venture.
Acquisitions
We may be unable to successfully consummate, manage or integrate our acquisitions. A portion of ourgrowth has occurred through acquisitions. We may from time to time continue to seek attractiveopportunities to acquire businesses, enter into joint ventures and make other investments that arecomplementary to our existing strengths. There are no assurances, however, that any acquisitionopportunities will arise or, if they do, that they will be consummated, or that any needed additional financingfor such opportunities will be available on satisfactory terms when required. In addition, acquisitions involverisks that the businesses acquired will not perform in accordance with expectations, that business judgmentsconcerning the value, strengths and weaknesses of businesses acquired will prove incorrect, that we mayassume unknown liabilities from the seller, that the acquired businesses may not be integrated successfullyand that the acquisitions may strain our management resources or divert management’s attention from otherbusiness concerns. International acquisitions may present unique challenges and increase our exposure tothe risks associated with foreign operations and countries. Failure to successfully integrate any of ouracquisitions may cause significant operating inefficiencies and could adversely affect our operations andfinancial condition.
17
Capital Expenditures
Our business requires capital investment and maintenance expenditures, and our capital resources may notbe adequate to provide for all of our cash requirements. Many of our operations are capital intensive. For thefive-year period ended May 31, 2013, our total capital expenditures, including acquisitions and investmentactivity, were approximately $759.8 million. Additionally, at May 31, 2013, we were obligated to makeaggregate lease payments of $29.9 million under operating lease agreements. Our business also requiresexpenditures for maintenance of our facilities. We currently believe that we have adequate resources(including cash and cash equivalents, cash provided by operating activities, availability under existing creditfacilities and unused lines of credit) to meet our cash needs for normal operating costs, capital expenditures,debt repayments, dividend payments, future acquisitions and working capital for our existing business.However, given the current challenges, uncertainty and volatility in the domestic and global economies andfinancial markets, there can be no assurance that our capital resources will be adequate to provide for all ofour cash requirements.
Litigation
We may be subject to legal proceedings or investigations, the resolution of which could negatively affect ourresults of operations and liquidity in a particular period. Our results of operations or liquidity in a particularperiod could be affected by an adverse ruling in any legal proceedings or investigations which may bepending against us or filed against us in the future. We are also subject to a variety of legal compliance risks,including, without limitation, potential claims relating to product liability, health and safety, environmentalmatters, intellectual property rights, taxes and compliance with U.S. and foreign export laws, anti-briberylaws, competition laws and sales and trading practices. While we believe that we have adopted appropriaterisk management and compliance programs to address and reduce these risks, the global and diverse natureof our operations means that these risks will continue to exist and additional legal proceedings andcontingencies may arise from time to time. A future adverse ruling or settlement or an unfavorable change inlaws, rules or regulations could have a material adverse effect on our results of operations or liquidity in aparticular period.
Accounting and Tax Estimates
We are required to make accounting and tax-related estimates, assumptions and judgments in preparing ourconsolidated financial statements, and actual results may differ materially from the estimates, assumptions andjudgments that we use. In preparing our consolidated financial statements in accordance with accountingprinciples generally accepted in the United States, we are required to make certain estimates andassumptions that affect the accounting for and recognition of assets, liabilities, revenues and expenses. Theseestimates and assumptions must be made because certain information that is used in the preparation of ourconsolidated financial statements is dependent on future events, or cannot be calculated with a high degreeof precision from data available to us. In some cases, these estimates and assumptions are particularly difficultto determine and we must exercise significant judgment. Some of the estimates, assumptions and judgmentshaving the greatest amount of uncertainty, subjectivity and complexity are related to our accounting for baddebts, returns and allowances, inventory, self-insurance reserves, derivatives, stock-based compensation,deferred tax assets and liabilities and asset impairments. Our actual results may differ materially from theestimates, assumptions and judgments that we use, which could have a material adverse effect on ourfinancial condition and results of operations.
Tax Laws and Regulations
Tax increases or changes in tax laws could adversely affect our financial results. We are subject to tax andrelated obligations in the jurisdictions in which we operate or do business, including state, local, federal andforeign taxes. The taxing rules of the various jurisdictions in which we operate or do business often are
18

complex and subject to varying interpretations. Tax authorities may challenge tax positions that we take orhistorically have taken, and may assess taxes where we have not made tax filings or may audit the tax filingswe have made and assess additional taxes. Some of these assessments may be substantial, and also mayinvolve the imposition of penalties and interest. In addition, governments could impose new taxes on us orincrease the rates at which we are taxed in the future. The payment of substantial additional taxes, penaltiesor interest resulting from tax assessments, or the imposition of any new taxes, could materially and adverselyimpact our results of operations, financial condition and cash flows. In addition, our provision for incometaxes and cash tax liability in the future could be adversely affected by changes in U.S. tax laws. Potentialchanges that may adversely affect our financial results include, without limitation, decreasing the ability ofU.S. companies to receive a tax credit for foreign taxes paid or to defer the U.S. deduction of expenses inconnection with investments made in other countries.
Claims and Insurance
Adverse claims experience, to the extent not covered by insurance, may have an adverse effect on ourfinancial results. We self-insure a significant portion of our potential liability for workers’ compensation,product liability, general liability, property liability, automobile liability and employee medical claims. In orderto reduce risk, we purchase insurance from highly-rated, licensed insurance carriers that cover most claims inexcess of the applicable deductible or retained amounts. We maintain reserves for the estimated cost toresolve open claims as well as an estimate of the cost of claims that have been incurred but not reported. Theoccurrence of significant claims, our failure to adequately reserve for such claims, a significant cost increase tomaintain our insurance or the failure of our insurance providers to perform could have an adverse impact onour financial condition and results of operations.
Principal Shareholder
Our principal shareholder may have the ability to exert significant influence in matters requiring ashareholder vote and could delay, deter or prevent a change in control of Worthington Industries. Pursuant toour charter documents, certain matters such as those in which a person would attempt to acquire or takecontrol of the Company, must be approved by the vote of the holders of common shares representing at least75% of Worthington Industries’ outstanding voting power. Approximately 25% of our outstanding commonshares are beneficially owned, directly or indirectly, by John P. McConnell, our Chairman of the Board andChief Executive Officer. As a result of his beneficial ownership of our common shares, Mr. McConnell may havethe ability to exert significant influence in these matters and other proposals upon which our shareholdersmay vote.
Key Employees
If we lose our senior management or other key employees, our business may be adversely affected. Ourability to successfully operate, grow our business and implement our business strategies is largely dependenton the efforts, abilities and services of our senior management and other key employees. The loss of any ofthese individuals or our inability to attract, train and retain additional personnel could reduce thecompetitiveness of our business or otherwise impair our operations or prospects. Our future success will alsodepend, in part, on our ability to attract and retain qualified personnel, such as engineers and other skilledtechnicians, who have experience in the application of our products and are knowledgeable about ourbusiness, markets and products. We cannot assure that we will be able to retain our existing seniormanagement personnel or other key employees or attract additional qualified personnel when needed. Wehave not entered into any formal employment agreements or change in control agreements with ourexecutive officers, and the loss of any member of our management team could adversely impact our businessand operations. Additionally, we may modify our management structure from time to time or reduce ouroverall workforce as we did in certain operating segments during the recent economic downturn, which maycreate marketing, operational and other business risks.
19
Credit Ratings
Ratings agencies may downgrade our credit ratings, which could make it more difficult for us to raise capitaland could increase our financing costs. Any downgrade in our credit ratings may make raising capital moredifficult, may increase the cost and affect the terms of future borrowings, may affect the terms under whichwe purchase goods and services and may limit our ability to take advantage of potential businessopportunities. In addition, the interest rate on our revolving credit facility is tied to our credit ratings, and anydowngrade of our credit ratings would likely result in an increase in the current cost of borrowings under ourrevolving credit facility.
Difficult Financial Markets
Should we be required to raise capital in the future, we could face higher borrowing costs, less availablecapital, more stringent terms and tighter covenants or, in extreme conditions, an inability to raisecapital. Although we currently have significant borrowing availability under our existing credit facilities,should those facilities become unavailable due to covenant or other defaults, or should we otherwise berequired to raise capital outside our existing facilities, given the current uncertainty and volatility in the U.S.and global credit and capital markets, our ability to access capital and the terms under which we do so maybe negatively impacted. Any adverse change in our access to capital or the terms of our borrowings, includingincreased costs, could have a negative impact on our financial condition.
Environmental, Health and Safety
We may incur additional costs related to environmental and health and safety matters. Our operations andfacilities are subject to a variety of federal, state, local and foreign laws and regulations relating to theprotection of the environment and human health and safety. Failure to maintain or achieve compliance withthese laws and regulations or with the permits required for our operations could result in increased costs andcapital expenditures and potentially fines and civil or criminal sanctions, third-party claims for propertydamage or personal injury, cleanup costs or temporary or permanent discontinuance of operations. Overtime, we and predecessor operators of our facilities have generated, used, handled and disposed of hazardousand other regulated wastes. Environmental liabilities, including cleanup obligations, could exist at ourfacilities or at off-site locations where materials from our operations were disposed of or at facilities we havedivested, which could result in future expenditures that cannot be currently quantified and which couldreduce our profits and cash flow. We may be held strictly liable for any contamination of these sites, and theamount of any such liability could be material. Under the “joint and several” liability principle of certainenvironmental laws, we may be held liable for all remediation costs at a particular site, even with respect tocontamination for which we are not responsible. Changes in environmental and human health and safetylaws, rules, regulations or enforcement policies could have a material adverse effect on our business, financialcondition or results of operations.
Legislation and Regulations
Certain proposed legislation and regulations may have an adverse impact on the economy in general and inour markets specifically, which may adversely affect our business. Our business may be negatively impacted bya variety of new or proposed legislation or regulations. For example, legislation and regulations proposingincreases in taxation on, or heightened regulation of, carbon or other greenhouse gas emissions may result inhigher prices for steel, higher prices for utilities required to run our facilities, higher fuel costs for us and oursuppliers and distributors and other adverse impacts. See the immediately following risk factor for additionalinformation regarding legislation and regulations concerning climate change and greenhouse gas emissions.To the extent that new legislation or regulations increase our costs, we may not be able to fully pass thesecosts on to our customers without a resulting decline in sales and adverse impact to our profits. Likewise, tothe extent new legislation or regulations would have an adverse effect on the economy, our markets or theability of domestic businesses to compete against foreign operations, it could also have an adverse impacton us.
20
Legislation or regulations concerning climate change and greenhouse gas emissions may negatively affectour results of operations. Energy is a significant input in a number of our operations and products, and manybelieve that consumption of energy derived from fossil fuels is a contributor to global warming. A number ofgovernments and governmental bodies have introduced or are contemplating legislative and regulatorychanges in response to the potential impacts of climate change and greenhouse gas emissions. The EuropeanUnion has established greenhouse gas regulations, and Canada has published details of a regulatoryframework for greenhouse gas emissions. The U.S. Environmental Protection Agency has issued and proposedregulations addressing greenhouse gas emissions, including regulations which will require reporting ofgreenhouse gas emissions from large sources and suppliers in the United States. Legislation previously hasbeen introduced in the U.S. Congress aimed at limiting carbon emissions from companies that conductbusiness that is carbon-intensive. Among other potential items, such bills could include a system of carbonemission credits issued to certain companies, similar to the European Union’s existing cap-and-trade system.Several U.S. states have also adopted, and other states may in the future adopt, legislation or regulationsimplementing state-wide or regional cap-and-trade systems that apply to some or all industries that emitgreenhouse gases. It is impossible at this time to forecast what the final regulations and legislation, if any, willlook like and the resulting effects on our business and operations. Depending upon the terms of any suchregulations or legislation, however, we could suffer a negative financial impact as a result of increased energy,environmental and other costs necessary to comply with limitations on greenhouse gas emissions, and wemay see changes in the margins of our greenhouse gas-intensive and energy-intensive assets. In addition,depending upon whether similar limitations are imposed globally, the regulations and legislation couldnegatively impact our ability to compete with foreign companies situated in areas not subject to suchlimitations. Many of our customers in the United States, Canada and Europe may experience similar impacts,which could result in decreased demand for our products.
Legislation, regulations or other events which could adversely affect the ability or cost to recover natural gasor oil may negatively affect our business. In recent years, increasing amounts of oil and natural gas have beenproduced through the hydraulic fracking process throughout the United States and North America. This hasresulted in decreasing energy costs, particularly for natural gas and similar energy products. This reductionhas been a boon for the U.S. economy and has helped lower energy costs for U.S. businesses. Also, some ofour recent acquisitions supply products which are used by companies engaged in hydraulic fracking. Iflegislation, regulations or other events limit the ability to recover such fuels through hydraulic fracking orincrease the cost thereof, it could have a negative impact on our business, the U.S. economy and U.S.businesses in general, which could result in decreased demand for our products or otherwise negativelyimpact our business.
The implementation of the provisions of the new health care law could adversely affect our business. As theprovisions of the Patient Protection and Affordable Care Act begin to be fully implemented and governmentsand employers take action related thereto, the impact on U.S. health care costs are unknown. Many projectthat there will be a significant increase in health care costs which could adversely impact the U.S. economyand U.S. businesses which could result in a decreased demand for our products. Further, the Company’shealth care costs could increase which would negatively impact our profits.
Seasonality
Our operations have been subject to seasonal fluctuations that may impact our cash flows for a particularperiod. Sales are generally strongest in the fourth quarter of the fiscal year when all of our businesssegments are normally operating at seasonal peaks. Historically, our sales are generally weaker in the thirdquarter of the fiscal year, primarily due to reduced activity in the building and construction industry as a resultof the colder, more inclement weather, as well as customer plant shutdowns in the automotive industry dueto holidays. Our quarterly results may also be affected by the timing of large customer orders. Consequently,our cash flow from operations may fluctuate significantly from quarter to quarter. If, as a result of any suchfluctuation, our quarterly cash flows were significantly reduced, we may be unable to service our
21
indebtedness or maintain compliance with certain covenants under our credit facilities. A default under any ofthe documents governing our indebtedness could prevent us from borrowing additional funds, limit ourability to pay interest or principal and allow our lenders to declare the amounts outstanding to beimmediately due and payable and to exercise certain other remedies.
Impairment Charges
Continued or enhanced weakness or instability in the economy, our markets or our results of operations couldresult in future asset impairments, which would reduce our reported earnings and net worth. We review thecarrying value of our long-lived assets, excluding purchased goodwill and intangible assets with indefinitelives, for impairment whenever events or changes in circumstances indicate that the carrying value of an assetor asset group may not be recoverable. Impairment testing involves a comparison of the sum of theundiscounted future cash flows of the asset or asset group to its respective carrying amount. If the sum of theundiscounted future cash flows exceeds the carrying amount, then no impairment exists. If the carryingamount exceeds the sum of the undiscounted future cash flows, then a second step is performed todetermine the amount of impairment, if any, to be recognized. For long-lived assets other than goodwill, animpairment loss is recognized to the extent that the carrying amount of the asset or asset group exceeds fairvalue. Goodwill and intangible assets with indefinite lives are tested for impairment annually, during thefourth quarter, or more frequently if events or changes in circumstances indicate that impairment may bepresent. The goodwill impairment test consists of comparing the fair value of each reporting unit, determinedusing discounted cash flows, to each reporting unit’s respective carrying value. If the estimated fair value ofreporting unit exceeds its carrying value, there is no impairment. If the carrying amount of the reporting unitexceeds its estimated fair value, a goodwill impairment is indicated. The amount of the impairment isdetermined by comparing the fair value of the net assets of the reporting unit, excluding goodwill, to itsestimated fair value, with the difference representing the implied fair value of the goodwill. If the implied fairvalue of the goodwill is lower than its carrying value, the difference is recorded as an impairment charge inour consolidated statement of earnings. Economic conditions remain fragile, particularly in Europe and thepossibility remains that the domestic or global economies, or certain industry sectors that are key to our sales,may deteriorate. If certain of our business segments are adversely affected by the challenging and volatileeconomic and financial conditions, we may be required to record additional impairments, which wouldnegatively impact our results of operations.
Item 1B. — Unresolved Staff Comments
None.
Item 2. — Properties.
General
Our principal corporate offices are located in an office building in Columbus, Ohio, containingapproximately 117,700 square feet, which houses the principal corporate offices of the Pressure Cylinders andConstruction Services operating segments. We purchased this office building on June 22, 2012. Our SteelProcessing corporate offices are located next to the corporate offices in a leased office building in Columbus,Ohio, containing approximately 30,000 square feet. We also own three facilities used for administrative andmedical purposes in Columbus, Ohio, containing an aggregate of approximately 166,000 square feet. As ofMay 31, 2013, we owned or leased a total of approximately 8,000,000 square feet of space for our operations,of which approximately 7,000,000 square feet (7,600,000 square feet with warehouses) was devoted tomanufacturing, product distribution and sales offices. Major leases contain renewal options for periods of upto 10 years. For information concerning rental obligations, refer to “Item 7. – Management’s Discussion andAnalysis of Financial Condition and Results of Operations – Contractual Cash Obligations and OtherCommercial Commitments” as well as “Item 8. – Financial Statements and Supplementary Data – Notes to
22
Consolidated Financial Statements – Note R – Operating Leases” of this Annual Report on Form 10-K. Webelieve the distribution and office facilities provide adequate space for our operations and are wellmaintained and suitable.
Excluding joint ventures, we operate 36 manufacturing facilities and 12 warehouses. Thesemanufacturing facilities are well maintained and in good operating condition, and are believed to besufficient to meet current needs.
Steel Processing
Our Steel Processing operating segment operates 11 manufacturing facilities, 10 of which are wholly-owned, containing a total of approximately 2,500,000 square feet, and one that is leased, containingapproximately 150,000 square feet. These facilities are located in Alabama, California, Indiana, Maryland,Michigan (2), and Ohio (5). This operating segment also owns one warehouse in Ohio, containingapproximately 110,000 square feet, one warehouse in Michigan, containing approximately 100,000 squarefeet, and one warehouse in California, containing approximately 60,000 square feet. As noted above, thisoperating segment’s corporate offices are located in Columbus, Ohio.
Pressure Cylinders
Our Pressure Cylinders operating segment operates 17 manufacturing facilities, 15 of which are wholly-owned, containing a total of approximately 2,300,000 square feet, and two that are leased, containingapproximately 350,000 square feet. These facilities are located in California, Kansas (2), Mississippi, NorthCarolina, New York, Ohio (5), Wisconsin, Austria, Canada, Poland (2) and Portugal. This operating segment alsooperates two owned warehouses, one in Austria and one in Poland, containing a total of approximately90,000 square feet, and three leased warehouses, two in Ohio and one in Canada, containing a total ofapproximately 130,000 square feet. As noted above, this operating segment’s corporate offices are located inColumbus, Ohio.
Engineered Cabs
Our Engineered Cabs operating segment operates four owned manufacturing facilities containing a totalof approximately 1,000,000 square feet. These facilities are located in Iowa, South Carolina, South Dakota, andTennessee. This operating segment also operates one owned warehouse in Iowa and one leased warehousein Tennessee containing a total of approximately 20,000 square feet. This operating segment’s corporateoffices are located in Watertown, South Dakota.
Other
Steel Packaging operates three facilities, one each in Indiana, Ohio and Pennsylvania. The manufacturingfacilities in Indiana and Pennsylvania are leased and contain a total of approximately 175,000 square feet; andthe facility located in Ohio is owned and contains approximately 21,000 square feet. The ConstructionServices operating segment, which includes Mid-Rise Construction and Military Construction business units,operates manufacturing facilities in Ohio and Tennessee containing approximately 220,000 square feet andleases approximately 18,300 square feet for administrative offices in Hawaii and Ohio. Additionally, weretained Gerstenslager’s manufacturing facility in Wooster, Ohio, which is subject to a lease agreement withArtiFlex and contains approximately 900,000 square feet.
Joint Ventures
The Spartan consolidated joint venture owns and operates one manufacturing facility in Michigan, theWEI joint venture leases one manufacturing facility in Fremont, Ohio, and the WNCL consolidated jointventure owns and operates a manufacturing facility in India. The unconsolidated joint ventures operate atotal of 47 manufacturing facilities, located in Alabama, California (2), Connecticut, Florida (2), Georgia, Hawaii,
23
Illinois, Kentucky, Maryland (2), Michigan (9), Nevada, Ohio (7), Tennessee, and Texas (2) domestically, and inChina (2), France, India (2), Mexico (7), Spain and the United Kingdom (2), internationally.
Item 3. — Legal Proceedings
The Company is involved in various judicial and administrative proceedings as both plaintiff anddefendant, arising in the ordinary course of business. The Company does not believe that any suchproceedings will have a material adverse effect on its business, financial position, results of operation or cashflows.
Item 4. — Mine Safety Disclosures
Not Applicable
Supplemental Item — Executive Officers of the Registrant
The following table lists the names, positions held and ages of the individuals serving as executiveofficers of the Registrant as of July 30, 2013.
Name Age Position(s) with the RegistrantPresent Office
Held Since
John P. McConnell 59 Chairman of the Board and Chief Executive Officer;a Director 1996
Mark A. Russell 50 President and Chief Operating Officer 2012
B. Andrew Rose 43 Vice President and Chief Financial Officer 2008
Dale T. Brinkman 60 Vice President-Administration, General Counsel andSecretary 2000
Terry M. DyerAndrew J. Billman
4645
Vice President-Human ResourcesPresident-Worthington Cylinder Corporation
20122011
Geoffrey G. Gilmore 41 President-The Worthington Steel Company 2012
Matthew A. Lockard 44 Vice President-Corporate Development and Treasurer 2009
Catherine M. Lyttle 54 Vice President-Communications and InvestorRelations 2009
Eric M. Smolenski 43 Chief Information Officer 2012
Richard G. Welch 55 Controller 2000
Virgil L. Winland 65 Senior Vice President-Manufacturing 2001
John P. McConnell has served as Worthington Industries’ Chief Executive Officer since June 1993, as adirector of Worthington Industries continuously since 1990, and as Chairman of the Board of WorthingtonIndustries since September 1996. Mr. McConnell serves as the Chair of the Executive Committee ofWorthington Industries’ Board of Directors. He served in various positions with the Company from 1975 toJune 1993.
Mark A. Russell has served as President and Chief Operating Officer of Worthington Industries sinceAugust 1, 2012. From February 2007 to July 31, 2012, Mr. Russell served as President of The Worthington SteelCompany. From August 2004 until February 2007, Mr. Russell was a partner in Russell & Associates, anacquisition group formed to acquire aluminum products companies.
B. Andrew ‘Andy’ Rose has served as Vice President and Chief Financial Officer of Worthington Industries sinceDecember 2008. From 2007 to 2008, he served as a senior investment professional with MCG Capital Corporation, aprivate equity firm specializing in investments in middle market companies; and from 2002 to 2007, he was afounding partner at Peachtree Equity Partners, L.P., a private equity firm backed by Goldman Sachs.
24
Dale T. Brinkman has served as Worthington Industries’ Vice President-Administration since December1998 and as Worthington Industries’ General Counsel since September 1982. He has been Secretary ofWorthington Industries since September 2000 and served as Assistant Secretary from September 1982 toSeptember 2000.
Terry M. Dyer has served as Vice President-Human Resources of Worthington Industries since June 2012.From October 2009 to June 2012, he served as the Vice President-Human Resources for our WAVE jointventure in Malvern, Pennsylvania. Mr. Dyer served as Senior Human Resources Generalist for Armstrong WorldIndustries, Inc. (“Armstrong”) from November 2004 to October 2009. Armstrong is a global leader in thedesign and manufacture of floors, ceilings and cabinets.
Andrew J. Billman has served as President of Worthington Cylinder Corporation since August 2011. FromFebruary 2010 to August 2011, he served as Vice President-Purchasing for Worthington Industries. He servedas Regional Sales Manager of The Worthington Steel Company from August 2008 to January 2010 and asNational Account Manager from August 2006 to July 2008. Mr. Billman served as Automotive AccountsManager of The Worthington Steel Company from August 1998 to December 2000; and in various otherpositions with the Company from 1991 to January 2001. From January 2001 to July 2006, he was employedwith A.M.S.E.A., Inc., a private manufacturing company that stamped components, located in Michigan.
Geoffrey G. Gilmore has served as President of The Worthington Steel Company since August 2012. FromJuly 2011 to July 2012, he served as Vice President-Purchasing for Worthington Industries responsible for allpurchasing efforts across the Company including steel, commodity and OEM purchasing, logistics andoutside processing. From April 2010 to July 2011, he served as General Manager of The Worthington SteelCompany’s Delta, Ohio facility, responsible for overseeing its manufacturing and sales operations; and fromJune 2006 to February 2010, he served as Director of Automotive Sales for The Worthington Steel Company.Mr. Gilmore served in various other positions with the Company from 1998 to June 2006.
Matthew A. Lockard has served as Treasurer of Worthington Industries since February 2009 and as VicePresident-Corporate Development of Worthington Industries since July 2005. From April 2001 to July 2005, heserved as Vice President-Global Business Development for Worthington Cylinder Corporation. Mr. Lockardserved in various other positions with the Company from January 1994 to April 2001.
Catherine M. Lyttle has served as Vice President of Communications and Investor Relations of WorthingtonIndustries since April 2009. She served as Vice President of Communications of Worthington Industries fromJanuary 1999 to April 2009. Ms. Lyttle served as Vice President of Marketing for the Columbus Chamber ofCommerce from 1987 to September 1997 and as Vice President of JMAC Hockey from 1997 to 1999.
Eric M. Smolenski has served as Chief Information Officer of Worthington Industries since June 2012. Heserved as Vice President-Human Resources of Worthington Industries from December 2005 through June2012. From January 2001 to December 2005, Mr. Smolenski served as the Director of Corporate HumanResources Services of Worthington Industries, and he served in various other positions with the Companyfrom January 1994 to January 2001.
Richard G. Welch has served as the Corporate Controller of Worthington Industries since March 2000 andprior thereto, he served as Assistant Controller from August 1999 to March 2000. He served as PrincipalFinancial Officer of Worthington Industries on an interim basis from September 2008 to December 2008.
Virgil L. Winland has served as Senior Vice President-Manufacturing of Worthington Industries sinceJanuary 2001. He served in various other positions with the Company from 1971 to January 2001, includingPresident of Worthington Cylinder Corporation from June 1998 through January 2001.
Executive officers serve at the pleasure of the directors of the Registrant. There are no family relationshipsamong any of the Registrant’s executive officers or directors. No arrangements or understandings exist pursuantto which any individual has been, or is to be, selected as an executive officer of the Registrant.
25
PART II
Item 5. — Market for Registrant’s Common Equity, Related Stockholder Matters and Issuer Purchasesof Equity Securities
Common Shares Information
The common shares of Worthington Industries, Inc. (“Worthington Industries”) trade on the New YorkStock Exchange (“NYSE”) under the symbol “WOR” and are listed in most newspapers as “WorthgtnInd.” As ofJuly 22, 2013, Worthington Industries had 6,355 registered shareholders. The following table sets forth (i) thelow and high closing prices and the closing price per share for Worthington Industries’ common shares foreach quarter of fiscal 2012 and fiscal 2013, and (ii) the cash dividends per share declared on WorthingtonIndustries’ common shares for each quarter of fiscal 2012 and fiscal 2013.
Market PriceCash
DividendsDeclaredLow High Closing
Fiscal 2012Quarter Ended
August 31, 2011 $14.98 $23.45 $16.25 $0.12November 30, 2011 $13.21 $18.68 $17.59 $0.12February 29, 2012 $15.58 $19.24 $16.87 $0.12May 31, 2012 $16.25 $19.75 $16.25 $0.12
Fiscal 2013Quarter Ended
August 31, 2012 $15.88 $23.16 $20.90 $0.13November 30, 2012 $20.86 $24.27 $23.56 $0.13February 28, 2013 $22.93 $29.10 $28.34 $0.26May 31, 2013 $28.02 $35.59 $34.38 $ -
Dividends are declared at the discretion of Worthington Industries’ Board of Directors. WorthingtonIndustries’ Board of Directors declared quarterly dividends of $0.12 per common share in fiscal 2012 and of$0.13 per common share for the first and second quarters in fiscal 2013. On December 10, 2012, the Boarddeclared an accelerated third and fourth quarter cash dividend totaling $0.26 per common share. Thedividend was paid on December 28, 2012 to shareholders of record as of December 21, 2012. On June 26,2013, the Board of Directors declared a quarterly dividend of $0.15 per common share for the first quarter offiscal 2014. This dividend is payable on September 27, 2013, to shareholders of record as of September 13,2013.
The Board of Directors reviews the dividend on a quarterly basis and establishes the dividend rate basedupon Worthington Industries’ financial condition, results of operations, capital requirements, current andprojected cash flows, business prospects and other factors which the directors may deem relevant. WhileWorthington Industries has paid a dividend every quarter since becoming a public company in 1968, there isno guarantee this will continue in the future.
Shareholder Return Performance
The following information in this Item 5 of this Annual Report on Form 10-K is not deemed to be“soliciting material” or to be “filed” with the Securities and Exchange Commission or subject to Regulation14A or Regulation 14C under the Securities Exchange Act of 1934, as amended (the “Exchange Act”), or to theliabilities of Section 18 of the Exchange Act, and will not be deemed to be incorporated by reference into anyfiling under the Securities Act of 1933, as amended, or the Exchange Act, except to the extent we specificallyincorporate such information into such a filing.
26
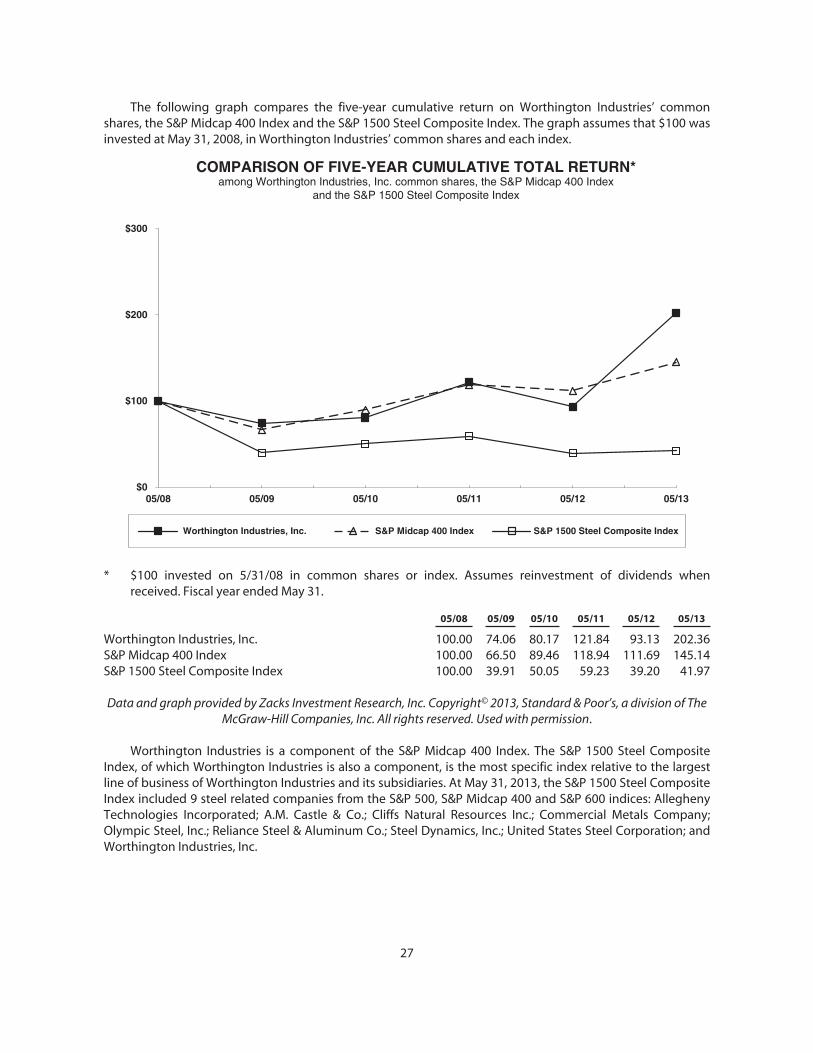
The following graph compares the five-year cumulative return on Worthington Industries’ commonshares, the S&P Midcap 400 Index and the S&P 1500 Steel Composite Index. The graph assumes that $100 wasinvested at May 31, 2008, in Worthington Industries’ common shares and each index.
Worthington Industries, Inc. S&P Midcap 400 Index S&P 1500 Steel Composite Index
COMPARISON OF FIVE-YEAR CUMULATIVE TOTAL RETURN*among Worthington Industries, Inc. common shares, the S&P Midcap 400 Index
and the S&P 1500 Steel Composite Index
05/1305/08 05/09 05/10 05/11 05/12$0
$100
$300
$200
* $100 invested on 5/31/08 in common shares or index. Assumes reinvestment of dividends whenreceived. Fiscal year ended May 31.
05/08 05/09 05/10 05/11 05/12 05/13
Worthington Industries, Inc. 100.00 74.06 80.17 121.84 93.13 202.36S&P Midcap 400 Index 100.00 66.50 89.46 118.94 111.69 145.14S&P 1500 Steel Composite Index 100.00 39.91 50.05 59.23 39.20 41.97
Data and graph provided by Zacks Investment Research, Inc. Copyright© 2013, Standard & Poor’s, a division of TheMcGraw-Hill Companies, Inc. All rights reserved. Used with permission.
Worthington Industries is a component of the S&P Midcap 400 Index. The S&P 1500 Steel CompositeIndex, of which Worthington Industries is also a component, is the most specific index relative to the largestline of business of Worthington Industries and its subsidiaries. At May 31, 2013, the S&P 1500 Steel CompositeIndex included 9 steel related companies from the S&P 500, S&P Midcap 400 and S&P 600 indices: AlleghenyTechnologies Incorporated; A.M. Castle & Co.; Cliffs Natural Resources Inc.; Commercial Metals Company;Olympic Steel, Inc.; Reliance Steel & Aluminum Co.; Steel Dynamics, Inc.; United States Steel Corporation; andWorthington Industries, Inc.
27
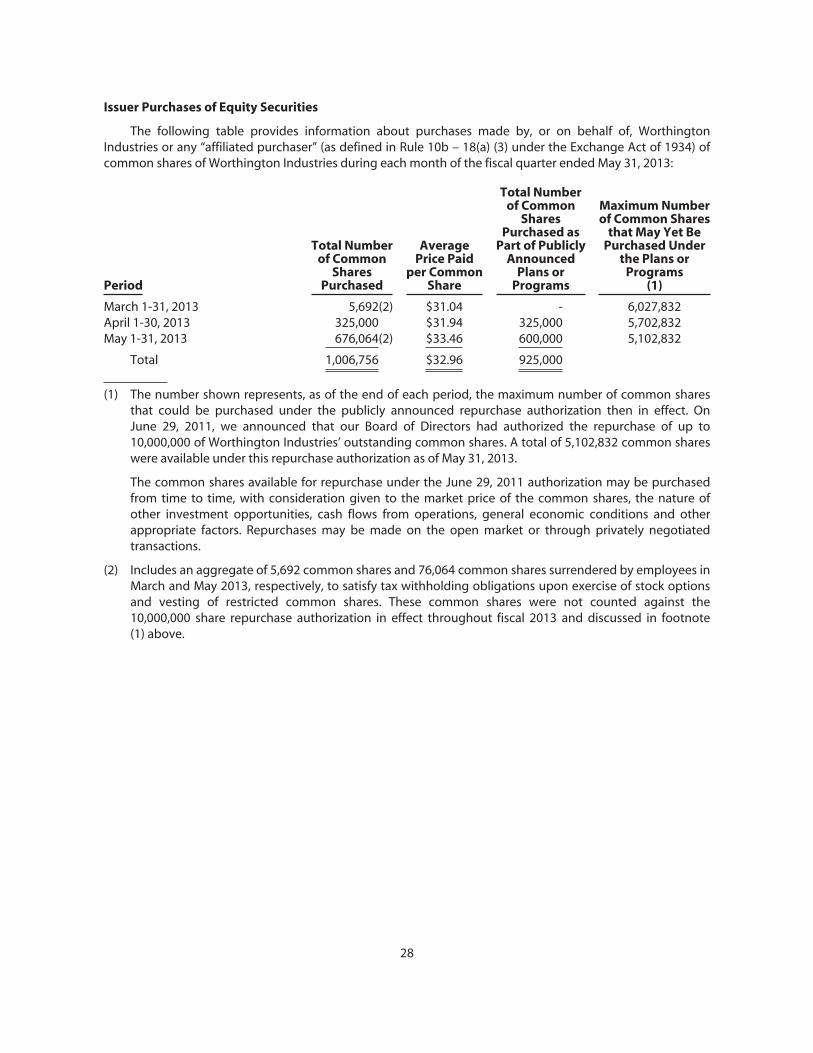
Issuer Purchases of Equity Securities
The following table provides information about purchases made by, or on behalf of, WorthingtonIndustries or any “affiliated purchaser” (as defined in Rule 10b – 18(a) (3) under the Exchange Act of 1934) ofcommon shares of Worthington Industries during each month of the fiscal quarter ended May 31, 2013:
Period
Total Numberof Common
SharesPurchased
AveragePrice Paid
per CommonShare
Total Numberof Common
SharesPurchased as
Part of PubliclyAnnounced
Plans orPrograms
Maximum Numberof Common Shares
that May Yet BePurchased Under
the Plans orPrograms
(1)
March 1-31, 2013 5,692(2) $31.04 - 6,027,832April 1-30, 2013 325,000 $31.94 325,000 5,702,832May 1-31, 2013 676,064(2) $33.46 600,000 5,102,832
Total 1,006,756 $32.96 925,000
(1) The number shown represents, as of the end of each period, the maximum number of common sharesthat could be purchased under the publicly announced repurchase authorization then in effect. OnJune 29, 2011, we announced that our Board of Directors had authorized the repurchase of up to10,000,000 of Worthington Industries’ outstanding common shares. A total of 5,102,832 common shareswere available under this repurchase authorization as of May 31, 2013.
The common shares available for repurchase under the June 29, 2011 authorization may be purchasedfrom time to time, with consideration given to the market price of the common shares, the nature ofother investment opportunities, cash flows from operations, general economic conditions and otherappropriate factors. Repurchases may be made on the open market or through privately negotiatedtransactions.
(2) Includes an aggregate of 5,692 common shares and 76,064 common shares surrendered by employees inMarch and May 2013, respectively, to satisfy tax withholding obligations upon exercise of stock optionsand vesting of restricted common shares. These common shares were not counted against the10,000,000 share repurchase authorization in effect throughout fiscal 2013 and discussed in footnote(1) above.
28
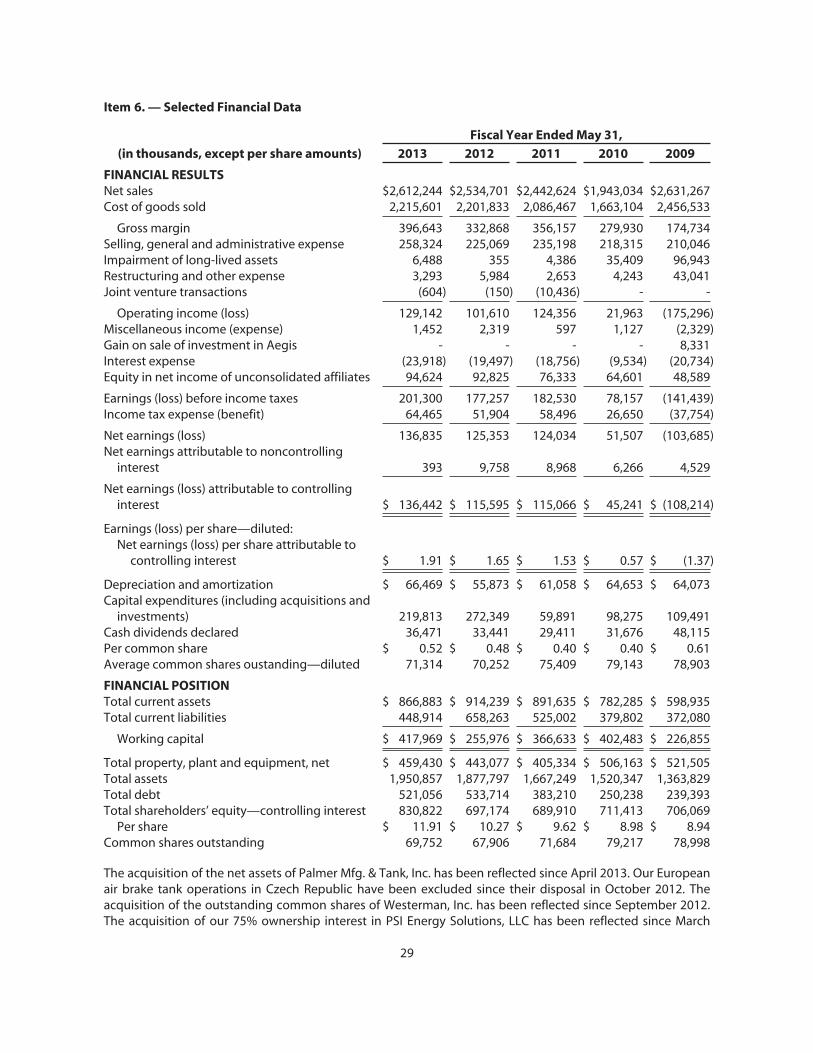
Item 6. — Selected Financial Data
Fiscal Year Ended May 31,
(in thousands, except per share amounts) 2013 2012 2011 2010 2009
FINANCIAL RESULTSNet sales $2,612,244 $2,534,701 $2,442,624 $1,943,034 $2,631,267Cost of goods sold 2,215,601 2,201,833 2,086,467 1,663,104 2,456,533
Gross margin 396,643 332,868 356,157 279,930 174,734Selling, general and administrative expense 258,324 225,069 235,198 218,315 210,046Impairment of long-lived assets 6,488 355 4,386 35,409 96,943Restructuring and other expense 3,293 5,984 2,653 4,243 43,041Joint venture transactions (604) (150) (10,436) - -
Operating income (loss) 129,142 101,610 124,356 21,963 (175,296)Miscellaneous income (expense) 1,452 2,319 597 1,127 (2,329)Gain on sale of investment in Aegis - - - - 8,331Interest expense (23,918) (19,497) (18,756) (9,534) (20,734)Equity in net income of unconsolidated affiliates 94,624 92,825 76,333 64,601 48,589
Earnings (loss) before income taxes 201,300 177,257 182,530 78,157 (141,439)Income tax expense (benefit) 64,465 51,904 58,496 26,650 (37,754)
Net earnings (loss) 136,835 125,353 124,034 51,507 (103,685)Net earnings attributable to noncontrolling
interest 393 9,758 8,968 6,266 4,529
Net earnings (loss) attributable to controllinginterest $ 136,442 $ 115,595 $ 115,066 $ 45,241 $ (108,214)
Earnings (loss) per share—diluted:Net earnings (loss) per share attributable to
controlling interest $ 1.91 $ 1.65 $ 1.53 $ 0.57 $ (1.37)
Depreciation and amortization $ 66,469 $ 55,873 $ 61,058 $ 64,653 $ 64,073Capital expenditures (including acquisitions and
investments) 219,813 272,349 59,891 98,275 109,491Cash dividends declared 36,471 33,441 29,411 31,676 48,115Per common share $ 0.52 $ 0.48 $ 0.40 $ 0.40 $ 0.61Average common shares oustanding—diluted 71,314 70,252 75,409 79,143 78,903
FINANCIAL POSITIONTotal current assets $ 866,883 $ 914,239 $ 891,635 $ 782,285 $ 598,935Total current liabilities 448,914 658,263 525,002 379,802 372,080
Working capital $ 417,969 $ 255,976 $ 366,633 $ 402,483 $ 226,855
Total property, plant and equipment, net $ 459,430 $ 443,077 $ 405,334 $ 506,163 $ 521,505Total assets 1,950,857 1,877,797 1,667,249 1,520,347 1,363,829Total debt 521,056 533,714 383,210 250,238 239,393Total shareholders’ equity—controlling interest 830,822 697,174 689,910 711,413 706,069
Per share $ 11.91 $ 10.27 $ 9.62 $ 8.98 $ 8.94Common shares outstanding 69,752 67,906 71,684 79,217 78,998
The acquisition of the net assets of Palmer Mfg. & Tank, Inc. has been reflected since April 2013. Our Europeanair brake tank operations in Czech Republic have been excluded since their disposal in October 2012. Theacquisition of the outstanding common shares of Westerman, Inc. has been reflected since September 2012.The acquisition of our 75% ownership interest in PSI Energy Solutions, LLC has been reflected since March
29
2012. The acquisition of the outstanding voting interests of Angus Industries, Inc. has been reflected sinceDecember 2011. The acquisition of the propane fuel cylinders business of The Coleman Company, Inc. hasbeen reflected since December 2011. The acquisition of the outstanding voting interests of STAKO sp. Z o.o.has been reflected since September 2011. The acquisition of substantially all of the net assets of theBernzOmatic business of Irwin Industrial Tool Company has been reflected since July 2011. Our AutomotiveBody Panels operations have been excluded from consolidated operating results since their deconsolidationin May 2011. Our Metal Framing operations have been excluded from consolidated operating results sincetheir deconsolidation in March 2011, except for our Metal Framing operations in Canada, which have beenexcluded since their disposition in November 2009. The acquisition of the net assets of three MISA Metals, Inc.steel processing locations has been reflected since March 2011. The acquisition of our 60% ownership interestin Nitin Cylinders Limited has been reflected since December 2010. The acquisition of the net assets of Hy-Mark Cylinders, Inc. has been reflected since June 2010. The acquisition of the steel processing assets ofGibraltar Industries, Inc. and its subsidiaries has been reflected since February 2010. The acquisition of themembership interests of Structural Composites Industries, LLC has been reflected since September 2009. Theacquisition of the net assets related to the businesses of Piper Metal Forming Corporation, U.S. Respiratory,Inc. and Pacific Cylinders, Inc. has been reflected since June 2009.
30
Item 7. — Management’s Discussion and Analysis of Financial Condition and Results of Operations
Selected statements contained in this “Item 7. – Management’s Discussion and Analysis of Financial Conditionand Results of Operations” constitute “forward-looking statements” as that term is used in the Private SecuritiesLitigation Reform Act of 1995. Such forward-looking statements are based, in whole or in part, on management’sbeliefs, estimates, assumptions and currently available information. For a more detailed discussion of whatconstitutes a forward-looking statement and of some of the factors that could cause actual results to differmaterially from such forward-looking statements, please refer to the “Safe Harbor Statement” in the beginning ofthis Annual Report on Form 10-K and “Part I—Item 1A.—Risk Factors” of this Annual Report on Form 10-K.
Introduction
Worthington Industries, Inc., together with its subsidiaries (collectively, “we,” “our,” “Worthington,” or the“Company”), is primarily a diversified metals manufacturing company, focused on value-added steelprocessing and manufactured metal products. Our manufactured metal products include: pressure cylinderproducts such as propane, oxygen, refrigerant and industrial cylinders, hand torches, camping cylinders,scuba tanks, compressed natural gas cylinders, helium balloon kits, and steel and fiberglass tanks andprocessing equipment for primarily the oil and gas industry; engineered cabs and operator stations and cabcomponents; framing systems for mid-rise buildings; steel pallets and racks; and, through joint ventures,suspension grid systems for concealed and lay-in panel ceilings; laser welded blanks; light gauge steelframing for commercial and residential construction; and current and past model automotive servicestampings. Our number one goal is to increase shareholder value, which we seek to accomplish by optimizingexisting operations, developing and commercializing new products and applications, and pursuing strategicacquisitions and joint ventures.
As of May 31, 2013, excluding our joint ventures, we operated 36 manufacturing facilities worldwide,principally in three reportable business segments: Steel Processing, Pressure Cylinders and Engineered Cabs.Our remaining operating segments, which do not meet the applicable aggregation criteria or quantitativethresholds for separate disclosure, are combined and reported in the “Other” category. These include theSteel Packaging, Construction Services and Worthington Energy Innovations operating segments.
During the first quarter of fiscal 2013, we made certain organizational changes impacting the internalreporting and management structure of our former Global Group operating segment. As a result of theseorganizational changes, management responsibilities and internal reporting were re-aligned into two newoperating segments: Construction Services and Worthington Energy Innovations. These organizationalchanges did not impact the composition of our reportable business segments as none of the operatingsegments impacted met the quantitative thresholds for separate disclosure.
Additionally, we no longer manage our residual metal framing assets in a manner that constitutes anoperating segment. Accordingly, the financial results and operating performance of our former Metal Framingoperating segment, including activity related to the wind-down of this business, are reported within theOther category for segment reporting purposes. Segment information reported in previous periods has beenrestated to conform to this new presentation.
We also held equity positions in 12 joint ventures, which operated 47 manufacturing facilities worldwide,as of May 31, 2013.
Overview
The Company’s performance during fiscal 2013 was strong relative to the prior year, aided by strongearnings growth in Pressure Cylinders and higher earnings from our joint ventures.
Volume trends were mixed in fiscal 2013. Pressure Cylinders volumes were up 15% driven by the impactof acquisitions. Steel Processing volumes were down 8%, but direct volumes, which carry a higher margin,
31
were up approximately 3%, after excluding volumes from the MISA Metals facilities which were wound downor sold during the past year.
Engineered Cabs continues to experience soft demand due to production declines at its top customer.We are responding to the current environment and are implementing a plan to adjust costs accordinglywithout sacrificing production capacity. We are taking advantage of these market conditions to increase thepace and focus of our transformation work, as described in more detail below.
Equity in net income of unconsolidated affiliates (“equity income”) was up a modest 2% over fiscal 2012.However, current year equity income was reduced by $5.8 million of impairment and restructuring charges,including $4.8 million related to the impairment of our 40%-owned metal framing joint venture in China.Excluding these items, equity income was up 8%. With the exception of our joint venture in China, all of ourunconsolidated joint ventures operated at a profit during fiscal 2013, led by Worthington Armstrong Venture(“WAVE”), TWB Company, L.L.C. (“TWB”), and Clarkwestern Dietrich Building Systems LLC (“ClarkDietrich”),which contributed $65.5 million, $12.6 million and $8.8 million of equity income, respectively. Additionally,we received $84.5 million in dividends from our unconsolidated joint ventures for the year.
The Company continues its strategy of optimizing existing operations and pursuing growthopportunities that add to our current businesses. We initiated the diagnostics phase of the TransformationPlan within our Pressure Cylinders operating segment in the first quarter of fiscal 2012, and these efforts areprogressing through each facility. During the first quarter of fiscal 2013, we initiated the diagnostics phase inour Engineered Cabs operating segment. For additional information regarding the Transformation Plan, referto “Item 8. – Financial Statements and Supplementary Data – Notes to Consolidated Financial Statements –NOTE D – Restructuring and Other Expense” of this Annual Report on Form 10-K.
Recent Business Developments
• On August 10, 2012, we issued $150.0 million aggregate principal amount of 12-year Senior Notesdue 2024 through a private placement with seven entities within the Prudential Capital Group. TheSenior Notes bear interest at a fixed rate of 4.6%.
• On September 17, 2012, our Pressure Cylinders operating segment acquired 100% of theoutstanding common shares of Westerman, Inc. (“Westerman”) for cash consideration ofapproximately $62.7 million and the assumption of approximately $7.3 million of debt, which wasrepaid at closing. Westerman manufactures tanks, pressure vessels and other products for the oiland gas and nuclear markets as well as hoists and other products for marine applications.Westerman also leverages its manufacturing competencies to produce pressure vessels,atmospheric tanks, controls and various custom machined components for other industrial endmarkets. Westerman became part of our Pressure Cylinders operating segment upon closing.
• On October 31, 2012, our Pressure Cylinders operating segment completed the sale of its Europeanair brake tank business to Frauenthal Automotive. Based in Hustopece, Czech Republic,Worthington Cylinders a.s. manufactured air brake tank cylinders for the European commercialvehicle market.
• On April 9, 2013, our Pressure Cylinders operating segment acquired the business of Palmer Mfg. &Tank, Inc. (“Palmer”) for cash consideration of $113.5 million. Palmer manufactures steel andfiberglass tanks and processing equipment for the oil and gas industry, and custom manufacturedfiberglass tanks for agricultural, chemical and general industrial applications. The acquired netassets became part of our Pressure Cylinders operating segment upon closing.
• During the fourth quarter of fiscal 2013, we repurchased a total of 925,000 of our common shares for$30.4 million at an average price of $32.88 per share.
32
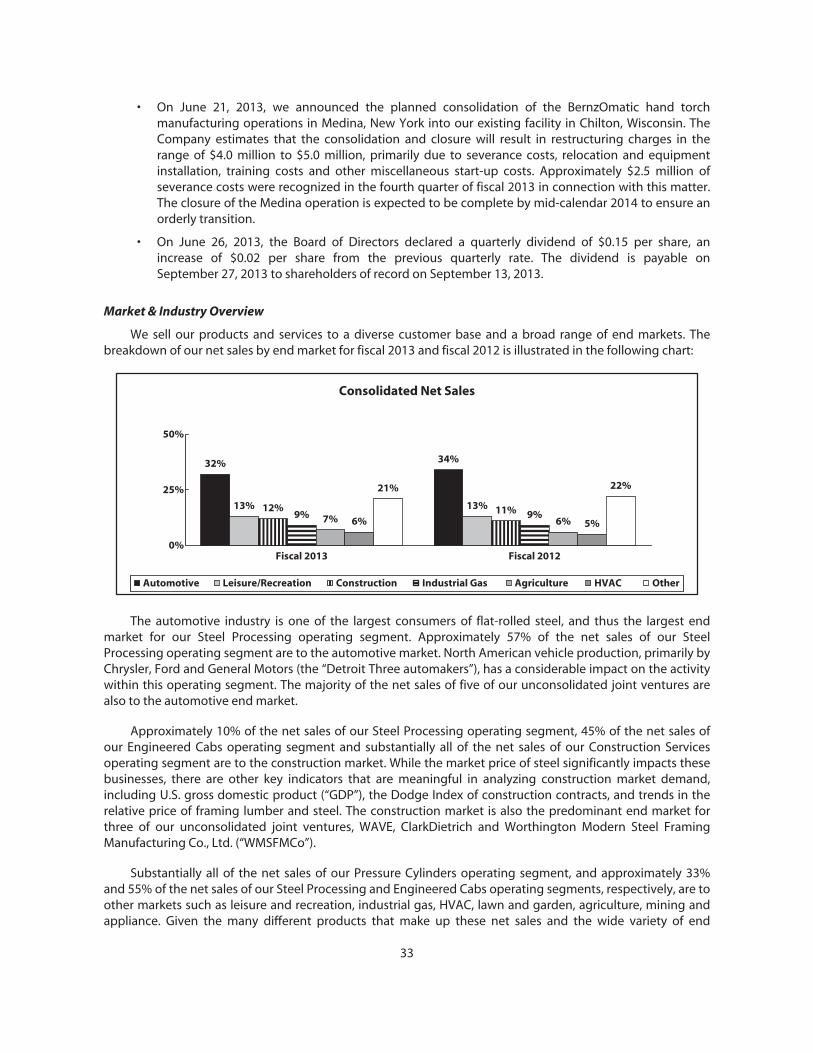
• On June 21, 2013, we announced the planned consolidation of the BernzOmatic hand torchmanufacturing operations in Medina, New York into our existing facility in Chilton, Wisconsin. TheCompany estimates that the consolidation and closure will result in restructuring charges in therange of $4.0 million to $5.0 million, primarily due to severance costs, relocation and equipmentinstallation, training costs and other miscellaneous start-up costs. Approximately $2.5 million ofseverance costs were recognized in the fourth quarter of fiscal 2013 in connection with this matter.The closure of the Medina operation is expected to be complete by mid-calendar 2014 to ensure anorderly transition.
• On June 26, 2013, the Board of Directors declared a quarterly dividend of $0.15 per share, anincrease of $0.02 per share from the previous quarterly rate. The dividend is payable onSeptember 27, 2013 to shareholders of record on September 13, 2013.
Market & Industry Overview
We sell our products and services to a diverse customer base and a broad range of end markets. Thebreakdown of our net sales by end market for fiscal 2013 and fiscal 2012 is illustrated in the following chart:
Consolidated Net Sales
Automotive Leisure/Recreation HVACAgriculture OtherConstruction Industrial Gas
Fiscal 2013 Fiscal 20120%
25%
50%
34%32%
13% 12%9% 7% 6%
21%
13% 11% 9%6% 5%
22%
The automotive industry is one of the largest consumers of flat-rolled steel, and thus the largest endmarket for our Steel Processing operating segment. Approximately 57% of the net sales of our SteelProcessing operating segment are to the automotive market. North American vehicle production, primarily byChrysler, Ford and General Motors (the “Detroit Three automakers”), has a considerable impact on the activitywithin this operating segment. The majority of the net sales of five of our unconsolidated joint ventures arealso to the automotive end market.
Approximately 10% of the net sales of our Steel Processing operating segment, 45% of the net sales ofour Engineered Cabs operating segment and substantially all of the net sales of our Construction Servicesoperating segment are to the construction market. While the market price of steel significantly impacts thesebusinesses, there are other key indicators that are meaningful in analyzing construction market demand,including U.S. gross domestic product (“GDP”), the Dodge Index of construction contracts, and trends in therelative price of framing lumber and steel. The construction market is also the predominant end market forthree of our unconsolidated joint ventures, WAVE, ClarkDietrich and Worthington Modern Steel FramingManufacturing Co., Ltd. (“WMSFMCo”).
Substantially all of the net sales of our Pressure Cylinders operating segment, and approximately 33%and 55% of the net sales of our Steel Processing and Engineered Cabs operating segments, respectively, are toother markets such as leisure and recreation, industrial gas, HVAC, lawn and garden, agriculture, mining andappliance. Given the many different products that make up these net sales and the wide variety of end
33
markets, it is very difficult to detail the key market indicators that drive this portion of our business. However,we believe that the trend in U.S. GDP growth is a good economic indicator for analyzing these operatingsegments.
We use the following information to monitor our costs and demand in our major end markets:
Fiscal Year Ended May 31,Increase /
(Decrease)
2013 2012 20112013 vs.
20122012 vs.
2011
U.S. GDP (% growth year-over-year)1 1.7% 0.5% 2.4% 1.2% -1.9%Hot-Rolled Steel ($ per ton)2 $ 616 $ 693 $ 680 ($ 77) $ 13Detroit Three Auto Build (000’s vehicles)3 8,553 8,084 7,251 469 833No. America Auto Build (000’s vehicles)3 15,716 14,242 12,756 1,474 1,486Zinc ($ per pound)4 $ 0.90 $ 0.96 $ 1.00 ($ 0.06) ($ 0.04)Natural Gas ($ per mcf)5 $ 3.49 $ 3.61 $ 4.14 ($ 0.12) ($ 0.53)On-Highway Diesel Fuel Prices ($ per gallon)6 $ 3.96 $ 3.93 $ 3.35 $ 0.03 $ 0.58
1 2012 figures based on revised actuals 2 CRU Index; period average 3 IHS Global 4 LME Zinc; periodaverage 5 NYMEX Henry Hub Natural Gas; period average 6 Energy Information Administration; periodaverage
U.S. GDP growth rate trends are generally indicative of the strength in demand and, in many cases,pricing for our products. A year-over-year increase in U.S. GDP growth rates is indicative of a strongereconomy, which generally increases demand and pricing for our products. Conversely, decreasing U.S. GDPgrowth rates generally indicate a weaker economy. Changes in U.S. GDP growth rates can also signal changesin conversion costs related to production and in selling, general and administrative (“SG&A”) expense.
The market price of hot-rolled steel is one of the most significant factors impacting our selling prices andoperating results. When steel prices fall, we typically have higher-priced material flowing through cost ofgoods sold, while selling prices compress to what the market will bear, negatively impacting our results. Onthe other hand, in a rising price environment, our results are generally favorably impacted, as lower-pricedmaterial purchased in previous periods flows through cost of goods sold, while our selling prices increase at afaster pace to cover current replacement costs.
The following table presents the average quarterly market price per ton of hot-rolled steel during fiscal2013, fiscal 2012, and fiscal 2011:
(Dollars per ton 1 ) Fiscal Year Inc / (Dec)
2013 2012 2011 2013 vs. 2012 2012 vs. 2011
1st Quarter $616 $709 $611 ($93) -13.1% $ 98 16.0%2nd Quarter $622 $660 $557 ($38) -5.8% $ 103 18.5%3rd Quarter $629 $718 $699 ($89) -12.4% $ 19 2.7%4th Quarter $595 $684 $851 ($89) -13.0% ($167) -19.6%Annual Avg. $616 $693 $680 ($77) -11.1% $ 13 1.9%
1 CRU Hot-Rolled Index
No single customer contributed more than 10% of our consolidated net sales during fiscal 2013. Whileour automotive business is largely driven by the production schedules of the Detroit Three automakers, ourcustomer base is much broader and includes other domestic manufacturers and many of their suppliers.During fiscal 2013, we continued to benefit from improving automotive production from the Detroit Threeautomakers, which experienced a 6% increase in vehicle production over the prior year. Additionally, NorthAmerican vehicle production during fiscal 2013 was up 10% over the prior year.
34
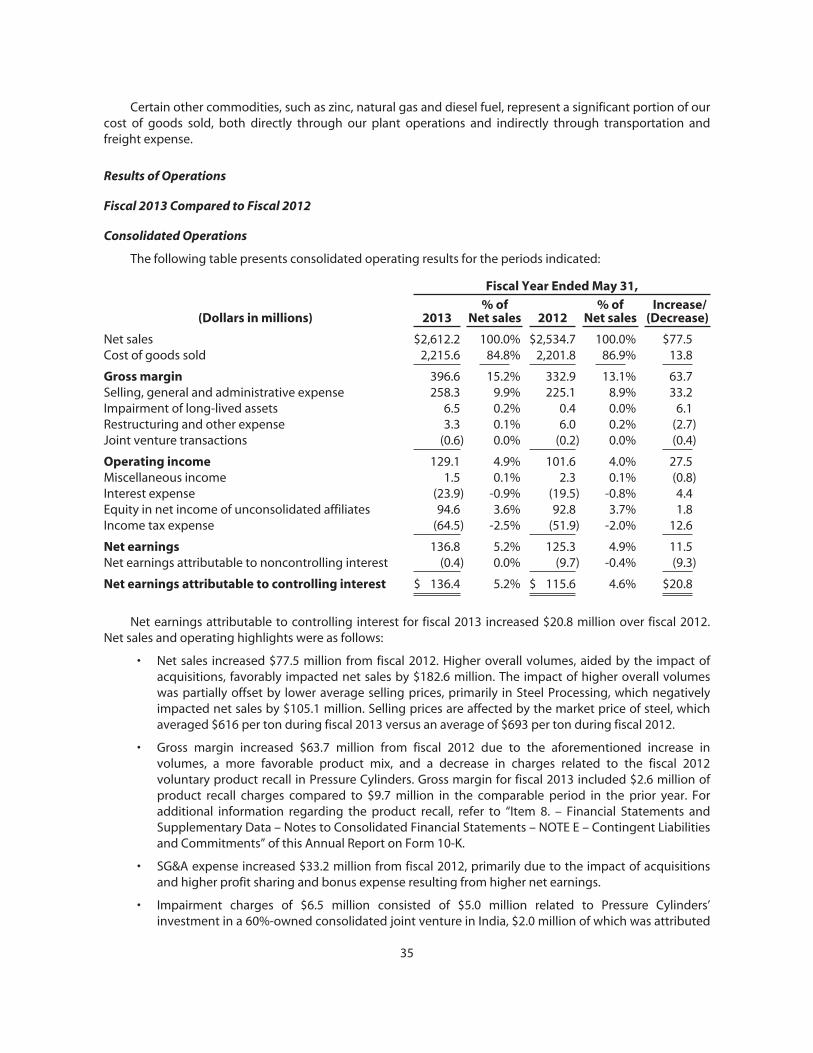
Certain other commodities, such as zinc, natural gas and diesel fuel, represent a significant portion of ourcost of goods sold, both directly through our plant operations and indirectly through transportation andfreight expense.
Results of Operations
Fiscal 2013 Compared to Fiscal 2012
Consolidated Operations
The following table presents consolidated operating results for the periods indicated:
Fiscal Year Ended May 31,
(Dollars in millions) 2013% of
Net sales 2012% of
Net salesIncrease/
(Decrease)
Net sales $2,612.2 100.0% $2,534.7 100.0% $77.5Cost of goods sold 2,215.6 84.8% 2,201.8 86.9% 13.8
Gross margin 396.6 15.2% 332.9 13.1% 63.7Selling, general and administrative expense 258.3 9.9% 225.1 8.9% 33.2Impairment of long-lived assets 6.5 0.2% 0.4 0.0% 6.1Restructuring and other expense 3.3 0.1% 6.0 0.2% (2.7)Joint venture transactions (0.6) 0.0% (0.2) 0.0% (0.4)
Operating income 129.1 4.9% 101.6 4.0% 27.5Miscellaneous income 1.5 0.1% 2.3 0.1% (0.8)Interest expense (23.9) -0.9% (19.5) -0.8% 4.4Equity in net income of unconsolidated affiliates 94.6 3.6% 92.8 3.7% 1.8Income tax expense (64.5) -2.5% (51.9) -2.0% 12.6
Net earnings 136.8 5.2% 125.3 4.9% 11.5Net earnings attributable to noncontrolling interest (0.4) 0.0% (9.7) -0.4% (9.3)
Net earnings attributable to controlling interest $ 136.4 5.2% $ 115.6 4.6% $20.8
Net earnings attributable to controlling interest for fiscal 2013 increased $20.8 million over fiscal 2012.Net sales and operating highlights were as follows:
• Net sales increased $77.5 million from fiscal 2012. Higher overall volumes, aided by the impact ofacquisitions, favorably impacted net sales by $182.6 million. The impact of higher overall volumeswas partially offset by lower average selling prices, primarily in Steel Processing, which negativelyimpacted net sales by $105.1 million. Selling prices are affected by the market price of steel, whichaveraged $616 per ton during fiscal 2013 versus an average of $693 per ton during fiscal 2012.
• Gross margin increased $63.7 million from fiscal 2012 due to the aforementioned increase involumes, a more favorable product mix, and a decrease in charges related to the fiscal 2012voluntary product recall in Pressure Cylinders. Gross margin for fiscal 2013 included $2.6 million ofproduct recall charges compared to $9.7 million in the comparable period in the prior year. Foradditional information regarding the product recall, refer to “Item 8. – Financial Statements andSupplementary Data – Notes to Consolidated Financial Statements – NOTE E – Contingent Liabilitiesand Commitments” of this Annual Report on Form 10-K.
• SG&A expense increased $33.2 million from fiscal 2012, primarily due to the impact of acquisitionsand higher profit sharing and bonus expense resulting from higher net earnings.
• Impairment charges of $6.5 million consisted of $5.0 million related to Pressure Cylinders’investment in a 60%-owned consolidated joint venture in India, $2.0 million of which was attributed
35
to the non-controlling interest, and $1.5 million related to the sale of Pressure Cylinders’ business inCzech Republic. For additional information regarding these impairment charges, refer to “Item 8. –Financial Statements and Supplementary Data – Notes to Consolidated Financial Statements – NOTEC – Goodwill and Other Long-Lived Assets” of this Annual Report on Form 10-K.
• Restructuring charges of $3.3 million consisted primarily of a $2.5 million accrual for severance costsassociated with the recently announced consolidation of our BernzOmatic hand torchmanufacturing operation in Medina, New York into the existing Pressure Cylinders facility in Chilton,Wisconsin and $1.8 million of facility exit and other costs associated with the closure of ourcommercial stairs business. For additional information regarding these restructuring charges, referto “Item 8. – Financial Statements and Supplementary Data – Notes to Consolidated FinancialStatements – NOTE D – Restructuring and Other Expense” of this Annual Report on Form 10-K.
• In connection with the wind down of our former Metal Framing operating segment, we recognizeda net benefit of $0.6 million within the “joint venture transactions” financial statement caption in ourconsolidated statement of earnings. This amount consisted primarily of $1.9 million of net gains onasset disposals partially offset by facility exit and other costs. For additional information, refer to“Item 8. – Financial Statements and Supplementary Data – Notes to Consolidated FinancialStatements – NOTE D – Restructuring and Other Expense” of this Annual Report on Form 10-K.
• Interest expense of $23.9 million was $4.4 million higher than the prior fiscal year, as the impact ofhigher average interest rates due to a higher mix of long-term versus short-term debt more thanoffset the impact of lower average debt levels. For additional information, refer to “Item 8. –Financial Statements and Supplementary Data – Notes to Consolidated Financial Statements – NOTEG – Debt and Receivables Securitization” of this Annual Report on Form 10-K.
• Equity income increased $1.8 million from fiscal 2012. The majority of equity income is generated byour WAVE joint venture, where our portion of net earnings increased $3.5 million, or 6%, to $65.5million. Additionally, our portion of net earnings of ClarkDietrich and TWB increased $2.7 millionand $2.3 million, respectively, over fiscal 2012. The overall increase in equity income was partiallyoffset by a $4.8 million charge related to the write-off of the investment in our joint venture inChina. For additional financial information regarding our unconsolidated affiliates, refer to “Item 8. –Financial Statements and Supplementary Data – Notes to Consolidated Financial Statements – NOTEB – Investments in Unconsolidated Affiliates” of this Annual Report on Form 10-K.
• Income tax expense increased $12.6 million from fiscal 2012 due primarily to higher earnings. Fiscal2013 income tax expense reflects an effective tax rate attributable to controlling interest of 32.1%versus 31.0% in fiscal 2012. These rates are calculated based on net earnings attributable tocontrolling interest, as reflected in our consolidated statements of earnings. The increase in theeffective tax rate attributable to controlling interest was due primarily to a reduction in the benefitassociated with lower tax rates on foreign income. The reduction in the tax benefit associated withlower tax rates on foreign income was due to certain foreign impairment charges for which therewas no associated tax benefit. The 32.1% rate is lower than the federal statutory rate of 35%primarily as a result of the benefits from the qualified production activities deduction and lower taxrates on foreign income (collectively decreasing the rate by 3.6%). These impacts are partially offsetby state and local income taxes of 1.0% (net of their federal tax benefit). For additional information,refer to “Item 8. – Financial Statements and Supplementary Data – Notes to Consolidated FinancialStatements – NOTE L – Income Taxes” of this Annual Report on Form 10-K.
36
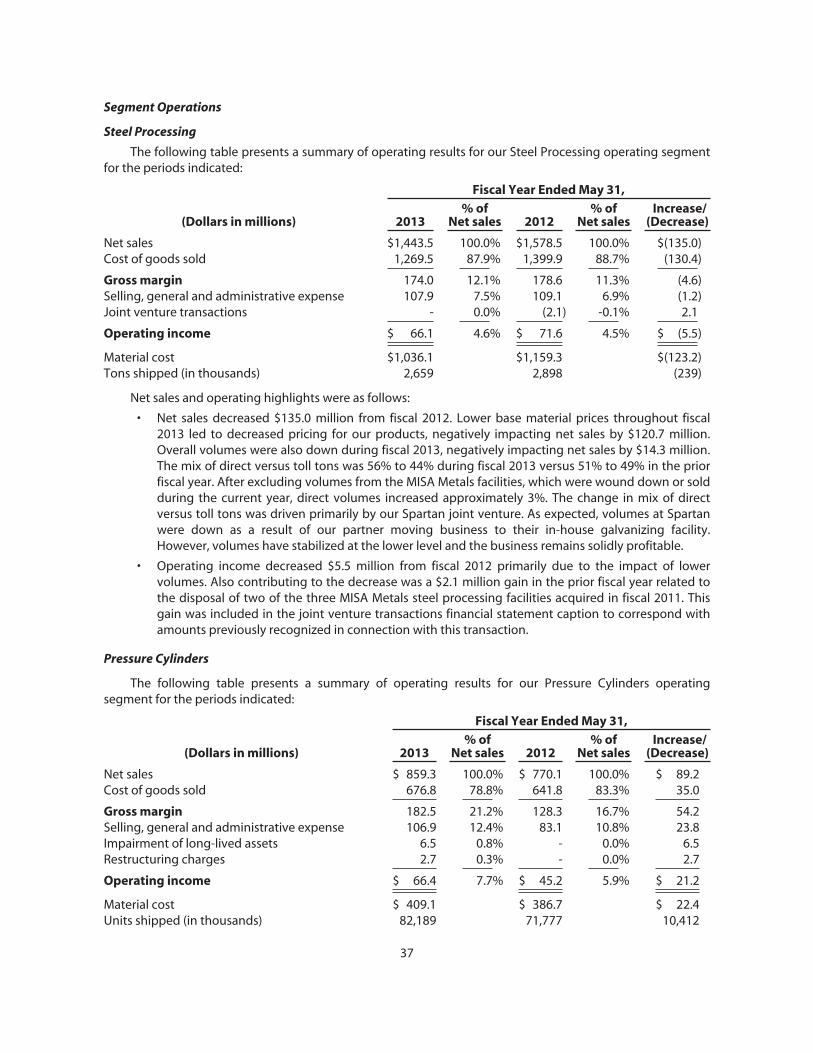
Segment Operations
Steel Processing
The following table presents a summary of operating results for our Steel Processing operating segmentfor the periods indicated:
Fiscal Year Ended May 31,
(Dollars in millions) 2013% of
Net sales 2012% of
Net salesIncrease/
(Decrease)
Net sales $1,443.5 100.0% $1,578.5 100.0% $(135.0)Cost of goods sold 1,269.5 87.9% 1,399.9 88.7% (130.4)
Gross margin 174.0 12.1% 178.6 11.3% (4.6)Selling, general and administrative expense 107.9 7.5% 109.1 6.9% (1.2)Joint venture transactions - 0.0% (2.1) -0.1% 2.1
Operating income $ 66.1 4.6% $ 71.6 4.5% $ (5.5)
Material cost $1,036.1 $1,159.3 $(123.2)Tons shipped (in thousands) 2,659 2,898 (239)
Net sales and operating highlights were as follows:
• Net sales decreased $135.0 million from fiscal 2012. Lower base material prices throughout fiscal2013 led to decreased pricing for our products, negatively impacting net sales by $120.7 million.Overall volumes were also down during fiscal 2013, negatively impacting net sales by $14.3 million.The mix of direct versus toll tons was 56% to 44% during fiscal 2013 versus 51% to 49% in the priorfiscal year. After excluding volumes from the MISA Metals facilities, which were wound down or soldduring the current year, direct volumes increased approximately 3%. The change in mix of directversus toll tons was driven primarily by our Spartan joint venture. As expected, volumes at Spartanwere down as a result of our partner moving business to their in-house galvanizing facility.However, volumes have stabilized at the lower level and the business remains solidly profitable.
• Operating income decreased $5.5 million from fiscal 2012 primarily due to the impact of lowervolumes. Also contributing to the decrease was a $2.1 million gain in the prior fiscal year related tothe disposal of two of the three MISA Metals steel processing facilities acquired in fiscal 2011. Thisgain was included in the joint venture transactions financial statement caption to correspond withamounts previously recognized in connection with this transaction.
Pressure Cylinders
The following table presents a summary of operating results for our Pressure Cylinders operatingsegment for the periods indicated:
Fiscal Year Ended May 31,
(Dollars in millions) 2013% of
Net sales 2012% of
Net salesIncrease/
(Decrease)
Net sales $ 859.3 100.0% $ 770.1 100.0% $ 89.2Cost of goods sold 676.8 78.8% 641.8 83.3% 35.0
Gross margin 182.5 21.2% 128.3 16.7% 54.2Selling, general and administrative expense 106.9 12.4% 83.1 10.8% 23.8Impairment of long-lived assets 6.5 0.8% - 0.0% 6.5Restructuring charges 2.7 0.3% - 0.0% 2.7
Operating income $ 66.4 7.7% $ 45.2 5.9% $ 21.2
Material cost $ 409.1 $ 386.7 $ 22.4Units shipped (in thousands) 82,189 71,777 10,412
37
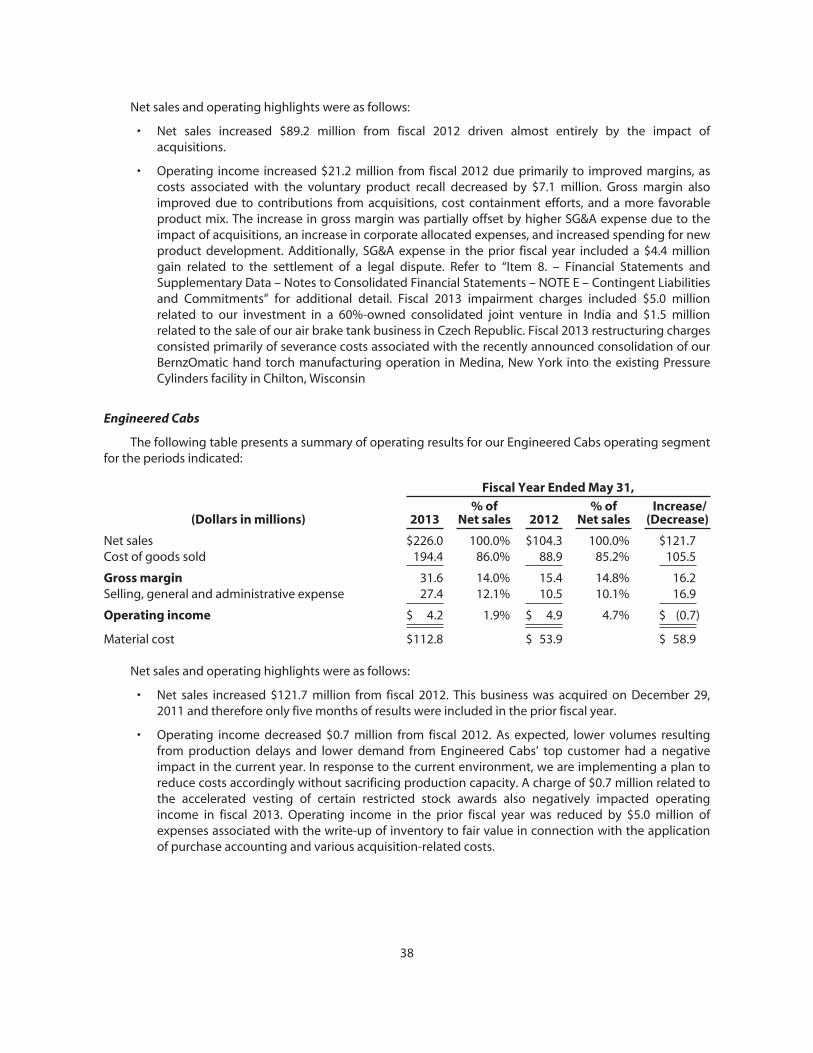
Net sales and operating highlights were as follows:
• Net sales increased $89.2 million from fiscal 2012 driven almost entirely by the impact ofacquisitions.
• Operating income increased $21.2 million from fiscal 2012 due primarily to improved margins, ascosts associated with the voluntary product recall decreased by $7.1 million. Gross margin alsoimproved due to contributions from acquisitions, cost containment efforts, and a more favorableproduct mix. The increase in gross margin was partially offset by higher SG&A expense due to theimpact of acquisitions, an increase in corporate allocated expenses, and increased spending for newproduct development. Additionally, SG&A expense in the prior fiscal year included a $4.4 milliongain related to the settlement of a legal dispute. Refer to “Item 8. – Financial Statements andSupplementary Data – Notes to Consolidated Financial Statements – NOTE E – Contingent Liabilitiesand Commitments” for additional detail. Fiscal 2013 impairment charges included $5.0 millionrelated to our investment in a 60%-owned consolidated joint venture in India and $1.5 millionrelated to the sale of our air brake tank business in Czech Republic. Fiscal 2013 restructuring chargesconsisted primarily of severance costs associated with the recently announced consolidation of ourBernzOmatic hand torch manufacturing operation in Medina, New York into the existing PressureCylinders facility in Chilton, Wisconsin
Engineered Cabs
The following table presents a summary of operating results for our Engineered Cabs operating segmentfor the periods indicated:
Fiscal Year Ended May 31,
(Dollars in millions) 2013% of
Net sales 2012% of
Net salesIncrease/
(Decrease)
Net sales $226.0 100.0% $104.3 100.0% $121.7Cost of goods sold 194.4 86.0% 88.9 85.2% 105.5
Gross margin 31.6 14.0% 15.4 14.8% 16.2Selling, general and administrative expense 27.4 12.1% 10.5 10.1% 16.9
Operating income $ 4.2 1.9% $ 4.9 4.7% $ (0.7)
Material cost $112.8 $ 53.9 $ 58.9
Net sales and operating highlights were as follows:
• Net sales increased $121.7 million from fiscal 2012. This business was acquired on December 29,2011 and therefore only five months of results were included in the prior fiscal year.
• Operating income decreased $0.7 million from fiscal 2012. As expected, lower volumes resultingfrom production delays and lower demand from Engineered Cabs’ top customer had a negativeimpact in the current year. In response to the current environment, we are implementing a plan toreduce costs accordingly without sacrificing production capacity. A charge of $0.7 million related tothe accelerated vesting of certain restricted stock awards also negatively impacted operatingincome in fiscal 2013. Operating income in the prior fiscal year was reduced by $5.0 million ofexpenses associated with the write-up of inventory to fair value in connection with the applicationof purchase accounting and various acquisition-related costs.
38
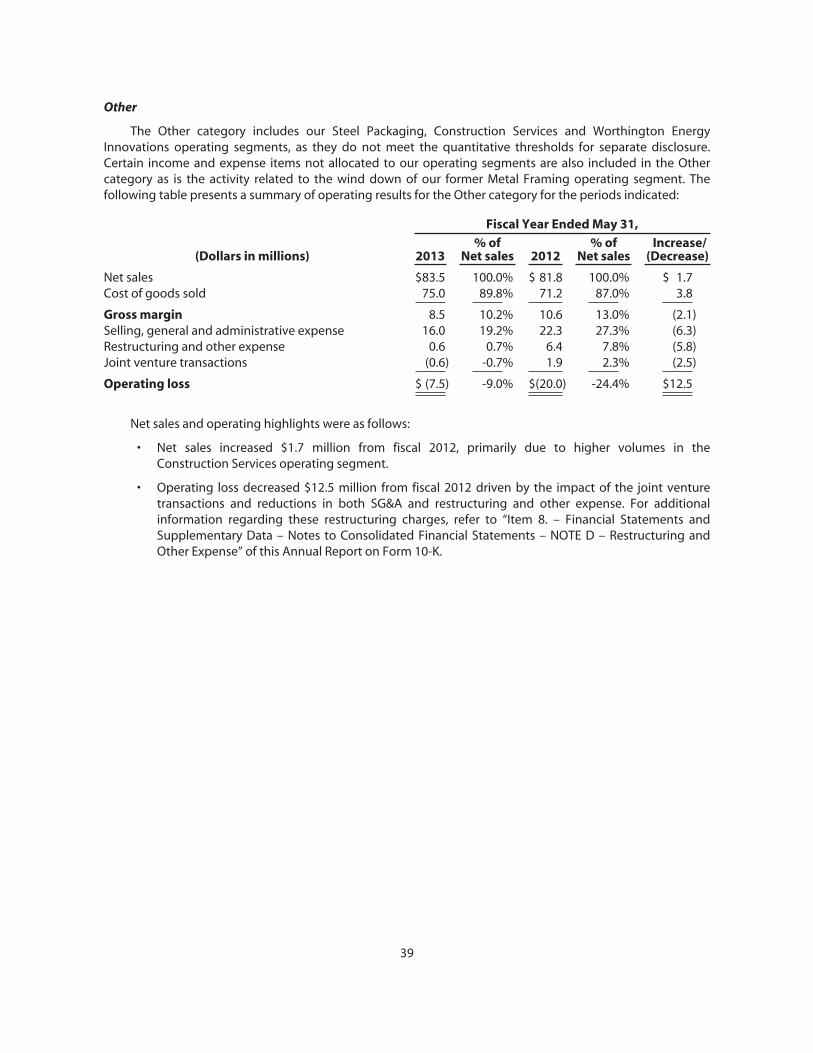
Other
The Other category includes our Steel Packaging, Construction Services and Worthington EnergyInnovations operating segments, as they do not meet the quantitative thresholds for separate disclosure.Certain income and expense items not allocated to our operating segments are also included in the Othercategory as is the activity related to the wind down of our former Metal Framing operating segment. Thefollowing table presents a summary of operating results for the Other category for the periods indicated:
Fiscal Year Ended May 31,
(Dollars in millions) 2013% of
Net sales 2012% of
Net salesIncrease/
(Decrease)
Net sales $83.5 100.0% $ 81.8 100.0% $ 1.7Cost of goods sold 75.0 89.8% 71.2 87.0% 3.8
Gross margin 8.5 10.2% 10.6 13.0% (2.1)Selling, general and administrative expense 16.0 19.2% 22.3 27.3% (6.3)Restructuring and other expense 0.6 0.7% 6.4 7.8% (5.8)Joint venture transactions (0.6) -0.7% 1.9 2.3% (2.5)
Operating loss $ (7.5) -9.0% $(20.0) -24.4% $12.5
Net sales and operating highlights were as follows:
• Net sales increased $1.7 million from fiscal 2012, primarily due to higher volumes in theConstruction Services operating segment.
• Operating loss decreased $12.5 million from fiscal 2012 driven by the impact of the joint venturetransactions and reductions in both SG&A and restructuring and other expense. For additionalinformation regarding these restructuring charges, refer to “Item 8. – Financial Statements andSupplementary Data – Notes to Consolidated Financial Statements – NOTE D – Restructuring andOther Expense” of this Annual Report on Form 10-K.
39
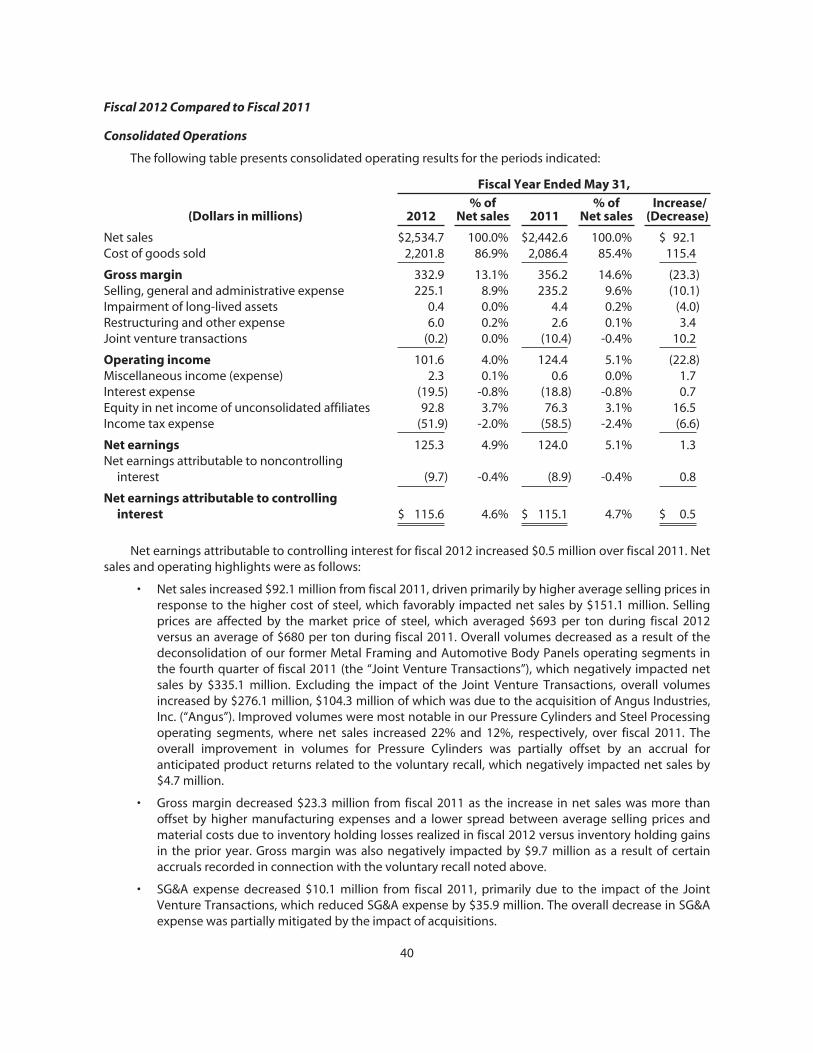
Fiscal 2012 Compared to Fiscal 2011
Consolidated Operations
The following table presents consolidated operating results for the periods indicated:
Fiscal Year Ended May 31,
(Dollars in millions) 2012% of
Net sales 2011% of
Net salesIncrease/
(Decrease)
Net sales $2,534.7 100.0% $2,442.6 100.0% $ 92.1Cost of goods sold 2,201.8 86.9% 2,086.4 85.4% 115.4
Gross margin 332.9 13.1% 356.2 14.6% (23.3)Selling, general and administrative expense 225.1 8.9% 235.2 9.6% (10.1)Impairment of long-lived assets 0.4 0.0% 4.4 0.2% (4.0)Restructuring and other expense 6.0 0.2% 2.6 0.1% 3.4Joint venture transactions (0.2) 0.0% (10.4) -0.4% 10.2
Operating income 101.6 4.0% 124.4 5.1% (22.8)Miscellaneous income (expense) 2.3 0.1% 0.6 0.0% 1.7Interest expense (19.5) -0.8% (18.8) -0.8% 0.7Equity in net income of unconsolidated affiliates 92.8 3.7% 76.3 3.1% 16.5Income tax expense (51.9) -2.0% (58.5) -2.4% (6.6)
Net earnings 125.3 4.9% 124.0 5.1% 1.3Net earnings attributable to noncontrolling
interest (9.7) -0.4% (8.9) -0.4% 0.8
Net earnings attributable to controllinginterest $ 115.6 4.6% $ 115.1 4.7% $ 0.5
Net earnings attributable to controlling interest for fiscal 2012 increased $0.5 million over fiscal 2011. Netsales and operating highlights were as follows:
• Net sales increased $92.1 million from fiscal 2011, driven primarily by higher average selling prices inresponse to the higher cost of steel, which favorably impacted net sales by $151.1 million. Sellingprices are affected by the market price of steel, which averaged $693 per ton during fiscal 2012versus an average of $680 per ton during fiscal 2011. Overall volumes decreased as a result of thedeconsolidation of our former Metal Framing and Automotive Body Panels operating segments inthe fourth quarter of fiscal 2011 (the “Joint Venture Transactions”), which negatively impacted netsales by $335.1 million. Excluding the impact of the Joint Venture Transactions, overall volumesincreased by $276.1 million, $104.3 million of which was due to the acquisition of Angus Industries,Inc. (“Angus”). Improved volumes were most notable in our Pressure Cylinders and Steel Processingoperating segments, where net sales increased 22% and 12%, respectively, over fiscal 2011. Theoverall improvement in volumes for Pressure Cylinders was partially offset by an accrual foranticipated product returns related to the voluntary recall, which negatively impacted net sales by$4.7 million.
• Gross margin decreased $23.3 million from fiscal 2011 as the increase in net sales was more thanoffset by higher manufacturing expenses and a lower spread between average selling prices andmaterial costs due to inventory holding losses realized in fiscal 2012 versus inventory holding gainsin the prior year. Gross margin was also negatively impacted by $9.7 million as a result of certainaccruals recorded in connection with the voluntary recall noted above.
• SG&A expense decreased $10.1 million from fiscal 2011, primarily due to the impact of the JointVenture Transactions, which reduced SG&A expense by $35.9 million. The overall decrease in SG&Aexpense was partially mitigated by the impact of acquisitions.
40

• Restructuring charges increased $3.4 million from fiscal 2011. Fiscal 2012 charges were primarilydriven by professional fees resulting from our ongoing transformation efforts within PressureCylinders and severance accrued in connection with the closure of our Commercial Stairs businessunit. For additional information regarding these restructuring charges, refer to “Item 8. – FinancialStatements and Supplementary Data – Notes to Consolidated Financial Statements – NOTE D –Restructuring and Other Expense.”
• In connection with the wind-down of our Metal Framing operating segment, we recognized a netbenefit of $0.2 million within the joint venture transaction line in our consolidated statement ofearnings. This amount consisted of $9.1 million of post-closure facility exit and other costs, offset by$8.3 million of net gains on asset disposals. In addition, the severance accrued in connection withthe Joint Venture Transactions was adjusted downward resulting in a $1.0 million credit to earnings.For additional information, refer to “Item 8. – Financial Statements and Supplementary Data – Notesto Consolidated Financial Statements – NOTE D – Restructuring and Other Expense.”
• Interest expense of $19.5 million was $0.7 million higher than the prior fiscal year due to the impactof higher average debt levels.
• Equity income increased $16.5 million from fiscal 2011. The majority of the equity income isgenerated by our WAVE joint venture, where our portion of net earnings increased $4.2 million, or7%. ClarkDietrich and ArtiFlex also contributed to the fiscal 2012 increase, providing $6.1 million and$5.2 million, respectively, of equity income. For additional financial information regarding ourunconsolidated affiliates, refer to “Item 8. – Financial Statements and Supplementary Data – Notesto Consolidated Financial Statements – NOTE B – Investments in Unconsolidated Affiliates.”
• Income tax expense decreased $6.6 million from fiscal 2011. Fiscal 2012 income tax expense reflectsan effective tax rate attributable to controlling interest of 31.0% versus 33.7% in fiscal 2011. Theserates are calculated based on net earnings attributable to controlling interest, as reflected in ourconsolidated statements of earnings. The decrease in the effective tax rate attributable tocontrolling interest was due to more of the Company’s income qualifying for the productionactivities deduction, and certain non-recurring items. The 31.0% rate is lower than the federalstatutory rate of 35% primarily as a result of the benefits from the qualified production activitiesdeduction and lower tax rates on foreign income (collectively decreasing the rate by 5.0%). Theseimpacts are partially offset by state and local income taxes of 1.6% (net of their federal tax benefit).For additional information, refer to “Item 8. – Financial Statements and Supplementary Data – Notesto Consolidated Financial Statements – NOTE L – Income Taxes.”
41

Segment Operations
Steel Processing
The following table presents a summary of operating results for our Steel Processing operating segmentfor the periods indicated:
Fiscal Year Ended May 31,
(Dollars in millions) 2012% of
Net sales 2011% of
Net salesIncrease/
(Decrease)
Net sales $1,578.5 100.0% $1,405.5 100.0% $173.0Cost of goods sold 1,399.9 88.7% 1,216.5 86.6% 183.4
Gross margin 178.6 11.3% 189.0 13.4% (10.4)Selling, general and administrative expense 109.1 6.9% 111.6 7.9% (2.5)Restructuring and other income - 0.0% (0.3) 0.0% 0.3Joint venture transactions (2.1) -0.1% - 0.0% (2.1)
Operating income $ 71.6 4.5% $ 77.7 5.5% $ (6.1)
Material cost $1,159.3 $1,001.9 $157.4Tons shipped (in thousands) 2,898 2,589 309
Net sales and operating highlights were as follows:
• Net sales increased $173.0 million from fiscal 2011. Higher base material prices throughout the yearled to increased pricing for our products, favorably impacting net sales by $103.3 million. Overallvolumes, aided by continued improvement in the automotive market, increased 12% over fiscal2011, favorably impacting net sales by $69.7 million. The mix of direct versus toll tons processed was51% to 49% in fiscal 2012, compared with a 55% to 45% mix in the prior fiscal year.
• Operating income decreased $6.1 million from fiscal 2011 as the increase in net sales was more thanoffset by a lower spread between average selling prices and material costs due to inventory holdinglosses realized in fiscal 2012 versus inventory holding gains in the prior year. Operating income wasalso adversely impacted by higher manufacturing expenses, primarily freight costs. The impact ofthese items was partially mitigated by a decrease in SG&A expense due to lower profit sharing andbonus expenses in fiscal 2012 as well as a $2.1 million gain related to the disposal of two of the threeMISA Metals steel processing facilities acquired during the fourth quarter of fiscal 2011. This gainwas included in the joint venture transactions line to correspond with amounts previouslyrecognized in connection with this transaction.
Pressure Cylinders
The following table presents a summary of operating results for our Pressure Cylinders operatingsegment for the periods indicated:
Fiscal Year Ended May 31,
(Dollars in millions) 2012% of
Net sales 2011% of
Net salesIncrease/
(Decrease)
Net sales $ 770.1 100.0% $ 591.9 100.0% $ 178.2Cost of goods sold 641.8 83.3% 474.8 80.2% 167.0
Gross margin 128.3 16.7% 117.1 19.8% 11.2Selling, general and administrative expense 83.1 10.8% 68.1 11.5% 15.0
Operating income $ 45.2 5.9% $ 49.0 8.3% $ (3.8)
Material cost $ 386.7 $ 273.9 $ 112.8Units shipped (in thousands) 71,777 59,037 12,740
42
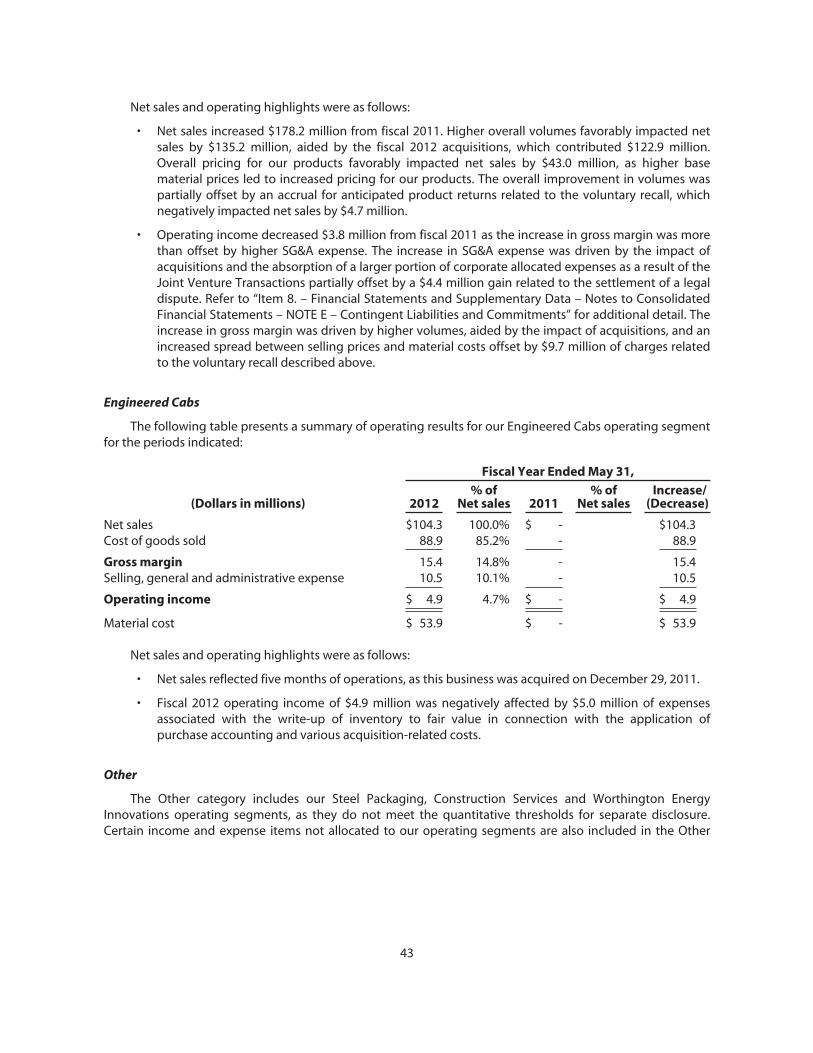
Net sales and operating highlights were as follows:
• Net sales increased $178.2 million from fiscal 2011. Higher overall volumes favorably impacted netsales by $135.2 million, aided by the fiscal 2012 acquisitions, which contributed $122.9 million.Overall pricing for our products favorably impacted net sales by $43.0 million, as higher basematerial prices led to increased pricing for our products. The overall improvement in volumes waspartially offset by an accrual for anticipated product returns related to the voluntary recall, whichnegatively impacted net sales by $4.7 million.
• Operating income decreased $3.8 million from fiscal 2011 as the increase in gross margin was morethan offset by higher SG&A expense. The increase in SG&A expense was driven by the impact ofacquisitions and the absorption of a larger portion of corporate allocated expenses as a result of theJoint Venture Transactions partially offset by a $4.4 million gain related to the settlement of a legaldispute. Refer to “Item 8. – Financial Statements and Supplementary Data – Notes to ConsolidatedFinancial Statements – NOTE E – Contingent Liabilities and Commitments” for additional detail. Theincrease in gross margin was driven by higher volumes, aided by the impact of acquisitions, and anincreased spread between selling prices and material costs offset by $9.7 million of charges relatedto the voluntary recall described above.
Engineered Cabs
The following table presents a summary of operating results for our Engineered Cabs operating segmentfor the periods indicated:
Fiscal Year Ended May 31,
(Dollars in millions) 2012% of
Net sales 2011% of
Net salesIncrease/
(Decrease)
Net sales $104.3 100.0% $ - $104.3Cost of goods sold 88.9 85.2% - 88.9
Gross margin 15.4 14.8% - 15.4Selling, general and administrative expense 10.5 10.1% - 10.5
Operating income $ 4.9 4.7% $ - $ 4.9
Material cost $ 53.9 $ - $ 53.9
Net sales and operating highlights were as follows:
• Net sales reflected five months of operations, as this business was acquired on December 29, 2011.
• Fiscal 2012 operating income of $4.9 million was negatively affected by $5.0 million of expensesassociated with the write-up of inventory to fair value in connection with the application ofpurchase accounting and various acquisition-related costs.
Other
The Other category includes our Steel Packaging, Construction Services and Worthington EnergyInnovations operating segments, as they do not meet the quantitative thresholds for separate disclosure.Certain income and expense items not allocated to our operating segments are also included in the Other
43

category as is the activity related to the wind down of our former Metal Framing operating segment. Thefollowing table presents a summary of operating results for the Other category for the periods indicated:
Fiscal Year Ended May 31,
(Dollars in millions) 2012% of
Net sales 2011% of
Net salesIncrease/
(Decrease)
Net sales $ 81.8 100.0% $445.1 100.0% $(363.3)Cost of goods sold 71.2 87.0% 395.1 88.8% (323.9)
Gross margin 10.6 13.0% 50.0 11.2% (39.4)Selling, general and administrative expense 22.3 27.3% 55.2 12.4% (32.9)Impairment of long-lived assets 0.4 0.5% 4.4 1.0% (4.0)Restructuring and other expense 6.0 7.3% 3.0 0.7% 3.0Joint Venture Transactions 1.9 2.3% (10.4) -2.3% 12.3
Operating loss $(20.0) -24.4% $ (2.2) -0.5% $ (17.8)
Net sales and operating highlights were as follows:
• Net sales decreased $363.3 million from fiscal 2011, driven primarily by the deconsolidation of ourformer Metal Framing and Automotive Body Panels operating segments during the fourth quarterof fiscal 2011.
• Operating loss increased $17.8 million driven by the deconsolidation of our former AutomotiveBody Panels operating segment, the impact of the joint venture transactions, higher restructuringand other expense, and lower volumes in the Construction Services operating segment. Currentyear restructuring charges were primarily driven by professional fees resulting from our ongoingtransformation efforts within Pressure Cylinders and severance accrued in connection with theclosure of our Commercial Stairs business unit. Consistent with similar charges incurred in priorperiods, the professional fees were not allocated to any of our operating segments.
Liquidity and Capital Resources
During fiscal 2013, we generated $273.0 million in cash from operating activities, invested $44.6 millionin property, plant and equipment and spent $175.2 million on acquisitions, net of cash acquired. Additionally,we repurchased 925,000 of our common shares for $30.4 million and paid $44.1 million of dividends. We alsorepaid $168.4 million of short-term borrowings, which was partially funded by $150.0 million of proceedsfrom the issuance of long-term debt. The following table summarizes our consolidated cash flows for eachperiod shown:
Fiscal Years EndedMay 31,
(in millions) 2013 2012
Net cash provided by operating activities $ 273.0 $ 173.7Net cash used by investing activities (202.0) (188.6)Net cash used by financing activities (60.6) (0.2)
Increase (decrease) in cash and cash equivalents 10.4 (15.1)Cash and cash equivalents at beginning of period 41.0 56.1
Cash and cash equivalents at end of period $ 51.4 $ 41.0
We believe we have access to adequate resources to meet our needs for normal operating costs,mandatory capital expenditures, mandatory debt redemptions, dividend payments and working capital forour existing businesses. These resources include cash and cash equivalents, cash provided by operatingactivities and unused lines of credit. We also believe we have adequate access to the financial markets to
44
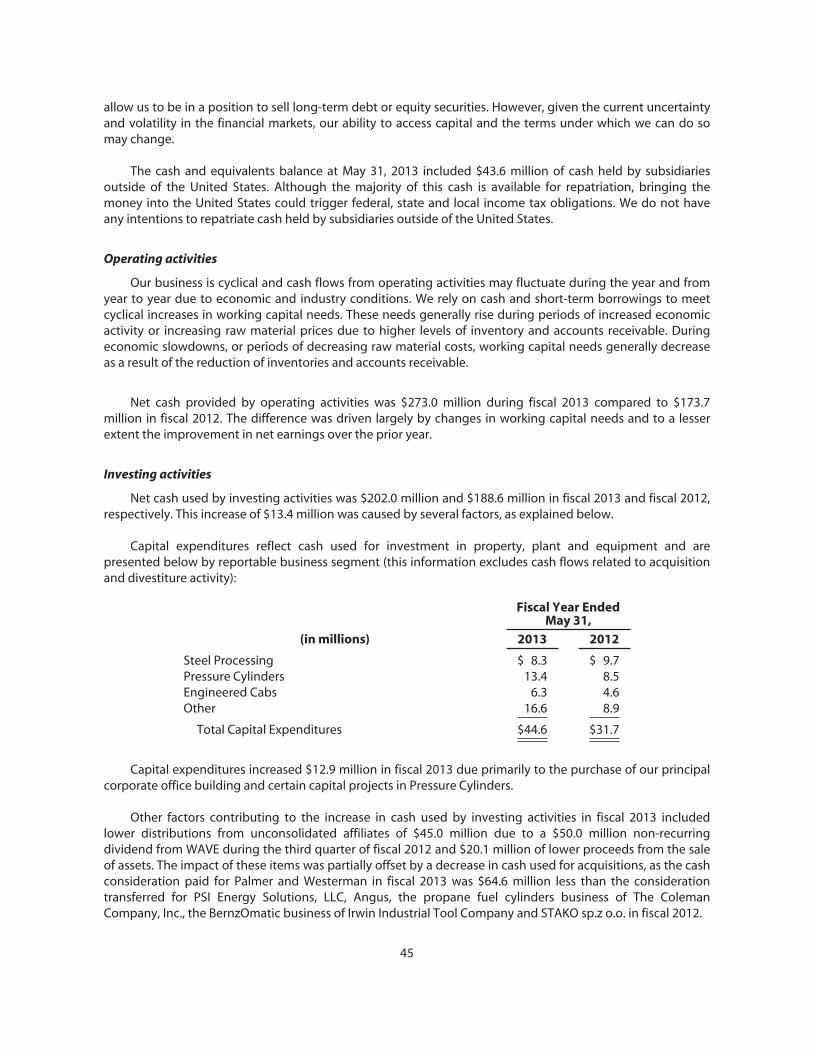
allow us to be in a position to sell long-term debt or equity securities. However, given the current uncertaintyand volatility in the financial markets, our ability to access capital and the terms under which we can do somay change.
The cash and equivalents balance at May 31, 2013 included $43.6 million of cash held by subsidiariesoutside of the United States. Although the majority of this cash is available for repatriation, bringing themoney into the United States could trigger federal, state and local income tax obligations. We do not haveany intentions to repatriate cash held by subsidiaries outside of the United States.
Operating activities
Our business is cyclical and cash flows from operating activities may fluctuate during the year and fromyear to year due to economic and industry conditions. We rely on cash and short-term borrowings to meetcyclical increases in working capital needs. These needs generally rise during periods of increased economicactivity or increasing raw material prices due to higher levels of inventory and accounts receivable. Duringeconomic slowdowns, or periods of decreasing raw material costs, working capital needs generally decreaseas a result of the reduction of inventories and accounts receivable.
Net cash provided by operating activities was $273.0 million during fiscal 2013 compared to $173.7million in fiscal 2012. The difference was driven largely by changes in working capital needs and to a lesserextent the improvement in net earnings over the prior year.
Investing activities
Net cash used by investing activities was $202.0 million and $188.6 million in fiscal 2013 and fiscal 2012,respectively. This increase of $13.4 million was caused by several factors, as explained below.
Capital expenditures reflect cash used for investment in property, plant and equipment and arepresented below by reportable business segment (this information excludes cash flows related to acquisitionand divestiture activity):
Fiscal Year EndedMay 31,
(in millions) 2013 2012
Steel Processing $ 8.3 $ 9.7Pressure Cylinders 13.4 8.5Engineered Cabs 6.3 4.6Other 16.6 8.9
Total Capital Expenditures $44.6 $31.7
Capital expenditures increased $12.9 million in fiscal 2013 due primarily to the purchase of our principalcorporate office building and certain capital projects in Pressure Cylinders.
Other factors contributing to the increase in cash used by investing activities in fiscal 2013 includedlower distributions from unconsolidated affiliates of $45.0 million due to a $50.0 million non-recurringdividend from WAVE during the third quarter of fiscal 2012 and $20.1 million of lower proceeds from the saleof assets. The impact of these items was partially offset by a decrease in cash used for acquisitions, as the cashconsideration paid for Palmer and Westerman in fiscal 2013 was $64.6 million less than the considerationtransferred for PSI Energy Solutions, LLC, Angus, the propane fuel cylinders business of The ColemanCompany, Inc., the BernzOmatic business of Irwin Industrial Tool Company and STAKO sp.z o.o. in fiscal 2012.
45
Investment activities are largely discretionary and future investment activities could be reducedsignificantly or eliminated as economic conditions warrant. We assess acquisition opportunities as they arise,and such opportunities may require additional financing. There can be no assurance, however, that any suchopportunities will arise, that any such acquisitions will be consummated or that any needed additionalfinancing will be available on satisfactory terms when required.
Financing activities
Net cash used by financing activities was $60.6 million in fiscal 2013. During fiscal 2013, we repaid $168.4million of short-term borrowings, which was partially funded by $150.0 million of proceeds from the issuanceof long-term debt, as described in more detail below. We received $37.9 million of proceeds from the issuanceof common shares from the exercise of stock options and paid $44.1 million of dividends in fiscal 2013, whichrepresents a $12.0 million increase over fiscal 2012. Additionally, we paid $30.4 million to repurchase 925,000of our common shares in fiscal 2013.
Long-term debt — Our senior unsecured long-term debt is rated “investment grade” by both Moody’sInvestors Service, Inc. and Standard & Poor’s Ratings Group. We typically use the net proceeds from long-termdebt for acquisitions, refinancing of outstanding debt, capital expenditures and general corporate purposes.As of May 31, 2013, we were in compliance with our long-term debt covenants. Our long-term debtagreements do not include ratings triggers or material adverse change provisions.
On April 13, 2010, we issued $150.0 million aggregate principal amount of unsecured senior notes dueon April 15, 2020 (the “2020 Notes”). The 2020 Notes bear interest at a rate of 6.50%. The 2020 Notes were soldto the public at 99.890% of the principal amount thereof, to yield 6.515% to maturity. We used the netproceeds from the offering to repay a portion of the then outstanding borrowings under our revolving creditfacility and amounts then outstanding under our revolving trade accounts receivable securitization facility.The proceeds on the issuance of the 2020 Notes were reduced for debt discount ($0.2 million), payment ofdebt issuance costs ($1.5 million) and settlement of a hedging instrument entered into in anticipation of theissuance of the 2020 Notes ($1.4 million).
In connection with the acquisition of Angus on December 29, 2011, we assumed industrial revenuebonds (“IRBs”) issued by the South Dakota Economic Development Finance Authority that mature in April2019 and had an outstanding principal balance of $2.1 million at May 31, 2013. These IRBs bear interest atrates between 2.75% and 5.00%.
On April 27, 2012, we executed a $5.9 million seven-year term loan that matures on May 1, 2019. The loanbears interest at a rate of 2.49% and is secured by an aircraft that was purchased with its proceeds.
On August 10, 2012, we issued $150.0 million aggregate principal amount of unsecured senior notes dueAugust 10, 2024 (the “2024 Notes”). The 2024 Notes bear interest at a rate of 4.60%. The net proceeds fromthis issuance were used to repay a portion of the outstanding borrowings under our multi-year revolvingcredit facility and amounts outstanding under our revolving trade accounts receivable securitization facility,both of which are described in more detail below.
Short-term borrowings — Our short-term debt agreements do not include ratings triggers or materialadverse change provisions. We were in compliance with our short-term debt covenants at May 31, 2013.
We maintain a $425.0 million multi-year revolving credit facility (the “Credit Facility”) with a group oflenders that matures in May 2017. Borrowings under the Credit Facility have maturities of less than one yearand given that our intention has been to repay them within a year, they have been classified as short-termborrowings within current liabilities on our consolidated balance sheets. However, we can also extend theterm of amounts borrowed by renewing these borrowings for the term of the Credit Facility. We have the
46
option to borrow at rates equal to an applicable margin over the LIBOR, Prime or Fed Funds rates. Theapplicable margin is determined by our credit rating. At May 31, 2013, $8.3 million of borrowings wereoutstanding under the Credit Facility and bore interest at rates based on LIBOR. The average variable rate was1.24% at May 31, 2013.
We provided approximately $11.7 million in letters of credit for third-party beneficiaries as of May 31,2013. The letters of credit secure potential obligations to certain bond and insurance providers. These letterscan be drawn at any time at the option of the beneficiaries, and while not drawn against at May 31, 2013 or2012, these letters of credit are issued against and therefore reduce availability under the Credit Facility. Wehad $405.0 million available to us under the Credit Facility at May 31, 2013, compared to $278.4 millionavailable to us at May 31, 2012.
We maintain a revolving trade accounts receivable securitization facility (the “AR Facility”). The AR Facilitywas available throughout fiscal 2013 and fiscal 2012. During the third quarter of fiscal 2013, we decreased ourborrowing capacity under the AR Facility from $150.0 million to $100.0 million and extended its maturity toJanuary 2015. Pursuant to the terms of the AR Facility, certain of our subsidiaries sell their accounts receivablewithout recourse, on a revolving basis, to Worthington Receivables Corporation (“WRC”), a wholly-owned,consolidated, bankruptcy-remote subsidiary. In turn, WRC may sell without recourse, on a revolving basis, upto $100.0 million of undivided ownership interests in this pool of accounts receivable to a multi-seller, asset-backed commercial paper conduit (the “Conduit”). Purchases by the Conduit are financed with the sale ofA1/P1 commercial paper. We retain an undivided interest in this pool and are subject to risk of loss based onthe collectability of the receivables from this retained interest. Because the amount eligible to be soldexcludes receivables more than 90 days past due, receivables offset by an allowance for doubtful accountsdue to bankruptcy or other cause, concentrations over certain limits with specific customers and certainreserve amounts, we believe additional risk of loss is minimal. The book value of the retained portion of thepool of accounts receivable approximates fair value. As of May 31, 2013, the pool of eligible accountsreceivable exceeded the $100.0 million limit and $100.0 million of undivided ownership interests in this poolof accounts receivable had been sold.
We also maintain a $9.5 million credit facility, through our consolidated joint venture, WNCL, thatmatures in November 2013. This credit facility bears interest at a variable rate, which was 2.25% at May 31,2013.
Common shares – We declared dividends at a quarterly rate of $0.13 per common share for the first andsecond quarters of fiscal 2013 compared to $0.12 per common share for each quarter of fiscal 2012. OnDecember 10, 2012, the Board of Directors declared an accelerated third and fourth quarter cash dividendtotaling $0.26 per common share. The dividend was paid on December 28, 2012 to shareholders of record asof December 21, 2012. We paid dividends on our common shares of $44.1 million and $32.1 million in fiscal2013 and fiscal 2012, respectively.
On June 29, 2011, the Board of Directors authorized the repurchase of up to 10,000,000 of ouroutstanding common shares of which 5,102,832 remained available for repurchase at May 31, 2013. Duringfiscal 2013, 925,000 common shares were repurchased under this authorization.
The common shares available for repurchase under these authorizations may be purchased from time totime, with consideration given to the market price of the common shares, the nature of other investmentopportunities, cash flows from operations, general economic conditions and other relevant considerations.Repurchases may be made on the open market or through privately negotiated transactions.
Dividend Policy
We currently have no material contractual or regulatory restrictions on the payment of dividends.Dividends are declared at the discretion of our Board of Directors. The Board reviews the dividend quarterly
47
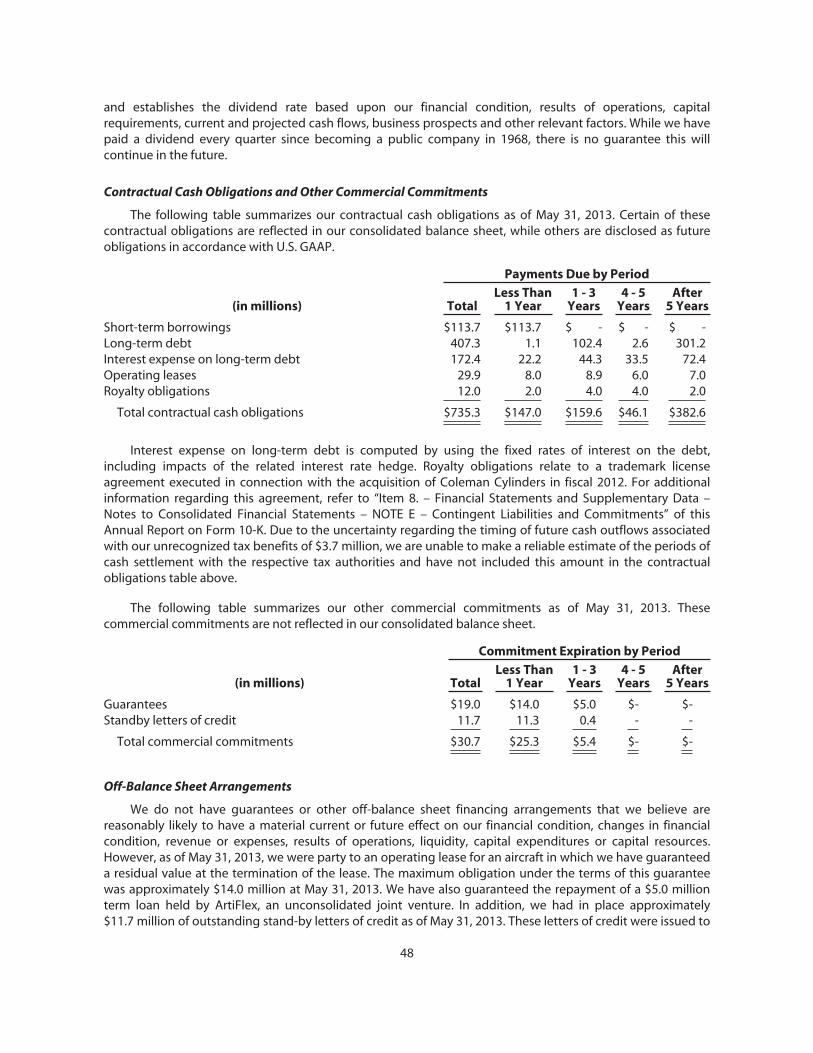
and establishes the dividend rate based upon our financial condition, results of operations, capitalrequirements, current and projected cash flows, business prospects and other relevant factors. While we havepaid a dividend every quarter since becoming a public company in 1968, there is no guarantee this willcontinue in the future.
Contractual Cash Obligations and Other Commercial Commitments
The following table summarizes our contractual cash obligations as of May 31, 2013. Certain of thesecontractual obligations are reflected in our consolidated balance sheet, while others are disclosed as futureobligations in accordance with U.S. GAAP.
Payments Due by Period
(in millions) TotalLess Than
1 Year1 - 3
Years4 - 5
YearsAfter
5 Years
Short-term borrowings $113.7 $113.7 $ - $ - $ -Long-term debt 407.3 1.1 102.4 2.6 301.2Interest expense on long-term debt 172.4 22.2 44.3 33.5 72.4Operating leases 29.9 8.0 8.9 6.0 7.0Royalty obligations 12.0 2.0 4.0 4.0 2.0
Total contractual cash obligations $735.3 $147.0 $159.6 $46.1 $382.6
Interest expense on long-term debt is computed by using the fixed rates of interest on the debt,including impacts of the related interest rate hedge. Royalty obligations relate to a trademark licenseagreement executed in connection with the acquisition of Coleman Cylinders in fiscal 2012. For additionalinformation regarding this agreement, refer to “Item 8. – Financial Statements and Supplementary Data –Notes to Consolidated Financial Statements – NOTE E – Contingent Liabilities and Commitments” of thisAnnual Report on Form 10-K. Due to the uncertainty regarding the timing of future cash outflows associatedwith our unrecognized tax benefits of $3.7 million, we are unable to make a reliable estimate of the periods ofcash settlement with the respective tax authorities and have not included this amount in the contractualobligations table above.
The following table summarizes our other commercial commitments as of May 31, 2013. Thesecommercial commitments are not reflected in our consolidated balance sheet.
Commitment Expiration by Period
(in millions) TotalLess Than
1 Year1 - 3
Years4 - 5
YearsAfter
5 Years
Guarantees $19.0 $14.0 $5.0 $- $-Standby letters of credit 11.7 11.3 0.4 - -
Total commercial commitments $30.7 $25.3 $5.4 $- $-
Off-Balance Sheet Arrangements
We do not have guarantees or other off-balance sheet financing arrangements that we believe arereasonably likely to have a material current or future effect on our financial condition, changes in financialcondition, revenue or expenses, results of operations, liquidity, capital expenditures or capital resources.However, as of May 31, 2013, we were party to an operating lease for an aircraft in which we have guaranteeda residual value at the termination of the lease. The maximum obligation under the terms of this guaranteewas approximately $14.0 million at May 31, 2013. We have also guaranteed the repayment of a $5.0 millionterm loan held by ArtiFlex, an unconsolidated joint venture. In addition, we had in place approximately$11.7 million of outstanding stand-by letters of credit as of May 31, 2013. These letters of credit were issued to
48

third-party service providers and had no amounts drawn against them at May 31, 2013. Based on current factsand circumstances, we have estimated the likelihood of payment pursuant to these guarantees, anddetermined that the fair value of our obligation under each guarantee based on those likely outcomes is notmaterial.
Recently Issued Accounting Standards
In December 2011, new accounting guidance was issued that establishes certain additional disclosurerequirements about financial instruments and derivative instruments that are subject to nettingarrangements. The new disclosures are required for annual reporting periods beginning on or after January 1,2013, and interim periods within those periods. We do not expect the adoption of this amended accountingguidance to have a material impact on our financial position or results of operations.
In June 2011, new accounting guidance was issued regarding the presentation of comprehensiveincome in financial statements prepared in accordance with U.S. GAAP. This new guidance requires entities topresent reclassification adjustments included in other comprehensive income on the face of the financialstatements and allows entities to present total comprehensive income, the components of net income andthe components of other comprehensive income either in a single continuous statement of comprehensiveincome or in two separate but consecutive statements. It also eliminates the option for entities to present thecomponents of other comprehensive income as part of the statement of equity. For public companies, thisaccounting guidance was effective for fiscal years (and interim periods within those fiscal years) beginningafter December 15, 2011, with early adoption permitted. Retrospective application to prior periods isrequired. We adopted the effective provisions of this new accounting guidance on June 1, 2012 and haveprovided the required statements of comprehensive income for the fiscal years ended May 31, 2013, 2012 and2011. In December 2011, certain provisions of this new guidance related to the presentation of reclassificationadjustments out of accumulated other comprehensive income were temporarily deferred. In February 2013,an effective date was established for the provisions that had been deferred. These provisions are effectiveprospectively for annual reporting periods, and interim periods within those annual periods, beginning afterDecember 15, 2012. We do not expect the adoption of these provisions, which relate to presentation only, tohave a material impact on our financial position or results of operations.
In September 2011, amended accounting guidance was issued that simplifies how an entity testsgoodwill for impairment. The amended guidance allows an entity to first assess qualitative factors todetermine whether it is necessary to perform the two-step quantitative goodwill impairment test. The two-step quantitative impairment test is required only if, based on its qualitative assessment, an entity determinesthat it is more likely than not that the fair value of a reporting unit is less than its carrying amount. Theamended guidance is effective for interim and annual goodwill impairment tests performed for fiscal yearsbeginning after December 15, 2011. Our adoption of this amended accounting guidance did not impact ourfinancial position or results of operations.
In July 2012, amended accounting guidance was issued that simplifies how an entity tests indefinite-lived intangible assets for impairment. The amended guidance allows an entity to first assess qualitativefactors to determine whether it is necessary to perform a quantitative impairment test. An entity will nolonger be required to calculate the fair value of an indefinite-lived intangible asset and perform thequantitative test unless the entity determines, based on a qualitative assessment, that it is more likely thannot that its fair value is less than its carrying amount. The amended guidance is effective for interim andannual indefinite-lived intangible asset impairment tests performed for fiscal years beginning afterSeptember 15, 2012, with early adoption permitted. We do not expect the adoption of this amendedaccounting guidance to have a material impact on our financial position or results of operations.
In March 2013, amended accounting guidance was issued regarding the accounting for cumulativetranslation adjustment. The amended guidance specifies that a cumulative translation adjustment should bereleased from earnings when an entity ceases to have a controlling financial interest in a subsidiary or a group
49

of assets within a consolidated foreign entity and the sale or transfer results in the complete or substantiallycomplete liquidation of the foreign entity. For sales of an equity method investment that is a foreign entity, apro rata portion of the cumulative translation adjustment attributable to the investment would be recognizedin earnings upon sale of the investment. The amended guidance is effective prospectively for annualreporting periods, and interim periods within those annual periods, beginning after December 15, 2013. Earlyadoption is permitted. We do not expect the adoption of this amended accounting guidance to have amaterial impact on our financial position or results of operations.
Environmental
We do not believe that compliance with environmental laws has or will have a material effect on ourcapital expenditures, future results of operations or financial position or competitive position.
Inflation
The effects of inflation on our operations were not significant during the periods presented in theconsolidated financial statements.
Critical Accounting Policies
The discussion and analysis of our financial condition and results of operations are based upon ourconsolidated financial statements, which have been prepared in accordance with U.S. GAAP. The preparationof these consolidated financial statements requires us to make estimates and assumptions that affect thereported amounts of assets and liabilities and the disclosure of contingent assets and liabilities at the date ofthe consolidated financial statements and the reported amounts of revenues and expenses during thereporting periods. We continually evaluate our estimates, including those related to our valuation ofreceivables, inventories, intangible assets, accrued liabilities, income and other tax accruals and contingenciesand litigation. We base our estimates on historical experience and various other assumptions that we believeto be reasonable under the circumstances. These results form the basis for making judgments about thecarrying values of assets and liabilities that are not readily apparent from other sources. Critical accountingpolicies are defined as those that reflect our significant judgments and uncertainties that could potentiallyresult in materially different results under different assumptions and conditions. Although actual resultshistorically have not deviated significantly from those determined using our estimates, as discussed below,our financial position or results of operations could be materially different if we were to report under differentconditions or to use different assumptions in the application of such policies. We believe the followingaccounting policies are the most critical to us, as these are the primary areas where financial information issubject to our estimates, assumptions and judgment in the preparation of our consolidated financialstatements.
Revenue Recognition: We recognize revenue upon transfer of title and risk of loss provided evidence ofan arrangement exists, pricing is fixed and determinable and the ability to collect is probable. Incircumstances where the collection of payment is not probable at the time of shipment, we defer recognitionof revenue until payment is collected. We provide for returns and allowances based on historical experienceand current customer activities.
The business units that comprise the Construction Services operating segment, which have contributedless than 5% of consolidated net sales for each of the last three fiscal years, recognize revenue on apercentage-of-completion method.
Receivables: In order to ensure that our receivables are properly valued, we utilize two contra-receivable accounts: returns and allowances and allowance for doubtful accounts. Returns and allowances areused to record estimates of returns or other allowances resulting from quality, delivery, discounts or otherissues affecting the value of receivables. This account is estimated based on historical trends and currentmarket conditions, with the offset to net sales.
50

The allowance for doubtful accounts is used to record the estimated risk of loss related to the customers’inability to pay. This allowance is maintained at a level that we consider appropriate based on factors thataffect collectability, such as the financial health of our customers, historical trends of charge-offs andrecoveries and current economic and market conditions. As we monitor our receivables, we identifycustomers that may have payment problems, and we adjust the allowance accordingly, with the offset toSG&A expense. Account balances are charged off against the allowance when recovery is considered remote.
We review our receivables on an ongoing basis to ensure that they are properly valued and collectible.Based on this review, we believe our related reserves are sized appropriately. The reserve for doubtfulaccounts increased approximately $0.1 million during fiscal 2013 to $3.4 million.
While we believe our allowances are adequate, changes in economic conditions, the financial health ofcustomers and bankruptcy settlements could impact our future earnings. If the economic environment andmarket conditions deteriorate, particularly in the automotive and construction end markets where ourexposure is greatest, additional reserves may be required.
Inventory Valuation: Our inventory is valued at the lower of cost or market, with cost determined usinga first-in, first-out method. This assessment requires the use of significant estimates to determine replacementcost, cost to complete, normal profit margin and ultimate selling price of the inventory. We believe that ourinventories were valued appropriately as of May 31, 2013 and 2012.
Impairment of Definite-Lived Long-Lived Assets: We review the carrying value of our long-lived assets,including intangible assets with finite useful lives, for impairment whenever events or changes incircumstances indicate that the carrying value of an asset or asset group may not be recoverable. Impairmenttesting involves a comparison of the sum of the undiscounted future cash flows of the asset or asset group toits respective carrying amount. If the sum of the undiscounted future cash flows exceeds the carrying amount,then no impairment exists. If the carrying amount exceeds the sum of the undiscounted future cash flows,then a second step is performed to determine the amount of impairment, if any, to be recognized. Animpairment loss is recognized to the extent that the carrying amount of the asset or asset group exceeds fairvalue.
Fiscal 2013: During the fourth quarter of fiscal 2013, due to current and projected operating losses at our60%-owned consolidated joint venture in India, we determined that certain indicators of impairment werepresent. Recoverability of the identified asset group was tested using future cash flow projections based onmanagement’s long-range estimates of market conditions. The sum of these undiscounted future cash flowswas less than the net book value of the asset group. The net book value was also determined to be in excessof fair value and, accordingly, the asset group was written down to its fair value of $6.9 million, resulting in animpairment charge of $5.0 million. This impairment loss was recorded within impairment of long-lived assetsin our consolidated statement of earnings. The portion of this impairment loss attributable to thenoncontrolling interest, or $2.0 million, is recorded within net earnings attributable to noncontrolling interestin our consolidated statement of earnings.
During the first quarter of fiscal 2013, our Pressure Cylinders operations in Czech Republic met theapplicable criteria for classification as assets held for sale. The net book value of this asset group wasdetermined to be in excess of fair value, and, as a result, this asset group was written down to its fair value lesscost to sell, or $6.9 million, resulting in an impairment charge of $1.6 million. On October 31, 2012, wecompleted the sale of this asset group to an unrelated third party resulting in a gain of approximately$50,000. The combined impact of these items of $1.5 million is presented within impairment of long-livedassets in our consolidated statement of earnings.
Fiscal 2012: During the fourth quarter of fiscal 2012, due largely to changes in the intended use of certainlong-lived assets within our Construction Services operating segment, we determined indicators ofimpairment were present. Recoverability of the identified asset group was tested using future cash flow
51
projections based on management’s long range estimates of market conditions. The sum of theseundiscounted future cash flows was less than the net book value of the asset group. The net book value wasalso determined to be in excess of fair value and, accordingly, the asset group was written down to its fairvalue of $0.2 million, resulting in an impairment charge of $0.4 million.
Impairment of Indefinite-Lived Long-Lived Assets: Goodwill and intangible assets with indefinite lives arenot amortized, but instead are tested for impairment annually, during the fourth quarter, or more frequently ifevents or changes in circumstances indicate that impairment may be present. Application of goodwillimpairment testing involves judgment, including but not limited to, the identification of reporting units andestimation of the fair value of each reporting unit. A reporting unit is defined as an operating segment or onelevel below an operating segment. We test goodwill at the operating segment level as we have determinedthat the characteristics of the reporting units within each operating segment are similar and allow for theiraggregation in accordance with the applicable accounting guidance.
The goodwill impairment test consists of comparing the fair value of each operating segment,determined using discounted cash flows, to each operating segment’s respective carrying value. If theestimated fair value of an operating segment exceeds its carrying value, there is no impairment. If the carryingamount of the operating segment exceeds its estimated fair value, a goodwill impairment is indicated. Theamount of the impairment is determined by comparing the fair value of the net assets of the operatingsegment, excluding goodwill, to its estimated fair value, with the difference representing the implied fairvalue of the goodwill. If the implied fair value of the goodwill is lower than its carrying value, the difference isrecorded as an impairment charge in our consolidated statements of earnings.
We performed our annual impairment evaluation of goodwill and other indefinite-lived intangible assetsduring the fourth quarter of fiscal 2013 and fiscal 2012 and concluded that the fair value of each reportingunit exceeded its carrying value; therefore, no impairment charges were recognized. As expected, theestimated fair value of the Engineered Cabs operating segment, which was formed in connection with therecent acquisition of Angus and had goodwill of $44.9 million at May 31, 2013, exceeded its carrying value byless than 10%. A 100 basis point decrease in the long-term growth rate for this operating segment coulddecrease the fair value by enough to result in some impairment based on the current forecast model. Futuredeclines in the market and deterioration in earnings could lead to a step 2 calculation to quantify a potentialimpairment.
Accounting for Derivatives and Other Contracts at Fair Value: We use derivatives in the normal course ofbusiness to manage our exposure to fluctuations in commodity prices, foreign currency and interest rates.Fair values for these contracts are based upon valuation methodologies deemed appropriate in thecircumstances; however, the use of different assumptions could affect the estimated fair values.
Stock-Based Compensation: All share-based awards to employees, including grants of employee stockoptions, are recorded as expense in the consolidated statements of earnings based on their fair values.
Income Taxes: In accordance with the authoritative accounting guidance, we account for income taxesusing the asset and liability method. The asset and liability method requires the recognition of deferred taxassets and liabilities for expected future tax consequences of temporary differences that currently existbetween the tax basis and financial reporting basis of our assets and liabilities. In assessing the realizability ofdeferred tax assets, we consider whether it is more likely than not that some, or a portion, of the deferred taxassets will not be realized. We provide a valuation allowance for deferred income tax assets when it is morelikely than not that a portion of such deferred income tax assets will not be realized.
In accordance with accounting literature related to uncertainty in income taxes, tax benefits fromuncertain tax positions that are recognized in the financial statements are measured based on the largestbenefit that has a greater than fifty percent likelihood of being realized upon ultimate settlement.
52

We have reserves for taxes and associated interest and penalties that may become payable in futureyears as a result of audits by taxing authorities. It is our policy to record these in income tax expense. While webelieve the positions taken on previously filed tax returns are appropriate, we have established the tax andinterest reserves in recognition that various taxing authorities may challenge our positions. The tax reservesare analyzed periodically, and adjustments are made as events occur to warrant adjustment to the reserves,such as lapsing of applicable statutes of limitations, conclusion of tax audits, additional exposure based oncurrent calculations, identification of new issues, and release of administrative guidance or court decisionsaffecting a particular tax issue.
Self-Insurance Reserves: We are largely self-insured with respect to workers’ compensation, general andautomobile liability, property damage, employee medical claims and other potential losses. In order to reducerisk and better manage our overall loss exposure, we purchase stop-loss insurance that covers individualclaims in excess of the deductible amounts. We maintain reserves for the estimated cost to settle open claims,which includes estimates of legal costs expected to be incurred, as well as an estimate of the cost of claimsthat have been incurred but not reported. These estimates are based on actuarial valuations that take intoconsideration the historical average claim volume, the average cost for settled claims, current trends in claimcosts, changes in our business and workforce, general economic factors and other assumptions believed to bereasonable under the circumstances. The estimated reserves for these liabilities could be affected if futureoccurrences and claims differ from assumptions used and historical trends. Facility consolidations, a focus onsafety initiatives and an emphasis on property loss prevention and product quality have resulted in animprovement in our loss history and the related assumptions used to analyze many of the current self-insurance reserves. We will continue to review these reserves on a quarterly basis, or more frequently if factorsdictate a more frequent review is warranted.
The critical accounting policies discussed herein are not intended to be a comprehensive list of all of ouraccounting policies. In many cases, the accounting treatment of a particular transaction is specifically dictatedby U.S. GAAP, with a lesser need for our judgment in their application. There are also areas in which ourjudgment in selecting an available alternative would not produce a materially different result.
Item 7A. — Quantitative and Qualitative Disclosures About Market Risk
In the normal course of business, we are exposed to various market risks. We continually monitor theserisks and regularly develop appropriate strategies to manage them. Accordingly, from time to time, we mayenter into certain financial and commodity-based derivative instruments. These instruments are used solelyto mitigate market exposure and are not used for trading or speculative purposes. Refer to “Item 8. – FinancialStatements and Supplementary Data – Notes to Consolidated Financial Statements – Note P – DerivativeInstruments and Hedging Activities” of this Annual Report on Form 10-K for additional information.
Interest Rate Risk
We entered into an interest rate swap in October 2004, which was amended December 17, 2004. Theswap has a notional amount of $100.0 million to hedge changes in cash flows attributable to changes in theLIBOR rate associated with the December 17, 2004, issuance of the 2014 Notes. See “Item 8 – FinancialStatements and Supplementary Data – Notes to Consolidated Financial Statements – Note G – Debt andReceivables Securitization” of this Annual Report on Form 10-K. The critical terms of the derivative correspondwith the critical terms of the underlying exposure. The interest rate swap was executed with a highly ratedfinancial institution. No credit loss is anticipated. We pay a fixed rate of 4.46% and receive a variable ratebased on the six-month LIBOR. A sensitivity analysis of changes in the interest rate yield curve associated withour interest rate swap indicates that a 10% parallel decline in the yield curve would not materially impact thefair value of our interest rate swap. A sensitivity analysis of changes in the interest rates on our variable ratedebt indicates that a 10% increase in those rates would not have materially impacted our reported results.Based on the terms of the noted derivative contract, such changes would also be expected to materially offsetagainst each other.
53
We entered into a U.S. Treasury Rate-based treasury lock in April 2010, in anticipation of the issuance of$150.0 million principal amount of our 2020 Notes. Refer to “Item 8. – Financial Statements andSupplementary Data – Notes to Consolidated Financial Statements – Note G – Debt and ReceivablesSecuritization” of this Annual Report on Form 10-K for additional information regarding the 2020 Notes. Thetreasury lock had a notional amount of $150.0 million to hedge the risk of changes in the semi-annual interestpayments attributable to changes in the benchmark interest rate during the several days leading up to theissuance of the 10-year fixed-rate debt. Upon pricing of the 2020 Notes, the derivative was settled andresulted in a loss of approximately $1.4 million, which has been reflected within other comprehensive incomeon the consolidated statements of equity. That balance is being recognized in earnings, as an increase tointerest expense, over the life of the related 2020 Notes.
Foreign Currency Risk
The translation of foreign currencies into United States dollars subjects us to exposure related tofluctuating exchange rates. Derivative instruments are not used to manage this risk; however, we do make useof forward contracts to manage exposure to certain intercompany loans with our foreign affiliates. Suchcontracts limit exposure to both favorable and unfavorable currency fluctuations. At May 31, 2013, thedifference between the contract and book value of these instruments was not material to our consolidatedfinancial position, results of operations or cash flows. A 10% change in the exchange rate to the U.S. dollarforward rate is not expected to materially impact our consolidated financial position, results of operations orcash flows. A sensitivity analysis of changes in the U.S. dollar on these foreign currency-denominatedcontracts indicates that if the U.S. dollar uniformly weakened by 10% against all of these currency exposures,the fair value of these instruments would not be materially impacted. Any resulting changes in fair valuewould be offset by changes in the underlying hedged balance sheet position. A sensitivity analysis of changesin the currency exchange rates of our foreign locations indicates that a 10% increase in those rates would nothave materially impacted our net results. The sensitivity analysis assumes a uniform shift in all foreigncurrency exchange rates. The assumption that exchange rates change in uniformity may overstate the impactof changing exchange rates on assets and liabilities denominated in a foreign currency.
Commodity Price Risk
We are exposed to market risk for price fluctuations on purchases of steel, natural gas, zinc and other rawmaterials as well as our utility requirements. We attempt to negotiate the best prices for commodities and tocompetitively price products and services to reflect the fluctuations in market prices. Derivative financialinstruments have been used to manage a portion of our exposure to fluctuations in the cost of certaincommodities, including steel, natural gas, zinc and other raw materials. These contracts covered periodscommensurate with known or expected exposures throughout the fiscal year ended May 31, 2013. Thederivative instruments were executed with highly rated financial institutions. No credit loss is anticipated. Noderivatives are held for trading purposes.
A sensitivity analysis of changes in the price of hedged commodities indicates that a 10% decline in themarket prices of steel, zinc, natural gas or any combination of these would not have a material impact to thevalue of our hedges or our reported results.
54
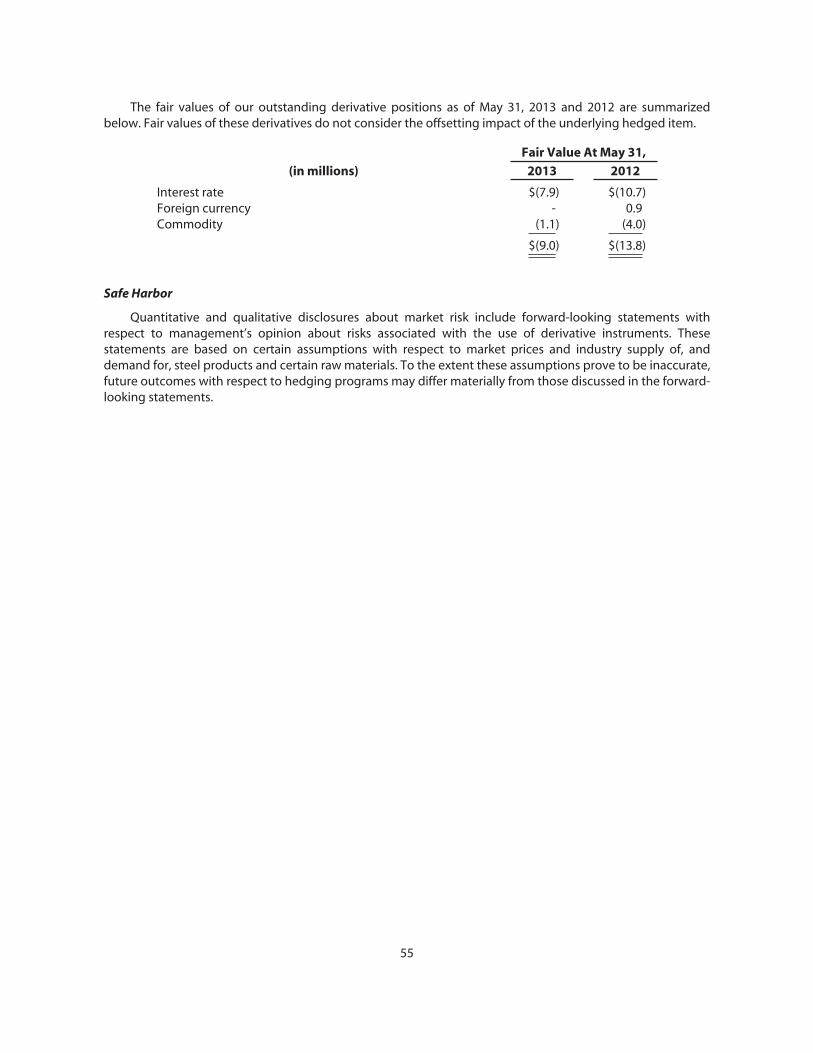
The fair values of our outstanding derivative positions as of May 31, 2013 and 2012 are summarizedbelow. Fair values of these derivatives do not consider the offsetting impact of the underlying hedged item.
Fair Value At May 31,
(in millions) 2013 2012
Interest rate $(7.9) $(10.7)Foreign currency - 0.9Commodity (1.1) (4.0)
$(9.0) $(13.8)
Safe Harbor
Quantitative and qualitative disclosures about market risk include forward-looking statements withrespect to management’s opinion about risks associated with the use of derivative instruments. Thesestatements are based on certain assumptions with respect to market prices and industry supply of, anddemand for, steel products and certain raw materials. To the extent these assumptions prove to be inaccurate,future outcomes with respect to hedging programs may differ materially from those discussed in the forward-looking statements.
55
Item 8. — Financial Statements and Supplementary Data
Report of Independent Registered Public Accounting Firm
The Board of Directors and ShareholdersWorthington Industries, Inc.:
We have audited the accompanying consolidated balance sheets of Worthington Industries, Inc.and subsidiaries as of May 31, 2013 and 2012, and the related consolidated statements of earnings,comprehensive income, equity, and cash flows for each of the years in the three-year period ended May 31,2013. In connection with our audits of the consolidated financial statements, we also have audited thefinancial statement schedule of valuation and qualifying accounts. These consolidated financial statementsand financial statement schedule are the responsibility of the Company’s management. Our responsibility isto express an opinion on these consolidated financial statements and financial statement schedule based onour audits.
We conducted our audits in accordance with the standards of the Public Company Accounting OversightBoard (United States). Those standards require that we plan and perform the audit to obtain reasonableassurance about whether the financial statements are free of material misstatement. An audit includesexamining, on a test basis, evidence supporting the amounts and disclosures in the financial statements. Anaudit also includes assessing the accounting principles used and significant estimates made by management,as well as evaluating the overall financial statement presentation. We believe that our audits provide areasonable basis for our opinion.
In our opinion, the consolidated financial statements referred to above present fairly, in all material respects,the financial position of Worthington Industries, Inc. and subsidiaries as of May 31, 2013 and 2012, and theresults of their operations and their cash flows for each of the years in the three-year period ended May 31,2013, in conformity with U.S. generally accepted accounting principles. Also in our opinion, the relatedfinancial statement schedule, when considered in relation to the basic consolidated financial statementstaken as a whole, presents fairly, in all material respects, the information set forth therein.
We also have audited, in accordance with the standards of the Public Company Accounting Oversight Board(United States), Worthington Industries, Inc.’s internal control over financial reporting as of May 31, 2013,based on criteria established in Internal Control – Integrated Framework issued by the Committee ofSponsoring Organizations of the Treadway Commission (COSO), and our report dated July 30, 2013 expressedan unqualified opinion on the effectiveness of the Company’s internal control over financial reporting.
/s/ KPMG LLP
Columbus, OhioJuly 30, 2013
56
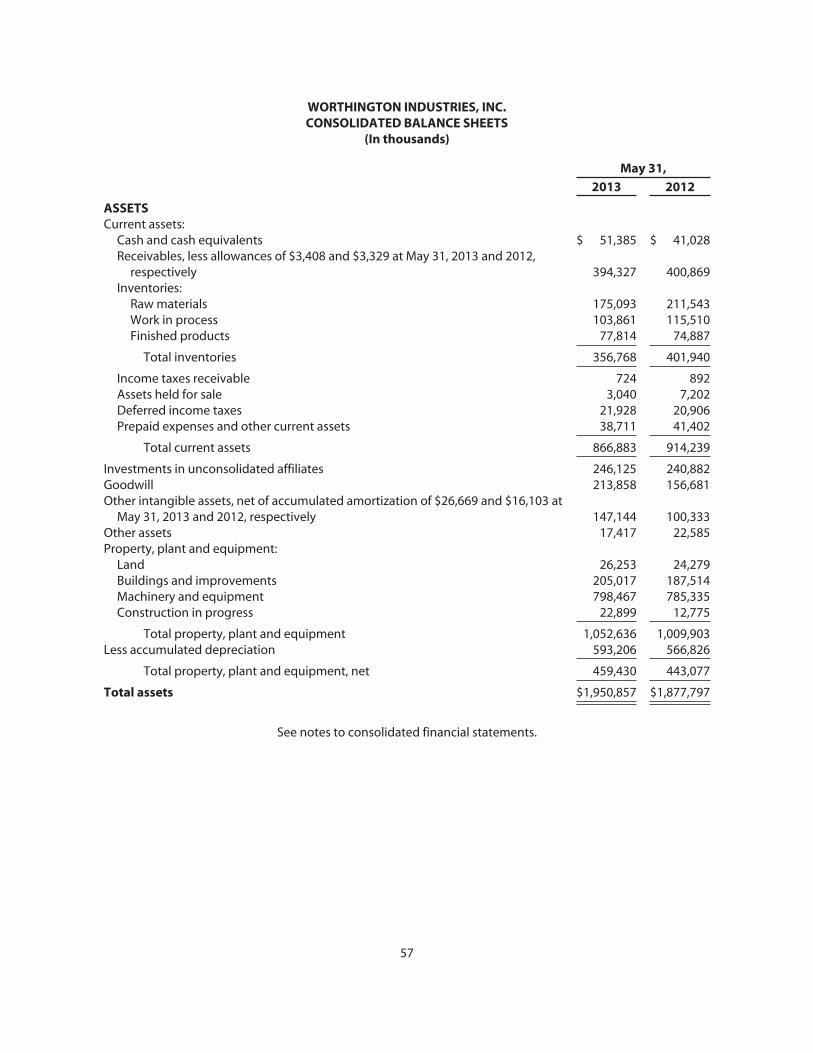
WORTHINGTON INDUSTRIES, INC.CONSOLIDATED BALANCE SHEETS
(In thousands)
May 31,
2013 2012
ASSETSCurrent assets:
Cash and cash equivalents $ 51,385 $ 41,028Receivables, less allowances of $3,408 and $3,329 at May 31, 2013 and 2012,
respectively 394,327 400,869Inventories:
Raw materials 175,093 211,543Work in process 103,861 115,510Finished products 77,814 74,887
Total inventories 356,768 401,940
Income taxes receivable 724 892Assets held for sale 3,040 7,202Deferred income taxes 21,928 20,906Prepaid expenses and other current assets 38,711 41,402
Total current assets 866,883 914,239
Investments in unconsolidated affiliates 246,125 240,882Goodwill 213,858 156,681Other intangible assets, net of accumulated amortization of $26,669 and $16,103 at
May 31, 2013 and 2012, respectively 147,144 100,333Other assets 17,417 22,585Property, plant and equipment:
Land 26,253 24,279Buildings and improvements 205,017 187,514Machinery and equipment 798,467 785,335Construction in progress 22,899 12,775
Total property, plant and equipment 1,052,636 1,009,903Less accumulated depreciation 593,206 566,826
Total property, plant and equipment, net 459,430 443,077
Total assets $1,950,857 $1,877,797
See notes to consolidated financial statements.
57
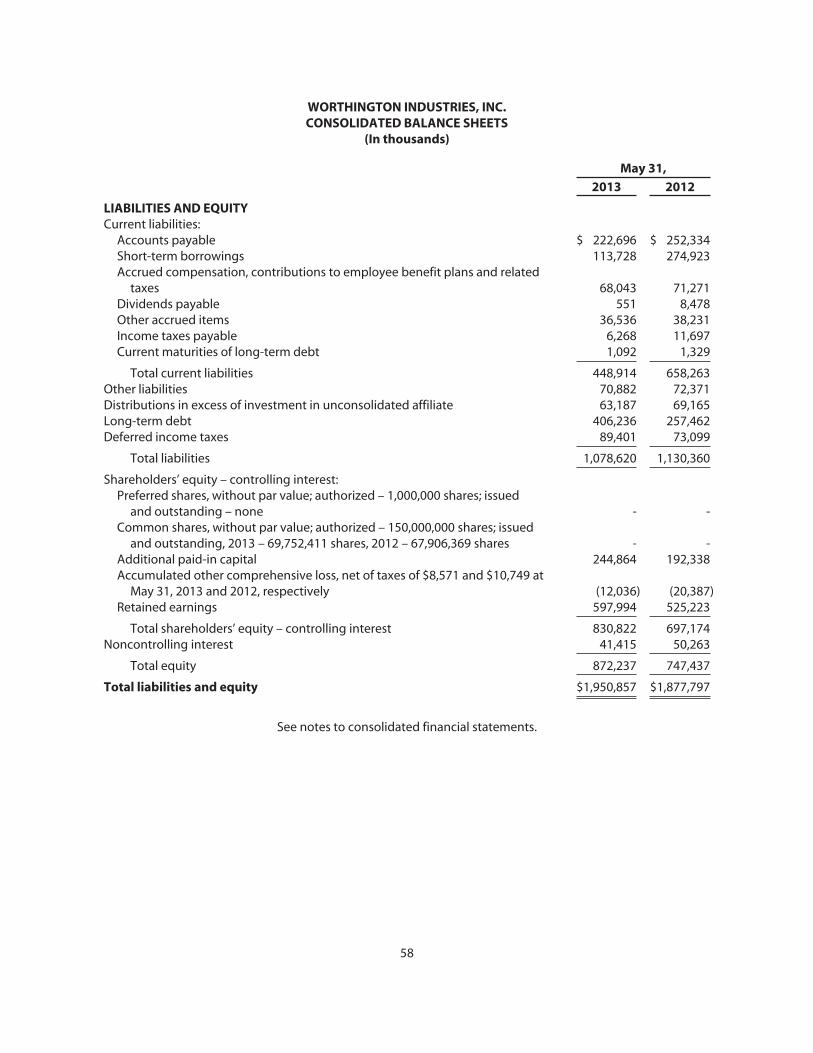
WORTHINGTON INDUSTRIES, INC.CONSOLIDATED BALANCE SHEETS
(In thousands)
May 31,
2013 2012
LIABILITIES AND EQUITYCurrent liabilities:
Accounts payable $ 222,696 $ 252,334Short-term borrowings 113,728 274,923Accrued compensation, contributions to employee benefit plans and related
taxes 68,043 71,271Dividends payable 551 8,478Other accrued items 36,536 38,231Income taxes payable 6,268 11,697Current maturities of long-term debt 1,092 1,329
Total current liabilities 448,914 658,263Other liabilities 70,882 72,371Distributions in excess of investment in unconsolidated affiliate 63,187 69,165Long-term debt 406,236 257,462Deferred income taxes 89,401 73,099
Total liabilities 1,078,620 1,130,360
Shareholders’ equity – controlling interest:Preferred shares, without par value; authorized – 1,000,000 shares; issued
and outstanding – none - -Common shares, without par value; authorized – 150,000,000 shares; issued
and outstanding, 2013 – 69,752,411 shares, 2012 – 67,906,369 shares - -Additional paid-in capital 244,864 192,338Accumulated other comprehensive loss, net of taxes of $8,571 and $10,749 at
May 31, 2013 and 2012, respectively (12,036) (20,387)Retained earnings 597,994 525,223
Total shareholders’ equity – controlling interest 830,822 697,174Noncontrolling interest 41,415 50,263
Total equity 872,237 747,437
Total liabilities and equity $1,950,857 $1,877,797
See notes to consolidated financial statements.
58

WORTHINGTON INDUSTRIES, INC.CONSOLIDATED STATEMENTS OF EARNINGS
(In thousands, except per share amounts)
Fiscal Years Ended May 31,
2013 2012 2011
Net sales $2,612,244 $2,534,701 $2,442,624Cost of goods sold 2,215,601 2,201,833 2,086,467
Gross margin 396,643 332,868 356,157Selling, general and administrative expense 258,324 225,069 235,198Impairment of long-lived assets 6,488 355 4,386Restructuring and other expense 3,293 5,984 2,653Joint venture transactions (604) (150) (10,436)
Operating income 129,142 101,610 124,356Other income (expense):
Miscellaneous income 1,452 2,319 597Interest expense (23,918) (19,497) (18,756)Equity in net income of unconsolidated affiliates 94,624 92,825 76,333
Earnings before income taxes 201,300 177,257 182,530Income tax expense 64,465 51,904 58,496
Net earnings 136,835 125,353 124,034Net earnings attributable to noncontrolling interest 393 9,758 8,968
Net earnings attributable to controlling interest $ 136,442 $ 115,595 $ 115,066
BasicAverage common shares outstanding 69,301 69,651 74,803
Earnings per share attributable to controlling interest $ 1.97 $ 1.66 $ 1.54
DilutedAverage common shares outstanding 71,314 70,252 75,409
Earnings per share attributable to controlling interest $ 1.91 $ 1.65 $ 1.53
See notes to consolidated financial statements.
59
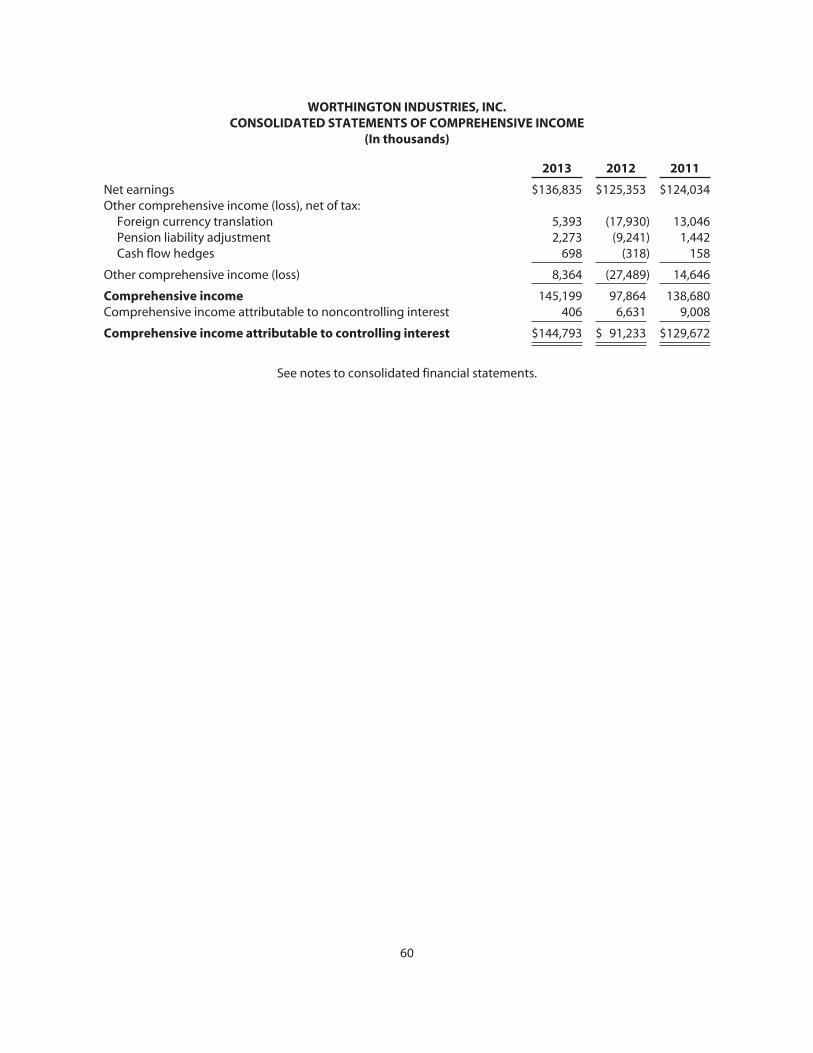
WORTHINGTON INDUSTRIES, INC.CONSOLIDATED STATEMENTS OF COMPREHENSIVE INCOME
(In thousands)
2013 2012 2011
Net earnings $136,835 $125,353 $124,034Other comprehensive income (loss), net of tax:
Foreign currency translation 5,393 (17,930) 13,046Pension liability adjustment 2,273 (9,241) 1,442Cash flow hedges 698 (318) 158
Other comprehensive income (loss) 8,364 (27,489) 14,646
Comprehensive income 145,199 97,864 138,680Comprehensive income attributable to noncontrolling interest 406 6,631 9,008
Comprehensive income attributable to controlling interest $144,793 $ 91,233 $129,672
See notes to consolidated financial statements.
60
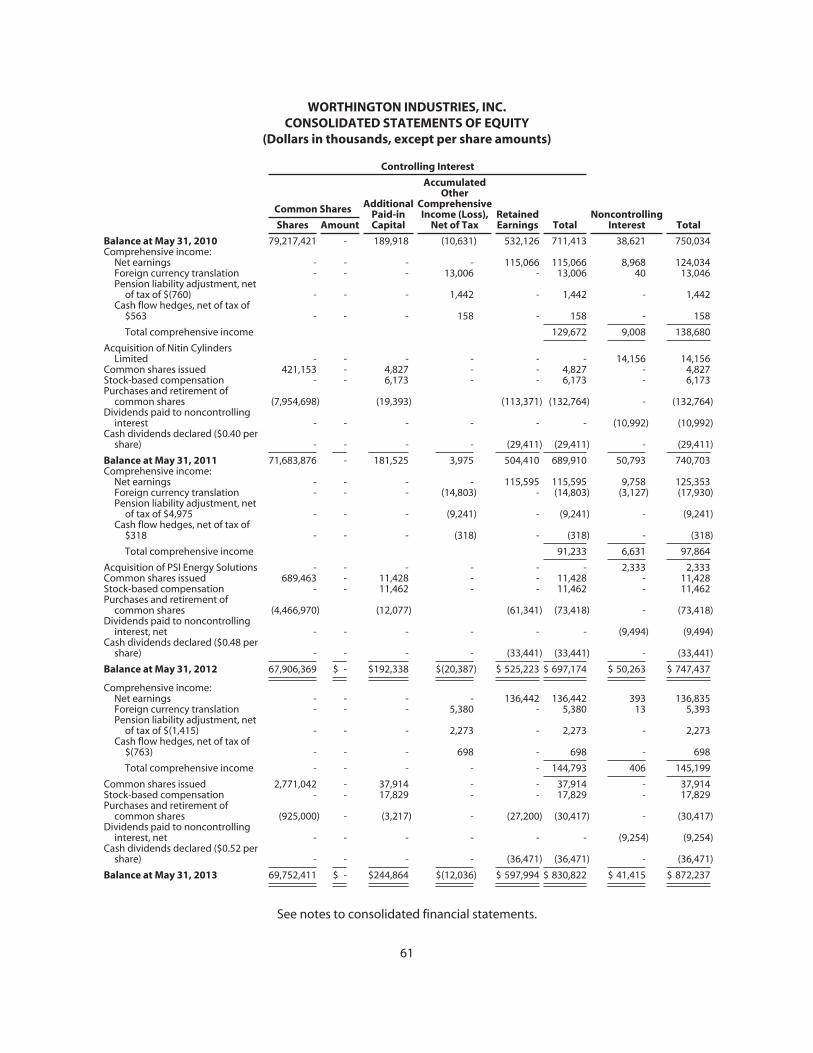
WORTHINGTON INDUSTRIES, INC.CONSOLIDATED STATEMENTS OF EQUITY
(Dollars in thousands, except per share amounts)
Controlling Interest
Common Shares AdditionalPaid-inCapital
AccumulatedOther
ComprehensiveIncome (Loss),
Net of TaxRetainedEarnings Total
NoncontrollingInterest TotalShares Amount
Balance at May 31, 2010 79,217,421 - 189,918 (10,631) 532,126 711,413 38,621 750,034Comprehensive income:
Net earnings - - - - 115,066 115,066 8,968 124,034Foreign currency translation - - - 13,006 - 13,006 40 13,046Pension liability adjustment, net
of tax of $(760) - - - 1,442 - 1,442 - 1,442Cash flow hedges, net of tax of
$563 - - - 158 - 158 - 158
Total comprehensive income 129,672 9,008 138,680
Acquisition of Nitin CylindersLimited - - - - - - 14,156 14,156
Common shares issued 421,153 - 4,827 - - 4,827 - 4,827Stock-based compensation - - 6,173 - - 6,173 - 6,173Purchases and retirement of
common shares (7,954,698) (19,393) (113,371) (132,764) - (132,764)Dividends paid to noncontrolling
interest - - - - - - (10,992) (10,992)Cash dividends declared ($0.40 per
share) - - - - (29,411) (29,411) - (29,411)
Balance at May 31, 2011 71,683,876 - 181,525 3,975 504,410 689,910 50,793 740,703Comprehensive income:
Net earnings - - - - 115,595 115,595 9,758 125,353Foreign currency translation - - - (14,803) - (14,803) (3,127) (17,930)Pension liability adjustment, net
of tax of $4,975 - - - (9,241) - (9,241) - (9,241)Cash flow hedges, net of tax of
$318 - - - (318) - (318) - (318)
Total comprehensive income 91,233 6,631 97,864
Acquisition of PSI Energy Solutions - - - - - - 2,333 2,333Common shares issued 689,463 - 11,428 - - 11,428 - 11,428Stock-based compensation - - 11,462 - - 11,462 - 11,462Purchases and retirement of
common shares (4,466,970) (12,077) (61,341) (73,418) - (73,418)Dividends paid to noncontrolling
interest, net - - - - - - (9,494) (9,494)Cash dividends declared ($0.48 per
share) - - - - (33,441) (33,441) - (33,441)
Balance at May 31, 2012 67,906,369 $ - $192,338 $(20,387) $ 525,223 $ 697,174 $ 50,263 $ 747,437
Comprehensive income:Net earnings - - - - 136,442 136,442 393 136,835Foreign currency translation - - - 5,380 - 5,380 13 5,393Pension liability adjustment, net
of tax of $(1,415) - - - 2,273 - 2,273 - 2,273Cash flow hedges, net of tax of
$(763) - - - 698 - 698 - 698
Total comprehensive income - - - - - 144,793 406 145,199
Common shares issued 2,771,042 - 37,914 - - 37,914 - 37,914Stock-based compensation - - 17,829 - - 17,829 - 17,829Purchases and retirement of
common shares (925,000) - (3,217) - (27,200) (30,417) - (30,417)Dividends paid to noncontrolling
interest, net - - - - - - (9,254) (9,254)Cash dividends declared ($0.52 per
share) - - - - (36,471) (36,471) - (36,471)
Balance at May 31, 2013 69,752,411 $ - $244,864 $(12,036) $ 597,994 $ 830,822 $ 41,415 $ 872,237
See notes to consolidated financial statements.
61
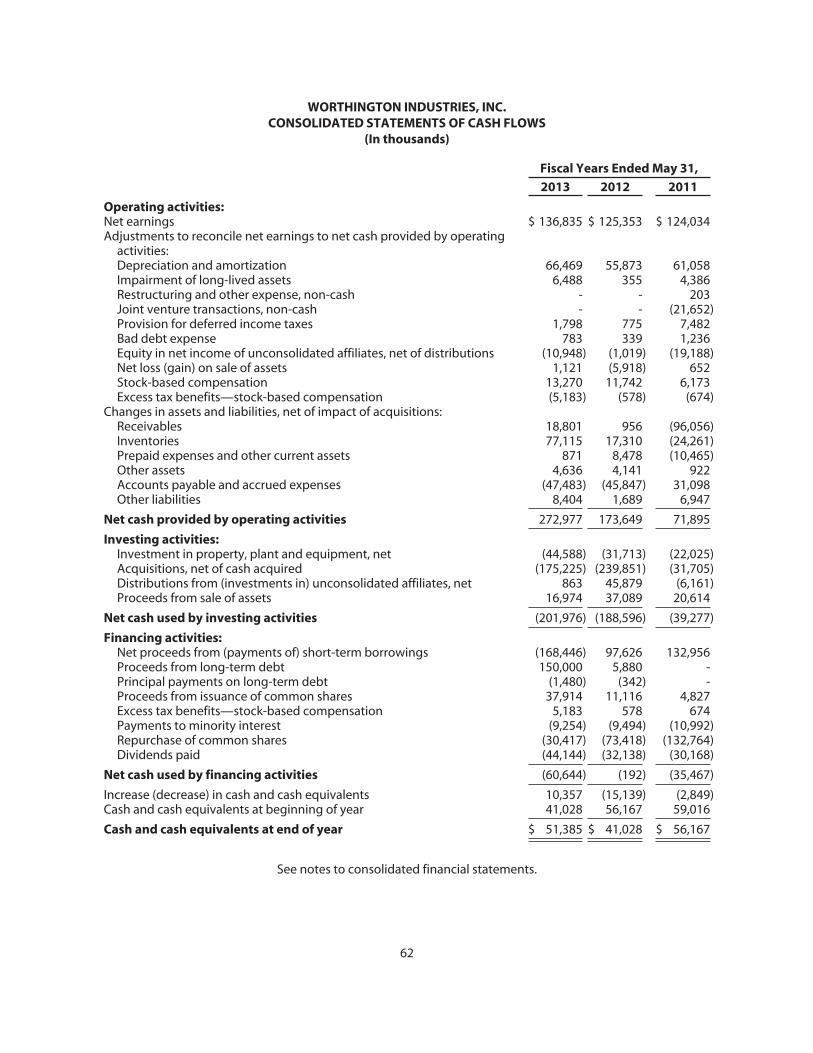
WORTHINGTON INDUSTRIES, INC.CONSOLIDATED STATEMENTS OF CASH FLOWS
(In thousands)
Fiscal Years Ended May 31,
2013 2012 2011
Operating activities:Net earnings $ 136,835 $ 125,353 $ 124,034Adjustments to reconcile net earnings to net cash provided by operating
activities:Depreciation and amortization 66,469 55,873 61,058Impairment of long-lived assets 6,488 355 4,386Restructuring and other expense, non-cash - - 203Joint venture transactions, non-cash - - (21,652)Provision for deferred income taxes 1,798 775 7,482Bad debt expense 783 339 1,236Equity in net income of unconsolidated affiliates, net of distributions (10,948) (1,019) (19,188)Net loss (gain) on sale of assets 1,121 (5,918) 652Stock-based compensation 13,270 11,742 6,173Excess tax benefits—stock-based compensation (5,183) (578) (674)
Changes in assets and liabilities, net of impact of acquisitions:Receivables 18,801 956 (96,056)Inventories 77,115 17,310 (24,261)Prepaid expenses and other current assets 871 8,478 (10,465)Other assets 4,636 4,141 922Accounts payable and accrued expenses (47,483) (45,847) 31,098Other liabilities 8,404 1,689 6,947
Net cash provided by operating activities 272,977 173,649 71,895
Investing activities:Investment in property, plant and equipment, net (44,588) (31,713) (22,025)Acquisitions, net of cash acquired (175,225) (239,851) (31,705)Distributions from (investments in) unconsolidated affiliates, net 863 45,879 (6,161)Proceeds from sale of assets 16,974 37,089 20,614
Net cash used by investing activities (201,976) (188,596) (39,277)
Financing activities:Net proceeds from (payments of) short-term borrowings (168,446) 97,626 132,956Proceeds from long-term debt 150,000 5,880 -Principal payments on long-term debt (1,480) (342) -Proceeds from issuance of common shares 37,914 11,116 4,827Excess tax benefits—stock-based compensation 5,183 578 674Payments to minority interest (9,254) (9,494) (10,992)Repurchase of common shares (30,417) (73,418) (132,764)Dividends paid (44,144) (32,138) (30,168)
Net cash used by financing activities (60,644) (192) (35,467)
Increase (decrease) in cash and cash equivalents 10,357 (15,139) (2,849)Cash and cash equivalents at beginning of year 41,028 56,167 59,016
Cash and cash equivalents at end of year $ 51,385 $ 41,028 $ 56,167
See notes to consolidated financial statements.
62
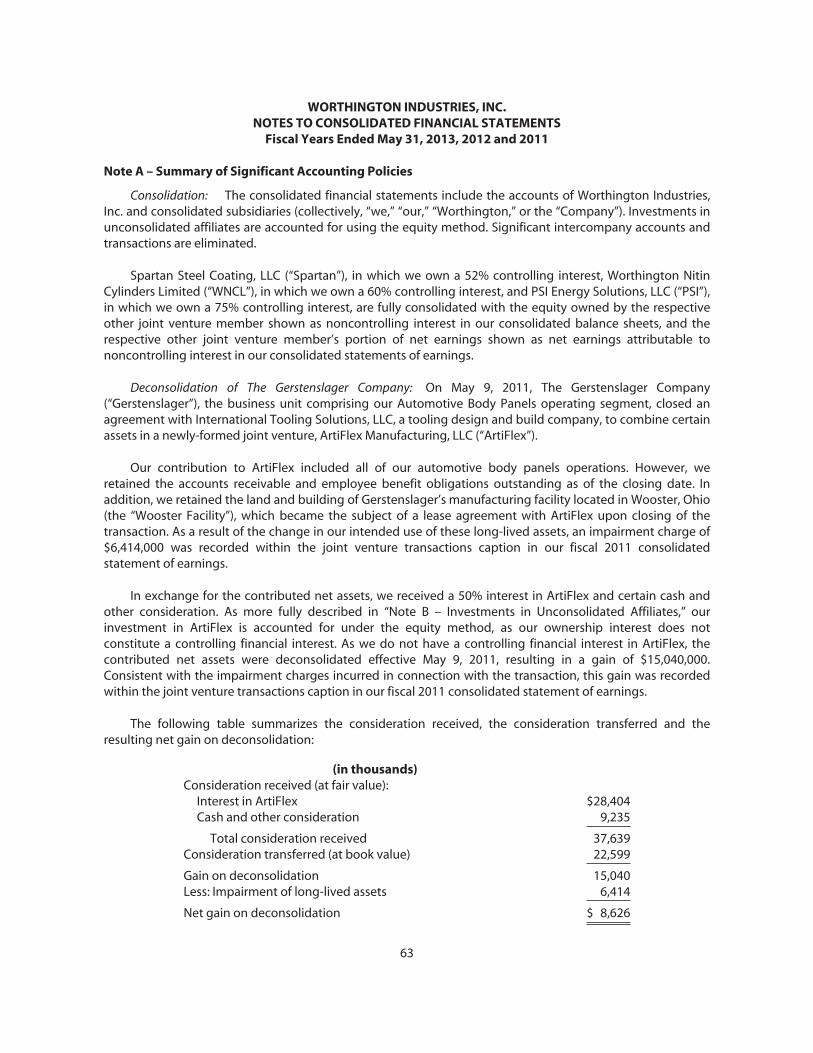
WORTHINGTON INDUSTRIES, INC.NOTES TO CONSOLIDATED FINANCIAL STATEMENTS
Fiscal Years Ended May 31, 2013, 2012 and 2011
Note A – Summary of Significant Accounting Policies
Consolidation: The consolidated financial statements include the accounts of Worthington Industries,Inc. and consolidated subsidiaries (collectively, “we,” “our,” “Worthington,” or the “Company”). Investments inunconsolidated affiliates are accounted for using the equity method. Significant intercompany accounts andtransactions are eliminated.
Spartan Steel Coating, LLC (“Spartan”), in which we own a 52% controlling interest, Worthington NitinCylinders Limited (“WNCL”), in which we own a 60% controlling interest, and PSI Energy Solutions, LLC (“PSI”),in which we own a 75% controlling interest, are fully consolidated with the equity owned by the respectiveother joint venture member shown as noncontrolling interest in our consolidated balance sheets, and therespective other joint venture member’s portion of net earnings shown as net earnings attributable tononcontrolling interest in our consolidated statements of earnings.
Deconsolidation of The Gerstenslager Company: On May 9, 2011, The Gerstenslager Company(“Gerstenslager”), the business unit comprising our Automotive Body Panels operating segment, closed anagreement with International Tooling Solutions, LLC, a tooling design and build company, to combine certainassets in a newly-formed joint venture, ArtiFlex Manufacturing, LLC (“ArtiFlex”).
Our contribution to ArtiFlex included all of our automotive body panels operations. However, weretained the accounts receivable and employee benefit obligations outstanding as of the closing date. Inaddition, we retained the land and building of Gerstenslager’s manufacturing facility located in Wooster, Ohio(the “Wooster Facility”), which became the subject of a lease agreement with ArtiFlex upon closing of thetransaction. As a result of the change in our intended use of these long-lived assets, an impairment charge of$6,414,000 was recorded within the joint venture transactions caption in our fiscal 2011 consolidatedstatement of earnings.
In exchange for the contributed net assets, we received a 50% interest in ArtiFlex and certain cash andother consideration. As more fully described in “Note B – Investments in Unconsolidated Affiliates,” ourinvestment in ArtiFlex is accounted for under the equity method, as our ownership interest does notconstitute a controlling financial interest. As we do not have a controlling financial interest in ArtiFlex, thecontributed net assets were deconsolidated effective May 9, 2011, resulting in a gain of $15,040,000.Consistent with the impairment charges incurred in connection with the transaction, this gain was recordedwithin the joint venture transactions caption in our fiscal 2011 consolidated statement of earnings.
The following table summarizes the consideration received, the consideration transferred and theresulting net gain on deconsolidation:
(in thousands)Consideration received (at fair value):
Interest in ArtiFlex $28,404Cash and other consideration 9,235
Total consideration received 37,639Consideration transferred (at book value) 22,599
Gain on deconsolidation 15,040Less: Impairment of long-lived assets 6,414
Net gain on deconsolidation $ 8,626
63
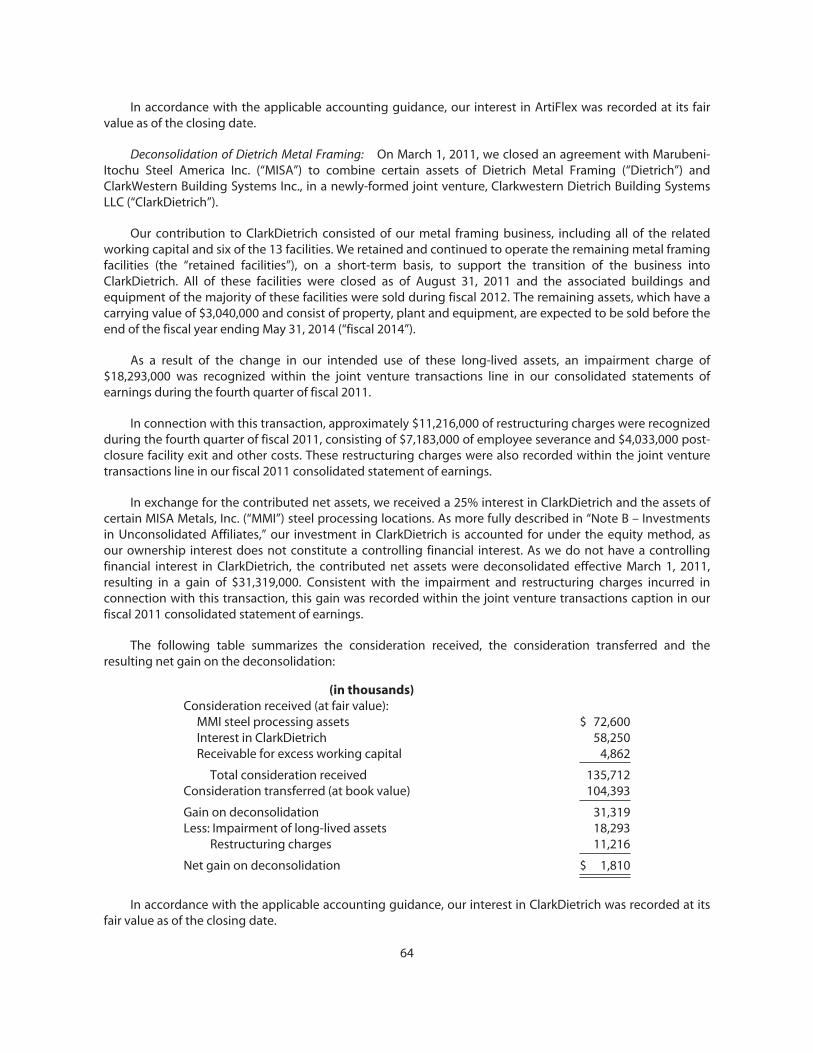
In accordance with the applicable accounting guidance, our interest in ArtiFlex was recorded at its fairvalue as of the closing date.
Deconsolidation of Dietrich Metal Framing: On March 1, 2011, we closed an agreement with Marubeni-Itochu Steel America Inc. (“MISA”) to combine certain assets of Dietrich Metal Framing (“Dietrich”) andClarkWestern Building Systems Inc., in a newly-formed joint venture, Clarkwestern Dietrich Building SystemsLLC (“ClarkDietrich”).
Our contribution to ClarkDietrich consisted of our metal framing business, including all of the relatedworking capital and six of the 13 facilities. We retained and continued to operate the remaining metal framingfacilities (the “retained facilities”), on a short-term basis, to support the transition of the business intoClarkDietrich. All of these facilities were closed as of August 31, 2011 and the associated buildings andequipment of the majority of these facilities were sold during fiscal 2012. The remaining assets, which have acarrying value of $3,040,000 and consist of property, plant and equipment, are expected to be sold before theend of the fiscal year ending May 31, 2014 (“fiscal 2014”).
As a result of the change in our intended use of these long-lived assets, an impairment charge of$18,293,000 was recognized within the joint venture transactions line in our consolidated statements ofearnings during the fourth quarter of fiscal 2011.
In connection with this transaction, approximately $11,216,000 of restructuring charges were recognizedduring the fourth quarter of fiscal 2011, consisting of $7,183,000 of employee severance and $4,033,000 post-closure facility exit and other costs. These restructuring charges were also recorded within the joint venturetransactions line in our fiscal 2011 consolidated statement of earnings.
In exchange for the contributed net assets, we received a 25% interest in ClarkDietrich and the assets ofcertain MISA Metals, Inc. (“MMI”) steel processing locations. As more fully described in “Note B – Investmentsin Unconsolidated Affiliates,” our investment in ClarkDietrich is accounted for under the equity method, asour ownership interest does not constitute a controlling financial interest. As we do not have a controllingfinancial interest in ClarkDietrich, the contributed net assets were deconsolidated effective March 1, 2011,resulting in a gain of $31,319,000. Consistent with the impairment and restructuring charges incurred inconnection with this transaction, this gain was recorded within the joint venture transactions caption in ourfiscal 2011 consolidated statement of earnings.
The following table summarizes the consideration received, the consideration transferred and theresulting net gain on the deconsolidation:
(in thousands)Consideration received (at fair value):
MMI steel processing assets $ 72,600Interest in ClarkDietrich 58,250Receivable for excess working capital 4,862
Total consideration received 135,712Consideration transferred (at book value) 104,393
Gain on deconsolidation 31,319Less: Impairment of long-lived assets 18,293
Restructuring charges 11,216
Net gain on deconsolidation $ 1,810
In accordance with the applicable accounting guidance, our interest in ClarkDietrich was recorded at itsfair value as of the closing date.
64
Use of Estimates: The preparation of financial statements in conformity with accounting principlesgenerally accepted in the United States (“U.S. GAAP”) requires management to make estimates andassumptions that affect the amounts reported in the financial statements and accompanying notes. Actualresults could differ from those estimates.
Cash and Cash Equivalents: We consider all highly liquid investments purchased with an originalmaturity of three months or less to be cash equivalents.
Inventories: Inventories are valued at the lower of cost or market. Cost is determined using the first-in,first-out method for all inventories. We believe our inventories were valued appropriately as of May 31, 2013and May 31, 2012.
Derivative Financial Instruments: We utilize derivative financial instruments to manage exposure tocertain risks related to our ongoing operations. The primary risks managed through the use of derivativeinstruments include interest rate risk, currency exchange risk and commodity price risk. All derivativeinstruments are accounted for using mark-to-market accounting. The accounting for changes in the fair valueof a derivative instrument depends on whether it has been designated and qualifies as part of a hedgingrelationship and, if so, the reason for holding it. Gains and losses on fair value hedges are recognized incurrent period earnings in the same line as the underlying hedged item. The effective portion of gains andlosses on cash flow hedges is deferred as a component of accumulated other comprehensive income (“AOCI”)and recognized in earnings at the time the hedged item affects earnings, in the same financial statementcaption as the underlying hedged item. Ineffectiveness of the hedges during the fiscal year ended May 31,2013 (“fiscal 2013”), the fiscal year ended May 31, 2012 (“fiscal 2012”) and the fiscal year ended May 31, 2011(“fiscal 2011”) was immaterial. Classification in the consolidated statements of earnings of gains and lossesrelated to derivative instruments that do not qualify for hedge accounting is determined based on theunderlying intent of the instruments. Cash flows related to derivative instruments are generally classified asoperating activities in our consolidated statements of cash flows.
In order for hedging relationships to qualify for hedge accounting under current accounting guidance,we formally document each hedging relationship and its risk management objective. This documentationincludes the hedge strategy, the hedging instrument, the hedged item, the nature of the risk being hedged,how hedge effectiveness will be assessed prospectively and retrospectively as well as a description of themethod used to measure hedge ineffectiveness.
Derivative instruments are executed only with highly rated financial institutions. No credit loss isanticipated on existing instruments, and no such material losses have been experienced to date. We continueto monitor our positions, as well as the credit ratings of counterparties to those positions.
We discontinue hedge accounting when it is determined that the derivative instrument is no longereffective in offsetting the hedged risk, expires or is sold, is terminated or is no longer designated as a hedginginstrument because it is unlikely that a forecasted transaction will occur or we determine that designation ofthe hedging instrument is no longer appropriate. In all situations in which hedge accounting is discontinuedand the derivative instrument is retained, we continue to carry the derivative instrument at its fair value onthe consolidated balance sheet and recognize any subsequent changes in its fair value in net earningsimmediately. When it is probable that a forecasted transaction will not occur, we discontinue hedgeaccounting and immediately recognize the gains and losses that were accumulated in AOCI.
Refer to “Note P – Derivative Instruments and Hedging Activities” for additional information regardingthe consolidated balance sheet location and the risk classification of our derivative instruments.
Risks and Uncertainties: As of May 31, 2013, we, together with our unconsolidated affiliates, operated 83production facilities in 24 states and 11 countries. Our largest market is the automotive market, which
65

comprised 32% of consolidated net sales in fiscal 2013. Our foreign operations represented 7% ofconsolidated net sales, 1% of pre-tax earnings attributable to controlling interest, and 19% of consolidatednet assets as of and for the year ended May 31, 2013. As of May 31, 2013, approximately 7% of ourconsolidated labor force was represented by collective bargaining agreements. The concentration of creditrisks from financial instruments related to the markets we serve is not expected to have a material adverseeffect on our consolidated financial position, cash flows or future results of operations.
In fiscal 2013, our largest customer accounted for approximately 5% of our consolidated net sales, andour ten largest customers accounted for approximately 25% of our consolidated net sales. A significant lossof, or decrease in, business from any of these customers could have an adverse effect on our sales andfinancial results if we cannot obtain replacement business. Also, due to consolidation within the industries weserve, including the construction, automotive and retail industries, our sales may be increasingly sensitive todeterioration in the financial condition of, or other adverse developments with respect to, one or more of ourlargest customers.
Our principal raw material is flat-rolled steel, which we purchase from multiple primary steel producers.The steel industry as a whole has been cyclical, and at times availability and pricing can be volatile due to anumber of factors beyond our control. This volatility can significantly affect our steel costs. In an environmentof increasing prices for steel and other raw materials, in general, competitive conditions may impact howmuch of the price increases we can pass on to our customers. To the extent we are unable to pass on futureprice increases in our raw materials to our customers, our financial results could be adversely affected. Also, ifsteel prices decrease, in general, competitive conditions may impact how quickly we must reduce our pricesto our customers and we could be forced to use higher-priced raw materials to complete orders for which theselling prices have decreased. Declining steel prices could also require us to write-down the value of ourinventories to reflect current market pricing. Further, the number of suppliers has decreased in recent yearsdue to industry consolidation and the financial difficulties of certain suppliers, and consolidation maycontinue. Accordingly, if delivery from a major steel supplier is disrupted, it may be more difficult to obtain analternative supply than in the past.
Receivables: We review our receivables on an ongoing basis to ensure that they are properly valued andcollectible. This is accomplished through two contra-receivable accounts: returns and allowances andallowance for doubtful accounts. Returns and allowances, including limited warranties on certain products,are used to record estimates of returns or other allowances resulting from quality, delivery, discounts or otherissues affecting the value of receivables. This account is estimated based on historical trends and currentmarket conditions, with the offset to net sales. The portion of the liability related to product warranties wasimmaterial at May 31, 2013 and 2012.
The allowance for doubtful accounts is used to record the estimated risk of loss related to the customers’inability to pay. This allowance is maintained at a level that we consider appropriate based on factors thataffect collectability, such as the financial health of our customers, historical trends of charge-offs andrecoveries and current economic and market conditions. As we monitor our receivables, we identifycustomers that may have payment problems, and we adjust the allowance accordingly, with the offset toselling, general and administrative (“SG&A”) expense. Account balances are charged off against the allowancewhen recovery is considered remote. The allowance for doubtful accounts increased approximately $79,000during fiscal 2013 to $3,408,000.
While we believe our allowances are adequate, changes in economic conditions, the financial health ofcustomers and bankruptcy settlements could impact our future earnings. If the economic environment andmarket conditions deteriorate, particularly in the automotive and construction end markets where ourexposure is greatest, additional reserves may be required.
Property and Depreciation: Property, plant and equipment are carried at cost and depreciated using thestraight-line method. Buildings and improvements are depreciated over 10 to 40 years and machinery and
66

equipment over 3 to 20 years. Depreciation expense was $56,002,000, $50,644,000, and $57,765,000 duringfiscal 2013, fiscal 2012 and fiscal 2011, respectively. The increase in depreciation expense in fiscal 2013resulted from the impact of acquisitions. The decrease in depreciation expense in fiscal 2012 resulted largelyfrom the deconsolidation of Dietrich and Gerstenslager in the fourth quarter of fiscal 2011. Accelerateddepreciation methods are used for income tax purposes.
Goodwill and Other Long-Lived Assets: We use the purchase method of accounting for all businesscombinations and recognize amortizable intangible assets separately from goodwill. The acquired assets andassumed liabilities in an acquisition are measured and recognized based on their estimated fair values at thedate of acquisition, with goodwill representing the excess of the purchase price over the fair value of theidentifiable net assets. A bargain purchase may occur, wherein the fair value of identifiable net assets exceedsthe purchase price, and a gain is then recognized in the amount of that excess. Goodwill and intangible assetswith indefinite lives are not amortized, but instead are tested for impairment annually, during the fourthquarter, or more frequently if events or changes in circumstances indicate that impairment may be present.Application of goodwill impairment testing involves judgment, including but not limited to, the identificationof reporting units and estimation of the fair value of each reporting unit. A reporting unit is defined as anoperating segment or one level below an operating segment. We test goodwill at the operating segmentlevel as we have determined that the characteristics of the reporting units within each operating segment aresimilar and allow for their aggregation in accordance with the applicable accounting guidance.
The goodwill impairment test consists of comparing the fair value of each operating segment,determined using discounted cash flows, to each operating segment’s respective carrying value. If theestimated fair value of an operating segment exceeds its carrying value, there is no impairment. If the carryingamount of the operating segment exceeds its estimated fair value, a goodwill impairment is indicated. Theamount of the impairment is determined by comparing the fair value of the net assets of the operatingsegment, excluding goodwill, to its estimated fair value, with the difference representing the implied fairvalue of the goodwill. If the implied fair value of the goodwill is lower than its carrying value, the difference isrecorded as an impairment charge in our consolidated statements of earnings.
We performed our annual impairment evaluation of goodwill and other indefinite-lived intangible assetsduring the fourth quarter of fiscal 2013 and fiscal 2012 and concluded that the fair value of each reportingunit exceeded its carrying value; therefore, no impairment charges were recognized. As expected, theestimated fair value of the Engineered Cabs operating segment, which was formed in connection with therecent acquisition of Angus Industries, Inc. (“Angus”) and had goodwill of $44,933,000 at May 31, 2013,exceeded its carrying value by less than 10%. A 100 basis point decrease in the long-term growth rate for thisoperating segment could decrease the fair value by enough to result in some impairment based on thecurrent forecast model. Future declines in the market and deterioration in earnings could lead to performinga step 2 calculation to quantify a potential impairment.
We review the carrying value of our long-lived assets, including intangible assets with finite useful lives,for impairment whenever events or changes in circumstances indicate that the carrying value of an asset orasset group may not be recoverable. Impairment testing involves a comparison of the sum of theundiscounted future cash flows of the asset or asset group to its respective carrying amount. If the sum of theundiscounted future cash flows exceeds the carrying amount, then no impairment exists. If the carryingamount exceeds the sum of the undiscounted future cash flows, then a second step is performed todetermine the amount of impairment, if any, to be recognized. The loss recognized is equal to the amountthat the carrying value of the asset or asset group exceeds fair value.
Our impairment testing for both goodwill and other long-lived assets, including intangible assets withfinite useful lives, is largely based on cash flow models that require significant judgment and requireassumptions about future volume trends, revenue and expense growth rates; and, in addition, external factorssuch as changes in economic trends and cost of capital. Significant changes in any of these assumptions could
67
impact the outcomes of the tests performed. See “Note C – Goodwill and Other Long-Lived Assets” foradditional details regarding these assets and related impairment testing.
Leases: Certain lease agreements contain fluctuating or escalating payments and rent holiday periods.The related rent expense is recorded on a straight-line basis over the length of the lease term. Leaseholdimprovements made by the lessee, whether funded by the lessee or by landlord allowances or incentives, arerecorded as leasehold improvement assets and will be amortized over the shorter of the economic life or thelease term. These incentives are also recorded as deferred rent and amortized as reductions in rent expenseover the lease term.
Stock-Based Compensation: At May 31, 2013, we had stock-based compensation plans for ouremployees as well as our non-employee directors as described more fully in “Note J – Stock-BasedCompensation.” All share-based awards, including grants of stock options, are recorded as expense in theconsolidated statements of earnings based on their grant-date fair values.
Revenue Recognition: We recognize revenue upon transfer of title and risk of loss provided evidence ofan arrangement exists, pricing is fixed and determinable and the ability to collect is probable. We provide,through charges to net sales, for returns and allowances based on experience and current customer activities.We also provide, through charges to net sales, for customer rebates and sales discounts based on specificagreements and recent and anticipated levels of customer activity. In circumstances where the collection ofpayment is not probable at the time of shipment, we defer recognition of revenue until payment is collected.
The business units that comprise the Construction Services operating segment, which have contributedless than 5% of consolidated net sales for each of the last three fiscal years, recognize revenue on apercentage-of-completion method. Refer to “Note N – Segment Data” for additional information.
Advertising Expense: We expense advertising costs as incurred. Advertising expense was $6,179,000,$4,788,000, and $3,817,000 for fiscal 2013, fiscal 2012, and fiscal 2011, respectively.
Shipping and Handling Fees and Costs: Shipping and handling fees billed to customers are included innet sales, and shipping and handling costs incurred are included in cost of goods sold.
Environmental Costs: Environmental costs are capitalized if the costs extend the life of the property,increase its capacity, and/or mitigate or prevent contamination from future operations. Costs related toenvironmental contamination treatment and clean up are charged to expense.
Statements of Cash Flows: Supplemental cash flow information was as follows for the fiscal years endedMay 31:
(in thousands) 2013 2012 2011
Interest paid, net of amount capitalized $22,614 $18,281 $17,358Income taxes paid, net of refunds 64,260 46,445 53,194
We use the “cumulative earnings” approach for determining cash flow presentation of distributions fromour unconsolidated joint ventures. Distributions received are included in our consolidated statements of cashflows as operating activities, unless the cumulative distributions exceed our portion of the cumulative equityin the net earnings of the joint venture, in which case the excess distributions are deemed to be returns of theinvestment and are classified as investing activities in our consolidated statements of cash flows.
Income Taxes: We account for income taxes using the asset and liability method. The asset and liabilitymethod requires the recognition of deferred tax assets and liabilities for expected future tax consequences of
68

temporary differences that currently exist between the tax basis and the financial reporting basis of our assetsand liabilities. In assessing the realizability of deferred tax assets, we consider whether it is more likely thannot that some, or a portion, of the deferred tax assets will not be realized. We provide a valuation allowancefor deferred income tax assets when it is more likely than not that a portion of such deferred income taxassets will not be realized.
Tax benefits from uncertain tax positions that are recognized in the consolidated financial statements aremeasured based on the largest benefit that has a greater than fifty percent likelihood of being realized uponultimate settlement.
We have reserves for taxes and associated interest and penalties that may become payable in futureyears as a result of audits by taxing authorities. It is our policy to record these in income tax expense. While webelieve the positions taken on previously filed tax returns are appropriate, we have established the tax andinterest reserves in recognition that various taxing authorities may challenge our positions. The tax reservesare analyzed periodically, and adjustments are made as events occur to warrant adjustment to the reserves,such as lapsing of applicable statutes of limitations, conclusion of tax audits, additional exposure based oncurrent calculations, identification of new issues and release of administrative guidance or court decisionsaffecting a particular tax issue.
Self-Insurance Reserves: We are largely self-insured with respect to workers’ compensation, general andautomobile liability, property damage, employee medical claims and other potential losses. In order to reducerisk and better manage our overall loss exposure, we purchase stop-loss insurance that covers individualclaims in excess of the deductible amounts. We maintain reserves for the estimated cost to settle open claims,which includes estimates of legal costs expected to be incurred, as well as an estimate of the cost of claimsthat has been incurred but not reported. These estimates are based on actuarial valuations that take intoconsideration the historical average claim volume, the average cost for settled claims, current trends in claimcosts, changes in our business and workforce, general economic factors and other assumptions believed to bereasonable under the circumstances. The estimated reserves for these liabilities could be affected if futureoccurrences and claims differ from assumptions used and historical trends.
Recently Issued Accounting Standards: In December 2011, new accounting guidance was issued thatestablishes certain additional disclosure requirements about financial instruments and derivative instrumentsthat are subject to netting arrangements. The new disclosures are required for annual reporting periodsbeginning on or after January 1, 2013, and interim periods within those periods. We do not expect theadoption of this amended accounting guidance to have a material impact on our financial position or resultsof operations.
In June 2011, new accounting guidance was issued regarding the presentation of comprehensiveincome in financial statements prepared in accordance with U.S. GAAP. This new guidance requires entities topresent reclassification adjustments included in other comprehensive income on the face of the financialstatements and allows entities to present total comprehensive income, the components of net income andthe components of other comprehensive income either in a single continuous statement of comprehensiveincome or in two separate but consecutive statements. It also eliminates the option for entities to present thecomponents of other comprehensive income as part of the statement of equity. For public companies, thisaccounting guidance was effective for fiscal years (and interim periods within those fiscal years) beginningafter December 15, 2011, with early adoption permitted. Retrospective application to prior periods isrequired. We adopted the effective provisions of this new accounting guidance on June 1, 2012 and haveprovided the required statements of comprehensive income for the fiscal years ended May 31, 2013, 2012 and2011. In December 2011, certain provisions of this new guidance related to the presentation of reclassificationadjustments out of accumulated other comprehensive income were temporarily deferred. In February 2013,an effective date was established for the provisions that had been deferred. These provisions are effectiveprospectively for annual reporting periods, and interim periods within those annual periods, beginning after
69
December 15, 2012. We do not expect the adoption of these provisions, which relate to presentation only, tohave a material impact on our financial position or results of operations.
In September 2011, amended accounting guidance was issued that simplifies how an entity testsgoodwill for impairment. The amended guidance allows an entity to first assess qualitative factors todetermine whether it is necessary to perform the two-step quantitative goodwill impairment test. The two-step quantitative impairment test is required only if, based on its qualitative assessment, an entity determinesthat it is more likely than not that the fair value of a reporting unit is less than its carrying amount. Theamended guidance is effective for interim and annual goodwill impairment tests performed for fiscal yearsbeginning after December 15, 2011. Our adoption of this amended accounting guidance did not impact ourfinancial position or results of operations.
In July 2012, amended accounting guidance was issued that simplifies how an entity tests indefinite-lived intangible assets for impairment. The amended guidance allows an entity to first assess qualitativefactors to determine whether it is necessary to perform a quantitative impairment test. An entity will nolonger be required to calculate the fair value of an indefinite-lived intangible asset and perform thequantitative test unless the entity determines, based on a qualitative assessment, that it is more likely thannot that its fair value is less than its carrying amount. The amended guidance is effective for interim andannual indefinite-lived intangible asset impairment tests performed for fiscal years beginning afterSeptember 15, 2012, with early adoption permitted. We do not expect the adoption of this amendedaccounting guidance to have a material impact on our financial position or results of operations.
In March 2013, amended accounting guidance was issued regarding the accounting for cumulativetranslation adjustment. The amended guidance specifies that a cumulative translation adjustment should bereleased from earnings when an entity ceases to have a controlling financial interest in a subsidiary or a groupof assets within a consolidated foreign entity and the sale or transfer results in the complete or substantiallycomplete liquidation of the foreign entity. For sales of an equity method investment that is a foreign entity, apro rata portion of the cumulative translation adjustment attributable to the investment would be recognizedin earnings upon sale of the investment. The amended guidance is effective prospectively for annualreporting periods, and interim periods within those annual periods, beginning after December 15, 2013. Earlyadoption is permitted. We do not expect the adoption of this amended accounting guidance to have amaterial impact on our financial position or results of operations.
Note B – Investments in Unconsolidated Affiliates
Our investments in affiliated companies that we do not control, either through majority ownership orotherwise, are accounted for using the equity method. At May 31, 2013, these equity investments and thepercentage interests owned consisted of: ArtiFlex (50%), ClarkDietrich (25%), Gestamp Worthington WindSteel, LLC (the “Gestamp JV”) (50%), Samuel Steel Pickling Company (31.25%), Serviacero Planos, S. de R. L. deC.V. (50%), TWB Company, L.L.C. (“TWB”) (45%), Worthington Armstrong Venture (“WAVE”) (50%),Worthington Modern Steel Framing Manufacturing Co., Ltd. (“WMSFMCo.”) (40%), and Worthington SpecialtyProcessing (“WSP”) (51%). WSP is considered to be jointly controlled and not consolidated due to substantiveparticipating rights of the minority partner.
Due to the volatile political environment in the United States, particularly in regards to the FederalProduction Tax Credit, the Company is in the process of dissolving the Gestamp JV.
During the fourth quarter of fiscal 2013, we determined our 40% ownership interest in our constructionjoint venture in China, WMSFMCo., was other than temporarily impaired due to current and projectedoperating losses. As a result, an impairment charge of $4,751,000, representing the carrying value of theinvestment, was recognized within equity income in our consolidated statement of earnings.
70

In September 2012, the parent company of ThyssenKrupp Steel North America, Inc., the other member ofour tailored steel blanks joint venture, TWB, announced that it had reached an agreement to sell its interest inthe joint venture to Wuhan Iron and Steel Corporation. The sale is subject to approval by the supervisorybodies and responsible regulatory authorities.
During January 2012, we sold our 49% equity interest in LEFCO Worthington, LLC, to the other memberof the joint venture. The impact of this transaction was immaterial.
We received distributions from unconsolidated affiliates totaling $84,539,000, $138,471,000 and$57,146,000 in fiscal 2013, fiscal 2012 and fiscal 2011, respectively, including a special dividend of $50,000,000in connection with a refinancing transaction completed by WAVE in December 2011. We have receivedcumulative distributions from WAVE in excess of our investment balance, which resulted in an amountrecorded within other liabilities on our consolidated balance sheets of $63,187,000 and $69,165,000 atMay 31, 2013 and 2012, respectively. In accordance with the applicable accounting guidance, we reclassifythe negative balance to the liability section of our consolidated balance sheet. We will continue to record ourequity in the net income of WAVE as a debit to the investment account, and if it becomes positive, it will againbe shown as an asset on our consolidated balance sheet. If it becomes probable that any excess distributionmay not be returned (upon joint venture liquidation or otherwise), we will recognize any balance classified asa liability as income immediately.
We use the “cumulative earnings” approach for determining cash flow presentation of distributions fromour unconsolidated joint ventures. Distributions received are included in our consolidated statements of cashflows as operating activities, unless the cumulative distributions exceed our portion of the cumulative equityin the net earnings of the joint venture, in which case the excess distributions are deemed to be returns of theinvestment and are classified as investing activities in our consolidated statements of cash flows.
The following table presents combined information of the financial position for affiliated companiesaccounted for using the equity method as of May 31, 2013 and 2012:
(in thousands) 2013 2012
Cash $ 70,380 $ 73,416Receivable from partner (1) 69,706 60,383Other current assets 518,262 493,176Noncurrent assets 350,681 345,500
Total assets $1,009,029 $972,475
Current liabilities $ 181,111 $161,907Short-term borrowings 21,369 12,109Current maturities of long-term debt 5,442 5,305Long-term debt 274,750 289,308Other noncurrent liabilities 18,345 21,934Equity 508,012 481,912
Total liabilities and equity $1,009,029 $972,475
(1) Represents cash owed from a joint venture partner as a result of centralized cashmanagement.
71

The following table presents financial results of our three largest affiliated companies for the fiscal yearsended May 31, 2013, 2012 and 2011. All other affiliated companies are combined and presented in the Othercategory.
(in thousands) 2013 2012 2011
Net salesWAVE $ 370,702 $ 364,530 $ 346,717ClarkDietrich 547,971 564,624 165,807TWB 344,065 312,943 272,191Other 490,996 443,646 249,716
Total net sales $1,753,734 $1,685,743 $1,034,431
Gross marginWAVE $ 167,924 $ 155,246 $ 144,499ClarkDietrich 75,580 61,703 16,926TWB 41,116 40,098 33,187Other 48,229 57,346 30,817
Total gross margin $ 332,849 $ 314,393 $ 225,429
Operating incomeWAVE $ 137,202 $ 127,305 $ 116,295ClarkDietrich 35,024 27,094 8,323TWB 28,241 28,141 21,470Other 30,457 38,473 22,056
Total operating income $ 230,924 $ 221,013 $ 168,144
Depreciation and amortizationWAVE $ 3,919 $ 4,142 $ 3,991ClarkDietrich 18,173 14,271 8TWB 5,123 3,259 3,900Other 13,497 12,481 3,553
Total depreciation and amortization $ 40,712 $ 34,153 $ 11,452
Interest expenseWAVE $ 6,280 $ 3,427 $ 1,375ClarkDietrich 3 3 -TWB - - -Other 2,611 2,617 137
Total interest expense $ 8,894 $ 6,047 $ 1,512
Income tax expenseWAVE $ 2,451 $ 2,789 $ 2,669ClarkDietrich - - -TWB 1,218 5,458 4,233Other 3,187 6,867 3,224
Total income tax expense $ 6,856 $ 15,114 $ 10,126
Net earningsWAVE $ 128,614 $ 121,261 $ 112,544ClarkDietrich 35,005 27,203 8,331TWB 27,931 22,952 18,022Other 24,452 30,317 17,782
Total net earnings $ 216,002 $ 201,733 $ 156,679
72
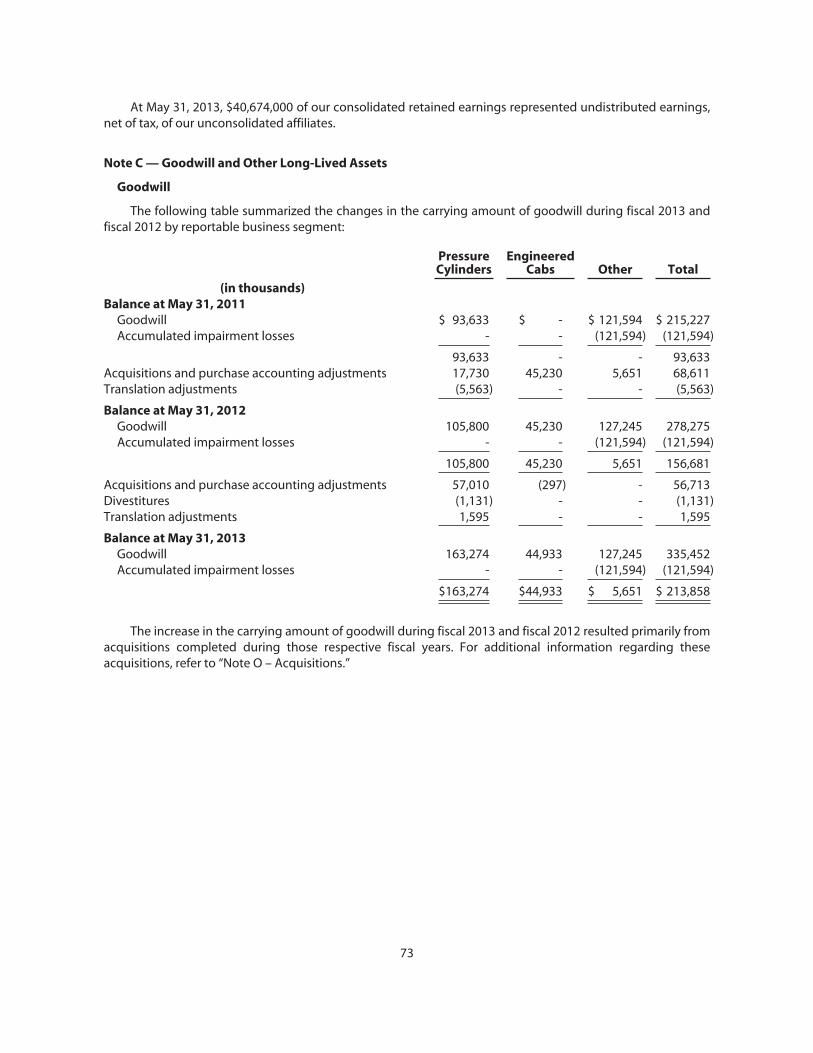
At May 31, 2013, $40,674,000 of our consolidated retained earnings represented undistributed earnings,net of tax, of our unconsolidated affiliates.
Note C — Goodwill and Other Long-Lived Assets
Goodwill
The following table summarized the changes in the carrying amount of goodwill during fiscal 2013 andfiscal 2012 by reportable business segment:
PressureCylinders
EngineeredCabs Other Total
(in thousands)Balance at May 31, 2011
Goodwill $ 93,633 $ - $ 121,594 $ 215,227Accumulated impairment losses - - (121,594) (121,594)
93,633 - - 93,633Acquisitions and purchase accounting adjustments 17,730 45,230 5,651 68,611Translation adjustments (5,563) - - (5,563)
Balance at May 31, 2012Goodwill 105,800 45,230 127,245 278,275Accumulated impairment losses - - (121,594) (121,594)
105,800 45,230 5,651 156,681
Acquisitions and purchase accounting adjustments 57,010 (297) - 56,713Divestitures (1,131) - - (1,131)Translation adjustments 1,595 - - 1,595
Balance at May 31, 2013Goodwill 163,274 44,933 127,245 335,452Accumulated impairment losses - - (121,594) (121,594)
$163,274 $44,933 $ 5,651 $ 213,858
The increase in the carrying amount of goodwill during fiscal 2013 and fiscal 2012 resulted primarily fromacquisitions completed during those respective fiscal years. For additional information regarding theseacquisitions, refer to “Note O – Acquisitions.”
73
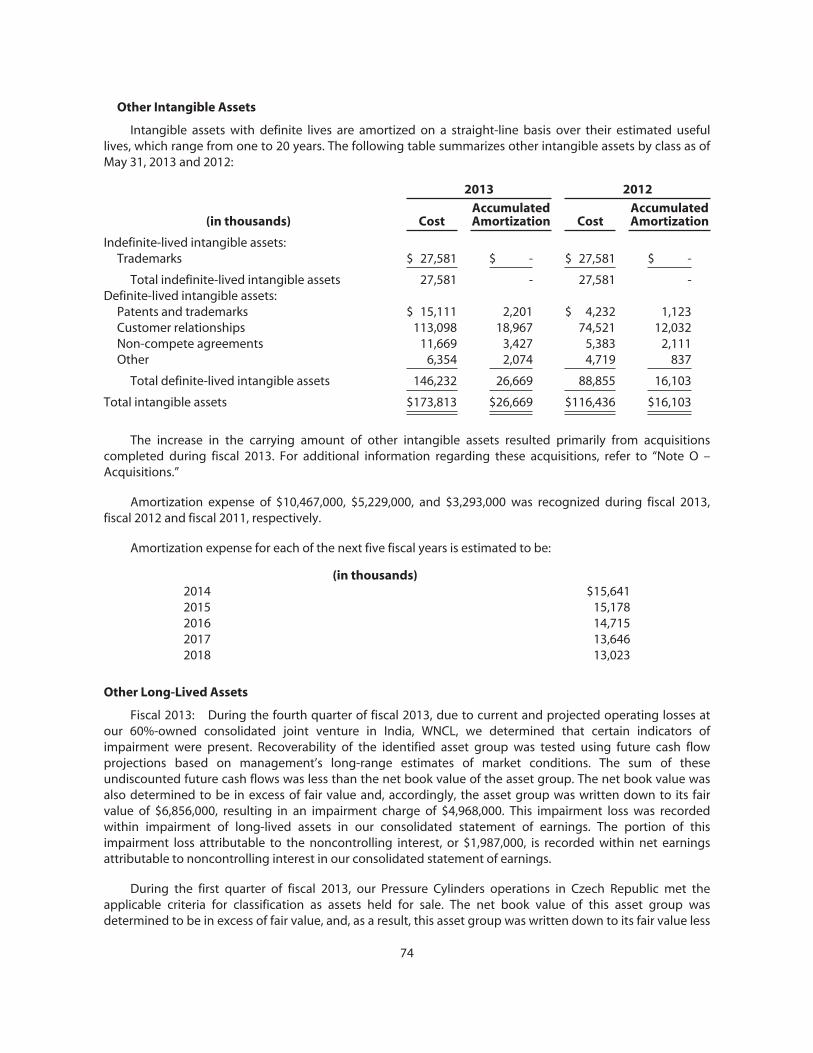
Other Intangible Assets
Intangible assets with definite lives are amortized on a straight-line basis over their estimated usefullives, which range from one to 20 years. The following table summarizes other intangible assets by class as ofMay 31, 2013 and 2012:
2013 2012
(in thousands) CostAccumulatedAmortization Cost
AccumulatedAmortization
Indefinite-lived intangible assets:Trademarks $ 27,581 $ - $ 27,581 $ -
Total indefinite-lived intangible assets 27,581 - 27,581 -Definite-lived intangible assets:
Patents and trademarks $ 15,111 2,201 $ 4,232 1,123Customer relationships 113,098 18,967 74,521 12,032Non-compete agreements 11,669 3,427 5,383 2,111Other 6,354 2,074 4,719 837
Total definite-lived intangible assets 146,232 26,669 88,855 16,103
Total intangible assets $173,813 $26,669 $116,436 $16,103
The increase in the carrying amount of other intangible assets resulted primarily from acquisitionscompleted during fiscal 2013. For additional information regarding these acquisitions, refer to “Note O –Acquisitions.”
Amortization expense of $10,467,000, $5,229,000, and $3,293,000 was recognized during fiscal 2013,fiscal 2012 and fiscal 2011, respectively.
Amortization expense for each of the next five fiscal years is estimated to be:
(in thousands)2014 $15,6412015 15,1782016 14,7152017 13,6462018 13,023
Other Long-Lived Assets
Fiscal 2013: During the fourth quarter of fiscal 2013, due to current and projected operating losses atour 60%-owned consolidated joint venture in India, WNCL, we determined that certain indicators ofimpairment were present. Recoverability of the identified asset group was tested using future cash flowprojections based on management’s long-range estimates of market conditions. The sum of theseundiscounted future cash flows was less than the net book value of the asset group. The net book value wasalso determined to be in excess of fair value and, accordingly, the asset group was written down to its fairvalue of $6,856,000, resulting in an impairment charge of $4,968,000. This impairment loss was recordedwithin impairment of long-lived assets in our consolidated statement of earnings. The portion of thisimpairment loss attributable to the noncontrolling interest, or $1,987,000, is recorded within net earningsattributable to noncontrolling interest in our consolidated statement of earnings.
During the first quarter of fiscal 2013, our Pressure Cylinders operations in Czech Republic met theapplicable criteria for classification as assets held for sale. The net book value of this asset group wasdetermined to be in excess of fair value, and, as a result, this asset group was written down to its fair value less
74
cost to sell, or $6,934,000, resulting in an impairment charge of $1,570,000. On October 31, 2012, wecompleted the sale of this asset group to an unrelated third party resulting in a gain of approximately$50,000. The combined impact of these items of $1,520,000 is presented within impairment of long-livedassets in our consolidated statement of earnings.
Fiscal 2012: During the fourth quarter of fiscal 2012, due largely to changes in the intended use ofcertain long-lived assets within our Construction Services operating segment, we determined indicators ofimpairment were present. Recoverability of the identified asset group was tested using future cash flowprojections based on management’s long range estimates of market conditions. The sum of theseundiscounted future cash flows was less than the net book value of the asset group. The net book value wasalso determined to be in excess of fair value and, accordingly, the asset group was written down to its fairvalue of $225,000, resulting in an impairment charge of $355,000. This impairment loss was recorded withinimpairment of long-lived assets in our consolidated statement of earnings.
Note D — Restructuring and Other Expense
In fiscal 2008, we initiated a Transformation Plan (the “Transformation Plan”) with the overall goal toimprove our sustainable earnings potential, asset utilization and operational performance. TheTransformation Plan focuses on cost reduction, margin expansion and organizational capabilityimprovements and, in the process, seeks to drive excellence in three core competencies: sales; operations;and supply chain management. The Transformation Plan is comprehensive in scope and includes aggressivediagnostic and implementation phases. As a result of the Transformation Plan and its related efforts, we haveincurred certain asset impairments which have been included within restructuring and other expense in ourconsolidated statements of earnings. Asset impairment charges that are not a result of these efforts havebeen included within impairment of long-lived assets in our consolidated statements of earnings, except forthe impairment charges incurred in connection with the formations of the unconsolidated joint ventures,ArtiFlex and ClarkDietrich, during the fourth quarter of fiscal 2011. These impairment charges wererecognized within the joint venture transactions caption in our consolidated statements of earnings.
To date, we have completed the transformation phases in each of the core facilities within our SteelProcessing operating segment, including the facilities of our Mexican joint venture. We also substantiallycompleted the transformation phases at our metal framing facilities prior to their contribution toClarkDietrich. Transformation efforts within our Pressure Cylinders operating segment, which began duringthe first quarter of fiscal 2012, are ongoing. In addition, during the first quarter of fiscal 2013, we initiated thediagnostics phase of the Transformation Plan in our Engineered Cabs operating segment.
When this process began, we retained a consulting firm to assist in the development andimplementation of the Transformation Plan. As the Transformation Plan progressed, we formed internalteams dedicated to this effort, and they ultimately assumed full responsibility for executing theTransformation Plan. Although the consulting firm was again engaged as we rolled out the TransformationPlan in our Pressure Cylinders operating segment, most of the work is now being done by our internal teams.These internal teams are now an integral part of our business and constitute what we refer to as the Centersof Excellence (“COE”). The COE will continue to monitor the performance metrics and new processesinstituted across our transformed operations and drive continuous improvements in all areas of ouroperations. The majority of the expenses related to the COE will be included in selling, general andadministrative expense going forward, except where they relate to a first time diagnostics phase of theTransformation Plan.
75
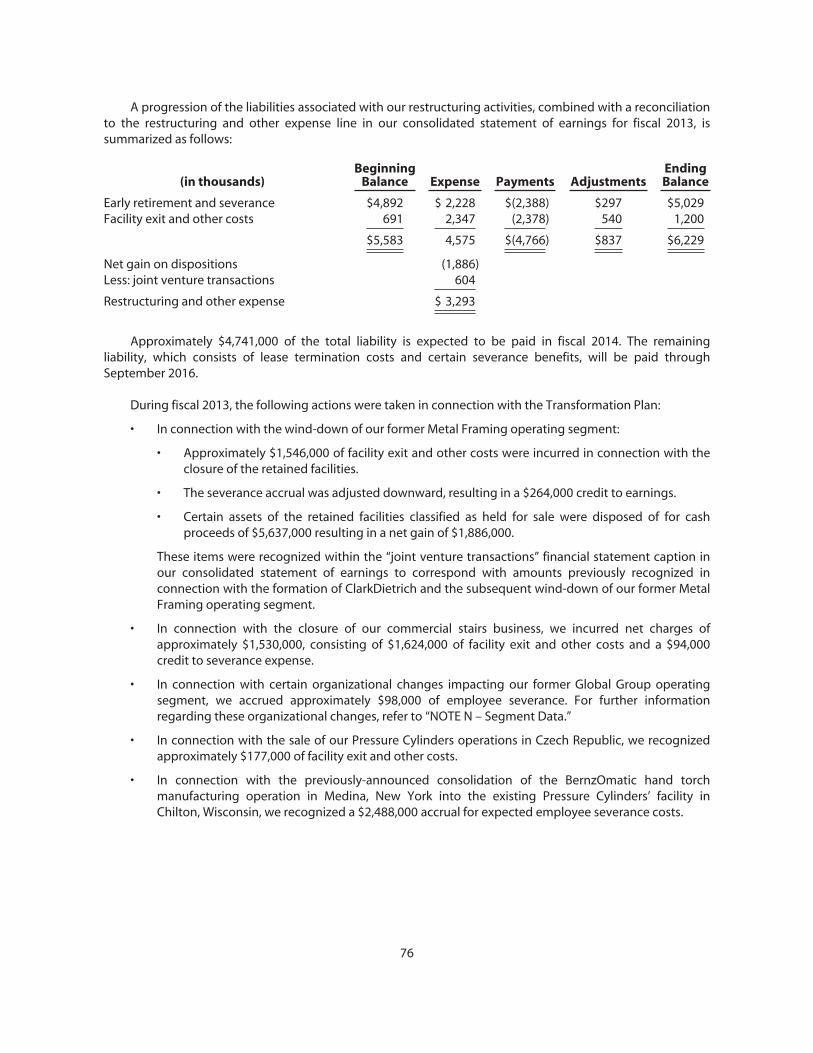
A progression of the liabilities associated with our restructuring activities, combined with a reconciliationto the restructuring and other expense line in our consolidated statement of earnings for fiscal 2013, issummarized as follows:
(in thousands)Beginning
Balance Expense Payments AdjustmentsEndingBalance
Early retirement and severance $4,892 $ 2,228 $(2,388) $297 $5,029Facility exit and other costs 691 2,347 (2,378) 540 1,200
$5,583 4,575 $(4,766) $837 $6,229
Net gain on dispositions (1,886)Less: joint venture transactions 604
Restructuring and other expense $ 3,293
Approximately $4,741,000 of the total liability is expected to be paid in fiscal 2014. The remainingliability, which consists of lease termination costs and certain severance benefits, will be paid throughSeptember 2016.
During fiscal 2013, the following actions were taken in connection with the Transformation Plan:
• In connection with the wind-down of our former Metal Framing operating segment:
• Approximately $1,546,000 of facility exit and other costs were incurred in connection with theclosure of the retained facilities.
• The severance accrual was adjusted downward, resulting in a $264,000 credit to earnings.
• Certain assets of the retained facilities classified as held for sale were disposed of for cashproceeds of $5,637,000 resulting in a net gain of $1,886,000.
These items were recognized within the “joint venture transactions” financial statement caption inour consolidated statement of earnings to correspond with amounts previously recognized inconnection with the formation of ClarkDietrich and the subsequent wind-down of our former MetalFraming operating segment.
• In connection with the closure of our commercial stairs business, we incurred net charges ofapproximately $1,530,000, consisting of $1,624,000 of facility exit and other costs and a $94,000credit to severance expense.
• In connection with certain organizational changes impacting our former Global Group operatingsegment, we accrued approximately $98,000 of employee severance. For further informationregarding these organizational changes, refer to “NOTE N – Segment Data.”
• In connection with the sale of our Pressure Cylinders operations in Czech Republic, we recognizedapproximately $177,000 of facility exit and other costs.
• In connection with the previously-announced consolidation of the BernzOmatic hand torchmanufacturing operation in Medina, New York into the existing Pressure Cylinders’ facility inChilton, Wisconsin, we recognized a $2,488,000 accrual for expected employee severance costs.
76
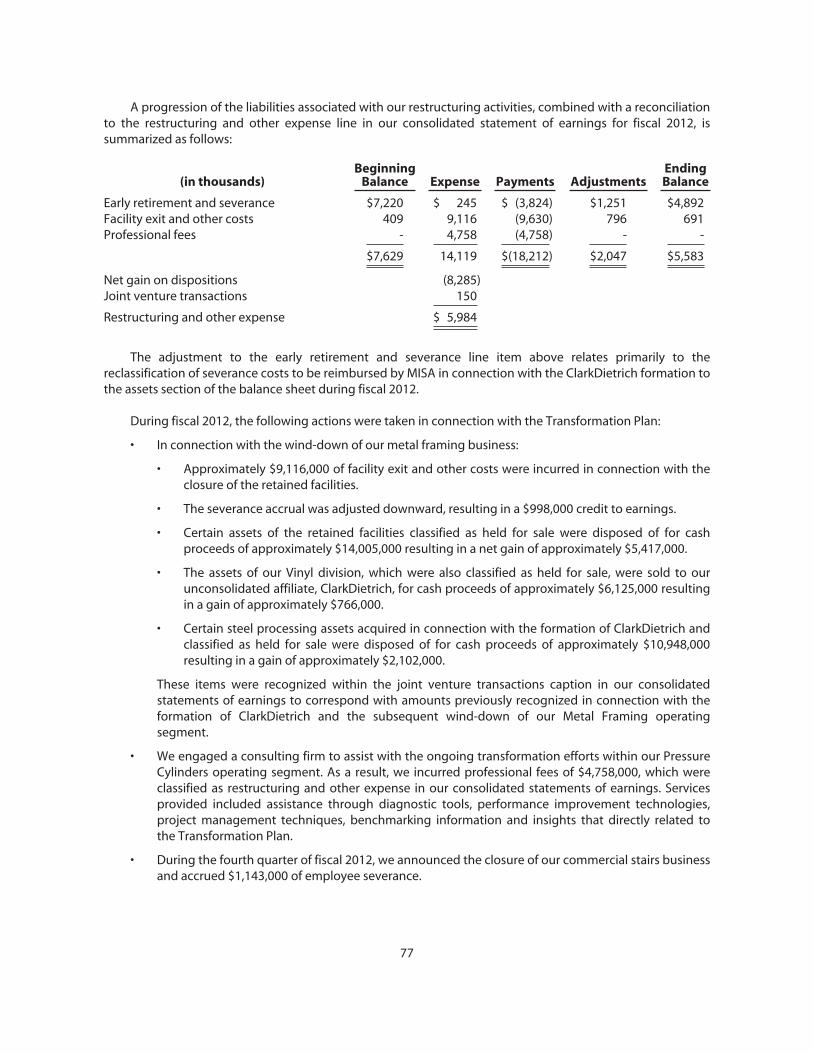
A progression of the liabilities associated with our restructuring activities, combined with a reconciliationto the restructuring and other expense line in our consolidated statement of earnings for fiscal 2012, issummarized as follows:
(in thousands)Beginning
Balance Expense Payments AdjustmentsEndingBalance
Early retirement and severance $7,220 $ 245 $ (3,824) $1,251 $4,892Facility exit and other costs 409 9,116 (9,630) 796 691Professional fees - 4,758 (4,758) - -
$7,629 14,119 $(18,212) $2,047 $5,583
Net gain on dispositions (8,285)Joint venture transactions 150
Restructuring and other expense $ 5,984
The adjustment to the early retirement and severance line item above relates primarily to thereclassification of severance costs to be reimbursed by MISA in connection with the ClarkDietrich formation tothe assets section of the balance sheet during fiscal 2012.
During fiscal 2012, the following actions were taken in connection with the Transformation Plan:
• In connection with the wind-down of our metal framing business:
• Approximately $9,116,000 of facility exit and other costs were incurred in connection with theclosure of the retained facilities.
• The severance accrual was adjusted downward, resulting in a $998,000 credit to earnings.
• Certain assets of the retained facilities classified as held for sale were disposed of for cashproceeds of approximately $14,005,000 resulting in a net gain of approximately $5,417,000.
• The assets of our Vinyl division, which were also classified as held for sale, were sold to ourunconsolidated affiliate, ClarkDietrich, for cash proceeds of approximately $6,125,000 resultingin a gain of approximately $766,000.
• Certain steel processing assets acquired in connection with the formation of ClarkDietrich andclassified as held for sale were disposed of for cash proceeds of approximately $10,948,000resulting in a gain of approximately $2,102,000.
These items were recognized within the joint venture transactions caption in our consolidatedstatements of earnings to correspond with amounts previously recognized in connection with theformation of ClarkDietrich and the subsequent wind-down of our Metal Framing operatingsegment.
• We engaged a consulting firm to assist with the ongoing transformation efforts within our PressureCylinders operating segment. As a result, we incurred professional fees of $4,758,000, which wereclassified as restructuring and other expense in our consolidated statements of earnings. Servicesprovided included assistance through diagnostic tools, performance improvement technologies,project management techniques, benchmarking information and insights that directly related tothe Transformation Plan.
• During the fourth quarter of fiscal 2012, we announced the closure of our commercial stairs businessand accrued $1,143,000 of employee severance.
77
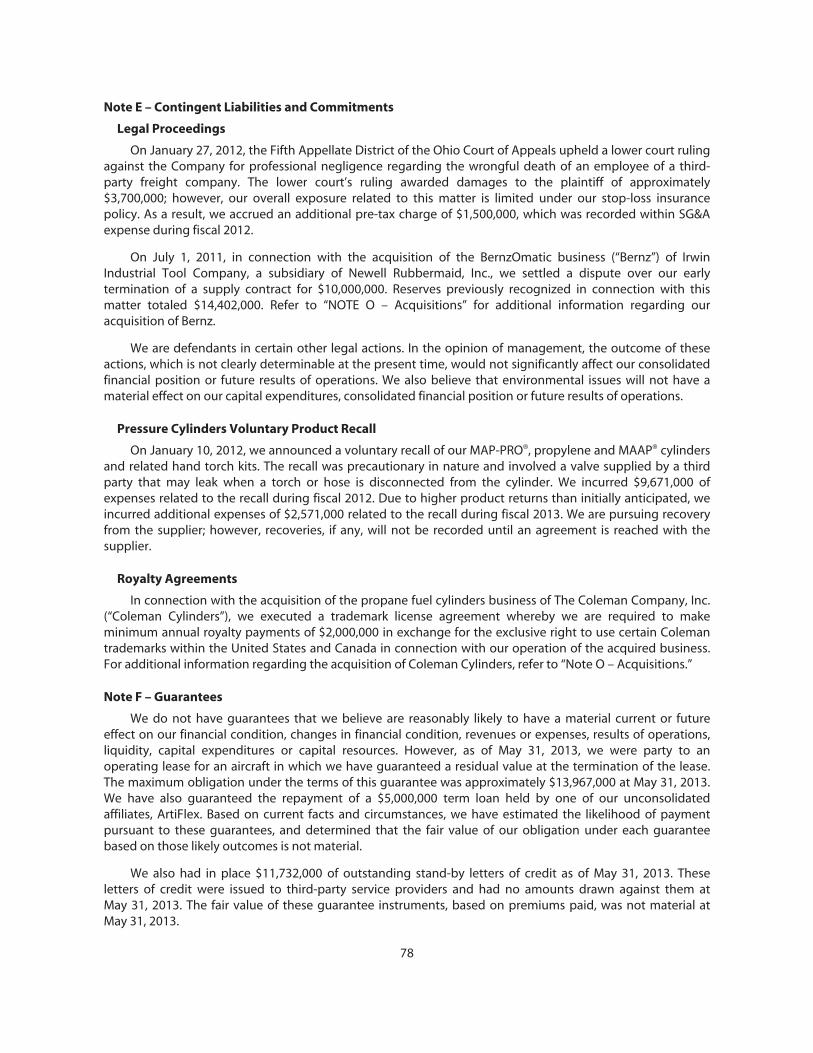
Note E – Contingent Liabilities and Commitments
Legal Proceedings
On January 27, 2012, the Fifth Appellate District of the Ohio Court of Appeals upheld a lower court rulingagainst the Company for professional negligence regarding the wrongful death of an employee of a third-party freight company. The lower court’s ruling awarded damages to the plaintiff of approximately$3,700,000; however, our overall exposure related to this matter is limited under our stop-loss insurancepolicy. As a result, we accrued an additional pre-tax charge of $1,500,000, which was recorded within SG&Aexpense during fiscal 2012.
On July 1, 2011, in connection with the acquisition of the BernzOmatic business (“Bernz”) of IrwinIndustrial Tool Company, a subsidiary of Newell Rubbermaid, Inc., we settled a dispute over our earlytermination of a supply contract for $10,000,000. Reserves previously recognized in connection with thismatter totaled $14,402,000. Refer to “NOTE O – Acquisitions” for additional information regarding ouracquisition of Bernz.
We are defendants in certain other legal actions. In the opinion of management, the outcome of theseactions, which is not clearly determinable at the present time, would not significantly affect our consolidatedfinancial position or future results of operations. We also believe that environmental issues will not have amaterial effect on our capital expenditures, consolidated financial position or future results of operations.
Pressure Cylinders Voluntary Product Recall
On January 10, 2012, we announced a voluntary recall of our MAP-PRO®, propylene and MAAP® cylindersand related hand torch kits. The recall was precautionary in nature and involved a valve supplied by a thirdparty that may leak when a torch or hose is disconnected from the cylinder. We incurred $9,671,000 ofexpenses related to the recall during fiscal 2012. Due to higher product returns than initially anticipated, weincurred additional expenses of $2,571,000 related to the recall during fiscal 2013. We are pursuing recoveryfrom the supplier; however, recoveries, if any, will not be recorded until an agreement is reached with thesupplier.
Royalty Agreements
In connection with the acquisition of the propane fuel cylinders business of The Coleman Company, Inc.(“Coleman Cylinders”), we executed a trademark license agreement whereby we are required to makeminimum annual royalty payments of $2,000,000 in exchange for the exclusive right to use certain Colemantrademarks within the United States and Canada in connection with our operation of the acquired business.For additional information regarding the acquisition of Coleman Cylinders, refer to “Note O – Acquisitions.”
Note F – Guarantees
We do not have guarantees that we believe are reasonably likely to have a material current or futureeffect on our financial condition, changes in financial condition, revenues or expenses, results of operations,liquidity, capital expenditures or capital resources. However, as of May 31, 2013, we were party to anoperating lease for an aircraft in which we have guaranteed a residual value at the termination of the lease.The maximum obligation under the terms of this guarantee was approximately $13,967,000 at May 31, 2013.We have also guaranteed the repayment of a $5,000,000 term loan held by one of our unconsolidatedaffiliates, ArtiFlex. Based on current facts and circumstances, we have estimated the likelihood of paymentpursuant to these guarantees, and determined that the fair value of our obligation under each guaranteebased on those likely outcomes is not material.
We also had in place $11,732,000 of outstanding stand-by letters of credit as of May 31, 2013. Theseletters of credit were issued to third-party service providers and had no amounts drawn against them atMay 31, 2013. The fair value of these guarantee instruments, based on premiums paid, was not material atMay 31, 2013.
78
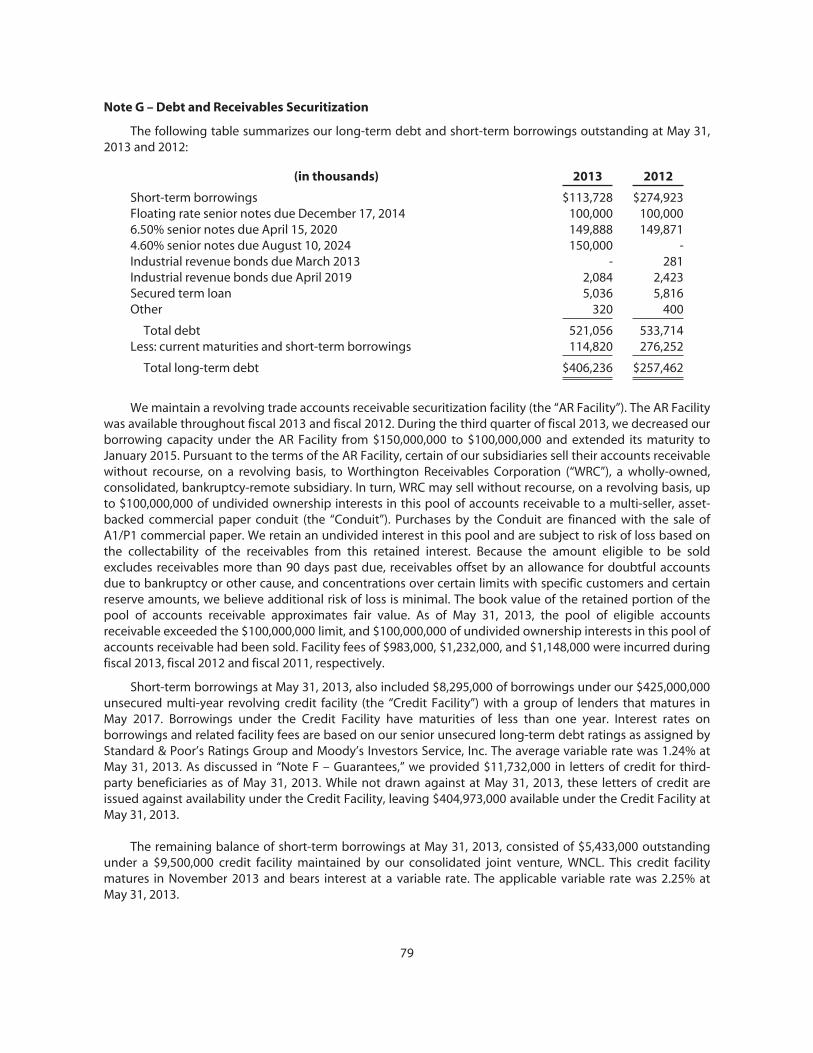
Note G – Debt and Receivables Securitization
The following table summarizes our long-term debt and short-term borrowings outstanding at May 31,2013 and 2012:
(in thousands) 2013 2012
Short-term borrowings $113,728 $274,923Floating rate senior notes due December 17, 2014 100,000 100,0006.50% senior notes due April 15, 2020 149,888 149,8714.60% senior notes due August 10, 2024 150,000 -Industrial revenue bonds due March 2013 - 281Industrial revenue bonds due April 2019 2,084 2,423Secured term loan 5,036 5,816Other 320 400
Total debt 521,056 533,714Less: current maturities and short-term borrowings 114,820 276,252
Total long-term debt $406,236 $257,462
We maintain a revolving trade accounts receivable securitization facility (the “AR Facility”). The AR Facilitywas available throughout fiscal 2013 and fiscal 2012. During the third quarter of fiscal 2013, we decreased ourborrowing capacity under the AR Facility from $150,000,000 to $100,000,000 and extended its maturity toJanuary 2015. Pursuant to the terms of the AR Facility, certain of our subsidiaries sell their accounts receivablewithout recourse, on a revolving basis, to Worthington Receivables Corporation (“WRC”), a wholly-owned,consolidated, bankruptcy-remote subsidiary. In turn, WRC may sell without recourse, on a revolving basis, upto $100,000,000 of undivided ownership interests in this pool of accounts receivable to a multi-seller, asset-backed commercial paper conduit (the “Conduit”). Purchases by the Conduit are financed with the sale ofA1/P1 commercial paper. We retain an undivided interest in this pool and are subject to risk of loss based onthe collectability of the receivables from this retained interest. Because the amount eligible to be soldexcludes receivables more than 90 days past due, receivables offset by an allowance for doubtful accountsdue to bankruptcy or other cause, and concentrations over certain limits with specific customers and certainreserve amounts, we believe additional risk of loss is minimal. The book value of the retained portion of thepool of accounts receivable approximates fair value. As of May 31, 2013, the pool of eligible accountsreceivable exceeded the $100,000,000 limit, and $100,000,000 of undivided ownership interests in this pool ofaccounts receivable had been sold. Facility fees of $983,000, $1,232,000, and $1,148,000 were incurred duringfiscal 2013, fiscal 2012 and fiscal 2011, respectively.
Short-term borrowings at May 31, 2013, also included $8,295,000 of borrowings under our $425,000,000unsecured multi-year revolving credit facility (the “Credit Facility”) with a group of lenders that matures inMay 2017. Borrowings under the Credit Facility have maturities of less than one year. Interest rates onborrowings and related facility fees are based on our senior unsecured long-term debt ratings as assigned byStandard & Poor’s Ratings Group and Moody’s Investors Service, Inc. The average variable rate was 1.24% atMay 31, 2013. As discussed in “Note F – Guarantees,” we provided $11,732,000 in letters of credit for third-party beneficiaries as of May 31, 2013. While not drawn against at May 31, 2013, these letters of credit areissued against availability under the Credit Facility, leaving $404,973,000 available under the Credit Facility atMay 31, 2013.
The remaining balance of short-term borrowings at May 31, 2013, consisted of $5,433,000 outstandingunder a $9,500,000 credit facility maintained by our consolidated joint venture, WNCL. This credit facilitymatures in November 2013 and bears interest at a variable rate. The applicable variable rate was 2.25% atMay 31, 2013.
79
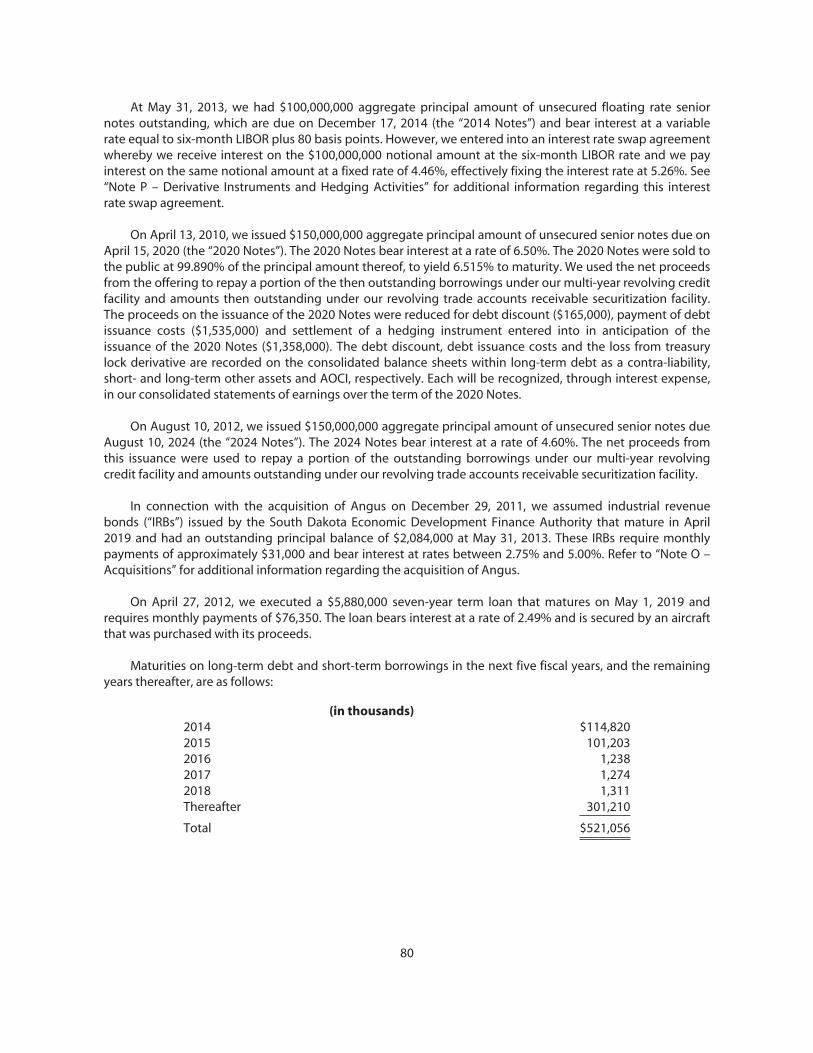
At May 31, 2013, we had $100,000,000 aggregate principal amount of unsecured floating rate seniornotes outstanding, which are due on December 17, 2014 (the “2014 Notes”) and bear interest at a variablerate equal to six-month LIBOR plus 80 basis points. However, we entered into an interest rate swap agreementwhereby we receive interest on the $100,000,000 notional amount at the six-month LIBOR rate and we payinterest on the same notional amount at a fixed rate of 4.46%, effectively fixing the interest rate at 5.26%. See“Note P – Derivative Instruments and Hedging Activities” for additional information regarding this interestrate swap agreement.
On April 13, 2010, we issued $150,000,000 aggregate principal amount of unsecured senior notes due onApril 15, 2020 (the “2020 Notes”). The 2020 Notes bear interest at a rate of 6.50%. The 2020 Notes were sold tothe public at 99.890% of the principal amount thereof, to yield 6.515% to maturity. We used the net proceedsfrom the offering to repay a portion of the then outstanding borrowings under our multi-year revolving creditfacility and amounts then outstanding under our revolving trade accounts receivable securitization facility.The proceeds on the issuance of the 2020 Notes were reduced for debt discount ($165,000), payment of debtissuance costs ($1,535,000) and settlement of a hedging instrument entered into in anticipation of theissuance of the 2020 Notes ($1,358,000). The debt discount, debt issuance costs and the loss from treasurylock derivative are recorded on the consolidated balance sheets within long-term debt as a contra-liability,short- and long-term other assets and AOCI, respectively. Each will be recognized, through interest expense,in our consolidated statements of earnings over the term of the 2020 Notes.
On August 10, 2012, we issued $150,000,000 aggregate principal amount of unsecured senior notes dueAugust 10, 2024 (the “2024 Notes”). The 2024 Notes bear interest at a rate of 4.60%. The net proceeds fromthis issuance were used to repay a portion of the outstanding borrowings under our multi-year revolvingcredit facility and amounts outstanding under our revolving trade accounts receivable securitization facility.
In connection with the acquisition of Angus on December 29, 2011, we assumed industrial revenuebonds (“IRBs”) issued by the South Dakota Economic Development Finance Authority that mature in April2019 and had an outstanding principal balance of $2,084,000 at May 31, 2013. These IRBs require monthlypayments of approximately $31,000 and bear interest at rates between 2.75% and 5.00%. Refer to “Note O –Acquisitions” for additional information regarding the acquisition of Angus.
On April 27, 2012, we executed a $5,880,000 seven-year term loan that matures on May 1, 2019 andrequires monthly payments of $76,350. The loan bears interest at a rate of 2.49% and is secured by an aircraftthat was purchased with its proceeds.
Maturities on long-term debt and short-term borrowings in the next five fiscal years, and the remainingyears thereafter, are as follows:
(in thousands)2014 $114,8202015 101,2032016 1,2382017 1,2742018 1,311Thereafter 301,210
Total $521,056
80
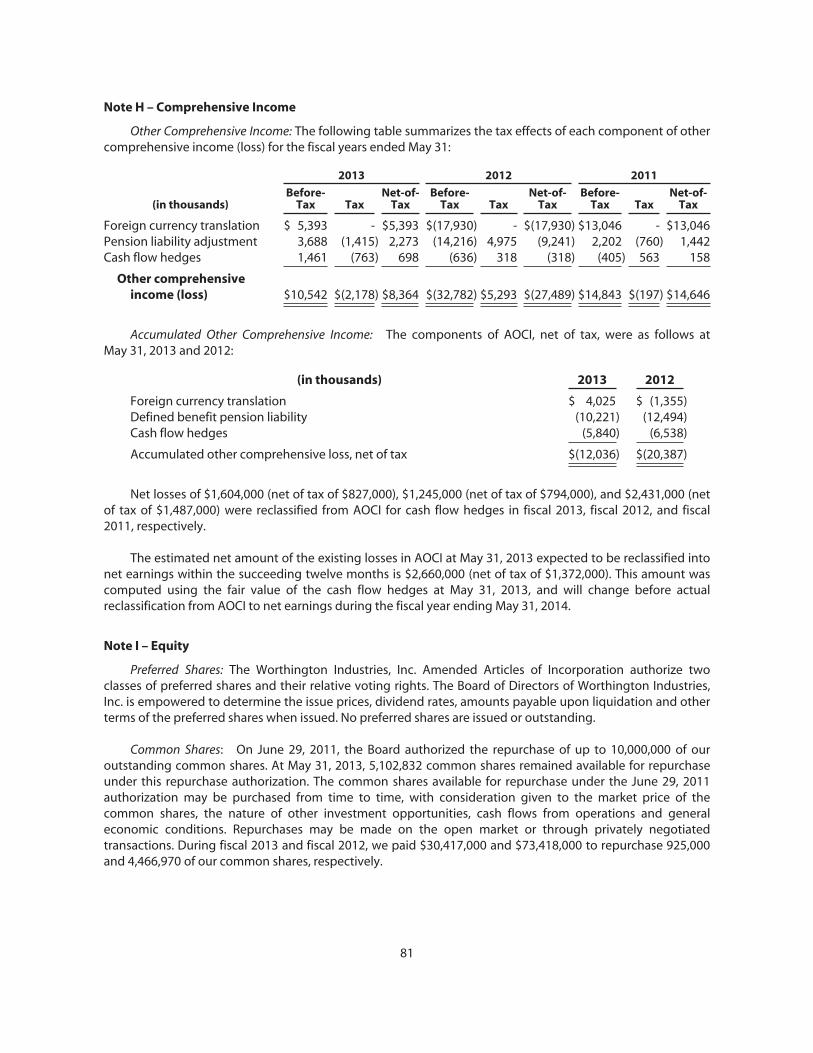
Note H – Comprehensive Income
Other Comprehensive Income: The following table summarizes the tax effects of each component of othercomprehensive income (loss) for the fiscal years ended May 31:
2013 2012 2011
(in thousands)Before-
Tax TaxNet-of-
TaxBefore-
Tax TaxNet-of-
TaxBefore-
Tax TaxNet-of-
Tax
Foreign currency translation $ 5,393 - $5,393 $(17,930) - $(17,930) $13,046 - $13,046Pension liability adjustment 3,688 (1,415) 2,273 (14,216) 4,975 (9,241) 2,202 (760) 1,442Cash flow hedges 1,461 (763) 698 (636) 318 (318) (405) 563 158
Other comprehensiveincome (loss) $10,542 $(2,178) $8,364 $(32,782) $5,293 $(27,489) $14,843 $(197) $14,646
Accumulated Other Comprehensive Income: The components of AOCI, net of tax, were as follows atMay 31, 2013 and 2012:
(in thousands) 2013 2012
Foreign currency translation $ 4,025 $ (1,355)Defined benefit pension liability (10,221) (12,494)Cash flow hedges (5,840) (6,538)
Accumulated other comprehensive loss, net of tax $(12,036) $(20,387)
Net losses of $1,604,000 (net of tax of $827,000), $1,245,000 (net of tax of $794,000), and $2,431,000 (netof tax of $1,487,000) were reclassified from AOCI for cash flow hedges in fiscal 2013, fiscal 2012, and fiscal2011, respectively.
The estimated net amount of the existing losses in AOCI at May 31, 2013 expected to be reclassified intonet earnings within the succeeding twelve months is $2,660,000 (net of tax of $1,372,000). This amount wascomputed using the fair value of the cash flow hedges at May 31, 2013, and will change before actualreclassification from AOCI to net earnings during the fiscal year ending May 31, 2014.
Note I – Equity
Preferred Shares: The Worthington Industries, Inc. Amended Articles of Incorporation authorize twoclasses of preferred shares and their relative voting rights. The Board of Directors of Worthington Industries,Inc. is empowered to determine the issue prices, dividend rates, amounts payable upon liquidation and otherterms of the preferred shares when issued. No preferred shares are issued or outstanding.
Common Shares: On June 29, 2011, the Board authorized the repurchase of up to 10,000,000 of ouroutstanding common shares. At May 31, 2013, 5,102,832 common shares remained available for repurchaseunder this repurchase authorization. The common shares available for repurchase under the June 29, 2011authorization may be purchased from time to time, with consideration given to the market price of thecommon shares, the nature of other investment opportunities, cash flows from operations and generaleconomic conditions. Repurchases may be made on the open market or through privately negotiatedtransactions. During fiscal 2013 and fiscal 2012, we paid $30,417,000 and $73,418,000 to repurchase 925,000and 4,466,970 of our common shares, respectively.
81
Note J – Stock-Based Compensation
Stock-Based Compensation Plans
Under our employee and non-employee director stock-based compensation plans, we may grantincentive or non-qualified stock options, restricted common shares and performance shares to employeesand non-qualified stock options and restricted common shares to non-employee directors. We classify share-based compensation expense within SG&A expense to correspond with the same financial statement captionas the majority of the cash compensation paid to employees. A total of 6,838,710 of our common shares havebeen authorized and are available for issuance in connection with the stock-based compensation plans inplace at May 31, 2013.
We recognized pre-tax stock-based compensation expense for stock options and restricted share awardsof $13,270,000 ($8,339,000 after-tax), $11,742,000 ($7,871,000 after-tax), and $6,173,000 ($4,163,000 after-tax)during fiscal 2013, fiscal 2012 and fiscal 2011, respectively. At May 31, 2013, the total unrecognizedcompensation cost related to non-vested awards was $16,962,000, which will be expensed over the nextthree fiscal years.
Stock options may be granted to purchase common shares at not less than 100% of fair market value onthe date of the grant. All outstanding stock options are non-qualified stock options. The exercise price of allstock options granted has been set at 100% of the fair market value of the underlying common shares on thedate of grant. Generally, stock options granted to employees vest and become exercisable at the rate of(i) 20% per year for options issued before June 30, 2011, and (ii) 33% per year for options issued on or afterJune 30, 2011, in each case beginning one year from the date of grant and expire ten years after the date ofgrant. Non-qualified stock options granted to non-employee directors vest and become exercisable on theearlier of (a) the first anniversary of the date of grant or (b) the date on which the next annual meeting ofshareholders is held following the date of grant for any stock option granted as of the date of an annualmeeting of shareholders of Worthington Industries, Inc. Stock options can be exercised through net-settlement, at the election of the option holder.
In addition to stock options, we have awarded performance shares to certain key employees that arecontingent (i.e., vest) upon achieving corporate targets for cumulative corporate economic value added,earnings per share growth and, in the case of business unit executives, business unit operating incometargets for the three-year periods ending May 31, 2013, 2014 and 2015. These performance share awards willbe paid, to the extent earned, in common shares of Worthington Industries, Inc. in the fiscal quarter followingthe end of the applicable three-year performance period.
We have also awarded restricted shares to certain employees and non-employee directors. Theserestricted shares are valued at the closing market price of common shares of Worthington Industries, Inc. onthe date of the grant. Service-based restricted shares granted to employees cliff vest three years from the dateof grant. Service-based restricted shares granted to non-employee directors vest under the same parametersas the stock options discussed above. Vesting of market-based restricted shares is contingent upon ourcommon shares reaching a specific price per share for a specific period of time as discussed more fully below.
Non-Qualified Stock Options
U.S. GAAP requires that all share-based awards, including grants of stock options, be recorded asexpense in the statement of earnings based on their grant-date fair value. We calculate the fair value of ournon-qualified stock options using the Black-Scholes option pricing model and certain assumptions. Thecomputation of fair values for all stock options incorporates the following assumptions: expected volatility(based on the historical volatility of our common shares); risk-free interest rate (based on the United StatesTreasury strip rate for the expected term of the stock options); expected term (based on historical exerciseexperience); and dividend yield (based on annualized current dividends and an average quoted price of ourcommon shares over the preceding annual period).
82
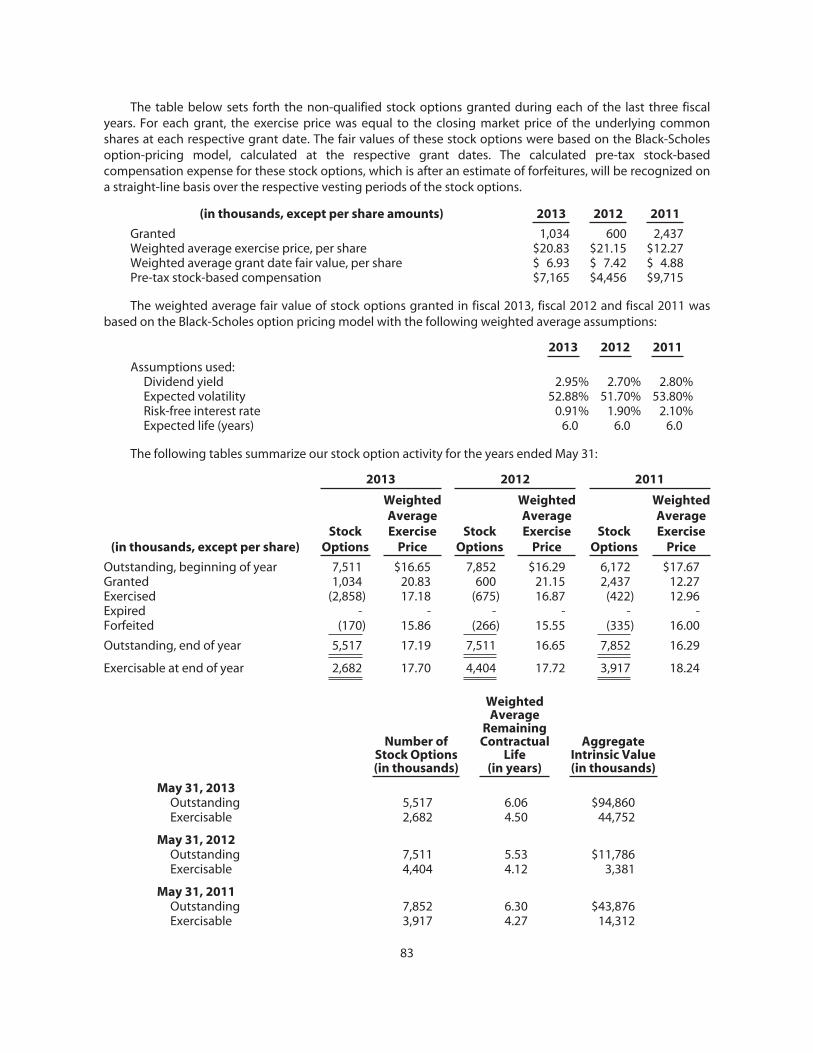
The table below sets forth the non-qualified stock options granted during each of the last three fiscalyears. For each grant, the exercise price was equal to the closing market price of the underlying commonshares at each respective grant date. The fair values of these stock options were based on the Black-Scholesoption-pricing model, calculated at the respective grant dates. The calculated pre-tax stock-basedcompensation expense for these stock options, which is after an estimate of forfeitures, will be recognized ona straight-line basis over the respective vesting periods of the stock options.
(in thousands, except per share amounts) 2013 2012 2011
Granted 1,034 600 2,437Weighted average exercise price, per share $20.83 $21.15 $12.27Weighted average grant date fair value, per share $ 6.93 $ 7.42 $ 4.88Pre-tax stock-based compensation $7,165 $4,456 $9,715
The weighted average fair value of stock options granted in fiscal 2013, fiscal 2012 and fiscal 2011 wasbased on the Black-Scholes option pricing model with the following weighted average assumptions:
2013 2012 2011
Assumptions used:Dividend yield 2.95% 2.70% 2.80%Expected volatility 52.88% 51.70% 53.80%Risk-free interest rate 0.91% 1.90% 2.10%Expected life (years) 6.0 6.0 6.0
The following tables summarize our stock option activity for the years ended May 31:
2013 2012 2011
(in thousands, except per share)Stock
Options
WeightedAverageExercise
PriceStock
Options
WeightedAverageExercise
PriceStock
Options
WeightedAverageExercise
Price
Outstanding, beginning of year 7,511 $16.65 7,852 $16.29 6,172 $17.67Granted 1,034 20.83 600 21.15 2,437 12.27Exercised (2,858) 17.18 (675) 16.87 (422) 12.96Expired - - - - - -Forfeited (170) 15.86 (266) 15.55 (335) 16.00
Outstanding, end of year 5,517 17.19 7,511 16.65 7,852 16.29
Exercisable at end of year 2,682 17.70 4,404 17.72 3,917 18.24
Number ofStock Options(in thousands)
WeightedAverage
RemainingContractual
Life(in years)
AggregateIntrinsic Value(in thousands)
May 31, 2013Outstanding 5,517 6.06 $94,860Exercisable 2,682 4.50 44,752
May 31, 2012Outstanding 7,511 5.53 $11,786Exercisable 4,404 4.12 3,381
May 31, 2011Outstanding 7,852 6.30 $43,876Exercisable 3,917 4.27 14,312
83
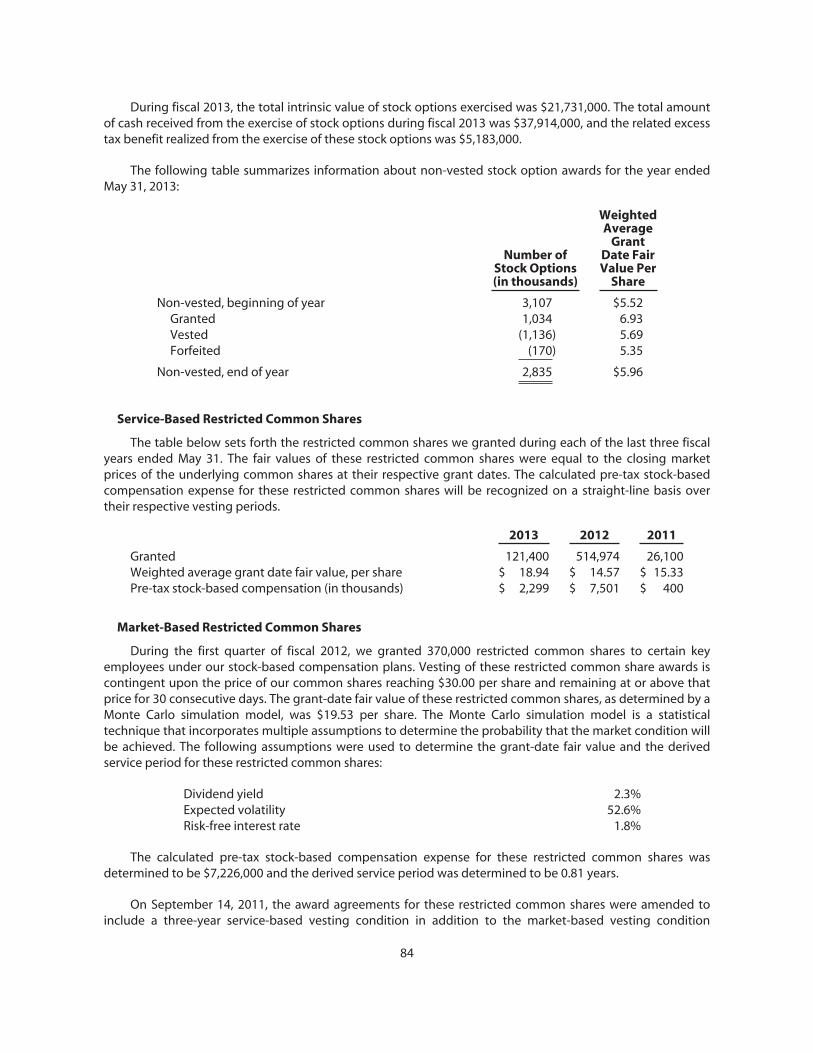
During fiscal 2013, the total intrinsic value of stock options exercised was $21,731,000. The total amountof cash received from the exercise of stock options during fiscal 2013 was $37,914,000, and the related excesstax benefit realized from the exercise of these stock options was $5,183,000.
The following table summarizes information about non-vested stock option awards for the year endedMay 31, 2013:
Number ofStock Options(in thousands)
WeightedAverage
GrantDate FairValue Per
Share
Non-vested, beginning of year 3,107 $5.52Granted 1,034 6.93Vested (1,136) 5.69Forfeited (170) 5.35
Non-vested, end of year 2,835 $5.96
Service-Based Restricted Common Shares
The table below sets forth the restricted common shares we granted during each of the last three fiscalyears ended May 31. The fair values of these restricted common shares were equal to the closing marketprices of the underlying common shares at their respective grant dates. The calculated pre-tax stock-basedcompensation expense for these restricted common shares will be recognized on a straight-line basis overtheir respective vesting periods.
2013 2012 2011
Granted 121,400 514,974 26,100Weighted average grant date fair value, per share $ 18.94 $ 14.57 $ 15.33Pre-tax stock-based compensation (in thousands) $ 2,299 $ 7,501 $ 400
Market-Based Restricted Common Shares
During the first quarter of fiscal 2012, we granted 370,000 restricted common shares to certain keyemployees under our stock-based compensation plans. Vesting of these restricted common share awards iscontingent upon the price of our common shares reaching $30.00 per share and remaining at or above thatprice for 30 consecutive days. The grant-date fair value of these restricted common shares, as determined by aMonte Carlo simulation model, was $19.53 per share. The Monte Carlo simulation model is a statisticaltechnique that incorporates multiple assumptions to determine the probability that the market condition willbe achieved. The following assumptions were used to determine the grant-date fair value and the derivedservice period for these restricted common shares:
Dividend yield 2.3%Expected volatility 52.6%Risk-free interest rate 1.8%
The calculated pre-tax stock-based compensation expense for these restricted common shares wasdetermined to be $7,226,000 and the derived service period was determined to be 0.81 years.
On September 14, 2011, the award agreements for these restricted common shares were amended toinclude a three-year service-based vesting condition in addition to the market-based vesting condition
84
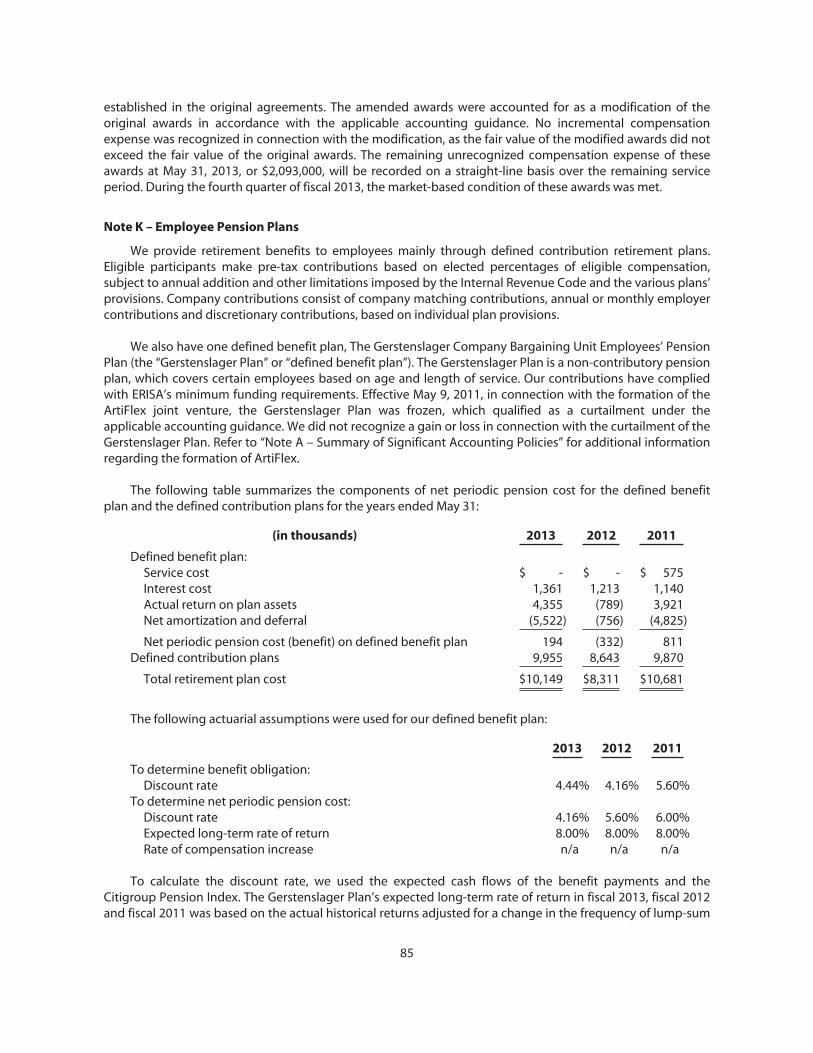
established in the original agreements. The amended awards were accounted for as a modification of theoriginal awards in accordance with the applicable accounting guidance. No incremental compensationexpense was recognized in connection with the modification, as the fair value of the modified awards did notexceed the fair value of the original awards. The remaining unrecognized compensation expense of theseawards at May 31, 2013, or $2,093,000, will be recorded on a straight-line basis over the remaining serviceperiod. During the fourth quarter of fiscal 2013, the market-based condition of these awards was met.
Note K – Employee Pension Plans
We provide retirement benefits to employees mainly through defined contribution retirement plans.Eligible participants make pre-tax contributions based on elected percentages of eligible compensation,subject to annual addition and other limitations imposed by the Internal Revenue Code and the various plans’provisions. Company contributions consist of company matching contributions, annual or monthly employercontributions and discretionary contributions, based on individual plan provisions.
We also have one defined benefit plan, The Gerstenslager Company Bargaining Unit Employees’ PensionPlan (the “Gerstenslager Plan” or “defined benefit plan”). The Gerstenslager Plan is a non-contributory pensionplan, which covers certain employees based on age and length of service. Our contributions have compliedwith ERISA’s minimum funding requirements. Effective May 9, 2011, in connection with the formation of theArtiFlex joint venture, the Gerstenslager Plan was frozen, which qualified as a curtailment under theapplicable accounting guidance. We did not recognize a gain or loss in connection with the curtailment of theGerstenslager Plan. Refer to “Note A – Summary of Significant Accounting Policies” for additional informationregarding the formation of ArtiFlex.
The following table summarizes the components of net periodic pension cost for the defined benefitplan and the defined contribution plans for the years ended May 31:
(in thousands) 2013 2012 2011
Defined benefit plan:Service cost $ - $ - $ 575Interest cost 1,361 1,213 1,140Actual return on plan assets 4,355 (789) 3,921Net amortization and deferral (5,522) (756) (4,825)
Net periodic pension cost (benefit) on defined benefit plan 194 (332) 811Defined contribution plans 9,955 8,643 9,870
Total retirement plan cost $10,149 $8,311 $10,681
The following actuarial assumptions were used for our defined benefit plan:
2013 2012 2011
To determine benefit obligation:Discount rate 4.44% 4.16% 5.60%
To determine net periodic pension cost:Discount rate 4.16% 5.60% 6.00%Expected long-term rate of return 8.00% 8.00% 8.00%Rate of compensation increase n/a n/a n/a
To calculate the discount rate, we used the expected cash flows of the benefit payments and theCitigroup Pension Index. The Gerstenslager Plan’s expected long-term rate of return in fiscal 2013, fiscal 2012and fiscal 2011 was based on the actual historical returns adjusted for a change in the frequency of lump-sum
85
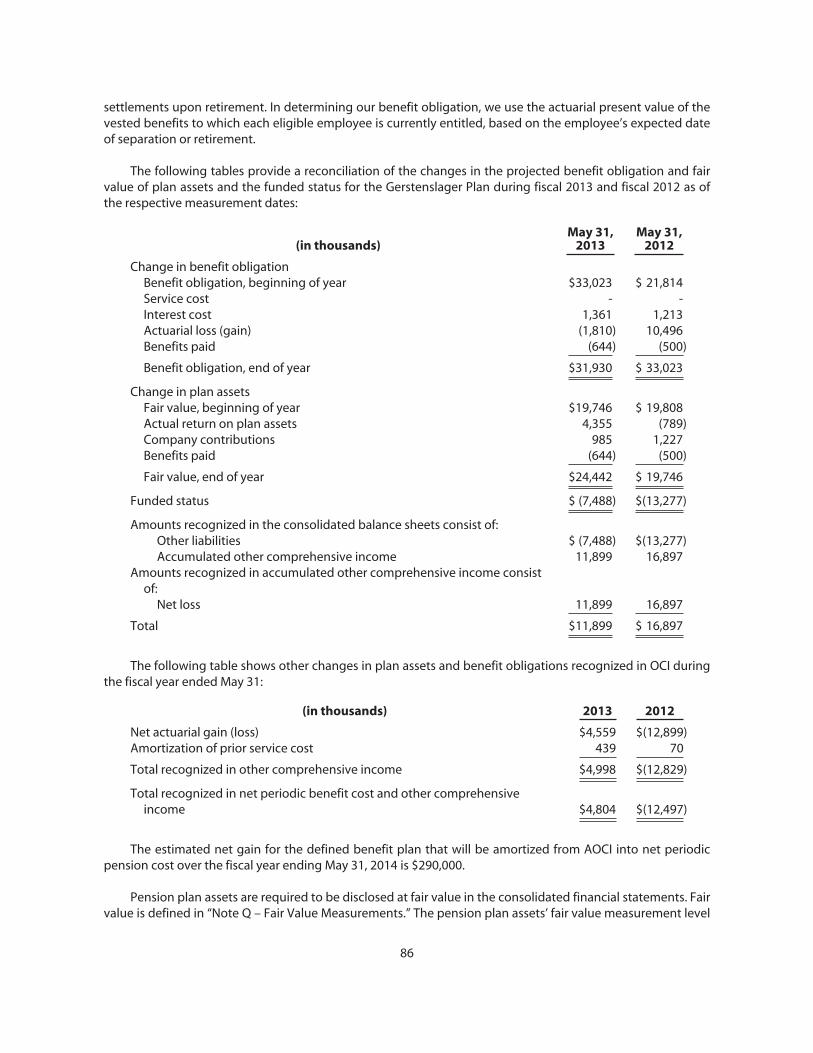
settlements upon retirement. In determining our benefit obligation, we use the actuarial present value of thevested benefits to which each eligible employee is currently entitled, based on the employee’s expected dateof separation or retirement.
The following tables provide a reconciliation of the changes in the projected benefit obligation and fairvalue of plan assets and the funded status for the Gerstenslager Plan during fiscal 2013 and fiscal 2012 as ofthe respective measurement dates:
(in thousands)May 31,
2013May 31,
2012
Change in benefit obligationBenefit obligation, beginning of year $33,023 $ 21,814Service cost - -Interest cost 1,361 1,213Actuarial loss (gain) (1,810) 10,496Benefits paid (644) (500)
Benefit obligation, end of year $31,930 $ 33,023
Change in plan assetsFair value, beginning of year $19,746 $ 19,808Actual return on plan assets 4,355 (789)Company contributions 985 1,227Benefits paid (644) (500)
Fair value, end of year $24,442 $ 19,746
Funded status $ (7,488) $(13,277)
Amounts recognized in the consolidated balance sheets consist of:Other liabilities $ (7,488) $(13,277)Accumulated other comprehensive income 11,899 16,897
Amounts recognized in accumulated other comprehensive income consistof:
Net loss 11,899 16,897
Total $11,899 $ 16,897
The following table shows other changes in plan assets and benefit obligations recognized in OCI duringthe fiscal year ended May 31:
(in thousands) 2013 2012
Net actuarial gain (loss) $4,559 $(12,899)Amortization of prior service cost 439 70
Total recognized in other comprehensive income $4,998 $(12,829)
Total recognized in net periodic benefit cost and other comprehensiveincome $4,804 $(12,497)
The estimated net gain for the defined benefit plan that will be amortized from AOCI into net periodicpension cost over the fiscal year ending May 31, 2014 is $290,000.
Pension plan assets are required to be disclosed at fair value in the consolidated financial statements. Fairvalue is defined in “Note Q – Fair Value Measurements.” The pension plan assets’ fair value measurement level
86
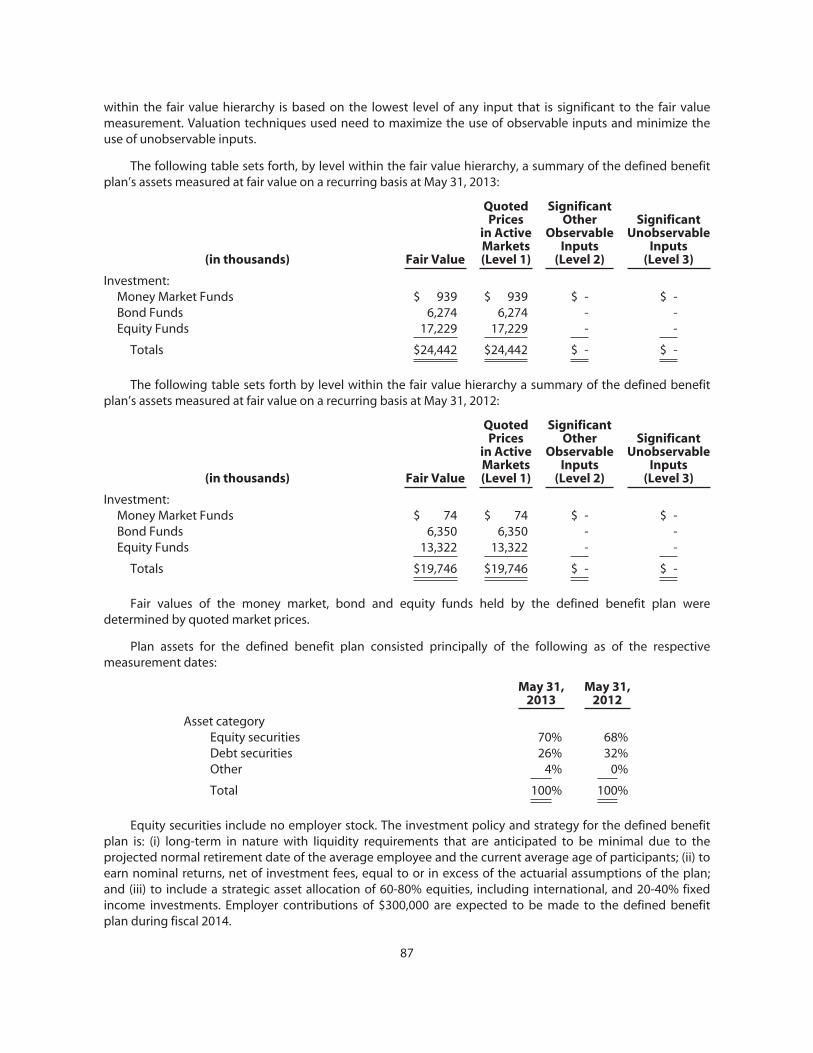
within the fair value hierarchy is based on the lowest level of any input that is significant to the fair valuemeasurement. Valuation techniques used need to maximize the use of observable inputs and minimize theuse of unobservable inputs.
The following table sets forth, by level within the fair value hierarchy, a summary of the defined benefitplan’s assets measured at fair value on a recurring basis at May 31, 2013:
(in thousands) Fair Value
QuotedPrices
in ActiveMarkets(Level 1)
SignificantOther
ObservableInputs
(Level 2)
SignificantUnobservable
Inputs(Level 3)
Investment:Money Market Funds $ 939 $ 939 $ - $ -Bond Funds 6,274 6,274 - -Equity Funds 17,229 17,229 - -
Totals $24,442 $24,442 $ - $ -
The following table sets forth by level within the fair value hierarchy a summary of the defined benefitplan’s assets measured at fair value on a recurring basis at May 31, 2012:
(in thousands) Fair Value
QuotedPrices
in ActiveMarkets(Level 1)
SignificantOther
ObservableInputs
(Level 2)
SignificantUnobservable
Inputs(Level 3)
Investment:Money Market Funds $ 74 $ 74 $ - $ -Bond Funds 6,350 6,350 - -Equity Funds 13,322 13,322 - -
Totals $19,746 $19,746 $ - $ -
Fair values of the money market, bond and equity funds held by the defined benefit plan weredetermined by quoted market prices.
Plan assets for the defined benefit plan consisted principally of the following as of the respectivemeasurement dates:
May 31,2013
May 31,2012
Asset categoryEquity securities 70% 68%Debt securities 26% 32%Other 4% 0%
Total 100% 100%
Equity securities include no employer stock. The investment policy and strategy for the defined benefitplan is: (i) long-term in nature with liquidity requirements that are anticipated to be minimal due to theprojected normal retirement date of the average employee and the current average age of participants; (ii) toearn nominal returns, net of investment fees, equal to or in excess of the actuarial assumptions of the plan;and (iii) to include a strategic asset allocation of 60-80% equities, including international, and 20-40% fixedincome investments. Employer contributions of $300,000 are expected to be made to the defined benefitplan during fiscal 2014.
87
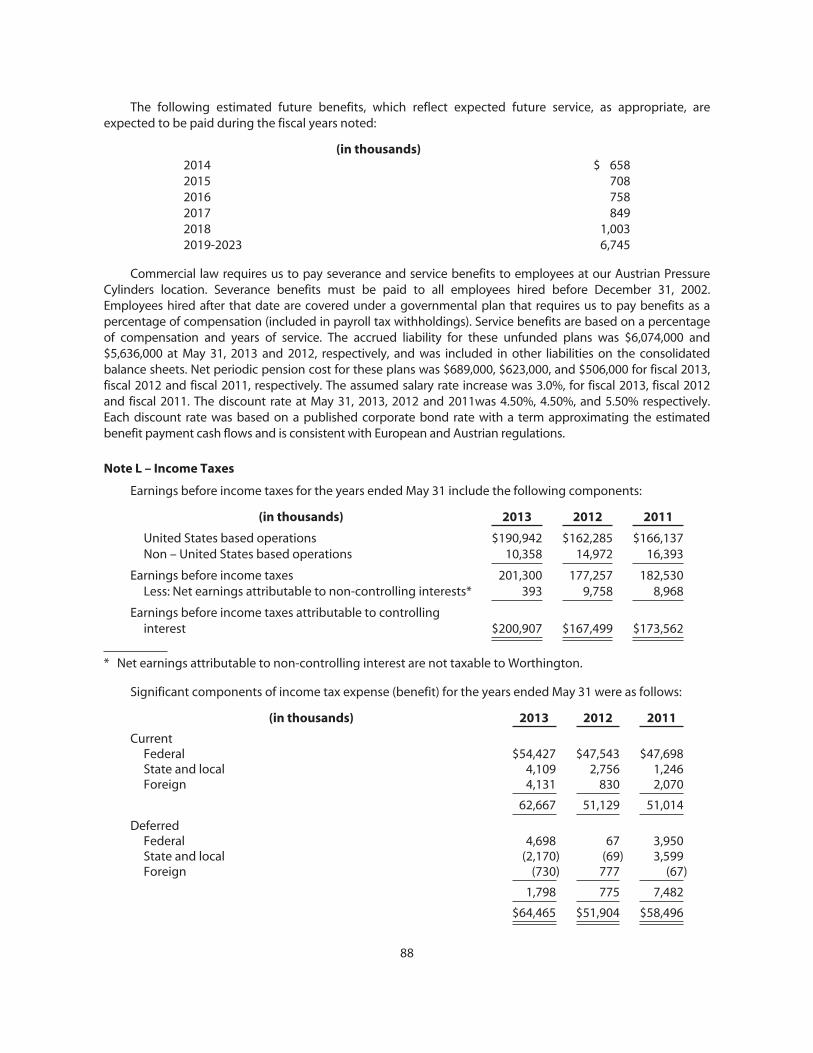
The following estimated future benefits, which reflect expected future service, as appropriate, areexpected to be paid during the fiscal years noted:
(in thousands)2014 $ 6582015 7082016 7582017 8492018 1,0032019-2023 6,745
Commercial law requires us to pay severance and service benefits to employees at our Austrian PressureCylinders location. Severance benefits must be paid to all employees hired before December 31, 2002.Employees hired after that date are covered under a governmental plan that requires us to pay benefits as apercentage of compensation (included in payroll tax withholdings). Service benefits are based on a percentageof compensation and years of service. The accrued liability for these unfunded plans was $6,074,000 and$5,636,000 at May 31, 2013 and 2012, respectively, and was included in other liabilities on the consolidatedbalance sheets. Net periodic pension cost for these plans was $689,000, $623,000, and $506,000 for fiscal 2013,fiscal 2012 and fiscal 2011, respectively. The assumed salary rate increase was 3.0%, for fiscal 2013, fiscal 2012and fiscal 2011. The discount rate at May 31, 2013, 2012 and 2011was 4.50%, 4.50%, and 5.50% respectively.Each discount rate was based on a published corporate bond rate with a term approximating the estimatedbenefit payment cash flows and is consistent with European and Austrian regulations.
Note L – Income Taxes
Earnings before income taxes for the years ended May 31 include the following components:
(in thousands) 2013 2012 2011
United States based operations $190,942 $162,285 $166,137Non – United States based operations 10,358 14,972 16,393
Earnings before income taxes 201,300 177,257 182,530Less: Net earnings attributable to non-controlling interests* 393 9,758 8,968
Earnings before income taxes attributable to controllinginterest $200,907 $167,499 $173,562
* Net earnings attributable to non-controlling interest are not taxable to Worthington.
Significant components of income tax expense (benefit) for the years ended May 31 were as follows:
(in thousands) 2013 2012 2011
CurrentFederal $54,427 $47,543 $47,698State and local 4,109 2,756 1,246Foreign 4,131 830 2,070
62,667 51,129 51,014
DeferredFederal 4,698 67 3,950State and local (2,170) (69) 3,599Foreign (730) 777 (67)
1,798 775 7,482
$64,465 $51,904 $58,496
88
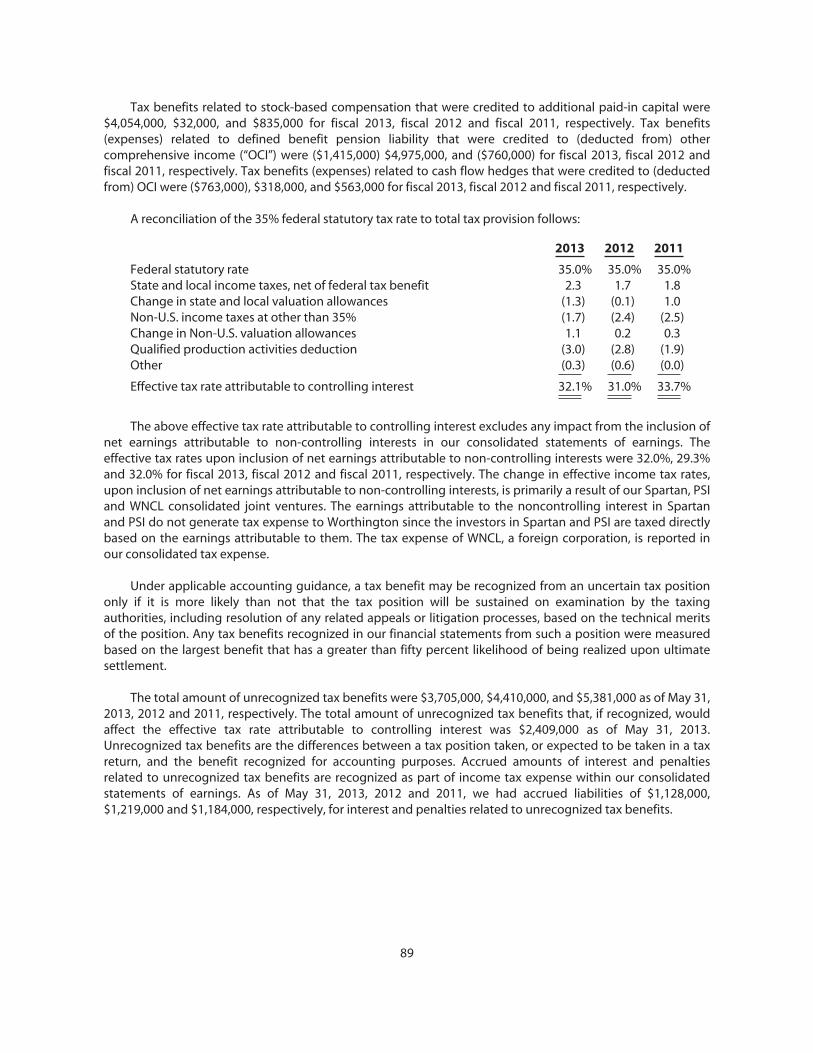
Tax benefits related to stock-based compensation that were credited to additional paid-in capital were$4,054,000, $32,000, and $835,000 for fiscal 2013, fiscal 2012 and fiscal 2011, respectively. Tax benefits(expenses) related to defined benefit pension liability that were credited to (deducted from) othercomprehensive income (“OCI”) were ($1,415,000) $4,975,000, and ($760,000) for fiscal 2013, fiscal 2012 andfiscal 2011, respectively. Tax benefits (expenses) related to cash flow hedges that were credited to (deductedfrom) OCI were ($763,000), $318,000, and $563,000 for fiscal 2013, fiscal 2012 and fiscal 2011, respectively.
A reconciliation of the 35% federal statutory tax rate to total tax provision follows:
2013 2012 2011
Federal statutory rate 35.0% 35.0% 35.0%State and local income taxes, net of federal tax benefit 2.3 1.7 1.8Change in state and local valuation allowances (1.3) (0.1) 1.0Non-U.S. income taxes at other than 35% (1.7) (2.4) (2.5)Change in Non-U.S. valuation allowances 1.1 0.2 0.3Qualified production activities deduction (3.0) (2.8) (1.9)Other (0.3) (0.6) (0.0)
Effective tax rate attributable to controlling interest 32.1% 31.0% 33.7%
The above effective tax rate attributable to controlling interest excludes any impact from the inclusion ofnet earnings attributable to non-controlling interests in our consolidated statements of earnings. Theeffective tax rates upon inclusion of net earnings attributable to non-controlling interests were 32.0%, 29.3%and 32.0% for fiscal 2013, fiscal 2012 and fiscal 2011, respectively. The change in effective income tax rates,upon inclusion of net earnings attributable to non-controlling interests, is primarily a result of our Spartan, PSIand WNCL consolidated joint ventures. The earnings attributable to the noncontrolling interest in Spartanand PSI do not generate tax expense to Worthington since the investors in Spartan and PSI are taxed directlybased on the earnings attributable to them. The tax expense of WNCL, a foreign corporation, is reported inour consolidated tax expense.
Under applicable accounting guidance, a tax benefit may be recognized from an uncertain tax positiononly if it is more likely than not that the tax position will be sustained on examination by the taxingauthorities, including resolution of any related appeals or litigation processes, based on the technical meritsof the position. Any tax benefits recognized in our financial statements from such a position were measuredbased on the largest benefit that has a greater than fifty percent likelihood of being realized upon ultimatesettlement.
The total amount of unrecognized tax benefits were $3,705,000, $4,410,000, and $5,381,000 as of May 31,2013, 2012 and 2011, respectively. The total amount of unrecognized tax benefits that, if recognized, wouldaffect the effective tax rate attributable to controlling interest was $2,409,000 as of May 31, 2013.Unrecognized tax benefits are the differences between a tax position taken, or expected to be taken in a taxreturn, and the benefit recognized for accounting purposes. Accrued amounts of interest and penaltiesrelated to unrecognized tax benefits are recognized as part of income tax expense within our consolidatedstatements of earnings. As of May 31, 2013, 2012 and 2011, we had accrued liabilities of $1,128,000,$1,219,000 and $1,184,000, respectively, for interest and penalties related to unrecognized tax benefits.
89
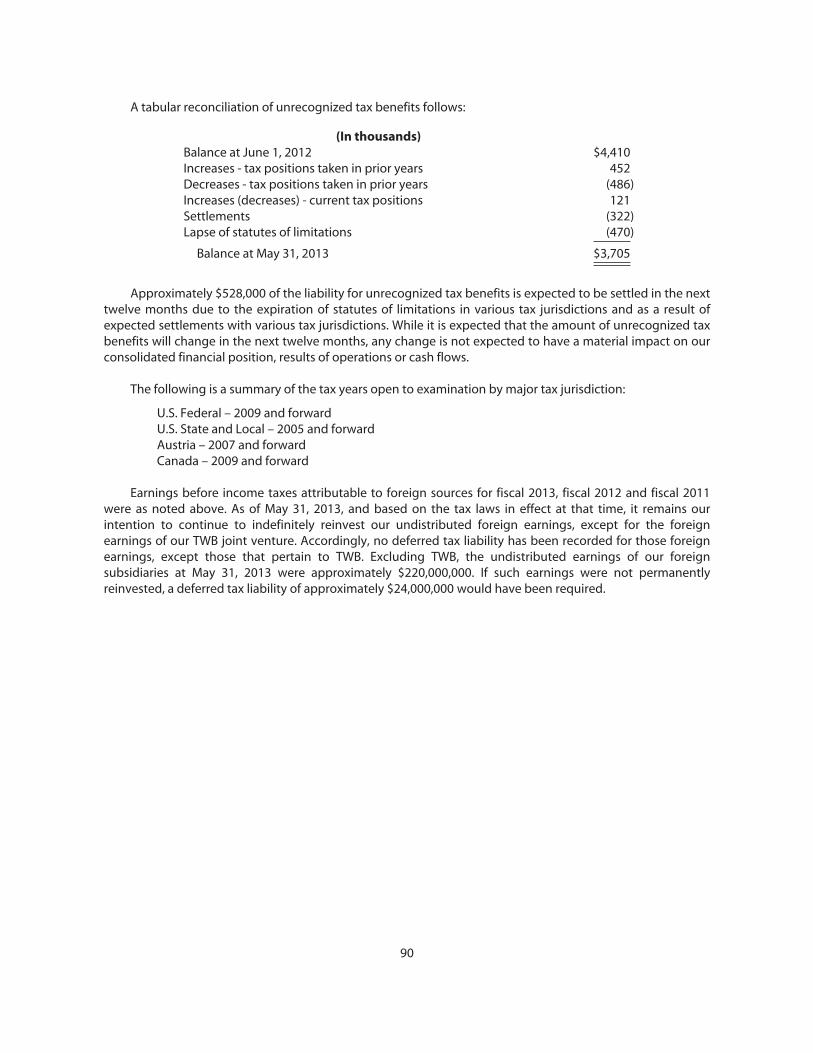
A tabular reconciliation of unrecognized tax benefits follows:
(In thousands)Balance at June 1, 2012 $4,410Increases - tax positions taken in prior years 452Decreases - tax positions taken in prior years (486)Increases (decreases) - current tax positions 121Settlements (322)Lapse of statutes of limitations (470)
Balance at May 31, 2013 $3,705
Approximately $528,000 of the liability for unrecognized tax benefits is expected to be settled in the nexttwelve months due to the expiration of statutes of limitations in various tax jurisdictions and as a result ofexpected settlements with various tax jurisdictions. While it is expected that the amount of unrecognized taxbenefits will change in the next twelve months, any change is not expected to have a material impact on ourconsolidated financial position, results of operations or cash flows.
The following is a summary of the tax years open to examination by major tax jurisdiction:
U.S. Federal – 2009 and forwardU.S. State and Local – 2005 and forwardAustria – 2007 and forwardCanada – 2009 and forward
Earnings before income taxes attributable to foreign sources for fiscal 2013, fiscal 2012 and fiscal 2011were as noted above. As of May 31, 2013, and based on the tax laws in effect at that time, it remains ourintention to continue to indefinitely reinvest our undistributed foreign earnings, except for the foreignearnings of our TWB joint venture. Accordingly, no deferred tax liability has been recorded for those foreignearnings, except those that pertain to TWB. Excluding TWB, the undistributed earnings of our foreignsubsidiaries at May 31, 2013 were approximately $220,000,000. If such earnings were not permanentlyreinvested, a deferred tax liability of approximately $24,000,000 would have been required.
90
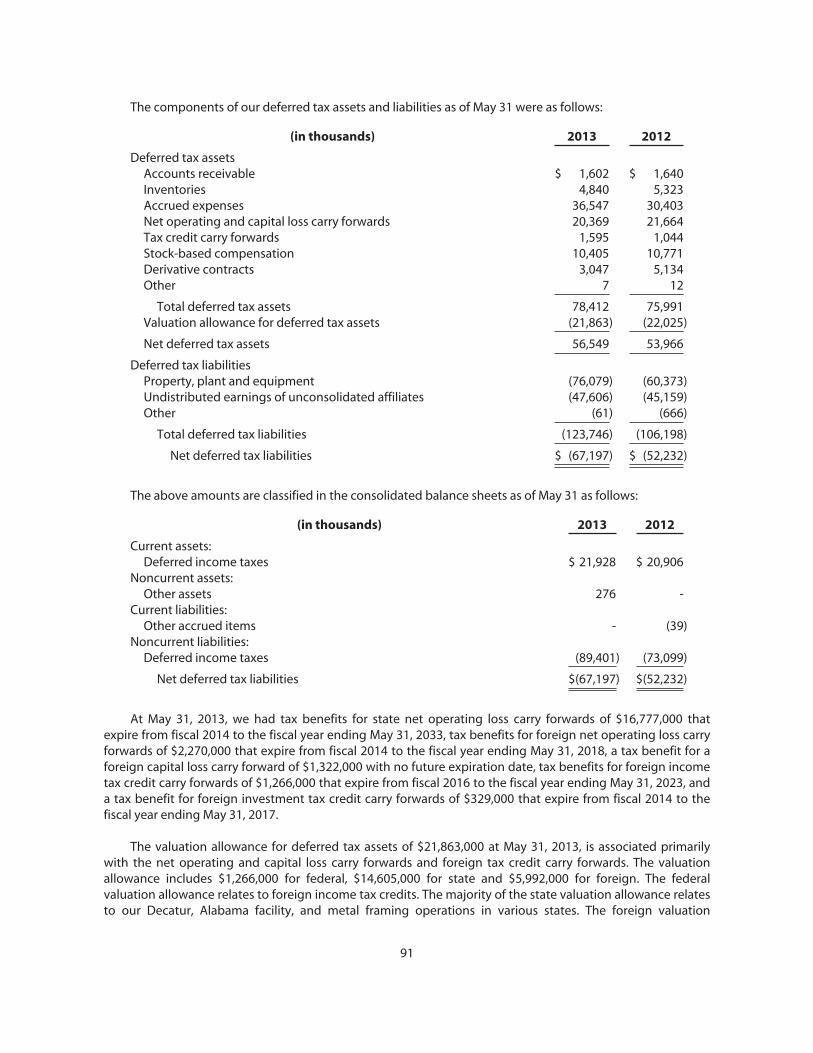
The components of our deferred tax assets and liabilities as of May 31 were as follows:
(in thousands) 2013 2012
Deferred tax assetsAccounts receivable $ 1,602 $ 1,640Inventories 4,840 5,323Accrued expenses 36,547 30,403Net operating and capital loss carry forwards 20,369 21,664Tax credit carry forwards 1,595 1,044Stock-based compensation 10,405 10,771Derivative contracts 3,047 5,134Other 7 12
Total deferred tax assets 78,412 75,991Valuation allowance for deferred tax assets (21,863) (22,025)
Net deferred tax assets 56,549 53,966
Deferred tax liabilitiesProperty, plant and equipment (76,079) (60,373)Undistributed earnings of unconsolidated affiliates (47,606) (45,159)Other (61) (666)
Total deferred tax liabilities (123,746) (106,198)
Net deferred tax liabilities $ (67,197) $ (52,232)
The above amounts are classified in the consolidated balance sheets as of May 31 as follows:
(in thousands) 2013 2012
Current assets:Deferred income taxes $ 21,928 $ 20,906
Noncurrent assets:Other assets 276 -
Current liabilities:Other accrued items - (39)
Noncurrent liabilities:Deferred income taxes (89,401) (73,099)
Net deferred tax liabilities $(67,197) $(52,232)
At May 31, 2013, we had tax benefits for state net operating loss carry forwards of $16,777,000 thatexpire from fiscal 2014 to the fiscal year ending May 31, 2033, tax benefits for foreign net operating loss carryforwards of $2,270,000 that expire from fiscal 2014 to the fiscal year ending May 31, 2018, a tax benefit for aforeign capital loss carry forward of $1,322,000 with no future expiration date, tax benefits for foreign incometax credit carry forwards of $1,266,000 that expire from fiscal 2016 to the fiscal year ending May 31, 2023, anda tax benefit for foreign investment tax credit carry forwards of $329,000 that expire from fiscal 2014 to thefiscal year ending May 31, 2017.
The valuation allowance for deferred tax assets of $21,863,000 at May 31, 2013, is associated primarilywith the net operating and capital loss carry forwards and foreign tax credit carry forwards. The valuationallowance includes $1,266,000 for federal, $14,605,000 for state and $5,992,000 for foreign. The federalvaluation allowance relates to foreign income tax credits. The majority of the state valuation allowance relatesto our Decatur, Alabama facility, and metal framing operations in various states. The foreign valuation
91
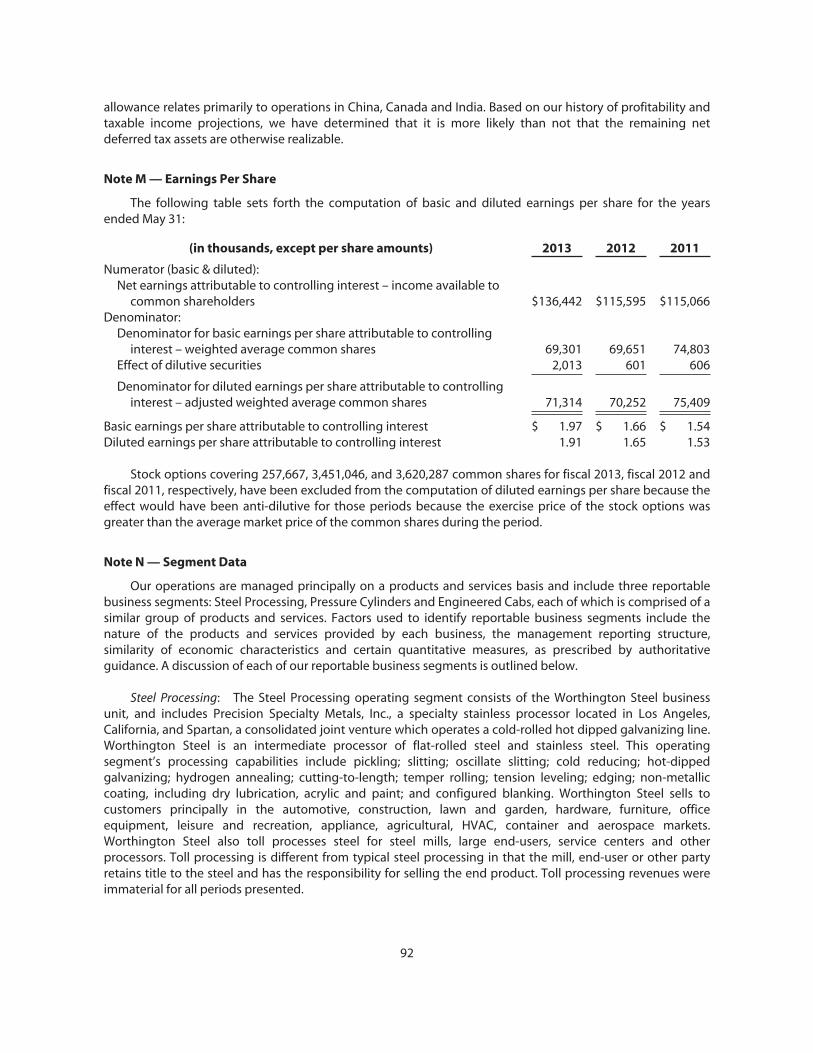
allowance relates primarily to operations in China, Canada and India. Based on our history of profitability andtaxable income projections, we have determined that it is more likely than not that the remaining netdeferred tax assets are otherwise realizable.
Note M — Earnings Per Share
The following table sets forth the computation of basic and diluted earnings per share for the yearsended May 31:
(in thousands, except per share amounts) 2013 2012 2011
Numerator (basic & diluted):Net earnings attributable to controlling interest – income available to
common shareholders $136,442 $115,595 $115,066Denominator:
Denominator for basic earnings per share attributable to controllinginterest – weighted average common shares 69,301 69,651 74,803
Effect of dilutive securities 2,013 601 606
Denominator for diluted earnings per share attributable to controllinginterest – adjusted weighted average common shares 71,314 70,252 75,409
Basic earnings per share attributable to controlling interest $ 1.97 $ 1.66 $ 1.54Diluted earnings per share attributable to controlling interest 1.91 1.65 1.53
Stock options covering 257,667, 3,451,046, and 3,620,287 common shares for fiscal 2013, fiscal 2012 andfiscal 2011, respectively, have been excluded from the computation of diluted earnings per share because theeffect would have been anti-dilutive for those periods because the exercise price of the stock options wasgreater than the average market price of the common shares during the period.
Note N — Segment Data
Our operations are managed principally on a products and services basis and include three reportablebusiness segments: Steel Processing, Pressure Cylinders and Engineered Cabs, each of which is comprised of asimilar group of products and services. Factors used to identify reportable business segments include thenature of the products and services provided by each business, the management reporting structure,similarity of economic characteristics and certain quantitative measures, as prescribed by authoritativeguidance. A discussion of each of our reportable business segments is outlined below.
Steel Processing: The Steel Processing operating segment consists of the Worthington Steel businessunit, and includes Precision Specialty Metals, Inc., a specialty stainless processor located in Los Angeles,California, and Spartan, a consolidated joint venture which operates a cold-rolled hot dipped galvanizing line.Worthington Steel is an intermediate processor of flat-rolled steel and stainless steel. This operatingsegment’s processing capabilities include pickling; slitting; oscillate slitting; cold reducing; hot-dippedgalvanizing; hydrogen annealing; cutting-to-length; temper rolling; tension leveling; edging; non-metalliccoating, including dry lubrication, acrylic and paint; and configured blanking. Worthington Steel sells tocustomers principally in the automotive, construction, lawn and garden, hardware, furniture, officeequipment, leisure and recreation, appliance, agricultural, HVAC, container and aerospace markets.Worthington Steel also toll processes steel for steel mills, large end-users, service centers and otherprocessors. Toll processing is different from typical steel processing in that the mill, end-user or other partyretains title to the steel and has the responsibility for selling the end product. Toll processing revenues wereimmaterial for all periods presented.
92
Pressure Cylinders: The Pressure Cylinders operating segment consists of the Worthington Cylindersbusiness unit and WNCL, a consolidated joint venture based in India that manufactures high-pressure,seamless steel cylinders for compressed natural gas storage in motor vehicles as well as cylinders forcompressed industrial gases. Our Pressure Cylinders operating segment manufactures and sells filled andunfilled pressure cylinders, tanks and various accessories and related products for diversified end-use marketapplications. The following is a detailed discussion of these markets:
• Retail: These products include liquefied petroleum gas (“LPG”) cylinders for barbecue grills andcamping equipment, propane accessories, hand held torches and accessories including fuelcylinders, scuba cylinders, paintball cylinders and Balloon Time® helium balloon kits. These productsare sold primarily to mass merchandisers, cylinder exchangers and distributors.
• Alternative fuels: This sector includes Type I, II, III and ASME cylinders for containment ofcompressed natural gas and hydrogen for automobiles, buses, and light-duty trucks, as well aspropane/autogas cylinders for automobiles.
• Industrial and Other: This market sector includes industrial, refrigerant, and certain LPG cylinders,as well as other specialty products. Cylinders in these markets are generally sold to gas producersand distributors. Industrial cylinders hold fuel for uses such as cutting, welding, breathing (medical,diving and firefighting), semiconductor production, and beverage delivery. Refrigerant gas cylindersare used to hold refrigerant gases for commercial, residential and automotive air conditioning andrefrigeration systems. LPG cylinders hold fuel for recreational vehicle equipment, residential andlight commercial heating systems, industrial forklifts and commercial/residential cooking (the latter,generally outside North America). Specialty products include a variety of fire suppression andchemical tanks.
• Energy: This sector includes steel and fiberglass tanks, and pressure vessels and other products forglobal energy markets, including oil and gas and nuclear, which products are used for a broadvariety of exploration, recovery and production purposes; and hoists and other marine productswhich are used principally in shipyard lift systems. This sector also leverages its manufacturingcompetencies to produce pressure vessels, atmospheric tanks, controls and various custommachined components for other industrial and agricultural end markets.
Engineered Cabs: This operating segment designs and manufactures high-quality, custom-engineeredopen and closed cabs and operator stations for a wide range of heavy mobile equipment in a range ofindustries. Engineered Cabs also manufactures other specialty weldments, kits, accessories, and cabcomponents. The segment’s core capabilities are organized into two categories: 1) design and engineeringand 2) manufacturing. Design and engineering capabilities consist of filling key project management rolesfrom the initial design phase, prototyping and through final manufacturing and delivery of the finishedproduct. Manufacturing capabilities are facilitated by computer-aided design and manufacturing systems aswell as a variety of technologically advanced cutting, bending, forming, welding and painting equipment.Products and services are sold principally to original equipment manufacturers located primarily in the UnitedStates.
Other: Included in the Other category are operating segments that do not meet the applicableaggregation criteria and materiality tests for purposes of separate disclosure as reportable business segments,as well as other corporate-related entities. These operating segments are: Steel Packaging, ConstructionServices and Worthington Energy Innovations (“WEI”). During the first quarter of fiscal 2013, we made certainorganizational changes impacting the internal reporting and management structure of our former GlobalGroup operating segment. As a result of these organizational changes, management responsibilities andinternal reporting were re-aligned to form the Construction Services and WEI operating segments.Additionally, we no longer manage our residual metal framing assets in a manner that constitutes anoperating segment. Accordingly, the financial results and operating performance of our former Metal Framingoperating segment, including activity related to the wind-down of this business, are reported within the
93
Other category for segment reporting purposes. Segment information reported in previous periods has beenrestated to conform to this new presentation.
Steel Packaging: This operating segment consists of Worthington Steelpac Systems, LLC (“Steelpac”),which designs and manufactures reusable custom platforms, racks and pallets made of steel forsupporting, protecting and handling products throughout the shipping process for customers inindustries such as automotive, lawn and garden and recreational vehicles.
Construction Services: This operating segment operates a business platform that includes the design,supply and building/construction of mid-rise light gauge steel framed commercial structures, singlefamily and multi-family housing units. The operating segment includes the Worthington ConstructionGroup and the Military Construction business units. Worthington Construction Group includes highdensity mid-rise residential construction in emerging and developed international markets. MilitaryConstruction operates with a focus on domestic military bases.
Worthington Energy Innovations: This operating segment consists of our 75%-owned consolidated jointventure. WEI is a professional services company that develops cost-effective energy solutions for entitiesin North America. WEI designs solutions to minimize energy consumption, manages the energy solutioninstallation, monitors and verifies energy usage, guarantees future energy savings and shares in thesesavings. Additionally, WEI utilizes certain patented products to further enhance energy savings.
The accounting policies of the reportable business segments and other operating segments aredescribed in “Note A – Summary of Significant Accounting Policies.” We evaluate operating segmentperformance based on operating income (loss). Inter-segment sales are not material.
94

The following table presents summarized financial information for our reportable business segments asof, and for the fiscal years ended, May 31:
(in thousands) 2013 2012 2011
Net salesSteel Processing $1,443,499 $1,578,509 $1,405,492Pressure Cylinders 859,264 770,101 591,945Engineered Cabs 226,002 104,272 -Other 83,479 81,819 445,187
Total net sales $2,612,244 $2,534,701 $2,442,624
Operating income (loss)Steel Processing $ 66,116 $ 71,578 $ 77,671Pressure Cylinders 66,367 45,108 48,954Engineered Cabs 4,158 4,878 -Other (7,499) (19,954) (2,269)
Total operating income $ 129,142 $ 101,610 $ 124,356
Depreciation and amortizationSteel Processing $ 25,742 $ 26,843 $ 27,632Pressure Cylinders 26,919 20,407 14,734Engineered Cabs 9,096 3,540 -Other 4,712 5,083 18,692
Total depreciation and amortization $ 66,469 $ 55,873 $ 61,058
Restructuring and other expense (income)Steel Processing $ - $ - $ (303)Pressure Cylinders 2,665 52 -Engineered Cabs - - -Other 628 5,932 2,956
Total restructuring and other expense $ 3,293 $ 5,984 $ 2,653
Impairment of long-lived assetsSteel Processing $ - $ - $ -Pressure Cylinders 6,488 - -Engineered Cabs - - -Other - 355 4,386
Total impairment of long-lived assets $ 6,488 $ 355 $ 4,386
Joint venture transactionsSteel Processing $ - $ (2,102) $ -Pressure Cylinders - - -Engineered Cabs - - -Other (604) 1,952 (10,436)
Total joint venture transactions $ (604) $ (150) $ (10,436)
Total assetsSteel Processing $ 605,963 $ 703,336 $ 742,838Pressure Cylinders 742,686 575,250 481,361Engineered Cabs 201,048 199,594 -Other 401,160 399,617 443,050
Total assets $1,950,857 $1,877,797 $1,667,249
95

The following table presents net sales by geographic region for the years ended May 31:
(in thousands) 2013 2012 2011
United States $2,418,307 $2,333,575 $2,256,579Canada 21,257 29,097 32,891Europe 159,562 150,458 116,071Other 13,118 21,571 37,083
Total $2,612,244 $2,534,701 $2,442,624
The following table presents property, plant and equipment, net, by geographic region as of May 31:
(in thousands) 2013 2012
United States $400,032 $371,269Canada 1,275 1,270Europe 51,222 59,209Other 6,901 11,329
Total $459,430 $443,077
Note O — Acquisitions
Fiscal 2013
Palmer Mfg. & Tank, Inc.
On April 9, 2013, we acquired the net assets of Palmer Mfg. & Tank, Inc. (“Palmer”) for cash considerationof approximately $113,479,000. Palmer manufactures steel and fiberglass tanks and processing equipment forthe oil and gas industry, and custom manufactured fiberglass tanks for agricultural, chemical and generalindustrial applications. The acquired net assets became part of our Pressure Cylinders operating segmentupon closing.
The assets acquired and liabilities assumed were recognized at their acquisition-date fair values, withgoodwill representing the excess of the purchase price over the fair value of the net identifiable assetsacquired. In connection with the acquisition of Palmer, we identified and valued the following identifiableintangible assets:
(in thousands)Amount
UsefulLife
(Years)CategoryCustomer relationships $25,730 8Trade name 8,406 5Non-compete agreement 5,208 5Other 150 3
Total acquired identifiable intangible assets $39,494
The purchase price includes the fair values of other assets that were not identifiable, not separatelyrecognizable under accounting rules (e.g., assembled workforce) or of immaterial value. The purchase pricealso includes a going-concern element that represents our ability to earn a higher rate of return on this groupof assets than would be expected on the separate assets as determined during the valuation process. Thisadditional investment value resulted in goodwill, which is expected to be deductible for income tax purposes.
96
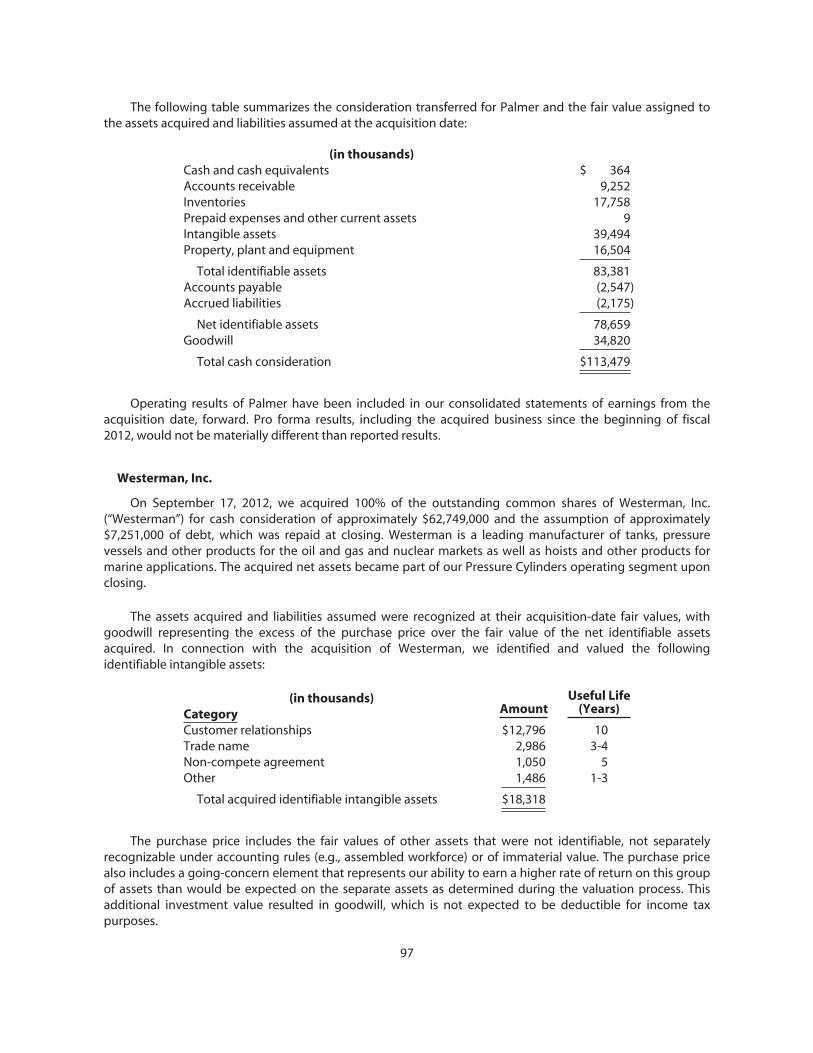
The following table summarizes the consideration transferred for Palmer and the fair value assigned tothe assets acquired and liabilities assumed at the acquisition date:
(in thousands)Cash and cash equivalents $ 364Accounts receivable 9,252Inventories 17,758Prepaid expenses and other current assets 9Intangible assets 39,494Property, plant and equipment 16,504
Total identifiable assets 83,381Accounts payable (2,547)Accrued liabilities (2,175)
Net identifiable assets 78,659Goodwill 34,820
Total cash consideration $113,479
Operating results of Palmer have been included in our consolidated statements of earnings from theacquisition date, forward. Pro forma results, including the acquired business since the beginning of fiscal2012, would not be materially different than reported results.
Westerman, Inc.
On September 17, 2012, we acquired 100% of the outstanding common shares of Westerman, Inc.(“Westerman”) for cash consideration of approximately $62,749,000 and the assumption of approximately$7,251,000 of debt, which was repaid at closing. Westerman is a leading manufacturer of tanks, pressurevessels and other products for the oil and gas and nuclear markets as well as hoists and other products formarine applications. The acquired net assets became part of our Pressure Cylinders operating segment uponclosing.
The assets acquired and liabilities assumed were recognized at their acquisition-date fair values, withgoodwill representing the excess of the purchase price over the fair value of the net identifiable assetsacquired. In connection with the acquisition of Westerman, we identified and valued the followingidentifiable intangible assets:
(in thousands)Amount
Useful Life(Years)Category
Customer relationships $12,796 10Trade name 2,986 3-4Non-compete agreement 1,050 5Other 1,486 1-3
Total acquired identifiable intangible assets $18,318
The purchase price includes the fair values of other assets that were not identifiable, not separatelyrecognizable under accounting rules (e.g., assembled workforce) or of immaterial value. The purchase pricealso includes a going-concern element that represents our ability to earn a higher rate of return on this groupof assets than would be expected on the separate assets as determined during the valuation process. Thisadditional investment value resulted in goodwill, which is not expected to be deductible for income taxpurposes.
97
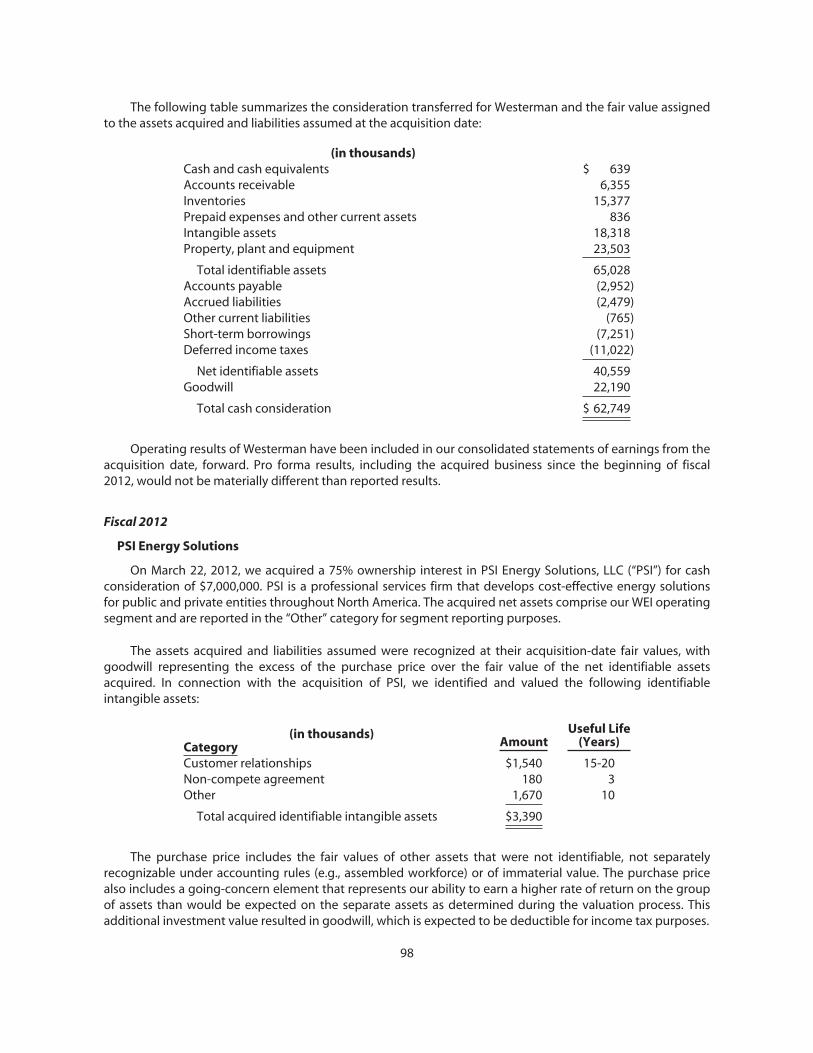
The following table summarizes the consideration transferred for Westerman and the fair value assignedto the assets acquired and liabilities assumed at the acquisition date:
(in thousands)Cash and cash equivalents $ 639Accounts receivable 6,355Inventories 15,377Prepaid expenses and other current assets 836Intangible assets 18,318Property, plant and equipment 23,503
Total identifiable assets 65,028Accounts payable (2,952)Accrued liabilities (2,479)Other current liabilities (765)Short-term borrowings (7,251)Deferred income taxes (11,022)
Net identifiable assets 40,559Goodwill 22,190
Total cash consideration $ 62,749
Operating results of Westerman have been included in our consolidated statements of earnings from theacquisition date, forward. Pro forma results, including the acquired business since the beginning of fiscal2012, would not be materially different than reported results.
Fiscal 2012
PSI Energy Solutions
On March 22, 2012, we acquired a 75% ownership interest in PSI Energy Solutions, LLC (“PSI”) for cashconsideration of $7,000,000. PSI is a professional services firm that develops cost-effective energy solutionsfor public and private entities throughout North America. The acquired net assets comprise our WEI operatingsegment and are reported in the “Other” category for segment reporting purposes.
The assets acquired and liabilities assumed were recognized at their acquisition-date fair values, withgoodwill representing the excess of the purchase price over the fair value of the net identifiable assetsacquired. In connection with the acquisition of PSI, we identified and valued the following identifiableintangible assets:
(in thousands)Amount
Useful Life(Years)Category
Customer relationships $1,540 15-20Non-compete agreement 180 3Other 1,670 10
Total acquired identifiable intangible assets $3,390
The purchase price includes the fair values of other assets that were not identifiable, not separatelyrecognizable under accounting rules (e.g., assembled workforce) or of immaterial value. The purchase pricealso includes a going-concern element that represents our ability to earn a higher rate of return on the groupof assets than would be expected on the separate assets as determined during the valuation process. Thisadditional investment value resulted in goodwill, which is expected to be deductible for income tax purposes.
98

The following table summarizes the consideration transferred for PSI and the fair value assigned to theassets acquired and liabilities assumed at the acquisition date:
(in thousands)Accounts receivable $ 784Inventories 407Intangible assets 3,390Property, plant and equipment 66
Total identifiable assets 4,647Accounts payable (528)Accrued liabilities (437)
Net identifiable assets 3,682Goodwill 5,651
Net assets 9,333Noncontrolling interest (2,333)
Total consideration paid $ 7,000
Operating results of PSI have been included in our consolidated statements of earnings from theacquisition date, forward. Pro forma results, including the acquired business since the beginning of fiscal 2013or fiscal 2012, would not be materially different than reported results.
Angus
On December 29, 2011, we acquired 100% of the outstanding economic interests of Angus for cashconsideration of approximately $132,940,000 and the assumption of approximately $47,324,000 of debt, ofwhich $44,341,000 was repaid prior to quarter-end. Additionally, we issued 382,749 restricted common sharesto certain former employees of Angus who became employees of Worthington upon closing. These restrictedcommon shares, which vest over a period of one or three years, had a grant-date fair value of approximately$6,300,000. Of this amount, approximately $1,100,000 was attributed to the purchase price. Angus designsand manufactures high-quality, custom-engineered open and closed cabs and operator stations and customfabrications of heavy mobile equipment. The acquired net assets and related operations of Angus compriseour Engineered Cabs operating segment. In connection with the acquisition of Angus, we incurredapproximately $780,000 of acquisition-related costs, which have been expensed as incurred and recognizedwithin SG&A expense in our consolidated statements of earnings.
The assets acquired and liabilities assumed were recognized at their acquisition-date fair values, withgoodwill representing the excess of the purchase price over the fair value of the net identifiable assetsacquired. In connection with the acquisition of Angus, we identified and valued the following identifiableintangible assets:
(in thousands)Amount
Useful Life(Years)Category
Trade name $19,100 IndefiniteCustomer relationships 32,200 10-15Non-compete agreement 640 3Other 963 9
Total acquired identifiable intangible assets $52,903
99
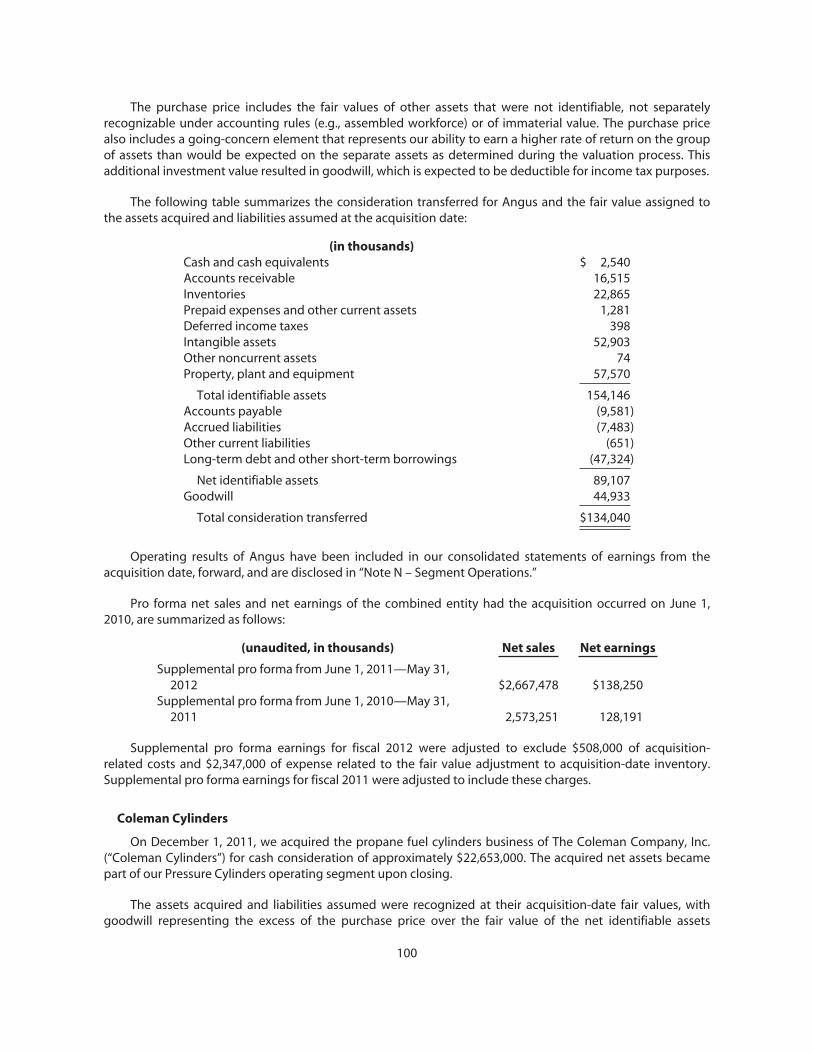
The purchase price includes the fair values of other assets that were not identifiable, not separatelyrecognizable under accounting rules (e.g., assembled workforce) or of immaterial value. The purchase pricealso includes a going-concern element that represents our ability to earn a higher rate of return on the groupof assets than would be expected on the separate assets as determined during the valuation process. Thisadditional investment value resulted in goodwill, which is expected to be deductible for income tax purposes.
The following table summarizes the consideration transferred for Angus and the fair value assigned tothe assets acquired and liabilities assumed at the acquisition date:
(in thousands)Cash and cash equivalents $ 2,540Accounts receivable 16,515Inventories 22,865Prepaid expenses and other current assets 1,281Deferred income taxes 398Intangible assets 52,903Other noncurrent assets 74Property, plant and equipment 57,570
Total identifiable assets 154,146Accounts payable (9,581)Accrued liabilities (7,483)Other current liabilities (651)Long-term debt and other short-term borrowings (47,324)
Net identifiable assets 89,107Goodwill 44,933
Total consideration transferred $134,040
Operating results of Angus have been included in our consolidated statements of earnings from theacquisition date, forward, and are disclosed in “Note N – Segment Operations.”
Pro forma net sales and net earnings of the combined entity had the acquisition occurred on June 1,2010, are summarized as follows:
(unaudited, in thousands) Net sales Net earnings
Supplemental pro forma from June 1, 2011—May 31,2012 $2,667,478 $138,250
Supplemental pro forma from June 1, 2010—May 31,2011 2,573,251 128,191
Supplemental pro forma earnings for fiscal 2012 were adjusted to exclude $508,000 of acquisition-related costs and $2,347,000 of expense related to the fair value adjustment to acquisition-date inventory.Supplemental pro forma earnings for fiscal 2011 were adjusted to include these charges.
Coleman Cylinders
On December 1, 2011, we acquired the propane fuel cylinders business of The Coleman Company, Inc.(“Coleman Cylinders”) for cash consideration of approximately $22,653,000. The acquired net assets becamepart of our Pressure Cylinders operating segment upon closing.
The assets acquired and liabilities assumed were recognized at their acquisition-date fair values, withgoodwill representing the excess of the purchase price over the fair value of the net identifiable assets
100
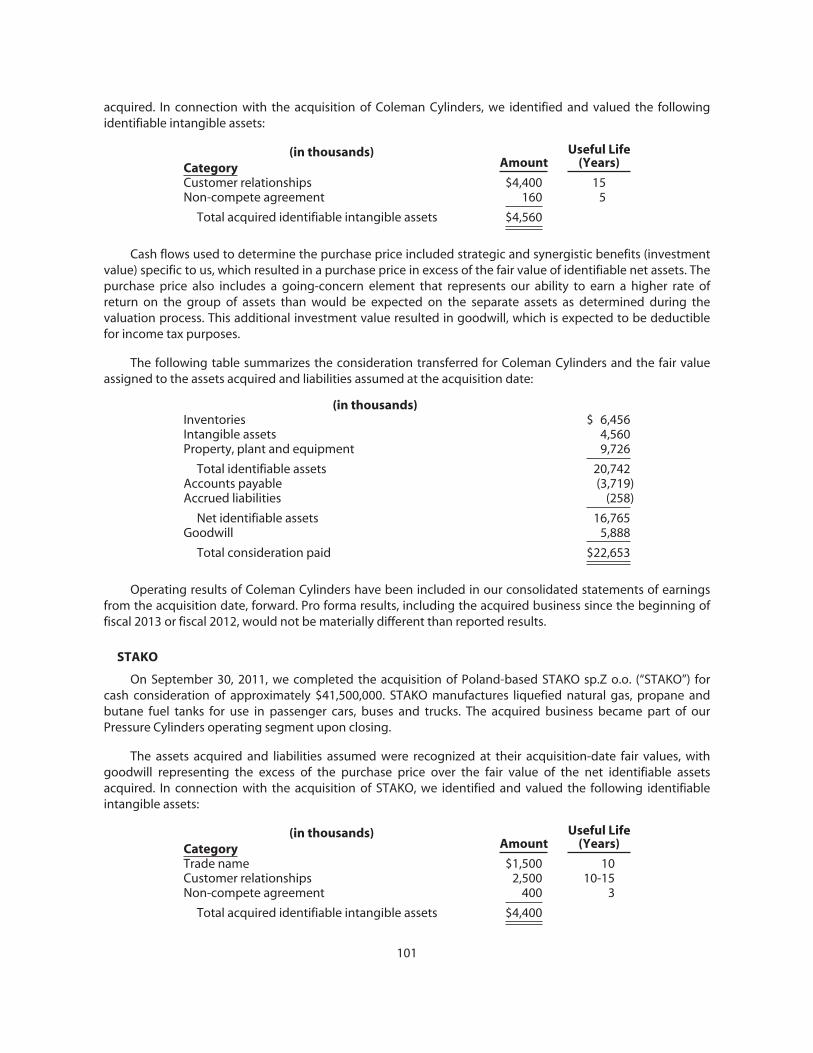
acquired. In connection with the acquisition of Coleman Cylinders, we identified and valued the followingidentifiable intangible assets:
(in thousands)Amount
Useful Life(Years)Category
Customer relationships $4,400 15Non-compete agreement 160 5
Total acquired identifiable intangible assets $4,560
Cash flows used to determine the purchase price included strategic and synergistic benefits (investmentvalue) specific to us, which resulted in a purchase price in excess of the fair value of identifiable net assets. Thepurchase price also includes a going-concern element that represents our ability to earn a higher rate ofreturn on the group of assets than would be expected on the separate assets as determined during thevaluation process. This additional investment value resulted in goodwill, which is expected to be deductiblefor income tax purposes.
The following table summarizes the consideration transferred for Coleman Cylinders and the fair valueassigned to the assets acquired and liabilities assumed at the acquisition date:
(in thousands)Inventories $ 6,456Intangible assets 4,560Property, plant and equipment 9,726
Total identifiable assets 20,742Accounts payable (3,719)Accrued liabilities (258)
Net identifiable assets 16,765Goodwill 5,888
Total consideration paid $22,653
Operating results of Coleman Cylinders have been included in our consolidated statements of earningsfrom the acquisition date, forward. Pro forma results, including the acquired business since the beginning offiscal 2013 or fiscal 2012, would not be materially different than reported results.
STAKO
On September 30, 2011, we completed the acquisition of Poland-based STAKO sp.Z o.o. (“STAKO”) forcash consideration of approximately $41,500,000. STAKO manufactures liquefied natural gas, propane andbutane fuel tanks for use in passenger cars, buses and trucks. The acquired business became part of ourPressure Cylinders operating segment upon closing.
The assets acquired and liabilities assumed were recognized at their acquisition-date fair values, withgoodwill representing the excess of the purchase price over the fair value of the net identifiable assetsacquired. In connection with the acquisition of STAKO, we identified and valued the following identifiableintangible assets:
(in thousands)Amount
Useful Life(Years)Category
Trade name $1,500 10Customer relationships 2,500 10-15Non-compete agreement 400 3
Total acquired identifiable intangible assets $4,400
101

The purchase price includes the fair values of other assets that were not identifiable, not separatelyrecognizable under accounting rules (e.g., assembled workforce) or of immaterial value. The purchase pricealso includes a going-concern element that represents our ability to earn a higher rate of return on the groupof assets than would be expected on the separate assets as determined during the valuation process. Thisadditional investment value resulted in goodwill, which is not expected to be deductible for income taxpurposes.
The following table summarizes the consideration transferred for STAKO and the fair value assigned tothe assets acquired and liabilities assumed at the acquisition date:
(in thousands)Cash and cash equivalents $ 2,715Accounts receivable 4,175Inventories 6,208Other current assets 75Intangible assets 4,400Other noncurrent assets 60Property, plant and equipment 23,770
Total identifiable assets 41,403Accounts payable (2,813)Accrued liabilities (750)Other liabilities (2,182)Deferred income taxes (2,384)
Net identifiable assets 33,274Goodwill 8,226
Total consideration paid $41,500
Operating results of STAKO have been included in our consolidated statements of earnings from theacquisition date, forward. Pro forma results, including the acquired business since the beginning of fiscal 2012or fiscal 2011, would not be materially different than reported results.
Bernz
On July 1, 2011, we purchased substantially all of the net assets of Bernz (excluding accounts receivable)from Irwin Industrial Tool Company, a subsidiary of Newell Rubbermaid, Inc., for cash consideration ofapproximately $41,000,000. Bernz is a leading manufacturer of hand held torches and accessories. Theacquired net assets became part of our Pressure Cylinders operating segment upon closing.
As more fully described in “NOTE E – Contingent Liabilities and Commitments,” in connection with thispurchase transaction, both parties agreed to settle their litigation. In accordance with the applicableaccounting guidance for the settlement of a pre-existing relationship between parties to a businesscombination, we recognized a settlement gain equal to the amount by which our previously recorded reserveexceeded the estimated fair value of the settlement. The components of the settlement gain are summarizedin the following table:
(in thousands)Reserve $ 14,402Less: Fair value of settlement (10,000)
Settlement gain $ 4,402
102
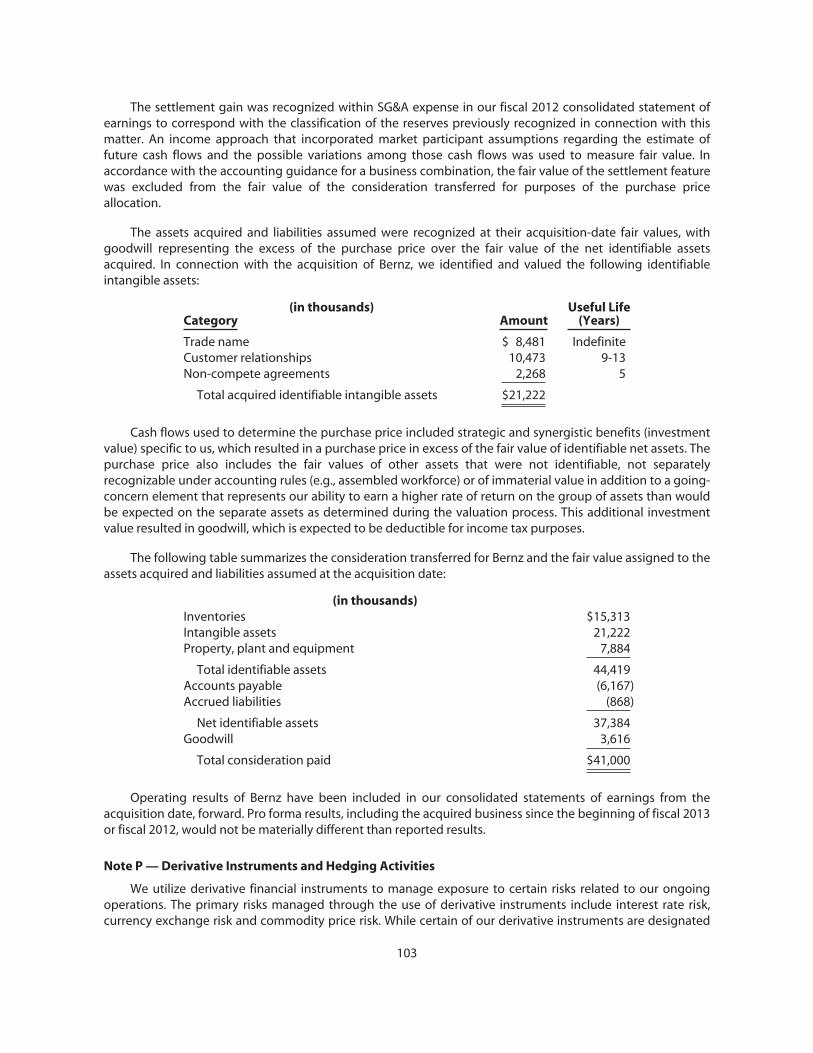
The settlement gain was recognized within SG&A expense in our fiscal 2012 consolidated statement ofearnings to correspond with the classification of the reserves previously recognized in connection with thismatter. An income approach that incorporated market participant assumptions regarding the estimate offuture cash flows and the possible variations among those cash flows was used to measure fair value. Inaccordance with the accounting guidance for a business combination, the fair value of the settlement featurewas excluded from the fair value of the consideration transferred for purposes of the purchase priceallocation.
The assets acquired and liabilities assumed were recognized at their acquisition-date fair values, withgoodwill representing the excess of the purchase price over the fair value of the net identifiable assetsacquired. In connection with the acquisition of Bernz, we identified and valued the following identifiableintangible assets:
(in thousands)Amount
Useful Life(Years)Category
Trade name $ 8,481 IndefiniteCustomer relationships 10,473 9-13Non-compete agreements 2,268 5
Total acquired identifiable intangible assets $21,222
Cash flows used to determine the purchase price included strategic and synergistic benefits (investmentvalue) specific to us, which resulted in a purchase price in excess of the fair value of identifiable net assets. Thepurchase price also includes the fair values of other assets that were not identifiable, not separatelyrecognizable under accounting rules (e.g., assembled workforce) or of immaterial value in addition to a going-concern element that represents our ability to earn a higher rate of return on the group of assets than wouldbe expected on the separate assets as determined during the valuation process. This additional investmentvalue resulted in goodwill, which is expected to be deductible for income tax purposes.
The following table summarizes the consideration transferred for Bernz and the fair value assigned to theassets acquired and liabilities assumed at the acquisition date:
(in thousands)Inventories $15,313Intangible assets 21,222Property, plant and equipment 7,884
Total identifiable assets 44,419Accounts payable (6,167)Accrued liabilities (868)
Net identifiable assets 37,384Goodwill 3,616
Total consideration paid $41,000
Operating results of Bernz have been included in our consolidated statements of earnings from theacquisition date, forward. Pro forma results, including the acquired business since the beginning of fiscal 2013or fiscal 2012, would not be materially different than reported results.
Note P — Derivative Instruments and Hedging Activities
We utilize derivative financial instruments to manage exposure to certain risks related to our ongoingoperations. The primary risks managed through the use of derivative instruments include interest rate risk,currency exchange risk and commodity price risk. While certain of our derivative instruments are designated
103
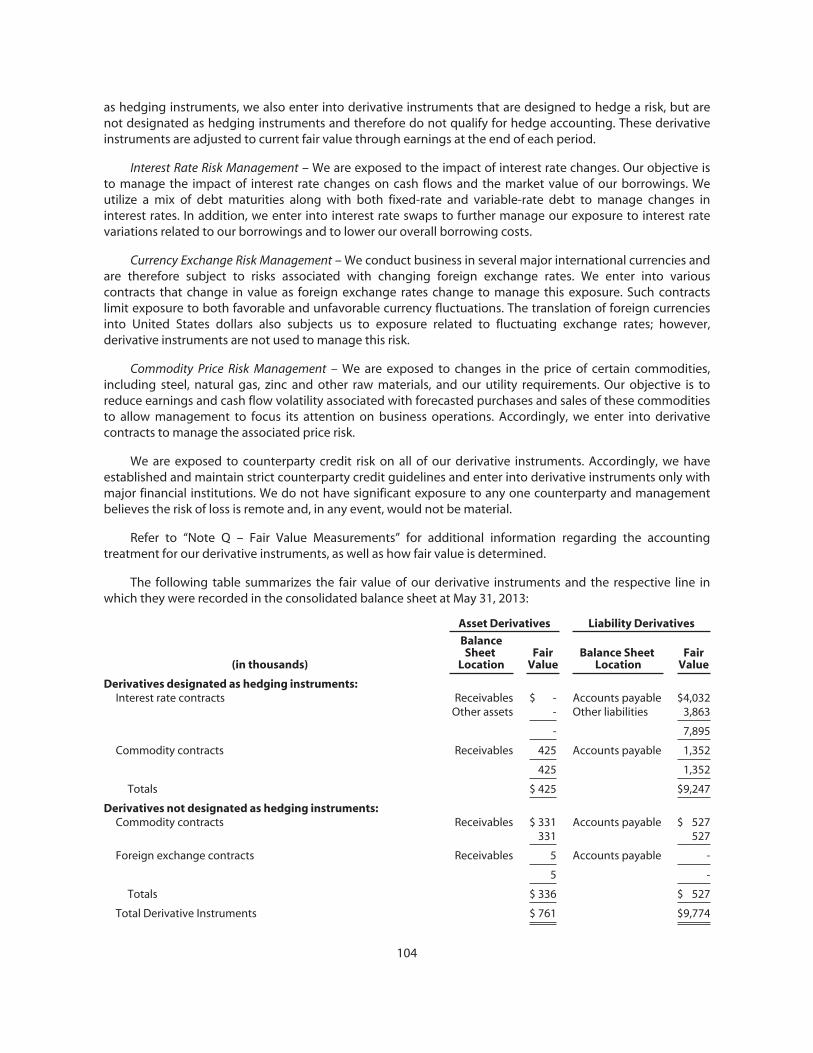
as hedging instruments, we also enter into derivative instruments that are designed to hedge a risk, but arenot designated as hedging instruments and therefore do not qualify for hedge accounting. These derivativeinstruments are adjusted to current fair value through earnings at the end of each period.
Interest Rate Risk Management – We are exposed to the impact of interest rate changes. Our objective isto manage the impact of interest rate changes on cash flows and the market value of our borrowings. Weutilize a mix of debt maturities along with both fixed-rate and variable-rate debt to manage changes ininterest rates. In addition, we enter into interest rate swaps to further manage our exposure to interest ratevariations related to our borrowings and to lower our overall borrowing costs.
Currency Exchange Risk Management – We conduct business in several major international currencies andare therefore subject to risks associated with changing foreign exchange rates. We enter into variouscontracts that change in value as foreign exchange rates change to manage this exposure. Such contractslimit exposure to both favorable and unfavorable currency fluctuations. The translation of foreign currenciesinto United States dollars also subjects us to exposure related to fluctuating exchange rates; however,derivative instruments are not used to manage this risk.
Commodity Price Risk Management – We are exposed to changes in the price of certain commodities,including steel, natural gas, zinc and other raw materials, and our utility requirements. Our objective is toreduce earnings and cash flow volatility associated with forecasted purchases and sales of these commoditiesto allow management to focus its attention on business operations. Accordingly, we enter into derivativecontracts to manage the associated price risk.
We are exposed to counterparty credit risk on all of our derivative instruments. Accordingly, we haveestablished and maintain strict counterparty credit guidelines and enter into derivative instruments only withmajor financial institutions. We do not have significant exposure to any one counterparty and managementbelieves the risk of loss is remote and, in any event, would not be material.
Refer to “Note Q – Fair Value Measurements” for additional information regarding the accountingtreatment for our derivative instruments, as well as how fair value is determined.
The following table summarizes the fair value of our derivative instruments and the respective line inwhich they were recorded in the consolidated balance sheet at May 31, 2013:
Asset Derivatives Liability Derivatives
(in thousands)
BalanceSheet
LocationFair
ValueBalance Sheet
LocationFair
Value
Derivatives designated as hedging instruments:Interest rate contracts Receivables $ - Accounts payable $4,032
Other assets - Other liabilities 3,863
- 7,895
Commodity contracts Receivables 425 Accounts payable 1,352
425 1,352
Totals $ 425 $9,247
Derivatives not designated as hedging instruments:Commodity contracts Receivables $ 331 Accounts payable $ 527
331 527
Foreign exchange contracts Receivables 5 Accounts payable -
5 -
Totals $ 336 $ 527
Total Derivative Instruments $ 761 $9,774
104
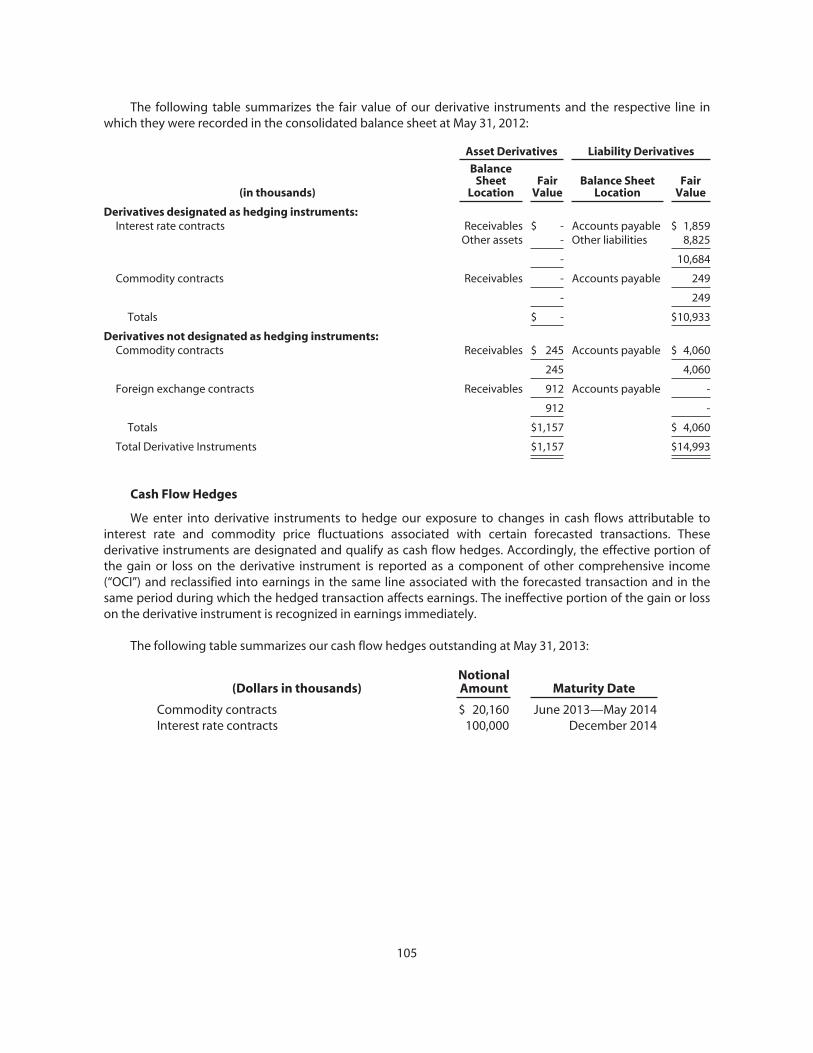
The following table summarizes the fair value of our derivative instruments and the respective line inwhich they were recorded in the consolidated balance sheet at May 31, 2012:
Asset Derivatives Liability Derivatives
(in thousands)
BalanceSheet
LocationFair
ValueBalance Sheet
LocationFair
Value
Derivatives designated as hedging instruments:Interest rate contracts Receivables $ - Accounts payable $ 1,859
Other assets - Other liabilities 8,825
- 10,684
Commodity contracts Receivables - Accounts payable 249
- 249
Totals $ - $10,933
Derivatives not designated as hedging instruments:Commodity contracts Receivables $ 245 Accounts payable $ 4,060
245 4,060
Foreign exchange contracts Receivables 912 Accounts payable -
912 -
Totals $1,157 $ 4,060
Total Derivative Instruments $1,157 $14,993
Cash Flow Hedges
We enter into derivative instruments to hedge our exposure to changes in cash flows attributable tointerest rate and commodity price fluctuations associated with certain forecasted transactions. Thesederivative instruments are designated and qualify as cash flow hedges. Accordingly, the effective portion ofthe gain or loss on the derivative instrument is reported as a component of other comprehensive income(“OCI”) and reclassified into earnings in the same line associated with the forecasted transaction and in thesame period during which the hedged transaction affects earnings. The ineffective portion of the gain or losson the derivative instrument is recognized in earnings immediately.
The following table summarizes our cash flow hedges outstanding at May 31, 2013:
(Dollars in thousands)NotionalAmount Maturity Date
Commodity contracts $ 20,160 June 2013—May 2014Interest rate contracts 100,000 December 2014
105
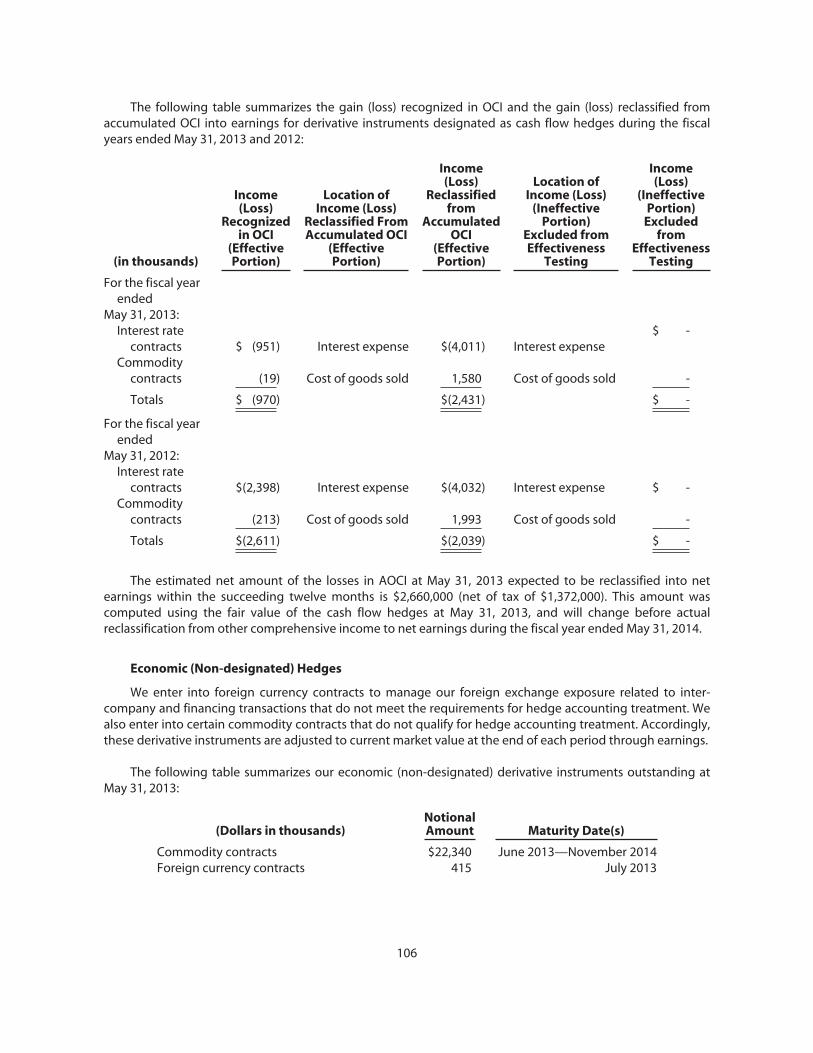
The following table summarizes the gain (loss) recognized in OCI and the gain (loss) reclassified fromaccumulated OCI into earnings for derivative instruments designated as cash flow hedges during the fiscalyears ended May 31, 2013 and 2012:
(in thousands)
Income(Loss)
Recognizedin OCI
(EffectivePortion)
Location ofIncome (Loss)
Reclassified FromAccumulated OCI
(EffectivePortion)
Income(Loss)
Reclassifiedfrom
AccumulatedOCI
(EffectivePortion)
Location ofIncome (Loss)
(IneffectivePortion)
Excluded fromEffectiveness
Testing
Income(Loss)
(IneffectivePortion)
Excludedfrom
EffectivenessTesting
For the fiscal yearended
May 31, 2013:Interest rate
contracts $ (951) Interest expense $(4,011) Interest expense$ -
Commoditycontracts (19) Cost of goods sold 1,580 Cost of goods sold -
Totals $ (970) $(2,431) $ -
For the fiscal yearended
May 31, 2012:Interest rate
contracts $(2,398) Interest expense $(4,032) Interest expense $ -Commodity
contracts (213) Cost of goods sold 1,993 Cost of goods sold -
Totals $(2,611) $(2,039) $ -
The estimated net amount of the losses in AOCI at May 31, 2013 expected to be reclassified into netearnings within the succeeding twelve months is $2,660,000 (net of tax of $1,372,000). This amount wascomputed using the fair value of the cash flow hedges at May 31, 2013, and will change before actualreclassification from other comprehensive income to net earnings during the fiscal year ended May 31, 2014.
Economic (Non-designated) Hedges
We enter into foreign currency contracts to manage our foreign exchange exposure related to inter-company and financing transactions that do not meet the requirements for hedge accounting treatment. Wealso enter into certain commodity contracts that do not qualify for hedge accounting treatment. Accordingly,these derivative instruments are adjusted to current market value at the end of each period through earnings.
The following table summarizes our economic (non-designated) derivative instruments outstanding atMay 31, 2013:
(Dollars in thousands)NotionalAmount Maturity Date(s)
Commodity contracts $22,340 June 2013—November 2014Foreign currency contracts 415 July 2013
106
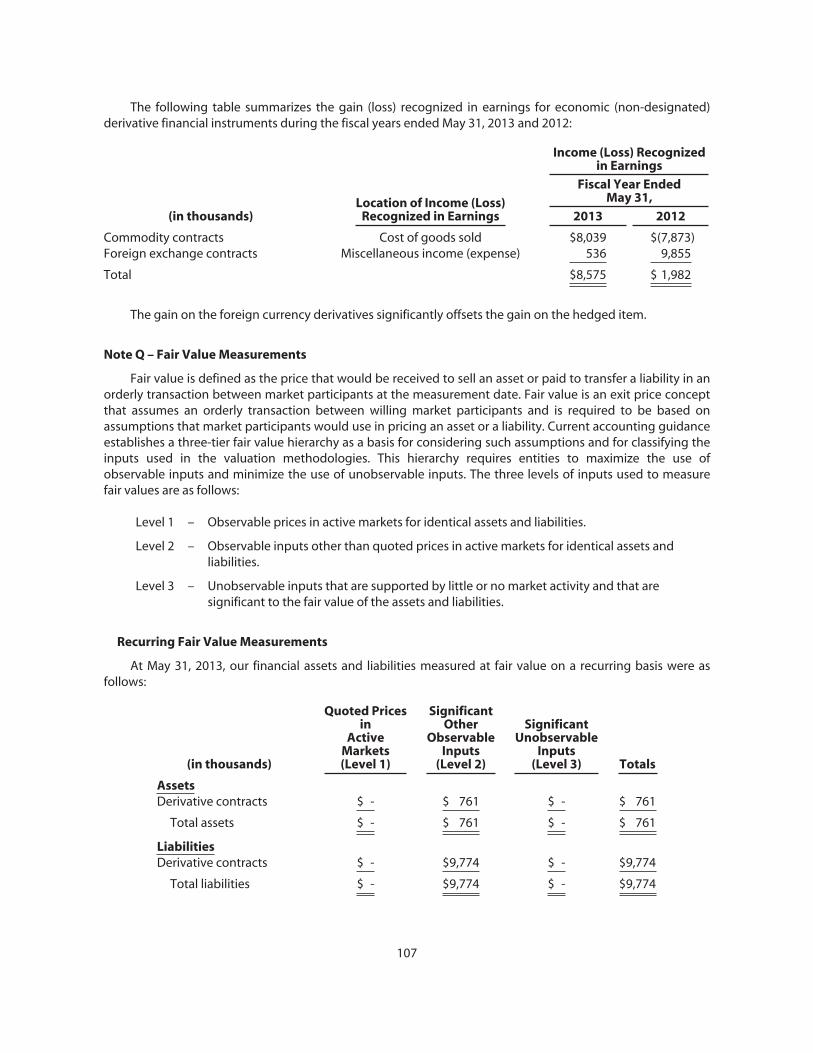
The following table summarizes the gain (loss) recognized in earnings for economic (non-designated)derivative financial instruments during the fiscal years ended May 31, 2013 and 2012:
Income (Loss) Recognizedin Earnings
Location of Income (Loss)Recognized in Earnings
Fiscal Year EndedMay 31,
(in thousands) 2013 2012
Commodity contracts Cost of goods sold $8,039 $(7,873)Foreign exchange contracts Miscellaneous income (expense) 536 9,855
Total $8,575 $ 1,982
The gain on the foreign currency derivatives significantly offsets the gain on the hedged item.
Note Q – Fair Value Measurements
Fair value is defined as the price that would be received to sell an asset or paid to transfer a liability in anorderly transaction between market participants at the measurement date. Fair value is an exit price conceptthat assumes an orderly transaction between willing market participants and is required to be based onassumptions that market participants would use in pricing an asset or a liability. Current accounting guidanceestablishes a three-tier fair value hierarchy as a basis for considering such assumptions and for classifying theinputs used in the valuation methodologies. This hierarchy requires entities to maximize the use ofobservable inputs and minimize the use of unobservable inputs. The three levels of inputs used to measurefair values are as follows:
Level 1 – Observable prices in active markets for identical assets and liabilities.
Level 2 – Observable inputs other than quoted prices in active markets for identical assets andliabilities.
Level 3 – Unobservable inputs that are supported by little or no market activity and that aresignificant to the fair value of the assets and liabilities.
Recurring Fair Value Measurements
At May 31, 2013, our financial assets and liabilities measured at fair value on a recurring basis were asfollows:
(in thousands)
Quoted Pricesin
ActiveMarkets(Level 1)
SignificantOther
ObservableInputs
(Level 2)
SignificantUnobservable
Inputs(Level 3) Totals
AssetsDerivative contracts $ - $ 761 $ - $ 761
Total assets $ - $ 761 $ - $ 761
LiabilitiesDerivative contracts $ - $9,774 $ - $9,774
Total liabilities $ - $9,774 $ - $9,774
107

At May 31, 2012, our financial assets and liabilities measured at fair value on a recurring basis were asfollows:
(in thousands)
Quoted Pricesin
ActiveMarkets(Level 1)
SignificantOther
ObservableInputs
(Level 2)
SignificantUnobservable
Inputs(Level 3) Totals
AssetsDerivative contracts $- $ 1,157 $- $ 1,157
Total assets $- $ 1,157 $- $ 1,157
LiabilitiesDerivative contracts $- $14,993 $- $14,993
Total liabilities $- $14,993 $- $14,993
The fair value of our derivative contracts is based on the present value of the expected future cash flowsconsidering the risks involved, including non-performance risk, using discount rates appropriate for therespective maturities. Market observable, Level 2 inputs are used to determine the present value of theexpected future cash flows. Refer to “Note P – Derivative Instruments and Hedging Activities” for additionalinformation regarding our use of derivative instruments.
Non-Recurring Fair Value Measurements
At May 31, 2013, our assets measured at fair value on a non-recurring basis were categorized as follows:
(in thousands)
Quoted Pricesin ActiveMarkets(Level 1)
SignificantOther
ObservableInputs
(Level 2)
SignificantUnobservable
Inputs(Level 3) Totals
AssetsLong-lived assets held and used (1) $- $6,856 $- $6,856
Total assets $- $6,856 $- $6,856
(1) During the fourth quarter of fiscal 2013, the long-lived assets of our 60%-owned consolidated jointventure in India, WNCL, were written down to their fair value of $6,856,000, resulting in an impairmentcharge of $4,968,000. This impairment loss was recorded within impairment of long-lived assets in ourconsolidated statement of earnings. The portion of this impairment loss attributable to thenoncontrolling interest, or $1,987,000, is recorded within net earnings attributable to noncontrollinginterest in our consolidated statement of earnings. Fair value was determined based on market prices forsimilar assets.
108
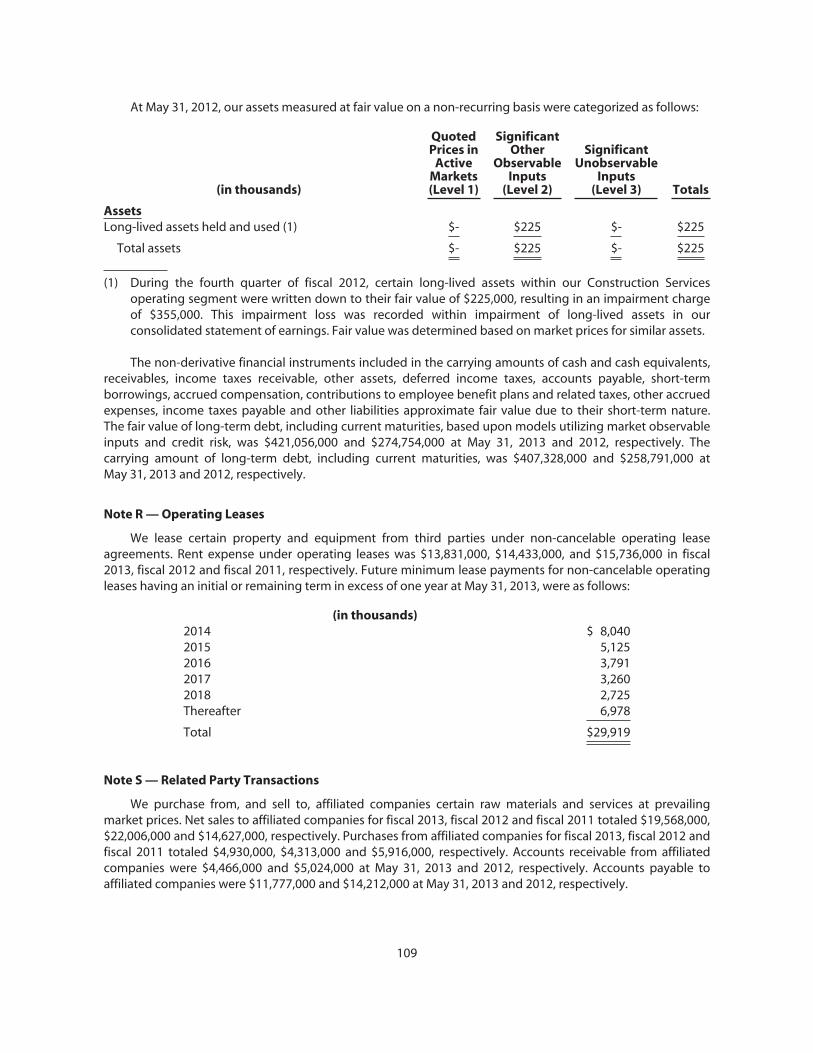
At May 31, 2012, our assets measured at fair value on a non-recurring basis were categorized as follows:
(in thousands)
QuotedPrices in
ActiveMarkets(Level 1)
SignificantOther
ObservableInputs
(Level 2)
SignificantUnobservable
Inputs(Level 3) Totals
AssetsLong-lived assets held and used (1) $- $225 $- $225
Total assets $- $225 $- $225
(1) During the fourth quarter of fiscal 2012, certain long-lived assets within our Construction Servicesoperating segment were written down to their fair value of $225,000, resulting in an impairment chargeof $355,000. This impairment loss was recorded within impairment of long-lived assets in ourconsolidated statement of earnings. Fair value was determined based on market prices for similar assets.
The non-derivative financial instruments included in the carrying amounts of cash and cash equivalents,receivables, income taxes receivable, other assets, deferred income taxes, accounts payable, short-termborrowings, accrued compensation, contributions to employee benefit plans and related taxes, other accruedexpenses, income taxes payable and other liabilities approximate fair value due to their short-term nature.The fair value of long-term debt, including current maturities, based upon models utilizing market observableinputs and credit risk, was $421,056,000 and $274,754,000 at May 31, 2013 and 2012, respectively. Thecarrying amount of long-term debt, including current maturities, was $407,328,000 and $258,791,000 atMay 31, 2013 and 2012, respectively.
Note R — Operating Leases
We lease certain property and equipment from third parties under non-cancelable operating leaseagreements. Rent expense under operating leases was $13,831,000, $14,433,000, and $15,736,000 in fiscal2013, fiscal 2012 and fiscal 2011, respectively. Future minimum lease payments for non-cancelable operatingleases having an initial or remaining term in excess of one year at May 31, 2013, were as follows:
(in thousands)2014 $ 8,0402015 5,1252016 3,7912017 3,2602018 2,725Thereafter 6,978
Total $29,919
Note S — Related Party Transactions
We purchase from, and sell to, affiliated companies certain raw materials and services at prevailingmarket prices. Net sales to affiliated companies for fiscal 2013, fiscal 2012 and fiscal 2011 totaled $19,568,000,$22,006,000 and $14,627,000, respectively. Purchases from affiliated companies for fiscal 2013, fiscal 2012 andfiscal 2011 totaled $4,930,000, $4,313,000 and $5,916,000, respectively. Accounts receivable from affiliatedcompanies were $4,466,000 and $5,024,000 at May 31, 2013 and 2012, respectively. Accounts payable toaffiliated companies were $11,777,000 and $14,212,000 at May 31, 2013 and 2012, respectively.
109
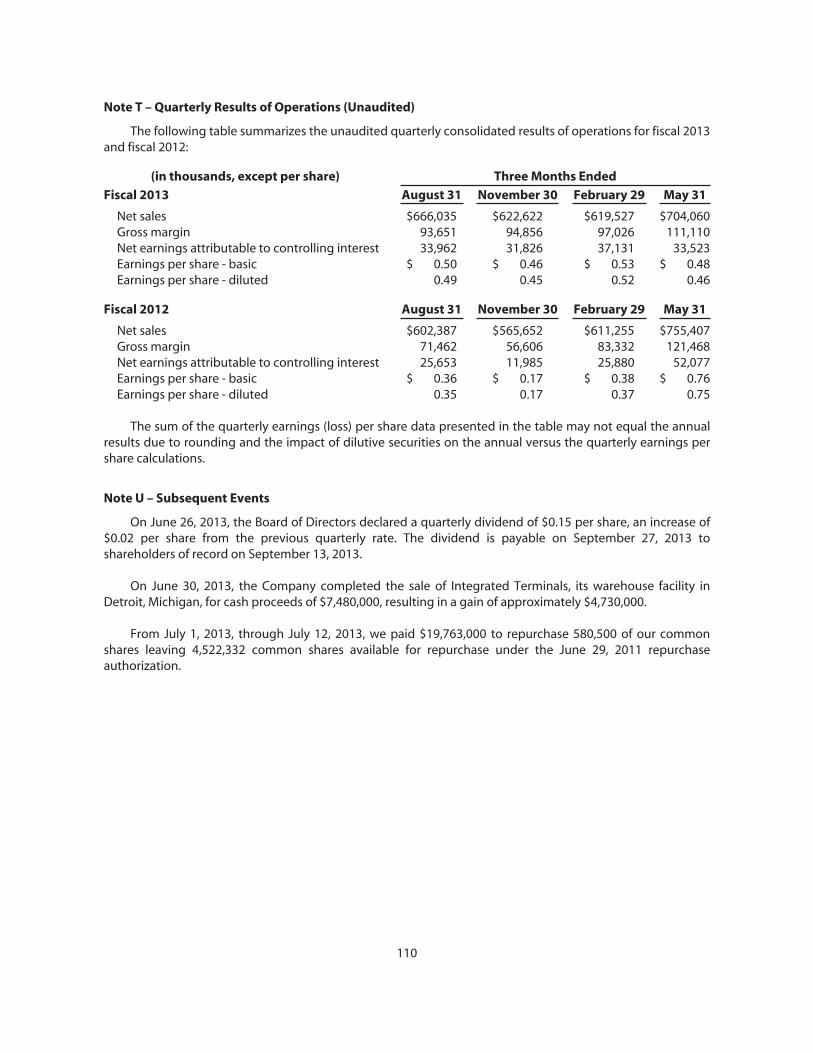
Note T – Quarterly Results of Operations (Unaudited)
The following table summarizes the unaudited quarterly consolidated results of operations for fiscal 2013and fiscal 2012:
(in thousands, except per share) Three Months Ended
Fiscal 2013 August 31 November 30 February 29 May 31
Net sales $666,035 $622,622 $619,527 $704,060Gross margin 93,651 94,856 97,026 111,110Net earnings attributable to controlling interest 33,962 31,826 37,131 33,523Earnings per share - basic $ 0.50 $ 0.46 $ 0.53 $ 0.48Earnings per share - diluted 0.49 0.45 0.52 0.46
Fiscal 2012 August 31 November 30 February 29 May 31
Net sales $602,387 $565,652 $611,255 $755,407Gross margin 71,462 56,606 83,332 121,468Net earnings attributable to controlling interest 25,653 11,985 25,880 52,077Earnings per share - basic $ 0.36 $ 0.17 $ 0.38 $ 0.76Earnings per share - diluted 0.35 0.17 0.37 0.75
The sum of the quarterly earnings (loss) per share data presented in the table may not equal the annualresults due to rounding and the impact of dilutive securities on the annual versus the quarterly earnings pershare calculations.
Note U – Subsequent Events
On June 26, 2013, the Board of Directors declared a quarterly dividend of $0.15 per share, an increase of$0.02 per share from the previous quarterly rate. The dividend is payable on September 27, 2013 toshareholders of record on September 13, 2013.
On June 30, 2013, the Company completed the sale of Integrated Terminals, its warehouse facility inDetroit, Michigan, for cash proceeds of $7,480,000, resulting in a gain of approximately $4,730,000.
From July 1, 2013, through July 12, 2013, we paid $19,763,000 to repurchase 580,500 of our commonshares leaving 4,522,332 common shares available for repurchase under the June 29, 2011 repurchaseauthorization.
110
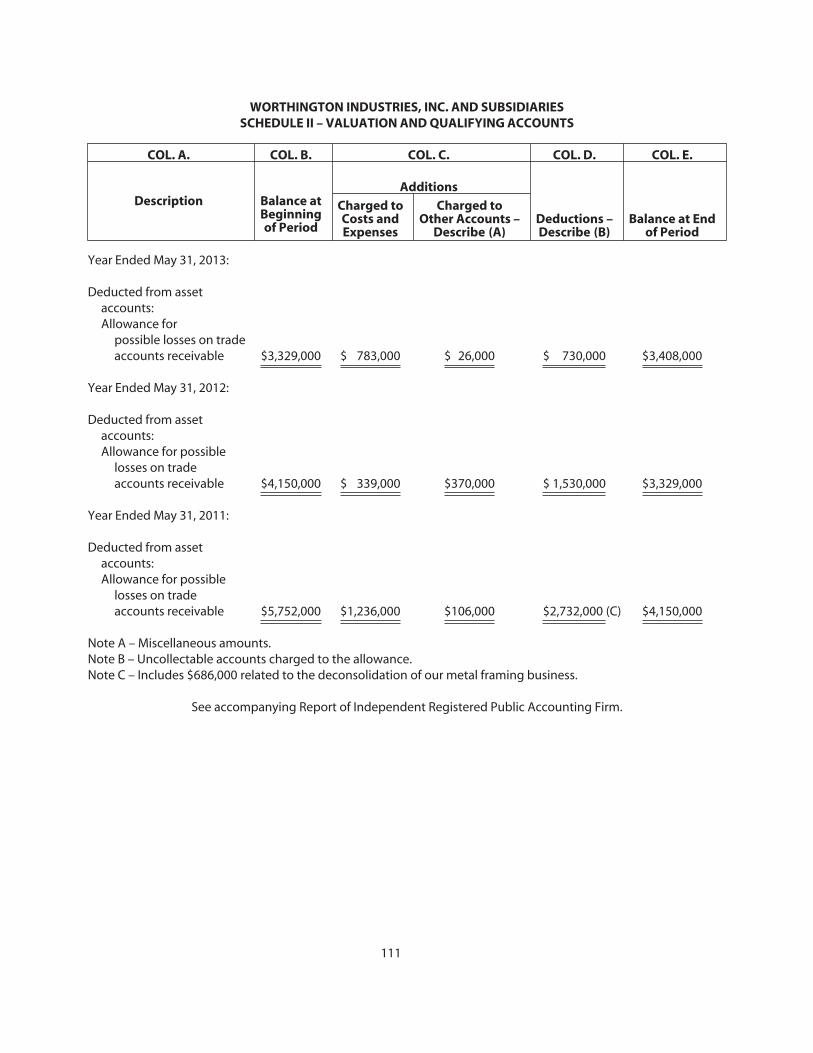
WORTHINGTON INDUSTRIES, INC. AND SUBSIDIARIESSCHEDULE II – VALUATION AND QUALIFYING ACCOUNTS
COL. A. COL. B. COL. C. COL. D. COL. E.
DescriptionAdditions
Balance atBeginningof Period
Charged toCosts andExpenses
Charged toOther Accounts –
Describe (A)Deductions –Describe (B)
Balance at Endof Period
Year Ended May 31, 2013:
Deducted from assetaccounts:Allowance for
possible losses on tradeaccounts receivable $3,329,000 $ 783,000 $ 26,000 $ 730,000 $3,408,000
Year Ended May 31, 2012:
Deducted from assetaccounts:Allowance for possible
losses on tradeaccounts receivable $4,150,000 $ 339,000 $370,000 $ 1,530,000 $3,329,000
Year Ended May 31, 2011:
Deducted from assetaccounts:Allowance for possible
losses on tradeaccounts receivable $5,752,000 $1,236,000 $106,000 $2,732,000 (C) $4,150,000
Note A – Miscellaneous amounts.Note B – Uncollectable accounts charged to the allowance.Note C – Includes $686,000 related to the deconsolidation of our metal framing business.
See accompanying Report of Independent Registered Public Accounting Firm.
111
Item 9. – Changes in and Disagreements With Accountants on Accounting and Financial Disclosure
Not applicable.
Item 9A.—Controls and Procedures
Evaluation of Disclosure Controls and Procedures
We maintain disclosure controls and procedures [as defined in Rules 13a-15(e) and 15d-15(e) under theSecurities Exchange Act of 1934, as amended (the “Exchange Act”)] that are designed to provide reasonableassurance that information required to be disclosed in the reports that we file or submit under the ExchangeAct is recorded, processed, summarized and reported within the time periods specified in the Securities andExchange Commission’s rules and forms, and that such information is accumulated and communicated to ourmanagement, including our principal executive officer and our principal financial officer, as appropriate toallow timely decisions regarding required disclosure.
Management, with the participation of our principal executive officer and our principal financial officer,performed an evaluation of the effectiveness of our disclosure controls and procedures as of the end of thefiscal year covered by this Annual Report on Form 10-K (the fiscal year ended May 31, 2013). Based on thatevaluation, our principal executive officer and our principal financial officer have concluded that suchdisclosure controls and procedures were effective at a reasonable assurance level as of the end of the fiscalyear covered by this Annual Report on Form 10-K.
Changes in Internal Control Over Financial Reporting
There were no changes in our internal control over financial reporting that occurred in the last fiscalquarter (the fiscal quarter ended May 31, 2013) that have materially affected, or are reasonably likely tomaterially affect, our internal control over financial reporting.
Annual Report of Management on Internal Control Over Financial Reporting
Management is responsible for establishing and maintaining adequate internal control over financialreporting to provide reasonable assurance regarding the reliability of our financial reporting and thepreparation of financial statements for external purposes in accordance with accounting principles generallyaccepted in the United States. Internal control over financial reporting includes those policies and proceduresthat (i) pertain to the maintenance of records that, in reasonable detail, accurately and fairly reflect thetransactions and dispositions of the assets of Worthington Industries, Inc. and our consolidated subsidiaries;(ii) provide reasonable assurance that transactions are recorded as necessary to permit preparation offinancial statements in accordance with accounting principles generally accepted in the United States, andthat receipts and expenditures of Worthington Industries, Inc. and our consolidated subsidiaries are beingmade only in accordance with authorizations of management and directors of Worthington Industries, Inc.and our consolidated subsidiaries, as appropriate; and (iii) provide reasonable assurance regarding preventionor timely detection of unauthorized acquisition, use or disposition of the assets of Worthington Industries, Inc.and our consolidated subsidiaries that could have a material effect on the financial statements.
Management, with the participation of our principal executive officer and our principal financial officer,evaluated the effectiveness of our internal control over financial reporting as of May 31, 2013, the end of ourfiscal year. Management based its assessment on criteria established in Internal Control—IntegratedFramework issued by the Committee of Sponsoring Organizations of the Treadway Commission.Management’s assessment included evaluation of such elements as the design and operating effectiveness ofkey financial reporting controls, process documentation, accounting policies and our overall controlenvironment. This assessment is supported by testing and monitoring performed under the direction ofmanagement.
112
Because of its inherent limitations, internal control over financial reporting may not prevent or detectmisstatements. Also, projections of any evaluation of effectiveness to future periods are subject to the riskthat controls may become inadequate because of changes in conditions, or that the degree of compliancewith the policies or procedures may deteriorate. Accordingly, even an effective system of internal control overfinancial reporting will provide only reasonable assurance with respect to financial statement preparation.
Based on the assessment of our internal control over financial reporting, management has concludedthat our internal control over financial reporting was effective at a reasonable assurance level as of May 31,2013. The results of management’s assessment were reviewed with the Audit Committee of the Board ofDirectors of Worthington Industries, Inc.
Additionally, our independent registered public accounting firm, KPMG LLP, independently assessed theeffectiveness of our internal control over financial reporting and issued the accompanying Report ofIndependent Registered Public Accounting Firm.
113
Report of Independent Registered Public Accounting Firm
The Board of Directors and ShareholdersWorthington Industries, Inc.:
We have audited Worthington Industries, Inc.’s internal control over financial reporting as of May 31,2013, based on criteria established in Internal Control – Integrated Framework issued by the Committee ofSponsoring Organizations of the Treadway Commission (COSO). Worthington Industries, Inc.’s management isresponsible for maintaining effective internal control over financial reporting and for its assessment of theeffectiveness of internal control over financial reporting, included in the accompanying Annual Report ofManagement on Internal Control Over Financial Reporting. Our responsibility is to express an opinion on theCompany’s internal control over financial reporting based on our audit.
We conducted our audit in accordance with the standards of the Public Company Accounting OversightBoard (United States). Those standards require that we plan and perform the audit to obtain reasonable assuranceabout whether effective internal control over financial reporting was maintained in all material respects. Our auditincluded obtaining an understanding of internal control over financial reporting, assessing the risk that a materialweakness exists, and testing and evaluating the design and operating effectiveness of internal control based on theassessed risk. Our audit also included performing such other procedures as we considered necessary in thecircumstances. We believe that our audit provides a reasonable basis for our opinion.
A company’s internal control over financial reporting is a process designed to provide reasonable assuranceregarding the reliability of financial reporting and the preparation of financial statements for external purposes inaccordance with generally accepted accounting principles. A company’s internal control over financial reportingincludes those policies and procedures that (1) pertain to the maintenance of records that, in reasonable detail,accurately and fairly reflect the transactions and dispositions of the assets of the company; (2) provide reasonableassurance that transactions are recorded as necessary to permit preparation of financial statements in accordancewith generally accepted accounting principles, and that receipts and expenditures of the company are beingmade only in accordance with authorizations of management and directors of the company; and (3) providereasonable assurance regarding prevention or timely detection of unauthorized acquisition, use, or disposition ofthe company’s assets that could have a material effect on the financial statements.
Because of its inherent limitations, internal control over financial reporting may not prevent or detectmisstatements. Also, projections of any evaluation of effectiveness to future periods are subject to the riskthat controls may become inadequate because of changes in conditions, or that the degree of compliancewith the policies or procedures may deteriorate.
In our opinion, Worthington Industries, Inc. maintained, in all material respects, effective internal controlover financial reporting as of May 31, 2013, based on criteria established in Internal Control – IntegratedFramework issued by the Committee of Sponsoring Organizations of the Treadway Commission.
We also have audited, in accordance with the standards of the Public Company Accounting OversightBoard (United States), the consolidated balance sheets of Worthington Industries, Inc. and subsidiaries as ofMay 31, 2013 and 2012, and the related consolidated statements of earnings, comprehensive income, equity,and cash flows for each of the years in the three-year period ended May 31, 2013, and our report datedJuly 30, 2013, expressed an unqualified opinion on those consolidated financial statements.
/S/ KPMG LLP
Columbus, OhioJuly 30, 2013
Item 9B. – Other Information
There is nothing to be reported under this Item 9B.
114
PART III
Item 10. — Directors, Executive Officers and Corporate Governance
Directors, Executive Officers and Persons Nominated or Chosen to Become Directors or ExecutiveOfficers
The information required by Item 401 of SEC Regulation S-K concerning the directors of WorthingtonIndustries, Inc. (“Worthington Industries” or the “Registrant”) and the nominees for re-election as directors ofWorthington Industries at the Annual Meeting of Shareholders to be held on September 26, 2013 (the “2013Annual Meeting”) is incorporated herein by reference from the disclosure to be included under the caption“PROPOSAL 1: ELECTION OF DIRECTORS” in Worthington Industries’ definitive Proxy Statement relating to the2013 Annual Meeting (“Worthington Industries’ Definitive 2013 Proxy Statement”), which will be filedpursuant to SEC Regulation 14A not later than 120 days after the end of Worthington Industries’ fiscal 2013(the fiscal year ended May 31, 2013).
The information required by Item 401 of SEC Regulation S-K concerning the executive officers ofWorthington Industries is incorporated herein by reference from the disclosure included under the caption“Supplemental Item – Executive Officers of the Registrant” in Part I of this Annual Report on Form 10-K.
Compliance with Section 16(a) of the Exchange Act
The information required by Item 405 of SEC Regulation S-K is incorporated herein by reference from thedisclosure to be included under the caption “SECURITY OWNERSHIP OF CERTAIN BENEFICIAL OWNERS ANDMANAGEMENT – Section 16(a) Beneficial Ownership Reporting Compliance” in Worthington Industries’Definitive 2013 Proxy Statement.
Procedures by which Shareholders may Recommend Nominees to Worthington Industries’ Board ofDirectors
Information concerning the procedures by which shareholders of Worthington Industries mayrecommend nominees to Worthington Industries’ Board of Directors is incorporated herein by reference fromthe disclosure to be included under the captions “PROPOSAL 1: ELECTION OF DIRECTORS – Committees of theBoard – Nominating and Governance Committee” and “CORPORATE GOVERNANCE – Nominating Procedures”in Worthington Industries’ Definitive 2013 Proxy Statement. These procedures have not materially changedfrom those described in Worthington Industries’ definitive Proxy Statement for the 2012 Annual Meeting ofShareholders held on September 27, 2012.
Audit Committee Matters
The information required by Items 407(d)(4) and 407(d)(5) of SEC Regulation S-K is incorporated hereinby reference from the disclosure to be included under the caption “PROPOSAL 1: ELECTION OF DIRECTORS –Committees of the Board – Audit Committee” in Worthington Industries’ Definitive 2013 Proxy Statement.
Code of Conduct; Committee Charters; Corporate Governance Guidelines; Charter of Lead IndependentDirector
Worthington Industries’ Board of Directors has adopted Charters for each of the Audit Committee, theCompensation and Stock Option Committee, the Executive Committee and the Nominating and GovernanceCommittee as well as Corporate Governance Guidelines as contemplated by the applicable sections of theNew York Stock Exchange Listed Company Manual. Worthington Industries’ Board of Directors has alsoadopted a Charter of the Lead Independent Director of Worthington Industries’ Board of Directors.
115
In accordance with the requirements of Section 303A.10 of the New York Stock Exchange ListedCompany Manual, the Board of Directors of Worthington Industries has adopted a Code of Conduct coveringthe directors, officers and employees of Worthington Industries and its subsidiaries, including WorthingtonIndustries’ Chairman of the Board and Chief Executive Officer (the principal executive officer), WorthingtonIndustries’ Vice President and Chief Financial Officer (the principal financial officer) and WorthingtonIndustries’ Controller (the principal accounting officer). The Registrant will disclose the following events, ifthey occur, in a current report on Form 8-K to be filed with the SEC within the required four business daysfollowing their occurrence: (A) the date and nature of any amendment to a provision of WorthingtonIndustries’ Code of Conduct that (i) applies to Worthington Industries’ principal executive officer, principalfinancial officer, principal accounting officer or controller, or persons performing similar functions, (ii) relatesto any element of the “code of ethics” definition enumerated in Item 406(b) of SEC Regulation S-K, and (iii) isnot a technical, administrative or other non-substantive amendment; and (B) a description of any waiver(including the nature of the waiver, the name of the person to whom the waiver was granted and the date ofthe waiver), including an implicit waiver, from a provision of the Code of Conduct granted to WorthingtonIndustries’ principal executive officer, principal financial officer, principal accounting officer or controller, orpersons performing similar functions, that relates to one or more of the elements of the “code of ethics”definition set forth in Item 406(b) of SEC Regulation S-K. In addition, Worthington Industries will disclose anywaivers from the provisions of the Code of Conduct granted to a director or executive officer of WorthingtonIndustries in a current report on Form 8-K to be filed with the SEC within the required four business daysfollowing their occurrence.
The text of each of the Charter of the Audit Committee, the Charter of the Compensation and StockOption Committee, the Charter of the Executive Committee, the Charter of the Nominating and GovernanceCommittee, the Charter of the Lead Independent Director, the Corporate Governance Guidelines and theCode of Conduct is posted on the “Corporate Governance” page of the “Investor Relations” section ofWorthington Industries’ web site located at www.worthingtonindustries.com. In addition, a copy of the Codeof Conduct was filed as Exhibit 14 to the 2012 Annual Report on Form 10-K.
Item 11. — Executive Compensation
The information required by Item 402 of SEC Regulation S-K is incorporated herein by reference from thedisclosure to be included under the captions “EXECUTIVE COMPENSATION” and “COMPENSATION OFDIRECTORS” in Worthington Industries’ Definitive 2013 Proxy Statement.
The information required by Item 407(e)(4) of SEC Regulation S-K is incorporated herein by referencefrom the disclosure to be included under the caption “CORPORATE GOVERNANCE — CompensationCommittee Interlocks and Insider Participation” in Worthington Industries’ Definitive 2013 Proxy Statement.
The information required by Item 407(e)(5) of SEC Regulation S-K is incorporated herein by referencefrom the disclosure to be included under the caption “EXECUTIVE COMPENSATION — CompensationCommittee Report” in Worthington Industries’ Definitive 2013 Proxy Statement.
Item 12. — Security Ownership of Certain Beneficial Owners and Management and RelatedStockholder Matters
Ownership of Common Shares of Worthington Industries
The information required by Item 403 of SEC Regulation S-K is incorporated herein by reference from thedisclosure to be included under the caption “SECURITY OWNERSHIP OF CERTAIN BENEFICIAL OWNERS ANDMANAGEMENT” in Worthington Industries’ Definitive 2013 Proxy Statement.
116
Equity Compensation Plan Information
The information required by Item 201(d) of SEC Regulation S-K is incorporated herein by reference fromthe disclosure to be included under the caption “EQUITY COMPENSATION PLAN INFORMATION” inWorthington Industries’ Definitive 2013 Proxy Statement.
Item 13. — Certain Relationships and Related Transactions, and Director Independence
Certain Relationships and Related Person Transactions
The information required by Item 404 of SEC Regulation S-K is incorporated herein by reference from thedisclosure in respect of John P. McConnell to be included under the caption “SECURITY OWNERSHIP OFCERTAIN BENEFICIAL OWNERS AND MANAGEMENT” and from the disclosure to be included under the caption“TRANSACTIONS WITH CERTAIN RELATED PERSONS” in Worthington Industries’ Definitive 2013 ProxyStatement.
Director Independence
The information required by Item 407(a) of SEC Regulation S-K is incorporated herein by reference fromthe disclosure to be included under the caption “CORPORATE GOVERNANCE – Director Independence” inWorthington Industries’ Definitive 2013 Proxy Statement.
Item 14. — Principal Accountant Fees and Services
The information required by this Item 14 is incorporated herein by reference from the disclosure to beincluded under the captions “AUDIT COMMITTEE MATTERS – Independent Registered Public Accounting FirmFees” and “AUDIT COMMITTEE MATTERS – Pre-Approval of Services Performed by the Independent RegisteredPublic Accounting Firm.”
117
PART IV
Item 15. — Exhibits, Financial Statement Schedules
(a) The following documents are filed as a part of this Annual Report on Form 10-K:
(1) Consolidated Financial Statements:
The consolidated financial statements (and report thereon) listed below are filed as a part of thisAnnual Report on Form 10-K:
Report of Independent Registered Public Accounting Firm (KPMG LLP)Consolidated Balance Sheets as of May 31, 2013 and 2012Consolidated Statements of Earnings for the fiscal years ended May 31, 2013, 2012 and 2011Consolidated Statements of Comprehensive Income for the fiscal years ended May 31, 2013, 2012and 2011Consolidated Statements of Equity for the fiscal years ended May 31, 2013, 2012 and 2011Consolidated Statements of Cash Flows for the fiscal years ended May 31, 2013, 2012 and 2011Notes to Consolidated Financial Statements – fiscal years ended May 31, 2013, 2012 and 2011
(2) Financial Statement Schedule:
Schedule II – Valuation and Qualifying Accounts
All other financial statement schedules for which provision is made in the applicable accountingregulations of the SEC are omitted because they are not required or the required information hasbeen presented in the aforementioned consolidated financial statements or notes thereto.
(3) Listing of Exhibits:
The exhibits listed on the “Index to Exhibits” beginning on page E-1 of this Annual Report on Form10-K are included with this Annual Report on Form 10-K or incorporated in this Annual Report onForm 10-K by reference as noted in the “Index to Exhibits.” The “Index to Exhibits” specificallyidentifies each management contract or compensatory plan or arrangement required to beincluded as an exhibit to this Annual Report on Form 10-K or incorporated in this Annual Report onForm 10-K by reference.
(b) Exhibits: The exhibits listed on the “Index to Exhibits” beginning on page E-1 of this Annual Report onForm 10-K are included with this Annual Report on Form 10-K or incorporated in this Annual Report onForm 10-K by reference as noted in the “Index to Exhibits.”
(c) Financial Statement Schedule: The financial statement schedule listed in Item 15(a)(2) above is filed withthis Annual Report on Form 10-K.
118
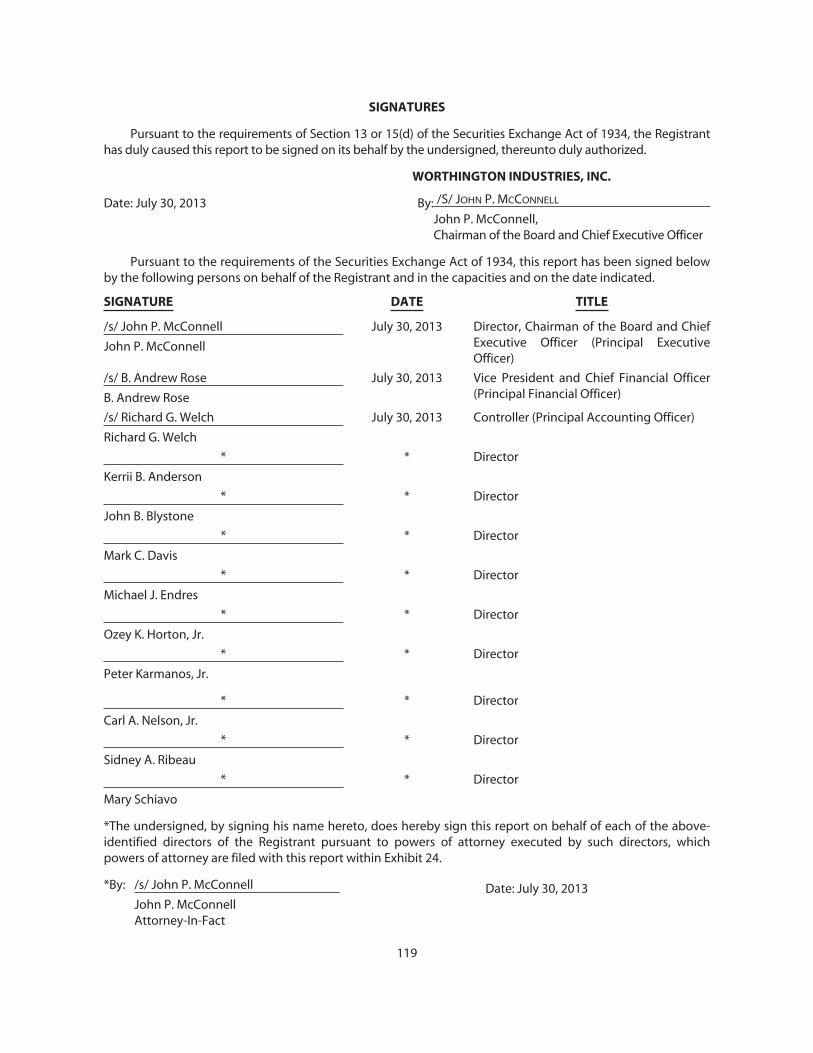
SIGNATURES
Pursuant to the requirements of Section 13 or 15(d) of the Securities Exchange Act of 1934, the Registranthas duly caused this report to be signed on its behalf by the undersigned, thereunto duly authorized.
WORTHINGTON INDUSTRIES, INC.
Date: July 30, 2013 By: /S/ JOHN P. MCCONNELL
John P. McConnell,Chairman of the Board and Chief Executive Officer
Pursuant to the requirements of the Securities Exchange Act of 1934, this report has been signed belowby the following persons on behalf of the Registrant and in the capacities and on the date indicated.
SIGNATURE DATE TITLE
/s/ John P. McConnell
John P. McConnell
July 30, 2013 Director, Chairman of the Board and ChiefExecutive Officer (Principal ExecutiveOfficer)
/s/ B. Andrew Rose
B. Andrew Rose
July 30, 2013 Vice President and Chief Financial Officer(Principal Financial Officer)
/s/ Richard G. Welch
Richard G. Welch
July 30, 2013 Controller (Principal Accounting Officer)
*
Kerrii B. Anderson
* Director
*
John B. Blystone
* Director
*
Mark C. Davis
* Director
*
Michael J. Endres
* Director
*
Ozey K. Horton, Jr.
* Director
*
Peter Karmanos, Jr.
* Director
*
Carl A. Nelson, Jr.
* Director
*
Sidney A. Ribeau
* Director
*
Mary Schiavo
* Director
*The undersigned, by signing his name hereto, does hereby sign this report on behalf of each of the above-identified directors of the Registrant pursuant to powers of attorney executed by such directors, whichpowers of attorney are filed with this report within Exhibit 24.
*By: /s/ John P. McConnell Date: July 30, 2013John P. McConnellAttorney-In-Fact
119

INDEX TO EXHIBITS
Exhibit Description Location
2.1 Stock Purchase Agreement, dated as ofDecember 29, 2011, by and betweenWorthington Steel of Michigan, Inc. and each of(i) Angus Industries, Inc., (ii) Angus Industries,Inc. Employee Stock Ownership Trust, (iii)William Blair Mezzanine Capital Fund III, L.P. and(iv) Robert A. Kluver, not in his individualcapacity but solely in his capacity as PhantomUnit Holder Representative?
Incorporated herein by reference to Exhibit 2.1 tothe Current Report on Form 8-K of WorthingtonIndustries, Inc., an Ohio corporation (the“Registrant”), dated January 4, 2012 and filed withthe SEC on the same date (SEC File No. 1-8399)
3.1 Amended Articles of Incorporation ofWorthington Industries, Inc., as filed with theOhio Secretary of State on October 13, 1998
Incorporated herein by reference to Exhibit 3(a)to the Registrant’s Quarterly Report onForm 10-Q for the quarterly period endedAugust 31, 1998 (SEC File No. 0-4016)
3.2 Code of Regulations of Worthington Industries,Inc., as amended [for SEC reporting compliancepurposes only]
Incorporated herein by reference to Exhibit 3(b)to the Registrant’s Quarterly Report onForm 10-Q for the quarterly period endedAugust 31, 2000 (SEC File No. 1-8399)
4.1 Credit Agreement, dated as of May 4, 2012,among Worthington Industries, Inc., asBorrower; the Foreign Subsidiary Borrowersfrom time to time party thereto; the Lendersfrom time to time party thereto; PNC Bank,National Association, as Administrative Agent;JPMorgan Chase Bank, N.A., as SyndicationAgent; Bank of America, N.A., U.S. Bank NationalAssociation and Wells Fargo Bank, NationalAssociation, as Co-Documentation Agents; andJ.P. Morgan Securities LLC and PNC CapitalMarkets LLC, as Joint Bookrunners and JointLead Arrangers
Incorporated herein by reference to Exhibit 4.1to the Registrant’s Current Report on Form 8-Kdated May 8, 2012 and filed with the SEC on thesame date (SEC File No. 1-8399)
4.2 Note Purchase Agreement, dated December 17,2004, between Worthington Industries, Inc. andAllstate Life Insurance Company, ConnecticutGeneral Life Insurance Company, United ofOmaha Life Insurance Company and PrincipalLife Insurance Company
Incorporated herein by reference to Exhibit 4.1to the Registrant’s Current Report on Form 8-Kdated December 20, 2004 and filed with the SECon December 21, 2004 (SEC File No. 1-8399)
4.3 Form of Floating Rate Senior Note dueDecember 17, 2014
Incorporated herein by reference to Exhibit 4.2to the Registrant’s Current Report on Form 8-Kdated December 20, 2004 and filed with the SECon December 21, 2004 (SEC File No. 1-8399)
? The Attachments, Exhibits and Disclosure Schedules referenced in the Stock Purchase Agreement havebeen omitted pursuant to Item 601(b)(2) of SEC Regulation S-K. Worthington Industries, Inc. herebyundertakes to furnish a copy of the omitted Attachments, Exhibits and Disclosure Schedules upon requestby the SEC.
E-1
4.4 First Amendment to Note Purchase Agreement,dated as of December 19, 2006, betweenWorthington Industries, Inc. and the purchasersnamed therein regarding the Note PurchaseAgreement, dated as of December 17, 2004,and the $100,000,000 Floating Rate SeniorNotes due December 17, 2014
Incorporated herein by reference to Exhibit 4.2to the Registrant’s Quarterly Report onForm 10-Q for the quarterly period endedNovember 30, 2006 (SEC File No. 1-8399)
4.5 Indenture, dated as of April 13, 2010, betweenWorthington Industries, Inc. and U.S. BankNational Association, as Trustee
Incorporated herein by reference to Exhibit 4.1to the Registrant’s Current Report on Form 8-Kdated April 13, 2010 and filed with the SEC onthe same date (SEC File No. 1-8399)
4.6 First Supplemental Indenture, dated as of April13, 2010, between Worthington Industries, Inc.and U.S. Bank National Association, as Trustee
Incorporated herein by reference to Exhibit 4.2to the Registrant’s Current Report on Form 8-Kdated April 13, 2010 and filed with the SEC onthe same date (SEC File No. 1-8399)
4.7 Form of 6.50% Global Note due April 15, 2020(included in Exhibit 4.6 to this Annual Report onForm 10-K)
Incorporated herein by reference to Exhibit 4.2to the Registrant’s Current Report on Form 8-Kdated April 13, 2010 and filed with the SEC onthe same date (SEC File No. 1-8399)
4.8 Note Agreement, dated as of August 10, 2012,between Worthington Industries, Inc. and ThePrudential Insurance Company of America,Pruco Life Insurance Company of New Jersey,Pruco Life Insurance Company, PrudentialArizona Reinsurance Universal Company,Prudential Annuities Life AssuranceCorporation, The Prudential Life InsuranceCompany, Ltd. and The Gibraltar Life InsuranceCo., Ltd.
Incorporated herein by reference to Exhibit 4.1to the Registrant’s Current Report on Form 8-Kdated August 15, 2012 and filed with the SECon the same date (SEC File No. 1-8399)
4.9 Form of 4.60% Senior Note due August 10, 2024(included in Exhibit 4.8 to this Annual Report onForm 10-K)
Incorporated herein by reference to Exhibit 4.1to the Registrant’s Current Report on Form 8-Kdated August 15, 2012 and filed with the SECon the same date (SEC File No. 1-8399)
4.10 Agreement to furnish instruments andagreements defining rights of holders of long-term debt
Filed herewith
10.1 Worthington Industries, Inc. Non-QualifiedDeferred Compensation Plan effective March 1,2000*
Incorporated herein by reference to Exhibit 10.1to the Registrant’s Annual Report on Form 10-Kfor the fiscal year ended May 31, 2005 (SEC FileNo. 1-8399)
10.2 Amendment to the Worthington Industries, Inc.Non-Qualified Deferred Compensation Plan(Amendment effective as of September 1,2011)*
Incorporated herein by reference to Exhibit 10.8to the Registrant’s Quarterly Report on Form10-Q for the quarterly period ended August 31,2011 (SEC File No. 1-8399)
* Indicates management contract or compensatory plan or arrangement.
E-2
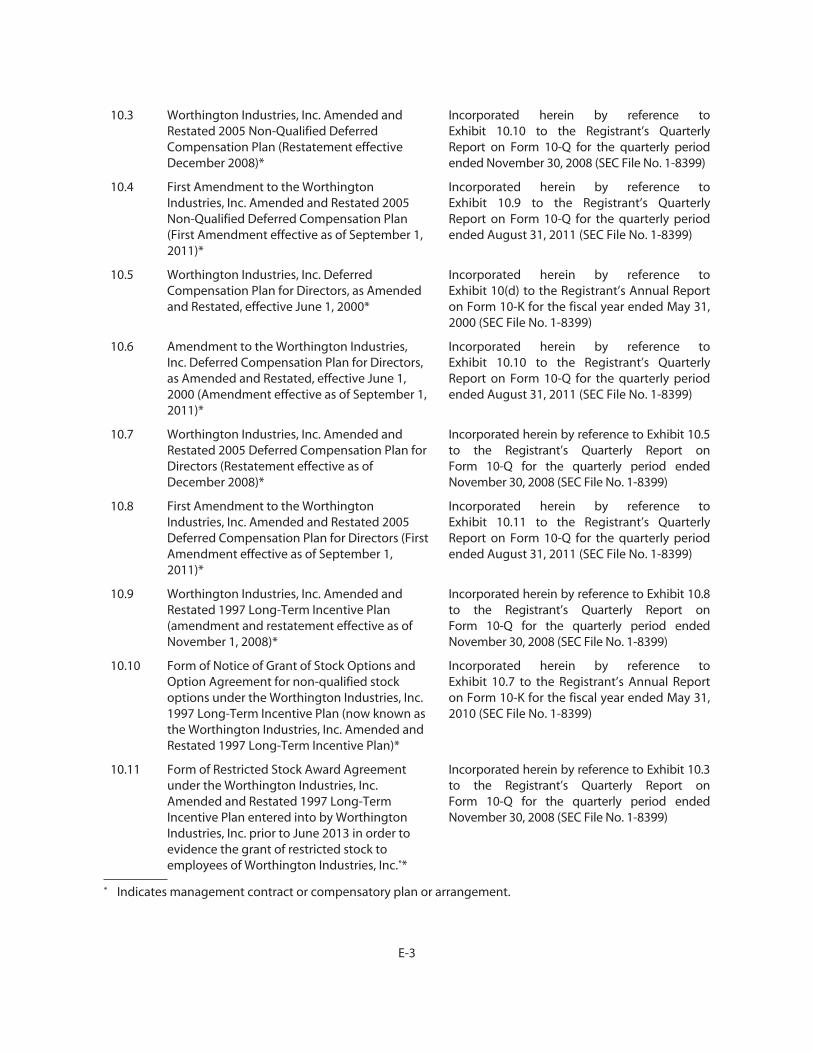
10.3 Worthington Industries, Inc. Amended andRestated 2005 Non-Qualified DeferredCompensation Plan (Restatement effectiveDecember 2008)*
Incorporated herein by reference toExhibit 10.10 to the Registrant’s QuarterlyReport on Form 10-Q for the quarterly periodended November 30, 2008 (SEC File No. 1-8399)
10.4 First Amendment to the WorthingtonIndustries, Inc. Amended and Restated 2005Non-Qualified Deferred Compensation Plan(First Amendment effective as of September 1,2011)*
Incorporated herein by reference toExhibit 10.9 to the Registrant’s QuarterlyReport on Form 10-Q for the quarterly periodended August 31, 2011 (SEC File No. 1-8399)
10.5 Worthington Industries, Inc. DeferredCompensation Plan for Directors, as Amendedand Restated, effective June 1, 2000*
Incorporated herein by reference toExhibit 10(d) to the Registrant’s Annual Reporton Form 10-K for the fiscal year ended May 31,2000 (SEC File No. 1-8399)
10.6 Amendment to the Worthington Industries,Inc. Deferred Compensation Plan for Directors,as Amended and Restated, effective June 1,2000 (Amendment effective as of September 1,2011)*
Incorporated herein by reference toExhibit 10.10 to the Registrant’s QuarterlyReport on Form 10-Q for the quarterly periodended August 31, 2011 (SEC File No. 1-8399)
10.7 Worthington Industries, Inc. Amended andRestated 2005 Deferred Compensation Plan forDirectors (Restatement effective as ofDecember 2008)*
Incorporated herein by reference to Exhibit 10.5to the Registrant’s Quarterly Report onForm 10-Q for the quarterly period endedNovember 30, 2008 (SEC File No. 1-8399)
10.8 First Amendment to the WorthingtonIndustries, Inc. Amended and Restated 2005Deferred Compensation Plan for Directors (FirstAmendment effective as of September 1,2011)*
Incorporated herein by reference toExhibit 10.11 to the Registrant’s QuarterlyReport on Form 10-Q for the quarterly periodended August 31, 2011 (SEC File No. 1-8399)
10.9 Worthington Industries, Inc. Amended andRestated 1997 Long-Term Incentive Plan(amendment and restatement effective as ofNovember 1, 2008)*
Incorporated herein by reference to Exhibit 10.8to the Registrant’s Quarterly Report onForm 10-Q for the quarterly period endedNovember 30, 2008 (SEC File No. 1-8399)
10.10 Form of Notice of Grant of Stock Options andOption Agreement for non-qualified stockoptions under the Worthington Industries, Inc.1997 Long-Term Incentive Plan (now known asthe Worthington Industries, Inc. Amended andRestated 1997 Long-Term Incentive Plan)*
Incorporated herein by reference toExhibit 10.7 to the Registrant’s Annual Reporton Form 10-K for the fiscal year ended May 31,2010 (SEC File No. 1-8399)
10.11 Form of Restricted Stock Award Agreementunder the Worthington Industries, Inc.Amended and Restated 1997 Long-TermIncentive Plan entered into by WorthingtonIndustries, Inc. prior to June 2013 in order toevidence the grant of restricted stock toemployees of Worthington Industries, Inc.**
Incorporated herein by reference to Exhibit 10.3to the Registrant’s Quarterly Report onForm 10-Q for the quarterly period endedNovember 30, 2008 (SEC File No. 1-8399)
* Indicates management contract or compensatory plan or arrangement.
E-3
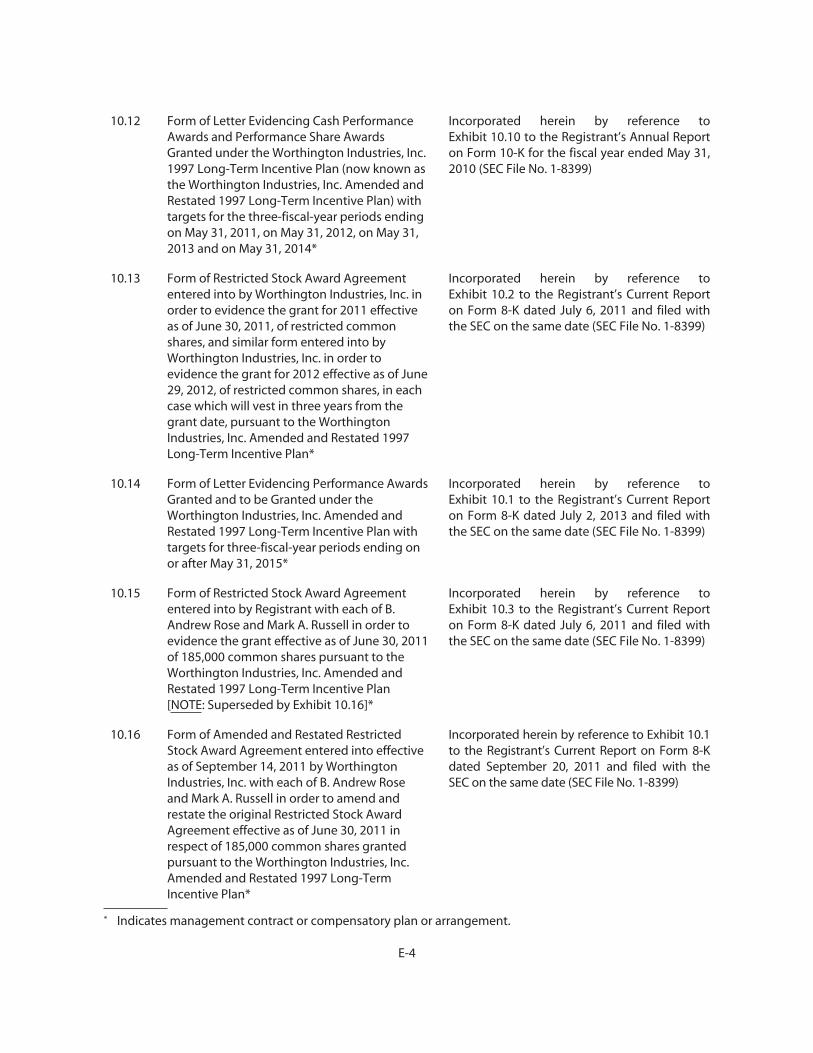
10.12 Form of Letter Evidencing Cash PerformanceAwards and Performance Share AwardsGranted under the Worthington Industries, Inc.1997 Long-Term Incentive Plan (now known asthe Worthington Industries, Inc. Amended andRestated 1997 Long-Term Incentive Plan) withtargets for the three-fiscal-year periods endingon May 31, 2011, on May 31, 2012, on May 31,2013 and on May 31, 2014*
Incorporated herein by reference toExhibit 10.10 to the Registrant’s Annual Reporton Form 10-K for the fiscal year ended May 31,2010 (SEC File No. 1-8399)
10.13 Form of Restricted Stock Award Agreemententered into by Worthington Industries, Inc. inorder to evidence the grant for 2011 effectiveas of June 30, 2011, of restricted commonshares, and similar form entered into byWorthington Industries, Inc. in order toevidence the grant for 2012 effective as of June29, 2012, of restricted common shares, in eachcase which will vest in three years from thegrant date, pursuant to the WorthingtonIndustries, Inc. Amended and Restated 1997Long-Term Incentive Plan*
Incorporated herein by reference toExhibit 10.2 to the Registrant’s Current Reporton Form 8-K dated July 6, 2011 and filed withthe SEC on the same date (SEC File No. 1-8399)
10.14 Form of Letter Evidencing Performance AwardsGranted and to be Granted under theWorthington Industries, Inc. Amended andRestated 1997 Long-Term Incentive Plan withtargets for three-fiscal-year periods ending onor after May 31, 2015*
Incorporated herein by reference toExhibit 10.1 to the Registrant’s Current Reporton Form 8-K dated July 2, 2013 and filed withthe SEC on the same date (SEC File No. 1-8399)
10.15 Form of Restricted Stock Award Agreemententered into by Registrant with each of B.Andrew Rose and Mark A. Russell in order toevidence the grant effective as of June 30, 2011of 185,000 common shares pursuant to theWorthington Industries, Inc. Amended andRestated 1997 Long-Term Incentive Plan[NOTE: Superseded by Exhibit 10.16]*
Incorporated herein by reference toExhibit 10.3 to the Registrant’s Current Reporton Form 8-K dated July 6, 2011 and filed withthe SEC on the same date (SEC File No. 1-8399)
10.16 Form of Amended and Restated RestrictedStock Award Agreement entered into effectiveas of September 14, 2011 by WorthingtonIndustries, Inc. with each of B. Andrew Roseand Mark A. Russell in order to amend andrestate the original Restricted Stock AwardAgreement effective as of June 30, 2011 inrespect of 185,000 common shares grantedpursuant to the Worthington Industries, Inc.Amended and Restated 1997 Long-TermIncentive Plan*
Incorporated herein by reference to Exhibit 10.1to the Registrant’s Current Report on Form 8-Kdated September 20, 2011 and filed with theSEC on the same date (SEC File No. 1-8399)
* Indicates management contract or compensatory plan or arrangement.
E-4
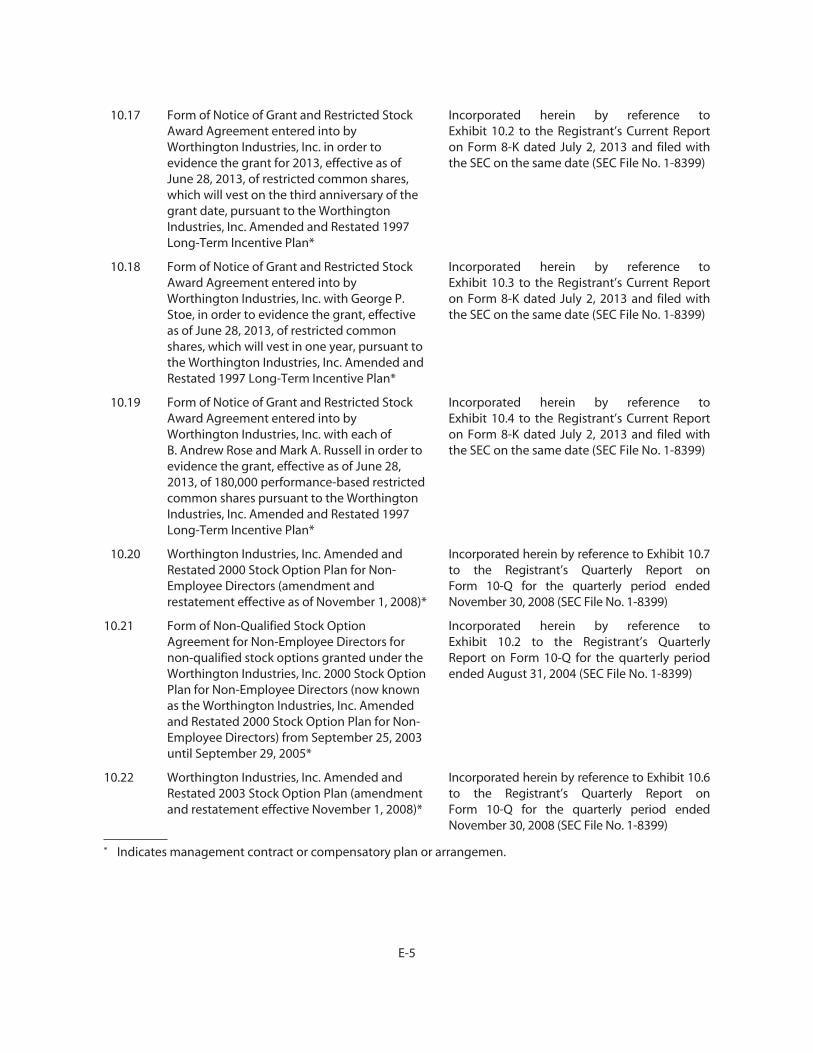
10.17 Form of Notice of Grant and Restricted StockAward Agreement entered into byWorthington Industries, Inc. in order toevidence the grant for 2013, effective as ofJune 28, 2013, of restricted common shares,which will vest on the third anniversary of thegrant date, pursuant to the WorthingtonIndustries, Inc. Amended and Restated 1997Long-Term Incentive Plan*
Incorporated herein by reference toExhibit 10.2 to the Registrant’s Current Reporton Form 8-K dated July 2, 2013 and filed withthe SEC on the same date (SEC File No. 1-8399)
10.18 Form of Notice of Grant and Restricted StockAward Agreement entered into byWorthington Industries, Inc. with George P.Stoe, in order to evidence the grant, effectiveas of June 28, 2013, of restricted commonshares, which will vest in one year, pursuant tothe Worthington Industries, Inc. Amended andRestated 1997 Long-Term Incentive Plan*
Incorporated herein by reference toExhibit 10.3 to the Registrant’s Current Reporton Form 8-K dated July 2, 2013 and filed withthe SEC on the same date (SEC File No. 1-8399)
10.19 Form of Notice of Grant and Restricted StockAward Agreement entered into byWorthington Industries, Inc. with each ofB. Andrew Rose and Mark A. Russell in order toevidence the grant, effective as of June 28,2013, of 180,000 performance-based restrictedcommon shares pursuant to the WorthingtonIndustries, Inc. Amended and Restated 1997Long-Term Incentive Plan*
Incorporated herein by reference toExhibit 10.4 to the Registrant’s Current Reporton Form 8-K dated July 2, 2013 and filed withthe SEC on the same date (SEC File No. 1-8399)
10.20 Worthington Industries, Inc. Amended andRestated 2000 Stock Option Plan for Non-Employee Directors (amendment andrestatement effective as of November 1, 2008)*
Incorporated herein by reference to Exhibit 10.7to the Registrant’s Quarterly Report onForm 10-Q for the quarterly period endedNovember 30, 2008 (SEC File No. 1-8399)
10.21 Form of Non-Qualified Stock OptionAgreement for Non-Employee Directors fornon-qualified stock options granted under theWorthington Industries, Inc. 2000 Stock OptionPlan for Non-Employee Directors (now knownas the Worthington Industries, Inc. Amendedand Restated 2000 Stock Option Plan for Non-Employee Directors) from September 25, 2003until September 29, 2005*
Incorporated herein by reference toExhibit 10.2 to the Registrant’s QuarterlyReport on Form 10-Q for the quarterly periodended August 31, 2004 (SEC File No. 1-8399)
10.22 Worthington Industries, Inc. Amended andRestated 2003 Stock Option Plan (amendmentand restatement effective November 1, 2008)*
Incorporated herein by reference to Exhibit 10.6to the Registrant’s Quarterly Report onForm 10-Q for the quarterly period endedNovember 30, 2008 (SEC File No. 1-8399)
* Indicates management contract or compensatory plan or arrangemen.
E-5
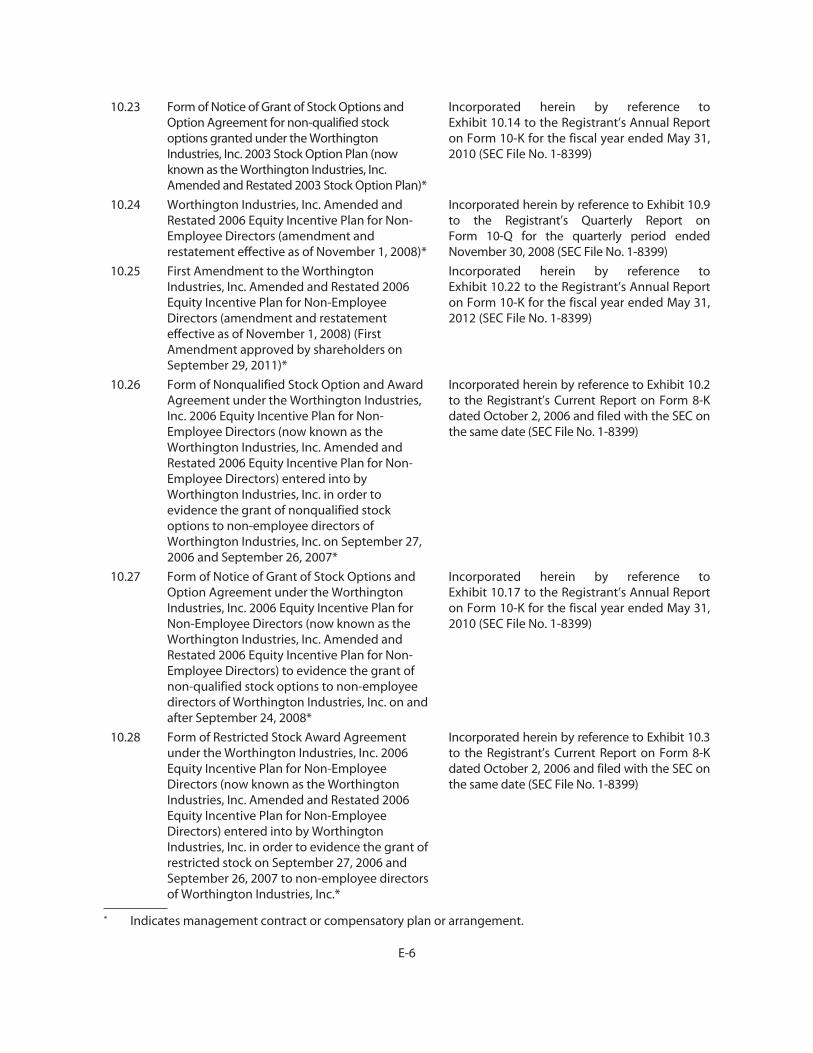
10.23 Form of Notice of Grant of Stock Options andOption Agreement for non-qualified stockoptions granted under the WorthingtonIndustries, Inc. 2003 Stock Option Plan (nowknown as the Worthington Industries, Inc.Amended and Restated 2003 Stock Option Plan)*
Incorporated herein by reference toExhibit 10.14 to the Registrant’s Annual Reporton Form 10-K for the fiscal year ended May 31,2010 (SEC File No. 1-8399)
10.24 Worthington Industries, Inc. Amended andRestated 2006 Equity Incentive Plan for Non-Employee Directors (amendment andrestatement effective as of November 1, 2008)*
Incorporated herein by reference to Exhibit 10.9to the Registrant’s Quarterly Report onForm 10-Q for the quarterly period endedNovember 30, 2008 (SEC File No. 1-8399)
10.25 First Amendment to the WorthingtonIndustries, Inc. Amended and Restated 2006Equity Incentive Plan for Non-EmployeeDirectors (amendment and restatementeffective as of November 1, 2008) (FirstAmendment approved by shareholders onSeptember 29, 2011)*
Incorporated herein by reference toExhibit 10.22 to the Registrant’s Annual Reporton Form 10-K for the fiscal year ended May 31,2012 (SEC File No. 1-8399)
10.26 Form of Nonqualified Stock Option and AwardAgreement under the Worthington Industries,Inc. 2006 Equity Incentive Plan for Non-Employee Directors (now known as theWorthington Industries, Inc. Amended andRestated 2006 Equity Incentive Plan for Non-Employee Directors) entered into byWorthington Industries, Inc. in order toevidence the grant of nonqualified stockoptions to non-employee directors ofWorthington Industries, Inc. on September 27,2006 and September 26, 2007*
Incorporated herein by reference to Exhibit 10.2to the Registrant’s Current Report on Form 8-Kdated October 2, 2006 and filed with the SEC onthe same date (SEC File No. 1-8399)
10.27 Form of Notice of Grant of Stock Options andOption Agreement under the WorthingtonIndustries, Inc. 2006 Equity Incentive Plan forNon-Employee Directors (now known as theWorthington Industries, Inc. Amended andRestated 2006 Equity Incentive Plan for Non-Employee Directors) to evidence the grant ofnon-qualified stock options to non-employeedirectors of Worthington Industries, Inc. on andafter September 24, 2008*
Incorporated herein by reference toExhibit 10.17 to the Registrant’s Annual Reporton Form 10-K for the fiscal year ended May 31,2010 (SEC File No. 1-8399)
10.28 Form of Restricted Stock Award Agreementunder the Worthington Industries, Inc. 2006Equity Incentive Plan for Non-EmployeeDirectors (now known as the WorthingtonIndustries, Inc. Amended and Restated 2006Equity Incentive Plan for Non-EmployeeDirectors) entered into by WorthingtonIndustries, Inc. in order to evidence the grant ofrestricted stock on September 27, 2006 andSeptember 26, 2007 to non-employee directorsof Worthington Industries, Inc.*
Incorporated herein by reference to Exhibit 10.3to the Registrant’s Current Report on Form 8-Kdated October 2, 2006 and filed with the SEC onthe same date (SEC File No. 1-8399)
* Indicates management contract or compensatory plan or arrangement.
E-6

10.29 Form of Restricted Stock Award Agreementunder the Worthington Industries, Inc. 2006Equity Incentive Plan for Non-EmployeeDirectors (now known as the WorthingtonIndustries, Inc. Amended and Restated 2006Equity Incentive Plan for Non-EmployeeDirectors) entered into by WorthingtonIndustries, Inc. in order to evidence the grant ofrestricted stock to non-employee directors ofWorthington Industries, Inc. on September 24,2008 and to be entered into by WorthingtonIndustries, Inc. in order to evidence futuregrants of restricted stock to non-employeedirectors of Worthington Industries, Inc.**
Incorporated herein by reference toExhibit 10.3 to the Registrant’s QuarterlyReport on Form 10-Q for the quarterly periodended August 31, 2008 (SEC File No. 1-8399)
10.30 Worthington Industries, Inc. 2010 Stock OptionPlan*
Incorporated herein by reference to Exhibit 10.1to the Registrant’s Current Report on Form 8-Kdated October 5, 2010 and filed with the SEC onthe same date (SEC File No. 1-8399)
10.31 Form of Non-Qualified Stock Option AwardAgreement entered into by WorthingtonIndustries, Inc. in order to evidence the grant ofnon-qualified stock options to executiveofficers of Worthington Industries, Inc. effectiveas of June 30, 2011 pursuant to theWorthington Industries, Inc. 2010 Stock OptionPlan and to be entered into by WorthingtonIndustries, Inc. in order to evidence futuregrants of non-qualified stock options toexecutive officers pursuant to the WorthingtonIndustries, Inc. 2010 Stock Option Plan*
Incorporated herein by reference toExhibit 10.1 to the Registrant’s Current Reporton Form 8-K dated July 6, 2011 and filed withthe SEC on the same date (SEC File No. 1-8399)
10.32 Worthington Industries, Inc. Annual IncentivePlan for Executives (approved by shareholderson September 24, 2008)*
Incorporated herein by reference to Exhibit 10.1to the Registrant’s Current Report on Form 8-Kdated September 30, 2008 and filed with theSEC on the same date (SEC File No. 1-8399)
10.33 Form of Letter Evidencing Cash PerformanceBonus Awards Granted and to be Grantedunder the Worthington Industries, Inc. AnnualIncentive Plan for Executives (sometimes alsoreferred to as the Worthington Industries, Inc.Annual Short Term Incentive Plan)*
Incorporated herein by reference toExhibit 10.23 to the Registrant’s Annual Reporton Form 10-K for the fiscal year ended May 31,2009 (SEC File No. 1-8399)
10.34 Receivables Purchase Agreement, dated as ofNovember 30, 2000, among WorthingtonReceivables Corporation, as Seller,Worthington Industries, Inc., as Servicer,members of various purchaser groups fromtime to time party thereto and PNC Bank,National Association, as Administrator
Incorporated herein by reference toExhibit 10(h)(i) to the Registrant’s AnnualReport on Form 10-K for the fiscal year endedMay 31, 2001 (SEC File No. 1-8399)
* Indicates management contract or compensatory plan or arrangement.
E-7

10.35 Amendment No. 1 to Receivables PurchaseAgreement, dated as of May 18, 2001, amongWorthington Receivables Corporation, asSeller, Worthington Industries, Inc., as Servicer,members of various purchaser groups fromtime to time party thereto and PNC Bank,National Association, as Administrator
Incorporated herein by reference toExhibit 10(h)(ii) to the Registrant’s AnnualReport on Form 10-K for the fiscal year endedMay 31, 2001 (SEC File No. 1-8399)
10.36 Amendment No. 2 to Receivables PurchaseAgreement, dated as of May 31, 2004, amongWorthington Receivables Corporation, asSeller, Worthington Industries, Inc., as Servicer,members of various purchaser groups fromtime to time party thereto and PNC Bank,National Association, as Administrator
Incorporated herein by reference toExhibit 10(g)(x) to the Registrant’s AnnualReport on Form 10-K for the fiscal year endedMay 31, 2004 (File No. 1-8399)
10.37 Amendment No. 3 to Receivables PurchaseAgreement, dated as of January 27, 2005,among Worthington Receivables Corporation,as Seller, Worthington Industries, Inc., asServicer, the members of the various purchasergroups from time to time party thereto andPNC Bank, National Association, asAdministrator
Incorporated herein by reference toExhibit 10.15 to the Registrant’s Annual Reporton Form 10-K for the fiscal year ended May 31,2005 (SEC File No. 1-8399)
10.38 Amendment No. 4 to Receivables PurchaseAgreement, dated as of January 25, 2008,among Worthington Receivables Corporation,as Seller, Worthington Industries, Inc., asServicer, the members of the various purchasergroups from time to time party thereto andPNC Bank, National Association, asAdministrator
Incorporated herein by reference toExhibit 10.20 to the Registrant’s Annual Reporton Form 10-K for the fiscal year ended May 31,2008 (SEC File No. 1-8399)
10.39 Amendment No. 5 to Receivables PurchaseAgreement, dated as of January 22, 2009,among Worthington Receivables Corporation,as Seller, Worthington Industries, Inc., asServicer, the members of the various purchasergroups from time to time party thereto andPNC Bank, National Association, asAdministrator
Incorporated herein by reference toExhibit 10.1 to the Registrant’s QuarterlyReport on Form 10-Q for the quarterly periodended February 28, 2009 (SEC File No. 1-8399)
10.40 Amendment No. 6 to Receivables PurchaseAgreement, dated as of April 30, 2009, amongWorthington Receivables Corporation, asSeller, Worthington Industries, Inc., as Servicer,the members of the various purchaser groupsfrom time to time party thereto and PNC Bank,National Association, as Administrator
Incorporated herein by reference toExhibit 10.30 to the Registrant’s Annual Reporton Form 10-K for the fiscal year ended May 31,2009 (SEC File No. 1-8399)
E-8
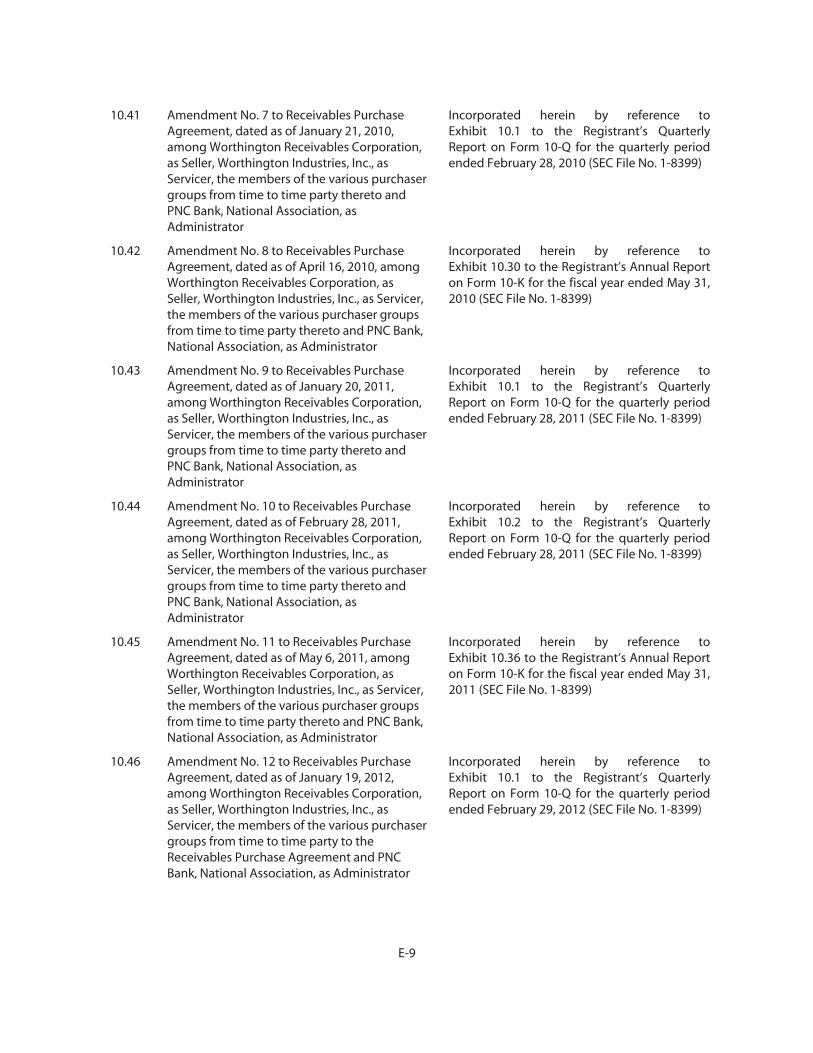
10.41 Amendment No. 7 to Receivables PurchaseAgreement, dated as of January 21, 2010,among Worthington Receivables Corporation,as Seller, Worthington Industries, Inc., asServicer, the members of the various purchasergroups from time to time party thereto andPNC Bank, National Association, asAdministrator
Incorporated herein by reference toExhibit 10.1 to the Registrant’s QuarterlyReport on Form 10-Q for the quarterly periodended February 28, 2010 (SEC File No. 1-8399)
10.42 Amendment No. 8 to Receivables PurchaseAgreement, dated as of April 16, 2010, amongWorthington Receivables Corporation, asSeller, Worthington Industries, Inc., as Servicer,the members of the various purchaser groupsfrom time to time party thereto and PNC Bank,National Association, as Administrator
Incorporated herein by reference toExhibit 10.30 to the Registrant’s Annual Reporton Form 10-K for the fiscal year ended May 31,2010 (SEC File No. 1-8399)
10.43 Amendment No. 9 to Receivables PurchaseAgreement, dated as of January 20, 2011,among Worthington Receivables Corporation,as Seller, Worthington Industries, Inc., asServicer, the members of the various purchasergroups from time to time party thereto andPNC Bank, National Association, asAdministrator
Incorporated herein by reference toExhibit 10.1 to the Registrant’s QuarterlyReport on Form 10-Q for the quarterly periodended February 28, 2011 (SEC File No. 1-8399)
10.44 Amendment No. 10 to Receivables PurchaseAgreement, dated as of February 28, 2011,among Worthington Receivables Corporation,as Seller, Worthington Industries, Inc., asServicer, the members of the various purchasergroups from time to time party thereto andPNC Bank, National Association, asAdministrator
Incorporated herein by reference toExhibit 10.2 to the Registrant’s QuarterlyReport on Form 10-Q for the quarterly periodended February 28, 2011 (SEC File No. 1-8399)
10.45 Amendment No. 11 to Receivables PurchaseAgreement, dated as of May 6, 2011, amongWorthington Receivables Corporation, asSeller, Worthington Industries, Inc., as Servicer,the members of the various purchaser groupsfrom time to time party thereto and PNC Bank,National Association, as Administrator
Incorporated herein by reference toExhibit 10.36 to the Registrant’s Annual Reporton Form 10-K for the fiscal year ended May 31,2011 (SEC File No. 1-8399)
10.46 Amendment No. 12 to Receivables PurchaseAgreement, dated as of January 19, 2012,among Worthington Receivables Corporation,as Seller, Worthington Industries, Inc., asServicer, the members of the various purchasergroups from time to time party to theReceivables Purchase Agreement and PNCBank, National Association, as Administrator
Incorporated herein by reference toExhibit 10.1 to the Registrant’s QuarterlyReport on Form 10-Q for the quarterly periodended February 29, 2012 (SEC File No. 1-8399)
E-9
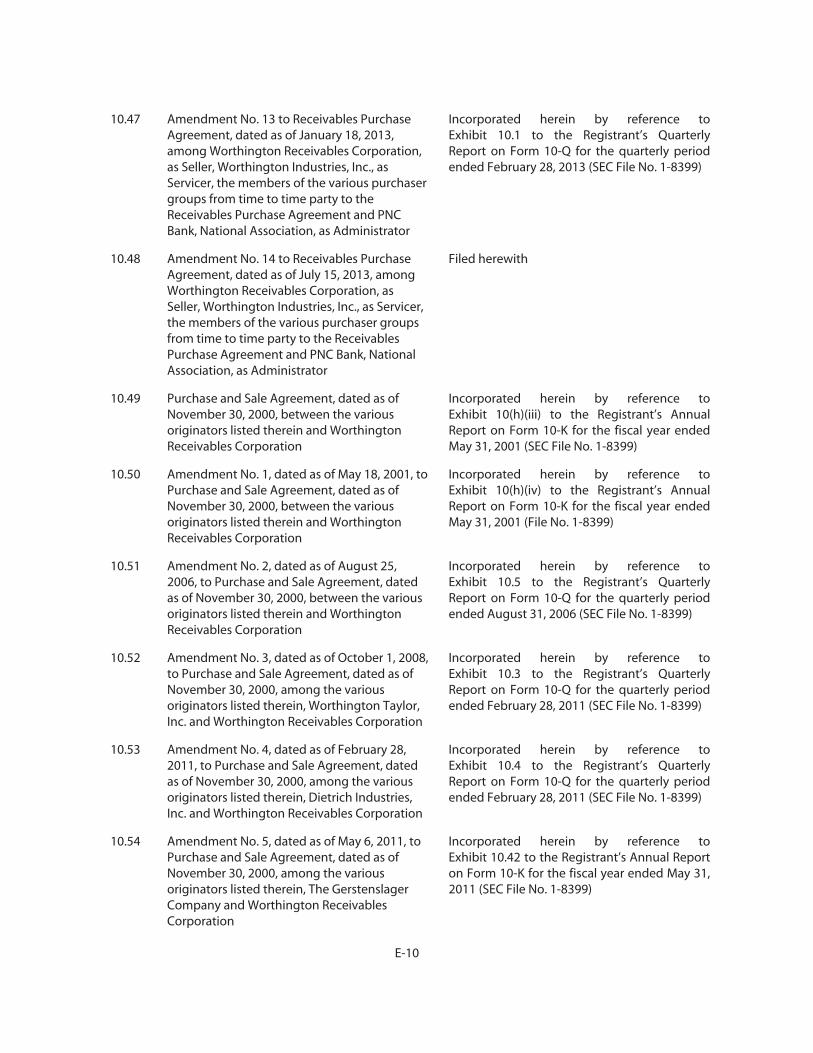
10.47 Amendment No. 13 to Receivables PurchaseAgreement, dated as of January 18, 2013,among Worthington Receivables Corporation,as Seller, Worthington Industries, Inc., asServicer, the members of the various purchasergroups from time to time party to theReceivables Purchase Agreement and PNCBank, National Association, as Administrator
Incorporated herein by reference toExhibit 10.1 to the Registrant’s QuarterlyReport on Form 10-Q for the quarterly periodended February 28, 2013 (SEC File No. 1-8399)
10.48 Amendment No. 14 to Receivables PurchaseAgreement, dated as of July 15, 2013, amongWorthington Receivables Corporation, asSeller, Worthington Industries, Inc., as Servicer,the members of the various purchaser groupsfrom time to time party to the ReceivablesPurchase Agreement and PNC Bank, NationalAssociation, as Administrator
Filed herewith
10.49 Purchase and Sale Agreement, dated as ofNovember 30, 2000, between the variousoriginators listed therein and WorthingtonReceivables Corporation
Incorporated herein by reference toExhibit 10(h)(iii) to the Registrant’s AnnualReport on Form 10-K for the fiscal year endedMay 31, 2001 (SEC File No. 1-8399)
10.50 Amendment No. 1, dated as of May 18, 2001, toPurchase and Sale Agreement, dated as ofNovember 30, 2000, between the variousoriginators listed therein and WorthingtonReceivables Corporation
Incorporated herein by reference toExhibit 10(h)(iv) to the Registrant’s AnnualReport on Form 10-K for the fiscal year endedMay 31, 2001 (File No. 1-8399)
10.51 Amendment No. 2, dated as of August 25,2006, to Purchase and Sale Agreement, datedas of November 30, 2000, between the variousoriginators listed therein and WorthingtonReceivables Corporation
Incorporated herein by reference toExhibit 10.5 to the Registrant’s QuarterlyReport on Form 10-Q for the quarterly periodended August 31, 2006 (SEC File No. 1-8399)
10.52 Amendment No. 3, dated as of October 1, 2008,to Purchase and Sale Agreement, dated as ofNovember 30, 2000, among the variousoriginators listed therein, Worthington Taylor,Inc. and Worthington Receivables Corporation
Incorporated herein by reference toExhibit 10.3 to the Registrant’s QuarterlyReport on Form 10-Q for the quarterly periodended February 28, 2011 (SEC File No. 1-8399)
10.53 Amendment No. 4, dated as of February 28,2011, to Purchase and Sale Agreement, datedas of November 30, 2000, among the variousoriginators listed therein, Dietrich Industries,Inc. and Worthington Receivables Corporation
Incorporated herein by reference toExhibit 10.4 to the Registrant’s QuarterlyReport on Form 10-Q for the quarterly periodended February 28, 2011 (SEC File No. 1-8399)
10.54 Amendment No. 5, dated as of May 6, 2011, toPurchase and Sale Agreement, dated as ofNovember 30, 2000, among the variousoriginators listed therein, The GerstenslagerCompany and Worthington ReceivablesCorporation
Incorporated herein by reference toExhibit 10.42 to the Registrant’s Annual Reporton Form 10-K for the fiscal year ended May 31,2011 (SEC File No. 1-8399)
E-10
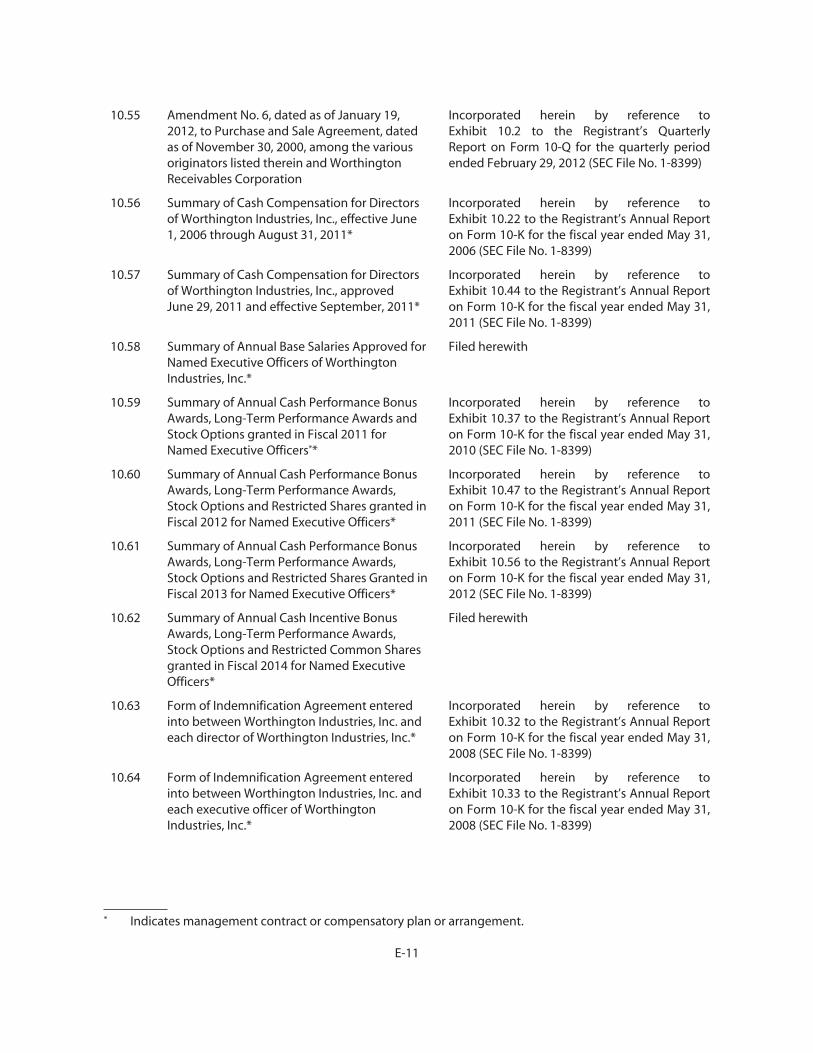
10.55 Amendment No. 6, dated as of January 19,2012, to Purchase and Sale Agreement, datedas of November 30, 2000, among the variousoriginators listed therein and WorthingtonReceivables Corporation
Incorporated herein by reference toExhibit 10.2 to the Registrant’s QuarterlyReport on Form 10-Q for the quarterly periodended February 29, 2012 (SEC File No. 1-8399)
10.56 Summary of Cash Compensation for Directorsof Worthington Industries, Inc., effective June1, 2006 through August 31, 2011*
Incorporated herein by reference toExhibit 10.22 to the Registrant’s Annual Reporton Form 10-K for the fiscal year ended May 31,2006 (SEC File No. 1-8399)
10.57 Summary of Cash Compensation for Directorsof Worthington Industries, Inc., approvedJune 29, 2011 and effective September, 2011*
Incorporated herein by reference toExhibit 10.44 to the Registrant’s Annual Reporton Form 10-K for the fiscal year ended May 31,2011 (SEC File No. 1-8399)
10.58 Summary of Annual Base Salaries Approved forNamed Executive Officers of WorthingtonIndustries, Inc.*
Filed herewith
10.59 Summary of Annual Cash Performance BonusAwards, Long-Term Performance Awards andStock Options granted in Fiscal 2011 forNamed Executive Officers**
Incorporated herein by reference toExhibit 10.37 to the Registrant’s Annual Reporton Form 10-K for the fiscal year ended May 31,2010 (SEC File No. 1-8399)
10.60 Summary of Annual Cash Performance BonusAwards, Long-Term Performance Awards,Stock Options and Restricted Shares granted inFiscal 2012 for Named Executive Officers*
Incorporated herein by reference toExhibit 10.47 to the Registrant’s Annual Reporton Form 10-K for the fiscal year ended May 31,2011 (SEC File No. 1-8399)
10.61 Summary of Annual Cash Performance BonusAwards, Long-Term Performance Awards,Stock Options and Restricted Shares Granted inFiscal 2013 for Named Executive Officers*
Incorporated herein by reference toExhibit 10.56 to the Registrant’s Annual Reporton Form 10-K for the fiscal year ended May 31,2012 (SEC File No. 1-8399)
10.62 Summary of Annual Cash Incentive BonusAwards, Long-Term Performance Awards,Stock Options and Restricted Common Sharesgranted in Fiscal 2014 for Named ExecutiveOfficers*
Filed herewith
10.63 Form of Indemnification Agreement enteredinto between Worthington Industries, Inc. andeach director of Worthington Industries, Inc.*
Incorporated herein by reference toExhibit 10.32 to the Registrant’s Annual Reporton Form 10-K for the fiscal year ended May 31,2008 (SEC File No. 1-8399)
10.64 Form of Indemnification Agreement enteredinto between Worthington Industries, Inc. andeach executive officer of WorthingtonIndustries, Inc.*
Incorporated herein by reference toExhibit 10.33 to the Registrant’s Annual Reporton Form 10-K for the fiscal year ended May 31,2008 (SEC File No. 1-8399)
* Indicates management contract or compensatory plan or arrangement.
E-11
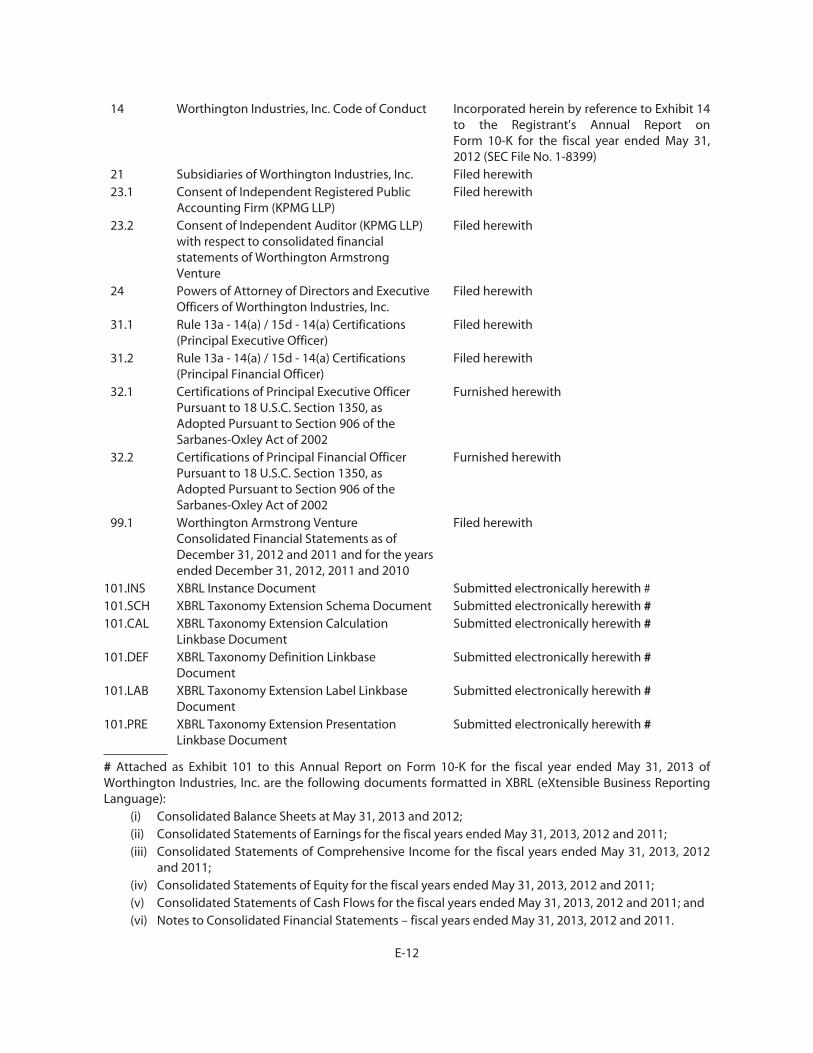
14 Worthington Industries, Inc. Code of Conduct Incorporated herein by reference to Exhibit 14to the Registrant’s Annual Report onForm 10-K for the fiscal year ended May 31,2012 (SEC File No. 1-8399)
21 Subsidiaries of Worthington Industries, Inc. Filed herewith23.1 Consent of Independent Registered Public
Accounting Firm (KPMG LLP)Filed herewith
23.2 Consent of Independent Auditor (KPMG LLP)with respect to consolidated financialstatements of Worthington ArmstrongVenture
Filed herewith
24 Powers of Attorney of Directors and ExecutiveOfficers of Worthington Industries, Inc.
Filed herewith
31.1 Rule 13a - 14(a) / 15d - 14(a) Certifications(Principal Executive Officer)
Filed herewith
31.2 Rule 13a - 14(a) / 15d - 14(a) Certifications(Principal Financial Officer)
Filed herewith
32.1 Certifications of Principal Executive OfficerPursuant to 18 U.S.C. Section 1350, asAdopted Pursuant to Section 906 of theSarbanes-Oxley Act of 2002
Furnished herewith
32.2 Certifications of Principal Financial OfficerPursuant to 18 U.S.C. Section 1350, asAdopted Pursuant to Section 906 of theSarbanes-Oxley Act of 2002
Furnished herewith
99.1 Worthington Armstrong VentureConsolidated Financial Statements as ofDecember 31, 2012 and 2011 and for the yearsended December 31, 2012, 2011 and 2010
Filed herewith
101.INS XBRL Instance Document Submitted electronically herewith #101.SCH XBRL Taxonomy Extension Schema Document Submitted electronically herewith #101.CAL XBRL Taxonomy Extension Calculation
Linkbase DocumentSubmitted electronically herewith #
101.DEF XBRL Taxonomy Definition LinkbaseDocument
Submitted electronically herewith #
101.LAB XBRL Taxonomy Extension Label LinkbaseDocument
Submitted electronically herewith #
101.PRE XBRL Taxonomy Extension PresentationLinkbase Document
Submitted electronically herewith #
# Attached as Exhibit 101 to this Annual Report on Form 10-K for the fiscal year ended May 31, 2013 ofWorthington Industries, Inc. are the following documents formatted in XBRL (eXtensible Business ReportingLanguage):
(i) Consolidated Balance Sheets at May 31, 2013 and 2012;(ii) Consolidated Statements of Earnings for the fiscal years ended May 31, 2013, 2012 and 2011;(iii) Consolidated Statements of Comprehensive Income for the fiscal years ended May 31, 2013, 2012
and 2011;(iv) Consolidated Statements of Equity for the fiscal years ended May 31, 2013, 2012 and 2011;(v) Consolidated Statements of Cash Flows for the fiscal years ended May 31, 2013, 2012 and 2011; and(vi) Notes to Consolidated Financial Statements – fiscal years ended May 31, 2013, 2012 and 2011.
E-12

[THIS PAGE INTENTIONALLY LEFT BLANK]

CORPORATE OFFICERS
John P. McConnell
Chairman of the Board & Chief Executive Offi cerDirector, 1975Member of the Executive Committee
Mark A. Russell
President & Chief Operating Offi cer, 2007
B. Andrew Rose
Vice President & Chief Financial Offi cer, 2008
Virgil L. Winland
Senior Vice President–Manufacturing, 1971
Dale T. Brinkman
Vice President–Administration, General Counsel & Secretary, 1982
Terrance M. Dyer
Vice President–Human Resources, 2009
Clifford J. Larivey
Vice President–Purchasing, 1998
Matthew A. Lockard
Vice President–Corporate Development & Treasurer, 1994
Michael H. Luh
Vice President–Centers of Excellence & Innovation, 2013
Catherine M. Lyttle
Vice President–Communications & Investor Relations, 1999
Eric M. Smolenski
Chief Information Offi cer, 1994
Richard G. Welch
Controller, 1999
SUBSIDIARY OFFICERS
Geoffrey G. Gilmore
President, 1998The Worthington Steel Company
Andrew J. Billman
President, 1991Worthington Cylinder Corporation
John G. Lamprinakos
President, 1979Angus Industries, Inc.
OUTSIDE DIRECTORS
John B. Blystone
Retired Chairman, President & Chief Executive Offi cer,SPX CorporationLead Director, 1997Member of the Executive, and Compensation and Stock Option Committees
Kerrii B. Anderson
Private Investor and Board AdvisorDirector, 2010Member of the Audit, and Compensation and Stock Option Committees
Mark C. Davis
Private Investor and Chief Executive Offi cer, Lank Acquisition Corp.Director, 2011Member of the Audit Committee
Michael J. Endres
Partner, Stonehenge Financial Holdings, Inc.Director, 1999Member of the Executive, and Compensation and Stock Option Committees
Ozey K. Horton, Jr.
Independent Advisor and Director Emeritus, McKinsey & CompanyDirector, 2011Member of the Nominating and Governance Committee
Peter Karmanos, Jr.
Founder and Retired Chairman & Chief Executive Offi cer, Compuware CorporationDirector, 1997Member of the Executive, Compensation and Stock Option, and Nominating and Governance Committees
Carl A. Nelson, Jr.
Independent Business ConsultantDirector, 2004Member of the Executive, and Audit Committees
Sidney A. Ribeau
President, Howard UniversityDirector, 2000Member of the Nominating and Governance Committee
Mary Schiavo
Member, Motley Rice LLCDirector, 1998Member of the Audit, and Nominating and Governance Committees
Note: Year listed indicates initial year of affi liation with Worthington Industries and its subsidiaries.
INQUIRIES
Questions regarding dividend checks, dividend reinvestment, lost certifi cates, change of address or consolidation of accounts should be directed to the transfer agent and registrar for Worthington Industries, Inc.’s common shares:
Wells Fargo Shareowner Services
P.O. Box 64874Saint Paul, MN 55164-0874
Courier:
Wells Fargo Shareowner Services
1110 Centre Pointe Curve, Suite 101Mendota Heights MN 55120-4100
Phone: 800.468.9716
Phone outside the U.S.: 651.450.4064
Fax: 651.450.4085
General Inquiries:
https://www.wellsfargo.com/com/investments/shareowner-services/
Account Information:
www.shareowneronline.com
Securities analysts and investors should contact the Investor Relations Department of Worthington Industries, Inc. at 614.438.3077 or [email protected]
WEBSITE
WorthingtonIndustries.com
DIVIDEND REINVESTMENT PLAN
Registered shareholders may participate in the dividend reinvestment and stock purchase plan. The plan is a convenient method for shareholders to increase their investment in the company without paying brokerage commissions or service charges. A prospectus describing the plan and an authorization card may be obtained by calling Wells Fargo Shareowner Services at 800.468.9716.
INVESTOR INFORMATION
CORPORATE OFFICERS AND DIRECTORS
134511.indd 7 8/9/13 8:15 AM

STEEL PROCESSING Decatur, AlabamaLos Angeles, CaliforniaPorter, IndianaBaltimore, MarylandCleveland, OhioColumbus, OhioDelta, OhioMiddletown, OhioMonroe, Ohio
PRESSURE CYLINDERSPomona, CaliforniaGarden City, KansasMaize, KansasNew Albany, MississippiMedina, New YorkWinston-Salem, North CarolinaBremen, OhioColumbus, OhioJefferson, OhioWesterville, OhioWooster, OhioChilton, WisconsinKienberg, AustriaTilbury, Ontario, CanadaSlupsk, Poland (two locations)Vale De Cambra, Portugal
ENGINEERED CABSNorthwood, IowaFlorence, South CarolinaWatertown, South DakotaGreeneville, Tennessee
OTHERWorthington Integrated Building
Systems, LLC
Cleveland, OhioFranklin, Tennessee
Worthington Steelpac Systems, LLC
Greensburg, IndianaNorth Lewisburg, OhioYork, Pennsylvania
JOINT VENTURESArtiFlex Manufacturing, LLC
Frankfort, KentuckyClyde, OhioWooster, OhioGrand Rapids, MichiganKentwood, MichiganWalker, Michigan
Clarkwestern Dietrich Building
Systems, LLC
Riverside, CaliforniaSacramento, CaliforniaBristol, ConnecticutDade City, FloridaMiami, FloridaMcDonough, GeorgiaKapolei, HawaiiRochelle, IllinoisBaltimore, MarylandWarren, Ohio (two locations)Baytown, TexasDallas, Texas
Worthington Energy Innovations, LLC
Freemont, Ohio
Samuel Steel Pickling Company
Cleveland, OhioTwinsburg, Ohio
Serviacero Planos, S. de R.L. de C.V.
Leon, MexicoMonterrey, MexicoQueretaro, Mexico
Spartan Steel Coating, LLC
Monroe, Michigan
TWB Company, LLC
Prattville, AlabamaMonroe, MichiganSmyrna, Tennessee Hermosillo, MexicoPuebla, MexicoRamos Arizpe, MexicoSilao, Mexico
Worthington Armstrong Venture (WAVE)
Aberdeen, MarylandBenton Harbor, MichiganNorth Las Vegas, NevadaQingpu, Shanghai, ChinaProuvy, FranceMarval, Pune, IndiaMadrid, SpainSittingbourne, United KingdomTeam Valley, United Kingdom
Worthington Modern Steel Framing
Manufacturing Co., Ltd.
Xianto City, Hubei Province, China
Worthington Nitin Cylinders Limited
Visakhapatnam, India
Worthington Specialty Processing (WSP)
Canton, MichiganJackson, MichiganTaylor, Michigan
Worthington Industries, Inc., based in Columbus, Ohio, through its subsidiaries and joint ventures, operated 82 facilities in 11 countries and employed approximately 10,000 people as of August 1, 2013.
200 Old Wilson Bridge RoadColumbus, Ohio 43085614.438.3210
WorthingtonIndustries.comNYSE: WOR
134511.indd 8 8/9/13 8:15 AM