Worries weigh on KLCI - i...
3
FOCUSM lead AUG 9·15. 2014 Worries weigh on KLCI SapuraKencana Petroleum, which made a huge financial gain this year from the inclusion of new businesses and contract wins, does not appear to have caught' investors' ;,tt,.,ntinn But the earnings of the 30 KLCI stocks, although within analysts ' expectations, have done little to reassure investors who are becoming increasingly jittery with both domestic and global uncertainties. A compilation of the first quarter (Q1) financial results of the KLCI constituents show a consistent decline in year-on-year (yoy) growth rates over the last three years. Fo cusM analysis reveals the average Q1 revenue yoy growth rate has slowed to 7.6% for Q1 2014 vs Q1 2013, compared with Company AMMBHidgs Astro Malaysia Hldgs Axiata Group British American Tobacco (Malaysia) CIMB Group Hldgs DiGi.Com Felda Global Ventures Hldgs Genting Genting Malaysia Hong Leong Bank Hong Leong Rnancial IHH Healthcare 101 Corp KLCC Property Hldgs Kuala lumpur Kepong Malayan Banking Maxis MISC Petronas Chemicals Group Petronas Dagangan Petronas Gas PPB Group Public Bank RHB Gapital SapuraKencana Petroleum SimeDarby Telekom Malaysia Latest Results Q4FY14 01 FY14 01 FY14 01 FY14 01 FY14 01 FY14 01 FY14 01 FY14 , 01 FY14 03 FY14 03 FY14 01 FY14 03 FY14 01 FY14 02FY14 01 FY14 01 FY14 01 FY14 01 FY14 01 FY14 I 01 FY14 01 FY14 01 FY14 01 FY14 • 01 FY15 Q3FY14 01 FY14 by Oinesh Immanuel 11.1% and 13.2% growth in revenue in the preceding two identical periods respectively (i.e. Q1 2013 vs Q1 2012 and Q12012 vs Q12011). It is interesting to note that Malay- sia maintained a steady gross domestic product (GDP) growth during those periods. In Q1 2012, the country recorded a GDP growth of 5.1 %, which fell to 4.2% in Q1 last year. However, the domestic economy recovered to post an impressive 6.2% growth in Q1 this year. Hence, these local corporate giants had been somehow deriving lesser earnings despite the economy chugging along at a healthy pace. The prospects for the rest of the year may not be rosy for world stock mar- kets including Malaysia. The Argen- tinian debt crisis, Portugal's banking woes, Italy slipping into a recession and other global political uncertainties are all weighing down on stocks. At home, rising interest rates and a slowing economy are causing jitters among investors. Analysts say the key benchmark FBM KLCI may slide due to slower earnings growth, unattractive Within Consensus Analyst 1 B uy I S ell NProfit 01 NProfit 01 NProfit 01 E PS 01 EPS 01 E PS 01 Cons ensus FY 14/13 FY 13/12 FY 12111 FY 14/13 FY 13/12 FY 12111 Yes Outperform 1.9% 13.4% 29.1 % 1.8% 14.4% 24.0% 3.2% Yes Neutral 11.4% 14.2% 13. 3% -7.7% 12.8% Yes Neutral 0.7% 5.5% 7.8% 8.1% 4.7% 0.6% 9.7% 7.5% 11.7% Yes Neutral 5 .3% 5.1% 5. 1% 10. 4% 5. 0% 8. 9% 10.3% 9.0% Mixed Outperform -10.3% 21.2% 18.4% -22.8% 37.1% 9.6% -29.5% 10.3% Yes Neutral 4.3% 4.9% 9.7% 47. 6% 2.5% -3.2% 47.5% -3.3% Yes Neutral 38.9% 55.9% 1.9% 25.0% -25.2% -36. 3% 5.4% -46.3% Yes Neutral 19.9% -7.8% I -13.1% 28.1% -26.6% -20. 9% 24.6% -42.7% -15.6% Mixed Neutral 8.8% -16.3% 54. 3% -35.2% -14.5% 54.6% -35.1% Yes Neutral -7. 5% . 76.0% 10. 1% -22.9% 103.4% 9.7% -9.1 % 42.9% Yes Neutral 8.6% 78.4% 23.0% -22. 8% 88.3% 23.7% -32.5% 93.4% Yes Neutral 8. 2% 12.9% -3. 8% 24.1% -22.5% Yes Neutral 0.9% -17.5% 287.1% 2.8% -18.1% 284.7% 3.5% -16.2% Yes Outperform 9.3% 13.1% 20.5% 42.0% 0.9% -42.4% 8.2% -13.3% -39.0% Yes Neutral 31.2% -14.8% 10. 8% 49. 5% -2.2% -41 .9% 49.7% -2.5% -42.5% Mixed Outperform 3.0% 3.1% 53.5% 4.9% 14.1 % 15.1 % 1.2% 1.4% 13.0% Yes Neutral -8.9% 4.4% 4.5% 2.5% -16.9% 6.1% 1.6% 5.6% Yes Neutral -3.7% 7.7% -24.5% 52.0% -177.6% 106.7% 62.7% 50.7% Yes Neutral -14.6% 1.5% 0.8% -32.1% 10. 3% -3.4% -35.7% 8. 3% No Underperform 8.9% 11 . 2% 7.4% -34. 3% 1 -3.4% 7.9% -34.7% 7.8% Yes Neutral 15. 8% -0.5% 2.6% 16.0% 8.1% 25.1 % 15.9% 25.0% No Neutral 15.6% 9.6% 20.2% -36.1% 30.2% -31 .8% -39.0% -32.7% Yes Neutral 0.0% 17.0% 12.8% 4.9% 4.4% 4.8% 5.0% 5.2% Mixed Neutral 6.1% 19.1% 14.2% 24. 6% -16.7% -4.8% 23.8% -7 .0% Yes Outperform 50.6% 138.0% 296.5% 112.8% 444.9% No Outperform 8.0% 23.3% -22.9% 8.3% 22.5% -21 .1% 6 .8% Yes Underperform 11 . 0% -1.6% -14.0% 48.1% -1.2% -14.9% 52.2% valuations and lack of positive cata- lysts. In short , prospects for the KLCI look pretty much unattractive. So after a stellar bull run for a good five years, the KLCI appears to be showing signs of fatigue which ap- peared early this year when the market fell by 4% in the first 20 trading days. Even as we move into the third quarter, there is very little indication that the KLCI has recovered from its slumber. Capital Dynamics managing · director and CEO Tan Teng Boo tells FocusM: "We find that the valuation Revenue Latest 0 2, 391 , 100 1, 253, 855 4, 515, 022 1 ,1 54,310 3, 538, 053 1, 717, 548 3, 726, 122 4, 693, 367 2, 026, 050 948,265 1,172, 829 1,757, 612 2,899, 900 340, 882 2,934,043 8, 356,765 2, 119, 000 2, 290,542 3, 806, 000 8, 293, 564 1,054,258 883, 185 3,948, 377 2, 404, 263 2, 443,568 10, 295, 975 2, 620, 036 Net Profit Latest 0 486, 335 128, 997 . 729, 966 225, 394 1, 082, 222 485, 159 208, 807 1, 075, 419 349, 695 500, 049 637, 369 188, 903 2,185,100 213,1 55 337, 128 1,634, 499 488, 000 511 , 851 839,000 157,193 418, 004 154, 860 1, 027, 033 453,471 510,1 12 882,048 218, 825 EPS Latest a 6.32 2 8.4 41 .3 1.96 34.2 10.19 29.5 18.09 6.4 10.9 9 15.6 21 . 12 12. 17 29. 04 17.7 8.5 14. 09 5.89 Revenue corresponding 0 1 year ago 2, 347, 109 1, 125,798 4,481 , 877 1,095,739 3, 945, 320 1, 647, 092 2, 682, 208 3, 914, 961 1, 861 , 994 1, 024, 916 1, 080, 379 1, 624,598 2, 874, 600 311 , 996 2, 235, 550 8,1 16,807 2, 327, 000 2,379, 539 4,455, 000 7, 618, 972 910,443 763, 846 3, 948, 377 2, 266, 819 1, 622, 522 10, 844, 200 2, 424, 649 Tenaga Nasional 03 FY14 Yes Neutral 15.1% -1 .1% 156.5% -445.7% -2.4% 152.0% -474.5% ' 11 , 510, 000 1, 737, 700 30.31 9, 647, 500 UMWHidgs 01 FY14 , Yes Outperform 14.9% 17.0% -3.1% 33. 1% 7.2% -o.2% 1 44.1% 3, 583,405 392, 094 3, 359, 296 YTLCorp I 03 FY14 Yes Neutral -4.4% -9.3% 23.5% 36.1 % -20.2% 9.5% 34. 3% -27.3% -10. 60% 4, 545,289 573,569 4, 752, 737 11> Note: All figures in RM ' 000; EPS in sen 11> Note: Astra & SapuraKencana financial quarter ended April 30, 2014; TNB ended May 31 , 2014 11> Source: Bursa, FocusM Research
Transcript of Worries weigh on KLCI - i...

FOCUSM lead AUG 9·15. 2014
Worries weigh on KLCI
SapuraKencana Petroleum, which made a huge financial gain this year from the inclusion of new businesses and contract wins, does not appear to have caught' investors' ;,tt,.,ntinn
But the earnings of the 30 KLCI stocks, although within analysts ' expectations, have done little to reassure investors who are becoming increasingly jittery with both domestic and global uncertainties.
A compilation of the first quarter (Q1) financial results of the KLCI constituents show a consistent decline in year-on-year (yoy) growth rates over the last three years. FocusM analysis reveals the average Q1 revenue yoy growth rate has slowed to 7.6% for Q1 2014 vs Q1 2013, compared with
Company
AMMBHidgs Astro Malaysia Hldgs Axiata Group British American Tobacco (Malaysia) CIMB Group Hldgs DiGi.Com Felda Global Ventures Hldgs Genting Genting Malaysia Hong Leong Bank Hong Leong Rnancial IHH Healthcare 101 Corp KLCC Property Hldgs Kuala lumpur Kepong Malayan Banking
Maxis MISC Petronas Chemicals Group Petronas Dagangan
Petronas Gas PPB Group Public Bank RHB Gapital SapuraKencana Petroleum SimeDarby Telekom Malaysia
Latest Results
Q4FY14 01 FY14 01 FY14 01 FY14 01 FY14 01 FY14 01 FY14 01 FY14
, 01 FY14 03 FY14 03 FY14 01 FY14 03 FY14 01 FY14 02FY14 01 FY14 01 FY14 01 FY14 01 FY14 01 FY14
I 01 FY14 01 FY14 01 FY14 01 FY14
• 01 FY15 Q3FY14 01 FY14
by Oinesh Immanuel
11.1% and 13.2% growth in revenue in the preceding two identical periods respectively (i.e. Q1 2013 vs Q1 2012 and Q12012 vs Q12011).
It is interesting to note that Malaysia maintained a steady gross domestic product (GDP) growth during those periods. In Q1 2012, the country recorded a GDP growth of 5.1 %, which fell to 4.2% in Q1 last year. However, the domestic economy recovered to post an impressive 6.2% growth in Q1 this year. Hence, these local corporate giants had been somehow deriving
lesser earnings despite the economy chugging along at a healthy pace.
The prospects for the rest of the year may not be rosy for world stock markets including Malaysia. The Argentinian debt crisis, Portugal's banking woes, Italy slipping into a recession and other global political uncertainties are all weighing down on stocks.
At home, rising interest rates and a slowing economy are causing jitters among investors. Analysts say the key benchmark FBM KLCI may slide due to slower earnings growth, unattractive
Within Consensus \-------------.....--...,-~-"G"-'roc:;wth~·A""o~_,..,,....,...,...-=-=---r--::c::-::-:...,-...,....,::-::-::--::--l Analyst 1 Buy I Sell NProfit 01 NProfit 01 NProfit 01 EPS 01 EPS 01 EPS 01
Consensus FY 14/13 FY 13/12 FY 12111 FY 14/13 FY 13/12 FY 12111
Yes Outperform 1.9% 13.4% 29.1 % 1.8% 14.4% 24.0% 3.2%
Yes Neutral 11.4% 14.2% 13.3% -7.7% 12.8%
Yes Neutral 0.7% 5.5% 7.8% 8.1% 4.7% 0.6% 9.7% 7.5% 11.7% Yes Neutral 5.3% 5.1% 5.1% 10.4% 5.0% 8.9% 10.3% 9.0%
Mixed Outperform -10.3% 21.2% 18.4% -22.8% 37.1% 9.6% -29.5% 10.3%
Yes Neutral 4.3% 4.9% 9.7% 47.6% 2.5% -3.2% 47.5% -3.3% Yes Neutral 38.9% 55.9% 1.9% 25.0% -25.2% -36.3% 5.4% -46.3%
Yes Neutral 19.9% -7.8% I -13.1% 28.1% -26.6% -20.9% 24.6% -42.7% -15.6%
Mixed Neutral 8.8% -16.3% 54.3% -35.2% -14.5% 54.6% -35.1%
Yes Neutral -7.5% . 76.0% 10.1% -22.9% 103.4% 9.7% -9.1 % 42.9%
Yes Neutral 8.6% 78.4% 23.0% -22.8% 88.3% 23.7% -32.5% 93.4% Yes Neutral 8.2% 12.9% -3.8% 24.1% -22.5% Yes Neutral 0.9% -17.5% 287.1% 2.8% -18.1% 284.7% 3.5% -16.2%
Yes Outperform 9.3% 13.1% 20.5% 42.0% 0.9% -42.4% 8.2% -13.3% -39.0% Yes Neutral 31.2% -14.8% 10.8% 49.5% -2.2% -41 .9% 49.7% -2.5% -42.5%
Mixed Outperform 3.0% 3.1% 53.5% 4.9% 14.1% 15.1% 1.2% 1.4% 13.0% Yes Neutral -8.9% 4.4% 4.5% 2.5% -16.9% 6.1% 1.6% 5.6%
Yes Neutral -3.7% 7.7% -24.5% 52.0% -177.6% 106.7% 62.7% 50.7%
Yes Neutral -14.6% 1.5% 0.8% -32.1% 10.3% -3.4% -35.7% 8.3%
No Underperform 8.9% 11 .2% 7.4% -34.3% 1 -3.4% 7.9% -34.7% 7.8% Yes Neutral 15.8% -0.5% 2.6% 16.0% 8.1% 25.1 % 15.9% 25.0% No Neutral 15.6% 9.6% 20.2% -36.1% 30.2% -31 .8% -39.0% -32.7%
Yes Neutral 0.0% 17.0% 12.8% 4.9% 4.4% 4.8% 5.0% 5.2%
Mixed Neutral 6.1% 19.1% 14.2% 24.6% -16.7% -4.8% 23.8% -7.0%
Yes Outperform 50.6% 138.0% 296.5% 112.8% 444.9% No Outperform 8.0% 23.3% -22.9% 8.3% 22.5% -21 .1% 6.8%
Yes Underperform 11 .0% -1.6% -14.0% 48.1% -1.2% -14.9% 52.2%
valuations and lack of positive catalysts. In short, prospects for the KLCI look pretty much unattractive.
So after a stellar bull run for a good five years, the KLCI appears to be showing signs of fatigue which appeared early this year when the market fell by 4% in the first 20 trading days. Even as we move into the third quarter, there is very little indication that the KLCI has recovered from its slumber.
Capital Dynamics managing · director and CEO Tan Teng Boo tells FocusM: "We find that the valuation
Revenue Latest 0
2,391 ,100 1,253,855 4,515,022 1,1 54,310 3,538,053 1,717,548 3,726,122 4,693,367 2,026,050
948,265 1,172,829 1,757,612 2,899,900
340,882 2,934,043 8,356,765 2,119,000 2,290,542
3,806,000 8,293,564 1,054,258
883,185 3,948,377 2,404,263 2,443,568
10,295,975 2,620,036
Net Profit Latest 0
486,335
128,997 . 729,966 225,394
1,082,222 485,159 208,807
1,075,419 349,695 500,049 637,369 188,903
2,185,100 213,155 337,128
1,634,499 488,000 511 ,851 839,000 157,193 418,004 154,860
1,027,033 453,471 510,1 12 882,048 218,825
EPS Latest a
6.32 28.4 41 .3 1.96 34.2
10.19 29.5
18.09 6.4
10.9
9 15.6
21 .12 12.17 29.04 17.7 8.5
14.09 5.89
Revenue corresponding 0
1 year ago
2,347,109 1,125,798 4,481 ,877
1,095,739 3,945,320 1,647,092 2,682,208 3,914,961 1,861 ,994 1,024,916 1,080,379 1,624,598 2,874,600
311 ,996 2,235,550 8,1 16,807 2,327,000 2,379,539 4,455,000 7,618,972
910,443 763,846
3,948,377 2,266,819 1,622,522
10,844,200 2,424,649
Tenaga Nasional 03 FY14 Yes Neutral 15.1% -1 .1% 156.5% -445.7% -2.4% 152.0% -474.5% ' 11 ,510,000 1,737,700 30.31 9,647,500
UMWHidgs 01 FY14 , Yes Outperform 14.9% 17.0% -3.1% 33.1% 7.2% -o.2% 1 44.1% 3,583,405 392,094 3,359,296
YTLCorp I 03 FY14 Yes Neutral -4.4% -9.3% 23.5% 36.1 % -20.2% 9.5% 34.3% -27.3% -10.60% 4,545,289 573,569 4,752,737
11> Note: All figures in RM '000; EPS in sen 11> Note: Astra & SapuraKencana financial quarter ended April 30, 2014; TNB ended May 31 , 2014 11> Source: Bursa, FocusM Research
AUG 9-15, 2014 lead FOCUSM 1!1 of the stock market on the rich side is based on numerous valuation metrics. Hence, it has been difficult to find attractively-priced stocks to invest in."
Foreign funds too are more carefully managing their many funds across the region as a hedge against global risks. In fact, these foreign funds appear to be slowly paring down their positions in Malaysian equities.
In a recent fund flow report, MIDF Research noted that on a cumulative basis, foreign investors remained net sellers of Malaysian stocks this year. The net outflow of foreign funds as at July 18 stood at negative RM1.46 bil, compared with a net inflow of RM3 bil last year. These funds are either taking profit on a fully-valued KLCI or simply cutting potential losses.
The current price-earnings multiple of the KLCI at 16.7 times is only a shade lower than its 2013 levels and seems relatively expensive compared with regional peers.
Singapore's Straits Times Index PE of 13.8 times does appear to present a better upside and value potential at face level. Even so, oil & gas player Samudra Energy Ltd called off its flotation exercise, citing weak market conditions. The Jakarta Composite Index doesn't seem expensive to foreign investors despite trading at 20 times PE, which is very near historical levels. Foreign funds bought up Indonesian equities following Joko Widodo's recent solid win in the presidential election.
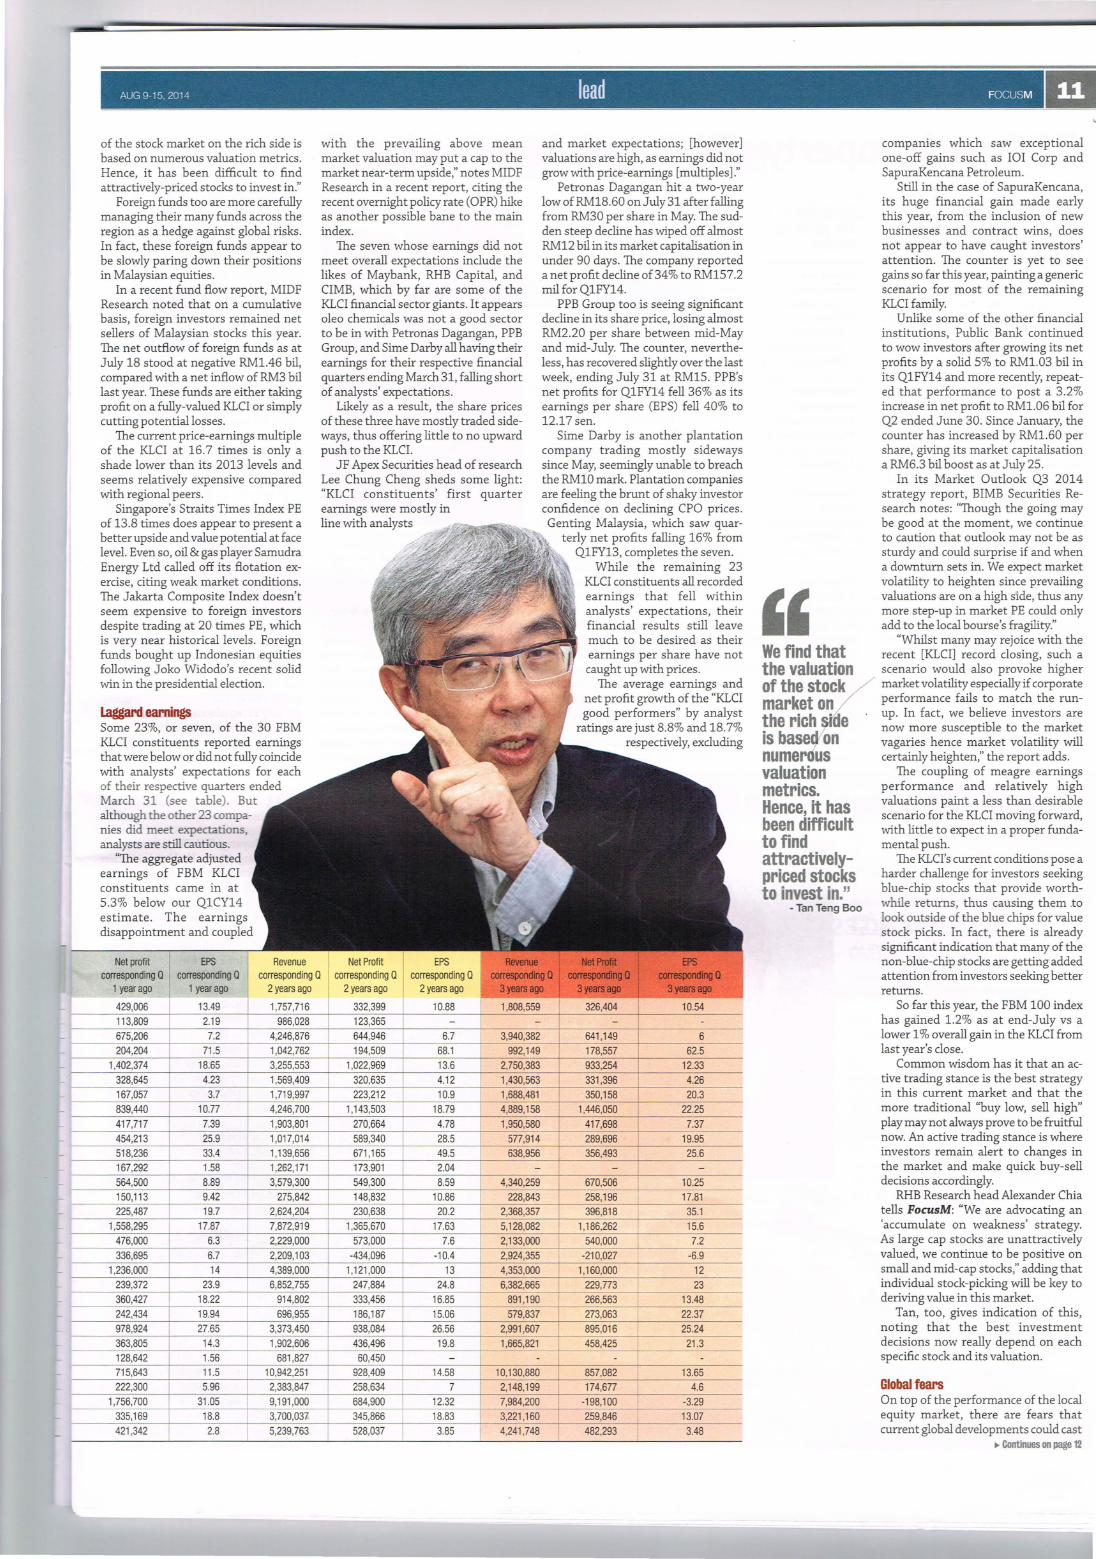
Laggard eamings Some 23%, or seven, of the 30 FBM KLCI constituents reported earnings that were below or did not fully coincide with analysts' expectations for each of their respective quarters ended March 31 (see table). But although the other 23 companies did meet expectations, analysts are still cautious.
'The aggregate adjusted earnings of FBM KLCI constituents came in at 5.3% below our Q1CY14 estimate. The earnings disappointment and coupled
Net profit corresponding a
1 year ago
EPS corresponding a
1 year ago
with the prevailing above mean market valuation may put a cap to the market near-term upside," notes MIDF Research in a recent report, citing the recent overnight policy rate (OPR) hike as another possible bane to the main index.
The seven whose earnings did not meet overall expectations include the likes of Maybank, RHB Capital, and CIMB, which by far are some of the KLCI financial sector giants. It appears oleo chemicals was not a good sector to be in with Petronas Dagangan, PPB Group, and Sirne Darby all having their earnings for their respective financial quarters ending March 31, falling short of analysts' expectations.
Likely as a result, the share prices of these three have mostly traded sideways, thus offering little to no upward push to the KLCI.
JF Apex Securities head of research Lee Chung Cheng sheds some light: "KLCI constituents' first quarter earnings were mostly in line with analysts
and market expectations; [however) valuations are high, as earnings did not grow with price-earnings [multiples)."
Petronas Dagangan hit a two-year low of RM18.60 on July 31 after falling from RM30 per share in May. The sudden steep decline has wiped off almost RM12 bil in its market capitalisation in under 90 days. The company reported a net profit decline of 34% to RM157.2 mil for Q1FY14.
PPB Group too is seeing significant decline in its share price, losing almost RM2.20 per share between mid-May and mid-July. The counter, nevertheless, has recovered slightly over the last week, ending July 31 at RM15. PPB's net profits for Q1FY14 fell 36% as its earnings per share (EPS) fell 40% to 12.17 sen.
Sime Darby is another plantation company trading mostly sideways since May, seemingly unable to breach the RM10 mark. Plantation companies are feeling the brunt of shaky investor confidence on declining CPO prices. Genting Malaysia, which saw quar
terly net profits falling 16% from Q1FY13, completes the seven.
While the remaining 23 KLCI constituents all recorded earnings that fell within analysts' expectations, their financial results still leave much to be desired as their earnings per share have not caught up with prices.
The average earnings and net profit growth of the "KLCI good performers" by analyst
ratings are just 8.8% and 18.7% respectively, excluding
' ' We find that the valuation of the stock market on the rich "de is base on nume us valuation metrics. Hence, it has been difficult to find attractivelypriced stocks to invest in."
- Tan Teng Boo
companies which saw exceptional one-off gains such as IOI Corp and SapuraKencana Petroleum.
Still in the case of SapuraKencana, its huge financial gain made early this year, from the inclusion of new businesses and contract wins, does not appear to have caught investors' attention. The counter is yet to see gains so far this year, painting a generic scenario for most of the remaining KLCI family.
Unlike some of the other financial institutions, Public Bank continued to wow investors after growing its net profits by a solid 5% to RM1.03 bil in its Q1FY14 and more recently, repeated that performance to post a 3.2% increase in net profit to RM1.06 bil for Q2 ended June 30. Since January, the counter has increased by RM1.60 per share, giving its market capitalisation a RM6.3 bil boost as at July 25.
In its Market Outlook Q3 2014 strategy report, BIMB Securities Research notes: "Though the going may be good at the moment, we continue to caution that outlook may not be as sturdy and could surprise if and when a downturn sets in. We expect market volatility to heighten since prevailing valuations are on a high side, thus any more step-up in market PE could only add to the local bourse's fragility."
"Whilst many may rejoice with the recent [KLCI) record closing, such a scenario would also provoke higher market volatility especially if corporate performance fails to match the runup. In fact, we believe investors are now more susceptible to the market vagaries hence market volatility will certainly heighten," the report adds.
The coupling of meagre earnings performance and relatively high valuations paint a less than desirable scenario for the KLCI moving forward, with little to expect in a proper fundamental push.
The KLCI's current conditions pose a harder challenge for investors seeking blue-chip stocks that provide worthwhile returns, thus causing them .to look outside of the blue chips for value stock picks. In fact, there is already significant indication that many of the non-blue-chip stocks are getting added attention from investors seeking better returns.
So far this year, the FBM 100 index has gained 1.2% as at end-July vs a lower 1% overall gain in the KLCI from last year's close.
Common wisdom has it that an active trading stance is the best strategy in this current market and that the more traditional "buy low, sell high" play may not always prove to be fruitful now. An active trading stance is where investors remain alert to changes in the market and make quick buy-sell decisions accordingly.
RHB Research head Alexander Chia tells FocusM: "We are advocating an 'accumulate on weakness' strategy. As large cap stocks are unattractively valued, we continue to be positive on small and mid-cap stocks," adding that individual stock-picking will be key to deriving value in this market.
Tan, too, gives indication of this, noting that the best investment decisions now really depend on each specific stock and its valuation.
Global fears On top of the performance of the local equity market, there are fears that current global developments could cast
,. Continues on pa,<le 12
....

KLCI may see upward bias in coming months on US and China growth "' From page 11 a long shadow on the Malaysian and regional markets as well as spook local and foreign investors.
Following failure to restructure and meet its debt payments, Argentina on July 30 descended into its third default in 25 years. Argentina, which is South America's second-largest economy, goes into another technical default with the last being in 2001, as its government refused to pay interest payments due to bondholders.
While all this sounds very bad, the fact remains that Argentina's default would probably not create much of a fuss in the global equity and bond markets.
Investors, Tan says, should not be taken aback as the developments taking place in Argentina are not expected to cause any harm to the Malaysia equity market.
"We do not see the Argentinian crisis affecting Malaysia's equity market. It is just that our stock market is rich in valuation," he says, pointing that developments in the US typically have stronger implications on the local market.
Interestingly, Argentine stocks don't appear to be flustered at all from the country's recent default. Argentina's benchmark Merval index fell only about 4% post-default and remains up 54% so far this year.
Investors jittery from the various geopolitical risks can find some relief in the many recent positive data coming out of the US. The US economic outlook is looking brighter with its latest quarter GDP growing by 4%. Signs on the ground are showing that the US is on a steady path to recovery and this will surely bode positively with Malaysia and other Asian indices.
A surge in activity across US industries, especially in the manufacturing and services
"We see emerging markets as less vulnerable than they were in 1997 as they have more flexible exchange rates, high forex reserves and smaller current account deficits," says Chia
sectors in July, is expected to put the economy on track for a strong second half of this year. Renewed home-buying activities are expected to also fuel the economy as consumers start spending on new homes.
"US economic recovery is sustainable and we see the US unemployment rate dropping further," says Tan.
"The problem is how the US Federal Reserve will normalise its monetary policy without disrupting the global equity markets. Fed chairman Janet Yellen has made the US monetary policy even more confusing and highly unpredictable and we have the New
York Stock Exchange already trading at a rich 20 times PE and the Nasdaq in a bubbly state," he adds. A big overhanging question this year has been the US monetary policy which has influenced global equity indices since the Fed started its quantitative easing programme.
Chia however views these developments more positively and maybe investors should too.
"We see emerging markets as less vulnerable than they were in 1997 as they have more flexible exchange rates, high forex reserves and smaller current account deficits . Hence, we are not expecting a crisis similar in magnitude to the 1997-1998Asian financial crisis.
"Markets are increasingly positive on the durability of the US recovery that will eventually have positive implications for global trade and growth. Expect some knee-jerk reaction from portfolio funds as expectations on the normalisation of US interest rates take hold, but medium-term market outlook remains positive," he says.
As it stands then, the KLCI could possibly see some upward bias in the coming months as key global economies like the US and China pick up pace. However, local market fundamentals and unsure investors could hamper the market until corporate earnings start showing proper substantial performance.
Most analysts and research houses remain neutral on most of the key sectors for the rest of this year, and as such do not expect any significant developments in the company financial and share performance of the sector's participants.
Non-blue chips shine In fact, most of the top stock picks by the research houses are non-KLCI constituents,
the likes of Dayang, TH Plantations, and Hartalega, among others. Ho Hup is another interesting stock picked by analysts with expected 48.5% total returns, given the counter's low PE .
Public Bank, in a recent market strategy commentary, takes note of a number of laggard mid and small-cap stocks which investors should look out for.
"Amongst the FBM 70 laggards perhaps worth looking out for are YTL Power International, Mudajaya, Kossan Rubber, DRB-Hicom, Pos Malaysia and Air Asia X [and] amongst the FBM Small Cap laggards perhaps worth looking out for are Can-One, Eversendai, Cypark Resources, ECM Libra Financial Group, Symphony Life and Puncak Niaga Holdings," the report notes .
Outlook The KLCI so far has traded neither here nor there in August, ending the first trading week up and down on different days, possibly as a tell-tale sign of the lil<ely fate of the KLCI for the remainder of this year.
Public Bank only targets a 2.5% upside to the main index for the remainder of this year and reiterates its year-end target at 1,920 points, the same as JF Apex Securities.
Analysts too don't expect to see significant gains from the index this year. JF Apex has revised its KLCI year-end target as it "doesn't expect much more upside," says Lee. MIDF lowered its target to just 1,900 points.
Still, the KLCI will surely pick up some pace towards the close of the year as global growth gains pace and if local blue-chip earnings catch up with valuations in the coming quarters. Nevertheless, any substantial gains in the main index are likely only after August. "August is normally a down period due to the summer holiday season," says Chia. ~