Worldwidetranslocationofteak … of landraces... · Central America was made in 1926 from Sri Lanka...
16
ORIGINAL ARTICLE Worldwide translocation of teak—origin of landraces and present genetic base Ole K. Hansen 1 & Suchitra Changtragoon 2 & Bundit Ponoy 3 & Juan Lopez 4 & John Richard 5 & Erik D. Kjær 1 Received: 11 September 2016 /Revised: 29 May 2017 /Accepted: 4 July 2017 /Published online: 17 July 2017 # The Author(s) 2017. This article is an open access publication Abstract Teak (Tectona grandis Linn. f.) is one of the major plantation timbers of the world. The species is native to India, Myanmar, Thailand and Laos in South East Asia but was translocated to several countries in Africa and Central and South America during the past century. Today, large areas of plantations are grown outside the species native range. It is speculated that genetic bottlenecks and founder effects com- bined with new selection pressures under new growing con- ditions have led to the formation of distinct landraces; this hypothesis is supported by results from international prove- nance tests. In the present study, we apply genetic markers to identify the likely origin of teak grown outside its native range and examine if the landraces show signs of reduced genetic diversity. We find large variation in the level of diversity among landraces, although not larger than that observed among native populations. We conclude that variation in the studied teak landraces probably reflects their areas of genetic origin rather than severe founder effects created during their introduction. The genetic data suggests that the studied land- races originated from either the semi-moist east coast of India, southern Myanmar or western Thailand. These results indicate that translocation of teak has mainly come from a certain part of the native distribution and that this did not include the widespread natural teak areas of southern, dry interior or west- ern India or northern Myanmar. Keywords Teak . Landraces . Genetic diversity . Geographic origin . Assignment tests Introduction Teak (Tectona grandis Linn. f.) is an outcrossing deciduous tree of the Lamiaceae family (The International Plant Names Index 2014). It has a large, partly discontinuous natural distri- bution area encompassing parts of India, Myanmar, Thailand and Laos (Kaosa-ard 1981). Teak is widely known and has an excellent reputation for wood quality, combining strength with lightness, durability, dimensional stability, non-corroding properties, ease of working and seasoning, termite, fungus, chemical, water and weather resistance and attractiveness (FAO 2009). At the current price of US$600–1000 per m 3 for high-quality logs and US$350–500 per m 3 for low- dimension plantation logs, teak is one of the most expensive major hardwoods in the world (FAO 2015). Today, the species is estimated to be planted in a total of 65 countries outside its native distribution (Koskela et al. 2014). The history of landrace formation in teak Teak was probably translocated outside its natural distribution range some 400 to 600 years ago, when it was naturalised in Java, Indonesia (Pandey and Brown 2000; Verhaegen et al. Communicated by Z. Kaya * Ole K. Hansen [email protected] 1 Department of Geosciences and Natural Resource Management, University of Copenhagen, Rolighedsvej 23, 1958 Frederiksberg C, Denmark 2 Forest and Plant Conservation Research Office, Department of National Parks, Wildlife and Plant Conservation, Bangkok, Thailand 3 Forest Research and Development Bureau, Royal Forest Department, Bangkok, Thailand 4 CAMCORE, Department of Forestry and Environmental Resources, North Carolina State University, Raleigh, NC, USA 5 The Tanzania Forestry Research Institute (TAFORI), Morogoro, Tanzania Tree Genetics & Genomes (2017) 13: 87 DOI 10.1007/s11295-017-1170-8
Transcript of Worldwidetranslocationofteak … of landraces... · Central America was made in 1926 from Sri Lanka...
ORIGINAL ARTICLE
Worldwide translocation of teak—origin of landraces and presentgenetic base
Ole K. Hansen1& Suchitra Changtragoon2
& Bundit Ponoy3 & Juan Lopez4 &
John Richard5& Erik D. Kjær1
Received: 11 September 2016 /Revised: 29 May 2017 /Accepted: 4 July 2017 /Published online: 17 July 2017# The Author(s) 2017. This article is an open access publication
Abstract Teak (Tectona grandis Linn. f.) is one of the majorplantation timbers of the world. The species is native to India,Myanmar, Thailand and Laos in South East Asia but wastranslocated to several countries in Africa and Central andSouth America during the past century. Today, large areas ofplantations are grown outside the species native range. It isspeculated that genetic bottlenecks and founder effects com-bined with new selection pressures under new growing con-ditions have led to the formation of distinct landraces; thishypothesis is supported by results from international prove-nance tests. In the present study, we apply genetic markers toidentify the likely origin of teak grown outside its native rangeand examine if the landraces show signs of reduced geneticdiversity. We find large variation in the level of diversityamong landraces, although not larger than that observedamong native populations. We conclude that variation in thestudied teak landraces probably reflects their areas of geneticorigin rather than severe founder effects created during their
introduction. The genetic data suggests that the studied land-races originated from either the semi-moist east coast of India,southernMyanmar or western Thailand. These results indicatethat translocation of teak has mainly come from a certain partof the native distribution and that this did not include thewidespread natural teak areas of southern, dry interior or west-ern India or northern Myanmar.
Keywords Teak . Landraces . Genetic diversity . Geographicorigin . Assignment tests
Introduction
Teak (Tectona grandis Linn. f.) is an outcrossing deciduoustree of the Lamiaceae family (The International Plant NamesIndex 2014). It has a large, partly discontinuous natural distri-bution area encompassing parts of India, Myanmar, Thailandand Laos (Kaosa-ard 1981). Teak is widely known and has anexcellent reputation for wood quality, combining strength withlightness, durability, dimensional stability, non-corrodingproperties, ease of working and seasoning, termite, fungus,chemical, water and weather resistance and attractiveness(FAO 2009). At the current price of US$600–1000 per m3
for high-quality logs and US$350–500 per m3 for low-dimension plantation logs, teak is one of the most expensivemajor hardwoods in the world (FAO 2015). Today, the speciesis estimated to be planted in a total of 65 countries outside itsnative distribution (Koskela et al. 2014).
The history of landrace formation in teak
Teak was probably translocated outside its natural distributionrange some 400 to 600 years ago, when it was naturalised inJava, Indonesia (Pandey and Brown 2000; Verhaegen et al.
Communicated by Z. Kaya
* Ole K. [email protected]
1 Department of Geosciences and Natural Resource Management,University of Copenhagen, Rolighedsvej 23, 1958 FrederiksbergC, Denmark
2 Forest and Plant Conservation Research Office, Department ofNational Parks, Wildlife and Plant Conservation, Bangkok, Thailand
3 Forest Research andDevelopment Bureau, Royal Forest Department,Bangkok, Thailand
4 CAMCORE, Department of Forestry and Environmental Resources,North Carolina State University, Raleigh, NC, USA
5 The Tanzania Forestry Research Institute (TAFORI),Morogoro, Tanzania
Tree Genetics & Genomes (2017) 13: 87DOI 10.1007/s11295-017-1170-8
2010 and references therein). Later plantations wereestablished in Sri Lanka (year 1680) (Perera 1962). InAfrica, the Germans introduced teak to Tanzania at the endof the nineteenth century using seed from Calcutta, India(Madoffe and Maghembe 1988). Later, before the FirstWorld War, many provenances of teak were introduced bythe German colonial administration, with seed sources beingfrom locations such as Tenasserim in southern Myanmar,Travancore in southern India and possibly also from Java(Wood 1967).
In 1902, teak was planted for the first time in Nigeria, withseed first from India and subsequently from Myanmar orThailand (Chollet 1958; Horne 1966). The species was intro-duced in Togo and Ghana in 1905 with seed from Nigeria(Chollet 1958) and in the Ivory Coast in 1926 with seed fromTogo (Tariel 1966).
In tropical America, the first pure teak plantations werestarted in 1913 in Trinidad and Tobago (Brooks 1941).This was based on seed from Tenasserim in Myanmar(Beard 1943, here after Keogh 1978), and in the next3 years, two additional seed lots were imported from thesame source (Moore 1966, here after Keogh 1978). Thiswould later become known as the Tenasserim-Trinidadstrain (Keogh 1978). Another important introduction inCentral America was made in 1926 from Sri Lanka (atthat time Ceylon) to Summit Gardens in Panama, wherea rather small seed lot produced offspring that was laterspread throughout the Panama Canal Zone and surround-ing countries. This strain was named the Ceylon-Panamastrain (Keogh 1978). Seed of these two above-mentionedstrains was widely distributed in the region. A third sig-nificant strain, introduced into Honduras from Trinidad in1927, probably originated in Myanmar, although not nec-essarily from the same place as the Tenasserim-Trinidadstrain (Keogh 1978).
Most of the early introductions mentioned abovewere on a pilot basis, with large-scale planting onlyinitiated more recently. However, the historical recordspresented above suggest that later upscaling of planta-tion forestry was often based on seed from the earlyintroductions. The introduction and domestication histo-ry combined with the diverse environmental conditionspresent in the new teak growing areas could obviouslyhave led to the formation of various landraces. This issupported by observations from international provenancetrials where some landraces were found to deviate sub-stantially in growth, stem form or early flowering frompopulations in the natural distribution area (Keidinget al. 1986). However, it has not been possible to testto what degree the landraces differ from their originalsource population because the genetic origin of thelandraces has been uncertain or imprecisely describedin almost all cases.
Present and future supply of teak
By the latest global assessment of teak resources, Kollert andCherubini (2012) estimated the area of natural teak forests inIndia, Myanmar, Thailand and Laos to be 29.04 million ha,while a conservative estimate of the teak plantation area wasset to 4.35 million ha. The latter presents a considerable in-crease from the former estimate from the mid-1990s of 2.25million ha (Pandey and Brown 2000). The teak plantationdistribution among regions is also changing. In 1995, about94% of global teak plantations were in tropical Asia; around4.8% (109,000 ha) were in tropical Africa, while only 1.5%(34,000 ha) were from tropical America and the Caribbean(Pandey and Brown 2000). Fifteen years later, Kollert andCherubini (2012) found the African share to constitute 11%of the total (470,000 ha) and the tropical American(Caribbean, Central and South America) share to be 6%(270,000 ha). At the same time, supplies of teak wood fromnatural forests have started to dwindle since the 1980s, mainlybecause of logging or log export bans in India, Laos andThailand (Kollert and Cherubini 2012). Moreover, high-input teak plantations have been developed since the late1980s, particularly in Latin America. Latin America will thusbecome increasingly important for plantation supply if thecurrent rate of expansion continues in this region (FAO 2009).
The recent complete map of global teak diversity
Although teak is one of the most important cultivated tropicalhardwoods (FAO 2009), studies describing the genetic patternacross the whole natural distribution area by use of DNAmarkers are sparse. Fofana et al. (2009) made the first attemptand found substantial genetic structure and differences amongthe native populations. However, this study was based on only166 individuals from 17 provenances and without any prove-nances from Myanmar. This latter point is important, sincealmost half of the remaining natural forests are found inMyanmar (Kollert and Cherubini 2012) and because historicalrecords suggest that Myanmar has been source for several ofthe first translocations of teak to Africa and America asdiscussed above. Recently, Hansen et al. (2015) completedthe first study of teak’s genetic structure comprising prove-nances from the total distribution area of the species, includingMyanmar. Using simple sequence repeat (SSR) markers on721 individuals from 29 provenances, a very strong geneticstructure was revealed, showing an overall Fst value of 0.23with population pairwise Fst values in the range 0.01–0.48. Atthe same time, large differences in the level of genetic diver-sity were observed in the different regions. In the eastern partof the distribution area (Myanmar, Thailand and Laos), astrong clinal decrease in diversity was observed towards theeast, where the average number of alleles of the southernMyanmar populations was around three times higher
87 Page 2 of 16 Tree Genetics & Genomes (2017) 13: 87

compared to the eastern Laos and Thai populations (Hansenet al. 2015). The findings draw attention to the importance ofthe genetic origin of native as well as planted teak, but thecomprehensive study also opens opportunities for the use ofso-called assignment methods, which are designed to deter-mine population membership for individuals or groups of in-dividuals using genetic information (Manel et al. 2005).During the last decades, these methods have been increasinglyused in wildlife forensic science applications (Ogden andLinacre 2015) including a range of studies that track illegaltimber trade of forest tree species (Tnah et al. 2010; Degenet al. 2013).
Objectives of the paper
The objectives of this paper are based on the above observa-tions that
& Teak has immense importance to global tropical plantationforestry
& Teak is widely used outside its natural distribution area,which may have led to the formation of distinct landracesoften characterised by unknown or imprecisely describedgenetic origin
& Future supply of teak timber will increasingly rely onplantations, many in tropical America and Africa
& Recent DNA technologies and studies have now made itpossible to trace the origin of various landraces and com-pare their level of genetic diversity
The specific objectives of this paper are to
1. Find the genetic origin of major landraces, with specialemphasis on tropical America
2. Compare the genetic diversity of the landraces, bothamong themselves but also to the diversity of their likelyorigin
For a subset of the landraces tested in field trials, we furtherwanted to investigate how the landraces perform compared topopulations of native origin.
Materials and methods
Plant material—landraces
Six populations from Africa, seven from Latin America andfour from Indonesia were included in the study. These 17populations were obtained from various sources, which inthe rest of this paper are collectively designated as landraces.Four were sampled as leaf material from a provenance trial inLonguza, Tanzania (Persson 1971; sampling location labelled
‘Longuza’ in Table 1). One represents a commercial seed lotfrom Tanzania (sampling location labelled ‘Tanzania’ inTable 1). Four populations, sampling location labelled‘FIP38’ in Table 1, were collected from the provenance trialat Pha Nok Kao in Thailand (trial no. 038), a part of theinternational series of teak provenance trials described byKeiding et al. (1986). Sampling of trees in the provenancetrials for the present study was done without any selection(consecutive remaining trees up to 31 individuals). An addi-tional six populations were shipped as seeds from commercialteak planting companies, which are members of Camcore, aninternational tree breeding and conservation programme withheadquarters at North Carolina State University (http://www.camcore.org; sampling location labelled ‘Camcore’ inTable 1). Seeds were collected separately from 30 (or 15)trees and germinated, and one seedling from each tree-seedlot was used for genotyping. Finally, two populations werecollected as leaf material from two commercial plantationsin Panama (sampling location labelled ‘IWC’ in Table 1).
Plant material—genetic reference populations
The 29 teak populations originating from the natural distribu-tion area and analysed by Hansen et al. (2015) using six SSRmarkers were used as a reference population to constitute a‘genetic map’ to which we could try to assign the landracesdescribed above. Further details about the origin and samplingof the 29 populations are given in Hansen et al. (2015) andreferences therein. Bayesian cluster analysis of the 29 popu-lations analysed by Hansen et al. (2015) resulted in three mainclusters and within those, six sub-clusters— the latter aredepicted together with the geographic origin of the 29 popu-lations in Fig. 1.
Laboratory work
DNA from the landraces was extracted from the leaf tissueusing any one of three methods: (1) the QIAGEN®(Germany) DNeasy Plant Mini Kit, (2) the QIAGEN®DNeasy 96 Plant Kit or (3) a modified version of the CTABmethod of Doyle and Doyle (1990). All individuals were ge-notypedwith six microsatellites developed by Verhaegen et al.( 2 0 0 5 ) : C IRAD1Te a kA06 , C IRAD1Te a kB03 ,CIRAD2TeakB07, CIRAD2TeakC03, CIRAD3TeakA11and CIRAD3TeakF01.
Genotyping of microsatellites took place in 10-μl PCRreactions using the QIAGEN® Multiplex kit (catalogue no.206143). PCR conditions followed the given standard multi-plex PCR protocol: 1× Multiplex master mix (providing afinal concentration of 3 mM MgCl2), 0.2 μM of each primerand around 20 ng of DNA sample with water added to makethe final reaction volume. Amplifications were carried out in aBio-Rad thermal cycler (model C1000) with the following
Tree Genetics & Genomes (2017) 13: 87 Page 3 of 16 87

thermal profile: 15 min of denaturation at 95 °C, followed by30 cycles of denaturation at 94 °C for 30 s, annealing at 58 °Cfor 90 s and extension at 72 °C for 60 s, with a final extensionstep at 60 °C for 30 min. Fragment sizes were determined onan ABI 3130XL genetic analyser and analysed with theGeneMapper software version 4.0 (Applied Biosystems).Genotyping of both genetic reference populations and land-races was done by the same methods on the same equipment.
Genetic diversity and structure
Genetic diversity in the landraces was estimated with the fol-lowing parameters: observed heterozygosity (Ho), expectedheterozygosity (He), number of observed alleles (Na), effec-tive number of alleles (Ne) and allelic richness calculated viararefaction (Na(rar)). The first four parameters were calculat-ed in GenAlEx vers. 6.5 (Peakall and Smouse 2006, 2012),and allelic richness was calculated in HP-Rare vers. 1.1(Kalinowski 2005). Na is the average number of observedalleles while Ne estimates the number of equally frequentalleles that it would take to achieve a given level of geneticdiversity in a panmictic population (usually less than the
actual number; Kimura and Crow 1964). Na(rar) is the num-ber of observed alleles corrected for the effects of sample sizethrough rarefaction, a correction that is important since largersample sizes are expected to sample more alleles than smallersamples (Kalinowski 2004). The fixation index, Fis (Hartl andClark 1997), was also calculated in GenAlEx.
To explore the genetic differentiation among the landraces,pairwise Fst values between populations were calculated inGenAlEx based on the framework of an analysis of molecularvariance (AMOVA; Excoffier et al. 1992). In addition to thistraditional measure of genetic differentiation, G″st values(Meirmans and Hedrick 2011) were calculated and tested withG-statistics in GenAlEx as an alternative estimator for popu-lation differentiation. The latter was developed specifically totake the high polymorphism of microsatellites into account,which otherwise may result in underestimation of the geneticdifferentiation (Hedrick 2005).
As a means of graphically illustrating the calculated geneticdifferentiation among landraces, while at the same time show-ing how differentiated the self-same landraces are to naturalpopulations from different regions of the natural distribution,pairwise G″st values were also calculated between all natural
Table 1 Landraces of teak included in the study
Landraceorigin
Populationabbreviation
Samplinglocation
Population name Latitude Longitude Elevation Assumed geneticorigina
Tanzania TAN_Kih Longuza Kihuhwi, Longuza (A) 5° 12 S 38° 39 E 200 Tenasserim, Myanmar
Tanzania TAN_Lon Tanzania Longuza 5° 12 S 38° 39 E 200 Tenasserim, Myanmar
Tanzania TAN_Mti Longuza Mtibwa (B) 6° 08 S 37° 38 E 460 Bigwa + others,Tanzania
Mozambique MOZ Camcore Gurue, Zambezia 15° 28 S 36° 59 E 6–700 Tea farmers (India)
Nigeria NIG Longuza Eastern Region-CentralNigeria (I)
10° N 8° E
Ivory Coast IVO FIP38 Bouake, Ivory Coast 7° 48 N 5° 07 W 310
Trinidad TRI_Har Longuza Mt. Harris (.C) 10° N 61° W Myanmar
Panama PAN_Rel IWC Relojera Delgado 8° 40 N 78° 02 W 83
Panama PAN_Los IWC Los Lagos 9° 11 N 78° 49 W Trinidad and Tobago
Guatemala GUA1 Camcore Tecales I 14° 15N
91° 29 W 60 Seed stand in CostaRica
Guatemala GUA2 Camcore Rancho Río Sis 14° 24N
91° 62 W 47 Seed stand in CostaRica
Venezuela VEN Camcore Cujicito 330 Trinidad
Colombia COL Camcore La Gloria 10° 01N
74° 12 W Trinidad + Colombia
Indonesia 3047 FIP38 Bangsri, Pati 6° 30 S 110° 48 E 75–100
Indonesia 3049 FIP38 Ngliron, Ngliron 7° 12 S 111° 22 E 150
Indonesia 3050 FIP38 Temandsang 7° 12 S 111° 22 E 104
Indonesia CAM_Indo Camcore Sumalindo Batu PutihPlantation
1° 24 118° 19 E 70–80
With regard to sampling locations, Longueza provenance trial in Longuza, Tanzania (Persson 1971), FIP38 international provenance trial in Pha NokKao in Thailand (trial no. 038) (Keiding et al. (1986). Camcore seed lots originating from commercial plantations facilitated through CAMCORE, IWCleaf material originating from commercial plantations facilitated through International Woodland Companya Based on historical records
87 Page 4 of 16 Tree Genetics & Genomes (2017) 13: 87

populations in the reference population and all 17 landraces.The resulting G″st value matrix with 46 columns/rows wasused as input to construct a neighbour-joining (NJ) tree(Saitou and Nei 1987); this was done in the TreeFit software(Kalinowski 2009), which also calculates the proportion ofvariance in the genetic distance matrix that is explained bythe tree (R2). The resultant tree was depicted in the graphicalviewer Dendroscope 3 ver. 3.5.7 (Huson and Scornavacca2012).
In an attempt to explore the origin of the 17 landraces, aBayesian cluster analysis was conducted using theSTRUCTURE software (version 2.3.4) (Pritchard et al.2000), whereby all genetic data from the populations originat-ing from both the natural distribution and from the landraceswas included. The USEPOPINFO model was used, wherebythe population origins of the 29 natural populations were usedto estimate the ancestry of populations of unknown origin (the17 landraces). Technically, this option is switched on in thefront end using the option BUpdate allele frequencies usingonly individuals with POPFLAG = 1^, located under theBAdvanced Tab^ (Pritchard et al. 2010) and where learning
samples are implemented using the PopFlag column in thedata file. The predefined population (the natural population)was used for those individuals for whom PopFlag = 1 (andwhose PopData is in (1…K)). The PopData value is ignoredfor individuals for whom PopFlag = 0. Ancestry of individualswith PopFlag = 0 is updated according to the admixture or no-admixture model, as specified by the user (Pritchard et al.2010). As in the analyses of natural populations by Hansenet al. (2015), two rounds of STRUCTURE analyses were run.The first one comprised data from all 46 populations (1166trees) and used the ‘no admixture ancestry’ model in combi-nation with the assumption of independent allele frequenciesamong populations, due to the strong genetic structure ob-served in the overall natural distribution area. In the secondround of STRUCTURE analyses, separate analyses were runon data sets comprising the populations from the main clustersresulting from the first round of STRUCTURE analysis. In thesecond round, the ‘admixture ancestry’ model combined withthe assumption of allele frequencies being correlated amongpopulations was applied, as the natural populations within themain clusters are geographically closer. In both rounds, ten
Fig. 1 Map showing the origin of the 29 natural populations of teakwhich constitute the reference population in the current study. The sixsub-clusters identified via cluster analysis by Hansen et al. (2015) are
depicted by colour coding. The dotted line indicates the approximateouter boundaries of the natural distribution of teak
Tree Genetics & Genomes (2017) 13: 87 Page 5 of 16 87

clustering runs were made for each K (from 1 to 8 in round 1;from 1 to 5 in round 2), each with a burn-in time and runlength of 100,000. To infer the true number of clusters (K),we used the deltaKmethod developed by Evanno et al. (2005)and the STRUCTURE HARVESTER software (Earl andvonHoldt 2012) to implement the method. As clustering inSTRUCTURE involves stochastic simulation, replicate clus-ter analysis of the same data may produce different solutions,due either to ‘label switching’ or ‘genuine multimodality’(Jakobsson and Rosenberg 2007). Consequently, we usedthe CLUMPP software (Jakobsson and Rosenberg 2007) toalign the outcome of the ten replicate cluster analyses with theidentified optimal number of clusters (K). The DISTRUCTsoftware (Rosenberg 2004) was used to illustrate the outcomeof this alignment.
Genetic assignment
Another approach to unravel the genetic origin of individualsor populations is to apply assignment tests, which are methodsdesigned to determine population membership for individuals(Guinand et al. 2002) based on multilocus genetic data, usingboth individual genotypes and population-level allele frequen-cies (Davies et al. 1999). Using the genetic data from the studyof teak populations covering the full range of the natu-ral distribution (Hansen et al. 2015) as an overall refer-ence population of 721 individuals, the 445 individualsfrom the 17 landraces were assigned to their most likelyorigin. This was done in the software GENECLASS2(Piry et al. 2004), and two different assignment methodswere applied: a frequency method developed by Paetkauet al. (1995) and a Bayesian method developed byRannala and Mountain (1997). Both methods includedsimulation of 1,000,000 individuals. We tested the as-signment power by performing a self-assignment: alltrees from the overall reference population (= knownorigin) were assigned to the most likely reference(sub)population according to their genotype. The indi-vidual to be assigned was excluded from its respective(sub)population during computations of assignmentcriteria (leave-one-out procedure; Efron 1983) to ensurecross-validation. An assignment score for each individ-ual was calculated based on the probability of that in-dividual belonging to the correct population, divided bythe sum of probabilities for the individual belonging toeach of the potential source populations. The mean val-ue of the scores from all individuals constitutes a so-called ‘quality index’ for the assignment procedure (Piryet al. 2004). Based on the percentage of correctly self-assigned individuals and the quality index of the self-assignment study, we evaluated the scale to determine towhich level the procedure allowed reliable assignment:clusters, sub-clusters or populations.
Genetic relatedness and inbreeding within landracesand natural populations
In order to investigate relatedness and inbreeding betweenindividuals within the landraces from the three regions(Latin America, Africa and Indonesia) and compare with therelatedness and inbreeding in the natural populations fromtheir most likely origin, analyses were performed in the soft-ware COANCESTRY version 1.0.1.5 (Wang 2011). The twolandraces Mozambique (MOZ) and 3047 were omitted fromthese analyses since they did not cluster together with theother landraces from Africa and Indonesia, respectively.Several relatedness estimators have been proposed, but nosingle estimator performs best in all situations as the rankorder of these estimators is marker data dependent and relieson the true relatedness being estimated or on the population’srelatedness structure (Wang 2011). Consequently,COANCESTRY offers the possibility to make a simulationusing the available marker data and test efficiency of sevendifferent estimators based on simulated individuals of knownrelationship (e.g. half-sibs). We did this with the SSR data forthe sub-cluster consisting of natural populations 3033, 3034and 3039 and the four populations from southern Myanmar,since most landraces appeared to originate from this region.Based on the simulations, we selected three relatedness esti-mators: the triadic likelihood estimator by Wang (2007)(TrioML), the moment estimator described in Ritland (1996)(Ritland) and the moment estimator given in Queller andGoodnight (1989) (QuellerGt). For the same pairs of groups,inbreeding coefficient (F) point estimates from the Ritlandestimator and from a moment estimator described by Lynchand Ritland (1999) were calculated. The difference in bothaverage relatedness and inbreeding coefficient betweengroups of natural populations and landraces was tested by apermutation procedure in COANCESTRY, using 100,000bootstraps.
Phenotypic data
We reanalysed published data from the series of internationalprovenance trials (Keiding et al. 1986): trials FIP038(Thailand) and FIP032 (Papua New Guinea) to compare theperformance of the landraces from Indonesia with populationsfrom the natural distribution, trial FIP022 (Mexico) to com-pare the performance of the landraces from Latin Americawith populations from the natural distribution and trialFIP008 (Ghana) to compare the performance of WestAfrican landraces with populations from the natural distribu-tion. We further used published results from Madoffe andMaghembe (1988) to compare the performance of EastAfrican landraces with natural populations in the Longuzatrial (Tanzania). We included data on average growth rate(basal area-weighted mean diameter) and persistence of main
87 Page 6 of 16 Tree Genetics & Genomes (2017) 13: 87
stem axis (related to stem form) assessed at age nine from theFIP trials (details in Keiding et al. 1986) and data on growthrate (basal area per ha) and stem straightness in the Tanzaniantrial (details in Madoffe and Maghembe 1988). Both axis per-sistence and stem straightness were scored on scales wherehigher values correspond to better stem quality. All trials wereestablished as replicated block trials, where significant differ-ences were found between the provenances. We compared theperformance of the landraces with natural populations basedon their mean performance. Four of the provenances in theMexican FIP022 trial had survival rates below 40% and weretherefore excluded from the comparison.
Results
Genetic diversity and differentiation of landraces
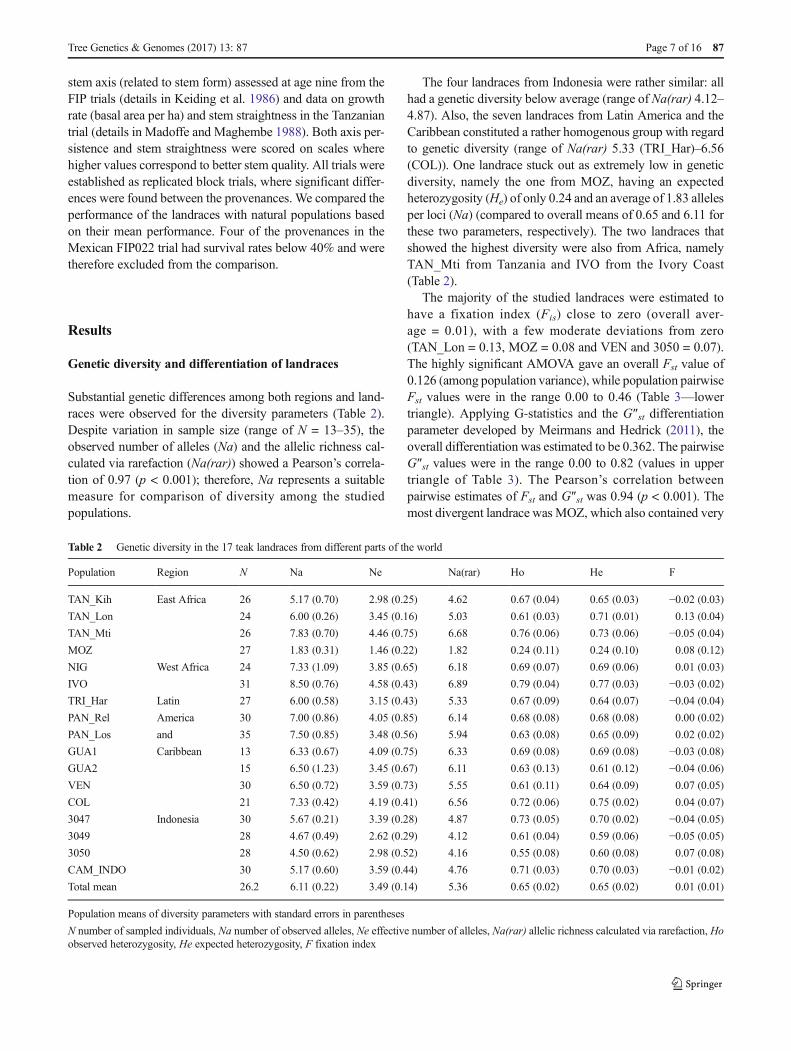
Substantial genetic differences among both regions and land-races were observed for the diversity parameters (Table 2).Despite variation in sample size (range of N = 13–35), theobserved number of alleles (Na) and the allelic richness cal-culated via rarefaction (Na(rar)) showed a Pearson’s correla-tion of 0.97 (p < 0.001); therefore, Na represents a suitablemeasure for comparison of diversity among the studiedpopulations.
The four landraces from Indonesia were rather similar: allhad a genetic diversity below average (range of Na(rar) 4.12–4.87). Also, the seven landraces from Latin America and theCaribbean constituted a rather homogenous group with regardto genetic diversity (range of Na(rar) 5.33 (TRI_Har)–6.56(COL)). One landrace stuck out as extremely low in geneticdiversity, namely the one from MOZ, having an expectedheterozygosity (He) of only 0.24 and an average of 1.83 allelesper loci (Na) (compared to overall means of 0.65 and 6.11 forthese two parameters, respectively). The two landraces thatshowed the highest diversity were also from Africa, namelyTAN_Mti from Tanzania and IVO from the Ivory Coast(Table 2).
The majority of the studied landraces were estimated tohave a fixation index (Fis) close to zero (overall aver-age = 0.01), with a few moderate deviations from zero(TAN_Lon = 0.13, MOZ = 0.08 and VEN and 3050 = 0.07).The highly significant AMOVA gave an overall Fst value of0.126 (among population variance), while population pairwiseFst values were in the range 0.00 to 0.46 (Table 3—lowertriangle). Applying G-statistics and the G″st differentiationparameter developed by Meirmans and Hedrick (2011), theoverall differentiation was estimated to be 0.362. The pairwiseG″st values were in the range 0.00 to 0.82 (values in uppertriangle of Table 3). The Pearson’s correlation betweenpairwise estimates of Fst and G″st was 0.94 (p < 0.001). Themost divergent landrace was MOZ, which also contained very
Table 2 Genetic diversity in the 17 teak landraces from different parts of the world
Population Region N Na Ne Na(rar) Ho He F
TAN_Kih East Africa 26 5.17 (0.70) 2.98 (0.25) 4.62 0.67 (0.04) 0.65 (0.03) −0.02 (0.03)TAN_Lon 24 6.00 (0.26) 3.45 (0.16) 5.03 0.61 (0.03) 0.71 (0.01) 0.13 (0.04)
TAN_Mti 26 7.83 (0.70) 4.46 (0.75) 6.68 0.76 (0.06) 0.73 (0.06) −0.05 (0.04)MOZ 27 1.83 (0.31) 1.46 (0.22) 1.82 0.24 (0.11) 0.24 (0.10) 0.08 (0.12)
NIG West Africa 24 7.33 (1.09) 3.85 (0.65) 6.18 0.69 (0.07) 0.69 (0.06) 0.01 (0.03)
IVO 31 8.50 (0.76) 4.58 (0.43) 6.89 0.79 (0.04) 0.77 (0.03) −0.03 (0.02)TRI_Har Latin 27 6.00 (0.58) 3.15 (0.43) 5.33 0.67 (0.09) 0.64 (0.07) −0.04 (0.04)PAN_Rel America 30 7.00 (0.86) 4.05 (0.85) 6.14 0.68 (0.08) 0.68 (0.08) 0.00 (0.02)
PAN_Los and 35 7.50 (0.85) 3.48 (0.56) 5.94 0.63 (0.08) 0.65 (0.09) 0.02 (0.02)
GUA1 Caribbean 13 6.33 (0.67) 4.09 (0.75) 6.33 0.69 (0.08) 0.69 (0.08) −0.03 (0.08)GUA2 15 6.50 (1.23) 3.45 (0.67) 6.11 0.63 (0.13) 0.61 (0.12) −0.04 (0.06)VEN 30 6.50 (0.72) 3.59 (0.73) 5.55 0.61 (0.11) 0.64 (0.09) 0.07 (0.05)
COL 21 7.33 (0.42) 4.19 (0.41) 6.56 0.72 (0.06) 0.75 (0.02) 0.04 (0.07)
3047 Indonesia 30 5.67 (0.21) 3.39 (0.28) 4.87 0.73 (0.05) 0.70 (0.02) −0.04 (0.05)3049 28 4.67 (0.49) 2.62 (0.29) 4.12 0.61 (0.04) 0.59 (0.06) −0.05 (0.05)3050 28 4.50 (0.62) 2.98 (0.52) 4.16 0.55 (0.08) 0.60 (0.08) 0.07 (0.08)
CAM_INDO 30 5.17 (0.60) 3.59 (0.44) 4.76 0.71 (0.03) 0.70 (0.03) −0.01 (0.02)Total mean 26.2 6.11 (0.22) 3.49 (0.14) 5.36 0.65 (0.02) 0.65 (0.02) 0.01 (0.01)
Population means of diversity parameters with standard errors in parentheses
N number of sampled individuals, Na number of observed alleles, Ne effective number of alleles, Na(rar) allelic richness calculated via rarefaction, Hoobserved heterozygosity, He expected heterozygosity, F fixation index
Tree Genetics & Genomes (2017) 13: 87 Page 7 of 16 87

low levels of diversity. The smallest pairwise Fst value forMOZ was 0.24 shared with CAM_INDO, and in general,MOZ was most similar to the landraces from Indonesia (range0.24–0.33) and Tanzania (range 0.31–0.35). Among the re-maining African landraces, we found TAN_Mti to be quitedifferentiated from the other two Tanzanian landraces. Thisfits well with the historical records of early import to EastAfrica from various sources spanning from Myanmar, Javaand/or Southern India. TAN_Kih and TAN_Lon are reportedto have the same genetic origin, while TAN_Mti is likely tohave a different genetic origin (Table 1). After the Africanlandraces, the four Indonesian landraces showed the largestwithin-region population differentiation (range 0.02–0.09 forpairwise Fst values) although the group still presents a rela-tively uniform cluster compared to the overall genetic differ-entiation (Fst = 0.126). The tested Latin American andCaribbean landraces represented a very uniform group (range
0.00–0.06 for pairwise Fst values) with several pairwise Fstvalues not statistically significant different from 0 (colourcoding in Table 3).
The above results are reflected in the NJ tree in Fig. 2. Thetree explained 76% of the variance in the matrix of pairwiseG″st values among the total of 46 available populations (land-races + natural populations). All of the seven landraces fromLatin America and the Caribbean are clustered closely togeth-er in the lower left corner, together with populations fromsouthern Myanmar. The landraces from Africa are scatteredbetween Thai and Lao origins but have no close relation to anyspecific natural population from the region. Three of the fourIndonesian landraces are positioned fairly closely within thetree. The Indonesian population 3047 seems to be more closelyrelated to some western Thai populations, yet the Indonesianlandraces are obviously closer to the Thai/Laotian group com-pared to India or Myanmar. None of the studied landraces were
Table 3 Pairwise differentiation among the 17 teak landraces
TAN_Kih TAN_Lon TAN_M� MOZ NIG IVO TRI_Har PAN_Rel PAN_Los GUA1 GUA2 VEN COL 3047 3049 3050 CAM_INDOTAN_Kih 0 0.00 0.27 0.59 0.32 0.13 0.45 0.44 0.39 0.31 0.44 0.49 0.36 0.05 0.21 0.22 0.12TAN_Lon 0.00 0 0.26 0.67 0.28 0.06 0.44 0.40 0.38 0.31 0.44 0.51 0.34 0.04 0.26 0.24 0.12TAN_M� 0.08 0.07 0 0.61 0.13 0.21 0.16 0.19 0.13 0.09 0.14 0.22 0.20 0.16 0.28 0.47 0.31MOZ 0.33 0.35 0.31 0 0.70 0.69 0.74 0.82 0.77 0.70 0.76 0.76 0.74 0.51 0.50 0.59 0.48NIG 0.10 0.08 0.03 0.37 0 0.24 0.09 0.01 0.02 0.05 0.06 0.13 0.13 0.26 0.42 0.62 0.43IVO 0.04 0.02 0.05 0.33 0.06 0 0.35 0.30 0.31 0.18 0.34 0.39 0.25 0.16 0.28 0.32 0.22TRI_Har 0.16 0.14 0.05 0.41 0.03 0.10 0 0.07 0.03 0.04 0.04 0.06 0.14 0.41 0.53 0.71 0.56PAN_Rel 0.14 0.12 0.06 0.43 0.00 0.08 0.02 0 0.00 0.01 0.03 0.06 0.14 0.42 0.53 0.72 0.57PAN_Los 0.13 0.12 0.04 0.41 0.01 0.09 0.01 0.00 0 0.01 0.00 0.07 0.16 0.36 0.48 0.68 0.54GUA1 0.10 0.09 0.03 0.41 0.01 0.05 0.01 0.00 0.00 0 0.01 0.04 0.08 0.27 0.38 0.60 0.44GUA2 0.15 0.14 0.04 0.46 0.02 0.10 0.01 0.01 0.00 0.01 0 0.06 0.19 0.39 0.47 0.70 0.57VEN 0.17 0.16 0.07 0.42 0.04 0.11 0.02 0.02 0.03 0.02 0.02 0 0.15 0.46 0.54 0.71 0.58COL 0.10 0.09 0.05 0.38 0.04 0.06 0.04 0.04 0.05 0.02 0.06 0.05 0 0.31 0.48 0.58 0.413047 0.02 0.01 0.04 0.26 0.08 0.04 0.13 0.13 0.12 0.08 0.13 0.15 0.08 0 0.20 0.27 0.083049 0.08 0.09 0.09 0.29 0.15 0.09 0.20 0.19 0.18 0.13 0.18 0.20 0.16 0.07 0 0.18 0.213050 0.08 0.08 0.15 0.33 0.21 0.10 0.26 0.25 0.25 0.21 0.27 0.26 0.18 0.09 0.07 0 0.12CAM_INDO 0.04 0.04 0.09 0.24 0.12 0.06 0.18 0.17 0.17 0.13 0.18 0.19 0.11 0.02 0.07 0.04 0
Pairwise Fst values calculated in the AMOVA in the lower triangle. PairwiseG″st values calculated in GenAlEx in the upper triangle in italics. Estimatescoloured yellow are not statistically significant on a 5% level; estimates coloured green are not statistically significant on a 1% level
Fig. 2 Neighbour-joining tree using the pairwise populationmatrix ofG″st values as input (genetic distance matrix). Populations from the naturaldistribution area are coloured as done in Hansen et al. (2015). Colourcode: yellow = India—dry interior, dark green = India—moist west coast,
magenta = India—semi moist east coast, light green =Myanmar—north-ern region, cyan = Myanmar—southern region, blue = Thailand,red = Laos, black = landraces
87 Page 8 of 16 Tree Genetics & Genomes (2017) 13: 87

found to be closely related to either populations from the dryinterior of India, the moist west coast of India or northernMyanmar: these regions constitute distinct groups in the lowerbranches of the tree (Fig. 2).
Clustering of landraces among native populations
The findings based on pairwise genetic differences were sup-ported by the Bayesian cluster analysis using STRUCTUREand comprising both the 17 landraces and the 29 natural pop-ulations. The STRUCTURE analysis revealed that the mostlikely number of clusters (K) was three, using the delta Kmethod (Evanno et al. 2005). Six of the 17 landraces, all fromLatin America and the Caribbean, distributed to cluster 2 (or-ange), encompassing the natural populations from the semi-moist east coast of India and southern Myanmar; seven land-races are admixtures of clusters 2 and 3 (blue) while the re-maining four landraces (three from Indonesia and the onefrom Mozambique) predominantly belonged to cluster 3(blue) comprising the natural populations from Thailand andLaos (Fig. 3). Only three landraces from Africa (TAN_Lon,NIG and IVO) and one from Latin America (COL) showedsmall indications of having part ancestry in cluster 1 (lightgreen), consisting of Indian populations from the dry interiorand the moist west coast, although predominantly all of theselandraces seem to originate from cluster 2 (Fig. 3).
In the second round of STRUCTURE analyses, separateanalyses were run on the populations from the main clustersresulting from the first round, though no second-round analy-ses were conducted for cluster 1, since no landraces clusteredwith these populations. The two main clusters (clusters 2 and3) used as starting points had slightly different compositionswith regard to natural populations than clusters 2 and 3 fromHansen et al. 2015 (see Fig. 1), since we here (correctly)assigned population 3036 from eastern India to cluster 1(and not cluster 2) and also (correctly) assigned population3039 from western Thailand to cluster 2 (and not cluster 3)(compare Figs. 1 and 3). Two sub-clusters were revealed with-in each of the main clusters (2 and 3) using the deltaKmethod.These four sub-clusters are depicted in Fig. 4. The main clus-ter 2 (from the first STRUCTURE analysis) separated into onesub-cluster consisting of the four northern Myanmar popula-tions (coloured light blue) and a second sub-cluster (colouredbrown) comprising of two populations from eastern India, onefrom west Thailand, four from southern Myanmar and 13landraces (Fig. 4a). Figure 4b illustrates the two sub-clustersfrom main cluster 3, where the first sub-cluster (coloured pur-ple) is made up by the most eastern of the natural Thai popu-lations plus the two Laotian populations, while the secondsub-cluster (coloured light pink/white) comprises two naturalpopulations more to the west in Thailand (3041 and 3042) andthe four Indonesian landraces. TheMozambique landrace alsofell into this eastern cluster. The results from the
STRUCTURE analyses were thus in good agreement withthe NJ tree based on G″st values (Fig. 2).
Assignment of landraces to likely population of origin
The fraction of correctly self-assigned individuals was 91.7%(661 individuals) when the reference population was split upinto three main STRUCTURE clusters using the Bayesianassignment method, while the corresponding result was53.7% (387 individuals) when individuals were self-assigned to the 29 individual populations (for the total com-parison of results from self-assignment, see Table 4).However, both correct self-assignment and quality index wereacceptable when based on the level of six sub-clusters(Table 4) and this scale also makes sense given the densityof the sampling of reference populations from the nativerange. We therefore decided to assign the 17 landraces at thislevel, and results from this assignment are presented inTable 5. The two different assignment methods gave verysimilar results; therefore, below, we only refer to the resultsof the Rannala and Mountain (1997) method.
All the African landraces, apart from the odd Mozambiquepopulation, had around 90% or more of their individualsassigned to the sub-cluster consisting of natural populationsfrom north-eastern India, west Thailand and southernMyanmar (C2_SC1). For the landraces from Latin Americanand the Caribbean, the picture was even clearer; in all sevenlandraces, 100% of the individuals were assigned to this sub-cluster.
The four Indonesian landraces showed a mixed pattern,with 87% of the individuals in 3047 assigned to the easternIndia, west Thailand and southern Myanmar (C2_SC1), whileindividuals from 3049 were assigned exactly 50:50 betweenC2_SC1 and C3_SC2, the latter consisting of two natural Thaipopulations (3041 and 3042). For 3050, the majority of indi-viduals (68%) were assigned to C3_SC2, while forCAM_INDO, 57% were assigned to C2_SC1. Overall, thereis a high degree of correspondence between the assignmenttests and the STRUCTURE results. The only landrace thatseems to provide a slightly different result between thesetwo approaches is CAM_INDO, which in STRUCTUREgrouped predominantly with the main cluster 3 (Thailandand Laos), while in assignment tests was placed in the south-ern Myanmar and east Indian sub-cluster C2_SC1.
Levels of relatedness within populations
Results from the comparative analysis of within-populationrelatedness and inbreeding coefficients between landracesfrom the three regions (Latin America, Africa and Indonesia)and the natural populations from the distribution area wherethe landraces were assigned are seen in Fig. 5.
Tree Genetics & Genomes (2017) 13: 87 Page 9 of 16 87

In the upper three panels of the figure, a comparison ofrelatedness within natural populations with relatedness withinlandraces from the three non-indigenous regions is presented.In the lower three panels, the inbreeding coefficients are com-pared for the same populations and landraces. For the com-parison of landraces from Latin America and the Caribbean
Fig. 4 Results from second round of STRUCTURE analyses. Since nolandraces were clustered together with the populations from the dryinterior and moist west coast of India (main cluster 1), no second roundof analysis was made for these populations. Within the two remainingmain clusters, two sub-clusters were identified in each. Graphs a and bshow ten replicate cluster analyses for K = 2 which have been aligned inCLUMPP
�Fig. 3 Results from STRUCTURE analysis with K = 3 clusters, wherethe ten replicate cluster analyses have been aligned in CLUMPP. Each of46 populations (1166 trees in total) is represented with a horizontal bar.Vertical height of the bar represents the number of trees in the population(range 10–35). The first 29 populations (from above) are naturalpopulations—the last 17 are landraces. For each population, anestimated cluster membership coefficient is shown; bar colours indicatethe clusters: (1) light green = India—dry interior and moist west coast, (2)orange = India—semi-moist east coast and Myanmar and (3)blue = Thailand and Laos
87 Page 10 of 16 Tree Genetics & Genomes (2017) 13: 87

and from Africa with natural populations from sub-clusterC2_SC1 (southern Myanmar and east India), which is thenatural distribution area where they all seem to originate, thereis a statistically significant trend of higher relatedness withinthe landraces for all three estimators. The only exception is for
the QuellerGt estimator in the Africa comparison; however,this is non-significant. In the case of the Indonesian landraces(rightmost upper panel in Fig. 5), the trend seems opposite,with statistically higher relatedness in the natural populationsfor two of the estimators, while the difference was non-significant for the last estimator (TrioML). However, thiscomparison is based on only two natural populations in thesub-cluster C3_SC2 (3041 and 3042) and only three landraces(3049, 3050 and CAM_INDO).
In the comparison of the inbreeding coefficient (F) (lowerthree panels in Fig. 5), the trend is a higher F in the naturalpopulations compared with the landraces from all three re-gions (except for LynchRD in the Africa comparison). Allthe differences are non-significant but are based on a muchlower number of data points (individuals’ F vs. thousands ofdyads).
Performance of the landraces
The results from the five trials consulted in the present studyare presented in Fig. 6 where performance in relation to stemform is plotted against growth data. In the Mexican trial, largevariation was observed among the Latin American landracesin both growth and stem quality, with landraces presentingboth good- and poor-performing provenances compared with
Table 5 Results from assignment of 445 teak trees from 17 landraces to six genetic sub-clusters identified in the natural distribution range of teak
Rannala and Mountain (1997) Paetkau et al. (1995)
C1_SC1 C1_SC2 C2_SC1 C2_SC2 C3_SC1 C3_SC2 C1_SC1 C1_SC2 C2_SC1 C2_SC2 C3_SC1 C3_SC2
TAN_Kih 0 0 96 0 0 4 0 0 92 0 0 8
TAN_Lon 0 0 92 0 0 8 0 4 92 0 0 4
TAN_Mti 0 0 96 0 0 4 0 0 96 0 0 4
MOZ 0 0 37 0 0 63 0 0 37 0 0 63
NIG 4 0 92 0 0 4 4 0 92 0 0 4
IVO 3 7 87 0 0 3 6 3 84 3 0 3
TRI_Har 0 0 100 0 0 0 0 0 100 0 0 0
PAN_Rel 0 0 100 0 0 0 0 0 100 0 0 0
PAN_Los 0 0 100 0 0 0 0 0 100 0 0 0
GUA1 0 0 100 0 0 0 0 0 100 0 0 0
GUA2 0 0 100 0 0 0 0 0 100 0 0 0
VEN 0 0 100 0 0 0 0 0 100 0 0 0
COL 0 0 100 0 0 0 0 0 100 0 0 0
3047 0 0 87 0 0 13 0 0 87 0 0 13
3049 0 0 50 0 0 50 0 0 50 0 0 50
3050 0 7 25 0 0 68 0 4 25 0 0 71
CAM_INDO 0 3 57 0 0 40 0 3 53 0 0 43
Results from two different assignment methods are given as percentages of the trees from each landrace assigned to the different sub-clusters. C1_SC1corresponds to sub-cluster 1 in main cluster 1
C1_SC1 3002, 3007, 3008, 3013, C1_SC2 3016, 3018, 3019, 3020, 3021, TAN_Coi, 3036, C2_SC1 3033, 3034, MY_PMUA, MY_AUA, MY_LUA,MY_TUA, 3039, C2_SC2MY_BUA, MY_IUA, MY_MUA, MY_PLUA, C3_SC1 3038, 3043, SN0133, 3055, 3057, C3_SC2 3041, 3042
Table 4 Results from self-assignment of 721 teak trees from 29 naturalpopulations in relation to different levels of entities in the reference pop-ulation as well as to two different assignment methods
No. ofentities in thereferencepopulation
Assignmentmethod
No. ofindividualscorrectlyself-assigned
Percentage ofindividualscorrectly self-assigned (%)
Qualityindexa
(%)
3 mainclusters
Bayesian 661 91.7 89.65
6 sub-clusters Bayesian 576 79.9 77.56
29 separatepopula-tions
Bayesian 387 53.7 42.41
3 mainclusters
Frequency 669 92.9 88.77
6 sub-clusters Frequency 560 77.7 70.34
29 separatepopula-tions
Frequency 366 50.8 30.47
a See the BMaterials and methods^ section or Piry et al. (2004) fordefinition
Tree Genetics & Genomes (2017) 13: 87 Page 11 of 16 87

the natural populations (Fig. 6a). The Indonesian/Papua NewGuinean landraces tested in the Thai and Papua New Guineantrials were among the fastest-growing landraces but displayedaverage or below average stem quality (Fig. 6b, c). The locallandraces tested in the trial in Ghana were among the slowest-growing landraces and particularly had lower stem qualitycompared with provenances from the natural populations(Fig. 6d). Still, the Indonesian landraces were among thefastest-growing landraces in this trial. Finally, the eastAfrican landraces in the Tanzanian trial were fast growingwith good quality compared with the natural populations, al-though a single provenance from moist west India(Coimbatore) was the best performing (Fig. 6e).
Discussion and conclusions
In the present study, we used the first ‘global genetic referencemap’ made by Hansen et al. (2015) to infer the likely genetic
origin of major landraces, with special emphasis on tropicalAmerica, and we compared the genetic diversity among land-races to the diversity levels present in natural populations fromtheir likely origin.
We found that of 17 investigated landraces fromIndonesia, Africa and tropical America, the majoritymost likely originated from southern Myanmar orsemi-moist east coast of India; the genetic analysis sug-gests only some of the Indonesian landraces to have alikely origin further east in Thailand.
These findings fit well with the historical records ofTenasserim (southern Myanmar) and Java as likely originsto East African landraces. The Tanzanian Kihuhwi source(TAN_Kih) is genetically very similar to the western Java(3047) plantation, while the Mtibwa plantation (TAN_Mti)is more genetically similar to the native Pyinmana teak forest(MY_PMUA; approximately 300 km north of Yangon, butstill in the Southern Myanmar cluster) (Fig. 2). However, wefind no signs of the Travancore (southern India) origin
Fig. 5 Results from comparative analysis of within-population related-ness and inbreeding coefficient between landraces and the natural popu-lations from the distribution area where the landraces were assigned.Upper three panels: comparison of relatedness among individuals within
populations. Lower three panels: comparison of inbreeding coefficientwithin populations. The difference in relatedness and inbreeding coeffi-cient between natural populations and landraces was tested by 100,000bootstraps
87 Page 12 of 16 Tree Genetics & Genomes (2017) 13: 87

mentioned inWood (1967) as a potential source for Tanzanianlandraces.
The seven landraces from Central America were genetical-ly quite similar to each other and to the native Letpadan teakforest (MY_LUA; approximately 120 km north-west ofYangon) (Fig. 2). The results support that they originate froma limited number of introductions of teak into Central Americain the beginning of the twentieth century with Myanmar as animportant source (both a Tenasserim strain and an additionalimport fromMyanmar) as suggested by Keogh (1978). Keogh(1978) also highlights a potential important introduction toCentral America (through Panama) based on an original col-lection from trees in a botanical garden in Sri Lanka. We haveno knowledge of the genetic origin of the trees in the botanicalgarden, but teak is not native to Sri Lanka and one can there-fore speculate that the southern Indian teak forest has been thelikely source due to geographic proximity to Sri Lanka.However, our genetic study reveals no signs of the south
Indian cluster in the analysed Central American landraces.We cannot exclude that the studied Central American plant-ings originate from this route, because trees in the Sri Lankabotanical garden could have been grown from seed collectedfrom trees growing somewhere in the east India-southMyanmar cluster. The most likely origin of the two WestAfrican plantations in the present study was also the eastIndia-south Myanmar cluster, where the sample fromNigeria clustered out with the Central American landraces,while the Ivory coast seemed more similar to the Tanzanianlandraces (Fig. 2). Interestingly, none of the studied landracesseem to have originated from the natural distribution of teak insouthern or western India or from northern Myanmar.
A few other studies have dealt with the genetic origin ofteak landraces. The findings of the present study are generallyin concordance with results from Verhaegen et al. (2010).Their analysis supported that the African teak mainly origi-nates from northern India, which is not contradictory to our
Fig. 6 Variation in average stem form and growth rate among variouslandraces and natural origins in five provenance trials. aMexico, IP022. bPapua New Guinea (PNG), IP032. c Thailand, IP038. d Ghana, IP008. e
Tanzania, Longuza. High values of persistence/straightness refer to supe-rior stem form. Based on data from Keiding et al. (1986) (a–d) andMadoffe and Maghembe (1988) (e)
Tree Genetics & Genomes (2017) 13: 87 Page 13 of 16 87

findings, but they had fewer natural reference populations andno populations fromMyanmar. Verhaegen et al. (2010) furtherdeduced that the Indonesian teak, of which three landraces arethe same as in our study (3047, 3049 and 3050), is closelylinked to central Laos or eastern Thailand. Our results placethe origin of Indonesian teak further west in north-westernThailand. One Indonesian landrace (3047) is even assignedto the north Indian/south Myanmar sub-cluster. Our analysisassigned 13 landraces to the sub-cluster composed of two east-Indian, four south-Myanmar and one west-Thai populations,but the analysis could not reveal if they were most likely tooriginate from India or Myanmar/western Thailand. In a sim-ilar way, Huang et al. (2015) used a provenance trial in southChina to try to determine the genetic relationships between 18natural populations from four different countries and ten in-troduced provenances, of which the majority of the latter hadbeen planted in China without any record of their origins.Their analyses revealed that the introduced provenances hadprobable origins in Laos, Thailand or Myanmar, while therewas no sign of a genetic relationship with the four naturalpopulations from India that were included in the study. Theissue regarding the genetic origin of teak takes on a new di-mension when plantations are established within the naturalrange of the species. Recently, DNA marker studies of teak inMyanmar (Minn et al. 2014; Thwe-Thwe-Win et al. 2015)revealed substantial variation in genetic diversity and geneticstructure within the large and extensive teak area in the coun-try. Teak planting in Myanmar was initiated in the 1700s, butuntil 2007, it was conducted by governmental institutionsusing native seed from Myanmar (Thwe-Thwe-Win et al.2016). Since 2007, private companies have establishedlarge-scale teak plantations in Myanmar using both nativeseed and seed introduced from Indonesia and China, for ex-ample. Thwe-Thwe-Win et al. (2016) compared the geneticdiversity of some of these young plantations with the naturalpopulations and found that the genetic composition of planta-tions was often substantially different from the nearby naturalpopulations. They further found that some of the plantationsbased on exotic seed had markedly lower genetic diversitythan the native populations. Both phenomena may pose apotential threat to the genetic diversity and structure that con-stitute the genetic resource of teak in Myanmar (Thwe-Thwe-Win et al. 2016).
The overall genetic differentiation among the 17 landraces(Fst value of 0.126) in the present study is considerably small-er than the overall Fst value of 0.227 among natural popula-tions found by Hansen et al. (2015) for the entire distributionarea. The result reflects that even though landraces are foundon different continents, they mainly originate from a certainpart of teak’s natural distribution area, as revealed in the pres-ent study from the NJ tree (based on pairwise G″st values),STRUCTURE analysis and assignment tests. According toour analysis, none of the 17 landraces were thus related to
populations from the dry interior of India, the moist west coastof India or northern Myanmar.
Various international provenance trials have shown thata number of economically important quality parameters ofplantation grown teak timber depend on the genetic ori-gin: growth rate, stem form, branch size, epicormicbranching, amount of heartwood, wood quali ty,buttressing, survival and health (Kjær et al. 1995; Kjæret al. 1999; Goh et al. 2013a). It is therefore important tounderstand the genetic base available for plantingprogrammes. Our study, in combination with previousstudies (Verhaegen et al. 2010; Huang et al. 2015;Thwe-Thwe-Win et al. 2015), seems to indicate thatIndian teak is not widely used outside India.
Differences in genetic diversity among landraces wereobse rved , bu t on ly one l and r ace f rom Af r i c a(Mozambique) showed very low genetic diversity, indicat-ing a major bot t leneck. The seed col lect ion inMozambique was conducted at a small plantation withlow stocking, where a distance of 100 m between selectedtrees could not be maintained. The possibility of relatedmating within the small population of unknown origin is adistinct possibility. Overall, the findings suggest that var-iation in diversity levels among teak landraces in generalreflects their relative areas of genetic origin rather thansevere founder effects created during their introductionsfrom Asia to Africa and the Americas.
The average diversity level He = 0.64 and Na = 6.7 for theseven Central America landraces in our study is only slightlysmaller compared with the levels He = 0.68 and Na = 7.5found for the natural population in southern Myanmar(Table 3 in Hansen et al. 2015), which are the areas we hereidentify as the likely origin of these landraces. As anotherexample, the three Tanzanian landraces actually had a higherdiversity level (average of He = 0.70 and Na = 6.3) comparedto the average level for natural populations in Thailand(He = 0.52 and Na = 4.3) and Laos (He = 0.35 andNa = 2.6) reported by Hansen et al. 2015.
The comparisons of within-population relatedness andinbreeding between landraces and natural populationsfrom the putative geographic origin of the very same land-races gave no clear results. This may be due to the factthat it is questionable whether the clusters from the genet-ic STRUCTURE analysis of the natural populations canbe regarded as true reference populations. However, therewas a tendency that some of the landraces—especially theones from Latin America—had a higher relatedness –which theoretically fits well with the historical recordsclaiming that only few introductions of teak have beenmade to this part of the world. On the contrary, the overalltendency—although not statistically significant—was thatthe inbreeding coefficient was higher within the naturalpopulations compared to the landraces.
87 Page 14 of 16 Tree Genetics & Genomes (2017) 13: 87

Large potential exists for the improvement of timber qual-ity through breeding (Kjær and Foster 1996; Goh et al.2013b), but it is important to build breeding programmeson genetically healthy and diverse plant material. It istherefore an important finding that the major landraces,in general, seem to be genetically diverse and not to havesuffered from severe bottlenecks during their transloca-tion. The international provenance trials tend to supportthat major landraces often represent healthy and viableseed sources: our survey of results from the five trialsshowed that the landraces were generally fast growingand have good survival rates, despite some of the westAfrican landraces revealing low stem quality. Still, singleplantations or even planting programmes may originatefrom seed collected on few trees and negative selectionfor early flowering could easily have occurred at earlierstages. It is therefore important to mobilise a suitable anddiverse founder population at the national or regional lev-el when initiating domestication programmes.
The present study only represents a small sample of thelandraces that may have developed in the many teak-growing regions worldwide. However, we trust that the find-ings have contributed new important information to the gen-eral understanding of the origin of landraces in teak. Also, wehope that the results from the study can be used in future moredetailed studies of the diversity, genetic quality and dynamicsof domesticated teak outside its natural distribution area.
Acknowledgments We are grateful to Lars Schmidt for having con-ducted some of the field sampling in the provenance trial in Longuza,Tanzania. We would also like to thank Mr. Wiroj and his staff from theRoyal Forest Department for excellent help during the collection of leafsamples in the field trial in Pha Nak Khao, Thailand. At the same time,our thanks go to Nutthakorn Semsantud and Verapong Suangtho forinvaluable help with logistics and collection in Thailand. We further ac-knowledge the contribution of the different members of CAMCOREwhoprovided us with samples of landraces from Latin America, Indonesia andAfrica. The International Woodland Company (IWC) supplied us withsamples from their two plantations in Panama. During the various steps ofseed handling, germination and genotyping, we had good help of KristinMarie Lassen, Kirstine Bräuner Nielsen and Jesper Vind. This researchwas supported by the Danish International Development Agency(Danida), and the final steps of analyses and publishing of the resultswere supported by the GB Hartmann Family Foundation. Finally, weacknowledge the comments from three anonymous reviewers which im-proved the final version of this manuscript.
Data archiving statement The data—consisting of genotypic data forsix SSRs in 721 individuals from 29 provenances as well as in 445individuals from the 17 landraces—will be archived in Dryad (http://datadryad.org/).
Open Access This article is distributed under the terms of the CreativeCommons At t r ibut ion 4 .0 In te rna t ional License (h t tp : / /creativecommons.org/licenses/by/4.0/), which permits unrestricted use,distribution, and reproduction in any medium, provided you give appro-priate credit to the original author(s) and the source, provide a link to theCreative Commons license, and indicate if changes were made.
References
Beard JS (1943) The importance of race in teak, Tectona grandis L.Caribb Forester 4(3):135–139
Brooks RL (1941) Notes on pure teak plantations in Trinidad. CaribbForester 3(1):25–28
Chollet MA (1958) Le teck au Togo. Bois For Trop 49:9–18Davies N, Villablanca FX, Roderick GK (1999) Determining the source
of individuals: multilocus genotyping in nonequilibrium populationgenetics. Trends Ecol Evol 14:17–21
Degen B, Ward SE, Lemes MR, Navarro C, Cavers S, Sebbenn AM(2013) Verifying the geographic origin of mahogany (Swieteniamacrophylla King) with DNA-fingerprints. Forensic Sci Int Genet7:55–62
Doyle JJ, Doyle JL (1990) Isolation of plant DNA from fresh tissue.Focus 12:13–15
Earl DA, vonHoldt BM (2012) STRUCTURE HARVESTER: a websiteand program for visualizing STRUCTURE output andimplementing the Evanno method. Conserv Genet Resour 4:359–361
Efron B (1983) Estimating the error rate of a prediction rule—improve-ment on cross-validation. J Am Stat Assoc 78:316–331
Evanno G, Regnaut S, Goudet J (2005) Detecting the number of clustersof individuals using the software STRUCTURE: a simulation study.Mol Ecol 14:2611–2620
Excoffier L, Smouse PE, Quattro JM (1992) Analysis of molecular var-iance inferred from metric distances among DNA haplotypes—ap-plication to human mitochondrial-DNA restriction data. Genetics131:479–491
FAO (2009) The future of teak and the high-grade tropical hardwoodsector. Planted Forests and Trees Working Paper FP/44E.Accessed on http://www.fao.org/docrep/012/k6549e/k6549e00.pdf
FAO (2015) Global teak trade in the aftermath of Myanmar’s log exportban by Kollert W & Walotek PJ Planted forests and trees workingpaper FP/49/E. Rome, Italy (available at http://www.fao.org/forestry/plantedforests/67508@170537/en/)
Fofana IJ, Ofori D, Poitel M, Verhaegen D (2009) Diversity and geneticstructure of teak (Tectona grandis L.f) in its natural range usingDNA microsatellite markers. New For 37:175–195
Goh DKS, Bacilieri R, Chaix G, Monteuuis O (2013a) Growth variationsand heritabilities of teak CSO-derived families and provenancesplanted in two humid tropical sites. Tree Genet Genomes 9(5):1329–1341
Goh DKS, Japarudin Y, Alwi A, Lapammu M, Flori A, Monteuuis O(2013b) Growth differences and genetic parameter estimates of 15teak (Tectona grandis L.f.) genotypes of various ages clonally prop-agated by microcuttings and planted under humid tropical condi-tions. Silvae Genet 62:196–206
Guinand B, Topchy A, Page KS, Burnham-Curtis MK, Punch WF,Scribner KT (2002) Comparisons of likelihood and machine learn-ing methods of individual classification. J Hered 93:260–269
Hansen OK, Changtragoon S, Ponoy B, Kjær ED, Minn Y, Finkeldey R,Nielsen KB, Graudal L (2015) Genetic resources of teak (Tectonagrandis Linn. f.)—strong genetic structure among natural popula-tions. Tree Genet Genomes 11:802
Hartl DL, Clark AG (1997) Principles of population genetics, 3rd edn.Sinauer Associates, Inc., Sunderland
Hedrick PW (2005) A standardized genetic differentiation measure.Evolution 59:1633–1638
Horne JEM (1966) Teak in Nigeria. Nigerian information bulletin (NewSeries) No. 16
Huang GH, Liang KN, Zhou ZZ, Xu JM, Ma HM (2015) Genetic vari-ation and origin of teak (Tectona grandis L.f.) native and introducedprovenances. Silvae Genet 64:33–46
Tree Genetics & Genomes (2017) 13: 87 Page 15 of 16 87

Huson DH, Scornavacca C (2012) Dendroscope 3: an interactive tool forrooted phylogenetic trees and networks. Syst Biol 61:1061–1067
Jakobsson M, Rosenberg NA (2007) CLUMPP: a cluster matching andpermutation program for dealing with label switching andmultimodality in analysis of population structure. Bioinformatics23:1801–1806
Kalinowski ST (2004) Counting alleles with rarefaction: private allelesand hierarchical sampling designs. Conserv Genet 5:539–543
Kalinowski ST (2005) HP-RARE 1.0: a computer program forperforming rarefaction on measures of allelic richness. Mol EcolNotes 5:187–189
Kalinowski ST (2009) How well do evolutionary trees describe geneticrelationships among populations? Heredity 102:506–513
Kaosa-ard A (1981) Teak (Tectona grandis L.f.)—its natural distributionand related factors. Nat Hist Bull Siam Soc 29:55–74
Keiding H, Wellendorf H, Lauridsen EB (1986) Evaluation of an inter-national series of teak provenance trials. Danida Forest Seed Centre,Humlebæk
Keogh RM (1978) Teak (Tectona grandis) provenances of the Caribbean;Central America; Venezuela and Colombia. Unpublished. Originaldocument at FAO headquarters, Rome. 16 p
Kimura M, Crow JF (1964) Number of alleles that can be maintained infinite population. Genetics 49:725–738
Kjær ED, Foster GS (1996) The economics of tree improvement of teak(Tectona grandis L.).Technical Note no 43. TheWorld Bank/DanidaForest Seed Centre. DK-3050 Humlebæk. Denmark. ISSN 0902–3224, p. 22
Kjær ED, Lauridsen EB, Wellendorf H (1995) Second evaluation of aninternational series of teak provenance trials. Danida Forest SeedCentre, Humlebæk 117p
Kjær ED, Kajornsrichon S, Lauridsen EB (1999) Heartwood, calciumand silica content in five provenances of teak (Tectona grandis L.f.). Silvae Genet 48:1–3
Kollert W, Cherubini L (2012) Teak resources and market assessment2010. FAO Planted Forests and Trees Working Paper FP/47/E,Rome. Available at http://www.fao.org/3/a-an537e.pdf. (AccessedFebruary 1 2016)
Koskela J, Vinceti B, Dvorak W, Bush D, Dawson IK, Loo J, Kjaer ED,Navarro C, Padolina C, Bordács S, Bordacs S, Jamnadass R,Graudal L, Ramamonjisoa L (2014) Utilization and transfer of forestgenetic resources: a global review. For Ecol Manag 333:22–34
Lynch M, Ritland K (1999) Estimation of pairwise relatedness with mo-lecular markers. Genetics 152:1753–1766
Madoffe SS, Maghembe JA (1988) Performance of teak (Tectona grandisL.f.) provenances seventeen years after planting at Longuza,Tanzania. Silvae Genet 37:175–178
Manel S, Gaggiotti OE, Waples RS (2005) Assignment methods:matching biological questions with appropriate techniques. TrendsEcol Evol 20:136–142
Meirmans PG, Hedrick PW (2011) Assessing population structure: F(ST)and related measures. Mol Ecol Resour 11:5–18
Minn Y, Prinz K, Finkeldey R (2014) Genetic variation of teak (Tectonagrandis Linn. f.) in Myanmar revealed by microsatellites. TreeGenet Genomes 11:802
Moore D (1966) The formation of teak plantations by the Group PlantingSystem. Proceedings of the 6th World Forestry Congress, Vol. II,Madrid
Ogden R, Linacre A (2015) Wildlife forensic science: a review of geneticgeographic origin assignment. Forensic Sci Int Genet 18:152–159
Paetkau D, Calvert W, Stirling I, Strobeck C (1995) Microsatellite anal-ysis of population structure in Canadian polar bears. Mol Ecol 4:347–354
Pandey D, Brown C (2000) Teak: a global overview. Unasylva 51(201):3–12
Peakall R, Smouse PE (2006) GENALEX 6: genetic analysis in Excel.Population genetic software for teaching and research. Mol EcolNotes 6:288–295
Peakall R, Smouse PE (2012) GenAlEx 6.5: genetic analysis in Excel.Population genetic software for teaching and research-an update.Bioinformatics 28:2537–2539
Perera WRH (1962) The development of forest plantations in Ceylonsince the seventeenth century. Ceylon Forester 5:142–147
Persson A (1971) Observations from a provenance trial of Tectonagrandis Linn. f. at Longuza, Tanga region. Tanzania SilvicultureRes Note 22:1–13
Piry S, Alapetite A, Cornuet JM, Paetkau D, Baudouin L, Estoup A(2004) GENECLASS2: a software for genetic assignment andfirst-generation migrant detection. J Hered 95:536–539
Pritchard JK, Stephens M, Donnelly P (2000) Inference of populationstructure using multilocus genotype data. Genetics 155:945–959
Pritchard JK, Wen X, Falush D (2010) Documentation for structure soft-ware: version 2.3—February 2, 2010. Department of HumanGenetics, University of Chicago
Queller DC, Goodnight KF (1989) Estimating relatedness using molecu-lar markers. Evolution 43:258–275
Rannala B, Mountain JL (1997) Detecting immigration by usingmultilocus genotypes. Proc Natl Acad Sci U S A 94:9197–9201
Ritland K (1996) Estimators for pairwise relatedness and inbreeding co-efficients. Genet Res 67:175–186
Rosenberg NA (2004) DISTRUCT: a program for the graphical displayof population structure. Mol Ecol Notes 4:137–138
SaitouN,NeiM (1987) The neighbor-joiningmethod—a newmethod forreconstructing phylogenetic trees. Mol Biol Evol 4:406–425
Tariel J (1966) Le Teck en Côte-d’Ivoire. Bois For Trop 107:27–47The International Plant Names Index (2014) Published on the Internet
http://www.ipni.org. Accessed 31 Jan 2014Thwe-Thwe-Win, Hirao T, Watanabe A, Goto S (2015) Current genetic
structure of teak (Tectona qrandis) in Myanmar based on newlydeveloped chloroplast single nucleotide polymorphism and nuclearsingle sequence repeat markers. Trop Conserv Sci 8:235–256
Thwe-Thwe-Win, Hirao T, Goto S (2016) Genetic composition of exoticand native teak (Tectona grandis) in Myanmar as revealed bycpSNP and nrSSR markers. Conserv Genet 17:251–258
Tnah LH, Lee SL, Ng KKS, Faridah QZ, Faridah-Hanum I (2010)Forensic DNA profiling of tropical timber species in PeninsularMalaysia. Forest Ecol Manag 259:1436–1446
Verhaegen D, Ofori D, Fofana I, Poitel M, Vaillant A (2005)Development and characterization of microsatellite markers inTectona grandis (Linn. f). Mol Ecol Notes 5:945–947
Verhaegen D, Fofana IJ, Logossa ZA, Ofori D (2010) What is the geneticorigin of teak (Tectona grandis L.) introduced in Africa and inIndonesia? Tree Genet Genomes 6:717–733
Wang J (2007) Triadic IBD coefficients and applications to estimatingpairwise relatedness. Genet Res 89:135–153
Wang J (2011) COANCESTRY: a program for simulating, estimating andanalysing relatedness and inbreeding coefficients. Mol Ecol Resour11(1):141–145
Wood PJ (1967) Teak planting in Tanzania. Proceedings from FAOworldsymposium on man-made forests. Document 3:1631–1644.Canberra, Australia
87 Page 16 of 16 Tree Genetics & Genomes (2017) 13: 87