Worlds Apart - IUPUI
34
Worlds Apart: How Can We Reduce the Gaps in Life Expectancy Across Communities of the Indy Metro Area? TESS WEATHERS, M.P.H. LISA K. STATEN, PH.D. SEPTEMBER 15, 2016
Transcript of Worlds Apart - IUPUI

Worlds Apart:How Can We Reduce the Gaps in Life Expectancy Across Communities of the Indy Metro Area?
T E S S W E AT H E R S , M . P. H .
L I S A K . S TAT E N , P H . D.
S E P T E M B E R 1 5 , 2 0 1 6

Why is it important to look at life expectancy?
The Oregonian, 10/21/2010, http://blog.oregonlive.com/kympokorny/2010/10/birch_trees_losing_ground.html

Life expectancy…
• Reflects how well a society is promoting the collective wellbeing of its members
• Is a number compared around the world as a measure of population health
• Identifies communities where gains in life expectancy have not been realized
• Is alterable by societal actions

Context• Gains in U.S. life expectancy have been outpaced
by many other wealthy, developed nations. The U.S. ranks 43rd in the world for life expectancy at birth (CIA World Factbook, 2015).
• Indiana ranks 39th among the states for life expectancy (The Measure of America, 2013-14).

Context
Other U.S. metro areas have found big differences among communities a short distance apart:• Washington, DC
• Kansas City
• Minneapolis/St. Paul
• San Joaquin Valley

What is life expectancy and how did we calculate it?

Life expectancy is…• A prediction of the number of years people of a
certain age living in a certain area can expect to live
• Based on the rates of death and survival by age group in the area during the time of study
• Most often reported as life expectancy at birth, but can apply to any age group

Shorter life expectancy…
• In a community, reflects people of any age dying too soon, perhaps in infancy or early adulthood
• These premature deaths have a larger influence on a community’s LE than do deaths at older ages

How did we do this?• Calculated abridged life tables for the 11
counties and >100 ZIP codes in the Indianapolis-Carmel-Anderson Metropolitan Statistical Area (MSA)
• Count of deaths by age group – from Indiana State Department of Health
• Estimated population size - from the American Community Survey
• For five-year period from 2009-2013
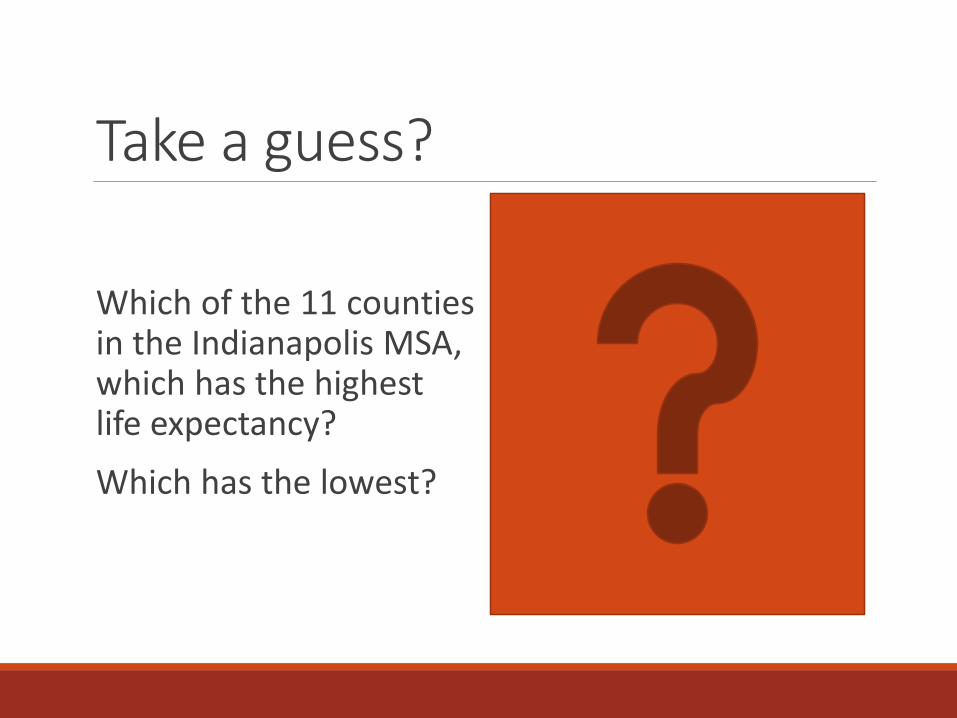
• SAVI partners visualized results by mapping
INDIANA UNIVERSITY 9

So what did we learn about life expectancy in the Indy metro?
Take a guess?
Which of the 11 counties in the Indianapolis MSA, which has the highest life expectancy?
Which has the lowest?

6 year gap by county

28 miles.
14 years.
Worlds apart.
Japan or Switzerland
Uzebekistan, Bangladesh,
Iraq
This was U.S. LE 60 years
ago!

1.2 years 5.2 years
14.3 years

What contributes to this UNEQUAL life expectancy?
The Oregonian, 10/21/2010, http://blog.oregonlive.com/kympokorny/2010/10/birch_trees_losing_ground.html

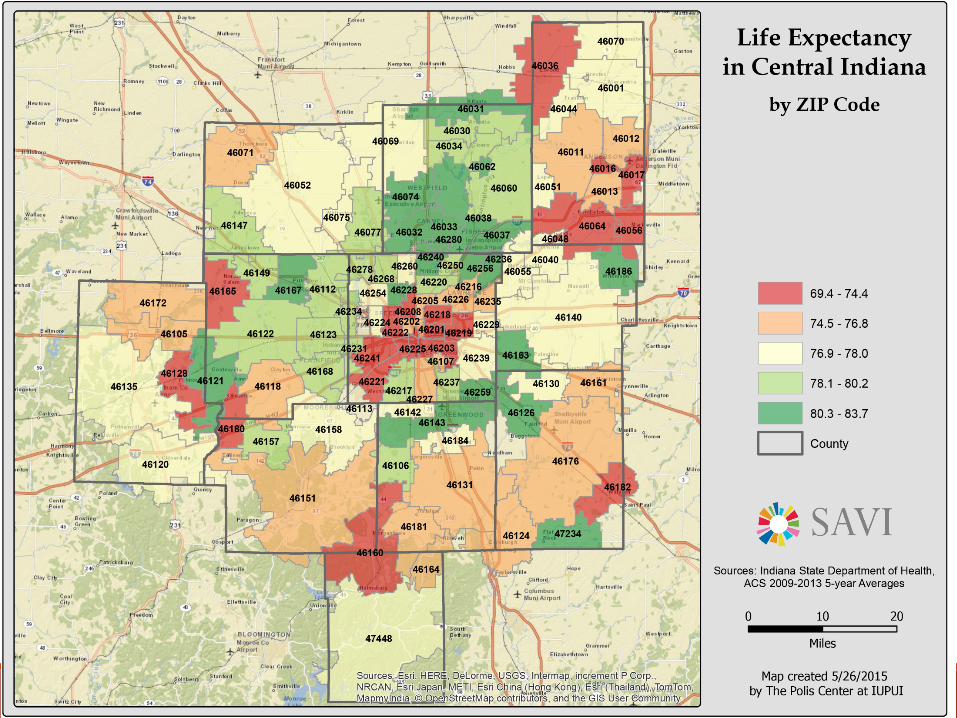
“Leading Causes” of Death
Source: Mokdad , Marks, Stroup, Gerberding. (2004) Actual Causes of Death in the United States, 2000. JAMA 291 (10): 1238-1245.
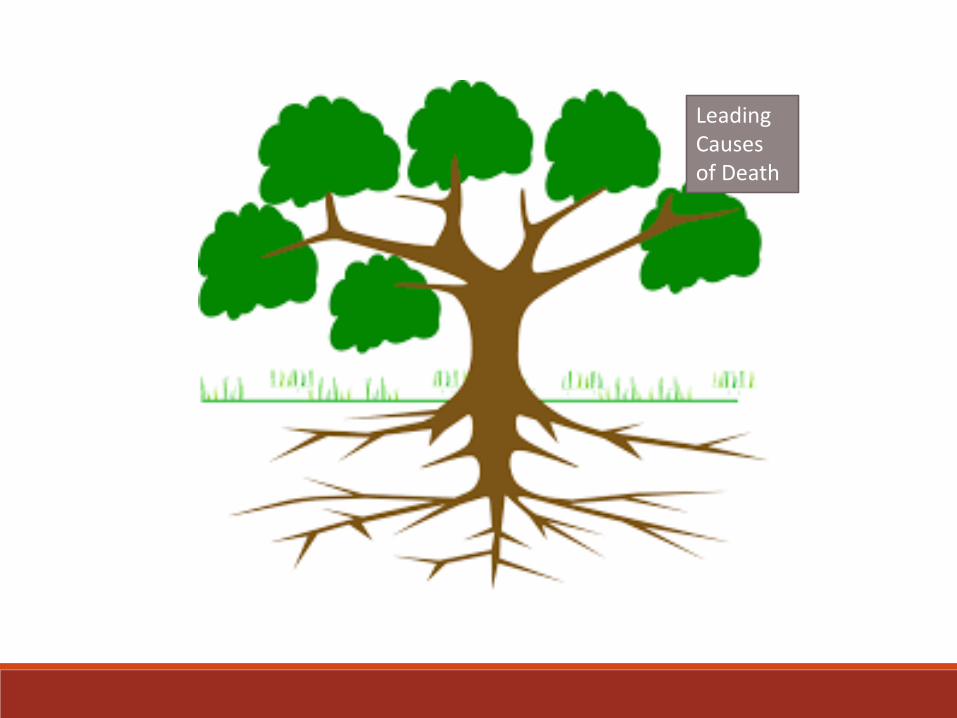
Leading Causes of Death

“Actual Causes” of Death
Source: Mokdad , Marks, Stroup, Gerberding. (2004) Actual Causes of Death in the United States, 2000. JAMA 291 (10): 1238-1245.

Leading Causes of Death
Actual Causes of Death

Deaths Related to Social Factors
0 50000 100000 150000 200000 250000 300000
Area-level poverty
Income inequality
Poverty
Low Social Support
Racial segregation
Low Education
21
Source: Galea S, Tracy M, Hoggatt K, et al. (2011) Estimated Deaths Attributable to Social Factors in the United States. American Journal of Public Health 101(8): 1456-1465.
Acute MI
Cerebrovascular
Lung cancer

Leading Causes of Death
Actual Causes of Death
Social/Root Causes of Death

Root Causes=Social Determinants“…economic and social conditions that influence the health of people and communities. These conditions are shaped by the amount of money, power, and resources that people have, all of which are influenced by policy choices.” -Centers for Disease Control & Prevention
“The social determinants of health are mostly responsible for health inequities - the unfair and avoidable differences in health status seen within and between countries.” - World Health Organization
23
http://www.cdc.gov/socialdeterminants/FAQ.htmlhttp://www.who.int/social_determinants/sdh_definition/en/

How much do social determinants matter?
Genes, biology and health behaviors ~ 25%
Social determinants ~75%
24
http://www.cdc.gov/nchhstp/socialdeterminants/faq.html
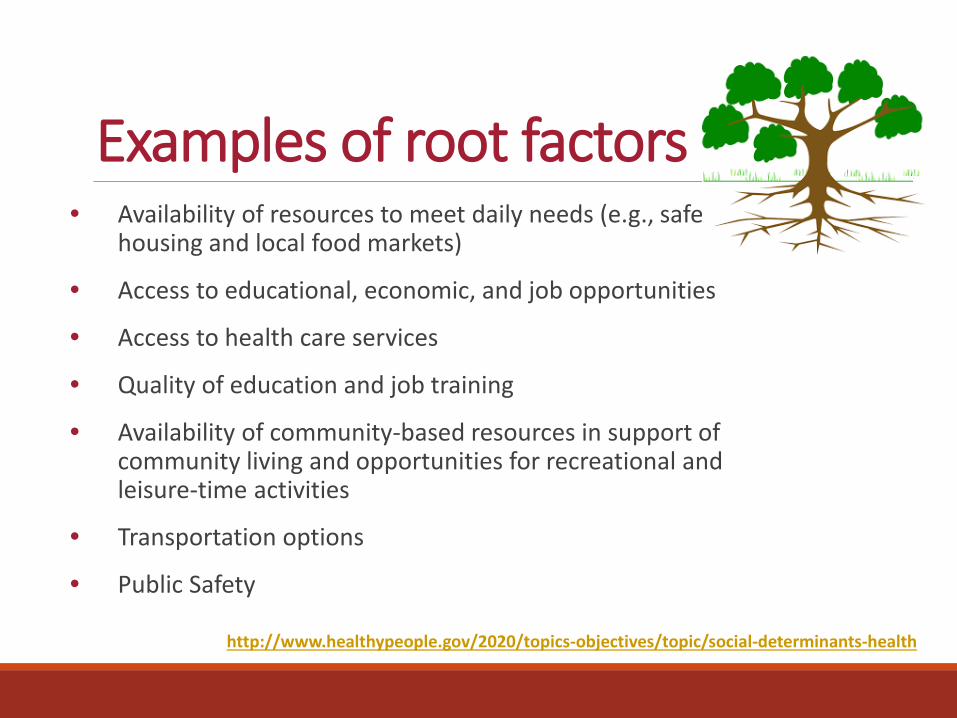
Examples of root factors• Availability of resources to meet daily needs (e.g., safe
housing and local food markets)
• Access to educational, economic, and job opportunities
• Access to health care services
• Quality of education and job training
• Availability of community-based resources in support of community living and opportunities for recreational and leisure-time activities
• Transportation options
• Public Safety
http://www.healthypeople.gov/2020/topics-objectives/topic/social-determinants-health

More examples• Social Support
• Social norms and attitudes (e.g., discrimination, racism and distrust of government)
• Exposure to crime, violence, and social disorder (e.g., presence of trash and lack of cooperation in a community)
• Socioeconomic conditions and the stressful conditions that accompany it
• Residential segregation
• Language/Literacy
• Access to mass media and emerging technologies (e.g., cell phones, the Internet, and social media)
• Culture
SOURCE: Braveman (2010) in IOM (2012).
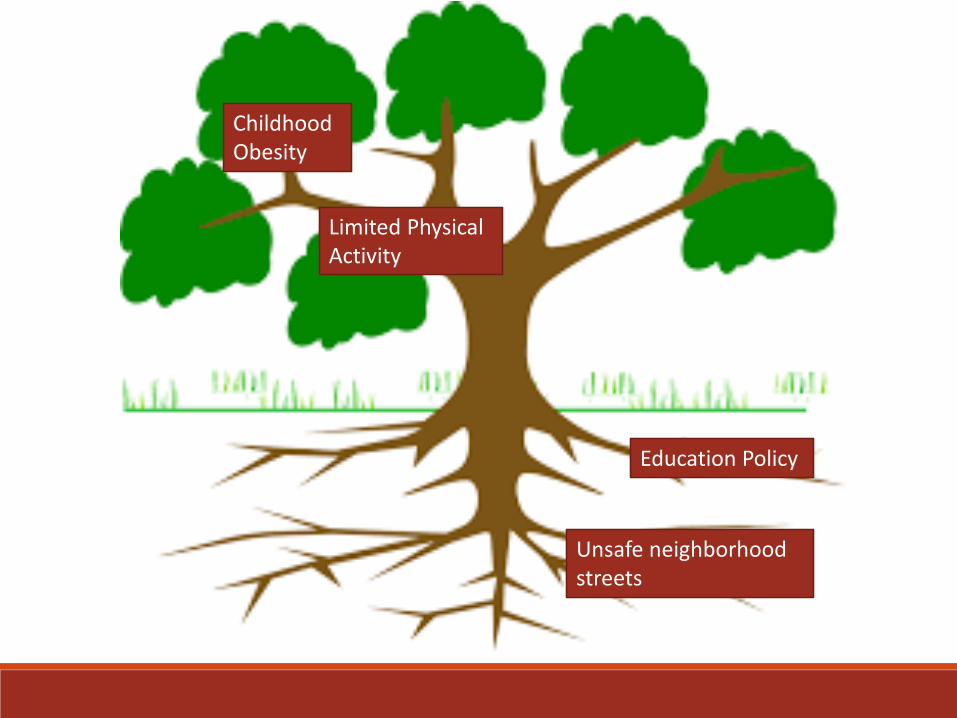
Childhood Obesity
Limited Physical Activity
Education Policy
Unsafe neighborhood streets
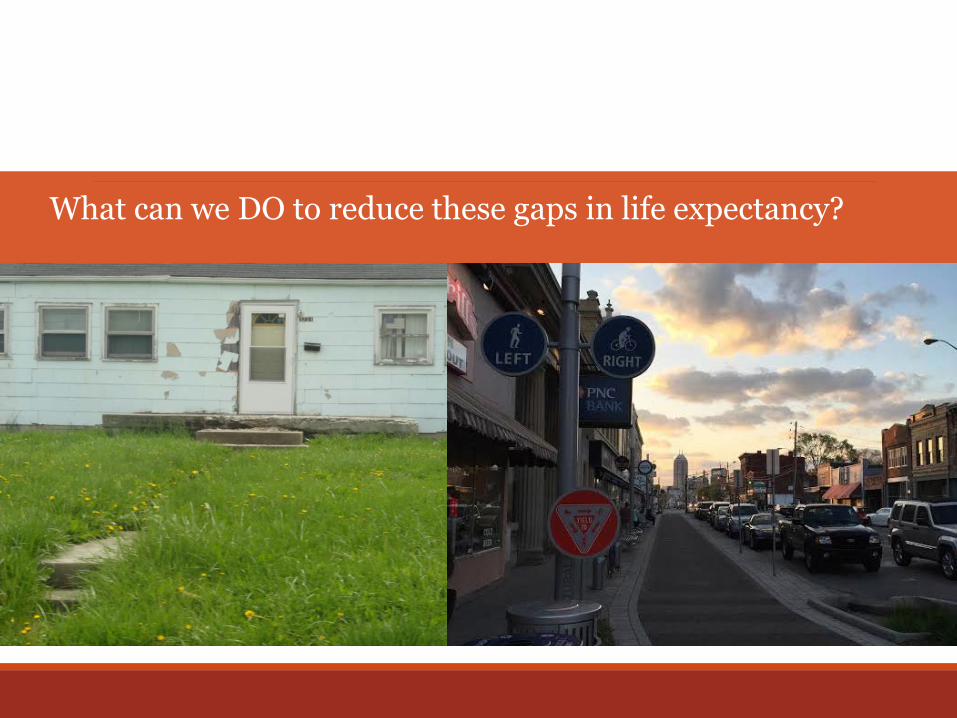
What can we DO to reduce these gaps in life expectancy?
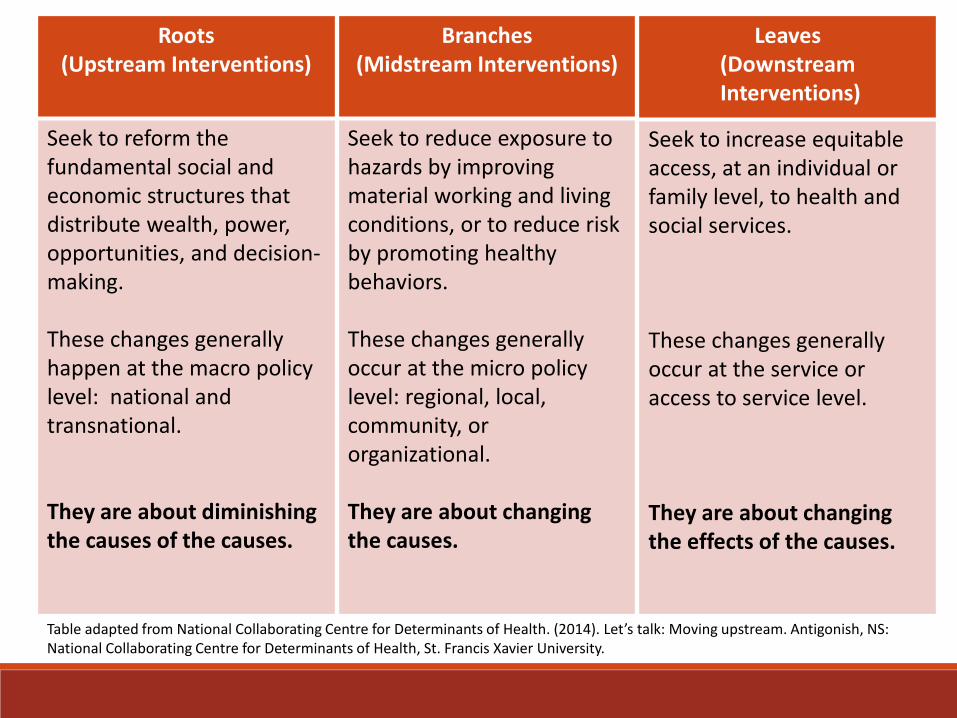
Table adapted from National Collaborating Centre for Determinants of Health. (2014). Let’s talk: Moving upstream. Antigonish, NS: National Collaborating Centre for Determinants of Health, St. Francis Xavier University.
Roots(Upstream Interventions)
Seek to reform the fundamental social and economic structures that distribute wealth, power, opportunities, and decision-making.
These changes generally happen at the macro policy level: national and transnational.
They are about diminishing the causes of the causes.
Branches(Midstream Interventions)
Seek to reduce exposure to hazards by improving material working and living conditions, or to reduce risk by promoting healthy behaviors.
These changes generally occur at the micro policy level: regional, local, community, or organizational.
They are about changing the causes.
Leaves(DownstreamInterventions)
Seek to increase equitable access, at an individual or family level, to health and social services.
These changes generally occur at the service or access to service level.
They are about changing the effects of the causes.

A 14 year gap in life expectancy should not exist in the heartland of America.
83.7years
70.5years
Individual changes will not significantly change a society’s life expectancy, but
collective action on the social determinants of health can.
Acknowledgments
Thank you to…
• The Polis Center and SAVI Community Information System
• Indiana State Department of Health
Photographs of Indy neighborhoods were taken by IUPUI Community Health students.
Questions?
Access the full report online at www.savi.org/worlds-apart/