world’s talent Empowering the flow of the For …...2019/02/26 · cost per hire ~$5,700 In...
33
1 1 Empowering the flow of the world’s talent LiveHire (ASX:LVH) FY19 H1 Results Presentation LiveHire For personal use only
Transcript of world’s talent Empowering the flow of the For …...2019/02/26 · cost per hire ~$5,700 In...

11
Empowering the flow of the world’s talent
LiveHire (ASX:LVH) FY19 H1 Results Presentation
LiveHire
For
per
sona
l use
onl
y

DisclaimerNot an offer or prospectusThis presentation is not, and does not constitute, an offer to sell or the solicitation, invitation or recommendation to purchase any securities or other financial products in any jurisdiction and neither this presentation nor any of the information contained herein shall form the basis of any contract or commitment. In particular, this presentation does not constitute an offer to sell, or a solicitation of an offer to buy, any securities in the United States. This presentation is not a prospectus, product disclosure statement or other offering document under Australian law or any other law, and will not be lodged with the Australian Securities and Investments Commission.
Not financial product adviceStatements and information in this presentation are current only as at 28 August 2018 and the information in this presentation remains subject to change without notice and is expected to change, potentially in material respects. The information contained in this presentation is for information purposes only, is an overview, and does not contain all information necessary to make an investment decision or that would be required in a prospectus or product disclosure statement prepared in accordance with the requirements of the Corporations Act 2001 (Cth) (Corporations Act). It is intended only for those persons to whom it is delivered personally by or on behalf of the Company. The information contained in this presentation is of a general nature and does not purport to be complete or verified by the Company. The information contained in this presentation does not constitute investment or financial product advice (nor taxation or legal advice) or a recommendation to acquire shares in the Company and is not intended to be used as the basis for making any investment decision. In providing this presentation, the Company has not considered the objectives, financial position, taxation situation or other needs of any particular recipients. Investors should consult with their own professional advisers in connection with any acquisition of securities.
No liabilityNeither the Company nor its related bodies corporate, shareholders or affiliates, nor any of their respective officers, directors, employees, affiliates, agents, representatives or advisers (each a Limited Party) guarantees or makes any representations or warranties, express or implied, as to or takes responsibility for, the accuracy, reliability, completeness, correctness or fairness of the information, opinions, forecasts, reports, estimates and conclusions contained in this presentation. The Company does not represent or warrant that this presentation is complete or that it contains all information about the Company that a prospective investor or purchaser may require in evaluating a possible investment in the Company or acquisition of shares in the Company. To the maximum extent permitted by law, each Limited Party expressly disclaims any and all liability, including, without limitation, any liability arising out of fault or negligence, for any loss arising from the use of or reliance on information contained in this presentation including representations or warranties or in relation to the accuracy or completeness of the information, statements, opinions, forecasts, reports or other matters, express or implied, contained in, arising out of or derived from, or for omissions from, this presentation including, without limitation, any financial information, any estimates or projections and any other financial information derived therefrom.
Forward looking statementThis presentation contains certain forward-looking statements and comments about future events, including the Company's expectations about the performance of its businesses and certain strategic transactions. Forward looking statements can generally be identified by the use of forward looking words such as, “aim”, “assume”, “due” “expect”, “anticipate”, “likely”, “intend”, “should”, “could”, “may”, “predict”, “plan”, “purpose”, “will”, “believe”, “forecast”, “estimate”, “target” and other similar expressions within the meaning of securities laws of applicable jurisdictions. Indications of, and guidance or outlook on, future earnings or financial position or performance are also forward looking statements. Forward-looking statements involve inherent risks and uncertainties, both general and specific, and there is a risk that such predictions, forecast, projections and other forward looking statements will not be achieved. A number of important factors could cause the Company's actual results to differ materially from the plans, objectives, expectations, estimates and intentions expressed in such forward-looking statements, and many of these factors are beyond the Company's control. Forward looking statements are provided as a general guide only, and should not be relied on as an indication or guarantee of future performance and involve known and unknown risks, uncertainty and other factors, many of which are outside the control of the Company. As such, undue reliance should not be placed on any forward-looking statement. Past performance is not necessarily a guide to future likelihood of achievement or reasonableness of any forward-looking statements, forecast financial information or other forecast. Nothing contained in this presentation nor any information made available to you is, or shall be relied upon as, a promise, representation, warranty or guarantee as to the past, present or the future performance of the Company. No Limited Party or any other person makes any representation, or gives any assurance or guarantee that the occurrence of the events expressed or implied in any forward-looking statements in this presentation will occur. The information in this presentation remains subject to change without notice. No responsibility or liability is assumed by the Company for updating any information in this presentation or to inform any recipient of any new or more accurate information or any errors or mis-descriptions of which the Company or its advisers may become aware.
DistributionDistribution of this presentation outside Australia may be restricted by law. Persons who come into possession of this presentation who are not in Australia should seek advice on and observe any such restrictions. Any failure to comply with such restrictions may constitute a violation of applicable securities laws. No action has been taken to register any securities outside Australia. This presentation is being provided to you on the basis that you are, and you represent and warrant that you are not in the United States and you are not you are not in the United States and you are not acting for the account or benefit of any person in the United States. This presentation may not be distributed or released, directly or indirectly, in the United States.
This presentation has been independently prepared by LiveHire Limited (Company) and is provided for informational purposes only. It should be read in conjunction with the Company’s latest and prior interim and annual reports
Non-GAAP measuresThis presentation includes Non-GAAP measures as we believe they provide useful information for readers to assist in understanding the Company’s financial performance. Non-GAAP financial measures do not have a standardised meaning and should not be viewed in isolation or considered as substitutes for measures reported in accordance with IFRS and AASB. These measures have not been independently audited or reviewed
2
For
per
sona
l use
onl
y

33
Christy ForestCEO - LiveHire
“I am excited to share another record half for LiveHire. Our game changing platform
ecosystem is maturing rapidly at a time when companies are finding it increasingly
difficult to find quality talent, whilst at the same time having to process an ever
increasing volume of applicants, and taking longer and longer to hire.
At LiveHire, we continue to build our product and model for long-term, continuous
scale, whilst maintaining impressive quarterly growth. We continue to be globally
unique, first mover, and growing fast in a market that is large and growing each
year, as more and more spend shifts from inefficient processes to A.I., automation,
and machine learning, complementing the high value, human touch requirements of
recruitment.
We would like to thank our RPO and Channel partners for their continued belief and
passion for working with LiveHire to bring a new way of recruitment to life together.”
From the CEOF
or p
erso
nal u
se o
nly

The Talent Acquisition market is huge.Companies are changing the way they recruit, the way they share and collaborate, the way they fundamentally treat candidates now like customers.
This is leading companies towards having to use the cloud to work and manage their talent data, to shift power to the candidate, to use AI, to unify data, and to communicate more personally.
LiveHire has created a new category, and built an architecture, a strategy, and a technology that is unique and enabling that vision of the future.
4
1: Reference Link 2: CEB Insights (now Gartner): 2017 State of the Recruiting Function (Benchmarks for Recruiting Budget, Staffing, and Workload). March 2017 3: Long term projection at scale assuming Account Management, Support and Implementation costs of 15% of revenue; AWS Hosting and Direct/Embedded Software Costs of 15% of revenue.
4
16%2
$240B
Technology portion of this spend is expected to increase from 2% to 16% over the next 3 years as companies look for greater efficiency.
Currently estimated spend each year in the US on Talent Acquisition alone.
1
LiveHire Technology: High CAGR (100%+) High Gross Margin (70%+)3
Scarcity (disruptive, high ROI model, globally unique).#1
For
per
sona
l use
onl
y

55
Michael RennieNon-Exec Director
Geoff Morgan AMNon-Exec Chairman
Gigi GozziFounder, CPO
Dr Mike HaywoodFounder, Growth
Adam ZorziNon-Exec Director
Christy ForestCEO
Board of DirectorsF
or p
erso
nal u
se o
nly

66
The way we’ve been taught to recruit is perfectly suited to a world that no longer exists...
LiveHire 2019
For
per
sona
l use
onl
y
7
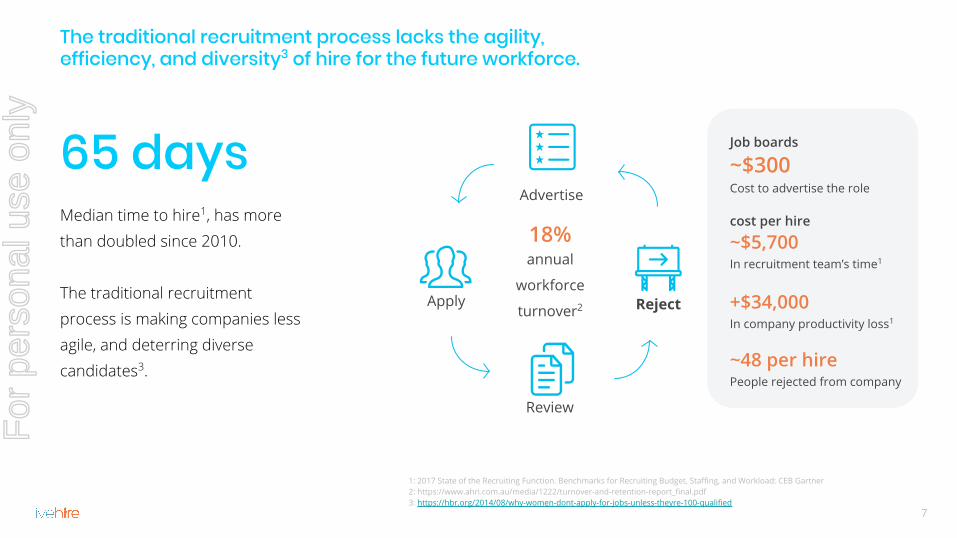
18% annual
workforce
turnover2
1: 2017 State of the Recruiting Function. Benchmarks for Recruiting Budget, Staffing, and Workload: CEB Gartner 2: https://www.ahri.com.au/media/1222/turnover-and-retention-report_final.pdf3: https://hbr.org/2014/08/why-women-dont-apply-for-jobs-unless-theyre-100-qualified
Advertise
Apply
Review
Reject
Job boards
~$300Cost to advertise the role
cost per hire
~$5,700In recruitment team’s time1
+$34,000In company productivity loss1
~48 per hirePeople rejected from company
The traditional recruitment process lacks the agility, efficiency, and diversity3 of hire for the future workforce.
Median time to hire1, has more than doubled since 2010.
The traditional recruitment process is making companies less agile, and deterring diverse candidates3.
65 days
For
per
sona
l use
onl
y

Talent From all Sources
The internet of talent.Discovered, Talent Pooled, Text Messaged, and Hired. On-demand.
3. Channel Sourcing
3. Talent Community
2. Talent Pool
Hiring
Talent Pooling
Talent Community
Sourcing
LiveHire is the future process.F
or p
erso
nal u
se o
nly

9
Website
Social
Job Ads Referrals Database Re-Target
Campaigns
Alumni
Your single, simple destination for all talent interested in you
A Live Talent Community
LiveHire 2019
For
per
sona
l use
onl
y

1010
In under 2 minutes...
One unified and private profile to engage all companies.
Candidates complete a Talent Profile
LiveHire 2019
For
per
sona
l use
onl
y

1111
Maintain a steady stream of candidates for the roles you’ll need in the future
Artificial Intelligence is the recruiters best friend.
Create Talent Pools for all roles
LiveHire 2019
For
per
sona
l use
onl
y

1212
Send and receive all communications between candidates and recruiters via SMS and email, direct to their smartphone, ensuring rapid responses and a better, more human candidate experience.
All communications between candidates and your team are automatically recorded in an easy to read organised format so anyone can pick up the conversation exactly where you left it.
Create a human connection with your candidates
Seamlessly engage with candidates to deliver a better experience
For
per
sona
l use
onl
y

1313
Recruiters are able to collaborate with hiring managers to speed the hiring process and attract more qualified candidates.
Greater insight into talent pipeline
Real-time job approvals
Review & select candidates based on their LiveHire Talent Profile
Easily send employment contracts to new hires
Create, manage and track all open vacancies
Manage the hiring process end-to-end.
For
per
sona
l use
onl
y
1414
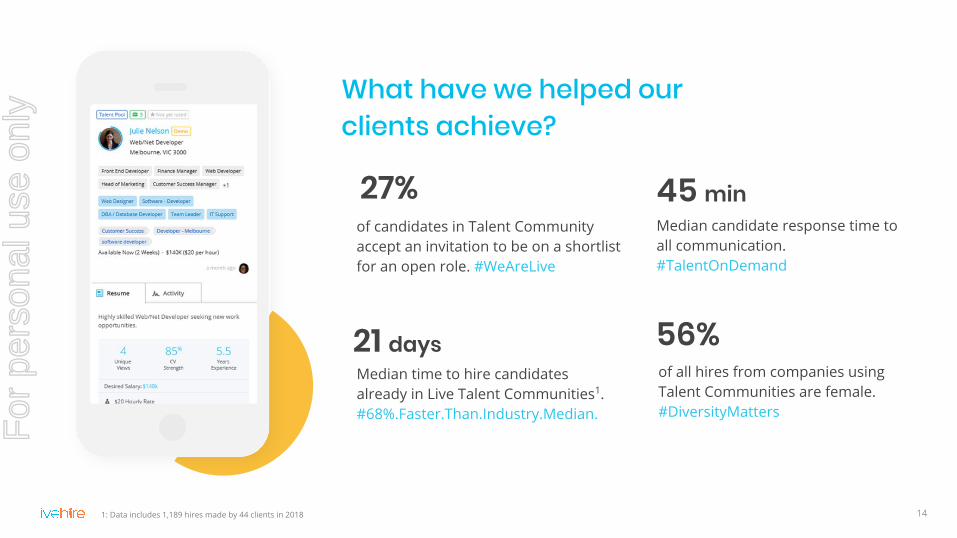
Median candidate response time to all communication. #TalentOnDemand
45 min
of all hires from companies using Talent Communities are female. #DiversityMatters
of candidates in Talent Community accept an invitation to be on a shortlist for an open role. #WeAreLive
27%
Median time to hire candidates already in Live Talent Communities1. #68%.Faster.Than.Industry.Median.
21 days 56%
What have we helped our clients achieve?
1: Data includes 1,189 hires made by 44 clients in 2018
For
per
sona
l use
onl
y

LinkedInFacebookInternal Talent
Referrals
Previous applicants
Careers PageGoogle poweredJob Boards
Video Interviewing
Reference checking
HRIS
Interview scheduling
LiveHire Platform. The talent ecosystem architecture built for global scale.
Client’s Central LiveHire Platform
1. The LiveHire PlatformCloud based, open API, rapidly deployed, highly scalable. Replaces the traditional Applicant tracking softwares.
2. Sourcing product integrationsDeep integrations with major sources of talent online so clients can grow their communities fast.
3. Third party “widget” integrations LiveHire is a central platform to an ever growing ecosystem of third party plug-and-play software to add further efficiency, candidate experience, and automation to client’s hiring process.
4. HRIS Integrations (Large Companies)For ultra large organisations, 2-way deep data synchronisation with client’s Human Resource Information Systems (HRIS).
15
1
2
3
4Many more ongoing
For
per
sona
l use
onl
y

1616
Old way vs New way
Poor candidate experienceDesktop applications to single role, hour to complete, Automated email notifications.
Award winning candidate experienceMobile connection to register, minutes to completeLive 2-way personalised text message communication.
Poor recruiter efficiencyScreening hundreds of different resumes.High applicant withdrawal rates during process.
High recruiter productivityInviting people via SMS to applyVery low applicant withdrawal rates during process.
Poor hiring efficiency65 days time to hire1.Job board applicants lack diversity
Talent on Demand21 days time to hire (68% reduction)3.>50% of all hires on platform are female2.
Damaged Brand42 people rejected from application2.>80% of rejected candidates cease being consumers4
Strengthened Brand (less rejection)17 people unsuccessful during application1
Moved to Talent Pools for future opportunities.
From transactional “System of Record” To humanised “System of Engagement”
Reset the bar on what good recruitment looks like
1: 2017 State of the Recruiting Function. Benchmarks for Recruiting Budget, Staffing, and Workload: CEB Gartner 2: Internal LiveHire data All companies. 3. Calculation: 51 day reduction in time to hire (68 less 17) / 68 days = 75% 4: Reference Link
For
per
sona
l use
onl
y

1717
One integrated platform
Pre-cloud technologyStatic Applicant Tracking SystemsProcess: Advertise → Apply → Review → Reject → Repeat
Cloud based platformTalent Engagement and On-demand Acquisition PlatformProcess: Grow Community → Talent Pool → SMS → Hire
Slow DeploymentRequires extensive, fixed configuration. Months to implement.
Rapid DeploymentHighly flexible configuration.Days to implement.
Non-integratedCostly manual integrations, limited options.Only connected to Job boards. Limited active talent.
Open API platformPlug and play with the best HR tech widgets ongoing.Connected to the whole internet of talent through AI.
Fixed versionsDifferent systems for different company sizes.Ongoing version or system upgrades.
Highly scalableOne size fits all from hundreds to millions of employees.Grows as the company does.
From Traditional Applicant Tracking System To Total Talent Acquisition and Engagement
For the entire talent ecosystem
For
per
sona
l use
onl
y

18
New way: A community experience with 2-way engagement, creates fast hiring and decisive candidates.
Old way: The traditional channels provide few hires, and less committed applicants.
Source: LiveHire analysis based on ~5,500 hires from our clients in 2018LiveHire 2019
Greater, faster hires, with less wasted recruiter time.
Total HiresShortlist to Hire Conversion
Withdrawn to Hire Conversion
Job Boards
Social Networks
Referrals
Talent Community & Talent Pool
Careers Website
For
per
sona
l use
onl
y

Building a high value ecosystem of Talent Community Connections (TCCs)
The unified candidate profile is unique to the LiveHire platform, and difficult to replicate. As more companies switch to LiveHire and grow their own Talent Communities, the total talent ecosystem grows, until the majority of talent globally are on LiveHire, keeping their single data set live, and responding fast to communications. This domino effect means companies that wish to
source, engage, and hire the best talent faster and more cost effectively, should join the LiveHire ecosystem.
19
LiveHire clients can benchmark their recruitment performance against their
industry averages.
New clients can grow their Talent Communities faster. Candidates join Talent Communities quicker.
More scalable across entire industries globally. The
industry standard.
More sticky platform and defensible from new market competitors.
Unified live data means AI and Machine learning continues to improve over time,
providing ongoing ROI and value to users.
Central source of valuable and live economic and employment data.
For
per
sona
l use
onl
y

20
Providing efficient and fast geographical scale to the largest enterprises with minimal sales infrastructure. Building the technology of the future for the industries best.
Adopted by leaders in the industry.Recruitment Outsourced partners (RPO & MSP)
RPO & MSP Channel to Market
40% of organisations globally use RPO & MSP firms to deliver all or parts of their end to end recruitment inside their organisations as a business partnership1.
LiveHire aims to be the preferred technology used by RPO & MSP partners to deliver improved value to end clients, and improved EBIT to RPO.
8 Enterprise clients to date with a large forward pipeline of some of the most well known brands in Australia and New Zealand.
2 government contracts to date with a focus on growth across multiple verticals in Australia and New Zealand.
Exploring MSP opportunities in new markets
Joint proposals and advanced discussions underway with multiple other national and international RPO providers.
Manpower Group
1: Reference Link
For
per
sona
l use
onl
y

2121
Because LiveHire helps us showcase who we are as a company and who we are as a brand, it means we attract candidates who are looking for companies that are just like us.
LiveHire’s direct sales team focus on medium organisations (200-5,000 FTE)
“Zoe SharanEmployee Experience Manager at Amicus
For
per
sona
l use
onl
y

FY19 H1 Performance & Financial MetricsTo be read in conjunction with the FY19 H1 Interim Financial Report, released to the ASX on 26th February 2019.
22
For
per
sona
l use
onl
y
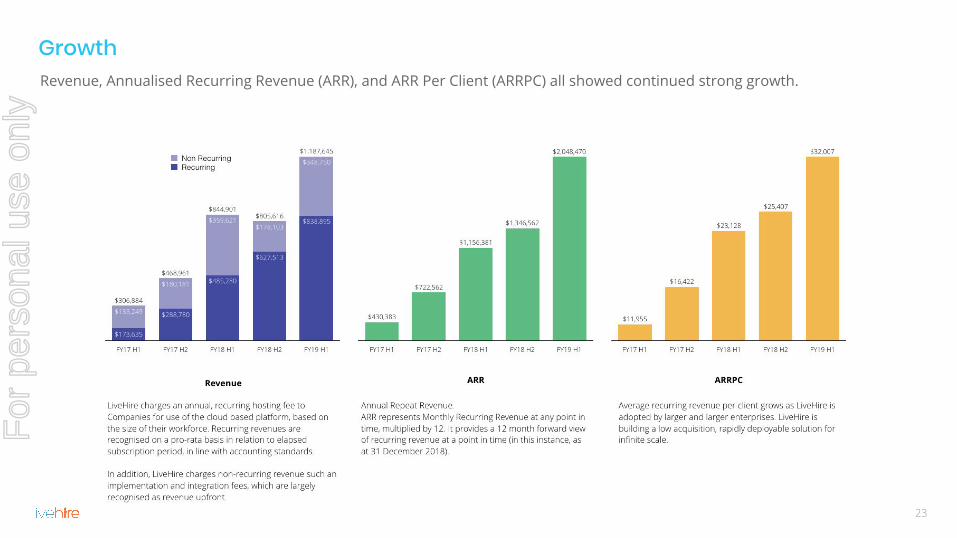
Growth
23
Revenue, Annualised Recurring Revenue (ARR), and ARR Per Client (ARRPC) all showed continued strong growth.
For
per
sona
l use
onl
y
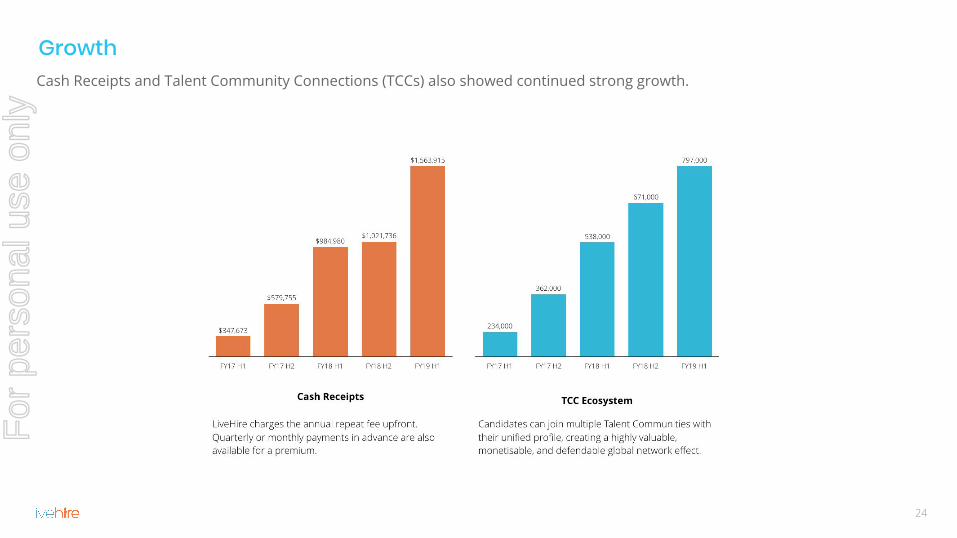
Growth
24
Cash Receipts and Talent Community Connections (TCCs) also showed continued strong growth.
For
per
sona
l use
onl
y
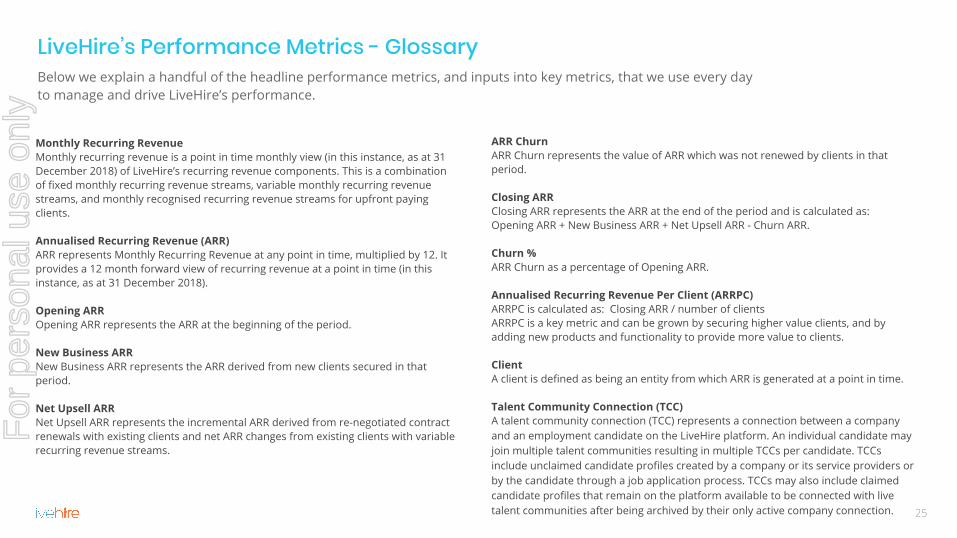
LiveHire’s Performance Metrics - GlossaryBelow we explain a handful of the headline performance metrics, and inputs into key metrics, that we use every day to manage and drive LiveHire’s performance.
Monthly Recurring RevenueMonthly recurring revenue is a point in time monthly view (in this instance, as at 31 December 2018) of LiveHire’s recurring revenue components. This is a combination of fixed monthly recurring revenue streams, variable monthly recurring revenue streams, and monthly recognised recurring revenue streams for upfront paying clients.
Annualised Recurring Revenue (ARR)ARR represents Monthly Recurring Revenue at any point in time, multiplied by 12. It provides a 12 month forward view of recurring revenue at a point in time (in this instance, as at 31 December 2018).
Opening ARROpening ARR represents the ARR at the beginning of the period.
New Business ARRNew Business ARR represents the ARR derived from new clients secured in that period.
Net Upsell ARRNet Upsell ARR represents the incremental ARR derived from re-negotiated contract renewals with existing clients and net ARR changes from existing clients with variable recurring revenue streams.
ARR ChurnARR Churn represents the value of ARR which was not renewed by clients in that period.
Closing ARRClosing ARR represents the ARR at the end of the period and is calculated as:Opening ARR + New Business ARR + Net Upsell ARR - Churn ARR.
Churn %ARR Churn as a percentage of Opening ARR.
Annualised Recurring Revenue Per Client (ARRPC)ARRPC is calculated as: Closing ARR / number of clientsARRPC is a key metric and can be grown by securing higher value clients, and by adding new products and functionality to provide more value to clients.
ClientA client is defined as being an entity from which ARR is generated at a point in time.
Talent Community Connection (TCC)A talent community connection (TCC) represents a connection between a company and an employment candidate on the LiveHire platform. An individual candidate may join multiple talent communities resulting in multiple TCCs per candidate. TCCs include unclaimed candidate profiles created by a company or its service providers or by the candidate through a job application process. TCCs may also include claimed candidate profiles that remain on the platform available to be connected with live talent communities after being archived by their only active company connection. 25
For
per
sona
l use
onl
y

1. ARR & Client NumbersARR has increased 52% for the 6 month period, driven by 18 new clients including Jemena, Dulux Group, Xero, Calibre Group, Komatsu Australia, Nissan Australia, iSelect, and several via the RPO Channel via Korn Ferry and Manpower Services (Aust) Pty Ltd.
2. ARRPCARRPC grows as LiveHire is adopted by larger and larger enterprises.
2. FTEFTE has grown 7 for the 6 month period. Growth in personnel was in line with budget and capital raising communication, to accelerate commercial expansion and continue product development and technology.
FY19 H1 FY18 % Change for 6 month period
Opening ARR ($'000) 1,347 723
New Business ARR ($'000) 827 611
Net Upsell ARR ($'000) 46 92
ARR Churn ($'000) (172) (79)
Closing ARR1 2,048 1,347 52%
ARR Churn % 13% 11%
Client Numbers1 64 53 21%
ARPC (Recurring) ($'000)2 32,007 25,407 26%
TCCs 797,483 671,254 19%
FTE3 61 54 11%
LiveHire’s Performance Metrics
26
For
per
sona
l use
onl
y

27
Recurring RevenueRecurring revenue is the component of statutory reported operating revenue that relates to recurring revenue streams earned during the period being reported on. Recurring revenue streams include hosting fees, user licence fees and ongoing support and maintenance fees.
Non-Recurring RevenueNon-recurring revenue is the component of statutory reported operating revenue that relates to one-off revenue streams earned during the period being reported on. This predominantly consists of upfront implementation and integrations fees as well as people service/consulting fees.
Management EBITDAEBITDA excluding Share Based Payments and R&D rebate income, and prior to the transfer of certain costs to the software development asset. It provides a normalised view that excludes significant non-cash expenses, income not considered part of core operations, and includes all salary costs (including those able to be capitalised under the applicable accounting standards).
Statutory EBITDAEBITDA including Share Based Payments and R&D rebate income, and after the transfer of certain costs to the software development asset.
Annual Cash Burn excluding financing activitiesCash Burn excluding financing activities is calculated as operating and investing cash flows as reported in the statutory cash flow statement.
It does not include net cashflows from financing activities (e.g. capital raise).
Annual Cash Burn excluding financing activities, R&D and interestCash Burn excluding financing activities, R&D and interest is calculated as operating and investing cash flows as reported in the statutory cash flow statement, excluding cash received from R&D rebates and interest received, and excluding net cashflows from financing activities (e.g. capital raise).
It provides a normalised Annual Cash Burn, excluding items not considered by management to be within core operations.
LiveHire’s Financial Metrics - GlossaryBelow we explain a handful of the headline financial metrics that we use every day to manage and drive LiveHire’s performance.
For
per
sona
l use
onl
y

1. Management EBITDAIncreased loss driven by continued investment in Product Development, and other associated costs, partially offset by increased revenue, which has grown proportionately more than expenditure (compared to FY18 H2 47% revenue growth, 17% expenditure growth).
2. Recurring RevenueGrowth against both FY18 H2 (34%) and FY18 H1 (73%) has been driven by new clients secured in FY19 accompanied by improved revenue from existing customers through contract renewals.
Note to market: SaaS pricing to corporate clients determined by workforce size. Pricing model not driven by TCCs.
3. Non-recurring RevenueGrowth against FY18 H2 has been driven by new clients secured in FY19. Minor reduction compared to FY18 H1 is due to revenue from a pilot program within FY18 H1 non-recurring revenue.
FY19 H1 FY18 H2 FY19 H1 % Change FY18 H1 FY19 H1
% Change
Management EBITDA ($'000) 1 (5,654) (5,040) (12%) (4,040) (40%)
Statutory EBITDA ($'000) (5,704) (5,165) (10%) (4,878) (17%)
Recurring Revenue ($'000)2 839 627 34% 485 73%
Non-recurring Revenue ($'000)3 349 179 96% 360 (3%)
Total Operating Revenue (Statutory) ($'000) 1,188 806 47% 845 41%
Cash Burn excluding financing activities (5,536) (3,618) (53%) (3,428) (61%)
Cash Burn excluding financing activities, R&D and Interest (5,939) (4,463) (33%) (3,613) (64%)
LiveHire’s Financial Metrics
28
For
per
sona
l use
onl
y

1. Operating RevenueRevenue excluding R&D rebate income and interest income.
2. ExpenditureExpenditure excluding non-cash share-based payments expense and depreciation & amortisation, and including software development expenditure (both expensed and capitalised).
3. EBITDAEarnings before interest, tax, depreciation and amortisation.
4. Share-based payments expenseShare-based payments is a non-cash cost relating to the value attributed to equity based employee benefits.
5. R&D rebate incomeR&D rebates are considered to be outside of operating revenue for management reporting purposes. This number includes the P&L portion of R&D rebates received, in addition to an accrual for the P&L portion of the estimated FY18 R&D rebate.
6. Capitalisation of software developmentSoftware development costs attributed to the Statutory Profit & Loss are impacted by the amount capitalised to the value of Intangible Assets under the relevant accounting standards.
FY19 H1 FY18 H2 FY19 H1 % Change FY18 H1 FY19 H1
% Change
Operating Revenue1 1,188 806 47% 845 41%
Expenditure2 (6,842) (5,845) (17%) (4,885) (40%)
EBITDA3 (Management Reporting) (5,654) (5,040) (12%) (4,040) (40%)
Share-based payments expense4 (1,082) (948) (14%) (1,931) 44%
R&D rebate income5 43 164 (74%) 302 (86%)
Capitalisation of software development6 990 659 50% 791 25%
EBITDA3 (Statutory Reporting) (5,704) (5,165) (10%) (4,878) (17%)
Interest, Depreciation & Amortisation (14) 41 (134%) (94) 85%
Net Loss (Statutory Reporting) (5,718) (5,124) (12%) (4,972) (15%)
Profit & Loss – Reconciliation to Statutory Results
29
For
per
sona
l use
onl
y

1. Payment for intangible assetsIn the statutory cash flow statement payments for intangible assets are separately identified. However, in the Appendix 4C these costs are included as payments to suppliers and employees. The reason for this difference in treatment is due to the fact that capitalised salaries are processed bi-annually as a statutory adjustment, and are subject to detailed documentation and audit review, which does not occur on a quarterly basis. During the financial year these payments amounted to $985k.
2. Payments for other non-current financial assetsAccounting standards require term deposits that mature in greater than 90 days from the date of the report to be shown as other non-current financial assets rather than cash. In the Appendix 4C these term deposits are considered to be cash. The $634k adjustment represents the balance of the these term deposits, $115k of which was a current period addition.
FY19 H1 Appendix 4C to Statutory Cashflow Reconciliation
FY19 H1 Appendix 4C Adjustments
FY19 H1 Statutory Cashflow
Receipts from customers 1,564 0 1,564
Payment to suppliers and employees1 (7,417) 985 (6,433)
Interest Received 346 0 346
Net Cash from / (used in) operating activities (5,507) 985 (4,522)
Payment to acquire tangible and intangible assets1 (85) (985) (1,070)
Payments for other non-current financial assets2 0 (115) (115)
Net Cash from / (used in) investing activities (85) (1,100) (1,186)
Proceeds from the issue of shares 56 0 56
Net Cash from / (used in) financing activities 56 0 56
Net increase in cash and cash equivalents2 (5,536) (115) (5,652)
Opening Cash Balance2 30,592 (519) 30,073
Closing Cash Balance2 25,056 (634) 24,421
Appendix 4C to Statutory Cashflow Reconciliation
30
For
per
sona
l use
onl
y

1. Cash and cash equivalentsRefer to Cash Flow
2. Trade and other receivables$238k of the variance relates to the revised estimate of R&D Tax Incentive receivable for FY18 (balance from FY18 still receivable at 31 December). $252k of the variance relates to trade receivables due due a significant increase in invoicing for the month of December 2018, compared to June 2018.
3. Other non-current financial assetsTerm Deposits in relation to corporate credit card facility and bank guarantees on property leases.
4. Intangible AssetsDespite $990k in additions, net intangible assets increased by $457k compared to June 18, due to credits to the Balance Sheet in relation to the R&D rebate accrual that relate to costs that were capitalised, plus amortisation.
FY19 H1($ ‘000)
FY18($ ‘000)
% Change
ASSETS Current assets Cash and cash equivalents1 24,421 30,073 (19%)Trade and other receivables2 1,591 1,095 45%Total current assets 26,013 31,168 (17%)
Non-current assets Plant and equipment 164 106 55%Other non-current financial assets3 635 520 22%Intangible assets4 2,880 2,423 19%Other non-current assets 56 0 -%Total non-current assets 3,735 3,049 22%Total assets 29,748 34,216 (13%)
LIABILITIES Current liabilities Trade and other payables 694 1,057 34%Provisions 417 397 (5%)Deferred revenue 838 407 (106%)Total current liabilities 1,949 1,861 (5%)
Non-current liabilities Provisions 87 65 (34%)Total non-current liabilities 87 65 (34%)Total liabilities 2,037 1,925 (6%)Net assets 27,711 32,291 (14%)
EQUITY Issued capital 46,736 46,680 0%Reserves 8,083 7,001 15%Accumulated losses (27,108) (21,391) (27%)Total equity 27,711 32,291 (14%)
Balance Sheet
31
For
per
sona
l use
onl
y

LiveHire Capital Structure
Share price1 $0.54
Shares on issue1 268.9m
Cash at bank2 $27.8m
Market capitalisation1 $145.2m
Enterprise value $117.4m
Options and performance rights on issue1 21.98m
Major Shareholders
Board & Management (including founders)1 28.06%
Antonluigi Gozzi1 11.07%
Michael Haywood1t 10.47%
Fidelity3 8.38%
Telstra Super4 5.5%
Share price since listing
1 As at 22 February 2019 2 As at 30 Sept 2018 3 As at 18 January 2019 4 As at 18 December 2017 32
For
per
sona
l use
onl
y

333333
LiveHire LimitedLevel 10, 461 Bourke Street, Melbourne 3000, Australia
Simon Hinsley+61 401 809 653
livehire.com
@livehireme
For
per
sona
l use
onl
y