World Water Quality Indicator
1
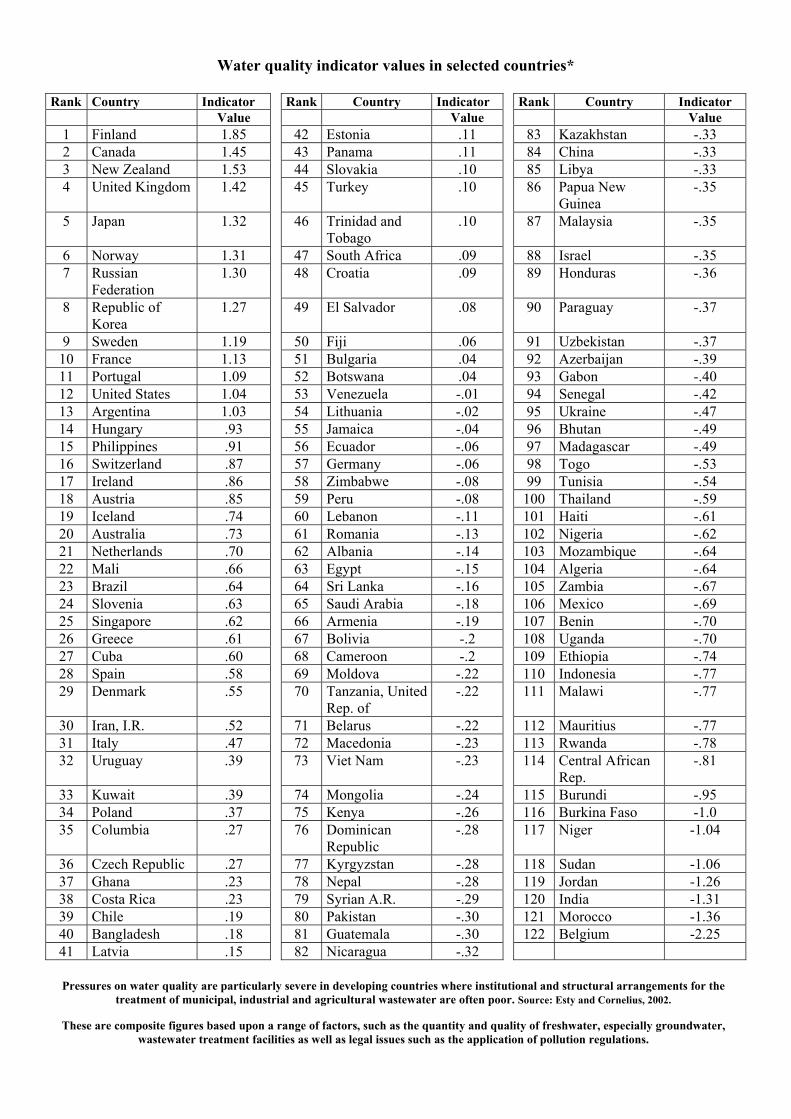
Water quality indicator values in selected countries* Pressures on water quality are particularly severe in developing countries where institutional and structural arrangements for the treatment of municipal, industrial and agricultural wastewater are often poor. Source: Esty and Cornelius, 2002. These are composite figures based upon a range of factors, such as the quantity and quality of freshwater, especially groundwater, wastewater treatment facilities as well as legal issues such as the application of pollution regulations. Rank Country Indicator Rank Country Indicator Rank Country Indicator Value Value Value 1 Finland 1.85 42 Estonia .11 83 Kazakhstan -.33 2 Canada 1.45 43 Panama .11 84 China -.33 3 New Zealand 1.53 44 Slovakia .10 85 Libya -.33 4 United Kingdom 1.42 45 Turkey .10 86 Papua New Guinea -.35 5 Japan 1.32 46 Trinidad and Tobago .10 87 Malaysia -.35 6 Norway 1.31 47 South Africa .09 88 Israel -.35 7 Russian Federation 1.30 48 Croatia .09 89 Honduras -.36 8 Republic of Korea 1.27 49 El Salvador .08 90 Paraguay -.37 9 Sweden 1.19 50 Fiji .06 91 Uzbekistan -.37 10 France 1.13 51 Bulgaria .04 92 Azerbaijan -.39 11 Portugal 1.09 52 Botswana .04 93 Gabon -.40 12 United States 1.04 53 Venezuela -.01 94 Senegal -.42 13 Argentina 1.03 54 Lithuania -.02 95 Ukraine -.47 14 Hungary .93 55 Jamaica -.04 96 Bhutan -.49 15 Philippines .91 56 Ecuador -.06 97 Madagascar -.49 16 Switzerland .87 57 Germany -.06 98 Togo -.53 17 Ireland .86 58 Zimbabwe -.08 99 Tunisia -.54 18 Austria .85 59 Peru -.08 100 Thailand -.59 19 Iceland .74 60 Lebanon -.11 101 Haiti -.61 20 Australia .73 61 Romania -.13 102 Nigeria -.62 21 Netherlands .70 62 Albania -.14 103 Mozambique -.64 22 Mali .66 63 Egypt -.15 104 Algeria -.64 23 Brazil .64 64 Sri Lanka -.16 105 Zambia -.67 24 Slovenia .63 65 Saudi Arabia -.18 106 Mexico -.69 25 Singapore .62 66 Armenia -.19 107 Benin -.70 26 Greece .61 67 Bolivia -.2 108 Uganda -.70 27 Cuba .60 68 Cameroon -.2 109 Ethiopia -.74 28 Spain .58 69 Moldova -.22 110 Indonesia -.77 29 Denmark .55 70 Tanzania, United Rep. of -.22 111 Malawi -.77 30 Iran, I.R. .52 71 Belarus -.22 112 Mauritius -.77 31 Italy .47 72 Macedonia -.23 113 Rwanda -.78 32 Uruguay .39 73 Viet Nam -.23 114 Central African Rep. -.81 33 Kuwait .39 74 Mongolia -.24 115 Burundi -.95 34 Poland .37 75 Kenya -.26 116 Burkina Faso -1.0 35 Columbia .27 76 Dominican Republic -.28 117 Niger -1.04 36 Czech Republic .27 77 Kyrgyzstan -.28 118 Sudan -1.06 37 Ghana .23 78 Nepal -.28 119 Jordan -1.26 38 Costa Rica .23 79 Syrian A.R. -.29 120 India -1.31 39 Chile .19 80 Pakistan -.30 121 Morocco -1.36 40 Bangladesh .18 81 Guatemala -.30 122 Belgium -2.25 41 Latvia .15 82 Nicaragua -.32
-
Upload
poondla-prashant -
Category
Documents
-
view
125 -
download
7
Transcript of World Water Quality Indicator
Water quality indicator values in selected countries*
Pressures on water quality are particularly severe in developing countries where institutional and structural arrangements for the
treatment of municipal, industrial and agricultural wastewater are often poor. Source: Esty and Cornelius, 2002.
These are composite figures based upon a range of factors, such as the quantity and quality of freshwater, especially groundwater, wastewater treatment facilities as well as legal issues such as the application of pollution regulations.
Rank Country Indicator Rank Country Indicator Rank Country Indicator Value Value Value
1 Finland 1.85 42 Estonia .11 83 Kazakhstan -.33 2 Canada 1.45 43 Panama .11 84 China -.33 3 New Zealand 1.53 44 Slovakia .10 85 Libya -.33 4 United Kingdom 1.42 45 Turkey .10 86 Papua New
Guinea -.35
5 Japan 1.32 46 Trinidad and Tobago
.10 87 Malaysia -.35
6 Norway 1.31 47 South Africa .09 88 Israel -.35 7 Russian
Federation 1.30 48 Croatia .09 89 Honduras -.36
8 Republic of Korea
1.27 49 El Salvador .08 90 Paraguay -.37
9 Sweden 1.19 50 Fiji .06 91 Uzbekistan -.37 10 France 1.13 51 Bulgaria .04 92 Azerbaijan -.39 11 Portugal 1.09 52 Botswana .04 93 Gabon -.40 12 United States 1.04 53 Venezuela -.01 94 Senegal -.42 13 Argentina 1.03 54 Lithuania -.02 95 Ukraine -.47 14 Hungary .93 55 Jamaica -.04 96 Bhutan -.49 15 Philippines .91 56 Ecuador -.06 97 Madagascar -.49 16 Switzerland .87 57 Germany -.06 98 Togo -.53 17 Ireland .86 58 Zimbabwe -.08 99 Tunisia -.54 18 Austria .85 59 Peru -.08 100 Thailand -.59 19 Iceland .74 60 Lebanon -.11 101 Haiti -.61 20 Australia .73 61 Romania -.13 102 Nigeria -.62 21 Netherlands .70 62 Albania -.14 103 Mozambique -.64 22 Mali .66 63 Egypt -.15 104 Algeria -.64 23 Brazil .64 64 Sri Lanka -.16 105 Zambia -.67 24 Slovenia .63 65 Saudi Arabia -.18 106 Mexico -.69 25 Singapore .62 66 Armenia -.19 107 Benin -.70 26 Greece .61 67 Bolivia -.2 108 Uganda -.70 27 Cuba .60 68 Cameroon -.2 109 Ethiopia -.74 28 Spain .58 69 Moldova -.22 110 Indonesia -.77 29 Denmark .55 70 Tanzania, United
Rep. of -.22 111 Malawi -.77
30 Iran, I.R. .52 71 Belarus -.22 112 Mauritius -.77 31 Italy .47 72 Macedonia -.23 113 Rwanda -.78 32 Uruguay .39 73 Viet Nam -.23 114 Central African
Rep. -.81
33 Kuwait .39 74 Mongolia -.24 115 Burundi -.95 34 Poland .37 75 Kenya -.26 116 Burkina Faso -1.0 35 Columbia .27 76 Dominican
Republic -.28 117 Niger -1.04
36 Czech Republic .27 77 Kyrgyzstan -.28 118 Sudan -1.06 37 Ghana .23 78 Nepal -.28 119 Jordan -1.26 38 Costa Rica .23 79 Syrian A.R. -.29 120 India -1.31 39 Chile .19 80 Pakistan -.30 121 Morocco -1.36 40 Bangladesh .18 81 Guatemala -.30 122 Belgium -2.25 41 Latvia .15 82 Nicaragua -.32