World Urbanization Prospects 2009 Revision (United Nations 2010)
56
E c o n o m i c & World Urbanization Prospects The 2009 Revision Highlights United Nations New York S o c i a l A f f a i r s
-
Upload
geografia-e-ensino-de-geografia -
Category
Documents
-
view
223 -
download
0
Transcript of World Urbanization Prospects 2009 Revision (United Nations 2010)
8/3/2019 World Urbanization Prospects 2009 Revision (United Nations 2010)
http://slidepdf.com/reader/full/world-urbanization-prospects-2009-revision-united-nations-2010 1/56
E c o n o m i c &
World Urbanization ProspectsThe 2009 Revision
Highlights
United NationsNew York
S o c
i a l
A f
f
a i
r s

8/3/2019 World Urbanization Prospects 2009 Revision (United Nations 2010)
http://slidepdf.com/reader/full/world-urbanization-prospects-2009-revision-united-nations-2010 2/56
8/3/2019 World Urbanization Prospects 2009 Revision (United Nations 2010)
http://slidepdf.com/reader/full/world-urbanization-prospects-2009-revision-united-nations-2010 3/56
ESA/P/WP/215March 2010English only
Department of Economic and Social AffairsPopulation Division
World Urbanization ProspectsThe 2009 Revision
Highlights
United NationsNew York, 2010

8/3/2019 World Urbanization Prospects 2009 Revision (United Nations 2010)
http://slidepdf.com/reader/full/world-urbanization-prospects-2009-revision-united-nations-2010 4/56
DESA
The Department of Economic and Social Affairs of the United Nations Secretariat
is a vital interface between global policies in the economic, social andenvironmental spheres and national action. The Department works in three maininterlinked areas: (i) it compiles, generates and analyses a wide range of economic,social and environmental data and information on which States Members of theUnited Nations draw to review common problems and take stock of policyoptions; (ii) it facilitates the negotiations of Member States in manyintergovernmental bodies on joint courses of action to address ongoing or emergingglobal challenges; and (iii) it advises interested Governments on the ways and meansof translating policy frameworks developed in United Nations conferences andsummits into programmes at the country level and, through technical assistance,helps build national capacities.
Note
The designations employed in this report and the material presented in it do not
imply the expression of any opinion whatsoever on the part of the Secretariat of
the United Nations concerning the legal status of any country, territory, city or
area or of its authorities, or concerning the delimitation of its frontiers or
boundaries.
Symbols of United Nations documents are composed of capital letters combined
with figures.
This publication has been issued without formal editing.
8/3/2019 World Urbanization Prospects 2009 Revision (United Nations 2010)
http://slidepdf.com/reader/full/world-urbanization-prospects-2009-revision-united-nations-2010 5/56
United Nations Department of Economic and Social Affairs/Population Division iiiWorld Urbanization Prospects: The 2009 Revision
EXPLANATORY NOTES
The following symbols have been used in the tables throughout this report:
Two dots (..) indicate that the item is not applicable.
Three dots (...) indicate that data are not available or are not separately reported.An em dash (—) indicates that the value is zero (magnitude zero).0 or 0.0 indicates that the magnitude is not zero, but less than half of the unit employed.A minus sign (-) before a figure indicates a decrease.A full stop (.) is used to indicate decimals.Years given start on 1 July.Use of a hyphen (-) between years, for example, 1995-2000, signifies the full period involved, from 1 July of
the beginning year to 30 June of the end year.
Decimals and percentages in tables may not add to the totals presented because of rounding.
References to countries, territories, areas and urban locations
The designations employed in this publication do not imply the expression of any opinion whatsoever on the part of the
Secretariat of the United Nations concerning the legal status of any country, territory or area or of its authorities, orconcerning the delimitation of its frontiers or boundaries.
The designations “more developed regions” and “less developed regions” are used for statistical convenience and do notnecessarily express a judgment about the stage reached by a particular country or area in the development process. Theterm “country” as used in this publication also refers, as appropriate, to territories or areas.
The more developed regions comprise all regions of Europe plus Northern America, Australia/New Zealand and Japan.The term “developed countries” is used to designate countries in the more developed regions.
The less developed regions comprise all regions of Africa, Asia (excluding Japan) and Latin America and the Caribbean,as well as Melanesia, Micronesia and Polynesia. The term “developing countries” is used to designate countries in theless developed regions.
The group of least developed countries, as defined by the United Nations General Assembly in resolutions 59/209,
59/210 and 60/33, as of January 2008 comprises 49 countries, 33 of which are located in Africa, 10 in Asia, one in LatinAmerica and the Caribbean, and five in Oceania (Botswana graduated in 1994 and Cape Verde in December 2007 fromthe group of least developed countries).
Country names and the composition of geographical areas follow those presented in “Standard country or area codes forstatistical use” (ST/ESA/STAT/SER.M/49/Rev.3), available at:
http://unstats.un.org/unsd/methods/m49/m49.htm.
Names of cities or urban agglomerations are presented in their original language, following the names used by NationalStatistical Offices or the United Nations Demographic Yearbook. For cities with names in more than one language,different names are separated by a hyphen. If the country uses non-Latin scripts, a transliteration of the original spellinginto Latin script is used. If cities have established alternative names or English names, those names are presented inbrackets. When necessary, the administrative subdivision to which a city belongs is appended to the city name to identifyit unambiguously.
For convenience, the term “growth rate” is used in this report interchangeably with the more appropriate term “rate of change”, which is neutral in respect to either growth or decline.
The following abbreviations are used in this publication:DESA Department of Economic and Social AffairsSAR Special Administrative RegionHDI Human Development Index
8/3/2019 World Urbanization Prospects 2009 Revision (United Nations 2010)
http://slidepdf.com/reader/full/world-urbanization-prospects-2009-revision-united-nations-2010 6/56
iv United Nations Department of Economic and Social Affairs/Population DivisionWorld Urbanization Prospects: The 2009 Revision
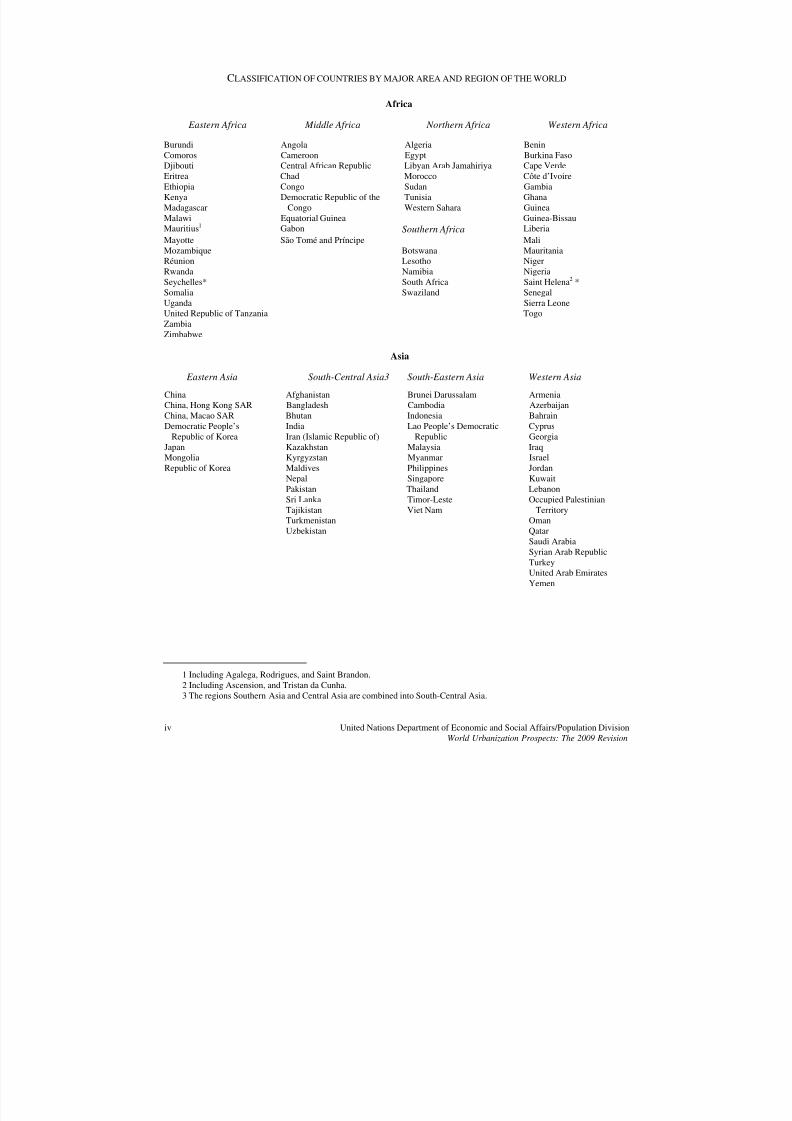
CLASSIFICATION OF COUNTRIES BY MAJOR AREA AND REGION OF THE WORLD
Africa
Eastern Africa Middle Africa Northern Africa Western Africa
Burundi Angola Algeria BeninComoros Cameroon Egypt Burkina FasoDjibouti Central African Republic Libyan Arab Jamahiriya Cape VerdeEritrea Chad Morocco Côte d’IvoireEthiopia Congo Sudan GambiaKenya Democratic Republic of the Tunisia GhanaMadagascar Congo Western Sahara GuineaMalawi Equatorial Guinea Guinea-BissauMauritius1 Gabon Southern Africa LiberiaMayotte São Tomé and Príncipe MaliMozambique Botswana MauritaniaRéunion Lesotho NigerRwanda Namibia NigeriaSeychelles* South Africa Saint Helena2 *Somalia Swaziland Senegal
Uganda Sierra LeoneUnited Republic of Tanzania TogoZambiaZimbabwe
Asia
Eastern Asia South-Central Asia3 South-Eastern Asia Western Asia
China Afghanistan Brunei Darussalam ArmeniaChina, Hong Kong SAR Bangladesh Cambodia AzerbaijanChina, Macao SAR Bhutan Indonesia BahrainDemocratic People’s India Lao People’s Democratic Cyprus
Republic of Korea Iran (Islamic Republic of) Republic GeorgiaJapan Kazakhstan Malaysia Iraq
Mongolia Kyrgyzstan Myanmar IsraelRepublic of Korea Maldives Philippines Jordan
Nepal Singapore KuwaitPakistan Thailand LebanonSri Lanka Timor-Leste Occupied PalestinianTajikistan Viet Nam TerritoryTurkmenistan OmanUzbekistan Qatar
Saudi ArabiaSyrian Arab RepublicTurkeyUnited Arab EmiratesYemen
1 Including Agalega, Rodrigues, and Saint Brandon. 2 Including Ascension, and Tristan da Cunha. 3 The regions Southern Asia and Central Asia are combined into South-Central Asia.

8/3/2019 World Urbanization Prospects 2009 Revision (United Nations 2010)
http://slidepdf.com/reader/full/world-urbanization-prospects-2009-revision-united-nations-2010 7/56
United Nations Department of Economic and Social Affairs/Population Division vWorld Urbanization Prospects: The 2009 Revision
CLASSIFICATION OF COUNTRIES (continued )
Europe
Eastern Europe Northern Europe Southern Europe Western Europe
Belarus Channel Islands4 Albania Austria
Bulgaria Denmark Andorra* BelgiumCzech Republic Estonia Bosnia and Herzegovina FranceHungary Faeroe Islands* Croatia GermanyPoland Finland5 Gibraltar* Liechtenstein*Republic of Moldova Iceland Greece LuxembourgRomania Ireland Holy See6 * Monaco*Russian Federation Isle of Man* Italy NetherlandsSlovakia Latvia Malta SwitzerlandUkraine Lithuania Montenegro
Norway7 PortugalSweden San Marino*United Kingdom of Great Serbia
Britain and Northern SloveniaIreland8 Spain
The former YugoslavRepublic of Macedonia9
Latin America and the Caribbean
Caribbean Central America South America
Anguilla* Belize ArgentinaAntigua and Barbuda* Costa Rica BoliviaAruba El Salvador BrazilBahamas Guatemala ChileBarbados Honduras ColombiaBritish Virgin Islands* Mexico EcuadorCayman Islands* Nicaragua Falkland Islands (Malvinas)*Cuba Panama French Guiana
Dominica* GuyanaDominican Republic ParaguayGrenada PeruGuadeloupe SurinameHaiti UruguayJamaica Venezuela (Bolivarian Rep. of)MartiniqueMontserrat*Netherlands AntillesPuerto RicoSaint Kitts and Nevis*Saint LuciaSaint Vincent and the
Grenadines
Trinidad and TobagoTurks and Caicos Islands*United States Virgin Islands
4 Refers to Guernsey, and Jersey. 5 Including Åland Islands. 6 Refers to the Vatican City State. 7 Including Svalbard and Jan Mayen Islands. 8 Also referred to as United Kingdom. 9 Also referred to as TFYR Macedonia.
8/3/2019 World Urbanization Prospects 2009 Revision (United Nations 2010)
http://slidepdf.com/reader/full/world-urbanization-prospects-2009-revision-united-nations-2010 8/56
vi United Nations Department of Economic and Social Affairs/Population DivisionWorld Urbanization Prospects: The 2009 Revision
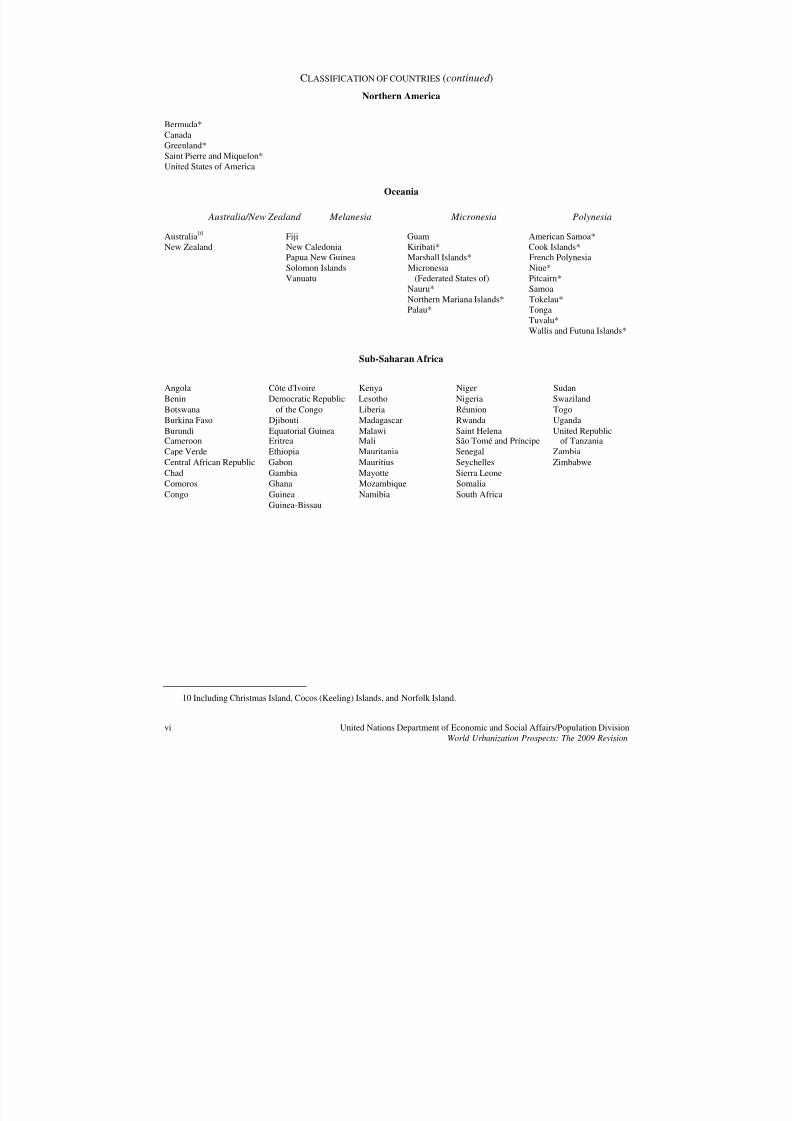
CLASSIFICATION OF COUNTRIES (continued )
Northern America
Bermuda*CanadaGreenland*Saint Pierre and Miquelon*United States of America
Oceania
Australia/New Zealand Melanesia Micronesia Polynesia
Australia10 Fiji Guam American Samoa*New Zealand New Caledonia Kiribati* Cook Islands*
Papua New Guinea Marshall Islands* French PolynesiaSolomon Islands Micronesia Niue*Vanuatu (Federated States of) Pitcairn*
Nauru* Samoa
Northern Mariana Islands* Tokelau*Palau* TongaTuvalu*Wallis and Futuna Islands*
Sub-Saharan Africa
Angola Côte d'Ivoire Kenya Niger SudanBenin Democratic Republic Lesotho Nigeria SwazilandBotswana of the Congo Liberia Réunion TogoBurkina Faso Djibouti Madagascar Rwanda UgandaBurundi Equatorial Guinea Malawi Saint Helena United RepublicCameroon Eritrea Mali São Tomé and Príncipe of Tanzania
Cape Verde Ethiopia Mauritania Senegal ZambiaCentral African Republic Gabon Mauritius Seychelles ZimbabweChad Gambia Mayotte Sierra LeoneComoros Ghana Mozambique SomaliaCongo Guinea Namibia South Africa
Guinea-Bissau
10 Including Christmas Island, Cocos (Keeling) Islands, and Norfolk Island.
8/3/2019 World Urbanization Prospects 2009 Revision (United Nations 2010)
http://slidepdf.com/reader/full/world-urbanization-prospects-2009-revision-united-nations-2010 9/56
United Nations Department of Economic and Social Affairs/Population Division viiWorld Urbanization Prospects: The 2009 Revision
CLASSIFICATION OF COUNTRIES (continued )
Least developed countries
Afghanistan Gambia RwandaAngola Guinea SamoaBangladesh Guinea-Bissau São Tomé and PríncipeBenin Haiti SenegalBhutan Kiribati Sierra LeoneBurkina Faso Lao People’s Democratic Republic Solomon IslandsBurundi Lesotho SomaliaCambodia Liberia SudanCentral African Republic Madagascar Timor-LesteChad Malawi TogoComoros Maldives TuvaluDemocratic Republic of the Congo Mali UgandaDjibouti Mauritania United Republic of TanzaniaEquatorial Guinea Mozambique VanuatuEritrea Myanmar YemenEthiopia Nepal Zambia
Niger
NOTE: Countries with fewer than 100,000 inhabitants in 2009 are marked by an asterisk (*).

8/3/2019 World Urbanization Prospects 2009 Revision (United Nations 2010)
http://slidepdf.com/reader/full/world-urbanization-prospects-2009-revision-united-nations-2010 10/56
8/3/2019 World Urbanization Prospects 2009 Revision (United Nations 2010)
http://slidepdf.com/reader/full/world-urbanization-prospects-2009-revision-united-nations-2010 11/56
United Nations Department of Economic and Social Affairs/Population Division 1World Urbanization Prospects: The 2009 Revision
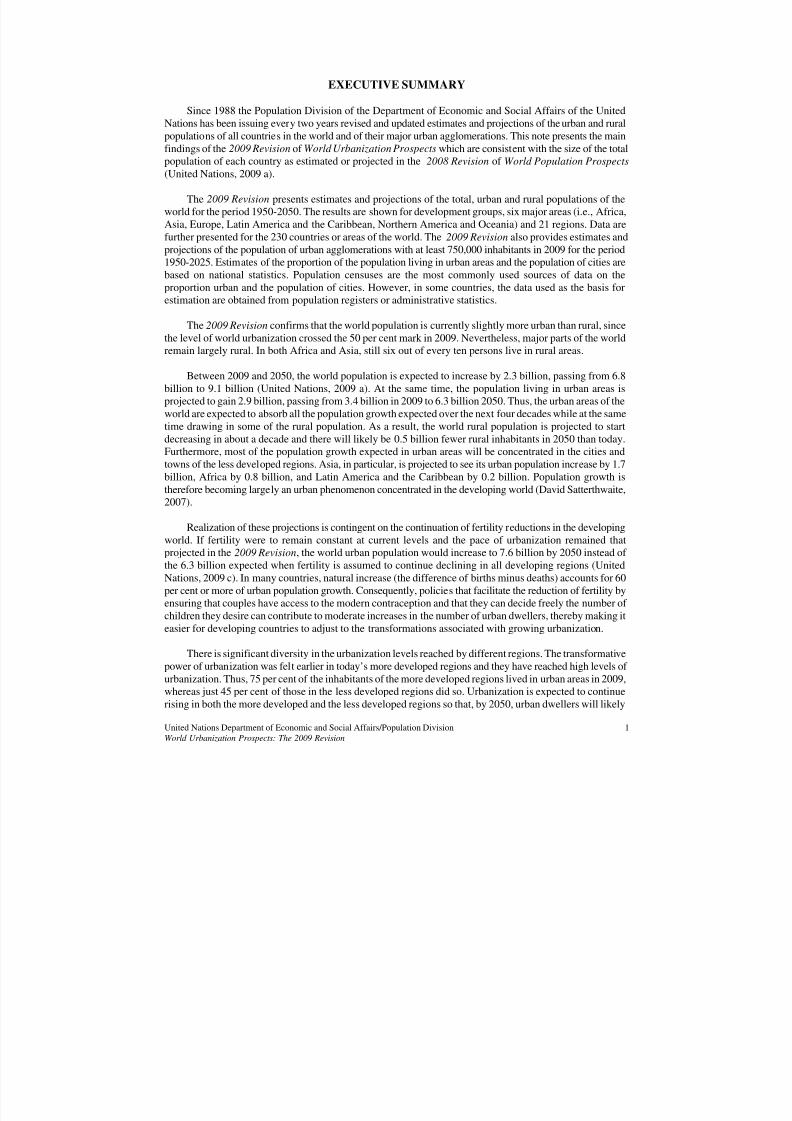
EXECUTIVE SUMMARY
Since 1988 the Population Division of the Department of Economic and Social Affairs of the UnitedNations has been issuing every two years revised and updated estimates and projections of the urban and ruralpopulations of all countries in the world and of their major urban agglomerations. This note presents the main
findings of the 2009 Revision of World Urbanization Prospects which are consistent with the size of the totalpopulation of each country as estimated or projected in the 2008 Revision of World Population Prospects (United Nations, 2009 a).
The 2009 Revision presents estimates and projections of the total, urban and rural populations of theworld for the period 1950-2050. The results are shown for development groups, six major areas (i.e., Africa,Asia, Europe, Latin America and the Caribbean, Northern America and Oceania) and 21 regions. Data arefurther presented for the 230 countries or areas of the world. The 2009 Revision also provides estimates andprojections of the population of urban agglomerations with at least 750,000 inhabitants in 2009 for the period1950-2025. Estimates of the proportion of the population living in urban areas and the population of cities arebased on national statistics. Population censuses are the most commonly used sources of data on theproportion urban and the population of cities. However, in some countries, the data used as the basis for
estimation are obtained from population registers or administrative statistics.
The 2009 Revision confirms that the world population is currently slightly more urban than rural, sincethe level of world urbanization crossed the 50 per cent mark in 2009. Nevertheless, major parts of the worldremain largely rural. In both Africa and Asia, still six out of every ten persons live in rural areas.
Between 2009 and 2050, the world population is expected to increase by 2.3 billion, passing from 6.8billion to 9.1 billion (United Nations, 2009 a). At the same time, the population living in urban areas isprojected to gain 2.9 billion, passing from 3.4 billion in 2009 to 6.3 billion 2050. Thus, the urban areas of theworld are expected to absorb all the population growth expected over the next four decades while at the sametime drawing in some of the rural population. As a result, the world rural population is projected to startdecreasing in about a decade and there will likely be 0.5 billion fewer rural inhabitants in 2050 than today.
Furthermore, most of the population growth expected in urban areas will be concentrated in the cities andtowns of the less developed regions. Asia, in particular, is projected to see its urban population increase by 1.7billion, Africa by 0.8 billion, and Latin America and the Caribbean by 0.2 billion. Population growth istherefore becoming largely an urban phenomenon concentrated in the developing world (David Satterthwaite,2007).
Realization of these projections is contingent on the continuation of fertility reductions in the developingworld. If fertility were to remain constant at current levels and the pace of urbanization remained thatprojected in the 2009 Revision, the world urban population would increase to 7.6 billion by 2050 instead of the 6.3 billion expected when fertility is assumed to continue declining in all developing regions (UnitedNations, 2009 c). In many countries, natural increase (the difference of births minus deaths) accounts for 60per cent or more of urban population growth. Consequently, policies that facilitate the reduction of fertility by
ensuring that couples have access to the modern contraception and that they can decide freely the number of children they desire can contribute to moderate increases in the number of urban dwellers, thereby making iteasier for developing countries to adjust to the transformations associated with growing urbanization.
There is significant diversity in the urbanization levels reached by different regions. The transformativepower of urbanization was felt earlier in today’s more developed regions and they have reached high levels of urbanization. Thus, 75 per cent of the inhabitants of the more developed regions lived in urban areas in 2009,whereas just 45 per cent of those in the less developed regions did so. Urbanization is expected to continuerising in both the more developed and the less developed regions so that, by 2050, urban dwellers will likely
8/3/2019 World Urbanization Prospects 2009 Revision (United Nations 2010)
http://slidepdf.com/reader/full/world-urbanization-prospects-2009-revision-united-nations-2010 12/56
United Nations Department of Economic and Social Affairs/Population DivisionWorld Urbanization Prospects: The 2009 Revision
2
account for 86 per cent of the population in the more developed regions and for 66 per cent of that in the lessdeveloped regions. Overall, the world population is expected to be 69 per cent urban in 2050.
Today’s 3.4 billion urban dwellers are distributed unevenly among urban settlements of different size. Indiscussing urbanization, the focus often is on large cities, cities whose populations are larger than those of many countries. In 2009, 21 urban agglomerations qualified as megacities because they had at least 10 million
inhabitants. Despite their visibility and dynamism, megacities account for a small though increasingproportion of the world urban population: 9.4 per cent in 2009 and 10.3 per cent in 2025. At the same time,over half of the urban population lives and will continue to live in small urban centres with fewer than half amillion inhabitants. These and other key findings of the 2009 Revision are summarized below.
Key Findings of the 2009 Revision
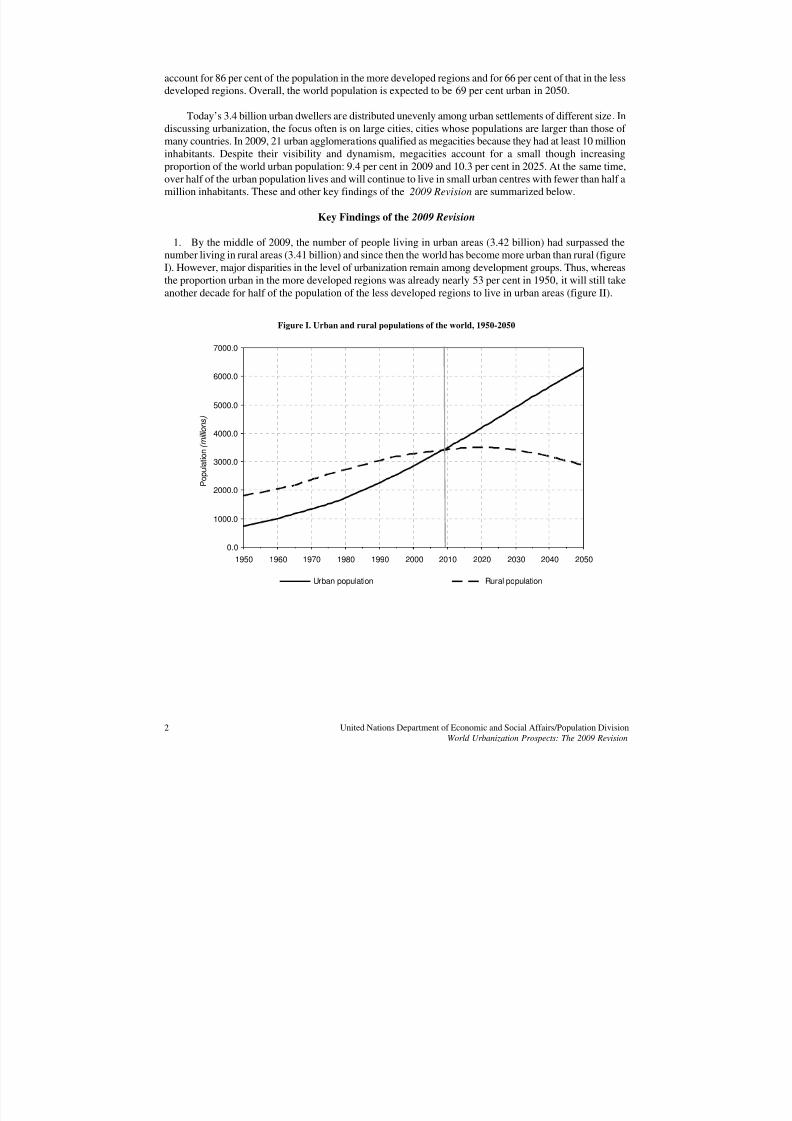
1. By the middle of 2009, the number of people living in urban areas (3.42 billion) had surpassed thenumber living in rural areas (3.41 billion) and since then the world has become more urban than rural (figureI). However, major disparities in the level of urbanization remain among development groups. Thus, whereasthe proportion urban in the more developed regions was already nearly 53 per cent in 1950, it will still takeanother decade for half of the population of the less developed regions to live in urban areas (figure II).
Figure I. Urban and rural populations of the world, 1950-2050
0.0
1000.0
2000.0
3000.0
4000.0
5000.0
6000.0
7000.0
1950 1960 1970 1980 1990 2000 2010 2020 2030 2040 2050
Year
P o p u l a t i o n ( m i l l i o n s )
Urban population Rural population

8/3/2019 World Urbanization Prospects 2009 Revision (United Nations 2010)
http://slidepdf.com/reader/full/world-urbanization-prospects-2009-revision-united-nations-2010 13/56
United Nations Department of Economic and Social Affairs/Population Division 3World Urbanization Prospects: The 2009 Revision
Figure II. Urban and rural populations by development group, 1950-2050
0.0
1000.0
2000.0
3000.0
4000.0
5000.0
6000.0
1950 1960 1970 1980 1990 2000 2010 2020 2030 2040 2050
Year
P o p u l a t i o n ( m i l l i o n s )
More developed regions, urban population Less developed regions, urban population
More developed regions, rural population Less developed regions, rural population
TABLE 1. TOTAL, URBAN AND RURAL POPULATIONS BY DEVELOPMENT GROUP, SELECTED PERIODS, 1950-2050
Population (billion) Average annual rate of change (percentage)
Development group 1950 1975 2009 2025 2050 1950-1975 1975-2009 2009-2025 2025-2050
Total population
World.................................... 2.53 4.06 6.83 8.01 9.15 1.89 1.53 1.00 0.53
More developed regions.... 0.81 1.05 1.23 1.28 1.28 1.02 0.48 0.22 -0.01
Less developed regions..... 1.72 3.01 5.60 6.73 7.87 2.25 1.82 1.16 0.63
Urban population
World.................................... 0.73 1.51 3.42 4.54 6.29 2.91 2.40 1.76 1.31
More developed regions.... 0.43 0.70 0.92 1.01 1.10 1.97 0.82 0.58 0.33
Less developed regions..... 0.30 0.81 2.50 3.52 5.19 3.96 3.30 2.15 1.55
Rural population
World.................................... 1.80 2.55 3.41 3.48 2.86 1.39 0.85 0.12 -0.77
More developed regions.... 0.39 0.35 0.31 0.26 0.18 -0.39 -0.35 -1.01 -1.62
Less developed regions..... 1.41 2.20 3.10 3.21 2.69 1.77 1.01 0.22 -0.71

8/3/2019 World Urbanization Prospects 2009 Revision (United Nations 2010)
http://slidepdf.com/reader/full/world-urbanization-prospects-2009-revision-united-nations-2010 14/56
United Nations Department of Economic and Social Affairs/Population DivisionWorld Urbanization Prospects: The 2009 Revision
4
2. The world urban population is expected to increase by 84 per cent by 2050, from 3.4 billion in 2009 to6.3 billion in 2050. By mid-century the world urban population will likely be the same size as the world’stotal population was in 2004. Virtually all of the expected growth in the world population will be concentratedin the urban areas of the less developed regions, whose population is projected to increase from 2.5 billion in2009 to 5.2 billion in 2050. Over the same period, the rural population of the less developed regions isexpected to decline from 3.4 billion to 2.9 billion. In the more developed regions, the urban population is
projected to increase modestly, from 0.9 billion in 2009 to 1.1 billion in 2050 (table 1).
TABLE 2. PERCENTAGE URBAN BY DEVELOPMENT GROUP, SELECTED PERIODS, 1950-2050
Rate of urbanization
Percentage urban (percentage)
Development group 1950 1975 2009 2025 2050 1950-1975 1975-2009 2009-2025 2025-2050
World...................................... 28.8 37.2 50.1 56.6 68.7 1.02 0.87 0.77 0.77
More developed regions ..... 52.6 66.7 74.9 79.4 86.2 0.95 0.34 0.36 0.33Less developed regions....... 17.6 27.0 44.6 52.3 65.9 1.71 1.48 0.99 0.92
3. The world rural population is expected to reach a maximum of 3.5 billion in 2020 and to decline slowlythereafter, to reach 2.9 billion in 2050 (figure I). These global trends are driven mostly by the dynamics of rural population growth in the less developed regions, which house today 91 per cent of the world ruralpopulation. Whereas the rural population of the more developed regions has been declining steadily duringthe second half of the twentieth century and will continue to do so for the foreseeable future, the ruralpopulation of the less developed regions more than doubled since 1950 and will likely continue to grow until2022 before a long-term decline sets in.
4. The rate of growth of the world urban population is slowing down (table 1). Between 1950 and 2009,the world urban population grew at an average rate of 2.6 per cent per year and increased nearly fivefold over
the period, passing from 0.7 billion to 3.4 billion. During 2009-2025, the world urban population is projectedto grow at an average annual rate of 1.8 per cent, which, if maintained, would lead to a doubling of the urbanpopulation in 39 years. During 2025-2050, the urban growth rate is expected to decline further to 1.3 per centper year, implying a doubling time of 53 years.
5. The sustained increase of the urban population combined with the pronounced deceleration of ruralpopulation growth will result in continued urbanization, that is, in increasing proportions of the populationliving in urban areas. Globally, the level of urbanization is expected to rise from 50 per cent in 2009 to 69 percent in 2050 (table 2). The more developed regions are expected to see their level of urbanization increasefrom 75 per cent to 86 per cent over the same period. In the less developed regions, the proportion urban willlikely increase from 45 per cent in 2009 to 66 per cent in 2050 (table 2).
6. The world urban population is not distributed evenly among cities of different sizes. Over half of theworld’s 3.4 billion urban dwellers (51.9 per cent) lived in cities or towns with fewer than half a millioninhabitants. Such small cities account for 53.2 per cent of the urban population in the more developed regionsand for 51.4 per cent of that in the less developed regions. Between 2009 and 2025, small urban centres withfewer than half a million inhabitants are expected to account for 45 per cent of the expected increase in theworld urban population.
8/3/2019 World Urbanization Prospects 2009 Revision (United Nations 2010)
http://slidepdf.com/reader/full/world-urbanization-prospects-2009-revision-united-nations-2010 15/56
United Nations Department of Economic and Social Affairs/Population Division 5World Urbanization Prospects: The 2009 Revision
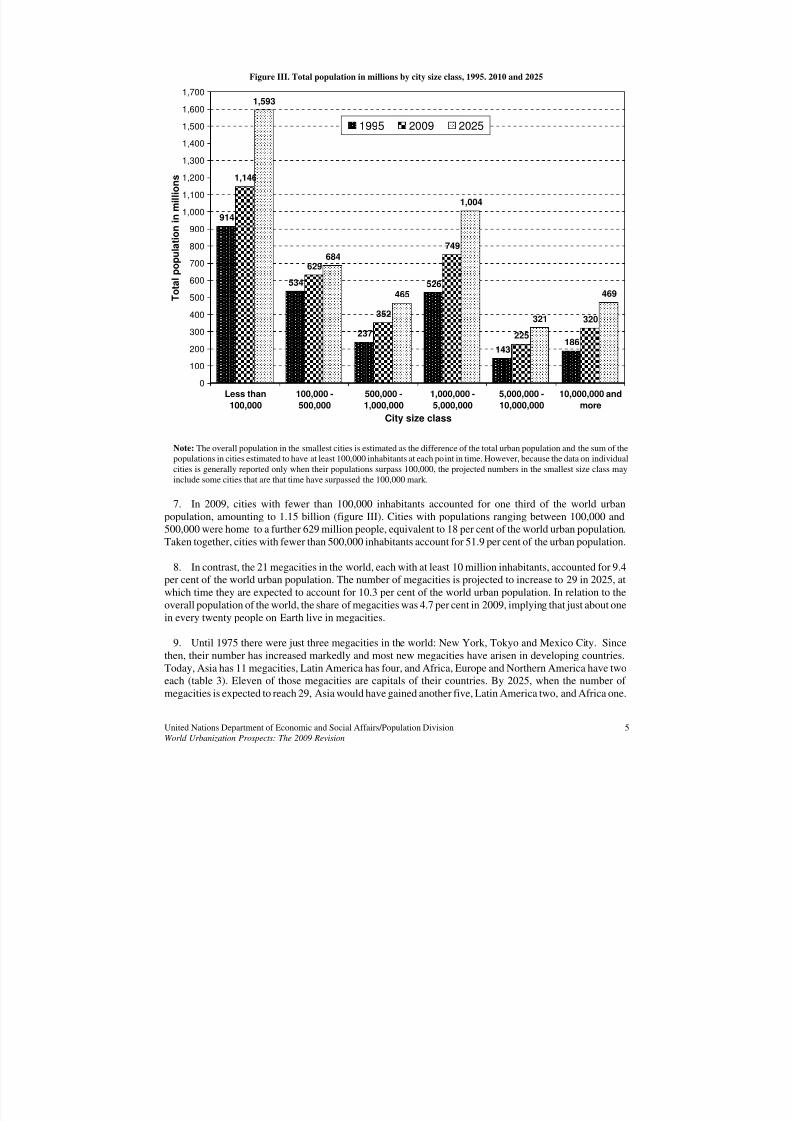
Figure III. Total population in millions by city size class, 1995. 2010 and 2025
914
534
237
526
143186
1,146
629
352
749
225
320
1,593
684
465
1,004
321
469
0
100
200
300
400
500
600
700
800
900
1,000
1,100
1,200
1,300
1,400
1,500
1,600
1,700
Less than
100,000
100,000 -
500,000
500,000 -
1,000,000
1,000,000 -
5,000,000
5,000,000 -
10,000,000
10,000,000 and
more
City size class
T o t a l p o p u l a t i o n i n m i l l i o n s
1995 2009 2025
Note: The overall population in the smallest cities is estimated as the difference of the total urban population and the sum of thepopulations in cities estimated to have at least 100,000 inhabitants at each point in time. However, because the data on individualcities is generally reported only when their populations surpass 100,000, the projected numbers in the smallest size class mayinclude some cities that are that time have surpassed the 100,000 mark.
7. In 2009, cities with fewer than 100,000 inhabitants accounted for one third of the world urbanpopulation, amounting to 1.15 billion (figure III). Cities with populations ranging between 100,000 and500,000 were home to a further 629 million people, equivalent to 18 per cent of the world urban population.Taken together, cities with fewer than 500,000 inhabitants account for 51.9 per cent of the urban population.
8. In contrast, the 21 megacities in the world, each with at least 10 million inhabitants, accounted for 9.4per cent of the world urban population. The number of megacities is projected to increase to 29 in 2025, atwhich time they are expected to account for 10.3 per cent of the world urban population. In relation to the
overall population of the world, the share of megacities was 4.7 per cent in 2009, implying that just about onein every twenty people on Earth live in megacities.
9. Until 1975 there were just three megacities in the world: New York, Tokyo and Mexico City. Sincethen, their number has increased markedly and most new megacities have arisen in developing countries.Today, Asia has 11 megacities, Latin America has four, and Africa, Europe and Northern America have twoeach (table 3). Eleven of those megacities are capitals of their countries. By 2025, when the number of megacities is expected to reach 29, Asia would have gained another five, Latin America two, and Africa one.
8/3/2019 World Urbanization Prospects 2009 Revision (United Nations 2010)
http://slidepdf.com/reader/full/world-urbanization-prospects-2009-revision-united-nations-2010 16/56
United Nations Department of Economic and Social Affairs/Population DivisionWorld Urbanization Prospects: The 2009 Revision
6
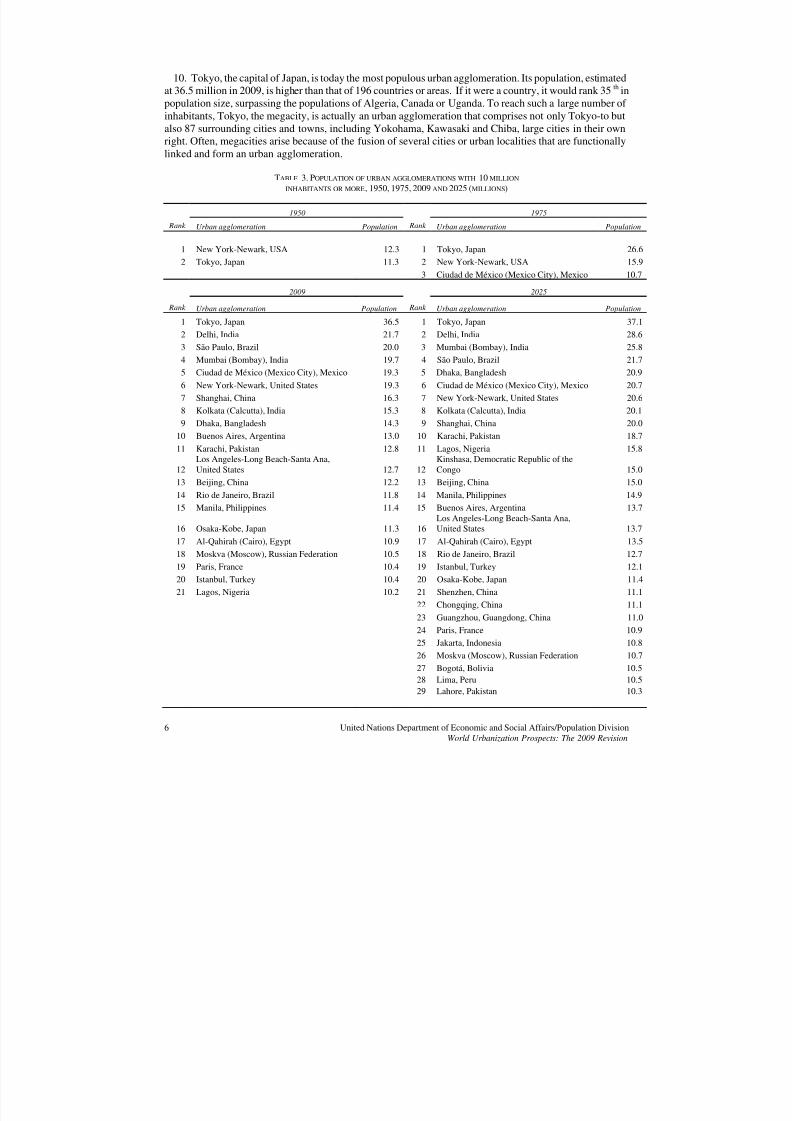
10. Tokyo, the capital of Japan, is today the most populous urban agglomeration. Its population, estimatedat 36.5 million in 2009, is higher than that of 196 countries or areas. If it were a country, it would rank 35th inpopulation size, surpassing the populations of Algeria, Canada or Uganda. To reach such a large number of inhabitants, Tokyo, the megacity, is actually an urban agglomeration that comprises not only Tokyo-to butalso 87 surrounding cities and towns, including Yokohama, Kawasaki and Chiba, large cities in their ownright. Often, megacities arise because of the fusion of several cities or urban localities that are functionally
linked and form an urban agglomeration.
TABLE 3. POPULATION OF URBAN AGGLOMERATIONS WITH 10 MILLION
INHABITANTS OR MORE, 1950, 1975, 2009 AND 2025 (MILLIONS)
1950 1975
Rank Urban agglomeration Population Rank Urban agglomeration Population
1 New York-Newark, USA 12.3 1 Tokyo, Japan 26.62 Tokyo, Japan 11.3 2 New York-Newark, USA 15.9
3 Ciudad de México (Mexico City), Mexico 10.7
2009 2025
Rank Urban agglomeration Population Rank Urban agglomeration Population
1 Tokyo, Japan 36.5 1 Tokyo, Japan 37.12 Delhi, India 21.7 2 Delhi, India 28.63 São Paulo, Brazil 20.0 3 Mumbai (Bombay), India 25.84 Mumbai (Bombay), India 19.7 4 São Paulo, Brazil 21.75 Ciudad de México (Mexico City), Mexico 19.3 5 Dhaka, Bangladesh 20.9
6 New York-Newark, United States 19.3 6 Ciudad de México (Mexico City), Mexico 20.77 Shanghai, China 16.3 7 New York-Newark, United States 20.68 Kolkata (Calcutta), India 15.3 8 Kolkata (Calcutta), India 20.19 Dhaka, Bangladesh 14.3 9 Shanghai, China 20.0
10 Buenos Aires, Argentina 13.0 10 Karachi, Pakistan 18.7
11 Karachi, Pakistan 12.8 11 Lagos, Nigeria 15.8
12Los Angeles-Long Beach-Santa Ana,United States 12.7 12
Kinshasa, Democratic Republic of theCongo 15.0
13 Beijing, China 12.2 13 Beijing, China 15.0
14 Rio de Janeiro, Brazil 11.8 14 Manila, Philippines 14.915 Manila, Philippines 11.4 15 Buenos Aires, Argentina 13.7
16 Osaka-Kobe, Japan 11.3 16Los Angeles-Long Beach-Santa Ana,United States 13.7
17 Al-Qahirah (Cairo), Egypt 10.9 17 Al-Qahirah (Cairo), Egypt 13.518 Moskva (Moscow), Russian Federation 10.5 18 Rio de Janeiro, Brazil 12.719 Paris, France 10.4 19 Istanbul, Turkey 12.120 Istanbul, Turkey 10.4 20 Osaka-Kobe, Japan 11.421 Lagos, Nigeria 10.2 21 Shenzhen, China 11.1
22 Chongqing, China 11.123 Guangzhou, Guangdong, China 11.024 Paris, France 10.925 Jakarta, Indonesia 10.826 Moskva (Moscow), Russian Federation 10.727 Bogotá, Bolivia 10.528 Lima, Peru 10.529 Lahore, Pakistan 10.3
8/3/2019 World Urbanization Prospects 2009 Revision (United Nations 2010)
http://slidepdf.com/reader/full/world-urbanization-prospects-2009-revision-united-nations-2010 17/56
United Nations Department of Economic and Social Affairs/Population Division 7World Urbanization Prospects: The 2009 Revision
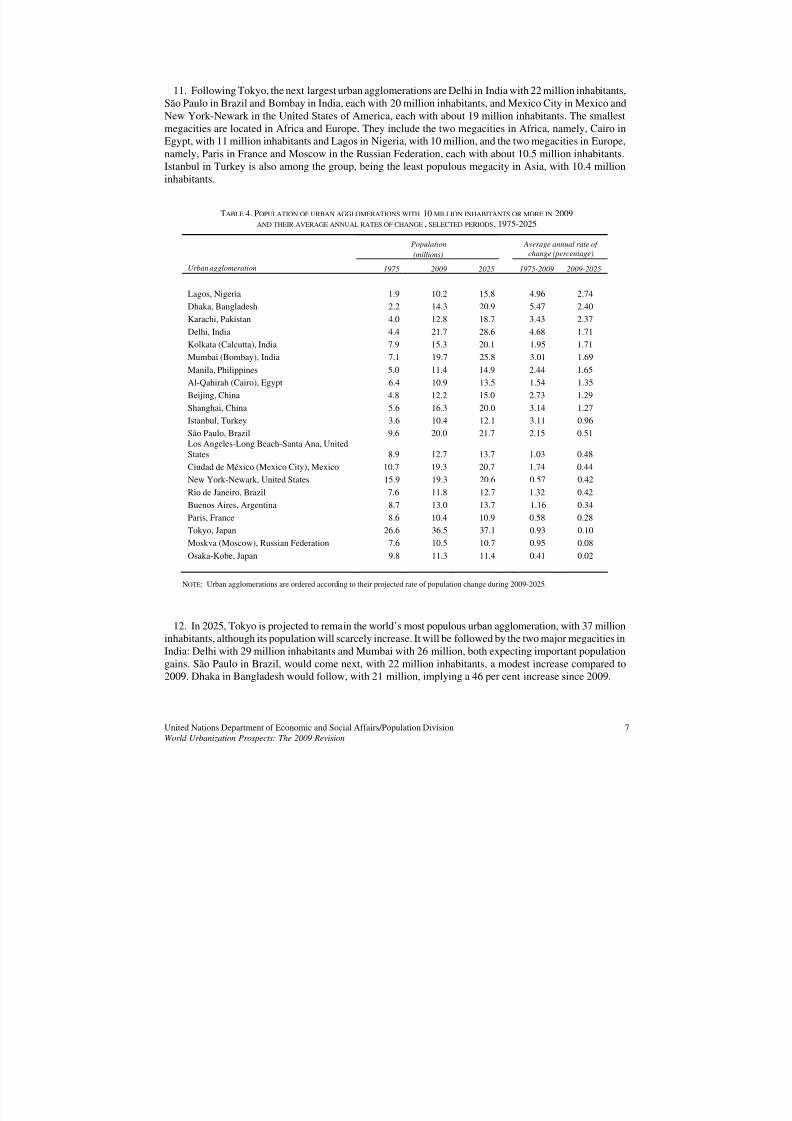
11. Following Tokyo, the next largest urban agglomerations are Delhi in India with 22 million inhabitants,São Paulo in Brazil and Bombay in India, each with 20 million inhabitants, and Mexico City in Mexico andNew York-Newark in the United States of America, each with about 19 million inhabitants. The smallestmegacities are located in Africa and Europe. They include the two megacities in Africa, namely, Cairo inEgypt, with 11 million inhabitants and Lagos in Nigeria, with 10 million, and the two megacities in Europe,
namely, Paris in France and Moscow in the Russian Federation, each with about 10.5 million inhabitants.Istanbul in Turkey is also among the group, being the least populous megacity in Asia, with 10.4 millioninhabitants.
TABLE 4. POPULATION OF URBAN AGGLOMERATIONS WITH 10 MILLION INHABITANTS OR MORE IN 2009
AND THEIR AVERAGE ANNUAL RATES OF CHANGE, SELECTED PERIODS, 1975-2025
Population
(millions)
Average annual rate of
change (percentage)
Urban agglomeration 1975 2009 2025 1975-2009 2009-2025
Lagos, Nigeria 1.9 10.2 15.8 4.96 2.74
Dhaka, Bangladesh 2.2 14.3 20.9 5.47 2.40Karachi, Pakistan 4.0 12.8 18.7 3.43 2.37Delhi, India 4.4 21.7 28.6 4.68 1.71Kolkata (Calcutta), India 7.9 15.3 20.1 1.95 1.71Mumbai (Bombay), India 7.1 19.7 25.8 3.01 1.69
Manila, Philippines 5.0 11.4 14.9 2.44 1.65Al-Qahirah (Cairo), Egypt 6.4 10.9 13.5 1.54 1.35Beijing, China 4.8 12.2 15.0 2.73 1.29Shanghai, China 5.6 16.3 20.0 3.14 1.27Istanbul, Turkey 3.6 10.4 12.1 3.11 0.96São Paulo, Brazil 9.6 20.0 21.7 2.15 0.51Los Angeles-Long Beach-Santa Ana, United
States 8.9 12.7 13.7 1.03 0.48Ciudad de México (Mexico City), Mexico 10.7 19.3 20.7 1.74 0.44New York-Newark, United States 15.9 19.3 20.6 0.57 0.42
Rio de Janeiro, Brazil 7.6 11.8 12.7 1.32 0.42Buenos Aires, Argentina 8.7 13.0 13.7 1.16 0.34Paris, France 8.6 10.4 10.9 0.58 0.28Tokyo, Japan 26.6 36.5 37.1 0.93 0.10Moskva (Moscow), Russian Federation 7.6 10.5 10.7 0.95 0.08
Osaka-Kobe, Japan 9.8 11.3 11.4 0.41 0.02
NOTE: Urban agglomerations are ordered according to their projected rate of population change during 2009-2025.
12. In 2025, Tokyo is projected to remain the world’s most populous urban agglomeration, with 37 millioninhabitants, although its population will scarcely increase. It will be followed by the two major megacities inIndia: Delhi with 29 million inhabitants and Mumbai with 26 million, both expecting important populationgains. São Paulo in Brazil, would come next, with 22 million inhabitants, a modest increase compared to2009. Dhaka in Bangladesh would follow, with 21 million, implying a 46 per cent increase since 2009.
8/3/2019 World Urbanization Prospects 2009 Revision (United Nations 2010)
http://slidepdf.com/reader/full/world-urbanization-prospects-2009-revision-united-nations-2010 18/56
United Nations Department of Economic and Social Affairs/Population DivisionWorld Urbanization Prospects: The 2009 Revision
8
13. Megacities are experiencing very different rates of population change. The populations of 9 of the 21megacities of 2009 are expected to grow at rates ranging from a very low 0.02 per cent per year to at most0.51 per cent per year during 2009-2025 (table 4). The megacities exhibiting such relatively slow rates of population growth include all those located in developed countries (France, Japan, the Russian Federation andthe United States) plus the four megacities in Latin America. Very high rates of growth are expected in Lagosin Nigeria, Dhaka in Bangladesh and Karachi in Pakistan (all having growth rates well above 2 per cent per
year). In addition, the megacities in India (Delhi, Calcutta and Bombay) plus Manila in the Philippines areexpected to grow considerably faster than those in China, Egypt or Turkey. These trends are consistent withthe overall differentials in fertility among the national populations concerned. As noted earlier, the excess of births over deaths is an important component of population growth in most urban areas and the projected ratesof population growth in megacities reflect the gradient in natural increase of the countries they belong to.
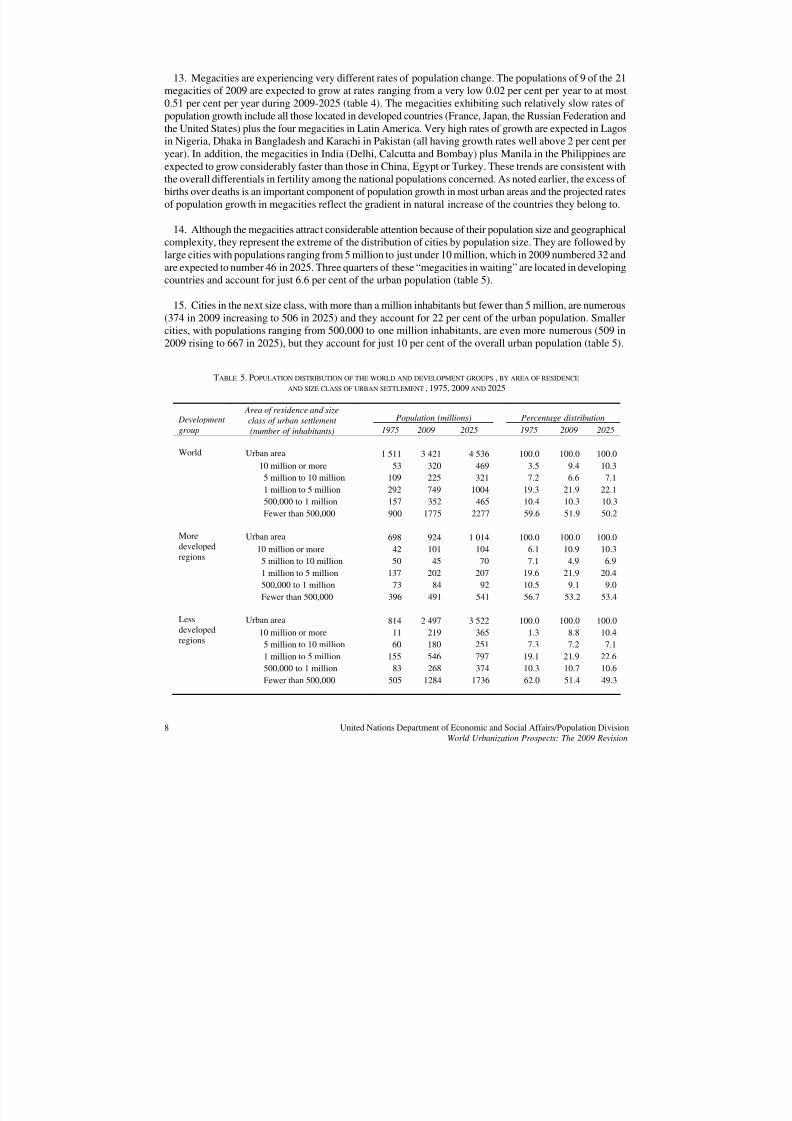
14. Although the megacities attract considerable attention because of their population size and geographicalcomplexity, they represent the extreme of the distribution of cities by population size. They are followed bylarge cities with populations ranging from 5 million to just under 10 million, which in 2009 numbered 32 andare expected to number 46 in 2025. Three quarters of these “megacities in waiting” are located in developingcountries and account for just 6.6 per cent of the urban population (table 5).
15. Cities in the next size class, with more than a million inhabitants but fewer than 5 million, are numerous(374 in 2009 increasing to 506 in 2025) and they account for 22 per cent of the urban population. Smallercities, with populations ranging from 500,000 to one million inhabitants, are even more numerous (509 in2009 rising to 667 in 2025), but they account for just 10 per cent of the overall urban population (table 5).
TABLE 5. POPULATION DISTRIBUTION OF THE WORLD AND DEVELOPMENT GROUPS, BY AREA OF RESIDENCE AND SIZE CLASS OF URBAN SETTLEMENT, 1975, 2009 AND 2025
Population (millions) Percentage distribution Development
group
Area of residence and size
class of urban settlement
(number of inhabitants) 1975 2009 2025 1975 2009 2025
Urban area 1 511 3 421 4 536 100.0 100.0 100.010 million or more 53 320 469 3.5 9.4 10.35 million to 10 million 109 225 321 7.2 6.6 7.11 million to 5 million 292 749 1004 19.3 21.9 22.1500,000 to 1 million 157 352 465 10.4 10.3 10.3
World
Fewer than 500,000 900 1775 2277 59.6 51.9 50.2
Urban area 698 924 1 014 100.0 100.0 100.010 million or more 42 101 104 6.1 10.9 10.35 million to 10 million 50 45 70 7.1 4.9 6.91 million to 5 million 137 202 207 19.6 21.9 20.4500,000 to 1 million 73 84 92 10.5 9.1 9.0
Moredevelopedregions
Fewer than 500,000 396 491 541 56.7 53.2 53.4
Urban area 814 2 497 3 522 100.0 100.0 100.010 million or more 11 219 365 1.3 8.8 10.45 million to 10 million 60 180 251 7.3 7.2 7.11 million to 5 million 155 546 797 19.1 21.9 22.6500,000 to 1 million 83 268 374 10.3 10.7 10.6
Lessdevelopedregions
Fewer than 500,000 505 1284 1736 62.0 51.4 49.3
8/3/2019 World Urbanization Prospects 2009 Revision (United Nations 2010)
http://slidepdf.com/reader/full/world-urbanization-prospects-2009-revision-united-nations-2010 19/56
United Nations Department of Economic and Social Affairs/Population Division 9World Urbanization Prospects: The 2009 Revision
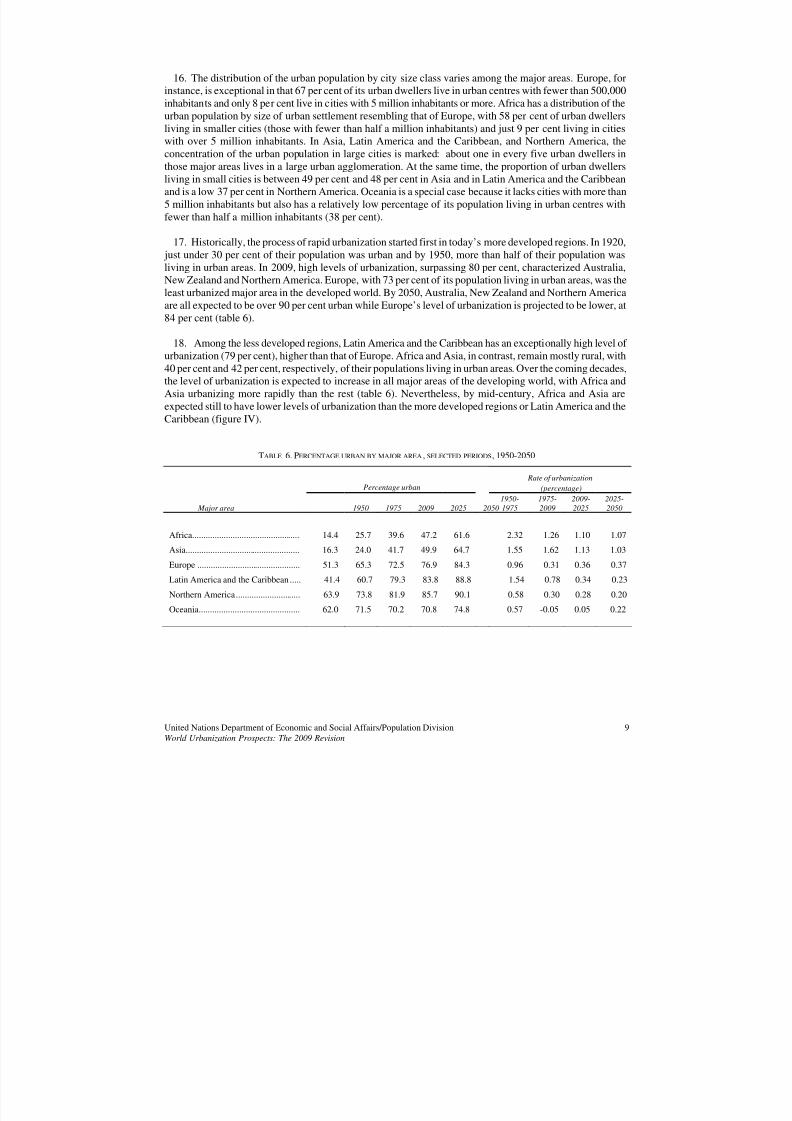
16. The distribution of the urban population by city size class varies among the major areas. Europe, forinstance, is exceptional in that 67 per cent of its urban dwellers live in urban centres with fewer than 500,000inhabitants and only 8 per cent live in cities with 5 million inhabitants or more. Africa has a distribution of theurban population by size of urban settlement resembling that of Europe, with 58 per cent of urban dwellersliving in smaller cities (those with fewer than half a million inhabitants) and just 9 per cent living in citieswith over 5 million inhabitants. In Asia, Latin America and the Caribbean, and Northern America, the
concentration of the urban population in large cities is marked: about one in every five urban dwellers inthose major areas lives in a large urban agglomeration. At the same time, the proportion of urban dwellersliving in small cities is between 49 per cent and 48 per cent in Asia and in Latin America and the Caribbeanand is a low 37 per cent in Northern America. Oceania is a special case because it lacks cities with more than5 million inhabitants but also has a relatively low percentage of its population living in urban centres withfewer than half a million inhabitants (38 per cent).
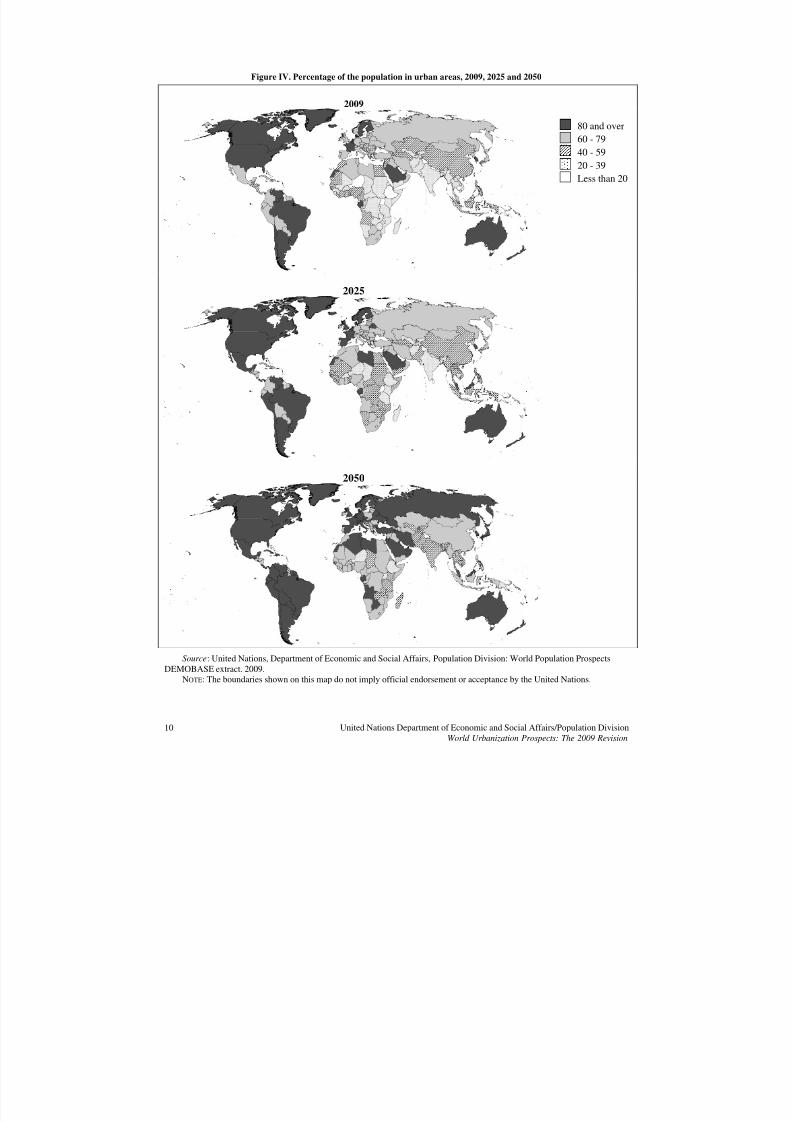
17. Historically, the process of rapid urbanization started first in today’s more developed regions. In 1920, just under 30 per cent of their population was urban and by 1950, more than half of their population wasliving in urban areas. In 2009, high levels of urbanization, surpassing 80 per cent, characterized Australia,New Zealand and Northern America. Europe, with 73 per cent of its population living in urban areas, was theleast urbanized major area in the developed world. By 2050, Australia, New Zealand and Northern America
are all expected to be over 90 per cent urban while Europe’s level of urbanization is projected to be lower, at84 per cent (table 6).
18. Among the less developed regions, Latin America and the Caribbean has an exceptionally high level of urbanization (79 per cent), higher than that of Europe. Africa and Asia, in contrast, remain mostly rural, with40 per cent and 42 per cent, respectively, of their populations living in urban areas. Over the coming decades,the level of urbanization is expected to increase in all major areas of the developing world, with Africa andAsia urbanizing more rapidly than the rest (table 6). Nevertheless, by mid-century, Africa and Asia areexpected still to have lower levels of urbanization than the more developed regions or Latin America and theCaribbean (figure IV).
TABLE 6. PERCENTAGE URBAN BY MAJOR AREA, SELECTED PERIODS, 1950-2050 Rate of urbanization
Percentage urban (percentage)
Major area 1950 1975 2009 2025 2050
1950-
1975
1975-
2009
2009-
2025
2025-
2050
Africa................................................ 14.4 25.7 39.6 47.2 61.6 2.32 1.26 1.10 1.07
Asia................................................... 16.3 24.0 41.7 49.9 64.7 1.55 1.62 1.13 1.03
Europe .............................................. 51.3 65.3 72.5 76.9 84.3 0.96 0.31 0.36 0.37
Latin America and the Caribbean ..... 41.4 60.7 79.3 83.8 88.8 1.54 0.78 0.34 0.23
Northern America............................. 63.9 73.8 81.9 85.7 90.1 0.58 0.30 0.28 0.20
Oceania............................................. 62.0 71.5 70.2 70.8 74.8 0.57 -0.05 0.05 0.22
8/3/2019 World Urbanization Prospects 2009 Revision (United Nations 2010)
http://slidepdf.com/reader/full/world-urbanization-prospects-2009-revision-united-nations-2010 20/56
United Nations Department of Economic and Social Affairs/Population DivisionWorld Urbanization Prospects: The 2009 Revision
10
Figure IV. Percentage of the population in urban areas, 2009, 2025 and 2050
2009
2025
2050
Source: United Nations, Department of Economic and Social Affairs, Population Division: World Population ProspectsDEMOBASE extract. 2009.
NOTE: The boundaries shown on this map do not imply official endorsement or acceptance by the United Nations.
80 and over60 - 79
40 - 5920 - 39Less than 20

8/3/2019 World Urbanization Prospects 2009 Revision (United Nations 2010)
http://slidepdf.com/reader/full/world-urbanization-prospects-2009-revision-united-nations-2010 21/56
United Nations Department of Economic and Social Affairs/Population Division 11World Urbanization Prospects: The 2009 Revision
Figure V. Distribution of the world urban population by major area, 1950, 2009, 2050
4%
31%
38%
9%
15%
1%
50%
13%
8%
1%
20%
54%
1%
12%
16%
9%
6%
10%
0%
10%
20%
30%
40%
50%
60%
Africa Asia Europe Latin America
and the
Caribbean
Northern
America
Oceania
1950 2009 2050
19. Despite its low level of urbanization, in 2009 Asia was home to about half of the urban population in
the world. Europe had the second highest share, at 16 per cent (figure V). Over the next four decades, Africaand Asia will experience a marked increase in their urban populations. In Africa the urban population is likelyto treble and in Asia it will almost double (table 7). By mid-century, most of the urban population of the
world will be concentrated in Asia (54 per cent) and Africa (20 per cent).
20. With the exception of Africa and Oceania, all major areas are expected to have smaller ruralpopulations in 2050 than today (table 7). Africa’s rural population may start to decline before the mid-century. Today, the majority of rural dwellers live in Asia (70 per cent) and Africa (18 per cent) and theconcentration of the world rural population in these two major areas combined is expected to increase so that,by 2050, 65 per cent of all rural inhabitants are projected to live in Asia and 27 per cent in Africa.
21. The world urban population is highly concentrated in a few countries. In 2009, about three quarters of the 3.4 billion urban dwellers on Earth lived in 25 countries, whose urban populations ranged from 31 millionin South Africa to 620 million in China. China, India and the United States accounted for 36 per cent of theworld urban population. Most of the 25 countries with the largest urban populations are highly urbanized, but
eight have levels of urbanization ranging from 28 per cent to 49 per cent and they include some of the mostpopulous countries in the world: Bangladesh, China, India, Indonesia, Nigeria and Pakistan.
22. Most countries have small urban populations. In 2009, two thirds of the 230 countries or areasconsidered had fewer than 5 million urban dwellers and they accounted for 6 per cent of the world urbanpopulation. Among them, 58 per cent had urban populations below one million and accounted for 0.5 per centof all urban dwellers on Earth. By 2050, just half of all countries or areas are expected to have fewer than 5million urban dwellers and will account for 2.1 per cent of the world urban population.
8/3/2019 World Urbanization Prospects 2009 Revision (United Nations 2010)
http://slidepdf.com/reader/full/world-urbanization-prospects-2009-revision-united-nations-2010 22/56
United Nations Department of Economic and Social Affairs/Population DivisionWorld Urbanization Prospects: The 2009 Revision
12
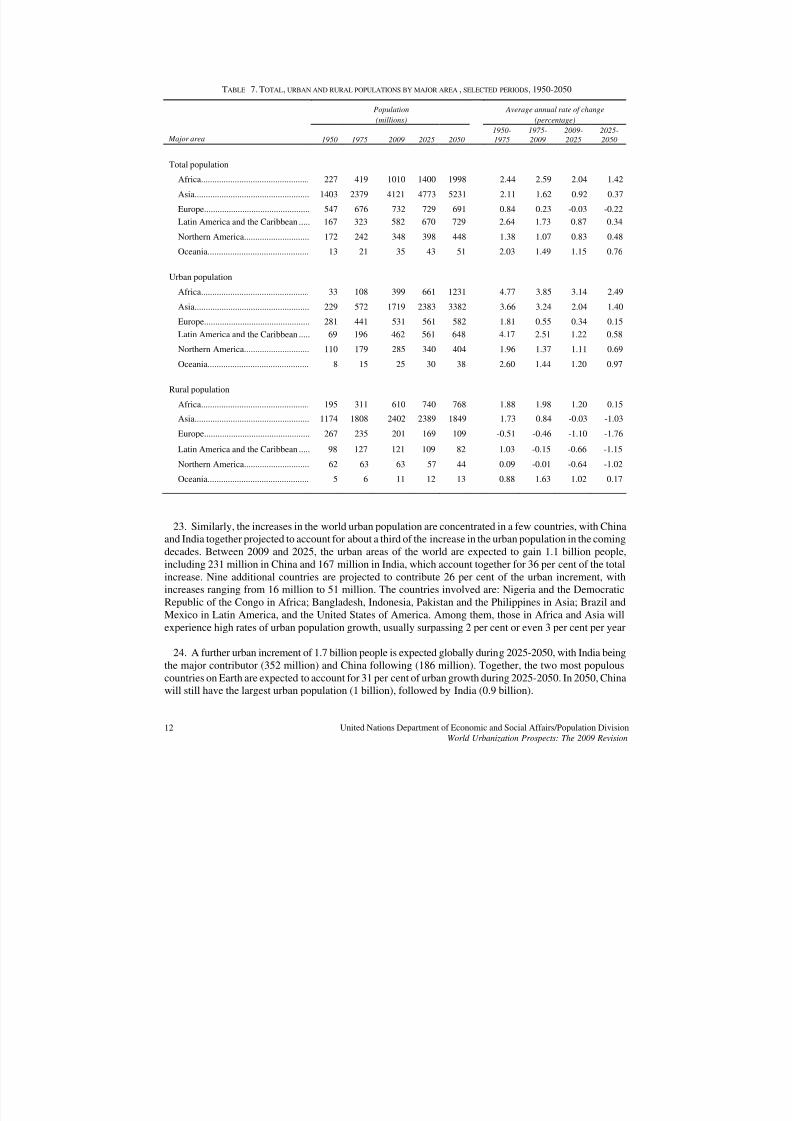
TABLE 7. TOTAL, URBAN AND RURAL POPULATIONS BY MAJOR AREA, SELECTED PERIODS, 1950-2050 Population Average annual rate of change
(millions) (percentage)
Major area 1950 1975 2009 2025 2050
1950-
1975
1975-
2009
2009-
2025
2025-
2050
Total population
Africa................................................ 227 419 1010 1400 1998 2.44 2.59 2.04 1.42
Asia................................................... 1403 2379 4121 4773 5231 2.11 1.62 0.92 0.37
Europe............................................... 547 676 732 729 691 0.84 0.23 -0.03 -0.22Latin America and the Caribbean ..... 167 323 582 670 729 2.64 1.73 0.87 0.34
Northern America............................. 172 242 348 398 448 1.38 1.07 0.83 0.48
Oceania............................................. 13 21 35 43 51 2.03 1.49 1.15 0.76
Urban population
Africa................................................ 33 108 399 661 1231 4.77 3.85 3.14 2.49
Asia................................................... 229 572 1719 2383 3382 3.66 3.24 2.04 1.40
Europe............................................... 281 441 531 561 582 1.81 0.55 0.34 0.15
Latin America and the Caribbean ..... 69 196 462 561 648 4.17 2.51 1.22 0.58
Northern America............................. 110 179 285 340 404 1.96 1.37 1.11 0.69
Oceania............................................. 8 15 25 30 38 2.60 1.44 1.20 0.97
Rural population
Africa................................................ 195 311 610 740 768 1.88 1.98 1.20 0.15
Asia................................................... 1174 1808 2402 2389 1849 1.73 0.84 -0.03 -1.03
Europe............................................... 267 235 201 169 109 -0.51 -0.46 -1.10 -1.76
Latin America and the Caribbean ..... 98 127 121 109 82 1.03 -0.15 -0.66 -1.15
Northern America............................. 62 63 63 57 44 0.09 -0.01 -0.64 -1.02
Oceania............................................. 5 6 11 12 13 0.88 1.63 1.02 0.17
23. Similarly, the increases in the world urban population are concentrated in a few countries, with Chinaand India together projected to account for about a third of the increase in the urban population in the comingdecades. Between 2009 and 2025, the urban areas of the world are expected to gain 1.1 billion people,including 231 million in China and 167 million in India, which account together for 36 per cent of the totalincrease. Nine additional countries are projected to contribute 26 per cent of the urban increment, withincreases ranging from 16 million to 51 million. The countries involved are: Nigeria and the Democratic
Republic of the Congo in Africa; Bangladesh, Indonesia, Pakistan and the Philippines in Asia; Brazil andMexico in Latin America, and the United States of America. Among them, those in Africa and Asia willexperience high rates of urban population growth, usually surpassing 2 per cent or even 3 per cent per year
24. A further urban increment of 1.7 billion people is expected globally during 2025-2050, with India beingthe major contributor (352 million) and China following (186 million). Together, the two most populouscountries on Earth are expected to account for 31 per cent of urban growth during 2025-2050. In 2050, Chinawill still have the largest urban population (1 billion), followed by India (0.9 billion).

8/3/2019 World Urbanization Prospects 2009 Revision (United Nations 2010)
http://slidepdf.com/reader/full/world-urbanization-prospects-2009-revision-united-nations-2010 23/56
United Nations Department of Economic and Social Affairs/Population Division 13World Urbanization Prospects: The 2009 Revision
25. In a few developed countries, the urban population will decrease. Despite the projected increases in thelevel of urbanization, overall population decline in several countries will lead to a reduction in the number of urban dwellers. Between 2009 and 2025, the urban population of the Russian Federation and that of Ukraineare projected to decline by 3 million and 0.7 million, respectively. Between 2025 and 2050, more countrieswill experience reductions in the urban population. Those with the largest drops include Japan (a reduction of 4.5 million), the Republic of Korea (2.9 million), the Russian Federation (4.1 million) and Ukraine (2
million).
26. The rural population is even more highly concentrated in a few countries than the urban population. In2009, 18 countries accounted for 75 per cent of the rural population and all but three (Japan, the RussianFederation and the United States) are located in Africa or Asia. India has the largest rural population (842million), followed by China (725 million). Together, they account for 46 per cent of the world ruralpopulation. Bangladesh, Indonesia and Pakistan follow, each with over 115 million rural inhabitants.
27. In Africa, the largest rural populations are located in Nigeria (79 million), Ethiopia (69 million), Egypt(47 million), the Democratic Republic of the Congo (43 million), the United Republic of Tanzania (32million) and Kenya (31 million). During 2009-2025, the rural populations of most of those African countriesare projected to increase at rates higher than 1.3 per cent per year, except in the cases of Nigeria and Egypt.
Among the populous countries in Asia, Pakistan is expected to experience the highest growth rate of the ruralpopulation during 2009-2025 (1.2 per cent per year). In contrast, in seven of the 18 countries with large ruralpopulations, the rural population is declining, with China, Japan, the Russian Federation, Thailand and theUnited States having the fastest rates of decline.
28. As in the case of the urban population, most countries have small rural populations. In 2009, two thirdsof the 230 countries or areas considered had at most 5 million rural inhabitants and accounted for 4.8 per centof the world rural population. In three quarters of them, the rural population is projected to decrease during2009-2050.
29. Faced with the opportunities and challenges associated with urbanization, many Governments haveconsistently considered their population’s spatial distribution as a concern. In 2009, 83 per cent of
Governments expressed concern about their pattern of population distribution, down from 89 per cent in the1970s (table 8). Among developing countries, 58 per cent expressed the desire to modify in a major way thespatial distribution of their populations, whereas 28 per cent wanted to effect only minor changes. Amongdeveloped countries, 29 per cent desired a major change and 43 per cent a minor change.
30. Dissatisfaction regarding patterns of population distribution was highest in Africa (75 per cent of itscountries wished to make major changes in the spatial distribution of their populations) and Asia (57 per centdesired a major change). In Latin America and the Caribbean, Oceania and Europe, about 40 per cent of Governments considered that major changes in spatial distribution were desirable.
31. Policies aimed at modifying the spatial distribution of a population often focus on ways to reducemigrant flows to large cities. In 1976, 44 per cent of developing countries reported having implemented such
policies and by 2009, that proportion had increased to 72 per cent. At the same time, among developedcountries, the proportion having policies to reduce migrant flows to large cities declined from 55 per cent in1976 to 26 per cent in 1996 but increased later to 34 per cent in 2009. In Oceania, 83 per cent of countrieshave such policies, in Africa 77 per cent, in Asia 66 per cent and in Latin America and the Caribbean 68 percent (United Nations, 2009 b).
8/3/2019 World Urbanization Prospects 2009 Revision (United Nations 2010)
http://slidepdf.com/reader/full/world-urbanization-prospects-2009-revision-united-nations-2010 24/56
United Nations Department of Economic and Social Affairs/Population DivisionWorld Urbanization Prospects: The 2009 Revision
14
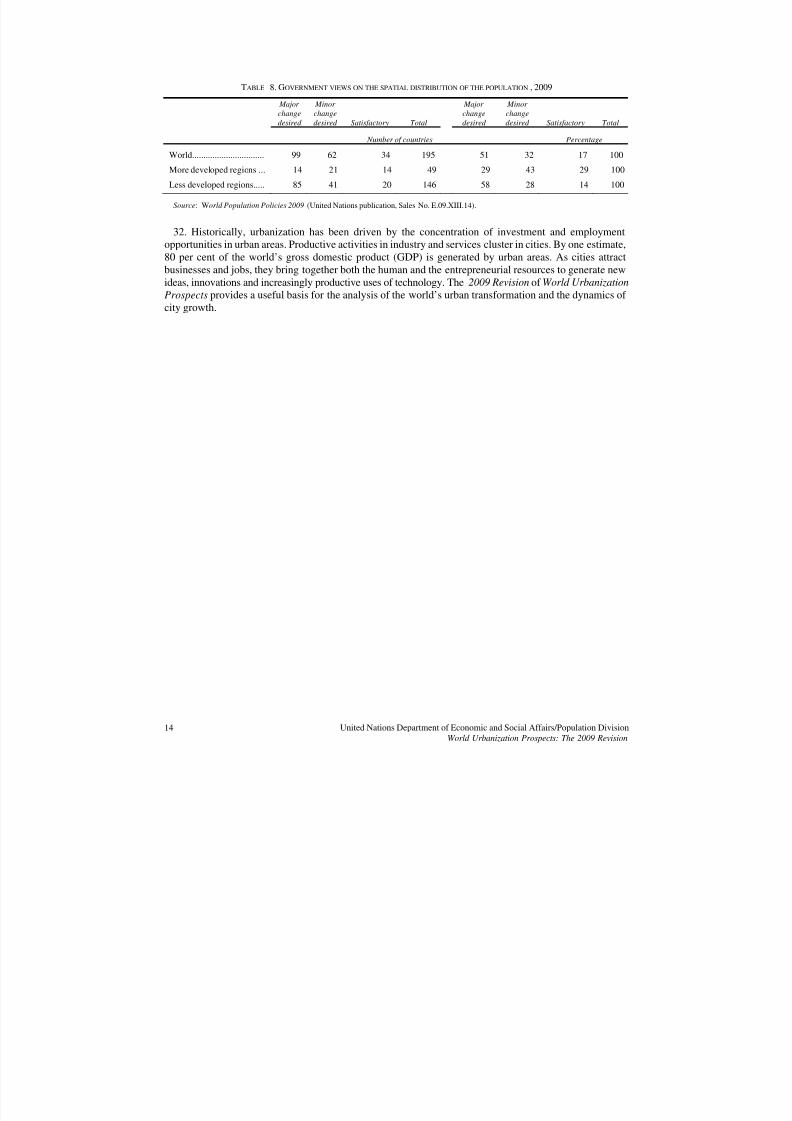
TABLE 8. GOVERNMENT VIEWS ON THE SPATIAL DISTRIBUTION OF THE POPULATION, 2009
Major
change
desired
Minor
change
desired Satisfactory Total
Major
change
desired
Minor
change
desired Satisfactory Total
Number of countries Percentage
World................................ 99 62 34 195 51 32 17 100
More developed regions ... 14 21 14 49 29 43 29 100
Less developed regions..... 85 41 20 146 58 28 14 100
Source: World Population Policies 2009 (United Nations publication, Sales No. E.09.XIII.14).
32. Historically, urbanization has been driven by the concentration of investment and employmentopportunities in urban areas. Productive activities in industry and services cluster in cities. By one estimate,80 per cent of the world’s gross domestic product (GDP) is generated by urban areas. As cities attractbusinesses and jobs, they bring together both the human and the entrepreneurial resources to generate newideas, innovations and increasingly productive uses of technology. The 2009 Revision of World Urbanization
Prospects provides a useful basis for the analysis of the world’s urban transformation and the dynamics of city growth.
8/3/2019 World Urbanization Prospects 2009 Revision (United Nations 2010)
http://slidepdf.com/reader/full/world-urbanization-prospects-2009-revision-united-nations-2010 25/56
United Nations Department of Economic and Social Affairs/Population Division 15World Urbanization Prospects: The 2009 Revision
References
David Satterthwaite (2007): The transition to a predominantly urban world and its underpinnings.
International Institute for Environment and Development . Human Settlements Discussion PaperSeries, 4 September 2007
United Nations, Department of Economic and Social Affairs, Population Division (2009 a): World Population Prospects: The 2008 Revision, New York (Extended Dataset on CD-ROM,ST/ESA/SER.A/283, Sales No. 09.XII.6)
_______ (2009 b): World Population Monitoring. Focusing on Population Distribution, Urbanization,
Internal Migration and Development. A Concise Report. New York, (ST/ESA/SER.A/284, Sales No.E.09.XII.3)
_______ (2009 c): World Fertility Patterns 2009. Wall Chart. (ST/ESA/SER.A/294, Sales No.E.09.XIII.12)

8/3/2019 World Urbanization Prospects 2009 Revision (United Nations 2010)
http://slidepdf.com/reader/full/world-urbanization-prospects-2009-revision-united-nations-2010 26/56

8/3/2019 World Urbanization Prospects 2009 Revision (United Nations 2010)
http://slidepdf.com/reader/full/world-urbanization-prospects-2009-revision-united-nations-2010 27/56
ANNEX TABLES

8/3/2019 World Urbanization Prospects 2009 Revision (United Nations 2010)
http://slidepdf.com/reader/full/world-urbanization-prospects-2009-revision-united-nations-2010 28/56

8/3/2019 World Urbanization Prospects 2009 Revision (United Nations 2010)
http://slidepdf.com/reader/full/world-urbanization-prospects-2009-revision-united-nations-2010 29/56
Total Urban Rural
World 6 829 360 3 421 110 3 408 251 50.1
Afghanistan 28 150 6 281 21 869 22.3
Albania 3 155 1 606 1 549 50.9
Algeria 34 895 22 992 11 903 65.9
American Samoa 67 62 5 92.7
Andorra 86 76 10 88.4
Angola 18 498 10 661 7 836 57.6
Anguilla 15 15 0 100.0
Antigua and Barbuda 88 27 61 30.3
Argentina 40 276 37 139 3 137 92.2
Armenia 3 083 1 977 1 106 64.1
Aruba 107 50 57 46.8
Australia 21 293 18 937 2 356 88.9
Austria 8 364 5 631 2 733 67.3
Azerbaijan 8 832 4 577 4 255 51.8
Bahamas 342 287 55 83.9Bahrain 791 701 91 88.6
Bangladesh 162 221 44 711 117 510 27.6
Barbados 256 112 144 43.8
Belarus 9 634 7 145 2 489 74.2
Belgium 10 647 10 368 279 97.4
Belize 307 159 148 51.8
Benin 8 935 3 718 5 217 41.6
Bermuda 65 65 0 100.0
Bhutan 697 237 461 33.9
Bolivia 9 863 6 518 3 345 66.1
Bosnia and Herzegovina 3 767 1 809 1 958 48.0
Botswana 1 950 1 178 772 60.4
Brazil 193 734 166 844 26 889 86.1British Virgin Islands 23 9 14 40.7
Brunei Darussalam 400 301 99 75.2
Bulgaria 7 545 5 371 2 173 71.2
Burkina Faso 15 757 3 914 11 843 24.8
Burundi 8 303 887 7 416 10.7
Cambodia 14 805 2 934 11 871 19.8
Cameroon 19 522 11 245 8 277 57.6
Canada 33 573 27 018 6 555 80.5
Cape Verde 506 305 200 60.4
Cayman Islands 56 56 0 100.0
Central African Republic 4 422 1 712 2 710 38.7
Chad 11 206 3 038 8 168 27.1
Channel Islands 150 47 103 31.2Chile 16 970 15 062 1 909 88.8
China 1 345 751 620 480 725 271 46.1
China, Hong Kong SAR 7 022 7 022 0 100.0
China, Macao SAR 538 538 0 100.0
Colombia 45 660 34 141 11 519 74.8
Comoros 676 190 486 28.1
Congo 3 683 2 273 1 410 61.7
Cook Islands 20 15 5 74.5
Costa Rica 4 579 2 926 1 653 63.9
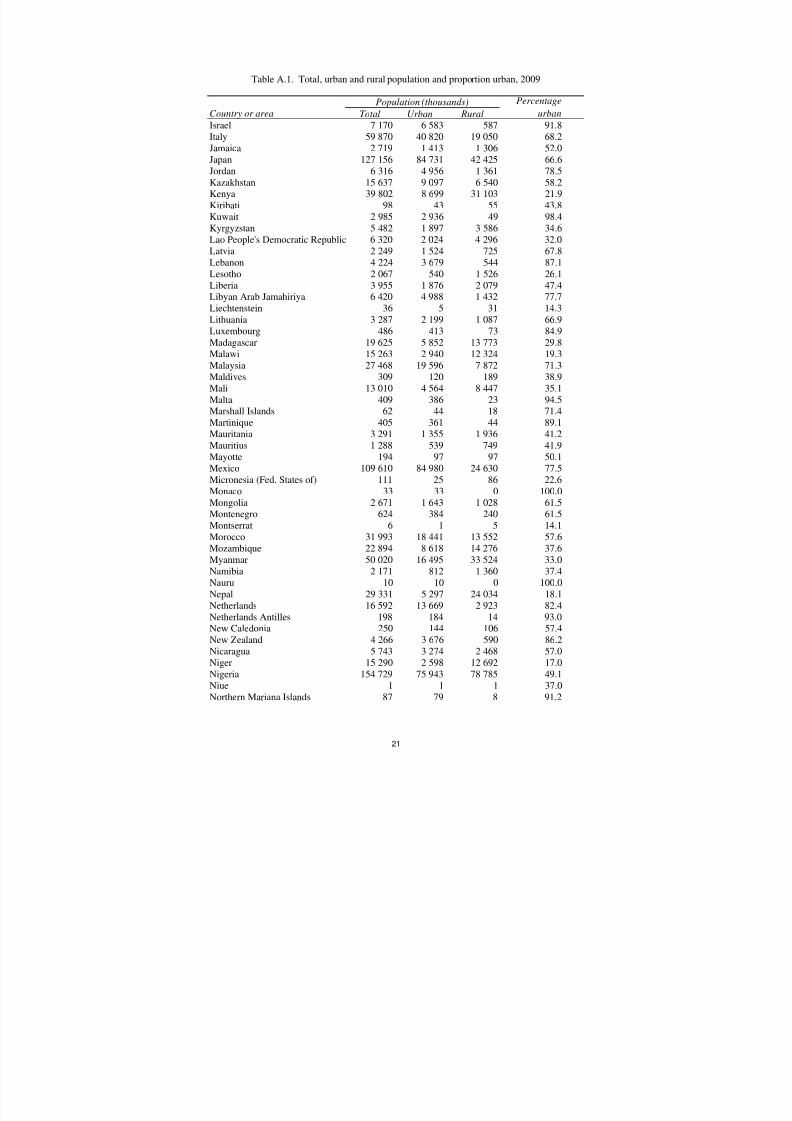
Table A.1. Total, urban and rural population and proportion urban, 2009
Country or area
Population (thousands) Percentage
urban
19

8/3/2019 World Urbanization Prospects 2009 Revision (United Nations 2010)
http://slidepdf.com/reader/full/world-urbanization-prospects-2009-revision-united-nations-2010 30/56
Total Urban Rural
Table A.1. Total, urban and rural population and proportion urban, 2009
Country or area
Population (thousands) Percentage
urban
Côte d'Ivoire 21 075 10 495 10 580 49.8
Croatia 4 416 2 537 1 879 57.4
Cuba 11 204 8 435 2 769 75.3Cyprus 871 611 260 70.1
Czech Republic 10 369 7 621 2 748 73.5
Dem. People's Republic of Korea 23 906 14 372 9 534 60.1
Democratic Republic of the Cong 66 020 22 819 43 201 34.6
Denmark 5 470 4 742 729 86.7
Djibouti 864 658 206 76.2
Dominica 67 45 22 67.1
Dominican Republic 10 090 6 914 3 176 68.5
Ecuador 13 625 9 035 4 590 66.3
Egypt 82 999 35 925 47 074 43.3
El Salvador 6 163 3 931 2 232 63.8
Equatorial Guinea 676 267 409 39.5
Eritrea 5 073 1 070 4 003 21.1
Estonia 1 340 931 409 69.5
Ethiopia 82 825 13 657 69 168 16.5
Faeroe Islands 50 20 30 40.3
Falkland Islands (Malvinas) 3 2 1 73.1
Fiji 849 437 412 51.5
Finland 5 326 4 517 808 84.8
France 62 343 52 746 9 597 84.6
French Guiana 226 172 54 76.2
French Polynesia 269 138 131 51.5
Gabon 1 475 1 262 212 85.6
Gambia 1 705 978 727 57.3
Georgia 4 260 2 244 2 016 52.7
Germany 82 167 60 580 21 587 73.7
Ghana 23 837 12 095 11 742 50.7Gibraltar 31 31 0 100.0
Greece 11 161 6 827 4 334 61.2
Greenland 57 48 9 83.9
Grenada 104 40 64 38.9
Guadeloupe 465 458 7 98.4
Guam 178 166 12 93.1
Guatemala 14 027 6 871 7 156 49.0
Guinea 10 069 3 509 6 559 34.9
Guinea-Bissau 1 611 481 1 130 29.9
Guyana 762 217 545 28.5
Haiti 10 033 5 074 4 959 50.6
Holy See 1 1 0 100.0
Honduras 7 466 3 808 3 658 51.0Hungary 9 993 6 768 3 225 67.7
Iceland 323 301 22 93.3
India 1 198 003 356 057 841 946 29.7
Indonesia 229 965 101 182 128 783 44.0
Iran (Islamic Republic of) 74 196 52 049 22 147 70.2
Iraq 30 747 20 377 10 370 66.3
Ireland 4 515 2 783 1 733 61.6
Isle of Man 80 41 40 50.7
20
8/3/2019 World Urbanization Prospects 2009 Revision (United Nations 2010)
http://slidepdf.com/reader/full/world-urbanization-prospects-2009-revision-united-nations-2010 31/56
Total Urban Rural
Table A.1. Total, urban and rural population and proportion urban, 2009
Country or area
Population (thousands) Percentage
urban
Israel 7 170 6 583 587 91.8
Italy 59 870 40 820 19 050 68.2
Jamaica 2 719 1 413 1 306 52.0Japan 127 156 84 731 42 425 66.6
Jordan 6 316 4 956 1 361 78.5
Kazakhstan 15 637 9 097 6 540 58.2
Kenya 39 802 8 699 31 103 21.9
Kiribati 98 43 55 43.8
Kuwait 2 985 2 936 49 98.4
Kyrgyzstan 5 482 1 897 3 586 34.6
Lao People's Democratic Republic 6 320 2 024 4 296 32.0
Latvia 2 249 1 524 725 67.8
Lebanon 4 224 3 679 544 87.1
Lesotho 2 067 540 1 526 26.1
Liberia 3 955 1 876 2 079 47.4
Libyan Arab Jamahiriya 6 420 4 988 1 432 77.7
Liechtenstein 36 5 31 14.3
Lithuania 3 287 2 199 1 087 66.9
Luxembourg 486 413 73 84.9
Madagascar 19 625 5 852 13 773 29.8
Malawi 15 263 2 940 12 324 19.3
Malaysia 27 468 19 596 7 872 71.3
Maldives 309 120 189 38.9
Mali 13 010 4 564 8 447 35.1
Malta 409 386 23 94.5
Marshall Islands 62 44 18 71.4
Martinique 405 361 44 89.1
Mauritania 3 291 1 355 1 936 41.2
Mauritius 1 288 539 749 41.9
Mayotte 194 97 97 50.1Mexico 109 610 84 980 24 630 77.5
Micronesia (Fed. States of) 111 25 86 22.6
Monaco 33 33 0 100.0
Mongolia 2 671 1 643 1 028 61.5
Montenegro 624 384 240 61.5
Montserrat 6 1 5 14.1
Morocco 31 993 18 441 13 552 57.6
Mozambique 22 894 8 618 14 276 37.6
Myanmar 50 020 16 495 33 524 33.0
Namibia 2 171 812 1 360 37.4
Nauru 10 10 0 100.0
Nepal 29 331 5 297 24 034 18.1
Netherlands 16 592 13 669 2 923 82.4Netherlands Antilles 198 184 14 93.0
New Caledonia 250 144 106 57.4
New Zealand 4 266 3 676 590 86.2
Nicaragua 5 743 3 274 2 468 57.0
Niger 15 290 2 598 12 692 17.0
Nigeria 154 729 75 943 78 785 49.1
Niue 1 1 1 37.0
Northern Mariana Islands 87 79 8 91.2
21

8/3/2019 World Urbanization Prospects 2009 Revision (United Nations 2010)
http://slidepdf.com/reader/full/world-urbanization-prospects-2009-revision-united-nations-2010 32/56
Total Urban Rural
Table A.1. Total, urban and rural population and proportion urban, 2009
Country or area
Population (thousands) Percentage
urban
Norway 4 812 3 804 1 008 79.0
Occupied Palestinian Territory 4 277 3 162 1 115 73.9
Oman 2 845 2 071 774 72.8Pakistan 180 808 64 349 116 459 35.6
Palau 20 17 4 82.4
Panama 3 454 2 558 895 74.1
Papua New Guinea 6 732 841 5 891 12.5
Paraguay 6 349 3 867 2 482 60.9
Peru 29 165 22 327 6 838 76.6
Philippines 91 983 44 784 47 199 48.7
Pitcairn 0 0 0 0.0
Poland 38 074 23 234 14 840 61.0
Portugal 10 707 6 435 4 272 60.1
Puerto Rico 3 982 3 927 55 98.6
Qatar 1 409 1 350 60 95.8
Republic of Korea 48 333 39 948 8 385 82.7
Republic of Moldova 3 604 1 665 1 939 46.2
Réunion 827 775 52 93.7
Romania 21 275 12 106 9 169 56.9
Russian Federation 140 874 102 976 37 898 73.1
Rwanda 9 998 1 856 8 142 18.6
Saint Helena 4 2 3 39.7
Saint Kitts and Nevis 52 17 35 32.3
Saint Lucia 172 48 124 27.8
Saint Pierre and Miquelon 6 5 1 90.4
Saint Vincent and the Grenadines 109 53 56 48.9
Samoa 179 36 142 20.4
San Marino 31 29 2 94.1
Sao Tome and Principe 163 100 63 61.4
Saudi Arabia 25 721 21 054 4 667 81.9Senegal 12 534 5 275 7 259 42.1
Serbia 9 850 5 488 4 362 55.7
Seychelles 84 46 38 54.8
Sierra Leone 5 696 2 167 3 529 38.0
Singapore 4 737 4 737 0 100.0
Slovakia 5 406 2 976 2 430 55.1
Slovenia 2 020 1 002 1 018 49.6
Solomon Islands 523 95 428 18.2
Somalia 9 133 3 376 5 757 37.0
South Africa 50 110 30 675 19 434 61.2
Spain 44 904 34 685 10 218 77.2
Sri Lanka 20 238 2 903 17 335 14.3
Sudan 42 272 16 645 25 628 39.4Suriname 520 358 161 68.9
Swaziland 1 185 254 931 21.4
Sweden 9 249 7 825 1 425 84.6
Switzerland 7 568 5 565 2 003 73.5
Syrian Arab Republic 21 906 12 121 9 785 55.3
Tajikistan 6 952 1 828 5 124 26.3
TFYR Macedonia 2 042 1 209 833 59.2
Thailand 67 764 22 761 45 003 33.6
22
8/3/2019 World Urbanization Prospects 2009 Revision (United Nations 2010)
http://slidepdf.com/reader/full/world-urbanization-prospects-2009-revision-united-nations-2010 33/56
Total Urban Rural
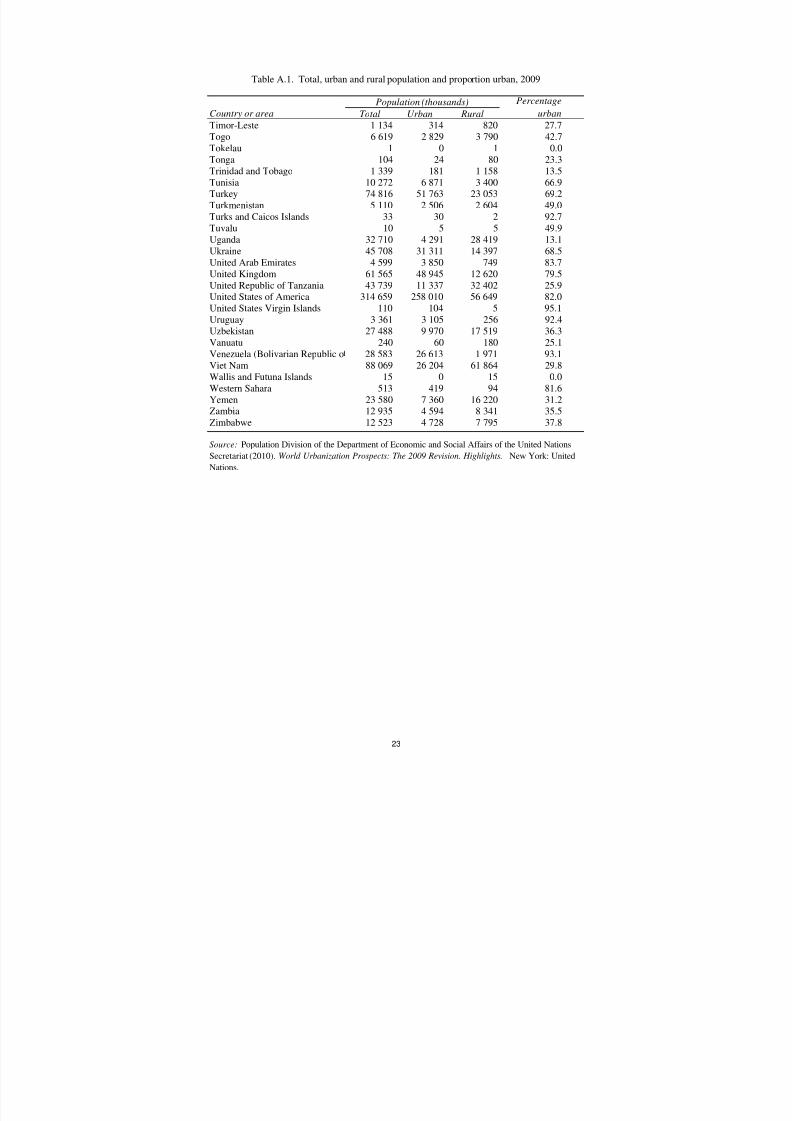
Table A.1. Total, urban and rural population and proportion urban, 2009
Country or area
Population (thousands) Percentage
urban
Timor-Leste 1 134 314 820 27.7
Togo 6 619 2 829 3 790 42.7
Tokelau 1 0 1 0.0Tonga 104 24 80 23.3
Trinidad and Tobago 1 339 181 1 158 13.5
Tunisia 10 272 6 871 3 400 66.9
Turkey 74 816 51 763 23 053 69.2
Turkmenistan 5 110 2 506 2 604 49.0
Turks and Caicos Islands 33 30 2 92.7
Tuvalu 10 5 5 49.9
Uganda 32 710 4 291 28 419 13.1
Ukraine 45 708 31 311 14 397 68.5
United Arab Emirates 4 599 3 850 749 83.7
United Kingdom 61 565 48 945 12 620 79.5
United Republic of Tanzania 43 739 11 337 32 402 25.9
United States of America 314 659 258 010 56 649 82.0
United States Virgin Islands 110 104 5 95.1
Uruguay 3 361 3 105 256 92.4
Uzbekistan 27 488 9 970 17 519 36.3
Vanuatu 240 60 180 25.1
Venezuela (Bolivarian Republic o 28 583 26 613 1 971 93.1
Viet Nam 88 069 26 204 61 864 29.8
Wallis and Futuna Islands 15 0 15 0.0
Western Sahara 513 419 94 81.6
Yemen 23 580 7 360 16 220 31.2
Zambia 12 935 4 594 8 341 35.5
Zimbabwe 12 523 4 728 7 795 37.8
Source: Population Division of the Department of Economic and Social Affairs of the United Nations
Secretariat (2010). World Urbanization Prospects: The 2009 Revision. Highlights. New York: UnitedNations.
23

8/3/2019 World Urbanization Prospects 2009 Revision (United Nations 2010)
http://slidepdf.com/reader/full/world-urbanization-prospects-2009-revision-united-nations-2010 34/56
2009 2050 2009 2050
World 3 421 110 6 285 881 50.1 68.7
Afghanistan 6 281 34 749 22.3 47.0
Albania 1 606 2 566 50.9 77.7
Algeria 22 992 41 425 65.9 83.5
American Samoa 62 104 92.7 96.8
Andorra 76 121 88.4 87.8
Angola 10 661 34 042 57.6 80.5
Anguilla 15 20 100.0 100.0
Antigua and Barbuda 27 58 30.3 51.9
Argentina 37 139 48 882 92.2 96.0
Armenia 1 977 2 319 64.1 76.9
Aruba 50 68 46.8 63.9
Australia 18 937 26 954 88.9 93.8
Austria 5 631 6 870 67.3 80.7
Azerbaijan 4 577 7 323 51.8 69.2Bahamas 287 414 83.9 90.9
Bahrain 701 1 185 88.6 92.8
Bangladesh 44 711 125 500 27.6 56.4
Barbados 112 167 43.8 70.4
Belarus 7 145 6 353 74.2 87.3
Belgium 10 368 11 306 97.4 98.4
Belize 159 368 51.8 72.7
Benin 3 718 14 630 41.6 66.6
Bermuda 65 63 100.0 100.0
Bhutan 237 650 33.9 64.2
Bolivia 6 518 12 261 66.1 82.2
Bosnia and Herzegovina 1 809 2 206 48.0 73.3
Botswana 1 178 2 236 60.4 81.1Brazil 166 844 204 464 86.1 93.6
British Virgin Islands 9 18 40.7 64.3
Brunei Darussalam 301 573 75.2 87.2
Bulgaria 5 371 4 497 71.2 83.4
Burkina Faso 3 914 23 991 24.8 58.8
Burundi 887 4 951 10.7 33.3
Cambodia 2 934 10 430 19.8 43.8
Cameroon 11 245 29 343 57.6 79.9
Canada 27 018 39 042 80.5 87.9
Cape Verde 305 568 60.4 80.8
Cayman Islands 56 66 100.0 100.0
Central African Republic 1 712 4 683 38.7 61.6
Chad 3 038 15 761 27.1 56.7Channel Islands 47 76 31.2 53.2
Chile 15 062 19 462 88.8 94.2
China 620 480 1 037 695 46.1 73.2
China, Hong Kong SAR 7 022 8 623 100.0 100.0
China, Macao SAR 538 593 100.0 100.0
Colombia 34 141 54 061 74.8 86.0
Comoros 190 622 28.1 50.7
Congo 2 273 5 422 61.7 79.0
Cook Islands 15 21 74.5 89.3
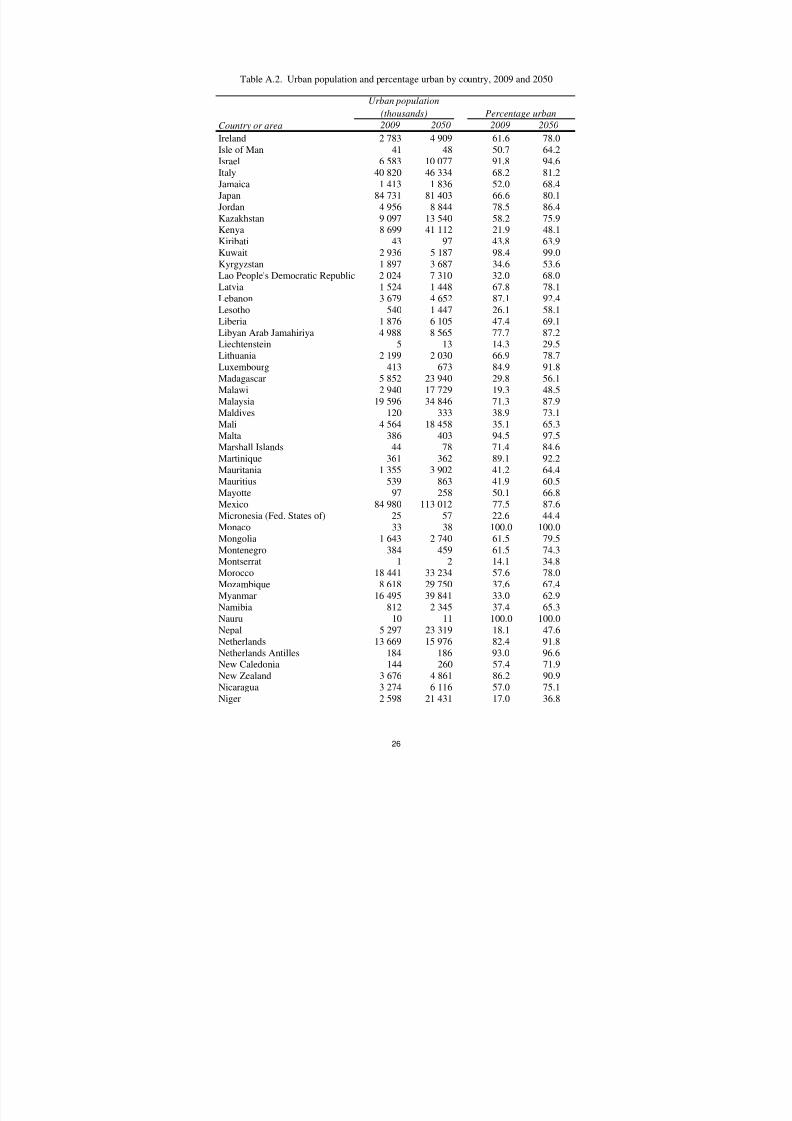
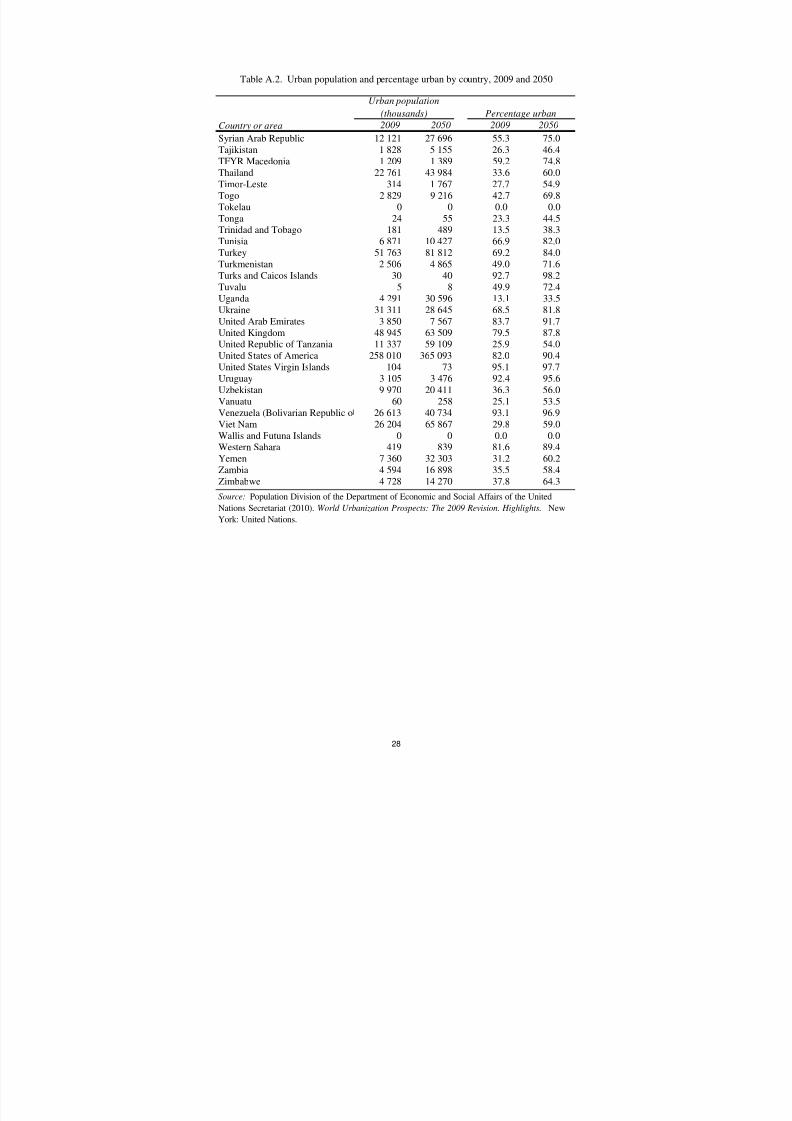
Table A.2. Urban population and percentage urban by country, 2009 and 2050
Country or area
Urban population
(thousands) Percentage urban
24

8/3/2019 World Urbanization Prospects 2009 Revision (United Nations 2010)
http://slidepdf.com/reader/full/world-urbanization-prospects-2009-revision-united-nations-2010 35/56
2009 2050 2009 2050
Table A.2. Urban population and percentage urban by country, 2009 and 2050
Country or area
Urban population
(thousands) Percentage urban
Costa Rica 2 926 5 199 63.9 81.6
Côte d'Ivoire 10 495 32 373 49.8 74.6Croatia 2 537 2 895 57.4 75.7
Cuba 8 435 8 068 75.3 83.0
Cyprus 611 964 70.1 82.0
Czech Republic 7 621 8 581 73.5 83.4
Dem. People's Republic of Korea 14 372 18 307 60.1 74.5
Democratic Republic of the Cong 22 819 93 271 34.6 63.2
Denmark 4 742 5 133 86.7 92.5
Djibouti 658 1 249 76.2 85.0
Dominica 45 53 67.1 80.0
Dominican Republic 6 914 11 436 68.5 85.1
Ecuador 9 035 15 045 66.3 83.6
Egypt 35 925 81 998 43.3 63.3
El Salvador 3 931 6 392 63.8 81.1Equatorial Guinea 267 901 39.5 62.4
Eritrea 1 070 5 405 21.1 50.1
Estonia 931 987 69.5 80.0
Ethiopia 13 657 65 149 16.5 37.5
Faeroe Islands 20 35 40.3 59.4
Falkland Islands (Malvinas) 2 3 73.1 86.7
Fiji 437 657 51.5 72.2
Finland 4 517 5 005 84.8 91.9
France 52 746 63 697 84.6 94.1
French Guiana 172 398 76.2 86.1
French Polynesia 138 239 51.5 67.4
Gabon 1 262 2 311 85.6 93.5
Gambia 978 3 046 57.3 81.0
Georgia 2 244 2 261 52.7 69.2
Germany 60 580 59 089 73.7 83.8
Ghana 12 095 34 198 50.7 75.6
Gibraltar 31 30 100.0 100.0
Greece 6 827 8 485 61.2 77.6
Greenland 48 46 83.9 91.3
Grenada 40 63 38.9 64.5
Guadeloupe 458 471 98.4 98.9
Guam 166 231 93.1 95.5
Guatemala 6 871 19 738 49.0 71.8
Guinea 3 509 15 087 34.9 62.9
Guinea-Bissau 481 1 875 29.9 52.7
Guyana 217 286 28.5 51.3
Haiti 5 074 12 644 50.6 81.7Holy See 1 1 100.0 100.0
Honduras 3 808 9 173 51.0 74.0
Hungary 6 768 7 339 67.7 82.1
Iceland 301 391 93.3 96.1
India 356 057 875 193 29.7 54.2
Indonesia 101 182 190 007 44.0 65.9
Iran (Islamic Republic of) 52 049 82 931 70.2 85.5
Iraq 20 377 49 193 66.3 76.9
25
8/3/2019 World Urbanization Prospects 2009 Revision (United Nations 2010)
http://slidepdf.com/reader/full/world-urbanization-prospects-2009-revision-united-nations-2010 36/56
2009 2050 2009 2050
Table A.2. Urban population and percentage urban by country, 2009 and 2050
Country or area
Urban population
(thousands) Percentage urban
Ireland 2 783 4 909 61.6 78.0
Isle of Man 41 48 50.7 64.2Israel 6 583 10 077 91.8 94.6
Italy 40 820 46 334 68.2 81.2
Jamaica 1 413 1 836 52.0 68.4
Japan 84 731 81 403 66.6 80.1
Jordan 4 956 8 844 78.5 86.4
Kazakhstan 9 097 13 540 58.2 75.9
Kenya 8 699 41 112 21.9 48.1
Kiribati 43 97 43.8 63.9
Kuwait 2 936 5 187 98.4 99.0
Kyrgyzstan 1 897 3 687 34.6 53.6
Lao People's Democratic Republic 2 024 7 310 32.0 68.0
Latvia 1 524 1 448 67.8 78.1
Lebanon 3 679 4 652 87.1 92.4Lesotho 540 1 447 26.1 58.1
Liberia 1 876 6 105 47.4 69.1
Libyan Arab Jamahiriya 4 988 8 565 77.7 87.2
Liechtenstein 5 13 14.3 29.5
Lithuania 2 199 2 030 66.9 78.7
Luxembourg 413 673 84.9 91.8
Madagascar 5 852 23 940 29.8 56.1
Malawi 2 940 17 729 19.3 48.5
Malaysia 19 596 34 846 71.3 87.9
Maldives 120 333 38.9 73.1
Mali 4 564 18 458 35.1 65.3
Malta 386 403 94.5 97.5
Marshall Islands 44 78 71.4 84.6
Martinique 361 362 89.1 92.2
Mauritania 1 355 3 902 41.2 64.4
Mauritius 539 863 41.9 60.5
Mayotte 97 258 50.1 66.8
Mexico 84 980 113 012 77.5 87.6
Micronesia (Fed. States of) 25 57 22.6 44.4
Monaco 33 38 100.0 100.0
Mongolia 1 643 2 740 61.5 79.5
Montenegro 384 459 61.5 74.3
Montserrat 1 2 14.1 34.8
Morocco 18 441 33 234 57.6 78.0
Mozambique 8 618 29 750 37.6 67.4
Myanmar 16 495 39 841 33.0 62.9
Namibia 812 2 345 37.4 65.3Nauru 10 11 100.0 100.0
Nepal 5 297 23 319 18.1 47.6
Netherlands 13 669 15 976 82.4 91.8
Netherlands Antilles 184 186 93.0 96.6
New Caledonia 144 260 57.4 71.9
New Zealand 3 676 4 861 86.2 90.9
Nicaragua 3 274 6 116 57.0 75.1
Niger 2 598 21 431 17.0 36.8
26
8/3/2019 World Urbanization Prospects 2009 Revision (United Nations 2010)
http://slidepdf.com/reader/full/world-urbanization-prospects-2009-revision-united-nations-2010 37/56
2009 2050 2009 2050
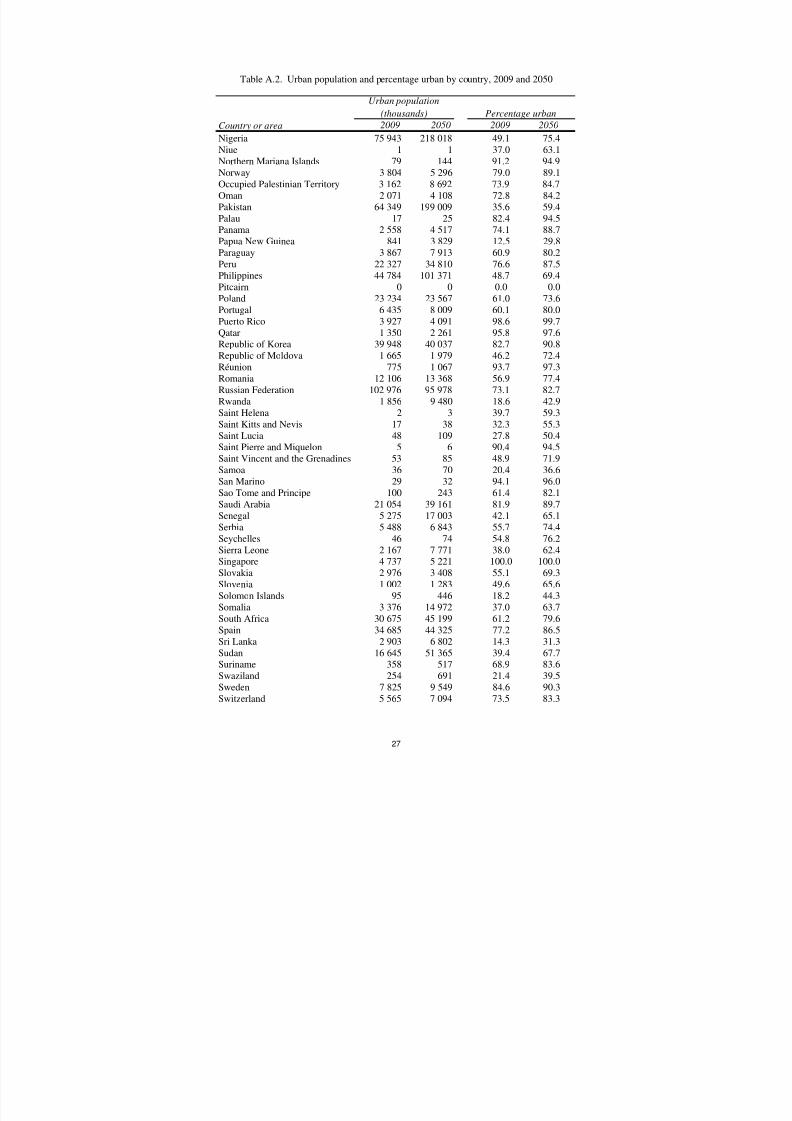
Table A.2. Urban population and percentage urban by country, 2009 and 2050
Country or area
Urban population
(thousands) Percentage urban
Nigeria 75 943 218 018 49.1 75.4
Niue 1 1 37.0 63.1Northern Mariana Islands 79 144 91.2 94.9
Norway 3 804 5 296 79.0 89.1
Occupied Palestinian Territory 3 162 8 692 73.9 84.7
Oman 2 071 4 108 72.8 84.2
Pakistan 64 349 199 009 35.6 59.4
Palau 17 25 82.4 94.5
Panama 2 558 4 517 74.1 88.7
Papua New Guinea 841 3 829 12.5 29.8
Paraguay 3 867 7 913 60.9 80.2
Peru 22 327 34 810 76.6 87.5
Philippines 44 784 101 371 48.7 69.4
Pitcairn 0 0 0.0 0.0
Poland 23 234 23 567 61.0 73.6Portugal 6 435 8 009 60.1 80.0
Puerto Rico 3 927 4 091 98.6 99.7
Qatar 1 350 2 261 95.8 97.6
Republic of Korea 39 948 40 037 82.7 90.8
Republic of Moldova 1 665 1 979 46.2 72.4
Réunion 775 1 067 93.7 97.3
Romania 12 106 13 368 56.9 77.4
Russian Federation 102 976 95 978 73.1 82.7
Rwanda 1 856 9 480 18.6 42.9
Saint Helena 2 3 39.7 59.3
Saint Kitts and Nevis 17 38 32.3 55.3
Saint Lucia 48 109 27.8 50.4
Saint Pierre and Miquelon 5 6 90.4 94.5
Saint Vincent and the Grenadines 53 85 48.9 71.9
Samoa 36 70 20.4 36.6
San Marino 29 32 94.1 96.0
Sao Tome and Principe 100 243 61.4 82.1
Saudi Arabia 21 054 39 161 81.9 89.7
Senegal 5 275 17 003 42.1 65.1
Serbia 5 488 6 843 55.7 74.4
Seychelles 46 74 54.8 76.2
Sierra Leone 2 167 7 771 38.0 62.4
Singapore 4 737 5 221 100.0 100.0
Slovakia 2 976 3 408 55.1 69.3
Slovenia 1 002 1 283 49.6 65.6
Solomon Islands 95 446 18.2 44.3
Somalia 3 376 14 972 37.0 63.7South Africa 30 675 45 199 61.2 79.6
Spain 34 685 44 325 77.2 86.5
Sri Lanka 2 903 6 802 14.3 31.3
Sudan 16 645 51 365 39.4 67.7
Suriname 358 517 68.9 83.6
Swaziland 254 691 21.4 39.5
Sweden 7 825 9 549 84.6 90.3
Switzerland 5 565 7 094 73.5 83.3
27
8/3/2019 World Urbanization Prospects 2009 Revision (United Nations 2010)
http://slidepdf.com/reader/full/world-urbanization-prospects-2009-revision-united-nations-2010 38/56
2009 2050 2009 2050
Table A.2. Urban population and percentage urban by country, 2009 and 2050
Country or area
Urban population
(thousands) Percentage urban
Syrian Arab Republic 12 121 27 696 55.3 75.0
Tajikistan 1 828 5 155 26.3 46.4TFYR Macedonia 1 209 1 389 59.2 74.8
Thailand 22 761 43 984 33.6 60.0
Timor-Leste 314 1 767 27.7 54.9
Togo 2 829 9 216 42.7 69.8
Tokelau 0 0 0.0 0.0
Tonga 24 55 23.3 44.5
Trinidad and Tobago 181 489 13.5 38.3
Tunisia 6 871 10 427 66.9 82.0
Turkey 51 763 81 812 69.2 84.0
Turkmenistan 2 506 4 865 49.0 71.6
Turks and Caicos Islands 30 40 92.7 98.2
Tuvalu 5 8 49.9 72.4
Uganda 4 291 30 596 13.1 33.5Ukraine 31 311 28 645 68.5 81.8
United Arab Emirates 3 850 7 567 83.7 91.7
United Kingdom 48 945 63 509 79.5 87.8
United Republic of Tanzania 11 337 59 109 25.9 54.0
United States of America 258 010 365 093 82.0 90.4
United States Virgin Islands 104 73 95.1 97.7
Uruguay 3 105 3 476 92.4 95.6
Uzbekistan 9 970 20 411 36.3 56.0
Vanuatu 60 258 25.1 53.5
Venezuela (Bolivarian Republic o 26 613 40 734 93.1 96.9
Viet Nam 26 204 65 867 29.8 59.0
Wallis and Futuna Islands 0 0 0.0 0.0
Western Sahara 419 839 81.6 89.4
Yemen 7 360 32 303 31.2 60.2
Zambia 4 594 16 898 35.5 58.4
Zimbabwe 4 728 14 270 37.8 64.3
Source: Population Division of the Department of Economic and Social Affairs of the United
Nations Secretariat (2010). World Urbanization Prospects: The 2009 Revision. Highlights. New
York: United Nations.
28
8/3/2019 World Urbanization Prospects 2009 Revision (United Nations 2010)
http://slidepdf.com/reader/full/world-urbanization-prospects-2009-revision-united-nations-2010 39/56
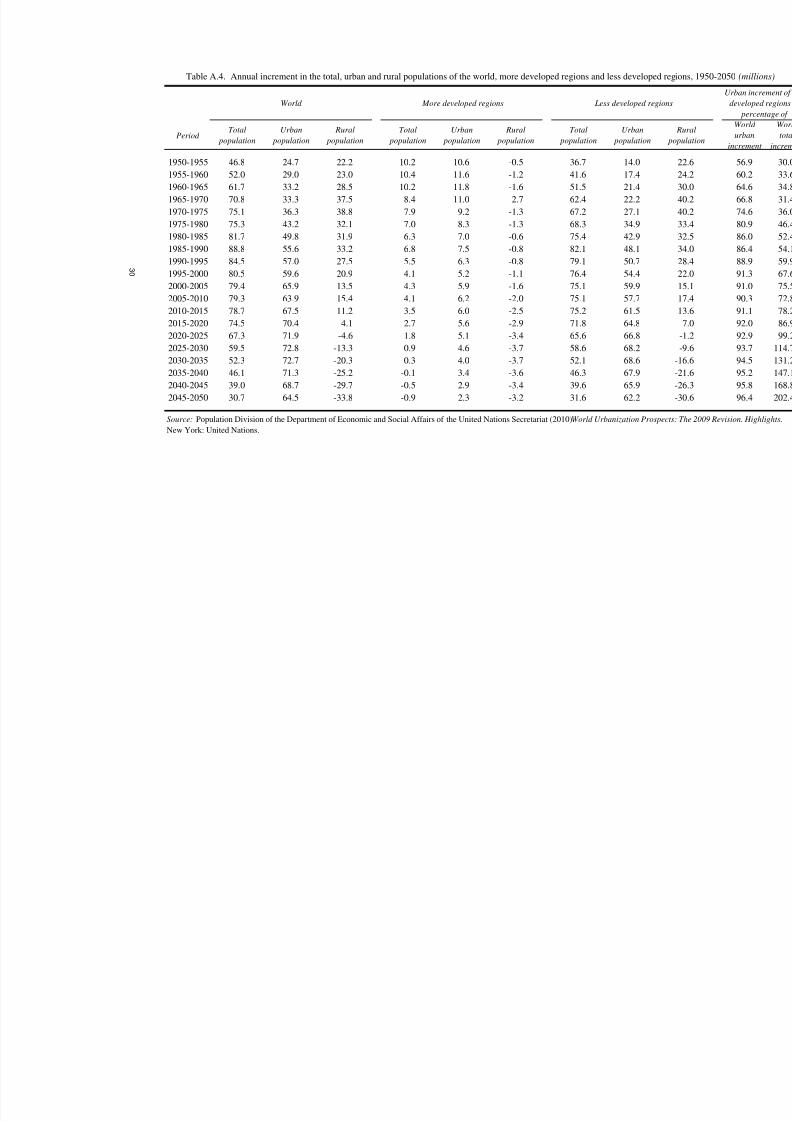
8/3/2019 World Urbanization Prospects 2009 Revision (United Nations 2010)
http://slidepdf.com/reader/full/world-urbanization-prospects-2009-revision-united-nations-2010 40/56
Period
1950-1955 46.8 24.7 22.2 10.2 10.6 -0.5 36.7 14.0
1955-1960 52.0 29.0 23.0 10.4 11.6 -1.2 41.6 17.4
1960-1965 61.7 33.2 28.5 10.2 11.8 -1.6 51.5 21.4
1965-1970 70.8 33.3 37.5 8.4 11.0 -2.7 62.4 22.2
1970-1975 75.1 36.3 38.8 7.9 9.2 -1.3 67.2 27.1
1975-1980 75.3 43.2 32.1 7.0 8.3 -1.3 68.3 34.9
1980-1985 81.7 49.8 31.9 6.3 7.0 -0.6 75.4 42.9
1985-1990 88.8 55.6 33.2 6.8 7.5 -0.8 82.1 48.1
1990-1995 84.5 57.0 27.5 5.5 6.3 -0.8 79.1 50.7
1995-2000 80.5 59.6 20.9 4.1 5.2 -1.1 76.4 54.4
2000-2005 79.4 65.9 13.5 4.3 5.9 -1.6 75.1 59.9
2005-2010 79.3 63.9 15.4 4.1 6.2 -2.0 75.1 57.72010-2015 78.7 67.5 11.2 3.5 6.0 -2.5 75.2 61.5
2015-2020 74.5 70.4 4.1 2.7 5.6 -2.9 71.8 64.8
2020-2025 67.3 71.9 -4.6 1.8 5.1 -3.4 65.6 66.8
2025-2030 59.5 72.8 -13.3 0.9 4.6 -3.7 58.6 68.2
2030-2035 52.3 72.7 -20.3 0.3 4.0 -3.7 52.1 68.6
2035-2040 46.1 71.3 -25.2 -0.1 3.4 -3.6 46.3 67.9
2040-2045 39.0 68.7 -29.7 -0.5 2.9 -3.4 39.6 65.9
2045-2050 30.7 64.5 -33.8 -0.9 2.3 -3.2 31.6 62.2
Rural
population
Total
population
Table A.4. Annual increment in the total, urban and rural populations of the world, more developed regions and less developed
World More developed regions Less developed regio
Source: Population Division of the Department of Economic and Social Affairs of the United Nations Secretariat (2010).World Urbanization Prospe
New York: United Nations.
Urban
population
Rural
population
Total
population
Urban
population
Total
population
Urban
population
3 0
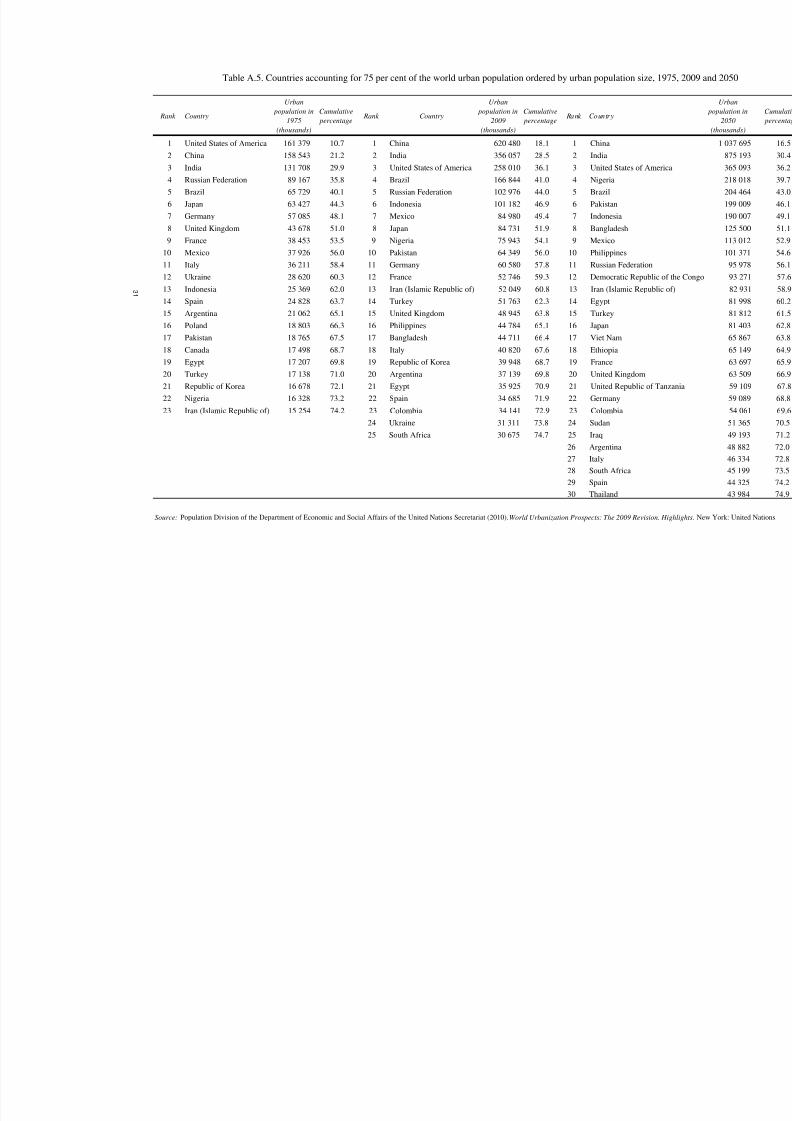
8/3/2019 World Urbanization Prospects 2009 Revision (United Nations 2010)
http://slidepdf.com/reader/full/world-urbanization-prospects-2009-revision-united-nations-2010 41/56
Rank Country
Urban
population in
1975
(thousands)
Cumulative
percentage Rank Country
Urban
population in
2009
(thousands)
Cumulative
percentage Rank Country
1 United States of America 161 379 10.7 1 China 620 480 18.1 1 China
2 China 158 543 21.2 2 India 356 057 28.5 2 India
3 India 131 708 29.9 3 United States of America 258 010 36.1 3 United States of Amer
4 Russian Federation 89 167 35.8 4 Brazil 166 844 41.0 4 Nigeria
5 Brazil 65 729 40.1 5 Russian Federation 102 976 44.0 5 Brazil
6 Japan 63 427 44.3 6 Indonesia 101 182 46.9 6 Pakistan
7 Germany 57 085 48.1 7 Mexico 84 980 49.4 7 Indonesia
8 United Kingdom 43 678 51.0 8 Japan 84 731 51.9 8 Bangladesh
9 France 38 453 53.5 9 Nigeria 75 943 54.1 9 Mexico
10 Mexico 37 926 56.0 10 Pakistan 64 349 56.0 10 Philippines
11 Italy 36 211 58.4 11 Germany 60 580 57.8 11 Russian Federation
12 Ukraine 28 620 60.3 12 France 52 746 59.3 12 Democratic Republic o
13 Indonesia 25 369 62.0 13 Iran (Islamic Republic of) 52 049 60.8 13 Iran (Islamic Republic
14 Spain 24 828 63.7 14 Turkey 51 763 62.3 14 Egypt 15 Argentina 21 062 65.1 15 United Kingdom 48 945 63.8 15 Turkey
16 Poland 18 803 66.3 16 Philippines 44 784 65.1 16 Japan
17 Pakistan 18 765 67.5 17 Bangladesh 44 711 66.4 17 Viet Nam
18 Canada 17 498 68.7 18 Italy 40 820 67.6 18 Ethiopia
19 Egypt 17 207 69.8 19 Republic of Korea 39 948 68.7 19 France
20 Turkey 17 138 71.0 20 Argentina 37 139 69.8 20 United Kingdom
21 Republic of Korea 16 678 72.1 21 Egypt 35 925 70.9 21 United Republic of Ta
22 Nigeria 16 328 73.2 22 Spain 34 685 71.9 22 Germany
23 Iran (Islamic Republic of) 15 254 74.2 23 Colombia 34 141 72.9 23 Colombia
24 Ukraine 31 311 73.8 24 Sudan
25 South Africa 30 675 74.7 25 Iraq
26 Argentina
27 Italy
28 South Africa
29 Spain
30 Thailand
Table A.5. Countries accounting for 75 per cent of the world urban population ordered by urban population size, 1
Source: Population Division of the Department of Economic and Social Affairs of the United Nations Secretariat (2010).World Urbanization Prospects: The 2009 Revision. H
3 1
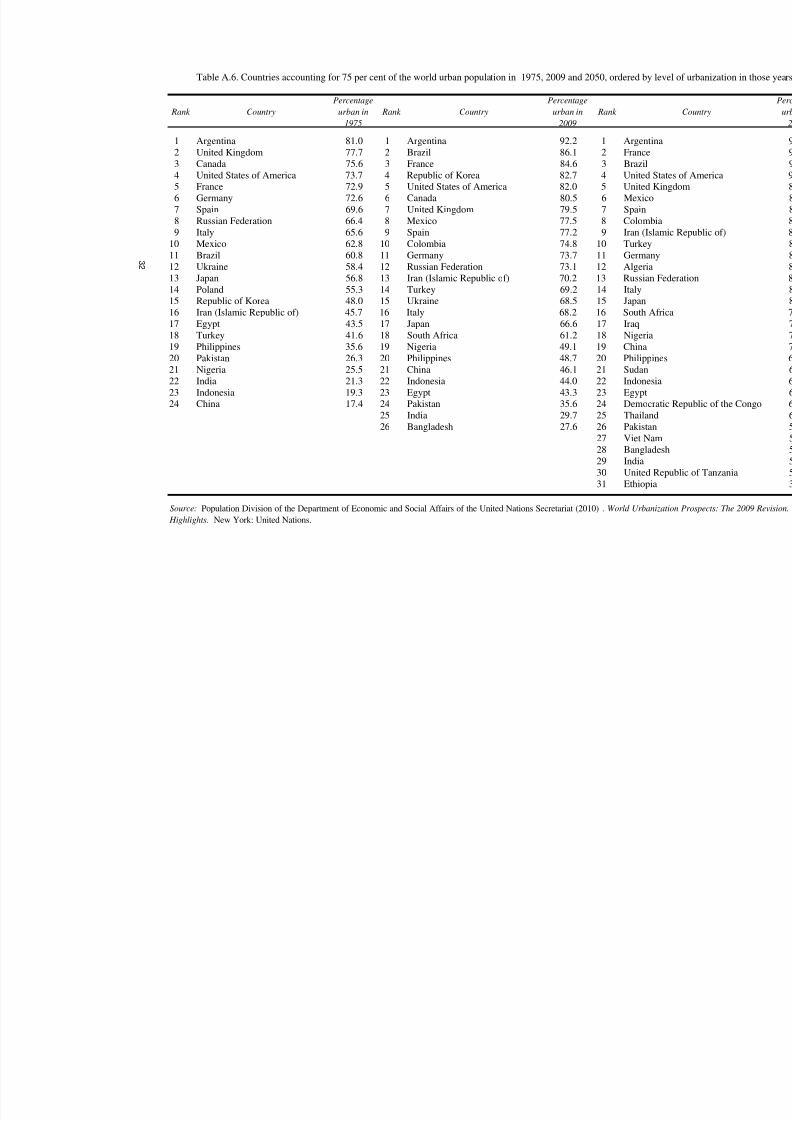
8/3/2019 World Urbanization Prospects 2009 Revision (United Nations 2010)
http://slidepdf.com/reader/full/world-urbanization-prospects-2009-revision-united-nations-2010 42/56
Rank Country
Percentage
urban in
1975
Rank Country
Percentage
urban in
2009
Rank
1 Argentina 81.0 1 Argentina 92.2 1 Argentina
2 United Kingdom 77.7 2 Brazil 86.1 2 France3 Canada 75.6 3 France 84.6 3 Brazil
4 United States of America 73.7 4 Republic of Korea 82.7 4 United St
5 France 72.9 5 United States of America 82.0 5 United Ki
6 Germany 72.6 6 Canada 80.5 6 Mexico
7 Spain 69.6 7 United Kingdom 79.5 7 Spain
8 Russian Federation 66.4 8 Mexico 77.5 8 Colombia
9 Italy 65.6 9 Spain 77.2 9 Iran (Islam
10 Mexico 62.8 10 Colombia 74.8 10 Turkey
11 Brazil 60.8 11 Germany 73.7 11 Germany
12 Ukraine 58.4 12 Russian Federation 73.1 12 Algeria
13 Japan 56.8 13 Iran (Islamic Republic of) 70.2 13 Russian F
14 Poland 55.3 14 Turkey 69.2 14 Italy
15 Republic of Korea 48.0 15 Ukraine 68.5 15 Japan16 Iran (Islamic Republic of) 45.7 16 Italy 68.2 16 South Afr
17 Egypt 43.5 17 Japan 66.6 17 Iraq
18 Turkey 41.6 18 South Africa 61.2 18 Nigeria
19 Philippines 35.6 19 Nigeria 49.1 19 China
20 Pakistan 26.3 20 Philippines 48.7 20 Philippine
21 Nigeria 25.5 21 China 46.1 21 Sudan
22 India 21.3 22 Indonesia 44.0 22 Indonesia
23 Indonesia 19.3 23 Egypt 43.3 23 Egypt
24 China 17.4 24 Pakistan 35.6 24 Democrat
25 India 29.7 25 Thailand
26 Bangladesh 27.6 26 Pakistan
27 Viet Nam
28 Banglade29 India
30 United Re
31 Ethiopia
Table A.6. Countries accounting for 75 per cent of the world urban population in 1975, 2009 and 2050, ordered by le
Source: Population Division of the Department of Economic and Social Affairs of the United Nations Secretariat (2010) . World Urbaniza
Highlights. New York: United Nations.
3 2
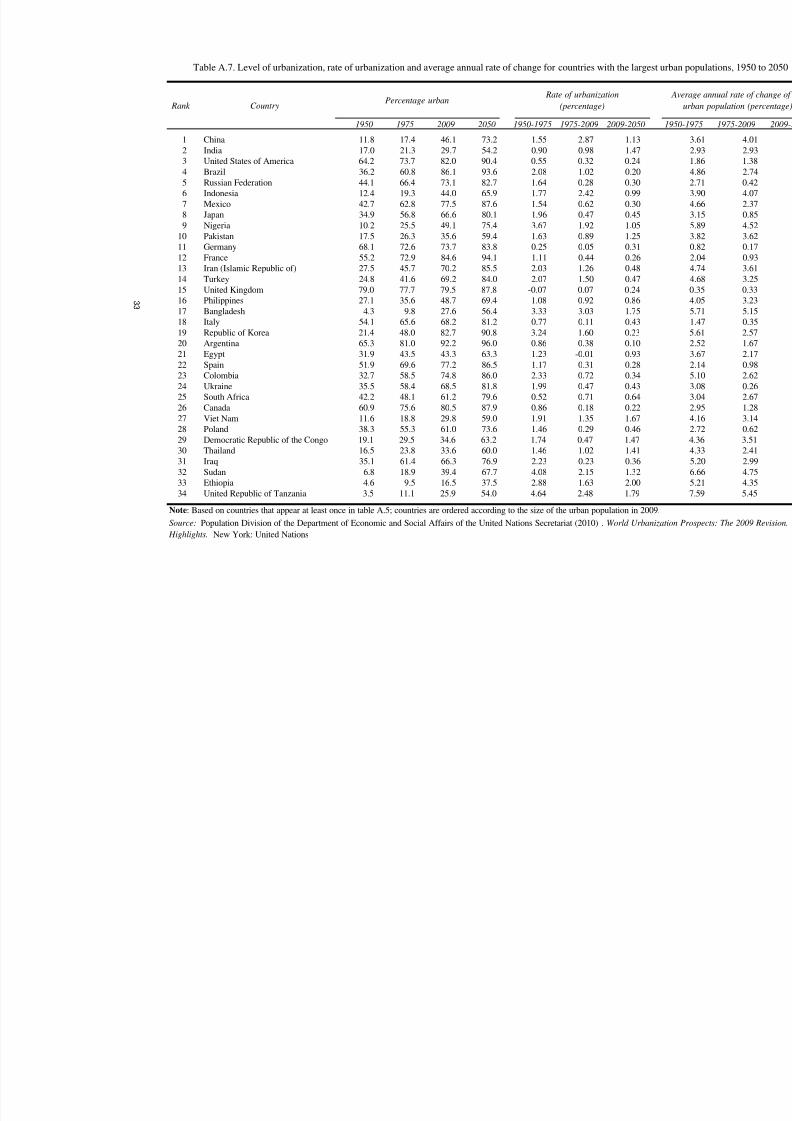
8/3/2019 World Urbanization Prospects 2009 Revision (United Nations 2010)
http://slidepdf.com/reader/full/world-urbanization-prospects-2009-revision-united-nations-2010 43/56
1950 1975 2009 2050 1950-1975 1975-2009 2009-2050
1 China 11.8 17.4 46.1 73.2 1.55 2.87 1.13
2 India 17.0 21.3 29.7 54.2 0.90 0.98 1.473 United States of America 64.2 73.7 82.0 90.4 0.55 0.32 0.24
4 Brazil 36.2 60.8 86.1 93.6 2.08 1.02 0.20
5 Russian Federation 44.1 66.4 73.1 82.7 1.64 0.28 0.30
6 Indonesia 12.4 19.3 44.0 65.9 1.77 2.42 0.99
7 Mexico 42.7 62.8 77.5 87.6 1.54 0.62 0.30
8 Japan 34.9 56.8 66.6 80.1 1.96 0.47 0.45
9 Nigeria 10.2 25.5 49.1 75.4 3.67 1.92 1.05
10 Pakistan 17.5 26.3 35.6 59.4 1.63 0.89 1.25
11 Germany 68.1 72.6 73.7 83.8 0.25 0.05 0.31
12 France 55.2 72.9 84.6 94.1 1.11 0.44 0.26
13 Iran (Islamic Republic of) 27.5 45.7 70.2 85.5 2.03 1.26 0.48
14 Turkey 24.8 41.6 69.2 84.0 2.07 1.50 0.47
15 United Kingdom 79.0 77.7 79.5 87.8 -0.07 0.07 0.24
16 Philippines 27.1 35.6 48.7 69.4 1.08 0.92 0.8617 Bangladesh 4.3 9.8 27.6 56.4 3.33 3.03 1.75
18 Italy 54.1 65.6 68.2 81.2 0.77 0.11 0.43
19 Republic of Korea 21.4 48.0 82.7 90.8 3.24 1.60 0.23
20 Argentina 65.3 81.0 92.2 96.0 0.86 0.38 0.10
21 Egypt 31.9 43.5 43.3 63.3 1.23 -0.01 0.93
22 Spain 51.9 69.6 77.2 86.5 1.17 0.31 0.28
23 Colombia 32.7 58.5 74.8 86.0 2.33 0.72 0.34
24 Ukraine 35.5 58.4 68.5 81.8 1.99 0.47 0.43
25 South Africa 42.2 48.1 61.2 79.6 0.52 0.71 0.64
26 Canada 60.9 75.6 80.5 87.9 0.86 0.18 0.22
27 Viet Nam 11.6 18.8 29.8 59.0 1.91 1.35 1.67
28 Poland 38.3 55.3 61.0 73.6 1.46 0.29 0.46
29 Democratic Republic of the Congo 19.1 29.5 34.6 63.2 1.74 0.47 1.47
30 Thailand 16.5 23.8 33.6 60.0 1.46 1.02 1.4131 Iraq 35.1 61.4 66.3 76.9 2.23 0.23 0.36
32 Sudan 6.8 18.9 39.4 67.7 4.08 2.15 1.32
33 Ethiopia 4.6 9.5 16.5 37.5 2.88 1.63 2.00
34 United Republic of Tanzania 3.5 11.1 25.9 54.0 4.64 2.48 1.79
Note: Based on countries that appear at least once in table A.5; countries are ordered according to the size of the urban population in 2009
Source: Population Division of the Department of Economic and Social Affairs of the United Nations Secretariat (2010) . World Urbaniza
Highlights. New York: United Nations
Table A.7. Level of urbanization, rate of urbanization and average annual rate of change for countries with the largest u
Rank CountryPercentage urban
Rate of urbanization
(percentage)
3 3

8/3/2019 World Urbanization Prospects 2009 Revision (United Nations 2010)
http://slidepdf.com/reader/full/world-urbanization-prospects-2009-revision-united-nations-2010 44/56
Rank Country
Rural
population in
1975
(thousands)
Cumulative
percentage Rank Country
Rural
population in
2009
(thousands)
Cumulative
percentage Rank Country
1 China 752 624 29.5 1 India 841 946 24.7 1 India
2 India 485 723 48.6 2 China 725 271 46.0 2 China
3 Indonesia 105 960 52.7 3 Indonesia 128 783 49.8 3 Pakistan
4 Bangladesh 71 274 55.5 4 Bangladesh 117 510 53.2 4 Ethiopia
5 United States of America 57 730 57.8 5 Pakistan 116 459 56.6 5 Indonesia
6 Pakistan 52 473 59.8 6 Nigeria 78 785 58.9 6 Bangladesh
7 Japan 48 192 61.7 7 Ethiopia 69 168 61.0 7 Nigeria
8 Nigeria 47 621 63.6 8 Viet Nam 61 864 62.8 8 Uganda
9 Russian Federation 45 066 65.4 9 United States of America 56 649 64.4 9 Democratic Republic
10 Brazil 42 398 67.0 10 Philippines 47 199 65.8 10 United Republic of T
11 Viet Nam 38 964 68.6 11 Egypt 47 074 67.2 11 Egypt
12 Thailand 32 201 69.8 12 Thailand 45 003 68.5 12 Viet Nam
13 Ethiopia 29 828 71.0 13 Democratic Republic of the C 43 201 69.8 13 Philippines
14 Philippines 27 090 72.0 14 Japan 42 425 71.0 14 Kenya 15 Turkey 24 073 73.0 15 Russian Federation 37 898 72.2 15 Afghanistan
16 Myanmar 22 736 73.9 16 Myanmar 33 524 73.1 16 United States of Am
17 Mexico 22 505 74.8 17 United Republic of Tanzania 32 402 74.1 17 Niger
18 Kenya 31 103 75.0 18 Thailand
19 Nepal
Table A.8. Countries accounting for 75 per cent of the world rural population
ordered by rural population size, 1975, 2009 and 2050
Source: Population Division of the Department of Economic and Social Affairs of the United Nations Secretariat (2010). World Urbanization Prospects: The 2009 Re
3 4

8/3/2019 World Urbanization Prospects 2009 Revision (United Nations 2010)
http://slidepdf.com/reader/full/world-urbanization-prospects-2009-revision-united-nations-2010 45/56
1950 1975 2009 2050 1950-1975 1975-2009 2009-2050
1 India 308 484 485 723 841 946 738 607 1.82 1.62 -0.32
2 China 480 632 752 624 725 271 379 350 1.79 -0.11 -1.583 Indonesia 67 585 105 960 128 783 98 103 1.80 0.57 -0.66
4 Bangladesh 41 728 71 274 117 510 96 995 2.14 1.47 -0.47
5 Pakistan 33 963 52 473 116 459 136 186 1.74 2.34 0.38
6 Nigeria 32 934 47 621 78 785 71 065 1.48 1.48 -0.25
7 Ethiopia 17 586 29 828 69 168 108 662 2.11 2.47 1.10
8 Viet Nam 24 181 38 964 61 864 45 798 1.91 1.36 -0.73
9 United States of America 56 571 57 730 56 649 38 839 0.08 -0.06 -0.92
10 Philippines 14 570 27 090 47 199 44 785 2.48 1.63 -0.13
11 Egypt 14 645 22 393 47 074 47 535 1.70 2.19 0.02
12 Thailand 17 211 32 201 45 003 29 377 2.51 0.98 -1.04
13 Democratic Republic of the Congo 9 857 16 520 43 201 54 240 2.07 2.83 0.56
14 Japan 53 958 48 192 42 425 20 256 -0.45 -0.37 -1.80
15 Russian Federation 57 424 45 066 37 898 20 119 -0.97 -0.51 -1.54
16 Myanmar 14 385 22 736 33 524 23 532 1.83 1.14 -0.8617 United Republic of Tanzania 7 383 14 192 32 402 50 341 2.61 2.43 1.07
18 Kenya 5 737 11 740 31 103 44 297 2.86 2.87 0.86
19 Uganda 5 013 10 126 28 419 60 676 2.81 3.03 1.85
20 Brazil 34 457 42 398 26 889 14 048 0.83 -1.34 -1.58
21 Mexico 15 908 22 505 24 630 15 952 1.39 0.27 -1.06
22 Nepal 7 909 12 711 24 034 25 709 1.90 1.87 0.16
23 Turkey 16 162 24 073 23 053 15 577 1.59 -0.13 -0.96
24 Afghanistan 7 679 11 559 21 869 39 189 1.64 1.88 1.42
25 Niger 2 342 4 509 12 692 36 785 2.62 3.04 2.60
Note: Based on countries that appear at least once in table A.8; countries are ordered according to the size of the rural population in 2009.
Source: Population Division of the Department of Economic and Social Affairs of the United Nations Secretariat (2010). World Urbanization P
New York: United Nations
Table A.9. Rural population, average annual rate of change and percentage rural for
countries with the lar est rural o ulations, 1950-2050
Rank Country Rural population (thousands)
Average annual rate of change of the
rural population (percentage)
3 5

8/3/2019 World Urbanization Prospects 2009 Revision (United Nations 2010)
http://slidepdf.com/reader/full/world-urbanization-prospects-2009-revision-united-nations-2010 46/56
Major area Before
1950
1950-
1975
1975-
2009
2009-
2025
2025-
2050
After
2050Total
World 52 45 43 20 46 24 230
Africa 1 2 16 7 23 8 57
Asia 8 12 8 5 12 5 50Europe 20 15 7 3 2 1 48Latin America and the Caribbean 14 9 11 4 6 2 46
Northern America 4 1 0 0 0 0 5Oceania 5 6 1 1 3 8 24
Table A.10. Number of countries by period in which their populations become 50 per cent urban, by major area
Source: Population Division of the Department of Economic and Social Affairs of the United Nations Secretariat (2010).
World Urbanization Prospects: The 2009 Revision. Highlights. New York: United Nations
Note: If a country or area had a urban poportion larger than 50 percent in 1950, the country was considered as a country that became 50 per
cent urban before 1950.
36

8/3/2019 World Urbanization Prospects 2009 Revision (United Nations 2010)
http://slidepdf.com/reader/full/world-urbanization-prospects-2009-revision-united-nations-2010 47/56
Major area Before 1950 1950-1975 1975-2009 2009-2025 2025-2050 After 2050 Total
World 35 38 49 43 60 5 230
Africa 1 1 10 6 37 2 57
Asia 1 7 11 16 13 2 50
Europe 23 13 8 2 2 0 48
Latin America and the Caribbean 6 11 15 11 3 0 46
Northern America 2 1 1 1 0 0 5Oceania 2 5 4 7 5 1 24
Table A.11. Number of countries or areas by period in which the rural population reaches a peak, by major area
Source: Population Division of the Department of Economic and Social Affairs of the United Nations Secretariat (2010). World
Urbanization Prospects: The 2009 Revision. Highlights. New York: United Nations
Note: If a country or area had its largest rural population in 1950, the country was considered as a country that reached its peak rural population
before 1950. This category also includes those countries or areas that did not have any rural population in 1950. If a country will have its largest
rural population in 2050, the country is considered as a country that will reach its peak rural population after 2050.
37
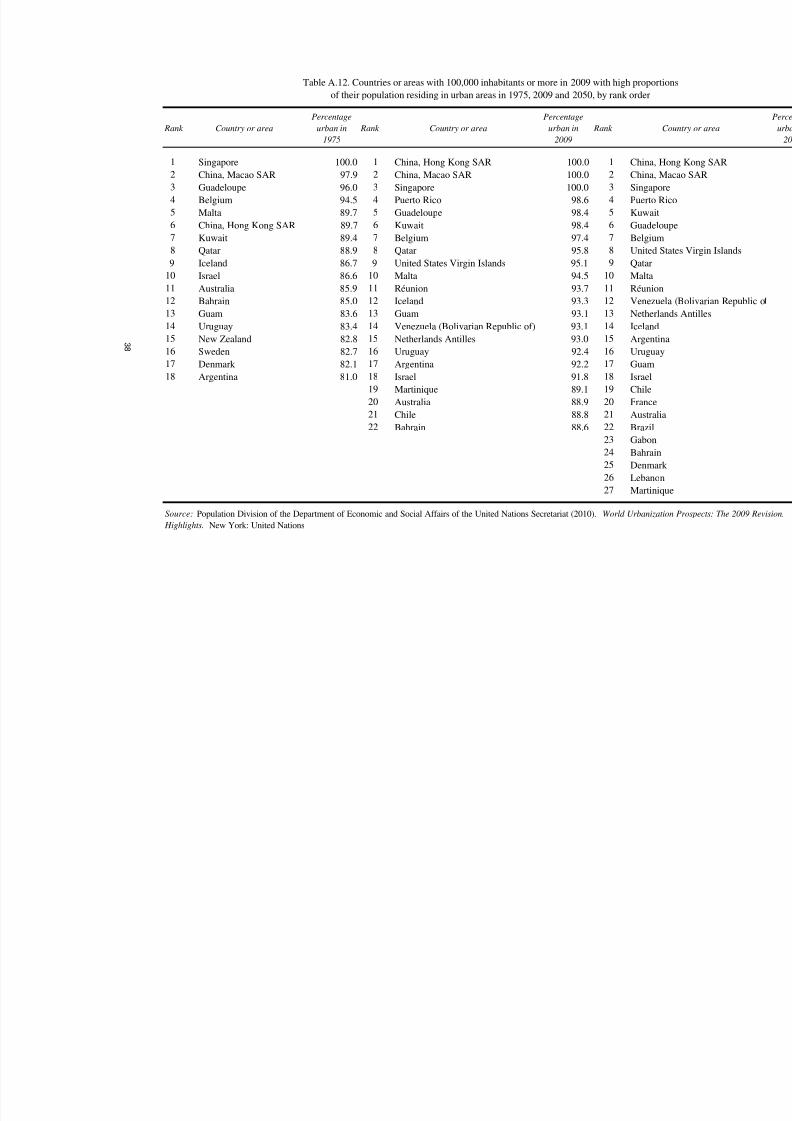
8/3/2019 World Urbanization Prospects 2009 Revision (United Nations 2010)
http://slidepdf.com/reader/full/world-urbanization-prospects-2009-revision-united-nations-2010 48/56
Rank Country or area
Percentage
urban in
1975
Rank Country or area
Percentage
urban in
2009
Rank
1 Singapore 100.0 1 China, Hong Kong SAR 100.0 1 China, H
2 China, Macao SAR 97.9 2 China, Macao SAR 100.0 2 China, M
3 Guadeloupe 96.0 3 Singapore 100.0 3 Singapo
4 Belgium 94.5 4 Puerto Rico 98.6 4 Puerto R
5 Malta 89.7 5 Guadeloupe 98.4 5 Kuwait
6 China, Hong Kong SAR 89.7 6 Kuwait 98.4 6 Guadelo
7 Kuwait 89.4 7 Belgium 97.4 7 Belgium
8 Qatar 88.9 8 Qatar 95.8 8 United S
9 Iceland 86.7 9 United States Virgin Islands 95.1 9 Qatar
10 Israel 86.6 10 Malta 94.5 10 Malta
11 Australia 85.9 11 Réunion 93.7 11 Réunion
12 Bahrain 85.0 12 Iceland 93.3 12 Venezue13 Guam 83.6 13 Guam 93.1 13 Netherla
14 Uruguay 83.4 14 Venezuela (Bolivarian Republic of) 93.1 14 Iceland
15 New Zealand 82.8 15 Netherlands Antilles 93.0 15 Argentin
16 Sweden 82.7 16 Uruguay 92.4 16 Uruguay
17 Denmark 82.1 17 Argentina 92.2 17 Guam
18 Argentina 81.0 18 Israel 91.8 18 Israel
19 Martinique 89.1 19 Chile
20 Australia 88.9 20 France
21 Chile 88.8 21 Australi
22 Bahrain 88.6 22 Brazil
23 Gabon
24 Bahrain25 Denmar
26 Lebanon
27 Martiniq
Table A.12. Countries or areas with 100,000 inhabitants or more in 2009 with high proport
of their population residing in urban areas in 1975, 2009 and 2050, by rank order
Source: Population Division of the Department of Economic and Social Affairs of the United Nations Secretariat (2010). World Urbanizat
Highlights. New York: United Nations
3 8
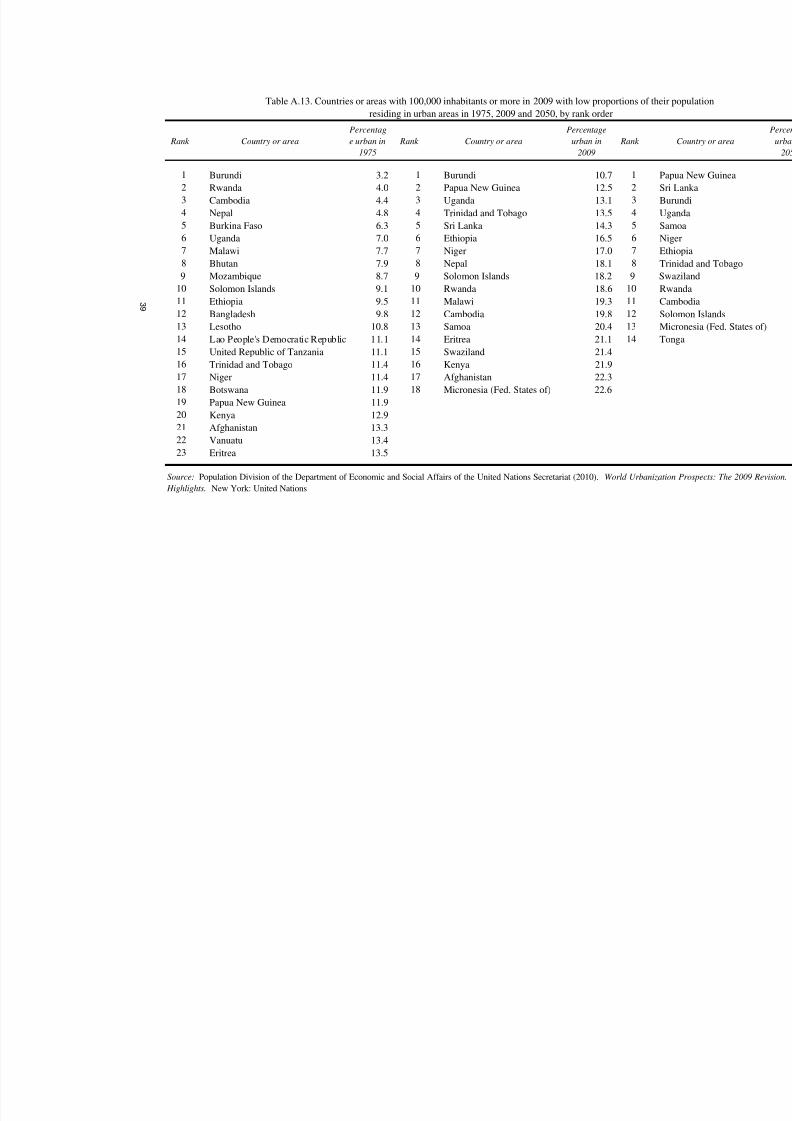
8/3/2019 World Urbanization Prospects 2009 Revision (United Nations 2010)
http://slidepdf.com/reader/full/world-urbanization-prospects-2009-revision-united-nations-2010 49/56
Rank Country or area
Percentag
e urban in
1975
Rank Country or area
Percentage
urban in
2009
Rank
1 Burundi 3.2 1 Burundi 10.7 1 P
2 Rwanda 4.0 2 Papua New Guinea 12.5 2 S
3 Cambodia 4.4 3 Uganda 13.1 3 B
4 Nepal 4.8 4 Trinidad and Tobago 13.5 4 U
5 Burkina Faso 6.3 5 Sri Lanka 14.3 5 S
6 Uganda 7.0 6 Ethiopia 16.5 6 N
7 Malawi 7.7 7 Niger 17.0 7 E
8 Bhutan 7.9 8 Nepal 18.1 8 T
9 Mozambique 8.7 9 Solomon Islands 18.2 9 S
10 Solomon Islands 9.1 10 Rwanda 18.6 10 R
11 Ethiopia 9.5 11 Malawi 19.3 11 C12 Bangladesh 9.8 12 Cambodia 19.8 12 S
13 Lesotho 10.8 13 Samoa 20.4 13 M
14 Lao People's Democratic Republic 11.1 14 Eritrea 21.1 14 T
15 United Republic of Tanzania 11.1 15 Swaziland 21.4
16 Trinidad and Tobago 11.4 16 Kenya 21.9
17 Niger 11.4 17 Afghanistan 22.3
18 Botswana 11.9 18 Micronesia (Fed. States of) 22.6
19 Papua New Guinea 11.9
20 Kenya 12.9
21 Afghanistan 13.3
22 Vanuatu 13.4
23 Eritrea 13.5
Table A.13. Countries or areas with 100,000 inhabitants or more in 2009 with low proportions of the
residing in urban areas in 1975, 2009 and 2050, by rank order
Source: Population Division of the Department of Economic and Social Affairs of the United Nations Secretariat (2010). World Urbaniza
Highlights. New York: United Nations
3 9
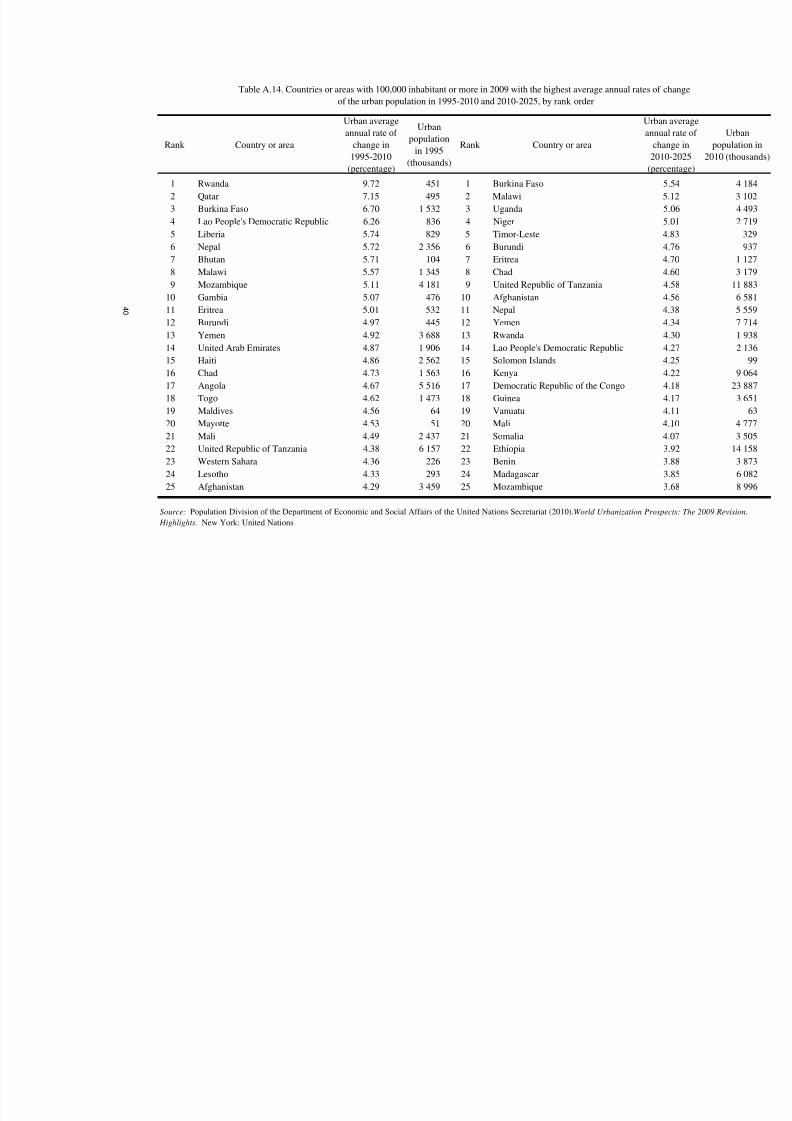
8/3/2019 World Urbanization Prospects 2009 Revision (United Nations 2010)
http://slidepdf.com/reader/full/world-urbanization-prospects-2009-revision-united-nations-2010 50/56
Rank Country or area
Urban average
annual rate of
change in
1995-2010
(percentage)
Urban
population
in 1995(thousands)
Rank Country or area
Urba
annu
ch
201
(per
1 Rwanda 9.72 451 1 Burkina Faso
2 Qatar 7.15 495 2 Malawi
3 Burkina Faso 6.70 1 532 3 Uganda
4 Lao People's Democratic Republic 6.26 836 4 Niger
5 Liberia 5.74 829 5 Timor-Leste
6 Nepal 5.72 2 356 6 Burundi
7 Bhutan 5.71 104 7 Eritrea
8 Malawi 5.57 1 345 8 Chad
9 Mozambique 5.11 4 181 9 United Republic of Tanzania
10 Gambia 5.07 476 10 Afghanistan11 Eritrea 5.01 532 11 Nepal
12 Burundi 4.97 445 12 Yemen
13 Yemen 4.92 3 688 13 Rwanda
14 United Arab Emirates 4.87 1 906 14 Lao People's Democratic Republic
15 Haiti 4.86 2 562 15 Solomon Islands
16 Chad 4.73 1 563 16 Kenya
17 Angola 4.67 5 516 17 Democratic Republic of the Congo
18 Togo 4.62 1 473 18 Guinea
19 Maldives 4.56 64 19 Vanuatu
20 Mayotte 4.53 51 20 Mali
21 Mali 4.49 2 437 21 Somalia
22 United Republic of Tanzania 4.38 6 157 22 Ethiopia23 Western Sahara 4.36 226 23 Benin
24 Lesotho 4.33 293 24 Madagascar
25 Afghanistan 4.29 3 459 25 Mozambique
Table A.14. Countries or areas with 100,000 inhabitant or more in 2009 with the highest average annual rates of
of the urban population in 1995-2010 and 2010-2025, by rank order
Source: Population Division of the Department of Economic and Social Affairs of the United Nations Secretariat (2010). World Urbanization Prosp
Highlights. New York: United Nations
4 0
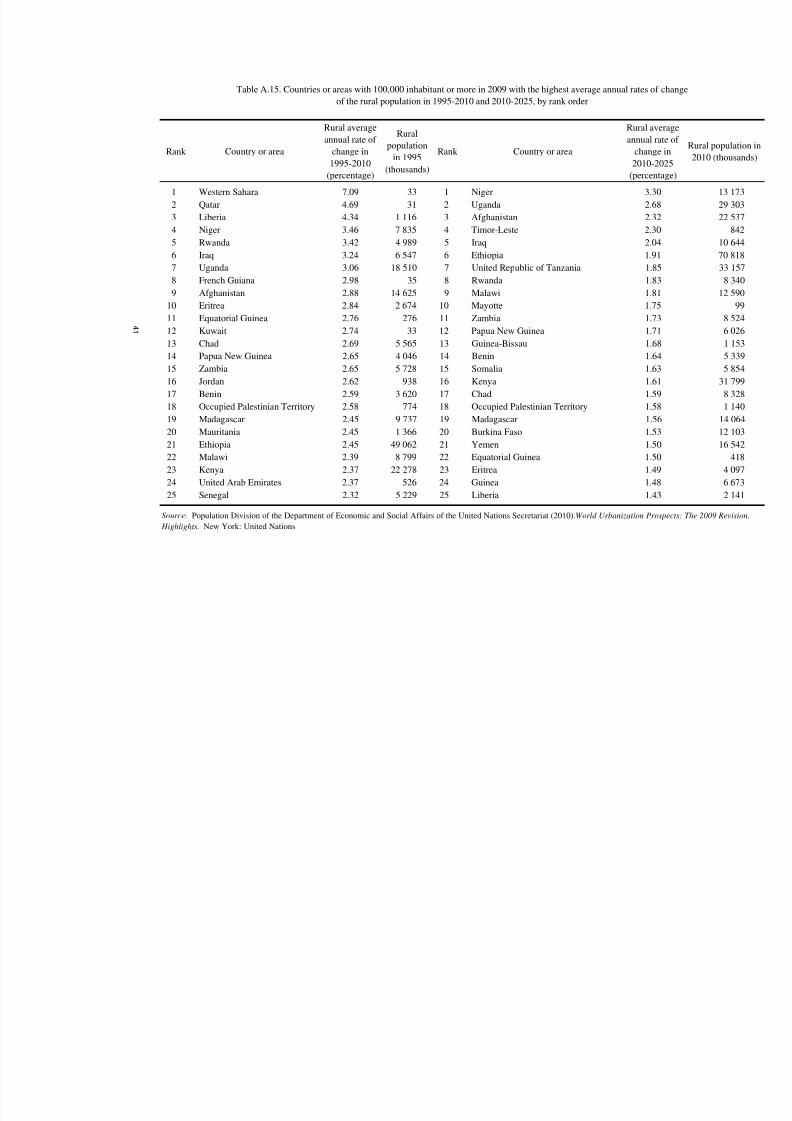
8/3/2019 World Urbanization Prospects 2009 Revision (United Nations 2010)
http://slidepdf.com/reader/full/world-urbanization-prospects-2009-revision-united-nations-2010 51/56
Rank Country or area
Rural average
annual rate of
change in1995-2010
(percentage)
Rural
population
in 1995
(thousands)
Rank Country or area
Rural ave
annual ra
change 2010-20
(percenta
1 Western Sahara 7.09 33 1 Niger 3.30
2 Qatar 4.69 31 2 Uganda 2.68
3 Liberia 4.34 1 116 3 Afghanistan 2.32
4 Niger 3.46 7 835 4 Timor-Leste 2.30
5 Rwanda 3.42 4 989 5 Iraq 2.04
6 Iraq 3.24 6 547 6 Ethiopia 1.91
7 Uganda 3.06 18 510 7 United Republic of Tanzania 1.85
8 French Guiana 2.98 35 8 Rwanda 1.83
9 Afghanistan 2.88 14 625 9 Malawi 1.81
10 Eritrea 2.84 2 674 10 Mayotte 1.75
11 Equatorial Guinea 2.76 276 11 Zambia 1.73
12 Kuwait 2.74 33 12 Papua New Guinea 1.71
13 Chad 2.69 5 565 13 Guinea-Bissau 1.68
14 Papua New Guinea 2.65 4 046 14 Benin 1.64
15 Zambia 2.65 5 728 15 Somalia 1.63
16 Jordan 2.62 938 16 Kenya 1.61
17 Benin 2.59 3 620 17 Chad 1.59
18 Occupied Palestinian Territory 2.58 774 18 Occupied Palestinian Territory 1.58
19 Madagascar 2.45 9 737 19 Madagascar 1.56
20 Mauritania 2.45 1 366 20 Burkina Faso 1.53
21 Ethiopia 2.45 49 062 21 Yemen 1.50
22 Malawi 2.39 8 799 22 Equatorial Guinea 1.50
23 Kenya 2.37 22 278 23 Eritrea 1.49
24 United Arab Emirates 2.37 526 24 Guinea 1.48
25 Senegal 2.32 5 229 25 Liberia 1.43
Table A.15. Countries or areas with 100,000 inhabitant or more in 2009 with the highest average annual rates of c
of the rural population in 1995-2010 and 2010-2025, by rank order
Source: Population Division of the Department of Economic and Social Affairs of the United Nations Secretariat (2010). World Urbanization Prosp
Highlights. New York: United Nations
4 1
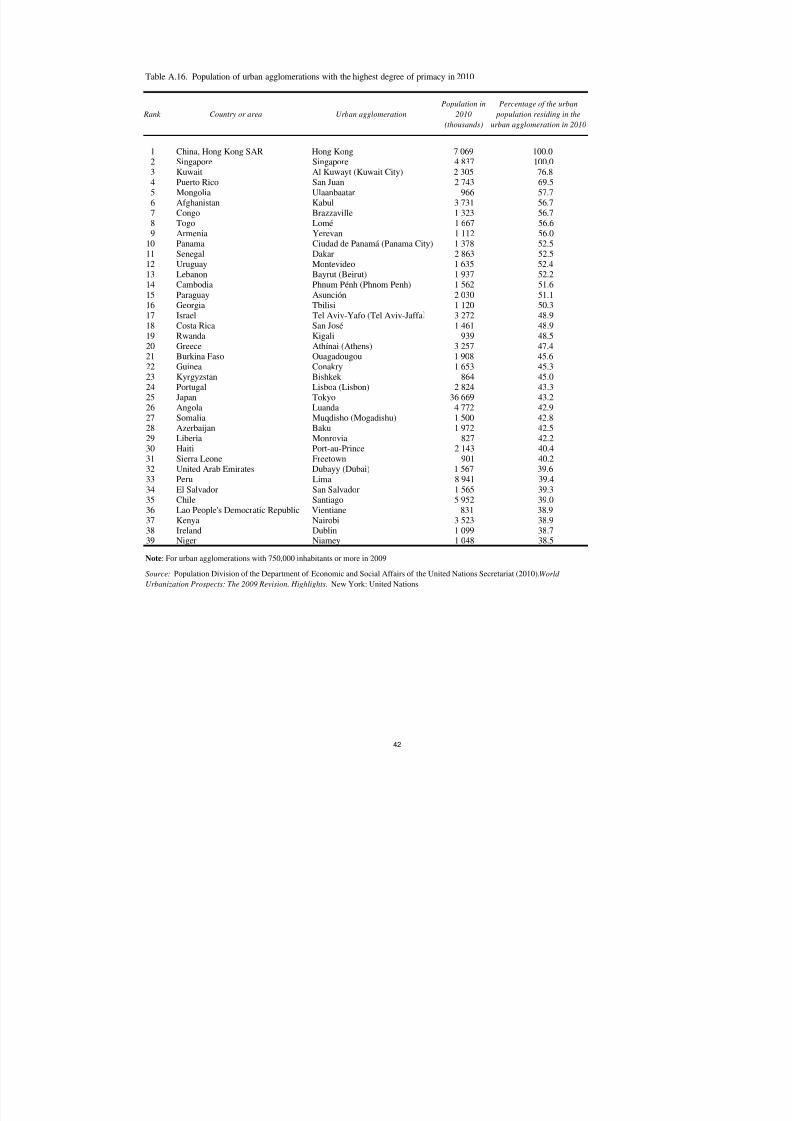
8/3/2019 World Urbanization Prospects 2009 Revision (United Nations 2010)
http://slidepdf.com/reader/full/world-urbanization-prospects-2009-revision-united-nations-2010 52/56
1 China, Hong Kong SAR Hong Kong 7 069 100.02 Singapore Singapore 4 837 100.03 Kuwait Al Kuwayt (Kuwait City) 2 305 76.84 Puerto Rico San Juan 2 743 69.55 Mongolia Ulaanbaatar 966 57.76 Afghanistan Kabul 3 731 56.77 Congo Brazzaville 1 323 56.78 Togo Lomé 1 667 56.69 Armenia Yerevan 1 112 56.0
10 Panama Ciudad de Panamá (Panama City) 1 378 52.511 Senegal Dakar 2 863 52.512 Uruguay Montevideo 1 635 52.413 Lebanon Bayrut (Beirut) 1 937 52.214 Cambodia Phnum Pénh (Phnom Penh) 1 562 51.6
15 Paraguay Asunción 2 030 51.1
16 Georgia Tbilisi 1 120 50.317 Israel Tel Aviv-Yafo (Tel Aviv-Jaffa 3 272 48.918 Costa Rica San José 1 461 48.919 Rwanda Kigali 939 48.520 Greece Athínai (Athens) 3 257 47.421 Burkina Faso Ouagadougou 1 908 45.622 Guinea Conakry 1 653 45.323 Kyrgyzstan Bishkek 864 45.024 Portugal Lisboa (Lisbon) 2 824 43.325 Japan Tokyo 36 669 43.226 Angola Luanda 4 772 42.927 Somalia Muqdisho (Mogadishu) 1 500 42.828 Azerbaijan Baku 1 972 42.529 Liberia Monrovia 827 42.230 Haiti Port-au-Prince 2 143 40.431 Sierra Leone Freetown 901 40.232 United Arab Emirates Dubayy (Dubai) 1 567 39.633 Peru Lima 8 941 39.4
34 El Salvador San Salvador 1 565 39.335 Chile Santiago 5 952 39.036 Lao People's Democratic Republic Vientiane 831 38.937 Kenya Nairobi 3 523 38.938 Ireland Dublin 1 099 38.739 Niger Niamey 1 048 38.5
Note: For urban agglomerations with 750,000 inhabitants or more in 2009
Source: Population Division of the Department of Economic and Social Affairs of the United Nations Secretariat (2010).World
Urbanization Prospects: The 2009 Revision. Highlights. New York: United Nations
Table A.16. Population of urban agglomerations with the highest degree of primacy in 2010
Rank Country or area Urban agglomeration
Population in
2010
(thousands)
Percentage of the urban
population residing in the
urban agglomeration in 2010
42
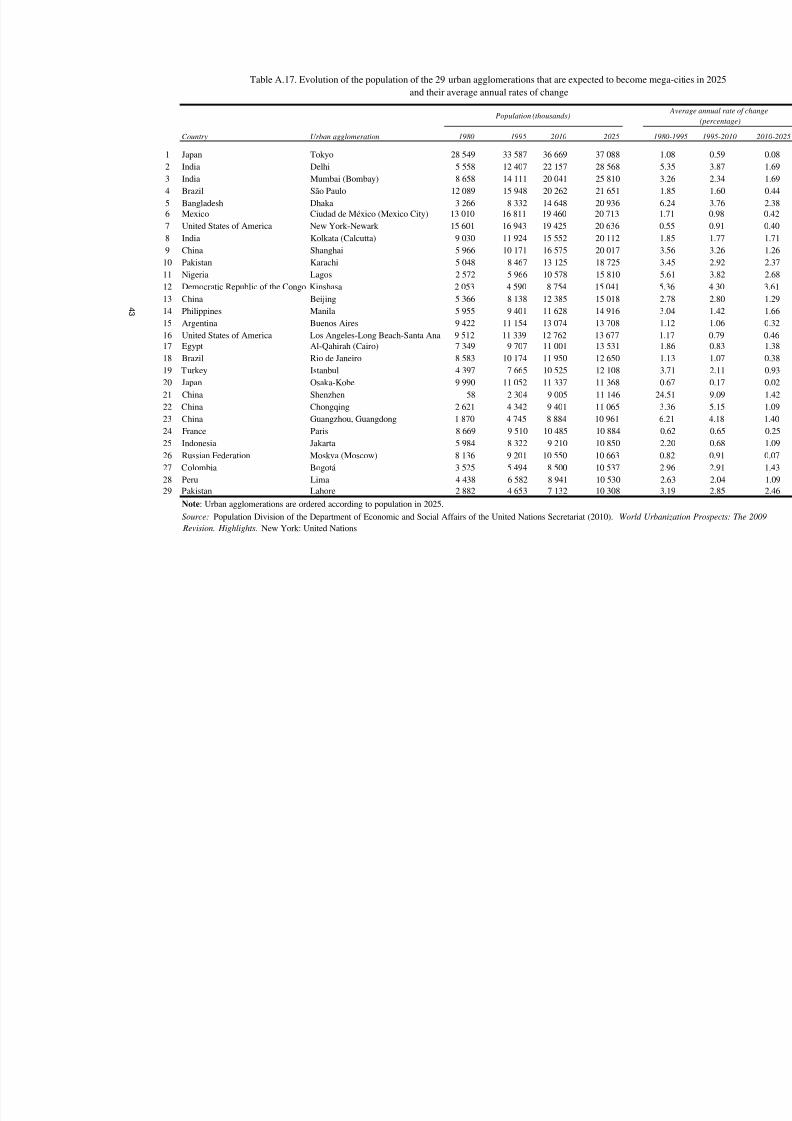
8/3/2019 World Urbanization Prospects 2009 Revision (United Nations 2010)
http://slidepdf.com/reader/full/world-urbanization-prospects-2009-revision-united-nations-2010 53/56
1980 1995 2010 2025 19
1 Japan Tokyo 28 549 33 587 36 669 37 088
2 India Delhi 5 558 12 407 22 157 28 568
3 India Mumbai (Bombay) 8 658 14 111 20 041 25 810
4 Brazil São Paulo 12 089 15 948 20 262 21 651
5 Bangladesh Dhaka 3 266 8 332 14 648 20 936
6 Mexico Ciudad de México (Mexico City) 13 010 16 811 19 460 20 713
7 United States of America New York-Newark 15 601 16 943 19 425 20 636 0
8 India Kolkata (Calcutta) 9 030 11 924 15 552 20 112
9 China Shanghai 5 966 10 171 16 575 20 017
10 Pakistan Karachi 5 048 8 467 13 125 18 725
11 Nigeria Lagos 2 572 5 966 10 578 15 810
12 Democratic Republic of the Congo Kinshasa 2 053 4 590 8 754 15 041
13 China Beijing 5 366 8 138 12 385 15 01814 Philippines Manila 5 955 9 401 11 628 14 916
15 Argentina Buenos Aires 9 422 11 154 13 074 13 708
16 United States of America Los Angeles-Long Beach-Santa Ana 9 512 11 339 12 762 13 677
17 Egypt Al-Qahirah (Cairo) 7 349 9 707 11 001 13 531
18 Brazil Rio de Janeiro 8 583 10 174 11 950 12 650
19 Turkey Istanbul 4 397 7 665 10 525 12 108
20 Japan Osaka-Kobe 9 990 11 052 11 337 11 368 0
21 China Shenzhen 58 2 304 9 005 11 146 24
22 China Chongqing 2 621 4 342 9 401 11 065
23 China Guangzhou, Guangdong 1 870 4 745 8 884 10 961
24 France Paris 8 669 9 510 10 485 10 884 0
25 Indonesia Jakarta 5 984 8 322 9 210 10 850
26 Russian Federation Moskva (Moscow) 8 136 9 201 10 550 10 663 0
27 Colombia Bogotá 3 525 5 494 8 500 10 537
28 Peru Lima 4 438 6 582 8 941 10 530
29 Pakistan Lahore 2 882 4 653 7 132 10 308
Note: Urban agglomerations are ordered according to population in 2025.
Source: Population Division of the Department of Economic and Social Affairs of the United Nations Secretariat (2010). World Urba
Revision. Highlights. New York: United Nations
Table A.17. Evolution of the population of the 29 urban agglomerations that are expected to become me
and their average annual rates of change
Country Urban agglomeration
Population (thousands)
4 3
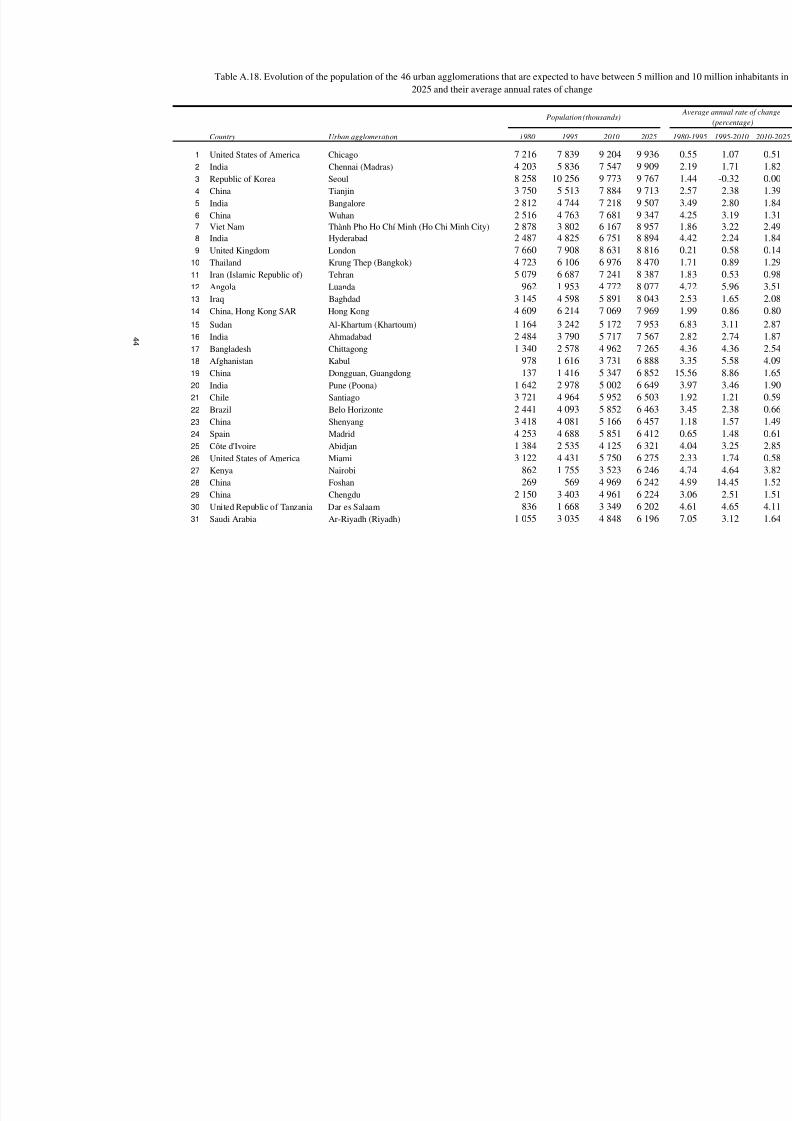
8/3/2019 World Urbanization Prospects 2009 Revision (United Nations 2010)
http://slidepdf.com/reader/full/world-urbanization-prospects-2009-revision-united-nations-2010 54/56
1980 1995 2010 2025
1 United States of America Chicago 7 216 7 839 9 204 9 936
2 India Chennai (Madras) 4 203 5 836 7 547 9 909
3 Republic of Korea Seoul 8 258 10 256 9 773 9 767
4 China Tianjin 3 750 5 513 7 884 9 713
5 India Bangalore 2 812 4 744 7 218 9 507
6 China Wuhan 2 516 4 763 7 681 9 3477 Viet Nam Thành Pho Ho Chí Minh (Ho Chi Minh City) 2 878 3 802 6 167 8 957
8 India Hyderabad 2 487 4 825 6 751 8 894
9 United Kingdom London 7 660 7 908 8 631 8 816
10 Thailand Krung Thep (Bangkok) 4 723 6 106 6 976 8 470
11 Iran (Islamic Republic of) Tehran 5 079 6 687 7 241 8 387
12 Angola Luanda 962 1 953 4 772 8 077
13Iraq Baghdad 3 145 4 598 5 891 8 043
14 China, Hong Kong SAR Hong Kong 4 609 6 214 7 069 7 969
15 Sudan Al-Khartum (Khartoum) 1 164 3 242 5 172 7 953
16 India Ahmadabad 2 484 3 790 5 717 7 567
17 Bangladesh Chittagong 1 340 2 578 4 962 7 265
18 Afghanistan Kabul 978 1 616 3 731 6 888
19 China Dongguan, Guangdong 137 1 416 5 347 6 852
20 India Pune (Poona) 1 642 2 978 5 002 6 649
21 Chile Santiago 3 721 4 964 5 952 6 503
22 Brazil Belo Horizonte 2 441 4 093 5 852 6 463
23 China Shenyang 3 418 4 081 5 166 6 457
24 Spain Madrid 4 253 4 688 5 851 6 412
25 Côte d'Ivoire Abidjan 1 384 2 535 4 125 6 321
26 United States of America Miami 3 122 4 431 5 750 6 275
27 Kenya Nairobi 862 1 755 3 523 6 246
28 China Foshan 269 569 4 969 6 242
29 China Chengdu 2 150 3 403 4 961 6 224
30 United Republic of Tanzania Dar es Salaam 836 1 668 3 349 6 202
31 Saudi Arabia Ar-Riyadh (Riyadh) 1 055 3 035 4 848 6 196
Table A.18. Evolution of the population of the 46 urban agglomerations that are expected to have between 5 milli
2025 and their average annual rates of change
Country Urban agglomeration
Population (thousands)
4 4
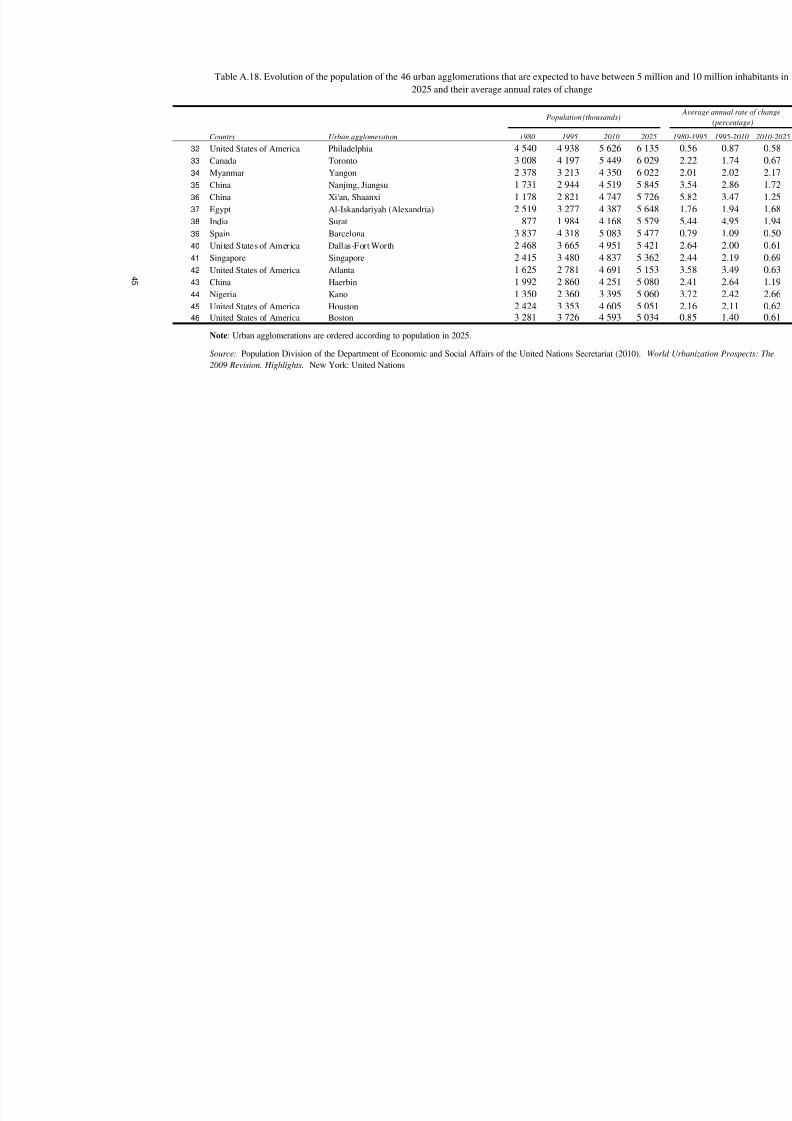
8/3/2019 World Urbanization Prospects 2009 Revision (United Nations 2010)
http://slidepdf.com/reader/full/world-urbanization-prospects-2009-revision-united-nations-2010 55/56
1980 1995 2010 2025
Table A.18. Evolution of the population of the 46 urban agglomerations that are expected to have between 5 milli
2025 and their average annual rates of change
Country Urban agglomeration
Population (thousands)
32 United States of America Philadelphia 4 540 4 938 5 626 6 13533 Canada Toronto 3 008 4 197 5 449 6 029
34 Myanmar Yangon 2 378 3 213 4 350 6 022
35 China Nanjing, Jiangsu 1 731 2 944 4 519 5 845
36 China Xi'an, Shaanxi 1 178 2 821 4 747 5 726
37 Egypt Al-Iskandariyah (Alexandria) 2 519 3 277 4 387 5 648
38 India Surat 877 1 984 4 168 5 579
39 Spain Barcelona 3 837 4 318 5 083 5 477
40 United States of America Dallas-Fort Worth 2 468 3 665 4 951 5 421
41 Singapore Singapore 2 415 3 480 4 837 5 362
42 United States of America Atlanta 1 625 2 781 4 691 5 153
43 China Haerbin 1 992 2 860 4 251 5 080
44 Nigeria Kano 1 350 2 360 3 395 5 060
45 United States of America Houston 2 424 3 353 4 605 5 051
46 United States of America Boston 3 281 3 726 4 593 5 034
Note: Urban agglomerations are ordered according to population in 2025.
Source: Population Division of the Department of Economic and Social Affairs of the United Nations Secretariat (2010). Wor
2009 Revision. Highlights. New York: United Nations
4 5

8/3/2019 World Urbanization Prospects 2009 Revision (United Nations 2010)
http://slidepdf.com/reader/full/world-urbanization-prospects-2009-revision-united-nations-2010 56/56
UNITED NATIONS NATIONS UNIES
Department of Economic and Social AffairsPOPULATION DIVISION
World Urbanization Prospects: The 2009 RevisionData in Digital Form
Copyright © United Nations 2010All rights reserved
Date: ____________________________
Order Form
Data set requested (please mark appropriate box with an “x”) Price in US$
CD-ROM:
World Urbanization Prospects: The 2009 Revision.
CD-ROM Edition – Data in digital form (POP/DB/WUP/Rev.2009) ......................................$200.-
SHIP TO:Name: ..............................................................................................................................................................
Institution: ..............................................................................................................................................................
Address: ..............................................................................................................................................................
..............................................................................................................................................................
Telephone: ..............................................................Fax No: .................................................................................
Email address: .............................................................................................................................................................
For overnight or express mail delivery, please provide a billing account number: ............................................
Notes
1. Data contained in the above data sets are copyrighted by the United Nations. No portion of the data filescontained on the CD-ROM can be reproduced, distributed or used to prepare derivative works or for any other purposewithout the express permission of the United Nations, to be obtained from the Secretary of the United Nations Publications
Board. For further information, please contact the Director, Population Division/DESA, United Nations (Room DC2-1950),New York, NY 10017, U.S.A. Telephone No. (1 212) 963-3179; Fax No. (1 212) 963-2147.
2. The order form should be accompanied by a cheque or an international money order in US dollars drawn on a
United States Bank for the correct amount, payable to the UNITED NATIONS POPULATION DIVISION and mailed to: