INTERNATIONAL TELECOMMUNICATION UNION - World Wide Web Consortium
SUMMARY
20
03
I n t e r n a t i o n a l Te l e c o m m u n i c a t i o n U n i o n
I n te rnat iona lTe lecommun icat ionUn ion

WORLD TELECOMMUNICATION
DEVELOPMENT REPORT 2003
Access Indicators for theInformation Society
Executive summary
December 2003
INTERNATIONAL TELECOMMUNICATION UNION
2
The World Telecommunication Development Report is carried out in relation toResolution 8: Collection and dissemination of information (World TelecommunicationDevelopment Conference, Istanbul, 2002) and coordinated by the ITU’sTelecommunication Development Bureau.
A team led by Michael Minges and comprising Vanessa Gray and Esperanza Magpantayprepared the report. Tim Kelly, Taylor Reynolds, Megha Mukim, Susan Schorr andSushant Suri also contributed. Joanna Goodrick was the principal editor.
Nathalie Delmas-Rollet coordinated the layout and production of the report.Patricia Sofia Sousa Pinto, age ten, of Portugal made the drawing on the cover.Stéphane Rollet did the cover design.
The authors would like to thank ITU Member States and Sector Members, publictelecommunication operators, regulators and others that have provided data and otherinputs to the report.
Several meetings provided valuable input to the report. These included the WorldTelecommunication / ICT Indicators Meeting, Indicators Workshop on Community Accessto ICTs, Expert Meeting on Measuring Electronic Commerce as an Instrument for theDevelopment of the Digital Economy, Inter-agency and Expert Group on MillenniumDevelopment Goals Indicators and the New Initiatives workshops.
The views expressed are those of the authors and may not necessarily reflect the opinionsof ITU or its members.
© 2003 ITU
3
Introduction
The 2003 ITU World Telecommunication Development Report: Access Indicatorsfor the Information Society has been specially prepared for the first phase of the WorldSummit on the Information Society (WSIS) (Geneva, 10-12 December 2003). Thisyear’s report examines the specific issue of measuring access to information andcommunication technologies (ICTs). ITU has long been involved in analysing accessto ICTs. As early as 1984, the Maitland Commission Report, known as “The MissingLink”, first drew international attention to the large inequities in telephone access acrossthe world. ITU’s 1998 World Telecommunication Development Report—on “universalaccess”—updated the Missing Link findings in light of technological and regulatorychanges affecting the telecommunication industry.
Until recently, infrastructure had been considered as the main obstacle to improvingaccess to ICTs. Existing indicators are therefore often infrastructure-based, measuringsuch variables as the number of main telephone lines, and typically usetelecommunication operators’ data. But there is growing evidence that other factors,such as affordability and knowledge, are an important part of the access picture. It iswidely recognized that new indicators are needed. The new environment, with a growingemphasis on reducing the digital divide, requires access and usage indicatorsdisaggregated by socio-economic categories such as age, gender, income and location.To measure the ICT picture in full, new multi-stakeholder partnerships will be requiredinvolving not only the statistical agencies that are traditionally responsible for conductingsurveys, but also policy-makers, the private sector, civil society, multilateral organisationsand others involved the ICT arena.
In 2003, nearly two decades after the Missing Link findings, this new edition of theWorld Telecommunication Development Report seeks to help meet this need byidentifying relevant indicators for measuring access of the world’s populations to ICTs—helping to measure the extent to which countries and communities worldwide havegenuine access to the information society. The report has six chapters. The first puts theinformation society in context, describing why new indicators are needed to followtrends and make comparisons. The second chapter discusses indicators for measuringindividual, household and community access to ICTs showing their relevance fordifferent policy objectives such as universal service or access. Chapter three looks atmeasuring ICT access in the key sectors of businesses, government and schools, whereICT use is crucial for electronic commerce, efficient public administration, and toencourage youth to participate in the information society. Chapter four examines theinterrelationship between ICT indicators and the Millennium Development Goals, whichhave attracted considerable attention as a standard for identifying and measuring globaldevelopment objectives. Chapter five examines the need for a relevant and inclusiveICT index to measure country progress. In conclusion, chapter six offersrecommendations for improving the availability of information society access indicators.
4
WORLD TELECOMMUNICATION DEVELOPMENT REPORT 2003 EXECUTIVE SUMMARY
1. Accessing the Information Society
At the time this report was prepared, the draft World Summit on the Information Society(WSIS) Declaration of Principles described the information society as a society where“…everyone can create, access, utilize and share information and knowledge, enablingindividuals, communities and people[s] to achieve their full potential and improvetheir quality of life in a sustainable manner.” New ICTs enable instantaneous exchangeof information and the delivery of innovative applications, for example in government,commerce, education and health. But without access to ICTs, many people around theworld are still excluded. How far is the world from realizing the vision of everyone havingaccess to the information society?
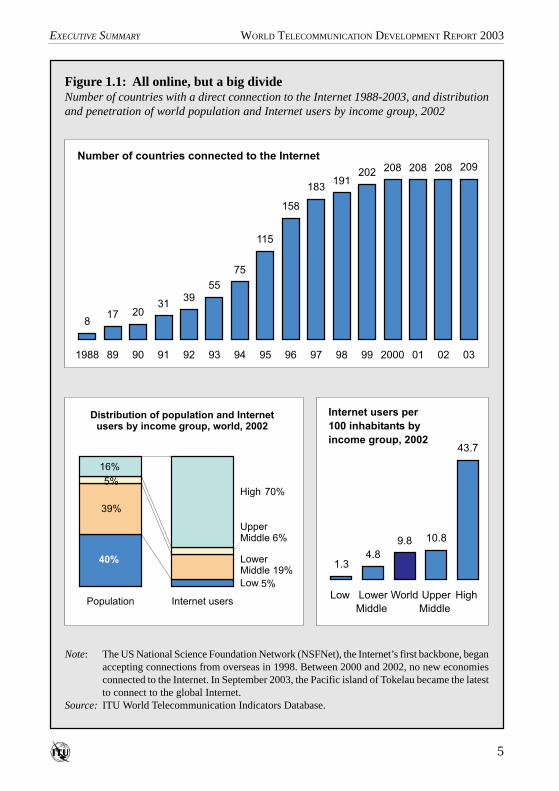
As we enter the new millennium, almost every country in the world has a directconnection to the Internet (Figure 1.1, top). Although this is an impressive achievement,ICT penetration levels vary among and within countries, creating a digital divide betweenthose with high and those with low access levels (Figure 1.1, bottom). In order to movetowards an inclusive information society, countries need meaningful data to identifydisparities in access, to track progress and to make international comparisons. Onlythen can policy-makers and the private sector effectively target underserved segmentsof society. It is crucial to understand who has access, and where and how people use ICTs,in both developing and developed countries.
If it is time to measure the information society, it is also time to re-think traditionalindicators. The convergence of ICT industries, and the new emphasis on addressing thedigital divide, has led to the need for a set of policy-oriented information society statistics.Although a number of ICT indicators already exist, they are often inappropriate forpolicy analysis; few countries collect pragmatic indicators for measuring access, andeven where they exist, international comparisons are often hampered by differences indefinition and methodologies. They are also typically derived from administrative recordsrather than from purpose-built surveys. This statistical divide is as great as—or evengreater than—the digital divide.
While some developed nations are racing ahead in measurement, tracking a multitude offactors such as ICT infrastructure, access, usage, volume and value, many developingnations are struggling to produce even basic ICT indicators. A globally relevant approachneeds to concentrate on trends that can be measured to a comparable extent in all countries,not just those already collecting data. This report argues that access to ICTs is doubtless themost fundamental prerequisite for an inclusive information society. Measuring access istherefore a key priority for a set of indicators that are relevant to all countries of the world.This report explains the different ways of measuring access to ICTs and offers a middleway between too much and too little, between relevance for the majority of countries oronly for a minority, between what is achievable within existing constraints and what wouldrequire a significant increase in resources.
5
WORLD TELECOMMUNICATION DEVELOPMENT REPORT 2003EXECUTIVE SUMMARY
Figure 1.1: All online, but a big divideNumber of countries with a direct connection to the Internet 1988-2003, and distributionand penetration of world population and Internet users by income group, 2002
Note: The US National Science Foundation Network (NSFNet), the Internet’s first backbone, beganaccepting connections from overseas in 1998. Between 2000 and 2002, no new economiesconnected to the Internet. In September 2003, the Pacific island of Tokelau became the latestto connect to the global Internet.
Source: ITU World Telecommunication Indicators Database.
40%
5%
39%
5%
16%
70%
Population Internet users
Distribution of population and Internetusers by income group, world, 2002
High
UpperMiddle 6%
LowerMiddle 19%
Low
1.34.8
9.8 10.8
43.7
Low Lower
Middle
World Upper
Middle
High
Internet users per
100 inhabitants by
income group, 2002
817 20
3139
55
75
115
158
183191
202 208 208 208 209
1988 89 90 91 92 93 94 95 96 97 98 99 2000 01 02 03
Number of countries connected to the Internet
6
WORLD TELECOMMUNICATION DEVELOPMENT REPORT 2003 EXECUTIVE SUMMARY
2. Measuring Access to ICTs
Picking the right indicator
Who has access to ICTs? Part of the answer depends on how ICTs are measured. Theconventional way is to divide the number of access devices or services by the total population.While such per capita measures are convenient and useful for comparing general differencesbetween and within countries, they can be misleading. This is because a per capita indicatordoes not reflect the socio-demographic composition of nations. For example, if there are100 telephone lines in a country, all owned by the same person, then is that country better offthan a country with 50 telephone lines owned by 50 different people? And is a country withfewer telephones but larger households worse off than a country with more telephones andsmaller households? Per capita measures also fail to take into account the principles of sharing—of telephones in households or of computers in Internet cafés, for instance (Box 2.1). They alsofail to take into account access to ICTs through the workplace, school or through governmentinitiatives (see Chapter Three). The lack of detailed breakdown of data provided by per capitameasures also make it impossible to set specific targets.
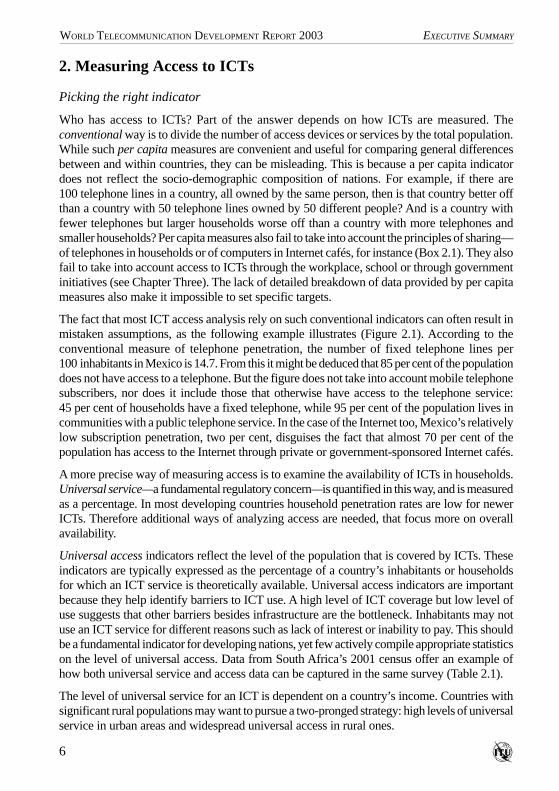
The fact that most ICT access analysis rely on such conventional indicators can often result inmistaken assumptions, as the following example illustrates (Figure 2.1). According to theconventional measure of telephone penetration, the number of fixed telephone lines per100 inhabitants in Mexico is 14.7. From this it might be deduced that 85 per cent of the populationdoes not have access to a telephone. But the figure does not take into account mobile telephonesubscribers, nor does it include those that otherwise have access to the telephone service:45 per cent of households have a fixed telephone, while 95 per cent of the population lives incommunities with a public telephone service. In the case of the Internet too, Mexico’s relativelylow subscription penetration, two per cent, disguises the fact that almost 70 per cent of thepopulation has access to the Internet through private or government-sponsored Internet cafés.
A more precise way of measuring access is to examine the availability of ICTs in households.Universal service—a fundamental regulatory concern—is quantified in this way, and is measuredas a percentage. In most developing countries household penetration rates are low for newerICTs. Therefore additional ways of analyzing access are needed, that focus more on overallavailability.
Universal access indicators reflect the level of the population that is covered by ICTs. Theseindicators are typically expressed as the percentage of a country’s inhabitants or householdsfor which an ICT service is theoretically available. Universal access indicators are importantbecause they help identify barriers to ICT use. A high level of ICT coverage but low level ofuse suggests that other barriers besides infrastructure are the bottleneck. Inhabitants may notuse an ICT service for different reasons such as lack of interest or inability to pay. This shouldbe a fundamental indicator for developing nations, yet few actively compile appropriate statisticson the level of universal access. Data from South Africa’s 2001 census offer an example ofhow both universal service and access data can be captured in the same survey (Table 2.1).
The level of universal service for an ICT is dependent on a country’s income. Countries withsignificant rural populations may want to pursue a two-pronged strategy: high levels of universalservice in urban areas and widespread universal access in rural ones.
7
WORLD TELECOMMUNICATION DEVELOPMENT REPORT 2003EXECUTIVE SUMMARY
Figure 2.1: Possession, access and use in MexicoFixed, mobile and Internet subscribers per 100 inhabitants; percentage of householdswith fixed telephone line and Internet access from the home; percentage of the populationcovered by fixed, mobile and Internet service, 2002
Note: Fixed and Internet coverage derived from localities with service.Source: ITU World Telecommunication Indicators Database and Secretariat of Communications and
Transport (SCT), Mexico.
It is also useful to compile usage statistics. While the categories described above give anindication of the availability of infrastructure, the number of users measures the actual utilizationof a given service.
14.7
25.4
2.0
45.3
6.2
94.5 89.9
68.5
9.9
0
10
20
30
40
50
60
70
80
90
100
Fixed Mobile Internet
Subscribersper 100inhabitants
Availability inhousehold (%)
Populationcovered (%)
Users per100 inhabitants
Universal
access
Universal
service
Table 2.1: Measuring universal service and accessTelephone facilities available to households, per cent, 2001, South Africa
Source: ITU adapted from Statistics South Africa, Census 2001.
Telephone and cell-phone in dwelling 14.2%
Telephone in dwelling 10.2%
Cell-phone in dwelling 18.0%
At a neighbour nearby 6.6%
At a public telephone nearby 38.5%
At another location nearby 3.2%
At another location, not nearby 3.4%
No access to a telephone 6.0%
Total 100.0%
UniversalService =
42.4%UniversalAccess =94.0 %
8
WORLD TELECOMMUNICATION DEVELOPMENT REPORT 2003 EXECUTIVE SUMMARY
What is an ICT?
The type of ICT devices and services useful for studying access to the informationsociety include radios, televisions, fixed telephones, mobile telephones, personalcomputers (PC), and the Internet. The first three are often considered to be old ICTswhile the latter three are considered new. This split between old and new is also reflectedin statistical availability. Most developing nations tend to have data on the “older”ICTs, while most developed nations focus on the newer ones.
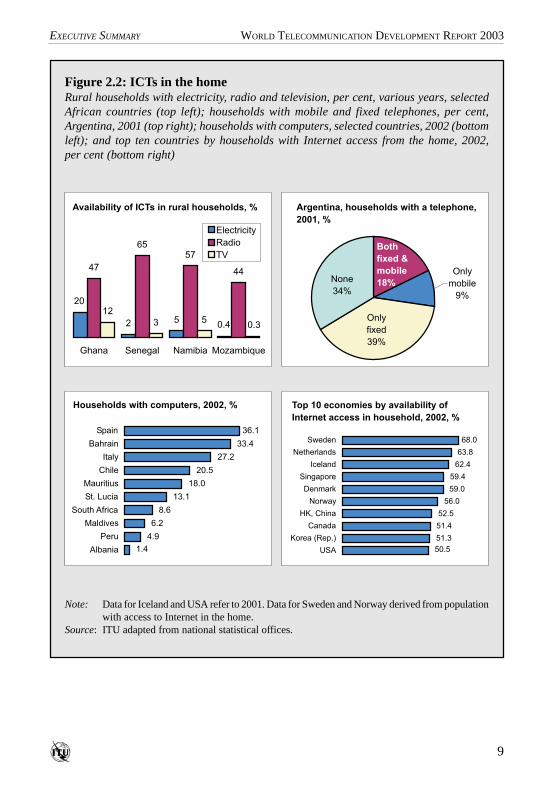
Radios increasingly fall into the category of having achieved universal service. In mostdeveloping nations, household radio ownership has surpassed the halfway mark.Televisions too are on the way to being ubiquitous in many countries. The biggeststumbling block to penetration of these ICTs in the lowest income nations appears to beelectricity. Data from Africa show that while rural availability of radios—which requireonly batteries to operate—is relatively high, the level of household television ownershipis tightly linked to the availability of electricity (Figure 2.2, top left). Newer ICTs alsotend to be more dependent on the availability of energy or recharging facilities, suggestingthat the percentage of households with electricity is a key indicator for measuring thepotential for ICT access in developing nations.
The availability of telephones in homes has grown tremendously over the last decade,particularly through the large increase in mobile subscribers. Unfortunately though,few countries provide differentiated data on the number of households with either afixed or mobile telephone. Argentina is one exception to this (Figure 2.2, top right).The wireless aspect of mobile telephony has given rise to a very useful new indicatorfor measuring universal telephone access. This is the number of inhabitants withinrange of a mobile telephone signal.
Access to a PC is important not only because is it an information device in its ownright, but also because it is the main tool to enable Internet access. Most internationalcomparisons of PC access are based on the stock available in the country, measuredaccording to estimated data based on sales figures. This is usually not a very reliable oruniversally available statistic compared to those obtained through purpose-built surveys.There are a number of national statistical agencies that conduct surveys on the numberof people that use a PC, and most developed nations compile data on the percentage ofhouseholds with a computer. A growing number of developing nations are also compilingthis statistic with emerging economies making strong progress (Figure 2.2, bottom left).A further useful indicator is the percentage of households with Internet access from thehome. Most developed economies consider this a key indicator of the information societyand almost all now compile it (Figure 2.2, bottom right).
9
WORLD TELECOMMUNICATION DEVELOPMENT REPORT 2003EXECUTIVE SUMMARY
Figure 2.2: ICTs in the homeRural households with electricity, radio and television, per cent, various years, selectedAfrican countries (top left); households with mobile and fixed telephones, per cent,Argentina, 2001 (top right); households with computers, selected countries, 2002 (bottomleft); and top ten countries by households with Internet access from the home, 2002,per cent (bottom right)
Note: Data for Iceland and USA refer to 2001. Data for Sweden and Norway derived from populationwith access to Internet in the home.
Source: ITU adapted from national statistical offices.
20
2 5
47
6557
44
12
3 50.4 0.3
Ghana Senegal Namibia Mozambique
Electricity
Radio
TV
Availability of ICTs in rural households, %
1.4
4.9
6.2
8.6
13.1
18.0
20.5
27.2
33.4
36.1
Albania
Peru
Maldives
South Africa
St. Lucia
Mauritius
Chile
Italy
Bahrain
Spain
Households with computers, 2002, %
50.5
51.3
51.4
52.5
56.0
59.0
59.4
62.4
63.8
68.0
USA
Korea (Rep.)
Canada
HK, China
Norway
Denmark
Singapore
Iceland
Netherlands
Sweden
Top 10 economies by availability of
Internet access in household, 2002, %
None
34%
Both
fixed &
mobile
18%
Only
mobile
9%
Only
fixed
39%
Argentina, households with a telephone,
2001, %
10
WORLD TELECOMMUNICATION DEVELOPMENT REPORT 2003 EXECUTIVE SUMMARY
Internet Users
Most references to the digital divide and the information society revolve around accessto the Internet. Yet it is remarkable how little we know about the true extent of Internetaccess—particularly in developing nations. While most developed nations now haveregular Internet user surveys, in developing nations estimating users is usually a matterof guesswork, often based on a multiple of the number of subscribers. However, withno benchmark reference, differing methodologies result in widely varying estimates.
This method has also become less reliable due to the growing number of Internet cafésand Internet use in schools and universities, as well as the use of prepaid cards. In Togo,the incumbent telecommunication operator estimates the number of Internet users bysurveying Internet cafés on the number of clients they receive. The resulting figuregives Togo the highest penetration rate among West African nations, even though itsper capita income is among the lowest. The Internet user to subscriber ratio in Togoworks out as 17, more than five times the figure commonly used. Either Togo isoverestimating the number of users, or the other nations are underestimating. In anotherexample, during the late 1990s the number of Internet users in Thailand was estimatedbased on the amount of domestic and international bandwidth. A January 2001 surveyby the Thai National Statistical Office showed that there were some 3.5 million Internetusers in the country compared to an estimated 2.3 million just a few months earlier.
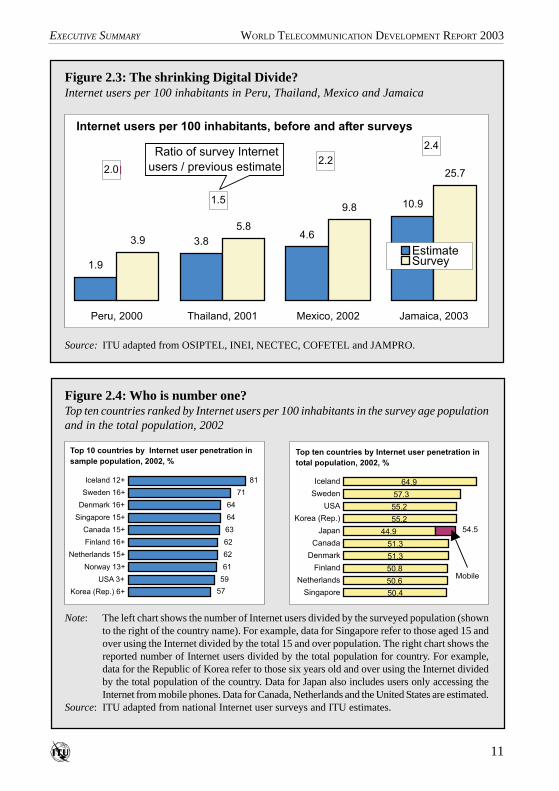
A number of other countries that have started to carry out surveys have found thatthey had hitherto been underestimating the number of people who access theInternet. An Internet survey carried out in Jamaica in January 2003, for example,found that there were almost 675’000 users in the country, more than twice thefigure suggested by previous estimates. A similar phenomenon occurred in Peru,with a November 2000 survey finding twice as many Internet users in the Capital(Lima) alone, than had been previously estimated for the entire country (Figure 2.3).Surprisingly perhaps, these findings suggest that the digital divide may not be aswide in some places as is assumed.
This evidence indicates that proper surveys are the only effective means to measure thenumber of Internet users. To that end, countries need to improve cooperation and agreeon definitions of categories of Internet user. For instance, existing surveys often usediffering age categories and frequency of individual Internet usage to define whatconstitutes an Internet user (Figure 2.4, left). Another question is whether a distinctionshould be made regarding the type of device used to access the Internet. In Japan, forexample, some ten per cent of users access the Internet using their mobile phone only(Figure 2.4, right).
11
WORLD TELECOMMUNICATION DEVELOPMENT REPORT 2003EXECUTIVE SUMMARY
Source: ITU adapted from OSIPTEL, INEI, NECTEC, COFETEL and JAMPRO.
Figure 2.3: The shrinking Digital Divide?Internet users per 100 inhabitants in Peru, Thailand, Mexico and Jamaica
Note: The left chart shows the number of Internet users divided by the surveyed population (shownto the right of the country name). For example, data for Singapore refer to those aged 15 andover using the Internet divided by the total 15 and over population. The right chart shows thereported number of Internet users divided by the total population for country. For example,data for the Republic of Korea refer to those six years old and over using the Internet dividedby the total population of the country. Data for Japan also includes users only accessing theInternet from mobile phones. Data for Canada, Netherlands and the United States are estimated.
Source: ITU adapted from national Internet user surveys and ITU estimates.
Figure 2.4: Who is number one?Top ten countries ranked by Internet users per 100 inhabitants in the survey age populationand in the total population, 2002
1.9
3.84.6
10.9
3.9
5.8
9.8
25.7
2.4
2.2
1.5
2.0
Peru, 2000 Thailand, 2001 Mexico, 2002 Jamaica, 2003
EstimateSurvey
Internet users per 100 inhabitants, before and after surveys
Ratio of survey Internet
users / previous estimate
57
59
61
62
62
63
64
64
71
81
Korea (Rep.) 6+
USA 3+
Norway 13+
Netherlands 15+
Finland 16+
Canada 15+
Singapore 15+
Denmark 16+
Sweden 16+
Iceland 12+
Top 10 countries by Internet user penetration in
sample population, 2002, %
50.4
50.6
50.8
51.3
51.3
44.9
55.2
55.2
57.3
64.9
Singapore
Netherlands
Finland
Denmark
Canada
Japan
Korea (Rep.)
USA
Sweden
Iceland
Top ten countries by Internet user penetration in
total population, 2002, %
Mobile
54.5
12
WORLD TELECOMMUNICATION DEVELOPMENT REPORT 2003 EXECUTIVE SUMMARY
Box 2.1: Community access indicators
The majority of households in developing nations do not have newer information andcommunication technologies (ICTs) such as computers and the Internet. For the immediatefuture, the citizens of most developing nations will most likely gain access to ICTs throughrelatives or friends, work, school or in public places such as Internet cafés. This observationis borne out by surveys in developing countries, which show that, for many of theirpopulations, Internet cafés are a primary location of Internet access.
This makes measuring access to community ICT facilities particularly important. In 2002,the ITU membership passed a Resolution calling on ITU to develop community accessindicators. In October 2003, the ITU Workshop on Indicators for Community Access toICTs proposed several indicators for measuring community access including: the numberof localities with public Internet access centres, and the number of users that use publicInternet access centres.
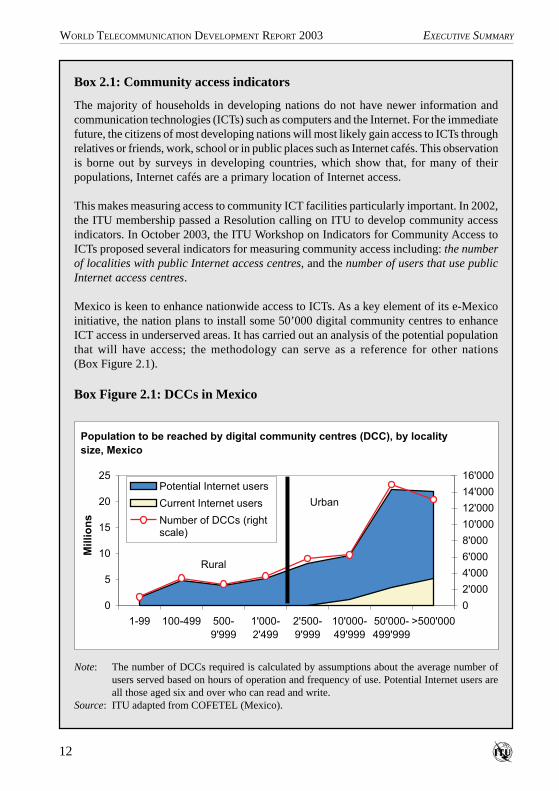
Mexico is keen to enhance nationwide access to ICTs. As a key element of its e-Mexicoinitiative, the nation plans to install some 50’000 digital community centres to enhanceICT access in underserved areas. It has carried out an analysis of the potential populationthat will have access; the methodology can serve as a reference for other nations(Box Figure 2.1).
Note: The number of DCCs required is calculated by assumptions about the average number ofusers served based on hours of operation and frequency of use. Potential Internet users areall those aged six and over who can read and write.
Source: ITU adapted from COFETEL (Mexico).
Box Figure 2.1: DCCs in Mexico
0
5
10
15
20
25
1-99 100-499 500-
9'999
1'000-
2'499
2'500-
9'999
10'000-
49'999
50'000-
499'999
>500'000
Millio
ns
0
2'000
4'000
6'000
8'000
10'000
12'000
14'000
16'000Potential Internet users
Current Internet users
Number of DCCs (rightscale)
Population to be reached by digital community centres (DCC), by locality
size, Mexico
Rural
Urban
13
WORLD TELECOMMUNICATION DEVELOPMENT REPORT 2003EXECUTIVE SUMMARY
3. ICTs in Business, Education and Government
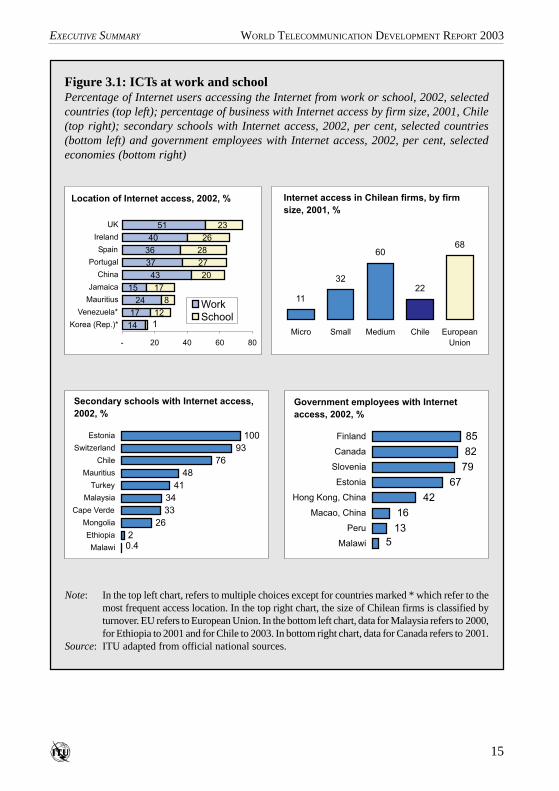
While household access to ICTs forms one part of the picture, access to ICTs in business,education and government is particularly critical for development of the informationsociety. Information technology in these sectors boosts efficiency and transparency,provides opportunities for the public and private sector and citizens to interact online,and offers access for those who do not have ICT access at home (Figure 3.1, top left).
Business use of ICTs raises productivity, helping to boost economic development. ICTinfrastructure is a fundamental prerequisite for enterprises to carry out electronictransactions. The availability of ICTs in business also has a social dimension, withmany workers developing ICT skills and obtaining access to the Internet through theirworkplace, which they can then use in other areas.
The best approach for collecting data on business usage involves surveying arepresentative sample of enterprises. Much of the work carried out in the domain ofICTs in the business sector has taken place in developed nations, including the designof model questionnaires to enhance international comparability. However, there arestill some discrepancies between different surveys concerning the categories of companysize that are used.
By contrast, few developing nations have carried out official surveys, although a numberof specialized surveys have been carried out in these countries—particularly for smalland medium sized enterprises. The available data suggest that the business digital divideis not so much between countries, but between different sizes of companies (Figure 3.1,top right).
Though a wide variety of indicators can be applied to measure business ICT penetration,a minimum set of indicators should ideally include the percentage of businesses withpersonal computers, percentage of businesses with Internet access and percentage ofbusiness with a website.
Education is a key component of a country’s transformation towards actively and fullyparticipating in the global information society. Surveys confirm that educationalinstitutions can have an important role as Internet access locations. Research also seemsto indicate that connecting schools and bringing students online in developing countriesmay have a major impact on raising the number of ICT users.
Unlike the business sector, the educational sector is generally centralized, which hasthe advantage that it is not always necessary to carry out surveys. The easiest way tocollect statistics is through the existing channels between Ministries of Education and
14
WORLD TELECOMMUNICATION DEVELOPMENT REPORT 2003 EXECUTIVE SUMMARY
the schools. Similarly to the business sector, developed countries have been at theforefront of collecting ICT statistics in the educational domain. The data collected isextensive, often reflecting qualitative as well as quantitative differences in infrastructureand use.
An overview of the existing data in developed and particularly in developing countrieshighlights the need to agree on a limited number of indicators that can both reflectglobal developments and include as many countries as possible. The two indicators thatare the most appropriate are the student to computer ratio, as well as the percentage ofschools connected to the Internet (Figure 3.1, bottom left). A common methodologyand categorization of data are needed for international comparability, including areflection of the policy of some countries in creating “magnet” ICT schools. An overallaverage may not reflect progress made, whereas a breakdown by percentiles of schoolsand into primary, secondary and tertiary schools, would.
As shown in numerous country examples, expanding ICT use in government has amajor impact on enhancing efficiency, accountability and transparency of processes inthe public domain. But the ability to provide electronic government services dependson the level of ICT adoption. The availability of ICTs in public administration also hassocial implications, since government workers can develop ICT skills and access theInternet from the workplace.
Although the importance of government ICT indicators is not disputed, harmonizedstatistics are nevertheless difficult to obtain. This is because of the complexity of definingthe unit of measurement. Government agencies include federal, regional and localentities, and the mix of these varies from country to country depending on the type ofadministration. In addition, very few developing countries compile statistics on ICTuse in government.
Government ICT penetration can be measured by a wide number of variables, but auseful basis would be to include indicators on the percentage of government officesconnected to the Internet, percentage of government offices with a website and percentageof government employees who use the Internet in their job (Figure 3.1, bottom right).
15
WORLD TELECOMMUNICATION DEVELOPMENT REPORT 2003EXECUTIVE SUMMARY
Figure 3.1: ICTs at work and schoolPercentage of Internet users accessing the Internet from work or school, 2002, selectedcountries (top left); percentage of business with Internet access by firm size, 2001, Chile(top right); secondary schools with Internet access, 2002, per cent, selected countries(bottom left) and government employees with Internet access, 2002, per cent, selectedeconomies (bottom right)
Note: In the top left chart, refers to multiple choices except for countries marked * which refer to themost frequent access location. In the top right chart, the size of Chilean firms is classified byturnover. EU refers to European Union. In the bottom left chart, data for Malaysia refers to 2000,for Ethiopia to 2001 and for Chile to 2003. In bottom right chart, data for Canada refers to 2001.
Source: ITU adapted from official national sources.
14
17
24
15
43
37
36
40
51
12
8
17
20
27
28
26
23
1
- 20 40 60 80
Korea (Rep.)*
Venezuela*
Mauritius
Jamaica
China
Portugal
Spain
Ireland
UK
Work
School
Location of Internet access, 2002, %
11
32
60
22
68
Micro Small Medium Chile European
Union
Internet access in Chilean firms, by firm
size, 2001, %
2
26
33
34
41
48
76
93
100
0.4Malawi
Ethiopia
Mongolia
Cape Verde
Malaysia
Turkey
Mauritius
Chile
Switzerland
Estonia
Secondary schools with Internet access,
2002, %
5
13
16
42
67
79
82
85
Malawi
Peru
Macao, China
Hong Kong, China
Estonia
Slovenia
Canada
Finland
Government employees with Internet
access, 2002, %
16
WORLD TELECOMMUNICATION DEVELOPMENT REPORT 2003 EXECUTIVE SUMMARY
4. ICTs and the Millennium Development Goals
A turn of the century is often marked by reflection on the past and fresh aspirations fora better future. One way this has been addressed at the global level is through theMillennium Declaration, adopted by 189 Member States of the United Nations at itsfifty-fifth General Assembly in September 2000.
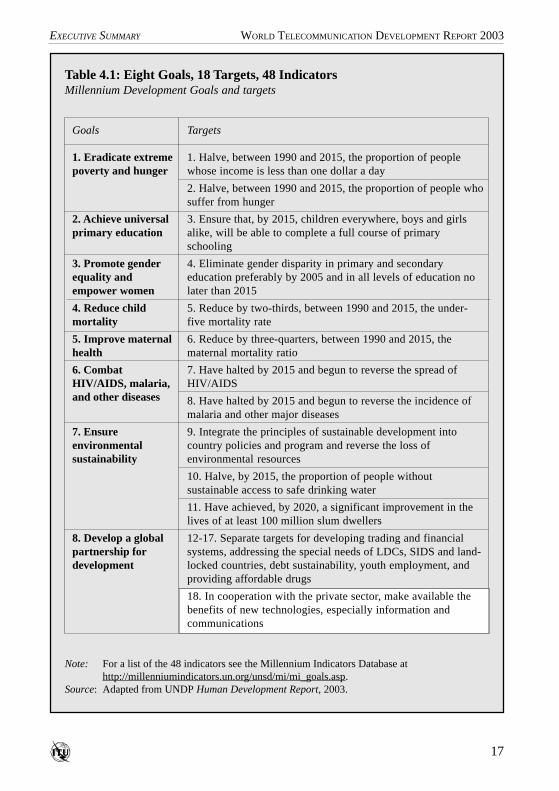
As one of the eight Millennium Development Goals (MDG), the Declaration makes acommitment that the number of people who live on less than one dollar a day should behalved by the year 2015. The goals outline specific areas for achieving improvement inpeople’s lives including in the areas of poverty reduction, education, gender, health andthe environment. The last goal, developing a global partnership for development,proposes a means of achieving the first seven. Attached to the eight goals are 18 specifictargets for achieving the MDGs (Table 4.1). A formal process for the systematic trackingand reviewing of progress on the path to achieving the MDGs is also foreseen. Thismonitoring activity aims to turn the goals and targets into widely recognized measuresof international cooperation. Monitoring is based on 48 indicators formulated to measurethe targets.
Significantly for the work of ITU, and for this report, the Millennium Declarationacknowledges that ICTs are an important tool to achieve its overall goals. ICTs canhelp alleviate poverty, improve the delivery of education and health care, makegovernments more accessible and accountable to the people, and much more. Target 18of Goal 8 calls upon the Declaration’s adherents to: “In cooperation with the privatesector make available the benefits of new technologies, specifically information andcommunications.”
Three indicators were chosen to measure ICT availability in countries. These indicatorsare the total number of telephone subscribers per 100 inhabitants, personal computersper 100 inhabitants and Internet users per 100 inhabitants. They were selected becausethey are widely available, and cover many years and most countries.
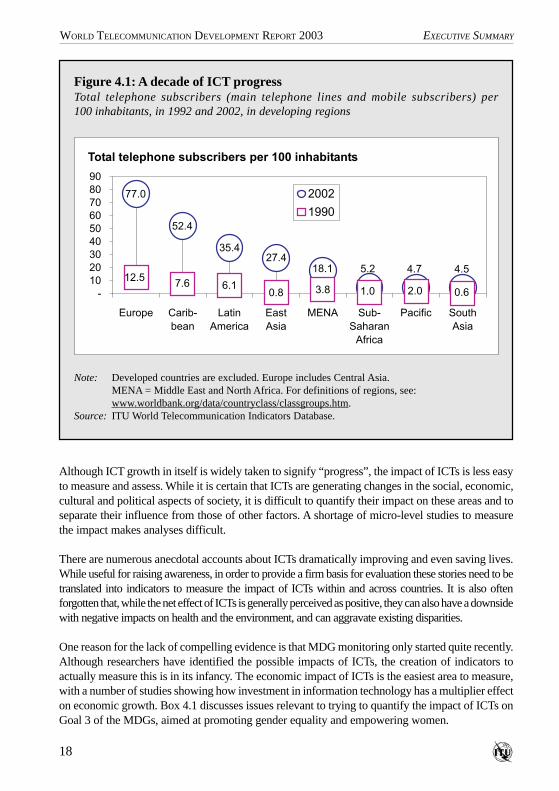
Of all the different MDG targets, number 18 is the most open-ended (raising the questionsof which ICTs should be made available, to whom and by when), but it is also the onewhere the most progress was made during the 1990s. All of the developing sub-regionsof the world have grown their fixed and mobile telephone networks (total teledensity)to a greater extent since 1990 than in the entire period before that date (Figure 4.1). Inthe exceptional case of East Asia (which includes China), the level of total teledensityin 2002 was more than 35 times higher than ten years earlier, and in all cases, except thedeveloping Pacific nations, total teledensity was at least five times higher in 2002 thanit was in 1992.
17
WORLD TELECOMMUNICATION DEVELOPMENT REPORT 2003EXECUTIVE SUMMARY
Table 4.1: Eight Goals, 18 Targets, 48 IndicatorsMillennium Development Goals and targets
Note: For a list of the 48 indicators see the Millennium Indicators Database athttp://millenniumindicators.un.org/unsd/mi/mi_goals.asp.
Source: Adapted from UNDP Human Development Report, 2003.
Goals
1. Eradicate extremepoverty and hunger
2. Achieve universalprimary education
3. Promote genderequality andempower women
4. Reduce childmortality
5. Improve maternalhealth
6. CombatHIV/AIDS, malaria,and other diseases
7. Ensureenvironmentalsustainability
8. Develop a globalpartnership fordevelopment
Targets
1. Halve, between 1990 and 2015, the proportion of peoplewhose income is less than one dollar a day
2. Halve, between 1990 and 2015, the proportion of people whosuffer from hunger
3. Ensure that, by 2015, children everywhere, boys and girlsalike, will be able to complete a full course of primaryschooling
4. Eliminate gender disparity in primary and secondaryeducation preferably by 2005 and in all levels of education nolater than 2015
5. Reduce by two-thirds, between 1990 and 2015, the under-five mortality rate
6. Reduce by three-quarters, between 1990 and 2015, thematernal mortality ratio
7. Have halted by 2015 and begun to reverse the spread ofHIV/AIDS
8. Have halted by 2015 and begun to reverse the incidence ofmalaria and other major diseases
9. Integrate the principles of sustainable development intocountry policies and program and reverse the loss ofenvironmental resources
10. Halve, by 2015, the proportion of people withoutsustainable access to safe drinking water
11. Have achieved, by 2020, a significant improvement in thelives of at least 100 million slum dwellers
12-17. Separate targets for developing trading and financialsystems, addressing the special needs of LDCs, SIDS and land-locked countries, debt sustainability, youth employment, andproviding affordable drugs
18. In cooperation with the private sector, make available thebenefits of new technologies, especially information andcommunications
18
WORLD TELECOMMUNICATION DEVELOPMENT REPORT 2003 EXECUTIVE SUMMARY
Although ICT growth in itself is widely taken to signify “progress”, the impact of ICTs is less easyto measure and assess. While it is certain that ICTs are generating changes in the social, economic,cultural and political aspects of society, it is difficult to quantify their impact on these areas and toseparate their influence from those of other factors. A shortage of micro-level studies to measurethe impact makes analyses difficult.
There are numerous anecdotal accounts about ICTs dramatically improving and even saving lives.While useful for raising awareness, in order to provide a firm basis for evaluation these stories need to betranslated into indicators to measure the impact of ICTs within and across countries. It is also oftenforgotten that, while the net effect of ICTs is generally perceived as positive, they can also have a downsidewith negative impacts on health and the environment, and can aggravate existing disparities.
One reason for the lack of compelling evidence is that MDG monitoring only started quite recently.Although researchers have identified the possible impacts of ICTs, the creation of indicators toactually measure this is in its infancy. The economic impact of ICTs is the easiest area to measure,with a number of studies showing how investment in information technology has a multiplier effecton economic growth. Box 4.1 discusses issues relevant to trying to quantify the impact of ICTs onGoal 3 of the MDGs, aimed at promoting gender equality and empowering women.
Figure 4.1: A decade of ICT progressTotal telephone subscribers (main telephone lines and mobile subscribers) per100 inhabitants, in 1992 and 2002, in developing regions
Note: Developed countries are excluded. Europe includes Central Asia.MENA = Middle East and North Africa. For definitions of regions, see:www.worldbank.org/data/countryclass/classgroups.htm.
Source: ITU World Telecommunication Indicators Database.
27.435.4
52.4
77.0
18.1 5.2 4.54.7
0.62.03.86.17.61.00.8
12.5
-
10
20
30
40
50
60
70
80
90
Europe Carib-
bean
Latin
America
East
Asia
MENA Sub-
Saharan
Africa
Pacific South
Asia
2002
1990
Total telephone subscribers per 100 inhabitants
19
WORLD TELECOMMUNICATION DEVELOPMENT REPORT 2003EXECUTIVE SUMMARY
Box 4.1: ICTs and gender
There are two dimensions to the impact of information and communication technologies (ICTs)on gender. One is the gender composition of ICT access. The other is the influence that ICTs canhave on reducing gender inequality.
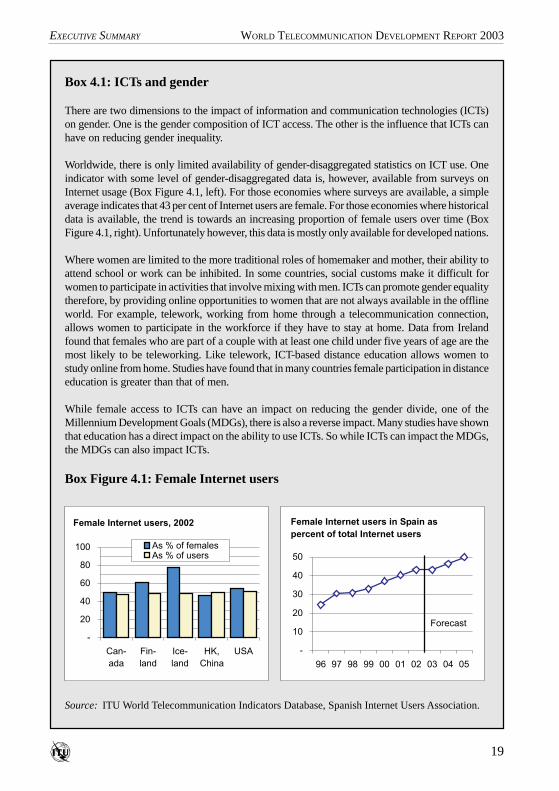
Worldwide, there is only limited availability of gender-disaggregated statistics on ICT use. Oneindicator with some level of gender-disaggregated data is, however, available from surveys onInternet usage (Box Figure 4.1, left). For those economies where surveys are available, a simpleaverage indicates that 43 per cent of Internet users are female. For those economies where historicaldata is available, the trend is towards an increasing proportion of female users over time (BoxFigure 4.1, right). Unfortunately however, this data is mostly only available for developed nations.
Where women are limited to the more traditional roles of homemaker and mother, their ability toattend school or work can be inhibited. In some countries, social customs make it difficult forwomen to participate in activities that involve mixing with men. ICTs can promote gender equalitytherefore, by providing online opportunities to women that are not always available in the offlineworld. For example, telework, working from home through a telecommunication connection,allows women to participate in the workforce if they have to stay at home. Data from Irelandfound that females who are part of a couple with at least one child under five years of age are themost likely to be teleworking. Like telework, ICT-based distance education allows women tostudy online from home. Studies have found that in many countries female participation in distanceeducation is greater than that of men.
While female access to ICTs can have an impact on reducing the gender divide, one of theMillennium Development Goals (MDGs), there is also a reverse impact. Many studies have shownthat education has a direct impact on the ability to use ICTs. So while ICTs can impact the MDGs,the MDGs can also impact ICTs.
Source: ITU World Telecommunication Indicators Database, Spanish Internet Users Association.
Box Figure 4.1: Female Internet users
-
20
40
60
80
100
Can-
ada
Fin-
land
Ice-
land
HK,
China
USA
As % of femalesAs % of users
Female Internet users, 2002
-
10
20
30
40
50
96 97 98 99 00 01 02 03 04 05
Female Internet users in Spain as
percent of total Internet users
Forecast
20
WORLD TELECOMMUNICATION DEVELOPMENT REPORT 2003 EXECUTIVE SUMMARY
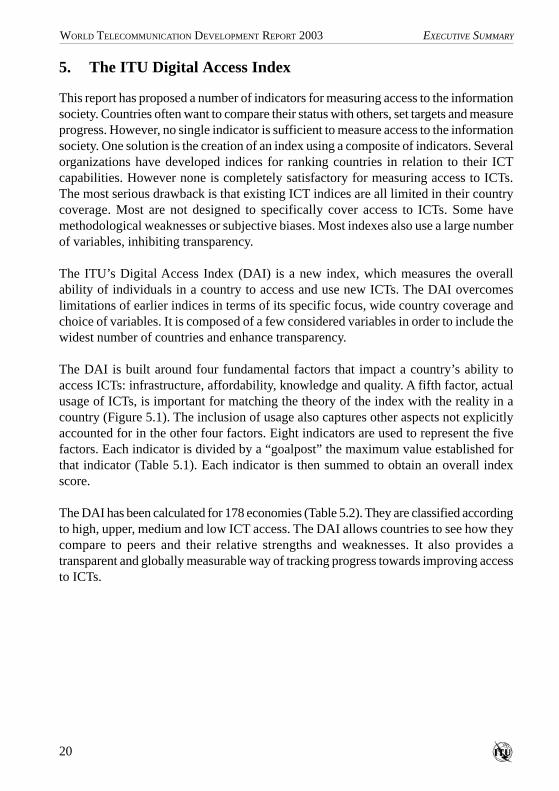
5. The ITU Digital Access Index
This report has proposed a number of indicators for measuring access to the informationsociety. Countries often want to compare their status with others, set targets and measureprogress. However, no single indicator is sufficient to measure access to the informationsociety. One solution is the creation of an index using a composite of indicators. Severalorganizations have developed indices for ranking countries in relation to their ICTcapabilities. However none is completely satisfactory for measuring access to ICTs.The most serious drawback is that existing ICT indices are all limited in their countrycoverage. Most are not designed to specifically cover access to ICTs. Some havemethodological weaknesses or subjective biases. Most indexes also use a large numberof variables, inhibiting transparency.
The ITU’s Digital Access Index (DAI) is a new index, which measures the overallability of individuals in a country to access and use new ICTs. The DAI overcomeslimitations of earlier indices in terms of its specific focus, wide country coverage andchoice of variables. It is composed of a few considered variables in order to include thewidest number of countries and enhance transparency.
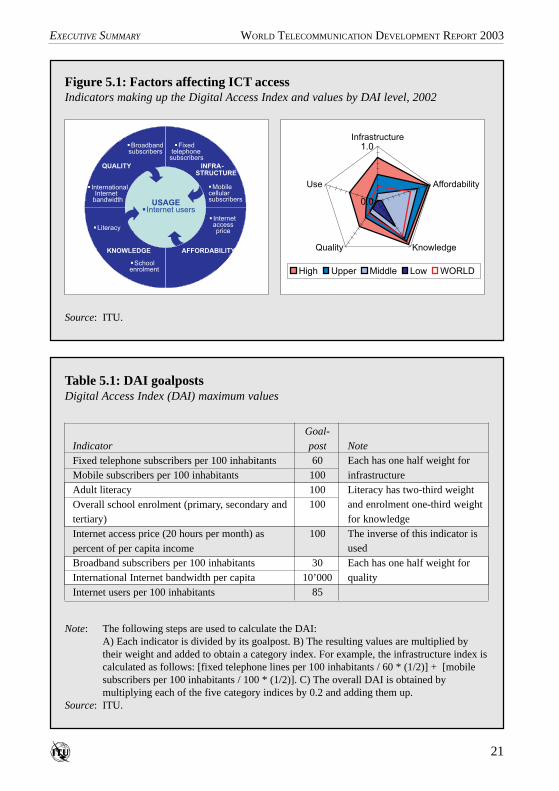
The DAI is built around four fundamental factors that impact a country’s ability toaccess ICTs: infrastructure, affordability, knowledge and quality. A fifth factor, actualusage of ICTs, is important for matching the theory of the index with the reality in acountry (Figure 5.1). The inclusion of usage also captures other aspects not explicitlyaccounted for in the other four factors. Eight indicators are used to represent the fivefactors. Each indicator is divided by a “goalpost” the maximum value established forthat indicator (Table 5.1). Each indicator is then summed to obtain an overall indexscore.
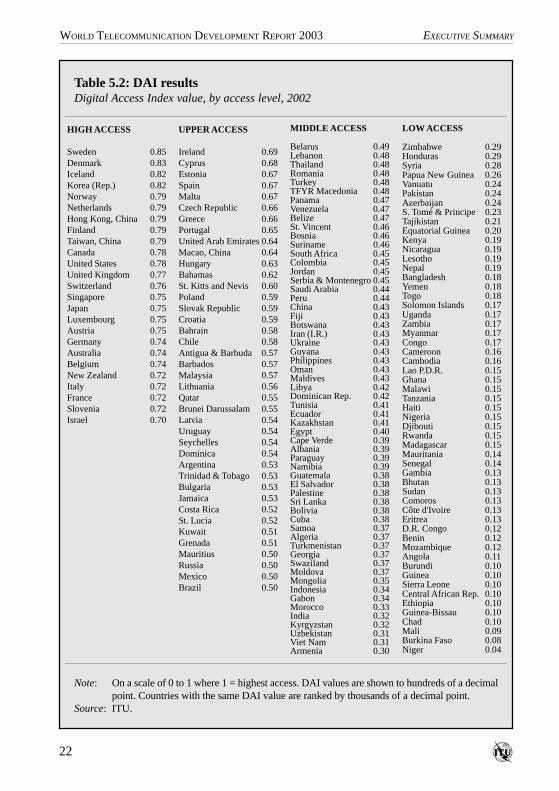
The DAI has been calculated for 178 economies (Table 5.2). They are classified accordingto high, upper, medium and low ICT access. The DAI allows countries to see how theycompare to peers and their relative strengths and weaknesses. It also provides atransparent and globally measurable way of tracking progress towards improving accessto ICTs.
21
WORLD TELECOMMUNICATION DEVELOPMENT REPORT 2003EXECUTIVE SUMMARY
Source: ITU.
Figure 5.1: Factors affecting ICT accessIndicators making up the Digital Access Index and values by DAI level, 2002
USAGE
� Internet users
INFRA-
STRUCTURE
AFFORDABILITYKNOWLEDGE
QUALITY
� Fixed
telephone
subscribers
� Mobile
cellular
subscribers
� Literacy
� School
enrolment
� Broadband
subscribers
� International
Internet
bandwidth
�Internet
access
price
USAGE�Internet users
INFRA-STRUCTURE
AFFORDABILITYKNOWLEDGE
QUALITY
�Fixedtelephone
subscribers
�Mobilecellularsubscribers
�Literacy
�Schoolenrolment
�Broadbandsubscribers
� InternationalInternet
bandwidth
� Internetaccessprice
0.0
1.0Infrastructure
Affordability
KnowledgeQuality
Use
High Upper Middle Low WORLD
Note: The following steps are used to calculate the DAI:A) Each indicator is divided by its goalpost. B) The resulting values are multiplied bytheir weight and added to obtain a category index. For example, the infrastructure index iscalculated as follows: [fixed telephone lines per 100 inhabitants / 60 * (1/2)] + [mobilesubscribers per 100 inhabitants / 100 * (1/2)]. C) The overall DAI is obtained bymultiplying each of the five category indices by 0.2 and adding them up.
Source: ITU.
Table 5.1: DAI goalpostsDigital Access Index (DAI) maximum values
Indicator
Fixed telephone subscribers per 100 inhabitantsMobile subscribers per 100 inhabitantsAdult literacyOverall school enrolment (primary, secondary andtertiary)Internet access price (20 hours per month) aspercent of per capita incomeBroadband subscribers per 100 inhabitantsInternational Internet bandwidth per capitaInternet users per 100 inhabitants
Goal-
post60
100100100
100
3010’000
85
NoteEach has one half weight forinfrastructureLiteracy has two-third weightand enrolment one-third weightfor knowledgeThe inverse of this indicator isusedEach has one half weight forquality
22
WORLD TELECOMMUNICATION DEVELOPMENT REPORT 2003 EXECUTIVE SUMMARY
Note: On a scale of 0 to 1 where 1 = highest access. DAI values are shown to hundreds of a decimalpoint. Countries with the same DAI value are ranked by thousands of a decimal point.
Source: ITU.
Table 5.2: DAI resultsDigital Access Index value, by access level, 2002
HIGH ACCESS
Sweden 0.85Denmark 0.83Iceland 0.82Korea (Rep.) 0.82Norway 0.79Netherlands 0.79Hong Kong, China 0.79Finland 0.79Taiwan, China 0.79Canada 0.78United States 0.78United Kingdom 0.77Switzerland 0.76Singapore 0.75Japan 0.75Luxembourg 0.75Austria 0.75Germany 0.74Australia 0.74Belgium 0.74New Zealand 0.72Italy 0.72France 0.72Slovenia 0.72Israel 0.70
UPPER ACCESS
Ireland 0.69Cyprus 0.68Estonia 0.67Spain 0.67Malta 0.67Czech Republic 0.66Greece 0.66Portugal 0.65United Arab Emirates 0.64Macao, China 0.64Hungary 0.63Bahamas 0.62St. Kitts and Nevis 0.60Poland 0.59Slovak Republic 0.59Croatia 0.59Bahrain 0.58Chile 0.58Antigua & Barbuda 0.57Barbados 0.57Malaysia 0.57Lithuania 0.56Qatar 0.55Brunei Darussalam 0.55Latvia 0.54Uruguay 0.54Seychelles 0.54Dominica 0.54Argentina 0.53Trinidad & Tobago 0.53Bulgaria 0.53Jamaica 0.53Costa Rica 0.52St. Lucia 0.52Kuwait 0.51Grenada 0.51Mauritius 0.50Russia 0.50Mexico 0.50Brazil 0.50
MIDDLE ACCESS
Belarus 0.49Lebanon 0.48Thailand 0.48Romania 0.48Turkey 0.48TFYR Macedonia 0.48Panama 0.47Venezuela 0.47Belize 0.47St. Vincent 0.46Bosnia 0.46Suriname 0.46South Africa 0.45Colombia 0.45Jordan 0.45Serbia & Montenegro 0.45Saudi Arabia 0.44Peru 0.44China 0.43Fiji 0.43Botswana 0.43Iran (I.R.) 0.43Ukraine 0.43Guyana 0.43Philippines 0.43Oman 0.43Maldives 0.43Libya 0.42Dominican Rep. 0.42Tunisia 0.41Ecuador 0.41Kazakhstan 0.41Egypt 0.40Cape Verde 0.39Albania 0.39Paraguay 0.39Namibia 0.39Guatemala 0.38El Salvador 0.38Palestine 0.38Sri Lanka 0.38Bolivia 0.38Cuba 0.38Samoa 0.37Algeria 0.37Turkmenistan 0.37Georgia 0.37Swaziland 0.37Moldova 0.37Mongolia 0.35Indonesia 0.34Gabon 0.34Morocco 0.33India 0.32Kyrgyzstan 0.32Uzbekistan 0.31Viet Nam 0.31Armenia 0.30
LOW ACCESS
Zimbabwe 0.29Honduras 0.29Syria 0.28Papua New Guinea 0.26Vanuatu 0.24Pakistan 0.24Azerbaijan 0.24S. Tomé & Principe 0.23Tajikistan 0.21Equatorial Guinea 0.20Kenya 0.19Nicaragua 0.19Lesotho 0.19Nepal 0.19Bangladesh 0.18Yemen 0.18Togo 0.18Solomon Islands 0.17Uganda 0.17Zambia 0.17Myanmar 0.17Congo 0.17Cameroon 0.16Cambodia 0.16Lao P.D.R. 0.15Ghana 0.15Malawi 0.15Tanzania 0.15Haiti 0.15Nigeria 0.15Djibouti 0.15Rwanda 0.15Madagascar 0.15Mauritania 0.14Senegal 0.14Gambia 0.13Bhutan 0.13Sudan 0.13Comoros 0.13Côte d'Ivoire 0.13Eritrea 0.13D.R. Congo 0.12Benin 0.12Mozambique 0.12Angola 0.11Burundi 0.10Guinea 0.10Sierra Leone 0.10Central African Rep. 0.10Ethiopia 0.10Guinea-Bissau 0.10Chad 0.10Mali 0.09Burkina Faso 0.08Niger 0.04
23
WORLD TELECOMMUNICATION DEVELOPMENT REPORT 2003EXECUTIVE SUMMARY
6. Conclusions
The world is still a long way from agreeing upon a common set of information societyaccess indicators with extensive and detailed coverage. In cases where data do exist, theyare sometimes unreliable, incomplete, out of date or not internationally comparable. Theyare also often difficult to locate and compile. The problem is particularly acute for developingnations, some of which lack the technical expertise or resources to collect, compile anddisseminate ICT statistics.
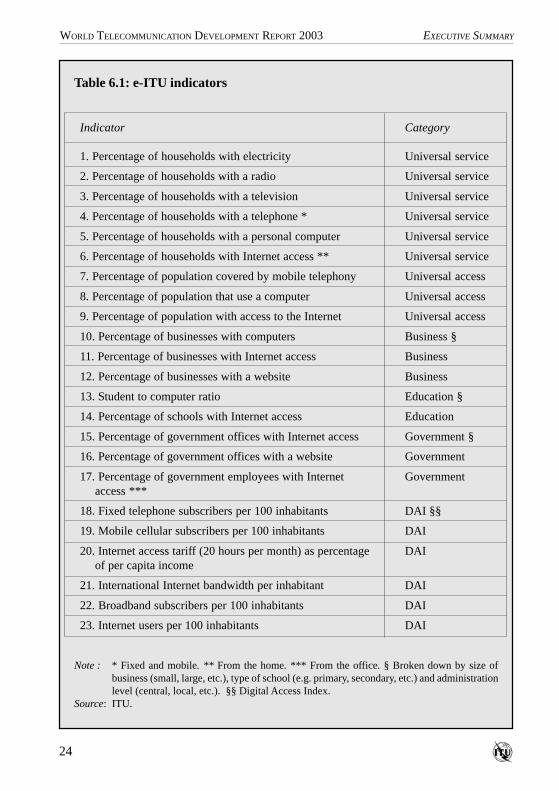
In an effort to standardize a minimum set of information society access indicators thatevery country should collect, ITU proposes its basket of e-ITU indicators (Table 6.1). Inaddition, the following recommendations are made to improve the collection of the requiredindicators and enhance international comparability:
• Model surveys exist for collecting data on business and individual and household use ofICTs. These should be followed to enhance international comparability. In cases wherehousehold or business surveys are already conducted by national statistical offices,efforts should be made to include ICT access questions.
• Developed nations and multilateral agencies should assist developing nations to compileICT indicators by providing technical assistance and material resources. Developingeconomies that have already conducted ICT surveys could assist other countries withmethods and questionnaire construction. International assistance should be provided toget more national statistical offices online.
• ICT policy-makers should liaise with their statistical offices to ensure the required dataare collected—preferably through purpose-built surveys. There is also a need to makeavailable data more visible. Countries should identify a prominent website location forinformation society statistics. At the international level, a portal for information societyindicators could be created, containing links to national statistics as well as modelquestionnaires and other methodological information.
• Good statistical practice is important; transparency, clarity, timeliness and relevance arecritical. Some countries provide regional breakdowns but do not provide a countrytotal, and sometimes dates to which the data pertain are not clear. Terms such as access,subscriber and user are often loosely employed though they mean different things. Surveysshould be conducted on a regular basis, and at least annually.
A partnership between international organizations, national statistical agencies and ICTpolicy-makers can help achieve the objective of a core set of information society accessindicators for a large number of countries. The second phase of the World Summit on theInformation Society (WSIS), scheduled to take place in Tunis, Tunisia, in 2005, is aparticularly appropriate deadline for this. If this can be achieved, the world will have takena giant step towards better measuring and understanding the information society.
24
WORLD TELECOMMUNICATION DEVELOPMENT REPORT 2003 EXECUTIVE SUMMARY
Note : * Fixed and mobile. ** From the home. *** From the office. § Broken down by size ofbusiness (small, large, etc.), type of school (e.g. primary, secondary, etc.) and administrationlevel (central, local, etc.). §§ Digital Access Index.
Source: ITU.
Table 6.1: e-ITU indicators
Indicator
1. Percentage of households with electricity
2. Percentage of households with a radio
3. Percentage of households with a television
4. Percentage of households with a telephone *
5. Percentage of households with a personal computer
6. Percentage of households with Internet access **
7. Percentage of population covered by mobile telephony
8. Percentage of population that use a computer
9. Percentage of population with access to the Internet
10. Percentage of businesses with computers
11. Percentage of businesses with Internet access
12. Percentage of businesses with a website
13. Student to computer ratio
14. Percentage of schools with Internet access
15. Percentage of government offices with Internet access
16. Percentage of government offices with a website
17. Percentage of government employees with Internetaccess ***
18. Fixed telephone subscribers per 100 inhabitants
19. Mobile cellular subscribers per 100 inhabitants
20. Internet access tariff (20 hours per month) as percentageof per capita income
21. International Internet bandwidth per inhabitant
22. Broadband subscribers per 100 inhabitants
23. Internet users per 100 inhabitants
Category
Universal service
Universal service
Universal service
Universal service
Universal service
Universal service
Universal access
Universal access
Universal access
Business §
Business
Business
Education §
Education
Government §
Government
Government
DAI §§
DAI
DAI
DAI
DAI
DAI
25
WORLD TELECOMMUNICATION DEVELOPMENT REPORT 2003EXECUTIVE SUMMARY
Box 6.1: Sources and analysis of ICT data
ITU is endeavouring to enhance ICT analysis by expanding from compiling indicatorsfrom administrative records to include survey data also. One problem has been thattraditional data correspondents, usually the telecom regulators, often have scarce contactwith national statistical offices. ITU has therefore carried out new work by locating andanalysing census and household surveys.
National statistical offices that have websites have provided a useful starting point. Someprovide the results of surveys online, including data on ICTs when available. However,where online data are lacking or difficult to locate, gathering such information is difficult.
One solution to finding official data is the use of regional reports. In Europe, governmentalICT statistical publications are available for the Baltic and Nordic countries. The EuropeanUnion, for example, disseminates some ICT data on its existing and prospective members.The Organisation for Economic Co-operation and Development (OECD) also publisheshousehold ICT data for its member countries.
Another solution is the use of websites featuring electronic libraries of household surveys,or that compile data from these. The World Bank’s Africa Household Survey Databankfor example, has electronic versions of census and survey documents for countries in thatregion, many of which do not have individual websites. The Demographic and HealthSurveys website provides data for many developing countries on households withtelevision, radio and telephone that have likewise been culled from official statistics.
While few countries are able to provide a complete set of ICT indicators, even feweranalyse available data in any detail. There are however some exceptions, where either thenational statistical office or the government agency responsible for ICTs publishes reportsanalysing the data. In Latin America for instance, both Chile and Peru have compiled in-depth reports on the use of ICTs in their countries. In East Asia, the Republic of Koreaproduces what is perhaps the most comprehensive analysis of computer and Internet useanywhere, covered in a number of government publications. Hong Kong, China andSingapore produce analytical reports on the use of ICTs in households. In Africa and theMiddle East however, there are few ICT surveys let alone in-depth analysis of access.One notable exception is Mauritius, which publishes surveys on household ICTs.
While many nations are becoming increasingly aware about the importance of access toICTs, very few developing country governments actually compile and analyse the dataneeded to assess and improve the situation. As long as this situation persists, so too willthe digital divide, since meaningful policies for enhancing access to ICTs cannot bedesigned without detailed statistics. Alternatively, we may be bridging the divide withoutknowing about it!
26
WORLD TELECOMMUNICATION DEVELOPMENT REPORT 2003 EXECUTIVE SUMMARY
World Telecommunication Development Report 2003Access Indicators for the Information Society
Date of publication: December 2003Paper format: A4 (21 x 29.7 cm)Length: 100 text, 80 pages statistical tablesElectronic format: Adobe AcrobatTM PDFLanguage: Separate editions (English, French, Spanish)Article number: English: 24174; French: 24175; Spanish: 24176ISBN : English: 92-61-10541-6; French: 92-61-10542-4;
Spanish: 92-61-10543-2
Price, Swiss francs (CHF)Catalogue price 100.-Member States and Sector Members -15%Least Developed Countries -80%
The report can be purchased and downloaded from ITU’s electronic bookshop at:www.itu.int/ict.
Please contact ITU Sales and Marketing Division for any further informationconcerning prices, availability, or purchase:
Telephone: +41 22 730 61 41Fax: +41 22 730 51 94E-mail: [email protected]
Methods of payment
All publications ordered from ITU must be paid in advance. Payments can be made:a) by credit card: American Express, Eurocard/Mastercard, Visa;b) by bank transfer to the UBS SA, Geneva, Account ITU GenevaNo. CH 96 0024 0240 C876 5565 0;c) by cheque made payable to ITU;d) by international postal order;e) to the ITU postal cheque account: ITU, Geneva, 12-50-3 (from within Switzerland);f) or by UNESCO coupon.
Payments normally should be made in Swiss francs (CHF). Payments may also be madein other currencies, freely convertible into CHF, provided that, when converted by thebank, the price of the service in CHF is covered. ITU does not accept letters of credit.
27
WORLD TELECOMMUNICATION DEVELOPMENT REPORT 2003EXECUTIVE SUMMARY
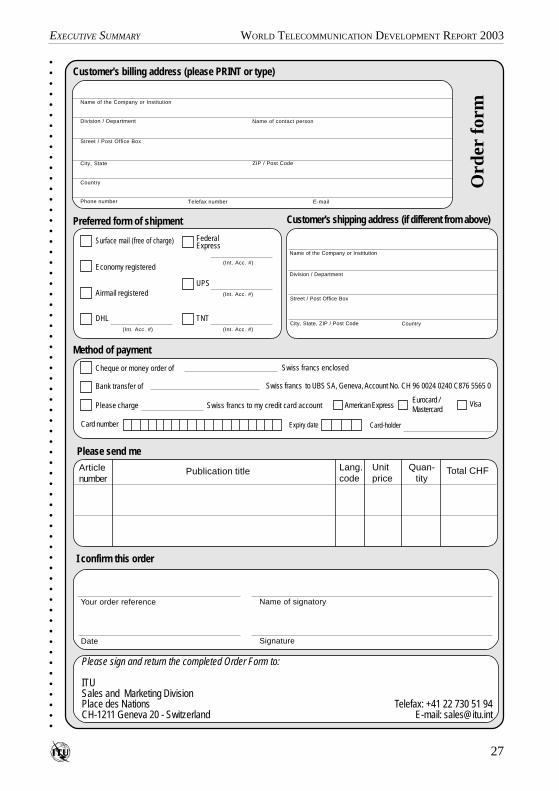
Ord
er f
orm
Customer's billing address (please PRINT or type)
Name of the Company or Institution
Division / Department Name of contact person
Preferred form of shipment Customer's shipping address (if different from above)
Street / Post Office Box
City, State
Country
Phone number Telefax number E-mail
ZIP / Post Code
Surface mail (free of charge)
Economy registered
Airmail registered
FederalExpress
(Int. Acc. #)
Method of payment
Please send me
Cheque or money order of Swiss francs enclosed
Bank transfer of Swiss francs to UBS SA, Geneva, Account No. CH 96 0024 0240 C876 5565 0
Please charge Swiss francs to my credit card accountEurocard /Mastercard
Visa
Card number Expiry date Card-holder
I confirm this order
Your order reference
Division / Department
Street / Post Office Box
City, State, ZIP / Post Code Country
Articlenumber
Publication title Lang.code
Unitprice
Quan-tity
Total CHF
American Express
Date
Name of signatory
Signature
Name of the Company or Institution
○
○
○
○
○
○
○
○
○
○
○
○
○
○
○
○
○
○
○
○
○
○
○
○
○
○
○
○
○
○
○
○
○
○
○
○
○
○
○
○
○
○
○
○
○
○
○
○
○
○
○
○
○
○
○
○
○
○
○
○
○
○
○
○
DHL(Int. Acc. #)
TNT
(Int. Acc. #)
UPS
(Int. Acc. #)
Please sign and return the completed Order Form to:
ITUSales and Marketing DivisionPlace des Nations Telefax: +41 22 730 51 94CH-1211 Geneva 20 - Switzerland E-mail: [email protected]