World Soil Resources Reports 65 - FAO
119
World Soil Resources Reports 65 EIGHTH MEETING OF THE EAST AND SOUTHERN AFRICAN SUB-COMMITTEE FOR SOIL CORRELATION AND LAND EVALUATION Harare, Zimbabwe, 9-13 October 1989 Ay AF Ö UlE-Mlier lands OD AND AGRICULTURE ORGANIZATION OF THE UNITED NATIONS
Transcript of World Soil Resources Reports 65 - FAO
World Soil Resources Reports 65
EIGHTH MEETING OF THE EAST AND SOUTHERN AFRICAN SUB-COMMITTEE
FOR SOIL CORRELATION AND LAND EVALUATION
Harare, Zimbabwe, 9-13 October 1989
Ay
AF Ö
UlE-Mlier lands
OD AND AGRICULTURE ORGANIZATION OF THE UNITED NATIONS
!3
9 ' ISRIO LIBRARY
)CT ^ ^ \ \
V/Ctoonlngon, Thn Nnthcrlnnds
EIGHTH MEETING
OF THE
EAST AND SOUTHERN AFRICAN SUB-COMMITTEE
FOR
SOIL CORRELATION AND LAND EVALUATION
Harare, Zimbabwe
9-13 October 1989
Scanned from original by ISRIC - World Soil Information, as ICSU World Data Centre for Soils. The purpose is to mal<e a safe depository for endangered documents and to make tl ie accrued information available for consultation, following Fair Use Guidelines. Ever/ effort is taken to respect Copyright of the materials within the archives where the identification of the Copyright holder is clear and, where feasible, to contact the originators. For questions please contact soil.isric(a)wur.n.l indicating the item reference number concerned.
FOOD AND AGRICULTURE ORGANIZATION OF THE UNITED NATIONS Rome 1990
n^cji
The designations employed and the presentation of material in this publication do not imply the expression of any opinion whatsoever on the part of the Food and Agriculture Organization of the United Nations conceming the legal status of any country, territory, city or area or of its authorities, or concerning the delimitation of Its frontiers or boundaries.
M-53 ISBN 92-5-102993-8
All rights reserved. No part of this publication may be reproduced, stored In a retrieval system, or transmitted In any form or by any means, electronic, mechanical, photocopying or otherwise, without the prior permission of the copyright owner. Applications for such permission, with a statement of the purpose and extent of the reproduction, should be addressed to the Director, Publications Division, Food and Agriculture Organization of the United Nations, Via delle Terme dl Caracalla, 00100 Rome, Italy.
© FAG 1990
- Ill -
TABLE OF OUNil l'S Page
INTRODUCTICN 1
LIST OF PARTICIPANTS 3
PROGRAMME 7
OPENING CEREMONY 9
EXPRESSION OF THANKS AND RECOMMENDATICWS 1-1
TECHNICAL PAPERS 13
6.1 Assessment of available soil moisture in Zimbabwe, by C.W. Kanyanda, M. Moyo and B. Nyamwanza 13
6.2 Rating of availability of soil moisture -A Kenyan appraisal, by S.M. Wokabi, M.M. Gatahi and W. Aore 17
6.3 Rating of land qualities : moisture availability, a country appraisal -Ethiopia, by Fikru Abebe 23
6.4 Rating of land qualities : moisture availability, a country appraisal -Lesotho, by H. Makhooane 35
6.5 Suitability rating for moisture availability - the model used by the Land Resource Evaluation Project in Malawi, by P. Banda 39
6.6 Rating of land qualities : moisture availability, a country appraisal -Botswana, by T.D. Mafoko 47
6.7 Moisture availability as a land quality: an appraisal for Zambia by D.J. Banda 53
6.8 Rating of land qualities: moisture availability, a country appraisal -Tanzania, by S.E. Mugogo 59
6.9 Rating of land qualities: moisture availability, a country appraisal, Sudan by Hassan Hag Abdulla 65
6.10 A methodology for the calculation of anticipated rainfed crop yields, by F.O. Nachtergaele and P.V. De Wit 77
6.11 FAO/ISRIC soil data base,
by Erik Van Waveren 91
SUMMARY OF THE DISCUSSIOIS 95
FIELD TRIP GUIDE 97
- 1 -
1. INTRCüüCnCN
The East and Southern African Sub-committee for Soil Correlation and Land Evaluation was set up by FAO in 1974 following a recommendation of the 7th FAO Regional Conference for Africa (Libreville 1972). The Svib-committee v^ich comprises all member countries of the sub-region, meets once every two years to discuss matters related to soil survey, classification, land evaluation and management. This Eighth session in Harare falls within that context.
The meeting took place in the Conference Room of the Ambassador Hotel in Harare, and was officially opened by the Director of the Department of Research and Specialist Services, Mr. Fenner. The FAO Representative in Zimbabwe, Mr. C.R. MacCulloch, welcomed the participants. In attendance were invited officials from the host country (Zimbabwe), supporting agencies, seven participating countries and observers.
In his opening speech, Mr. Fenner called for a closer working relationship among soil scientists of the Region, hence the need for a regular meeting every two years. He also pointed out that if the ultimate goal is to attain self-sufficiency in food supply, participating countries must be able to exchange research experiences on the management of various types of soils within the Region, as no country can do it all alone.
Mr. MacCulloch, in his welcoming address said that lack of moisture affects land productivity and that natural climatic changes resulting in severe drought have threatened many African countries with serious food deficits affecting millions of people and animals. Support for increased food production can be given through iitproving soil moisture storage capacity.
The delegate of Zimbabwe, Mr. C.W. Kanyanda, was elected Chairman of the meeting, vrtiile Messrs P. Banda of Malawi, S. Wokabi of Kenya and H. Makhooane of Lesotho were elected Vice-chairman, and first and second rapporteurs respectively.
The papers presented by the participants dealt with the theme of the meeting, vrfiich was "Rating of the land quality of moisture availability: a country appraisal".
A three day field trip took the participants to Chiredzi and Chisumbanji, where 8 soil profiles were described and classified, and to the Mushandike irrigation scheme, situated 20 km south of Masvingo town.

- 3 -
2. LIST OF PARTICIFANTS
BOTSWANA Mr. T.D. MAFOKO Soil Surveyor Ministry of Agriculture Private Bag 003 Gaborone
Mr. B. MOGANANE Soil Surveyor Ministry of Agriculture Private Bag 003 Gaborone
Mr. P. DE WIT Soil Scientist FAO P.O. Box 54 Gaborone
Mr. D.J. RADCLIFFE Land Evaluation Specialist FAO P.O. Box 54 Gaborone
ETHIOPIA Mr. F. ABEBE Soil Surveyor, Head Land Use Planning and
Regulatory Department Ministry of Agriculture P.O. Box 5354 Addis Ababa
KENYA Mr. S.M. WOKABI Acting Head Kenya Soil Survey P.O. Box 14733 Nairobi
Mr. M.M. GATAHI Land Evaluation Officer Kenya Soil Survey P.O. Box 14733 Nairobi
Mr. W. AORE Soil Scientist Kenya Soil Survey P.O. Box 14733 Nairobi
LESOTHO Mr. H. MAKHOOANE Soil Scientist Soil and Water Conservation Division P.O. Box 92 • Maseru 100
- 4 -
MALAWI Mrs. D. LAKUDZALA Soil Chemist Ministry of Agriculture Chitedze Agricultural Research Station P.O. Box 158 Lilongwe
Mr. P. BANDA Agricultural Research Officer (Soil Surveyor) Ministry of Agriculture Soil Survey Unit P.O. Box 92 Lilongwe
TANZANIA Mr. S.E. MUGOGO Senior Agricultural Research Officer (SARO) Ministry of Agriculture and Livestock
Development Private Bag Ngomeni Tanga
Mr. A.J. VAN KEKEM National Soil Service Project P.O. Box 5088 Tanga
ZAMBIA Mr. D.J. BANDA Soil Surveyor Soil Survey Unit Private Bag 7 Chilanga
Mr. L. CHILESHE Department of Agriculture Soil Survey Unit Mt. Makulu Private Bag 7 Chilanga
Mr. C,. LUNGU Soil Information officer Soil Survey Unit Private Bag 7 Chilanga
Mr. N. MUKANDA Soil Survey Unit Department of Agriculture Mt. Makulu Research Station Private Bag 7 Chilanga
ZIMBABWE Mr. C.W. KANÏANDA Head, Pedology and Soil Survey Department of Research & Specialist Services Chemistry and Soil Research institute P.O. Box 8100 Causeway, Harare
- 5 -
Mr. M. MOYO Pedologist Department of Research & Specialist Services Chemistry and Soil Research Institute P.O. Box 8100 Causeway, Harare
Mr. S. MUSHIRI Soil Chemist Department of Research & Specialist Services Chemistry and Soil Research Institute P.O. Box 8100 Causeway, Harare
Mr. J, MZEZEWA Research Officer Department of Research & Specialist Services Chemistry and Soil Research Institute P.O. Box 8100 Causeway, Harare
Mr. B. NYAMWANZA Research Officer Department of Research & Specialist Services Chemistry and Soil Research Institute P.O. Box 8100 Causeway, Harare
Mr. J. HUESUEN Land Use Planner FAD P.O. Box 3730 Harare
Mr. G.R. TYRIE Land Use Planner FAO P.O. Box 3730 Harare
Winand Staring Centre Mr. W. ANDRIESSE P.O. Box 125 6700 AC Wageningen The Netherlands
SADCC Dr. J. SAMKI Soil Correlator SADCC SADCC Food Security Programme P.O. Box 4046 Harare Zimbabwe
FAO Mr. M.F. PURNELL Senior Technical Officer Soil Resources, Management and Conservation
Service Land and water Development Division Rome Italy
- 6 -
Mr. R. SANT-ANNA Regional Soil Resources Officer FAO Regional Office for Africa P.O. Box 1628 Accra Ghana
Mr. E. VAN WAVEI EN APO, Soil Survey/Database Development P.O. Box 1867 Sana'a Yemen Arab Republic
Mr. A. NENSAH Bilingual Secretary FAO Regional Office for Africa P.O. Box 1628 Accra Ghana
- 7 -
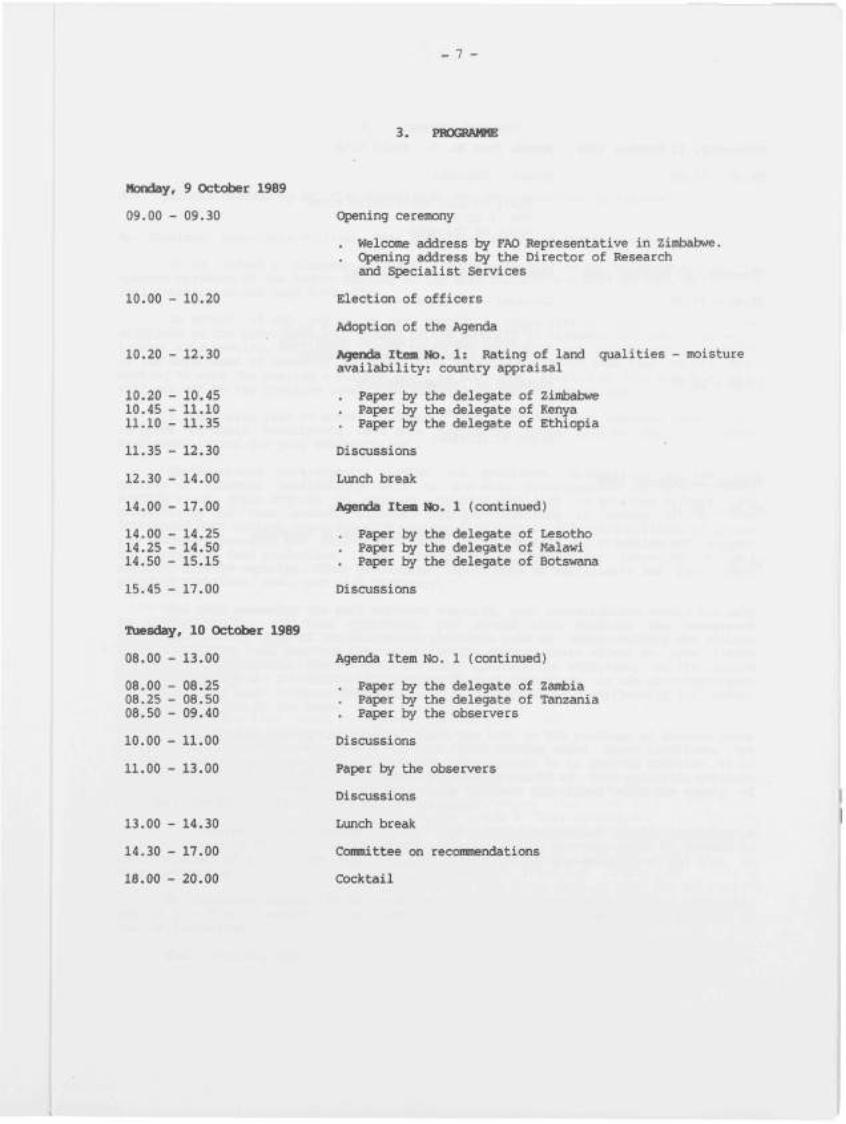
3. FROGBANNE
Honday, 9 October 1989
09.00 - 09.30
10.00 - 10.20
10.20 - 12.30
10.20 10.45 11.10
11.35
12.30
14.00
14.00 14.25 14.50
10.45 11.10 11.35
12.30
14.00
17.00
14.25 14.50 15.15
15.45 - 17.00
Opening ceremony
. Welcome address by FAO Representative in Zimbabwe.
. Opening address by the Director of Research and Specialist Services
Election of officers
Adoption of the Agenda
Agenda Item No. 1: Rating of land qualities - moisture availability: country appraisal
. Paper by the delegate of Zimbabwe
. Paper by the delegate of Kenya
. Paper by the delegate of Ethiopia
Discussions
Lunch break
Agenda Item No. 1 (continued)
. Paper by the delegate of Lesotho
. Paper by the delegate of Malawi
. Paper by the delegate of Botswana
Discussions
Tuesday, 10 Octcdjer 1989
08.00 - 13.00
08.00 - 08.25 08.25 - 08.50 08.50 - 09.40
10.00 - 11.00
11.00 - 13.00
13.00 - 14.30
14.30 - 17.00
18.00 - 20.00
Agenda Item No. 1 (continued)
. Paper by the delegate of Zambia
. Paper by the delegate of Tanzania
. Paper by the observers
Discussions
Paper by the observers
Discussions
Lunch break
Committee on recommendations
Cocktail

- 8 -
Wednesday, 11 Octdaer 1989 Agenda item NO. 2: Field trip
08.00 - 17.00 Harare - Chiredzi
. Visit to soil correlation sites Nos. 1 to 4
. Night at Chiredzi
Thursday, 12 October 1989
08.00 - 17.00
17.00 - 18.30
Agenda item No. 2 (continued)
Chiredzi - Chisumbanje:
. Soil correlation sites Nos, 5 to 8 5 and 6 under irrigation conditions 7 and 8 imder rainfed conditions
Adoption of recommendations
Closing session
Night at Chiredzi
Friday, 13 October 1989
07.00 - 16.30
16.30
Chisijmbanje - Masvingo - Harare
. Visit to Irrigation Scheme of Masvingo
Arrival in Harare
- 9 -
4. OPENING CEREMONY
4.1 Welcome Address by Kc. C.R. HacCulloch, FAO Representative in Zimbabwe
Mr. Chairman, Honourable Minister, Dear Participants, Ladies and Gentlemen,
It is indeed a pleasant duty and a great pleasure to be associated with the opening ceremony of the Eighth meeting of the East and Southern African Sub-comittee for Soil Correlation and Land Evaluation.
On behalf of FAO and on ray own behalf, I would like to express our sincere gratitude to the Government and people of the Republic of Zimbabwe for kindly agreeing to host this meeting. Particular thanks go to the Chemistry and Soil Research Institute of the Department of Research and Specialist Services v^ich for some time now has been working to make the meeting a success and I am sure that, looking at your schedule, this will pay off by the positive results we expect from your deliberations.
I would also like to convey my sincere appreciation to our resource persons v^o, in spite of their commitments, have gone beyond the normal call of duty to prepare backgroxind papers for your deliberations.
Distinguished participants, ladies and gentlemen, discussions on the land quality of moisture availability will be the main preoccupation of your present meeting : and quite rightly so, vrtien we consider that lack of moisture affects land productivity and that natural climatic changes resulting in severe drought have threatened many African countries with serious food deficit affecting millions of people and animals. Therefore the most crucial area which requires our attention and support for increased food production is the development of methods for iirproving the soil moisture storage capacity. Other production inputs such as fertilizers and pesticides, yielding varieties, etc., are also necessary.
But vrtien assessing the soil moisture capacity, your investigation should not only be limited to the soil/land qualities, you should also consider the management practices. In fact, some of the management practices such as inter-cropping and minimum tillage influence soil moisture storage indirectly through their effect on water intake and reduced evaporation. These practices also increase the efficiency of the stored moisture for crop use in rainfed agriculture. Also of inportance is the microtopography which can often lead to micro-climatic differences affecting significantly the actual evapotranspiration by the crop.
Mr. Chairman, having said this, I shall now turn to the problems of farming under rainfed conditions. From experience we know that farming under these conditions has become increasingly risky and thus resorting to irrigation is an obvious solution. It is my hope therefore that this meeting, v^ile addressing itself to land qualities moisture availability, will also examine how best some problems associated with the supply of soil moisture through irrigation, can be overcome.
Mr. Chairman, I am pleased to note that you have included in your programme a field excursion to Chiredzi and ChisunÜDanje, where you will in many cases be treated to the challenges of agriculture \inder rainfed conditions and the enormity of the task in water harvesting.
Mr. Chairman, Honourable Minister, distinguished participants, without taking too much of your time, I would like once again on behalf of FAO to wish you all the best in your deliberations.
Thank you very much.
- 10 -
4.2 Address by Mr. Fenner, Director of the Department of Research and Specialist Services
As the Director of the Department of Research and Specialist Services, it also gives me great pleasure to welcome you all to Zimbabwe. It may be the hottest time of the year, but being Jacaranda time this must be a con jensation to those of you who in the context of this meeting raise their heads to a more upright position.
But let us get to the root of the matter. Why do you meet regularly every two years? On the broad front, this is easy to answer. Your continued activities lay the foundation for good working relationships between soil scientists in the Region. So do many other meetings of agricultural scientists afford this opportunity, but v*iat is different about this meeting and you, the participants?
Soil classification and land evaluation are very specific and specialized disciplines, and many agricultural researchers believe you to be a very small cog in the vast coitplicated machine of agricultural production.
Before I became an administrator and manager, I was a soil chemist and crop nutritionist. I therefore cannot, and do not, vmderrate your iitportance. No country can be an island onto itself! To progress we must be able to transfer agrotechnology between countries. We must be able to exchange research experiences on the management of various soil types within the region, as no one covmtry can do it all, if the ultimate goal is to attain self-sufficiency in food supply. To do this we must know vdiat each of us means when we describe the basic unit of agricultural productivity, the soil. A colleague of mine, a very eminent soil scientist here in Zimbabwe, classified our soils into sands and red soils; and we may laugh, but most of us v^o have worked here for many years know exactly the point being made. Would anyone from outside our borders? The answer in the negative goes without saying! We must be able to correlate through the nomenclature the soils of the Region.
But names are not enough. They must also describe the properties inherent and vdiat can be done with them, and we also must agree on these matters. And the specific themes of past meetings have done just that. In 1983 in the Sudan, the properties, management and classification of Vertisols were discussed in detail; in 1985 in Lesotho "problem soils" were discussed. Not as grand a theme as the previous one, or even the following meeting, but the English language tends to underestimate the importance of any problem. In Botswana in 1987 you discussed land evaluation for rainfed agriculture and during the discussions you found it diffcult to rate moisture availability through lack of guidelines. In fact one was unable to describe precisely vrtiat is the ideal available moisture requirement for crop growth.
I note from the programme this meeting attenpts to answer this question; what a difficult goal, particularly as your deliberations are crop specific, and when one considers the wide range of climatic situations that occur within the region. To anyone here it is obvious that, lower the available water capacity of a given soil, the shorter the period over vrfiich any crop can stay alive in the absence of rainfall becomes less or the rainfall itself becomes less reliable. I therefore wish you well in your attempts to define and measure those soil parameters that determine the ability of a soil, v^ether you call it a fine-grained sand, a Haplic Arenosol, or a coarse, siliceous, hyperthermic Typic Tropopsamment, to hold and store moisture.
It is now my privilege, on behalf of the Government of Zimbabwe and the Ministry of Lands, Agriculture and Rural Resettlement, to declare the 8th Session on Soil Correlation and Land Evaluation in East and Southern Africa officially open.
- 11 -
5. EXPRESSION OF THANKS AND RECGHHENDATIONS
Expressie») of "Dianks
The participants of the eight session of the East and Southern African Sub-Committee for Soil Correlation and Land Evaluation,
Satisfied that the eight session of the Sub-Committee has provided a good forum, for discussing land quality with respect to moisture availability towards increased crop production,
Convinced of the in jact of such periodic meetings in enhancing exchange of experiences on soil survey, classification, evaluation and management,
Record their warm appreciation to FAO for its efforts aimed at promoting technical cooperation among the national institutions of the siob-region towards continuous support to the work of the Sub-Committee,
Express on behalf of FAO their deep sense of gratitude to the Government of Zimbabwe for hosting the meeting and for the facilities provided; to the Governments of Angola, Botswana, Ethiopia, Kenya, Lesotho, Malawi, Madagascar, Mozambique, Sudan, Swaziland, Tanzania, Uganda and Zambia for their confidence in the work of the sv±>-committee; to the Winand Staring Centre (The Netherlands) for the continuous interest and cooperation accorded to the Sub-committee; to the Chemistry and Soil Research Institute of the Department of Research and Specialist Services (Zimbabwe) for the preparation of the session and field tours, and to those vrtio contributed in various ways to the success of the meeting.
Recomnendations
The participants
Being aware that the natural climatic variations resulting in severe drought threatened many African countries with serious deficits in food production.
Convinced that lack of moisture is a major constraint on land productivity in the region and that there is a need for development of methods for assessing and improving the utilization of the soil moisture storage capacity.
Recommend that;
1. Governments of the sub-region
a. Promote internal cooperation and exchange of information relevant to moisture studies developnent between the different soil and agroclimatological agencies.
b. Facilitate regional and international cooperation in agrotechnology transfer among covmtries of the sub-region and elsewhere.
2. National soil institutions:
a. Pay greater attention in their programmes to the assessment of moisture availability year by year for optimum crop production.
b. Use a quantitative moisture balance model, incorporating precipitation, evapotranspiration and soil moisture storage (models should be crop and soil specific).
- 12 -
c. Conduct further investigations to establish local values for certain parameters (for exaitple effective rainfed grovmdwater contribution and initial moisture studies),
d. Test and verify the models in conparison with actual crop yields,
e. Develop soil moisture regime classification in collaboration with FAO and other agencies.
3. FAO
a. Assist member countries in their programmes for assessing and improving the utilization of the soil moisture storage capacity,
b. Produce guidelines on moisture balance modelling for moisture availability assessment, specifically for rainfed conditions,
c. Advise on software for computerized systems and on interfacing with programmes dealing with data bases, land evaluation and geographical information systems.
Next Meeting of the Sub-Conmittee
The Secretariat should explore the possibility of holding the ninth session of the Sub-Committee in Malawi.
The theme of the meeting will be: Computer assisted systems for processing soil data and for quantified land evaluation.

- 13 -
6. TEXSNICAL PAPERS
6.1 ASSESaiEMT OF AVAILABLE SOIL MOISTURE IN ZIMBABWE
by
C.W. Kanyanda, M. Moyo and B. Nyamwanza
INTRODUCTIGN
One of the limiting factors to agricultural production in Zimbabwe is the availability of soil moisture. This is particularly so in areas of low and unreliable rainfall. Over the years, investigations have been conducted to assess the effect of this land quality on crop production in the country. The most notable doctmient on this subject is the Agro-ecological Survey of Southern Rhodesia (Vincent and Thomas) in which the country was divided into five natural regions vrfiich constitute broad areas of optimal land use capabilities based on climate. Natural Region I is v*iere rainfall is high OlOOO mm) and reliable. At the bottom end. Natural Region V is vrtiere rainfall is low (<450 mm) and erratic for the reliable production of crops.
The most recent refinement of this document was by Hussein (1987) vrtio used rainfall and tenperature data to calculate length of growing seasons in Natural Regions III, IV and V. In a way this was an assessment of the available moisture.
Within each region potential use is determined by soil characteristics. Such soil parameters are, therefore, to be utilized to determine the ability and capacity of a particular soil to hold and store moisture. Thus the lower the available water capacity of any given soil, the shorter the period over vrtiich any crop can be sustained in the absence of rainfall.
CHARACTERISTICS AFFECTING AVAILABLE MOISTURE
The available water capacity of the soil depends on various soil parameters but consideration will be given to soil depth, soil texture, vrtiether sand fraction is fine grained or coarse grained, and clay mineralogy.
Soil Depth
Soil depth with respect to moisture availability refers to the depth in a soil profile within v^ich roots can easily penetrate in search of water for the development of crops. Rooting conditions are controlled by soil effective depth and ease of root penetration. The deeper the soil, the more water is retained and thus more of it is available for plant growth.
Six depth classes are recognized for general use. These are given in Table 1.
Table 1 DEPTH CLASSES
Depth Class
Deep Moderately deep Moderately shallow Shallow Very shallow Extremely shallow
Depth (cm)
>150 100 -50 -40 -25 -<25
150 100 50 40
- 14 -
Soil Texture/Nature of Sand Fraction
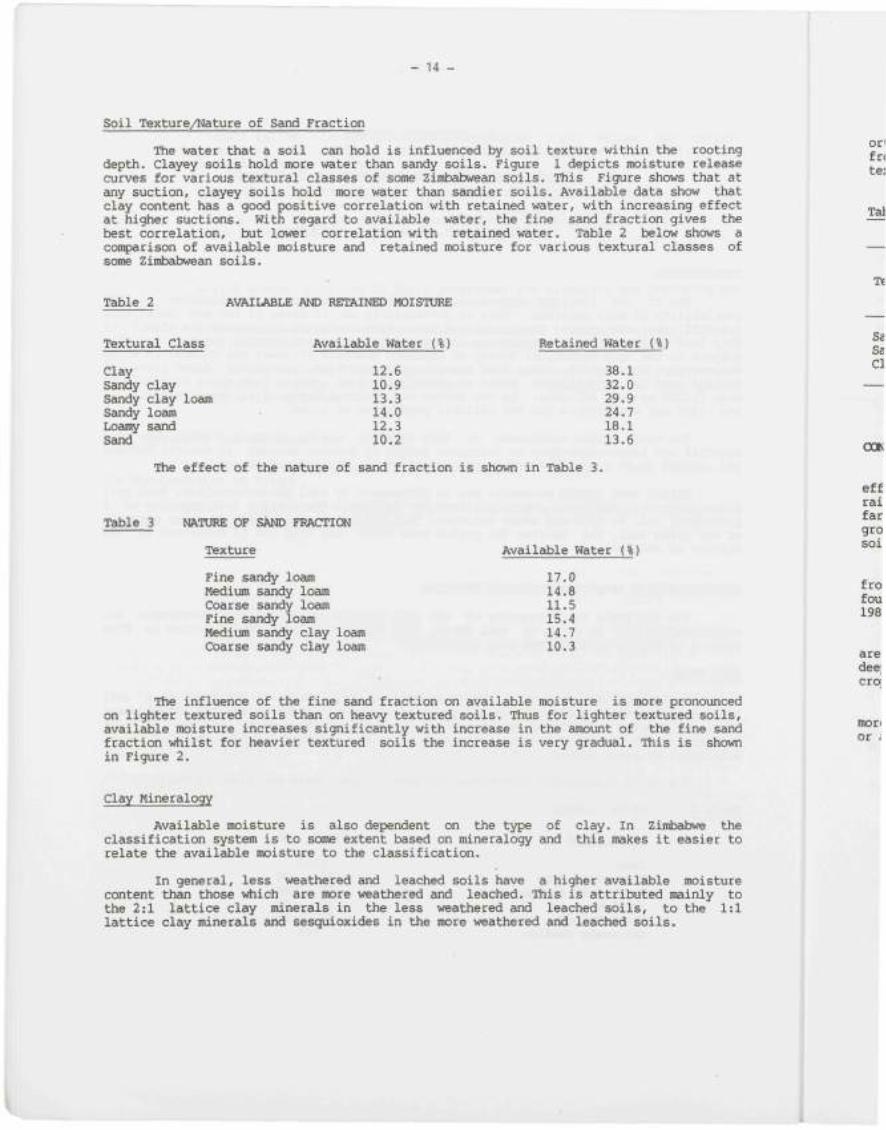
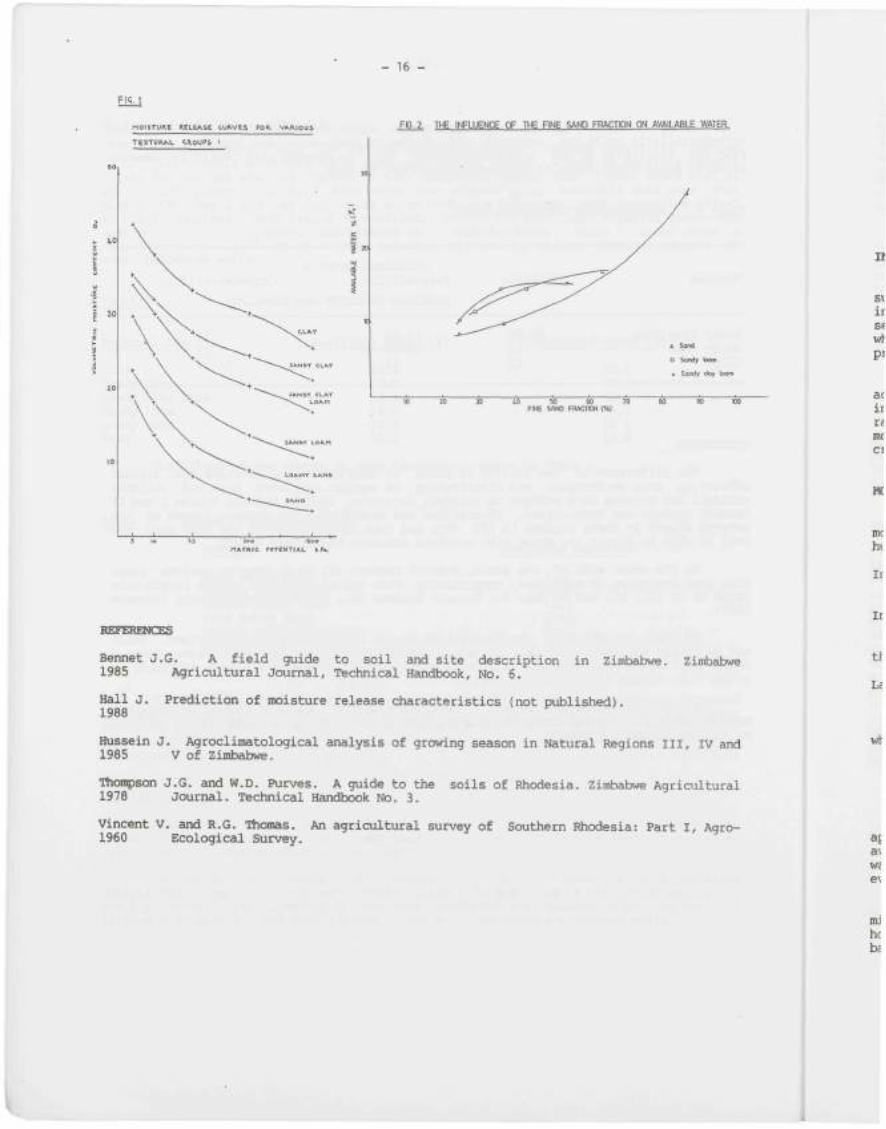
The water that a soil can hold is influenced by soil texture within the rooting depth. Clayey soils hold more water than sandy soils. Figure 1 depicts moisture release curves for various textural classes of some Zimbabwean soils. This Figure shows that at any suction, clayey soils hold more water than sandier soils. Available data show that clay content has a good positive correlation with retained water, with increasing effect at higher suctions. With regard to available water, the fine sand fraction gives the best correlation, but lower correlation with retained water. Table 2 below shows a comparison of available moisture and retained moisture for various textural classes of some Zimbabwean soils.
Table 2 AVAILABLE AND RETAINED MOISTURE
Textural Class Available Water
Clay 12.6 Sandy clay 10.9 Sandy clay loam 13.3 Sandy loam 14.0 Loamy sand 12.3 Sand 10.2
{%)
The effect of the nature of sand fraction is shown
Retained Water (%
in Table
38.1 32.0 29.9 24.7 18.1 13.6
3.
Table 3 NATURE OF SAND FRACTIOI
Texture Available Water (%)
Fine sandy loam 17.0 Medium sandy loam 14.8 Coarse sandy loam 11.5 Fine sandy loam 15.4 Medium sandy clay loam 14.7 Coarse sandy clay loam 10.3
The influence of the fine sand fraction on available moisture is more pronoionced on lighter textured soils than on heavy textured soils. Thus for lighter textured soils, available moisture increases significantly with increase in the amount of the fine sand fraction vrtiilst for heavier textured soils the increase is very gradual. This is shown in Figure 2.
Clay Mineralogy
Available moisture is also dependent on the type of clay. In Zimbabwe the classification system is to some extent based on mineralogy and this makes it easier to relate the available moisture to the classification.
In general, less weathered and leached soils have a higher available moisture content than those vdiich are more weathered and leached. This is attributed mainly to the 2:1 lattice clay minerals in the less weathered and leached soils, to the 1:1 lattice clay minerals and sesquioxides in the more weathered and leached soils.
- 15 -
Table 4 below depicts this phenomenon where siallitic, fersiallitic and orthoferrallitic soils are coirpared: the degree of weathering and leaching increases from the siallitics to the orthoferrallitics. This is however only valid in heavier textured soils v^ere there is a significant amount of clay.
Table 4 PERCEOTAGE OF AVAILABLE WATER
Texture
Sandy clay Sandy clay Clay
loam
Siallitic
12-16 14 13
AVAILABLE VJATER % Fersiallitic
11-14 12-14
12
Orthoferrallitic
11
10 11 -12
OGNCLUSIOf
The difference in the ability of soils to hold and store moisture has minimal effects on crop performance and distribution in regions receiving high and reliable rainfall but becomes more evident as rainfall decreases. Thus in Natural Region I and II farming systems are specialised, diversified and intensive. The average length of the growing season in these regions is 150 days and this is a measure of the time v*ien the soil is able to supply the plant with required moisture to sustain growth.
On the other side of the scale. Natural Regions III to V, farming systems range from semi-intensive to extensive, respectively. Mean medium values of season length were found to be 131, 121 and 96 days for Natural Regions III, IV and V respectively (Hussein 1987).
In these regions soil characteristics become increasingly more important. Soils are generally shallow due to poor prevalent weathering and leaching conditions. Hence a deeper soil (more available moisture) will considerably increase the water available to crops, i.e. length of the growing season.
In Natural Region III, IV and V, deep, fine grained soils of medium textures are more suitable for dryland cropping assuming that field capacity is attained at one time or another during the season.
16 -
FK. 1
HOI>TUR£ R£L6^5E CUUVeS FOR VA.MOUS
TEVtTURAL «ROUPi !
10 I 20
3
FIG.2. THE INFLUENCE OF THE FINE SANO FRACTION ON AVAILABLE WATER.
& Sond
o Sondy kxitn
o Sondy clay loom
to 50 60 70 FINE SAHD FRACTCN (V,|
leo iSoo MATRl t POTENTIAL k P..
REFERENCES
Bennet J.G. A field guide to soil and site description in Zimbabwe. Zimbabwe 1985 Agricultural Journal, Technical Handbook, No. 6.
Hall J. Prediction of moisture release characteristics (not published). 1988
Hussein J. Agroclimatological analysis of growing season in Natural Regions ill, iv and 1985 V of Zimbabwe.
Thonpson J.G. and W.D. Purves. A guide to the soils of Rhodesia. Zimbabwe Agriaaltural 1978 Journal. Technical Handbook No. 3.
Vincent V. and R.G. Thomas. An agricultural survey of Southern Rhodesia: Part I, Agro-1960 Ecological Survey.
- 17 -
6.2 BATING OF AVAIIABILITy OF SOIL MOISTURE - A KENXftN APPRAISAL
by
S.M. Wokabi, M.M. Gatahi and W.W. Acre
INTRCMÜCTION
A major constraint to agricultural production in Kenya, like in many other stib-Saharan countries, is availability of moisture. Only 20% of the total land surface in Kenya is suited for rainfed arable production vrfiile the remaining 80% is arid to semi-arid. Population pressure has necessitated increased utilization of semi-arid areas vrtiere availability of moisture becomes the single crucial factor limiting sustained productivity.
The rating of availability of moisture in Kenya has evolved over the years in accordance with our growing capacity to compile specific data on land resources, including climate, soils, vegetation on one hand and crop yields on the other. The rating of availability of moisture has thus evolved from broad generalization of moisture availability involving water balance calculations culminating in the use of crop moisture deficits as the rating criteria.
MOISTURE INDICT
Various moisture indices have been used in Kenya. Pratt and Gwynne (1966) used monthly rainfall and annual potential evaporation (Eo) to calculate the index of humidity and aridity, then siibsequently a moisture index as shown in the equation below:
Index of humidity (Ih) = monthly rainfall excesses x 100 annual Eo
Index of aridity (la) = monthly rainfall deficits x 100
annual Eo
thus moisture index «= Ih ~ 0.6la
Later this moisture index was modified to
Im = Ih - la or Im = 100 (P/PE - 1)
v*iere Im = moisture index
P » average annual precipitation and
PE = annual average potential evapotranspiration The resultant map of the Pratt, Greenway and Gwynne moisture index system
appeared to be optimistic and was difficult to interpret vegetation in terms of the average annual water balance. Woodhead (1970) calculated an annual index of available water, through a water balance based on average monthly rainfall, average monthly evaporation and incorporated soil moisture storage capacity.
The soil moisture storage capacity was however estimated from a soil map of 1:3 million (Gethin Jones and Scott 1959). The soil moisture storage capacity estimate was however too generalized since the soil units were catenas. At that time, the water balance calculations were based on evaporation rather than potential evapotranspiration.
- 18 -
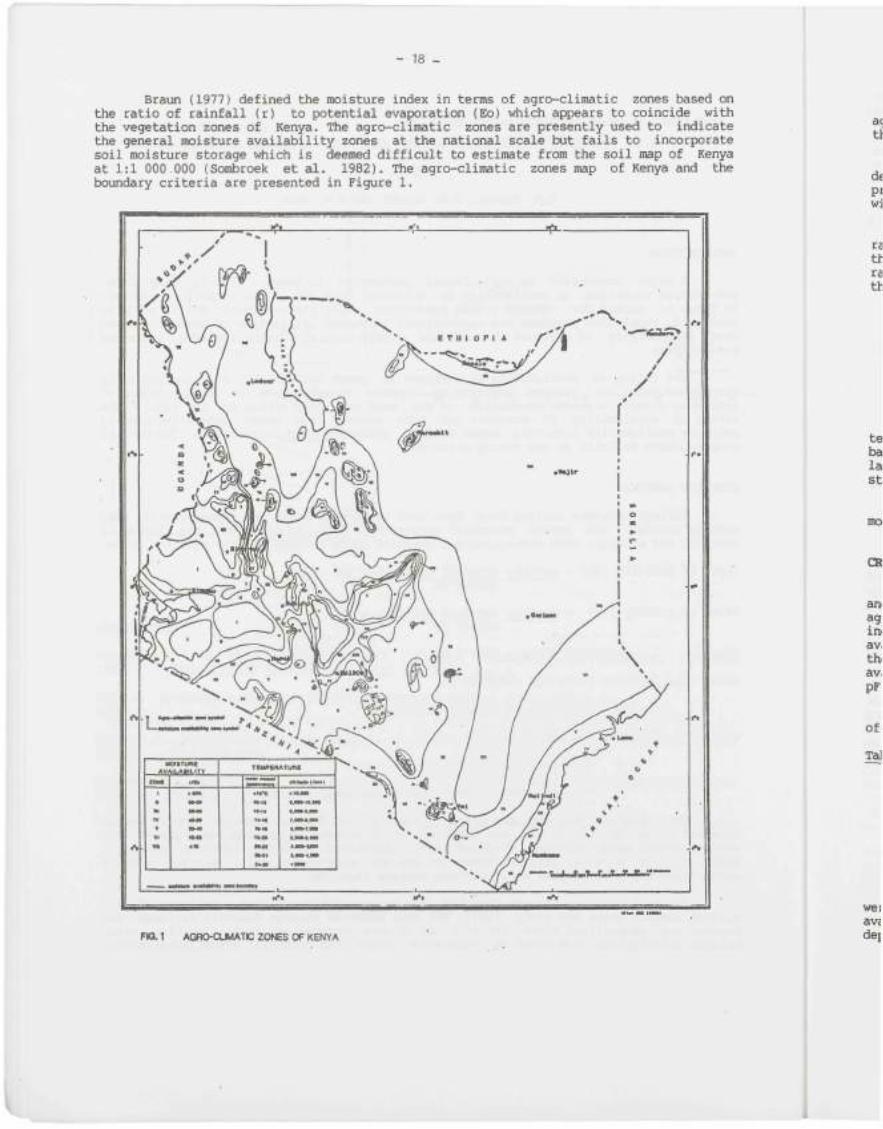
Braun (1977) defined the moisture index in terms of agro-climatic zones based on the ratio of rainfall (r) to potential evaporation (Eo) \^ich appears to coincide with the vegetation zones of Kenya. The agro-climatic zones are presently used to indicate the general moisture availability zones at the national scale but fails to incorporate soil moisture storage v iich is deemed difficult to estimate from the soil map of Kenya at 1:1 000.000 (Sombroek at al. 1982). The agro-climatic zones map of Kenya and the boundary criteria are presented in Figure 1.
FKÏ. 1 AGRO-CUMATC ZONES C3F KENYA
- 19 -
The r/Eo based moisture index of Braun (1977) is a single but useful indicator of agricultural productivity on a national or regional level, however it falls short v^en the productivity of a specific area is considered.
Jaetzold et al. (1982) using the FAO Agro-ecological Zone Methodology (1978) delineated the agro-ecological zones of Kenya. The ecological zones are based on the probability that the tenperature and water requirements of a crop will be fully met within an area.
This methodology takes into account the soil moisture storage, effective rainfall, rooting volume of the crop and a progressively changing crop coefficient through the several stages of crop development. The yield expectations (suitability ranking) of an area is given in terms of a probability (60%) that a given percentage of the optimum yield can be obtained. The ranking is as shown below:
Yield % of optimum yield
Very good 80-100 Good 60-80 Fair 40-60 Poor 20-40 Very poor 0-20
The agro-ecological zone methodology has served its intended purposes well in terms of selection of the crops suitable for particular zones. The method is however based on the 1:1 000 000 Soil Map of Kenya (Sombroek et al. 1982); consequently, for larger scale of mapping, a methodology en jloying more specific data on soil moisture storage is necessary for evaluating the land quality availability of moisture.
A water balance approach using crop moisture deficits for rating availability of moisture for specific crops is presently being tested by the Kenya Soil Survey.
CRITERIGN FOR BATING AVAILABILITY OF HOISTURE
Since its inception, the Kenya Soil Survey has employed both agro-climatic zones and the soil moisture storage capacity for rating availability of moisture. The agro-climatic zones based on the ratio r/Eo, has been used broadly and qualitatively to indicate areas of differing moisture availability. The higher the ratio, the higher the available moisture. At the second level, soil moisture storage capacity is used to rate the availability of moisture per individual soil mapping unit. The total readily available moisture (TRAM), taken as moisture content at pF 2.3 minus moisture content at pF 3:7, is used as the criteria for rating soil available moisture storage capacity.
The total available moisture storage capacity integrated over the rooting depth of the soil is rated according to Table 1 (Braun and Van de Weg 1977).
Table 1 RATING OF TOTAL READILY AVAILABLE MOISTURE
Rating TRAM (mm)
1. Very high 160-200 2. High 120-160 3. Moderate 80-120 4. Low 40 5. Very low <40
Graphical correlations between total readily available moisture and clay content were used to estimate the available moisture where actual determinations were not available. These graphical correlations were tabulated for various textures and soil depths, as shown in Table 2.

- 2ü -
The use of agro-climatic zones and total readily available moisture storage capacity has some limitations. First, quantification of availability moisture is not possible since the actual moisture content is not taken into account. Secondly, the graphical correlations used to estimate available moisture storage capacity was based on one soil characteristic (clay) within a limited geographical extent. Given these limitations, the Kenya Soil Survey is presently using a water balance approach which takes into consideration rainfall, soil moisture storage capacity, rooting depth and crop water requirements to calculate moisture deficits. The moisture deficits are employed as criteria for rating the land quality availability of moisture.
Table 2 RATING OF READILY AVAILABLE MOISTURE (mm) VARIOUS TEXTURES AND DEPTHS
FOR
Soil depth (cm)
25 50 80 120 150 180
LS
8 15 24 36 45 54
SL
10 20 32 48 60 72
Textural class
SCL
14 28 44 66 83 99
SC
20 40 64 96 120 144
C
28 55 88 132 165 198
LS = Loany sand; SL = Sandy loam; SCL = Sandy clay loam; SC = Sandy clay; C =C.lay
(Source: Braun and Van de Weg 1977).
Moisture Deficit Approach
This method is both soil and crop specific. It involves the calculation of moisture deficits experienced by a crop during a selected period and sxobsequently uses the deficits to rate availability of moisture. Rainfall, rooting depth, soil moisture storage capacity and crop water requirements are all considered in these calculations.
a. Determination of available moisture storage capacity
The readily available moisture storage capacity (RAM) viz. the difference between moisture content at pF 2.3 and pF 3.7, and total available moisture (TAM) viz. the difference between moisture content pF 2.3 and pF 4.2 was determined for approximately 300 soil samples from all parts of the country. The determined moisture storage capacities were then regressed against the soil characteristics vide clay, silt, sand, carbon and bulk density. The resultant regression equations (i) and (ii) were used to estimate RAM and TAM v*iere actual data was not available.
RAM = 44. 423-14. 385Xj^-0.24X2-0. 172X3-0.097X^-0.08 x^
multiple R = 0.657
ii. TAM -= 17.846-12.735Xj^ + 0.027X2 x O.O67X3 x 0.245X^ - 0.363X5
multiple R = 0.685
v^ere X^ = bulk density; X2 = percent clay; X, = percent sand; X, »= percent silt cind Xc = percent carbon.

- 21 -
Crop water requirements
Penman Eo and crop coefficients of selected periods were used to estimate crop water requirements. For maize, Kc values used were 0.3, 0.7, 1.05 and 0.8 for initial, development, mid-season and late season respectively (Doorenbos and Kassam 1979). For coconut, Kc values ranging from 0.3 to 1.0 and cashew nut 0.5 -0.85 (Gatahi 1983).
Moisture deficit calculations
Moisture deficits were calculated according to the equation
MD - P + SMS - Etc
where
MD = moisture deficit over selected periods; P = rainfall for selected periods SMS " soil moisture storage Etc = crop evapotranspiration
Moisture deficits were calculated per decade during the various growth stages for maize. For coconut and cashew nuts, monthly moisture deficits were calculated. Cumulative moisture deficits of selected periods were regressed against yields. The regression equation obtained for maize was of the form:
5.64 - 0.257X (r - 0.618)
where
Y = yield ( tans/ha) X = cumulative moisture deficit
The regression equation relating to copra yield (Y) to moisture deficits during 29 and 24 months (X- and X,) preceding the year of harvest respectively are:
Y - 218.89-0.049XT (r - 0.562), and Y = 221 - 0.058X2- (r = 0.581)
The regression equation between cashew yield (Y) and August-December moisture deficit (X) is:
Y - 261 + 0.645X (r' - 0.593)
Rating of availability of moisture using moisture deficit method
Moisture deficits experienced by coconuts 24 months preceding harvest was found to be significantly correlated to copra yields and was therefore used to rate availability of moisture according to Table 3.
Table 3 RATING OF AVAILABILITY OF MOISTURE FOR COCCMJT
Class Range of moisture deficits (mm)
1 0-570 2 571 - 1140 3 1141 - 1700 4 17Q1 - 2200 5 >2200
- 22 -
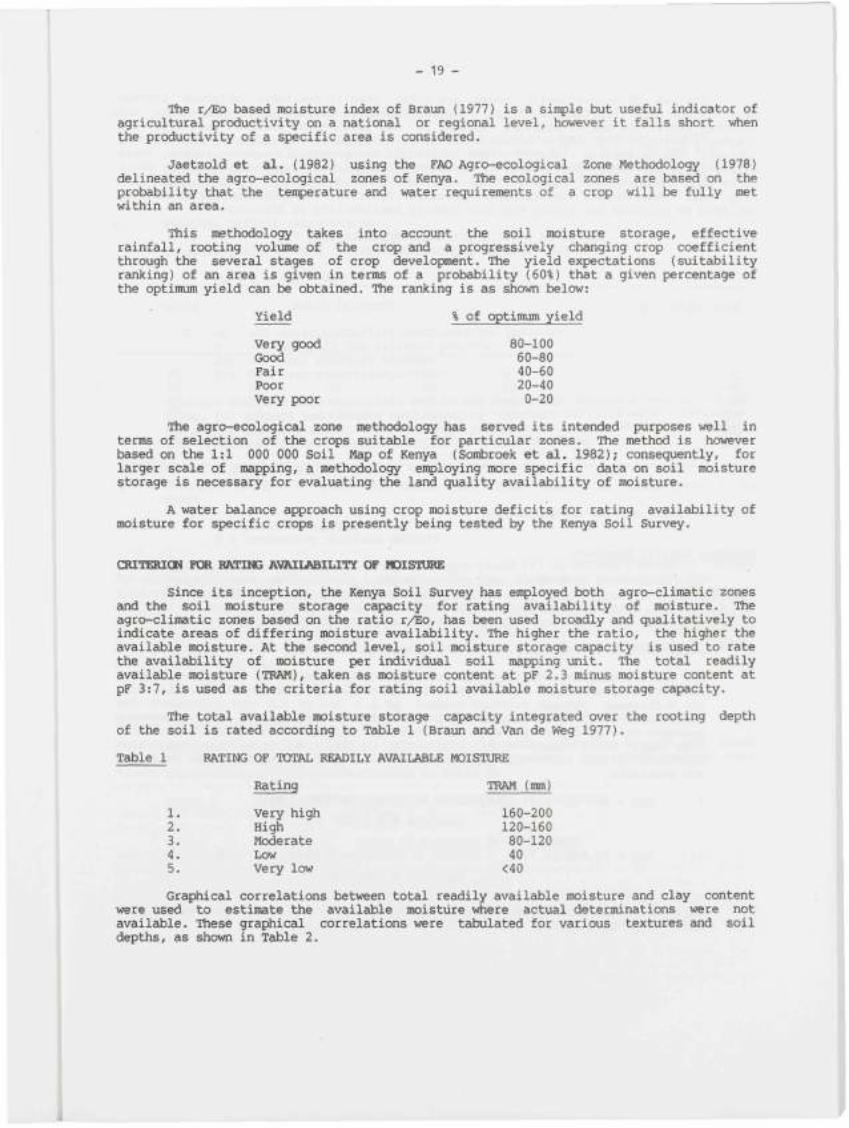
Moisture deficits experienced by cashew nuts during the August-December period were also significantly correlated to yields. The rating criteria for availability of moisture is given in Table 4.
Table 4 RATING OF AVAILABILITY OF MOISTURE FOR CASHEW NUTS
Class Range of average moisture deficits (mm)
1 <160 2 161 - 320 3 321 - 470 4 471 - 625 5 >625
The study for maize is still in progress and no conclusive ratings for availability of moisture have been established to date.
CX]NCLUSIGN
Difficulties have been experienced in rating availability of moisture using sinple moisture indices. More elaborate approaches, for example, agro-ecological zones, are suited for delineating land use zones on regional and national scales. The moisture deficit approach is both crop and soil specific, furthermore it can be used to predict crop yields once significant relationships are established. It is therefore suitable for large scale resource maps.
REFERENCES
Braun H.M.H. and R.F. van de Weg. Proposals for rating land qualities. Kenya Soil 1977 Survey, internal Communication No. 7.
Doorenbos J. and A.H. Kassam. Yield response to water. FAO Irrigation and Drainage 1979 Paper No. 33. FAO, Rome.
FAO. Report on the Agro-ecological Zones Project. Vol. 1, Methodology and results for 1978 Africa. World Soil Resources Report No. 48. Rome.
Gatahi M.M. Physical land evaluation of Chonyi-Kaloleni area, Kilifi District, with an 1983 eirphasis on suitability for cashew nuts and coconuts. M.Sc Thesis, University
of Nairobi.
Gethin-Jones G.H. and R.M. Scott. Soil Map of Kenya in: Atlas of Kenya, 1962 edition, 1959 Survey of Kenya, Nairobi.
Jaetzold R. and H. Schmidt. Farm Management Handbook of Kenya, Volume II. Ministry of 1982 Agriculture, Nairobi.
Pratt D.J., P.J. Greenway and M.D. Gwynne. A classification of East African rangeland. 1966 Journal of implied Ecology. Vol. 3, pp 369-382.
Sombroek W.G., H.M.H. Braun and B.J.A. van der Pouw. Exploratory soil map and 1982 agro-climatic zones map of Kenya. Kenya Soil Survey. Report No. El, Nairobi.
Woodhead T. A classification of East African rangeland III. The water balance as a 1970 guide to site potential. Journ. i^pl. Ecol. Vol. 7. No. 3. pp 647-652.
- 22, -
6.3 BATZNQ OF LAND QUALITIES: HOISIUBE AVAILABILITY
A COUNTRY APPRAISAL - ETHIOPIA
by
Frikru Abebe
SUMMARY
The moisture availability rating as part of a computerized Land Evaluation System to prepare semi-detailed land use plans at a scale of 1:50 000 is presented with special en ihasis on the highlands of Ethiopia with minor reference to rainfed agriculture.
It is part of a land evaluation methodology developed during Phase II of the Land Use Planning Project of the Land Use Planning and Regulatory Department. The method of assessing moisture availability and diagnostic land characteristics of features considered necessary for estimating and rating soil moisture availability viz. climate [decadal or monthly precipitation values (mm), decadal or monthly PET-values (mm)], soil [depth of topsoil and subsoil (cm), texture of topsoil and subsoil, bulk density of topsoil and subsoil (cj/cc), organic matter content of topsoil (%), permeability class of least permeable horizon, ground water table depth (cm), relative topographic situation], crops [crop-specific rooting depth (cm), crop coefficient Ko, available soil moisture depletion fraction (p) of crop] are outlined. Conclusions emanating from the discussions are also presented.
INTRODUCTIGN
With global and regional change in climatic pattern and a trend of grading towards drier conditions moisture availability most often becomes the most critical factor determining crop production. The mostly bimodal rainfall pattern in the Ethiopian highlands also shows considerable variation on the onset and duration of the rainy seasons thus causing substantial changes in cropping seasons and patterns over relatively short distances. Droughts usually occur at alarming frequencies with catastrophic consequences. Assessment and rating of moisture availability for land use planning purposes, therefore, become extremely essential in Ethiopia because soil moisture is perhaps the most inportant factor which limits crop growth and development.
Crops are affected by moisture availability through the effects of moisture stress on growth, and the possible death of the crop through drought.
Moisture stress occurs v^en soil water in the rooting zone falls sx±)Stantially below field capacity. Either vegetative growth may suffer or fruiting may be affected. The moisture level at which stress effects first become apparent varies considerably between crops, e.g. vegetables need relatively continuous wet soils, v^ereas cotton and sorghum can deplete soil water much further before stress effects occur.
The severity of the effects of moisture stress varies according to the development stage of the crop.
Moisture availability is affected by climate, soil, landforms and hydrology. The initial determinant is the ratio between rainfall and potential evapotranspiration. Climatically determined moisture deficiency is modified by soil moisture storage, being lower for sandy and/or shallow soils and higher for deep loams or well structured clays. Further modifications are caused by valley-floor situations receiving run-off, by seepage sites or by the presence of ground water within rooting range.
The purpose of this paper is to highlight the major features of the model for assessing of moisture availability v^ich involves calculation of crop specific LGP's based on available soil moisture and the rating of land quality: moisture availability for land use requirements.
- 24 -
1. ASSESSMENT OF MOISTURE AVAILABILITY
1.1 Soil Moisture Balance Model
The present assessment model for moisture availability determines the period at which moisture content in the soil is sufficient to permit crop growth. It gives a calculation of the moisture available to a specified crop (S^Q) under defined soil, climatic and hydrological conditions for each ten day period (decade) of the year.
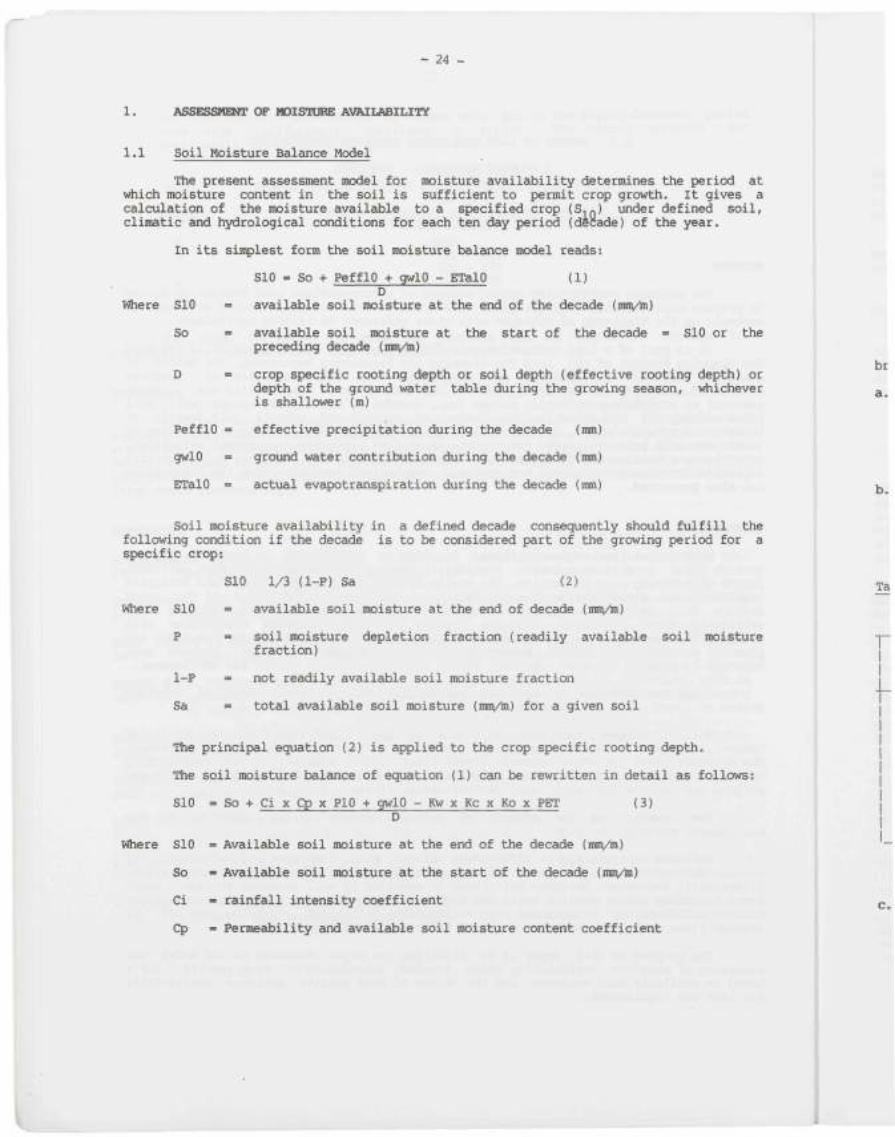
In its simplest form the soil moisture balance model reads:
SIO - So + PefflO + gwlO - ETalO (1) D
Where SlO = available soil moisture at the end of the decade (mm/m)
So = available soil moisture at the start of the decade = SlO or the preceding decade (mn\/m)
D = crop specific rooting depth or soil depth (effective rooting depth) or depth of the ground water table during the growing season, v^ichever is shallower (m)
PefflO = effective precipitation during the decade (mm)
gwlO = ground water contribution during the decade (mm)
ETalO = actual evapotranspiration during the decade (mm)
Soil moisture availability in a defined decade consequently should fulfill the following condition if the decade is to be considered part of the growing period for a specific crop:
SlO 1/3 (1-P) Sa (2)
Where SlO = available soil moisture at the end of decade (mnyta)
P • soil moisture depletion fraction (readily available soil moisture fraction)
1-P = not readily available soil moisture fraction
Sa = total available soil moisture (mnyln) for a given soil
The principal equation (2) is applied to the crop specific rooting depth.
The soil moisture balance of equation (1) can be rewritten in detail as follows:
SlO - So + Ci X Cp X PIO + gwlO - Kw x Kc x Ko x PET (3)
D
Where SlO = Available soil moisture at the end of the decade (mtty'm)
So - Available soil moisture at the start of the decade (mny'm)
Ci - rainfall intensity coefficient
Cp - Permeability and available soil moisture content coefficient

- 25 -
PlO •= Precipitation during the decade (mm)
gwlO = ground water contribution during the decade (mm)
Kw = restricted soil moisture supply coefficient
Kc = Crop coefficient
PET = Potential evapotranspiration during the decade (mm).
D = Crop-specific rooting depth or soil depth (effective rooting depth) or depth of ground water table during the growing season, whichever is shallower (m)
The determination of the various parameters of soil moisture balance model is briefly outlined below:
a. Effective decadal precipitation, mm (PlO) :
It is derived from monthly values by linear interpolation. In case of a deficient data base for monthly precipitation values, this data can be generated using a model developed within the Land Use Planning and Regulatory Department. Thus PlO is obtained either by measuring, generating or interpolation.
b. Grofund water contribution during the decade, mm (gwlO) :
Very detailed experiments are required to determine the ground water contribution under field conditions. Therefore in the moisture balance model a standardized contribution of 10 mm per decade is assumed, if the conditions in Table 1 are met.
Table 1 COMBINATION OF GROUND WATER - LEVEL AND TEXTURE CLASSES ENABLING STANDARDIZED GROUND WATER COWraiBUTION (10 mrn/decade) AT SPECIFIED ROOTING DEPTHS
Crop-specific rooting depth (cm)
any <50 <50
50 - 100 50 - 100 50 - 100 100 - 150 100 - 150 100 - 150
Ground water level (cm)
<50 50 - 100 100 - 150 50 - 100 100 - 150 150 - 300 50 - 100 100 - 150 150 - 300
Texture class
any finer than sand only sandy loam
any finer than sand only sandy loam
any any
finer than sand
In all other cases no ground water contribution is assumed.
c. Actual evapotranspiration during the decade, mm (ETalO)
The decadal potential evapotranspiration data is derived by linear interpolation from the monthly values. If the latter is scarce or deficient either rough estimates should be made or based on deficient data, more coitqplete data sets should be generated using a model developed within LUPRD.
- 26 -
d. Crop specific rooting depth, m (D)
The rooting depth from which crops extract moisture is considered as the soil depth or the depth of the ground water table during the growing season v^ichever is shallower.
e. Available soil moisture at the start of the decade, nnvln (So)
For the calculation of SIO of the first decade (SO) of the year, it has been arbitrarily defined as being equal to 0.2 cm since So is assumed to be 20% of the total available soil moisture.
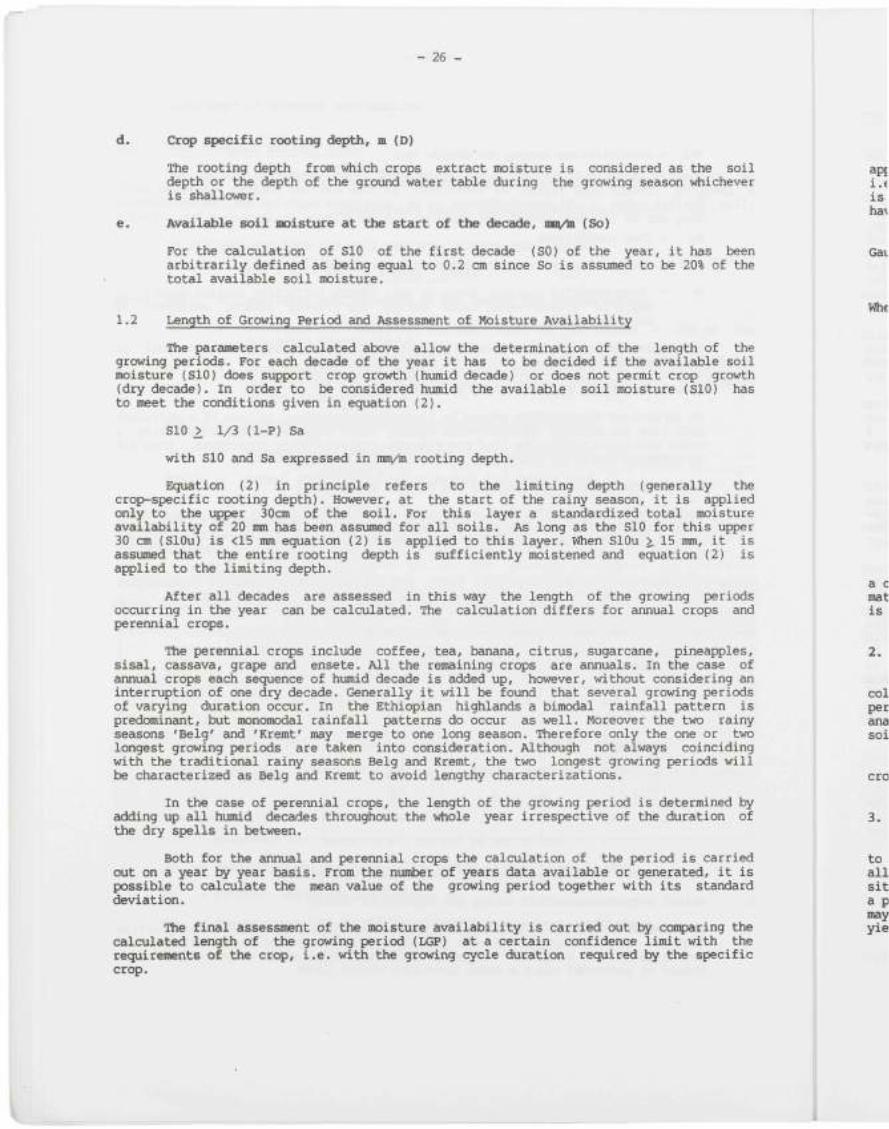
1.2 Length of Growing Period and Assessment of Moisture Availability
The parameters calculated above allow the determination of the length of the growing periods. For each decade of the year it has to be decided if the available soil moisture (SlO) does support crop growth (humid decade) or does not permit crop growth (dry decade). In order to be considered humid the available soil moisture (SIO) has to meet the conditions given in equation (2).
SIO > 1/3 (1-P) Sa
with SIO and Sa expressed in mm/m rooting depth.
Equation (2) in principle refers to the limiting depth (generally the crop-specific rooting depth). However, at the start of the rainy season, it is applied only to the upper 30cm of the soil. For this layer a standardized total moisture availability of 20 mm has been assumed for all soils. As long as the SIO for this upper 30 cm (SlOu) is <15 mm equation (2) is applied to this layer. When SlOu 15 mm, it is assumed that the entire rooting depth is sufficiently moistened and equation (2) is applied to the limiting depth.
After all decades are assessed in this way the length of the growing periods occurring in the year can be calculated. The calculation differs for annual crops and perennial crops.
The perennial crops include coffee, tea, banana, citrus, sugarcane, pineapples, sisal, cassava, grape and ensete. All the remaining crops are annuals. In the case of annual crops each sequence of humid decade is added up, however, without considering an interruption of one dry decade. Generally it will be foiond that several growing periods of varying duration occur. In the Ethiopian highlands a bimodal rainfall pattern is predominant, but monomodal rainfall patterns do occur as well. Moreover the two rainy seasons 'Belg' and 'Kremt' may merge to one long season. Therefore only the one or two longest growing periods are taken into consideration. Although not always coinciding with the traditional rainy seasons Belg and Kremt, the two longest growing periods will be characterized as Belg and Kremt to avoid lengthy characterizations.
In the case of perennial crops, the length of the growing period is determined by adding up all himiid decades throughout the v^ole year irrespective of the duration of the dry spells in between.
Both for the annual and perennial crops the calculation of the period is carried out on a year by year basis. From the number of years data available or generated, it is possible to calculate the mean value of the growing period together with its standard deviation.
The final assessment of the moisture availability is carried out by conparing the calculated length of the growing period (LGP) at a certain confidence limit with the requirements of the crop, i.e. with the growing cycle duration required by the specific crop.
- 27 -
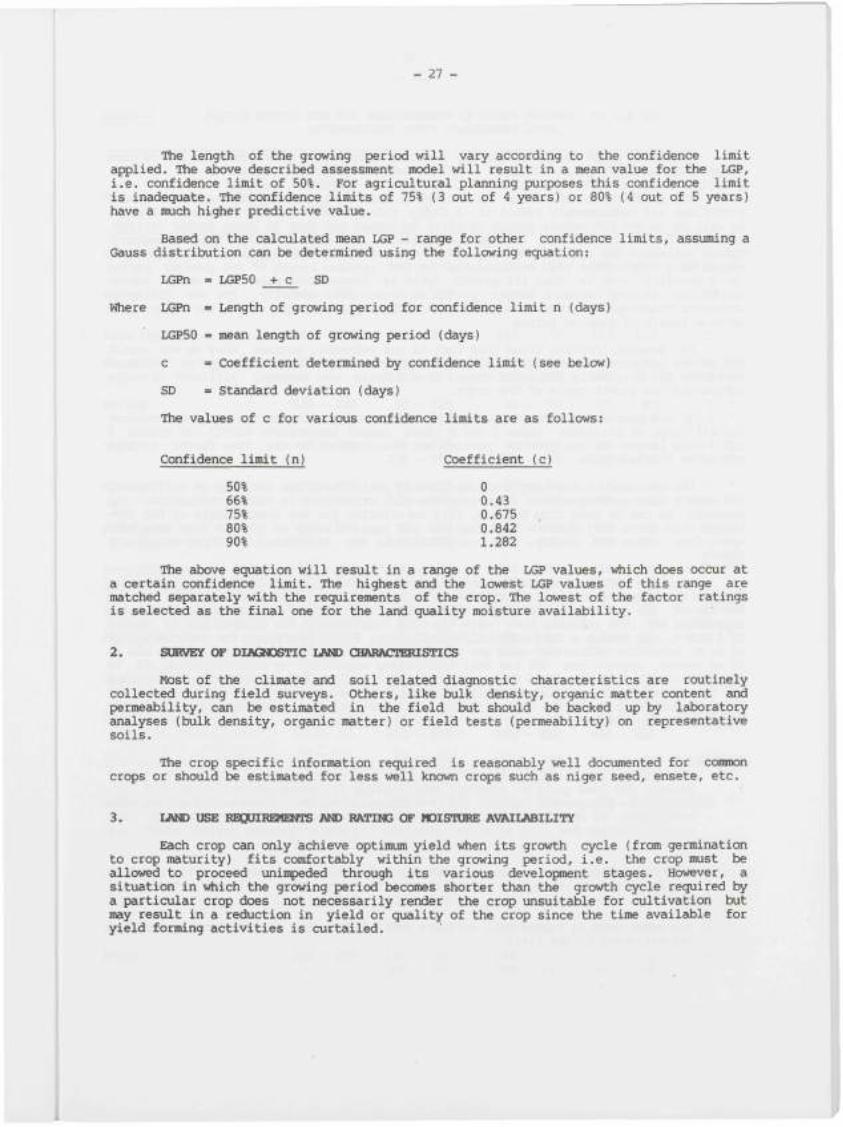
The length of the growing period will vary according to the confidence limit applied. The above described assessment model will result in a mean value for the LGP, i.e. confidence limit of 50%. For agricultural pleinning purposes this confidence limit is inadequate. The confidence limits of 75% (3 out of 4 years) or 80% (4 out of 5 years) have a much higher predictive value.
Based on the calculated mean LGP - range for other confidence limits, assuming a Gauss distribution can be determined using the following equation:
LGPn - LGP50 + c SD
Where LGPn = Length of growing period for confidence limit n (days)
LGP50 = mean length of growing period (days)
c = Coefficient determined by confidence limit (see below)
SD = Standard deviation (days)
The values of c for various confidence limits are as follows:
Confidence limit (n) Coefficient (c)
50% 0 66% 0.43 75% 0.675 80% 0.842 90% 1.282
The above equation will result in a range of the LGP values, vrfiich does occur at a certain confidence limit. The highest and the lowest LGP values of this range are matched separately with the requirements of the crop. The lowest of the factor ratings is selected as the final one for the land quality moisture availability.
2. SURVEY OF DIAGNOSTIC LAND CHARACTERISTICS
Most of the climate and soil related diagnostic characteristics are routinely collected during field surveys. Others, like bulk density, organic matter content and permeability, can be estimated in the field but should be backed up by laboratory analyses (bulk density, organic matter) or field tests (permeability) on representative soils.
The crop specific information required is reasonably well documented for common crops or should be estimated for less well known crops such as niger seed, ensete, etc.
3. LAND USE RBQUIRQIENTS AND RATING OF MOISTURE AVAILABILITY
Each crop can only achieve optimum yield v^en its growth cycle (from germination to crop maturity) fits comfortably within the growing period, i.e. the crop must be allowed to proceed unin jeded through its various development stages. However, a situation in vAiich the growing period becomes shorter than the growth cycle required by a particular crop does not necessarily render the crop unsuitable for cultivation but may result in a reduction in yield or quality of the crop since the time available for yield forming activities is curtailed.
- 28 -
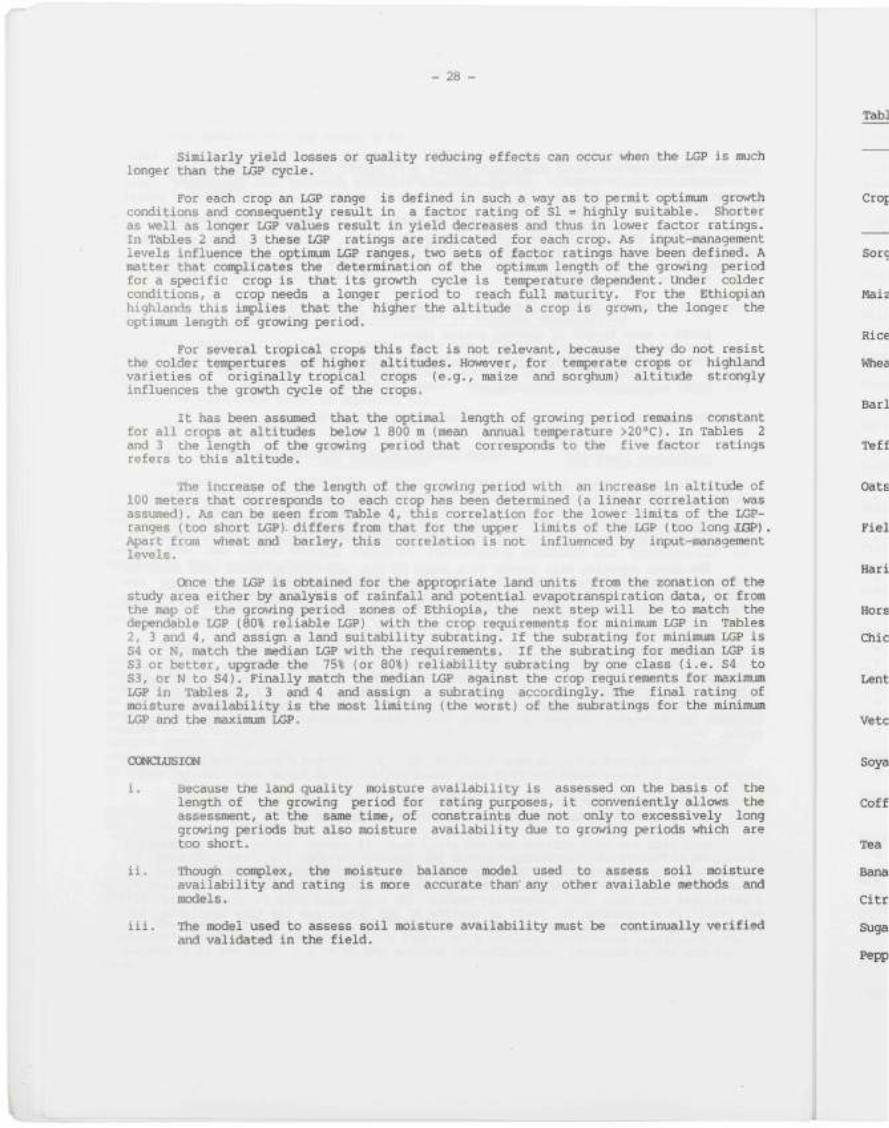
Similarly yield losses or quality reducing effects can occur when the LGP is much longer than the LGP cycle.
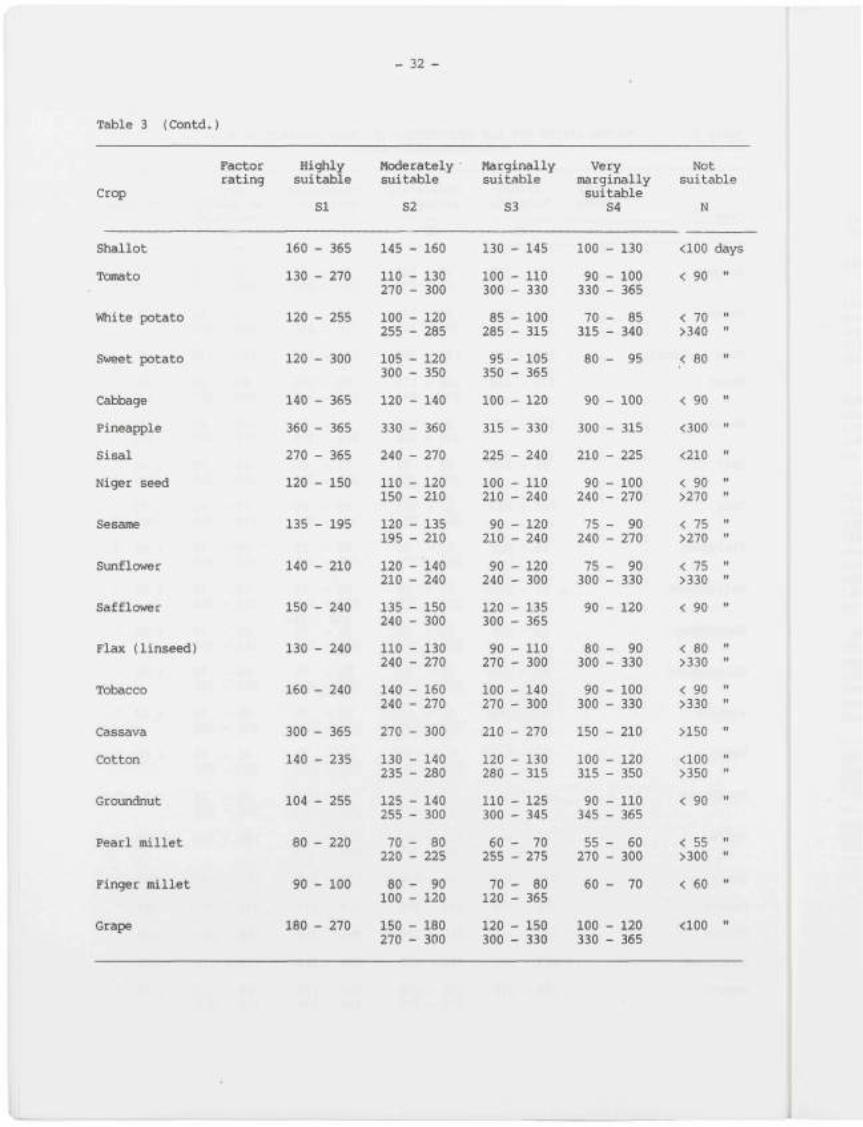
For each crop an LGP range is defined in such a way as to permit optimum growth conditions and consequently result in a factor rating of Si = highly suitable. Shorter as well as longer LGP values result in yield decreases and thus in lower factor ratings. In Tables 2 and 3 these LGP ratings are indicated for each crop. As input-management levels influence the optimum LGP ranges, two sets of factor ratings have been defined. A matter that complicates the determination of the optimum length of the growing period for a specific crop is that its growth cycle is ten jerature dependent. Under colder conditions, a crop needs a longer period to reach full maturity. For the Ethiopian highlands this iit jlies that the higher the altitude a crop is grown, the longer the optimum length of growing period.
For several tropical crops this fact is not relevant, because they do not resist the colder tenï)ertures of higher altitudes. However, for temperate crops or highland varieties of originally tropical crops (e.g., maize and sorghum) altitude strongly influences the growth cycle of the crops.
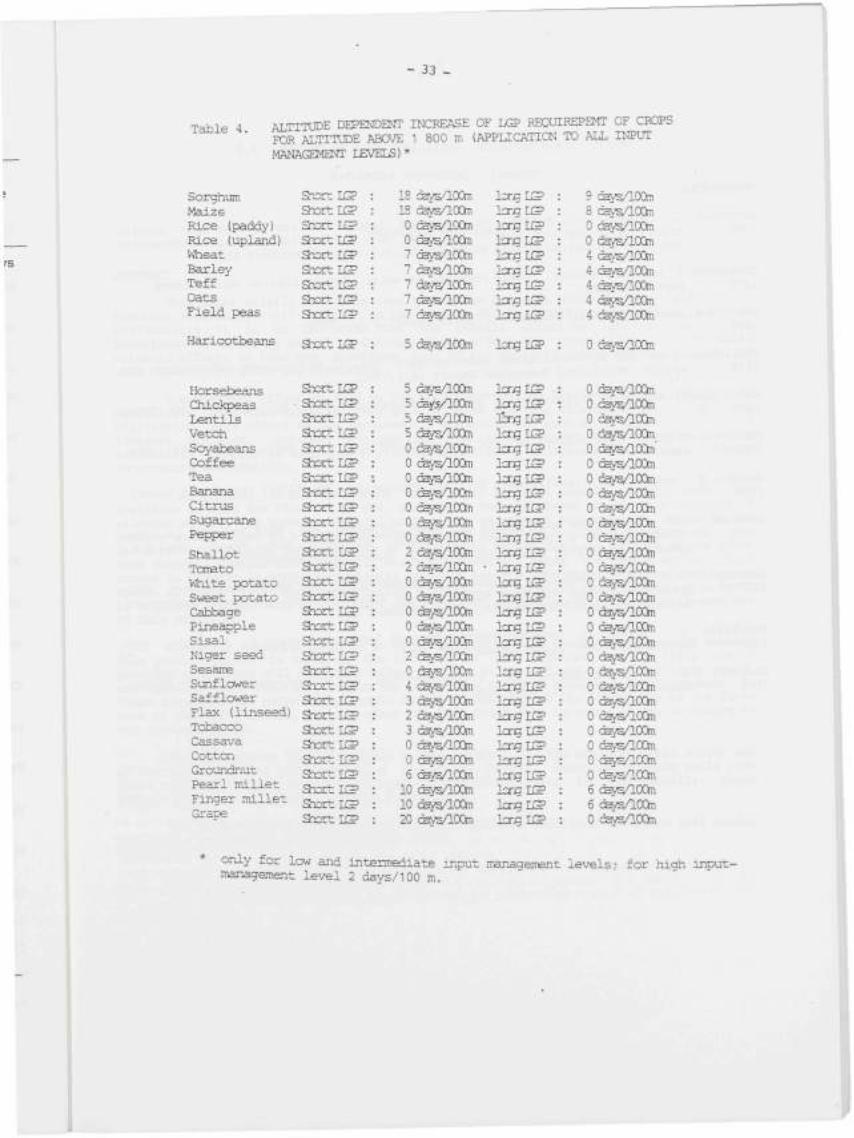
It has been assxiraed that the optimal length of growing period remains constant for all crops at altitudes below 1 800 m (mean annual temperature >20°C). In Tables 2 and 3 the length of the growing period that corresponds to the five factor ratings refers to this altitude.
The increase of the length of the growing period with an increase in altitude of 100 meters that corresponds to each crop has been determined (a linear correlation was assumed). As can be seen from Table 4, this correlation for the lower limits of the LGP-ranges (too short LGP). differs from that for the upper limits of the LGP (too long IJ3£>) . i^rt from vdieat and barley, this correlation is not influenced by input-management levels.
Once the LGP is obtained for the appropriate land units from the zonation of the study area either by analysis of rainfall and potential evapotranspiration data, or from the map of the growing period zones of Ethiopia, the next step will be to match the dependable LGP (80% reliable LGP) with the crop requirements for minimum LGP in Tables 2, 3 and 4, and assign a land suitability subrating. If the subrating for minimum LGP is S4 or N, match the median LGP with the requirements. If the subrating for median LGP is S3 or better, upgrade the 75% (or 80%) reliability subrating by one class (i.e. S4 to S3, or N to S4). Finally match the median LGP against the crop requirements for maximum LGP in Tables 2, 3 and 4 and assign a si±»rating accordingly. The final rating of moisture availability is the most limiting (the worst) of the subratings for the minimum LGP and the maximum LGP.
CONCLUSION
i. Because the land quality moisture availability is assessed on the basis of the length of the growing period for rating purposes, it conveniently allows the assessment, at the same time, of constraints due not only to excessively long growing periods but also moisture availability due to growing periods vrtiich are too short.
ii. Though complex, the moisture balance model used to assess soil moisture availability and rating is more accurate than' any other available methods and models.
iii. The model used to assess soil moisture availability must be continually verified and validated in the field.
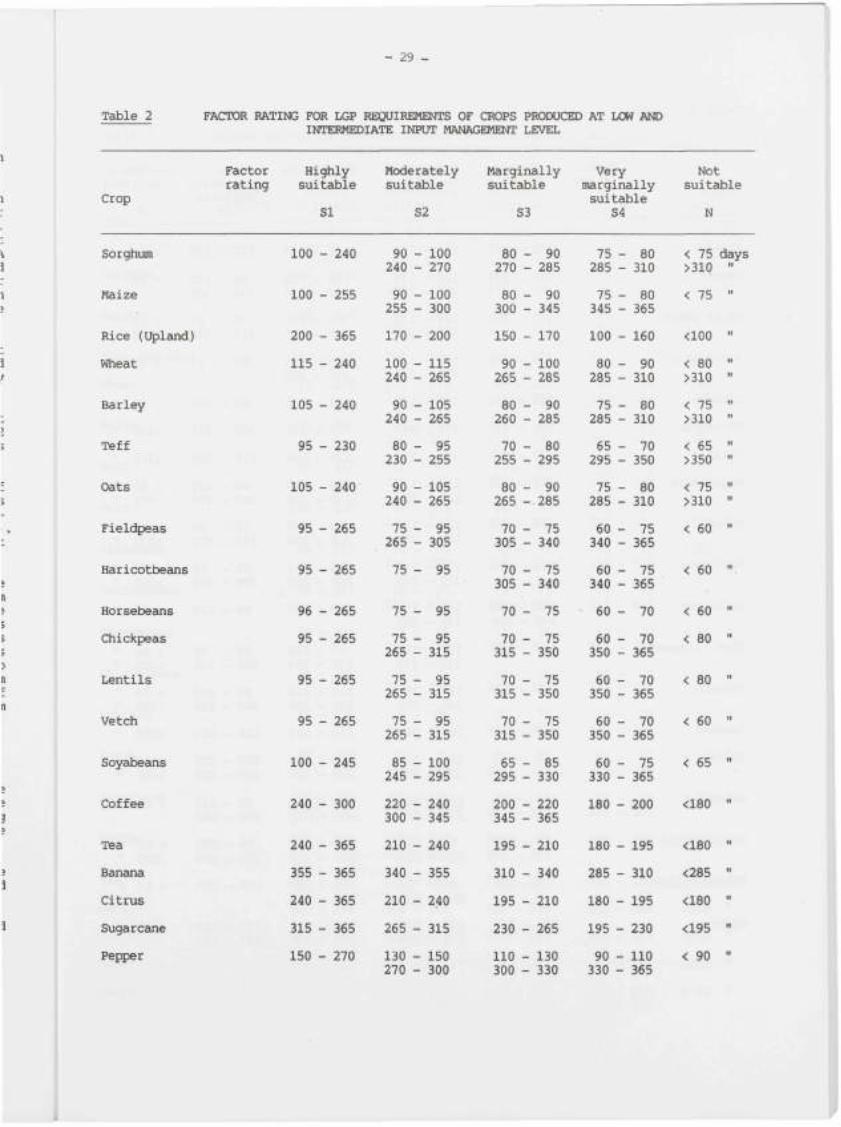
- 29 -
Table 2 FACTOR RATING FOR LGP REQUIREMENTS OF CROPS PRODUCED AT LOW AND INTERMEDIATE INPUT MANAGEMENT LEVEL
Factor Highly Moderately Marginally Very Not rating suitable suitable suitable marginally suitable
Crop suitable SI S2 S3 S4 N
Sorghum
Maize
Rice (Upland)
Wheat
Barley
Teff
Oats
Fieldpeas
Haricotbeans
Horsebeans
Chickpeas
Lentils
Vetch
Soyabeans
Coffee
Tea
Banana
Citrus
Sugarcane
Pepper
100 -
100 -
200 -
115 -
105 -
95 -
105 -
95 -
95 -
96 -
95 -
95 -
95 -
100 -
240 -
240 -
355 -
240 -
315 -
150 -
240
255
365
240
240
230
240
265
265
265
265
265
265
245
300
365
365
365
365
270
90 -240 -
90 -255 -
170 -
100 -240 -
90 -240 -
80 -230 -
90 -240 -
75 -265 -
75 -
75 -
75 -265 -
75 -265 -
75 -265 -
85 -245 -
220 -300 -
210 -
340 -
210 -
265 -
130 -270 -
100 270
100 300
200
115 265
105 265
95 255
105 265
95 305
95
95
95 315
95 315
95 315
100 295
240 345
240
355
240
315
150 300
80 -270 -
80 -300 -
150 -
90 -265 -
80 -260 -
70 -255 -
80 -265 -
70 -305 -
70 -305 -
70 -
70 -315 -
70 -315 -
70 -315 -
65 -295 -
200 -345 -
195 -
310 -
195 -
230 -
110 -300 -
90 285
90 345
170
100 285
90 285
80 295
90 .285
75 340
75 340
75
75 350
75 350
75 350
85 330
220 365
210
340
210
265
130 330
75 -285 -
75 -345 -
100 -
80 -285 -
75 -285 -
65 -295 -
75 -285 -
60 -340 -
60 -340 -
60 -
60 -350 -
60 -350 -
60 -350 -
60 -330 -
180 -
180 -
285 -
180 -
195 -
90 -330 -
80 310
80 365
160
90 310
80 310
70 350
80 310
75 365
75 365
70
70 365
70 365
70 365
75 365
200
195
310
195
230
110 365
< 75 >310
< 75
<100
< 80 >310
< 75 >310
< 65 >350
< 75 >310
< 60
< 60
< 60
< 80
< 80
< 60
< 65
<180
<180
<285
<180
<195
< 90
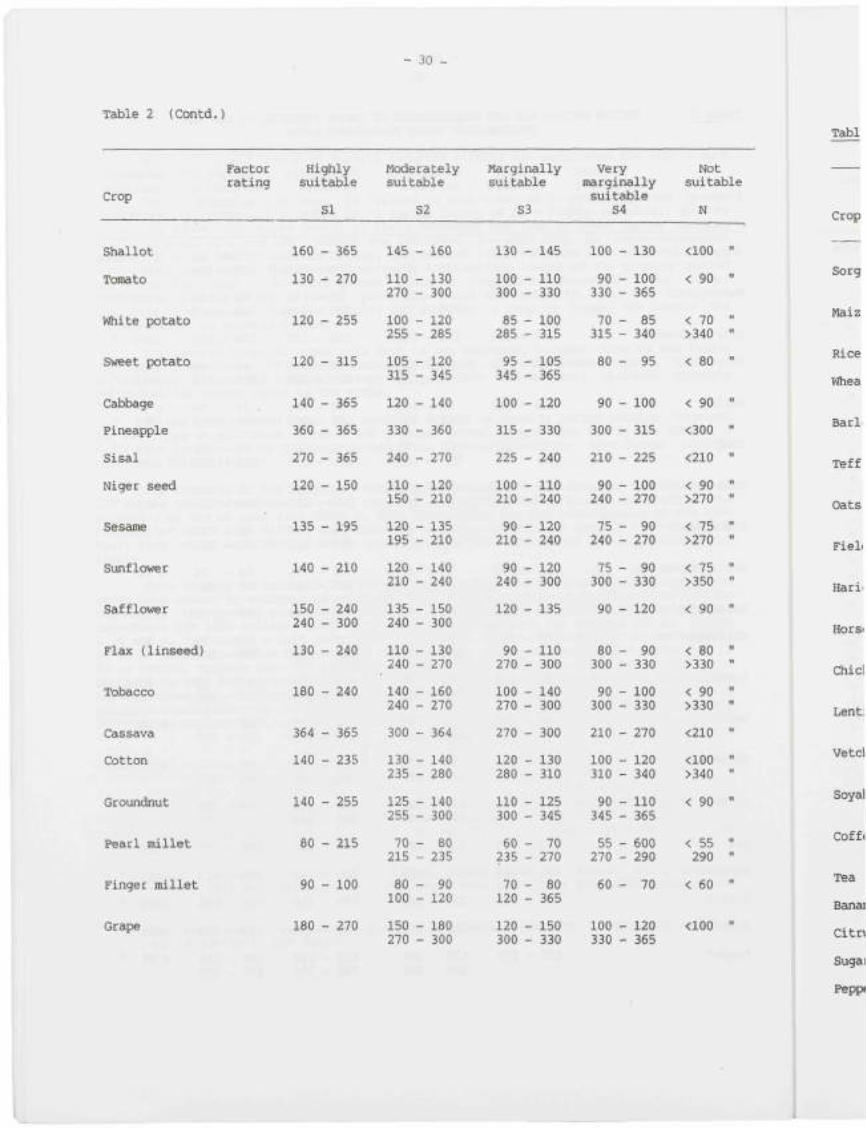
Table 2 (Contd.)
- 30 -
Factor Highly rating suitable
Crop SI
Shallot
Tomato
White potato
Sweet potato
Cabbage
Pineapple
Sisal
Niger seed
Sesame
Sunflower
Safflower
Flax (linseed)
Tobacco
Cassava
Cotton
Groundnut
Pearl millet
Finger millet
Grape
160 - 365
130 - 270
120 - 255
120 - 315
140 - 365
360 - 365
270 - 365
120 - 150
135 - 195
140 - 210
150 - 240 240 - 300
130 - 240
180 - 240
364 - 365
140 - 235
140 - 255
80 - 215
90 - 100
180 - 270
Moderately suitable
S2
145
110 270
100 255
105 315
120
330
240
110 150
120 195
120 210
135 240
110 240
140 240
300
130 235
125 255
70 215
80 100
150 270
- 160
- 130 - 300
- 120 - 285
- 120 - 345
- 140
- 360
- 270
- 120 - 210
- 135 - 210
- 140 - 240
- 150 - 300
- 130 - 270
- 160 - 270
- 364
- 140 - 280
- 140 - 300
- 80 - 235
- 90 - 120
- 180 - 300
Marginally suitable
S3
130 -
100 -300 -
85 -285 -
95 -345 -
100 -
315 -
225 -
100 -210 -
90 -210 -
90 -240 -
120 -
90 -270 -
100 -270 -
270 -
120 -280 -
110 -300 -
60 -235 -
70 -120 -
120 -300 -
145
110 330
100 315
105 365
120
330
240
110 240
120 240
120 300
135
110 300
140 300
300
130 310
125 345
70 270
80 365
150 330
Very marginally suitable
S4
100 -
90 -330 -
70 -315 -
80 -
90 -
300 -
210 -
90 -240 -
75 -240 -
75 -300 -
90 -
80 -300 -
90 -300 -
210 -
100 -310 -
90 -345 -
55 -270 -
60 -
100 -330 -
130
100 365
85 340
95
100
315
225
100 270
90 270
90 330
120
90 330
100 330
270
120 340
110 365
600 290
70
120 365
Not suitable
N
<100 "
< 90 "
< 70 " >340 "
< 80 "
< 90 "
<300 "
<210 "
< 90 " >270 "
< 75 " >270 "
< 75 " >350 "
< 90 "
< 80 " >330 "
< 90 " >330 "
<210 "
<100 " >340 "
< 90 "
< 55 " 290 "
< 60 "
<100 "
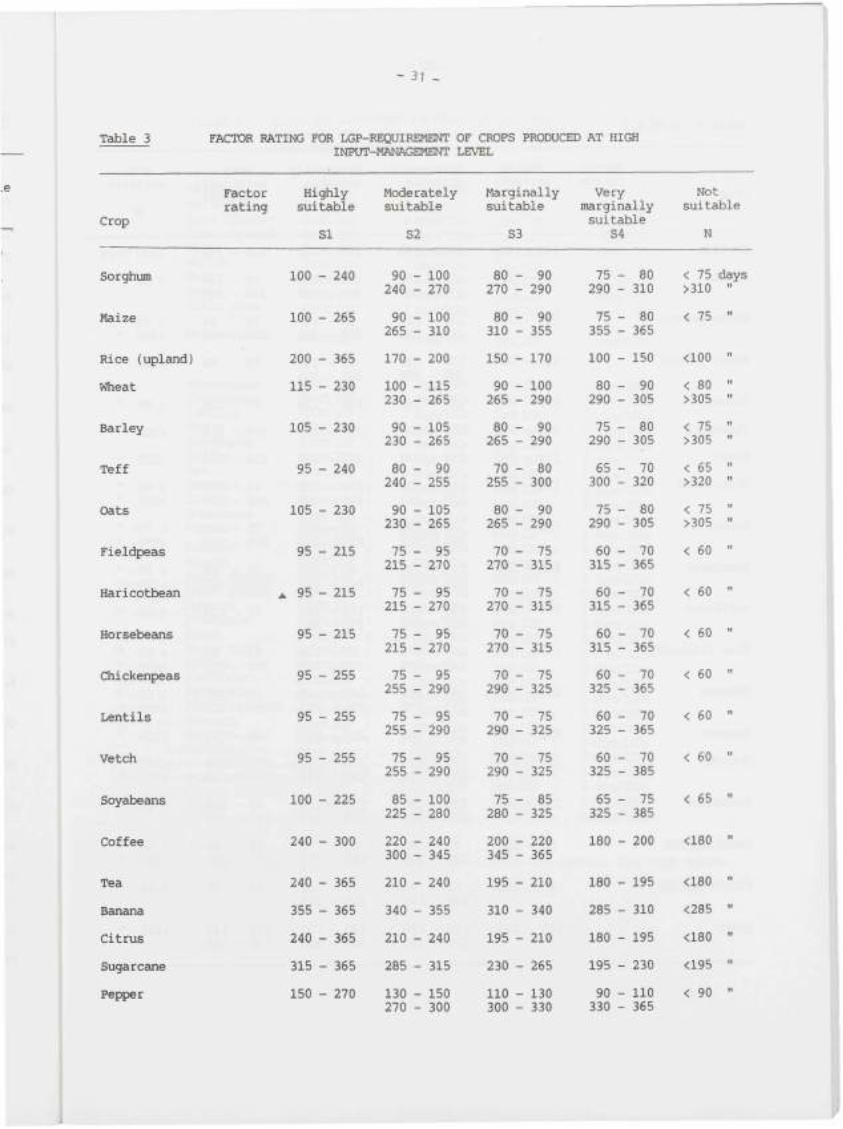
~ 31 _
Table 3 FACTOR RATING FOR LGP-REQUIREMENT OF CROPS PRODUCED AT HIGH INPUT-MANAGEMENT LEVEL
Factor Highly Moderately Marginally Very Not rating suitable suitable suitable marginally suitable
Crop suitable SI S2 S3 S4 N
Sorghum
Maize
Rice (upland)
Wheat
Barley
Teff
Oats
Fieldpeas
Haricotbean
Horsebeans
Chickenpeas
Lentils
Vetch
Soyabeans
Coffee
Tea
Banana
Citrus
Sugarcane
Pepper
100 -
100 -
200 -
115 -
105 -
95 -
105 -
95 -
A 95 -
95 -
95 -
95 -
95 -
100 -
240 -
240 -
355 -
240 -
315 -
150 -
240
265
365
230
230
240
230
215
215
215
255
255
255
225
300
365
365
365
365
270
90 -240 -
90 -265 -
170 -
100 -230 -
90 -230 -
80 -240 -
90 -230 -
75 -215 -
75 -215 -
75 -215 -
75 -255 -
75 -255 -
75 -255 -
85 -225 -
220 -300 -
210 -
340 -
210 -
285 -
130 -270 -
100 270
100 310
200
115 265
105 265
90 255
105 265
95 270
95 270
95 270
95 290
95 290
95 290
100 280
240 345
240
355
240
315
150 300
80 -270 -
80 -310 -
150 -
90 -265 -
80 -265 -
70 -255 -
80 -265 -
70 -270 -
70 -270 -
70 -270 -
70 -290 -
70 -290 -
70 -290 -
75 -280 -
200 -345 -
195 -
310 -
195 -
230 -
110 -300 -
90 290
90 355
170
100 290
90 290
80 300
90 290
75 315
75 315
75 315
75 325
75 325
75 325
85 325
220 365
210
340
210
265
130 330
75 -290 -
75 -355 -
100 -
80 -290 -
75 -290 -
65 -300 -
75 -290 -
60 -315 -
60 -315 -
60 -315 -
60 -325 -
60 -325 -
60 -325 -
65 -325 -
180 -
180 -
285 -
180 -
195 -
90 -330 -
80 310
80 365
150
90 305
80 305
70 320
80 305
70 365
70 365
70 365
70 365
70 365
70 385
75 385
200
195
310
195
230
110 365
< 75 >310
< 75
<100
< 80 >305
< 75 >305
< 65 >320
< 75 >305
< 60
< 60
< 60
< 60
< 60
< 60
< 65
<180
<180
<285
<180
<195
< 90
- 32 -
Table 3 (Contd.)
Factor Highly rating suitable
Crop SI
Shallot
Tomato
White potato
Sweet potato
Cabbage
Pineapple
Sisal
Niger seed
Sesame
Sunflower
Safflower
Flax (linseed)
Tobacco
Cassava
Cotton
Grovindnut
Pearl millet
Finger millet
Grape
160 - 365
130 - 270
120 - 255
120 - 300
140 - 365
360 - 365
270 - 365
120 - 150
135 - 195
140 - 210
150 - 240
130 - 240
160 - 240
300 - 365
140 - 235
104 - 255
80 - 220
90 - 100
180 - 270
Moderately suitable
S2
145 -
110 -270 -
100 -255 -
105 -300 -
120 -
330 -
240 -
110 -150 -
120 -195 -
120 -210 -
135 -240 -
110 -240 -
140 -240 -
270 -
130 -235 -
125 -255 -
70 -220 -
80 -100 -
150 -270 -
160
130 300
120 285
120 350
140
360
270
120 210
135 210
140 240
150 300
130 270
160 270
300
140 280
140 300
80 225
90 120
180 300
Marginally suitable
S3
130 -
100 -300 -
85 -285 -
95 -350 -
100 -
315 -
225 -
100 -210 -
90 -210 -
90 -240 -
120 -300 -
90 -270 -
100 -270 -
210 -
120 -280 -
110 -300 -
60 -255 -
70 -120 -
120 -300 -
145
110 330
100 315
105 365
120
330
240
110 240
120 240
120 300
135 365
110 300
140 300
270
130 315
125 345
70 275
80 365
150 330
Very marginally suitable
S4
100
90 330
70 315
80
90
300
210
90 240
75 240
75 300
90
80 300
90 300
150
100 315
90 345
55 270
60
100 330
- 130
- 100 - 365
- 85 - 340
- 95
- 100
- 315
- 225
- 100 - 270
- 90 - 270
- 90 - 330
- 120
- 90 - 330
- 100 - 330
- 210
- 120 - 350
- 110 - 365
- 60 - 300
- 70
- 120 - 365
Not suitable
N
<100 days
< 90 "
< 70 " >340 "
< 80 "
< 90 "
<300 "
<210 "
< 90 " >270 "
< 75 " >270 "
< 75 " >330 "
< 90 "
< 80 " >330 "
< 90 " >330 "
>150 "
<100 " >350 "
< 90 "
< 55 " >300 "
< 60 "
<100 "
~ 33 ~
ALTITUDE DEPENDENT INCREASE OF LGP REQUIREPEMT CF CROPS FOR ALTITUDE ABOVE 1 800 m (APPLICATION TO ALL INPUT MANAGEMENT LEVELS)*
Sorghum Ma i ze Rice (paddy) Rice (upland) VÖieat Bar ley Teff Oats F i e l d peas
Har ico tbeans
2Ton;TP5 axirtTP^ Short rr^» ScortJCP Short rrp Snort Tf a ^ r t T f ^ S io r tTP ' Short rpo
a ^ r t TfP
IS cs^^lOOn 18 cs's/lCCm 0 (3yg/100m 0 d^'5/lOCtn 7 c^'s^OOm 7 CTy'5/lOCm 7 cd/s/lCCm 1 c^^/lO&n 7 c ^ ^ O Q n
5 (sy^/lOOm
lo-igTf^ la-gTr= Icrg ,T(^ lacq](^ IcrjgTfP Icng rr= lcngTP= lo-ig r r? l c rg r r=
longrr^o
9 day^OCïn 8 c^'^OOn 0 c^'^OOm 0 c^^lOOn 4 rav^/lOCni 4 cs/:^CCm 4 cèy^OOm 4 (^'^/KXm 4 c^'s^OOm
0 (sy^OOn
Horsebeans Chickpea'^ L e n t i l s Vetch Soyabeans Coffee T e a Banana C i t r u s Sugarcane Pepper S h a l l o t Tomato White p o t a t o Sweet p o t a t o Cabbage P ineapple S i s a l Niger seed Sesaire Sunflower Safflower F lax ( l inseed) Tobacco Cassava Cotton Groundnut Pea r l m i l l e t F inger m i l l e t Grape
Short Tn= • a r i r t r rp :
ax)rtK5> 3xxtJC^ S ü r t T f ? • a r ) r t T ( ? S n r t rP= Short rP= a r j r t r r p Siort TP= STortTP^ ax)rtTP3 2x)rtrr=> 2:iDrtIS> a r j r t r r p a ior t i rp • a n r t r p p Short Tf ar jr tTPP S o r t yf=^ Short US' aiortTf^ 2x)r tTr= Short Tr== S ü r t T f ^ S ü r t TP3 a r ) r t ] I = ax)r t Tr= a ^ r t r p ^ Sxjrt r r^
5 csys/lOCm 5 csjVlOQn 5 c ^ ^ O Q n 5 (iyg/lOQn 0 c ^ ^ O Q n 0 c^^OQm 0 d^-i^QCtii 0 (^^OOm 0 c^y^/ioan 0 c^^OOm 0 d^/lOQm 2 csyg/lOCm 2 d^^lOQn 0 c^'s^OOm 0 c^^OQm 0 csys/lOOm 0 (^^OCm 0 ( ^ ^ O Q n 2 cfeysACCm 0 (^(^OOm 4 c ^ ^ O O n 3 (^^OQm 2 (^'s/lOCm 3 c^^(X)m 0 (^"s/lOQn 0 c^'^OOm 6 cfe^^CXhi
10 cÈy^OOn : 10 c^^lCOn
20 (^i'5/lOCm
IcTigff? IcTQTr? • HbrqUS IcrgTf^ Icr/grr? IcngrrP I c r g r r ^ IcngTfP I r g T P a I c r g l S Icngrr^ Icng rf^ IcngrrP I c n g l C IcTigrr» IcrgTP^ Icr/gTf^ lcrgTP= I x g r r ? Icrg tC? IcngTfP Icrg TP= IcngTifP Icrgrf^ ^krQ^CP larqJCP IcrgTf^ IcngTP;' la-gTfP I c r g K ?
0 cfek^lCQn 0 c^^lOOm 0 cssTs/VXïn 0 (^ ' :^Oan 0 c^^iocm' 0 cfey^O(>n 0 c^^lOCfn 0 csysAOQm 0 dHy /lOCtn 0 c^-^OCm Oda^lOQii 0 ci '5/lOOm 0 csy^OCm 0 ray^OCm 0 da^is/lCün 0 cBV /lOOn 0 c^^ /lOCm 0 csyg/lOOm 0 c^vlOGn
: 0 csys/lOOm 0 csfs/lQQcn
: 0 csy^OOn 0 d^'^OChi
: 0 csy^lOCm : 0 csTs/lQChi : 0 csy^/lOQm : 0 d^^/lOChi : 6 CT^s/lCX^n : 6 cSi'S/lCCtn : 0 (3y=/l(Xhi
only for low and intermediate input managerrent levels; for high inout-management level 2 days/100 m.
- 34 -
BEFERENCES
Bechtold, G. Manual for spatial, computerized land evaluation system with special 1988 reference to the Highlands of Ethiopia, Vol. 3 GILES (Geographical Information
and Land Evaluation System AG:DP/ETH/82.010), Field Document 25.
Doorenbos J. and A.M. Kassam. Yield response to water, FAO Irrigation and Drainage 1979 Paper 33, Rome.
FAO. A framework for land evaluation. Soils Bulletin 32, Rome. 1976
FAO. Report on the Agro-ecological zones project Vol. 1, Methodology and Results for 1978 Africa. World Soil Resources Report 48/1, FAO.
FAO. Guidelines: Land Evaluation for Rainfed Agriculture. Soils Bulletin 52, FAO, Rome. 1983
FAO. Guidelines: Land Evaluation for Irrigated Agriculture. Soils Bulletin 55, FAO, 1985 Rome.
Goebel, W. Analysis of climatic data for land evaluation. ETH/82/011 Consultant report. 1986
Greacen, E.L. Mechanisms and models of water transfer. In: Soil Factors in Crop Production in a Semi-Arid Environment, edited by J.D. Russel and E.H. Greacen. University of Queensland Press. Queensland, Australia.
Konstapel, CD. and G. Bechtold. Manual on a conputerized land evaluation system with 1987 special reference to the Highlands of Ethiopia, Vol. 1 Land Evaluation
Methodology, AG:DP/ETH/82/010, Field Document 16.
Radcliffe, J. Manual on reconnaissance physical land evaluation in Ethiopia. FAO 1987 AG:DP/ETH/87/006, Field Document No. 35.
Ridgway, R.B. Land evaluation. Part 1, Introduction and Procedures. AGQA:ETH/78/003 1983 Technical Report 5.1, FAO, Rome.
- 35 -
6.4 BATING OF LAND QUM.ITIES: MOISTURE AVAILABILITY
A CXXJNTRY APPRAISAL - LESOHiO
by
Habofanoe Makhooane
ABSTRACT
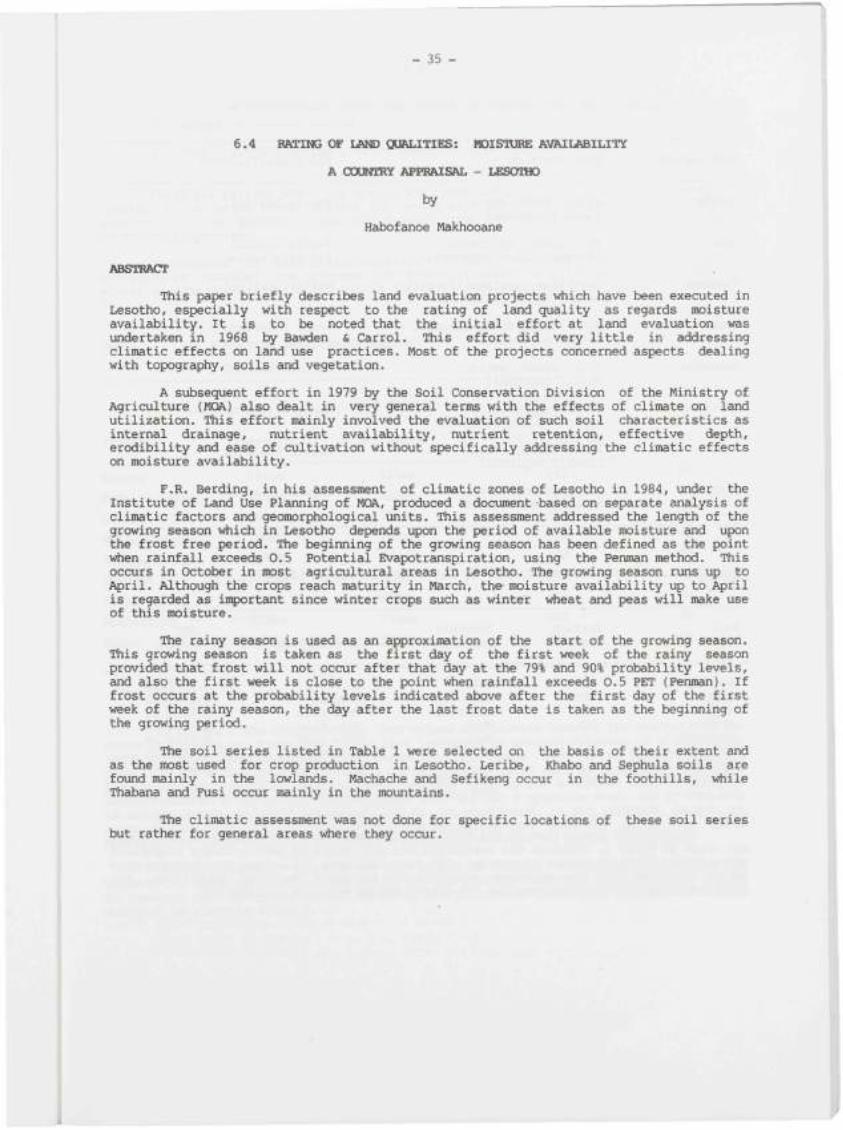
This paper briefly describes land evaluation projects v^ich have been executed in Lesotho, especially with respect to the rating of land quality as regards moisture availability. It is to be noted that the initial effort at land evaluation was undertaken in 1968 by Bawden & Carrol. This effort did very little in addressing climatic effects on land use practices. Most of the projects concerned aspects dealing with topography, soils and vegetation,
A subsequent effort in 1979 by the Soil Conservation Division of the Ministry of Agriculture (MQA) also dealt in very general terms with the effects of climate on land utilization. This effort mainly involved the evaluation of such soil characteristics as internal drainage, nutrient availability, nutrient retention, effective depth, erodibility and ease of cultivation without specifically addressing the climatic effects on moisture availability.
F.R. Berding, in his assessment of climatic zones of Lesotho in 1984, under the Institute of Land Use Planning of MQA, produced a document based on separate analysis of climatic factors and geomorphological units. This assessment addressed the length of the growing season v^ich in Lesotho depends upon the period of available moisture and upon the frost free period. The beginning of the growing season has been defined as the point v^en rainfall exceeds 0.5 Potential Evapotranspiration, using the Penman method. This occurs in October in most agricultural areas in Lesotho. The growing season runs up to i^ril. Although the crops reach maturity in March, the moisture availability up to i^ril is regarded as inportant since winter crops such as winter v^eat and peas will make use of this moisture.
The rainy season is used as an approximation of the start of the growing season. This growing season is taken as the first day of the first week of the rainy season provided that frost will not occur after that day at the 79% and 90% probability levels, and also the first week is close to the point \^en rainfall exceeds 0.5 PET (Penman). If frost occurs at the probability levels indicated above after the first day of the first week of the rainy season, the day after the last frost date is taken as the beginning of the growing period.
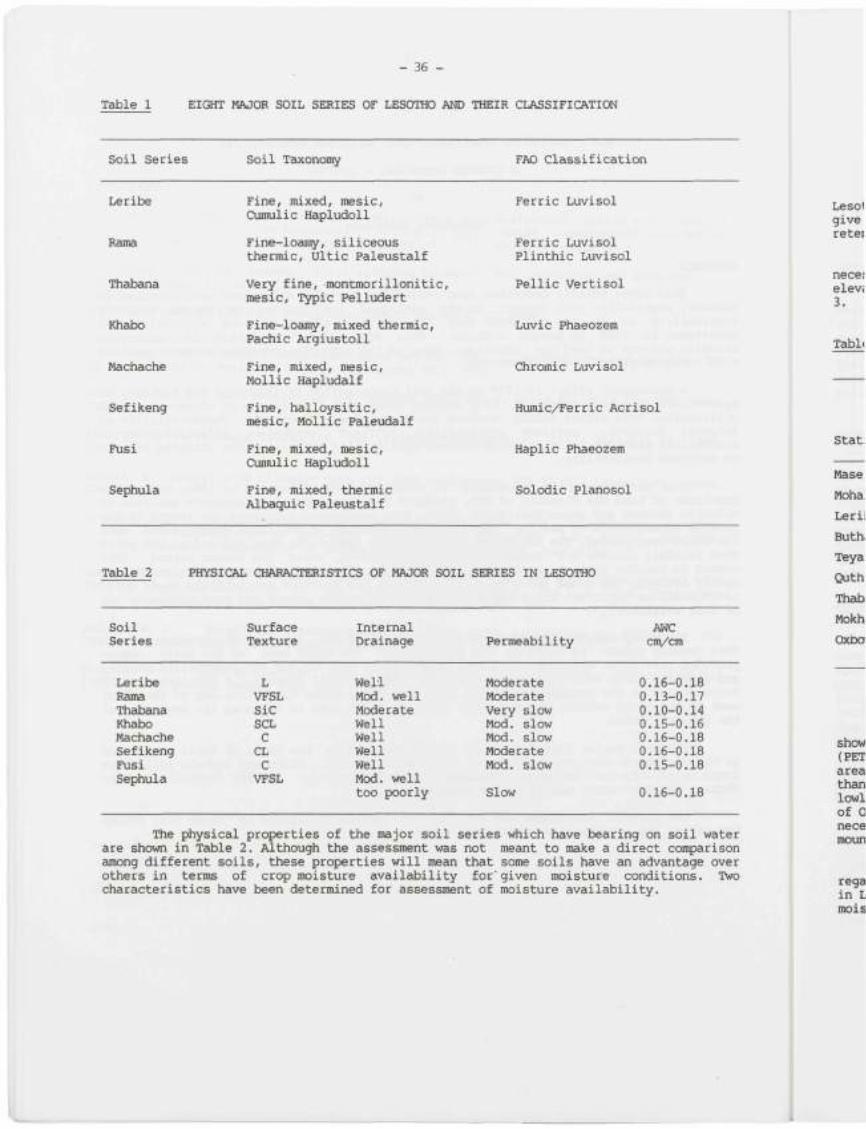
The soil series listed in Table 1 were selected on the basis of their extent and as the most used for crop production in Lesotho. Leribe, Khabo and Sephula soils are found mainly in the lowlands. Machache and Sefikeng occur in the foothills, vrtiile Thabana and Fusi occur mainly in the moxmtains.
The climatic assessment was not done for specific locations of these soil series but rather for general areas vAiere they occur.
- 36 -
Table 1 EIGHT MAJOR SOIL SERIES OF LESOTHO AND THEIR CLASSIFICATION
Soil Series Soil Taxonomy FAO Classification
Leribe
Rama
Thabana
Khabo
Machache
Sefikeng
Fusi
Sephula
Fine, mixed, mesic. Cumulic Hapludoll
Fine-loaiiy, siliceous thermic, Ultic Paleustalf
Very fine, -moncmorillonitic, mesic, Typic Pelludert
Fine-loamy, mixed thermic, Pachic Argiustoll
Fine, mixed, mesic, Mollic Hapludalf
Fine, halloysitic, mesic, Mollic Paleudalf
Fine, mixed, mesic. Cumulic Hapludoll
Fine, mixed, thermic Albaquic Paleustalf
Ferric Luvisol
Ferric Luvisol Plinthic Luvisol
Pellic Vertisol
Luvic Phaeozem
Chromic Luvisol
Humic/Ferric Acrisol
Haplic Phaeozem
Solodic Planosol
Table 2 PHYSICAL CHARACTERISTICS OF MAJOR SOIL SERIES IN LESOTHO
Soil Series
Surface Texture
Internal Drainage Permeability
AWC cnv/cm
Leribe Rama Thabana Khabo Machache Sefikeng Fusi Sephula
L VFSL Sic SCL C CL C
VFSL
Well Mod, well Moderate Well Well Well Well Mod, well too poorly
Moderate Moderate Very slow Mod. slow Mod. slow Moderate Mod. slow
Slow
0.16-0.18 0.13-0.17 0.10-0.14 0.15-0.16 0.16-0.18 0.16-0.18 0.15-0.18
0.16-0.18
The physical properties of the major soil series v^ich have bearing on soil water are shown in Table 2. Although the assessment was not meant to make a direct con¥>arison among different soils, these properties will mean that some soils have an advantage over others in terms of crop moisture availability for'given moisture conditions. Two characteristics have been determined for assessment of moisture availability.
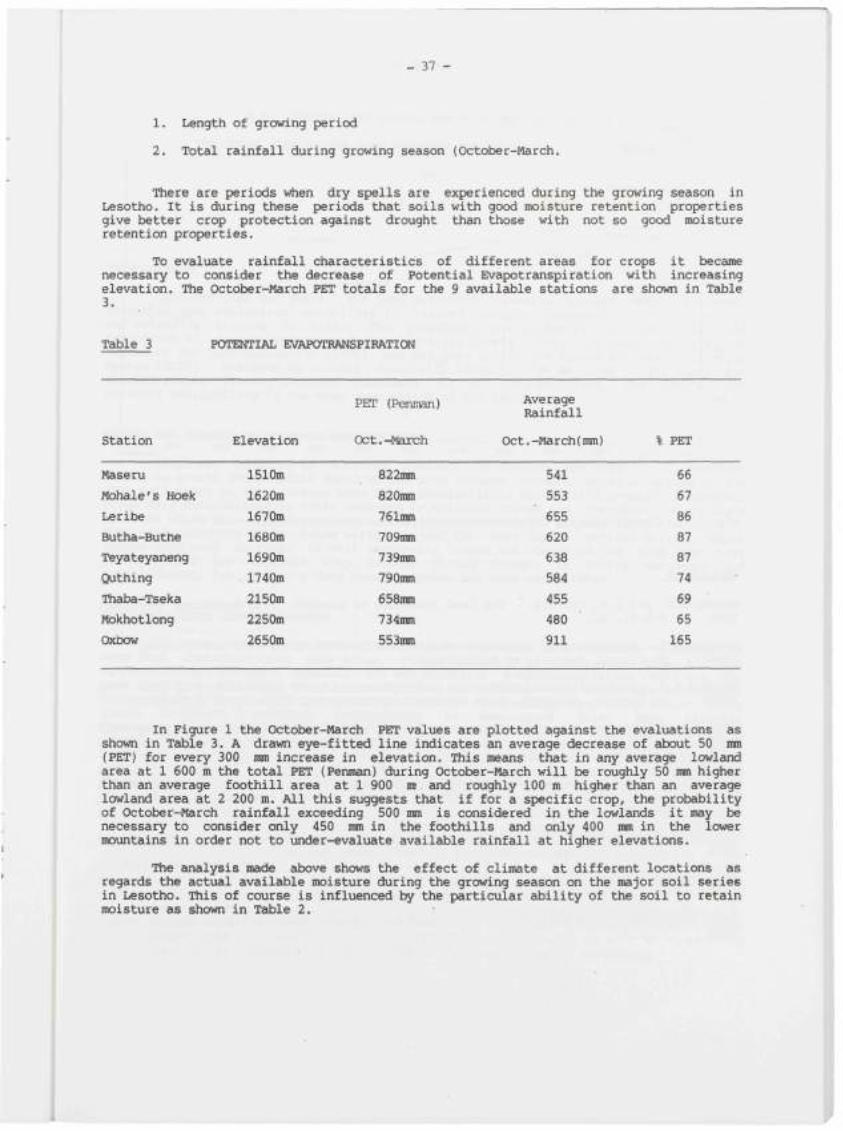
- 37 -
1. Length of growing period
2. Total rainfall during growing season (October-March.
There are periods when dry spells are experienced during the growing season in Lesotho. It is during these periods that soils with good moisture retention properties give better crop protection against drought than those with not so good moisture retention properties.
To evaluate rainfall characteristics of different areas for crops it became necessary to consider the decrease of Potential Evapotranspiration with increasing elevation. The October-March PET totals for the 9 available stations are shown in Table 3.
Table 3
Station
Maseru
Mohale's Hoek
Leribe
Butha-Buthe
Teyateyaneng
Quthing
Thaba-Tseka
Mokhotlong
Oxbow
POTENTIAL EVAPOTRANSPIRATICW
Elevation
1510m
1620ra
1670m
1680m
1690m
1740m
2150m
2250m
2650m
PE?r (Pesninan)
Oct.-March
822mm
820mm
761mm
709mm
739mm
790mm
658mm
734mm
553mm
Average Rainfall
Oct.-March(mm)
541
553
655
620
638
584
- 455
480
911
% PET
66
67
86
87
87
74
69
65
165
In Figure 1 the October-March PET values are plotted against the evaluations as shown in Table 3. A drawn eye-fitted line indicates an average decrease of about 50 mm (PET) for every 300 mm increase in elevation. This means that in any average lowland area at 1 600 m the total PET (Penman) during October-March will be roughly 50 mm higher than an average foothill area at 1 900 mt and roughly 100 m higher than an average lowland area at 2 200 m. All this suggests that if for a specific crop, the probability of October-March rainfall exceeding 500 mm is considered in the lowlands it may be necessary to consider only 450 mm in the foothills and only 400 mm in the lower mountains in order not to under-evaluate available rainfall at higher elevations.
The analysis made above shows the effect of climate at different locations as regards the actual available moisture during the growing season on the major soil series in Lesotho. This of course is influenced by the particular ability of the soil to retain moisture as shown in Têible 2.

- 38 -
RETT (Penman) mn
800
700
600
500
400
300
-t- Maseru •»• Hahaleshoek
* Quthing
Leribe + .Teyaleyanong + Mdkhotlong
Butha-Buthe
Thaba-Tseka
Oxbow
1500 1600 1800 1900 2000 2100 2200 2400 2500 2600 2700 Elevation
Fig. 1 Correlation of PET Penman with elevation (October-March)
REFERENCES
Bawden M.G. and D.M. Carroll. The land resources of Lesotho. Land Resources Division. 1968 D.O.S., UK,
Berding F.R. Assessment of climatic zones in Lesotho. FAO/SIDA, Land Use Planning 1984a Institute, Ministry of Agriculture.
Berding F.R. Suitability classification of soil and climate for a number of land uses 1984b in Lesotho. FAO/SIDA, Land Use Planning Institute, Ministry of Agriculture.
Carrol P. Soils of Lesotho - A system of soil' classification for interpreting soil 1979 surveys in Lesotho. The Office of Soil Surveys, Conservation Division,
Ministry of Agriculture.
Cauley P.M. et al. Benchmark soils of Lesotho, their classification, interpretation, use and management. The Office of Soil Surveys, Conservation Division, Ministry of Agriculture.
Conservation Division. Land capability guide to safe land use and crop suitability 1979 ratings for Lesotho. Ministry of Agriculture, Maseru.
FAO. Report on the agro-ecological zones project. Vol. 1. Methodology and results for 1978 Africa. World Soil Resources Report No. 48. Rome.
FAO. Guidelines: Land evaluation for rainfed agriculture. Soils Bulletin No. 52. Rome. 1983
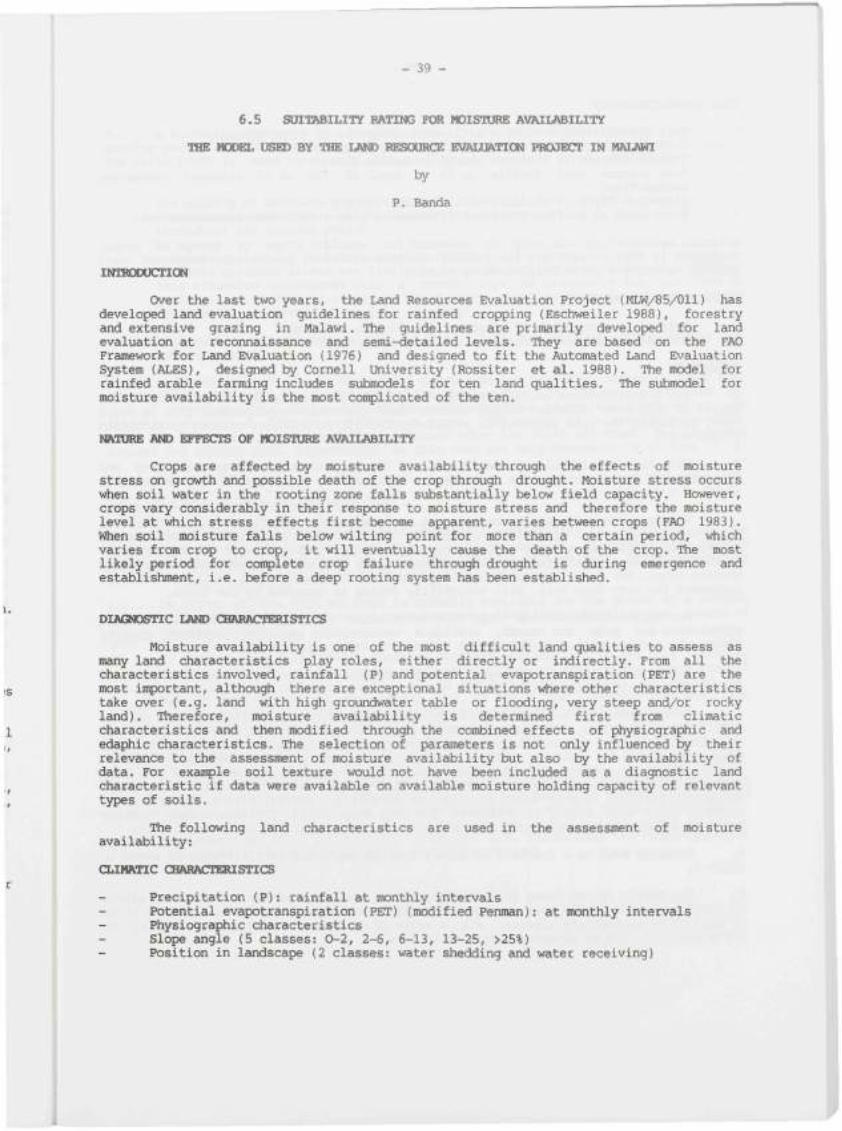
- 39 -
6.5 SUITABILITY RATING POR MOISTURE AVAILABILITY
THE NCOEL USED BY THE LMUD RESCXmCE EVALUATION PROJECT IN MALAWI
by
P. Banda
INTRCHXJCTION
Over the last two years, the Land Resources Evaluation Project (MLW/85/011) has developed land evaluation guidelines for rainfed cropping (Eschweiler 1988), forestry and extensive grazing in Malawi. The guidelines are primarily developed for land evaluation at reconnaissance and semi-detailed levels. They are based on the FAQ Framework for Land Evaluation (1976) and designed to fit the Automated Land Evaluation System (ALES), designed by Cornell University (Rossiter et al. 1988). The model for rainfed arable farming includes submodels for ten land qualities. The siobmodel for moisture availability is the most conplicated of the ten.
NATORE AND EFFECTS OF MOISTURE AVAILABILITY
Crops are affected by moisture availability through the effects of moisture stress on growth and possible death of the crop through drought. Moisture stress occurs when soil water in the rooting zone falls substantially below field capacity. However, crops vary considerably in their response to moisture stress and therefore the moisture level at v iich stress effects first become apparent, varies between crops (FAQ 1983). When soil moisture falls below wilting point for more than a certain period, which varies from crop to crop, it will eventually cause the death of the crop. The most likely period for conplete crop failure through drought is during emergence and establishment, i.e. before a deep rooting system has been established.
DIAGNOSTIC LAND CHARACTERISTICS
Moisture availability is one of the most difficult land qualities to assess as many land characteristics play roles, either directly or indirectly. From all the characteristics involved, rainfall (P) and potential evapotranspiration (PET) are the most inportant, although there are exceptional situations where other characteristics take over (e.g. land with high grovindwater table or flooding, very steep and/or rocky land). Therefore, moisture availability is determined first from climatic characteristics and then modified through the con±)ined effects of physiographic and edaphic characteristics. The selection of parameters is not only influenced by their relevance to the assessment of moisture availability but also by the availability of data. For exair ile soil texture would not have been included as a diagnostic land characteristic if data were available on available moisture holding capacity of relevant types of soils.
The following land characteristics are used in the assessment of moisture availability:
CLIMATIC CHARACTERISTICS
Precipitation (P): rainfall at monthly intervals Potential evapotranspiration (PET) (modified Penman): at monthly intervals Physiographic characteristics Slope angle (5 classes: 0-2, 2-6, 6-13, 13-25, >25%) Position in lêindscape (2 classes: water shedding and water receiving)
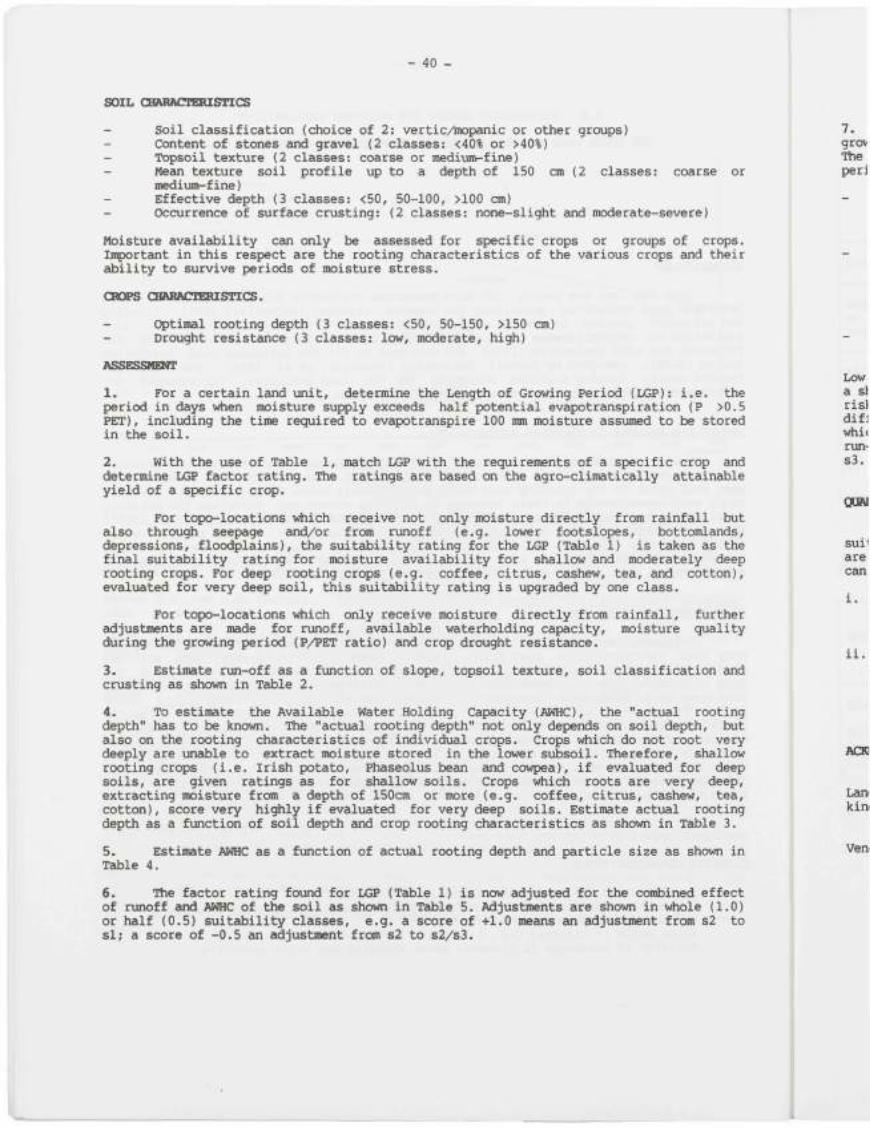
- 40 -
SOIL CBARACTERISnCS
Soil classification (choice of 2: vertic/mopanic or other groups) Content of stones and gravel (2 classes: <40% or >40%) Topsoil texture (2 classes: coarse or medium-fine)
- Mean texture soil profile up to a depth of 150 cm (2 classes: coarse or medium-fine) Effective depth (3 classes: <50, 50-100, >100 cm) Occurrence of surface crusting: (2 classes: none-slight and moderate-severe)
Moisture availability can only be assessed for specific crops or groups of crops. Inportant in this respect are the rooting characteristics of the various crops and their ability to survive periods of moisture stress.
CROPS CBABACTERISnCS.
Optimal rooting depth (3 classes: <50, 50-150, >150 cm) - Drought resistance (3 classes: low, moderate, high)
ASSESSHEMT
1. For a certain land unit, determine the Length of Growing Period (LGP): i.e. the period in days vhen moisture supply exceeds half potential evapotranspiration (P >0.5 PET), including the time required to evapotranspire 100 mm moisture assumed to be stored in the soil.
2. With the use of Table 1, match LGP with the requirements of a specific crop and determine LGP factor rating. The ratings are based on the agro-climatically attainable yield of a specific crop.
For topo-locations v*iich receive not only moisture directly from rainfall but also through seepage and/or from runoff (e.g. lower footslopes, bottomlands, depressions, floodplains), the suitability rating for the LGP (Table 1) is taken as the final suitability rating for moisture availability for shallow and moderately deep rooting crops. For deep rooting crops (e.g. coffee, citrus, cashew, tea, and cotton), evaluated for very deep soil, this suitability rating is upgraded by one class.
For topo-locations vrtiich only receive moisture directly from rainfall, further adjustments are made for runoff, available waterholding capacity, moisture quality during the growing period (P/PET ratio) and crop drought resistance.
3. Estimate run-off as a ftinction of slope, topsoil texture, soil classification and crusting as shown in Table 2.
4. To estimate the Available Water Holding Capacity (AWHC), the "actual rooting depth" has to be known. The "actual rooting depth" not only depends on soil depth, but also on the rooting characteristics of individual crops. Crops v^ich do not root very deeply are vinable to extract moisture stored in the lower subsoil. Therefore, shallow rooting crops (i.e. Irish potato, Phaseolus bean and cowpea), if evaluated for deep soils, are given ratings as for shallow soils. Crops which roots are very deep, extracting moisture from a depth of 150cm or more (e.g. coffee, citrus, cashew, tea, cotton), score very highly if evaluated for very deep soils. Estimate actual rooting depth as a function of soil depth and crop rooting characteristics as shown in Table 3.
5. Estimate AWHC as a function of actual rooting depth and particle size as shown in Tëible 4.
6. The factor rating found for LGP (Table 1) is now adjusted for the combined effect of runoff and AWHC of the soil as shown in Table 5. Adjustments are shown in v^ole (1.0) or half (0.5) suitability classes, e.g. a score of +1.0 means an adjustment from s2 to si; a score of -0.5 an adjustment from s2 to s2/s3.
- 41 -
7. A further adjustment is for the "quality of the moisture supply" during the growing period and for the ability of crops to withstand moisture stress (i.e. drought). The ratio P/PET is used to express the quality of moisture supply during the growing period:
low quality of moisture supply (P/PET <1): rainfall does not fully meet potential evapotranspiration and a slight to moderate moisture stress is created for crops throughout the growing period
moderate quality of moisture supply (P/PET 1-1.3): short periods of slight to moderate moisture stress are likely to occur during the growing period. (Although this situation corresponds with a "normal" type of growing period, the "humid" period (i.e. P> PET) is likely to be of short duration and soil moisture storage is often not achieved to its full capacity)
high quality of moisture supply (P/PET > 1.3): no moisture stress during the growing period.
Low to moderate moisture supply during the growing period normally occurs in areas with a short LGP (i.e. <165 days). Generally the shorter the LGP, the more pronounced the risk of having droughts. Table 6 gives the combined effect of various P/PET ratios and different classes of drought resistance of crops. The number of classes are shown by vrtiich the LGP factor rating is further adjusted after the first adjustment for increased run-off and limited AWHC. Adjustments in this case are only downwards, e.g. from s2 to s3.
QUANTIFICAnOK OF MOISTURE AVAIIABILITÏ
The result of the assessment of moisture availability is expressed in the suitability si±>-ratings (or sub-classes) si, s2, s3 and n. Half, or intermediate classes are also distinguished, expressed as sl/2, s2/3 and s3/n respectively. These sub-ratings can be quantified in two ways:
i. in number of days that moisture is actually available for the growth of a certain crop. Table 1 gives the correlation between suitability sub-rating and length of growing period
ii. in maximum attainable yield. Assuming moisture availability is the only limiting land quality, the sub-rating for moisture availability is also the final overall land suitability class (i.e. si, s2, s3 and n correlate with Si, S2, S3 and N). Overall land suitability classes (51, S2, S3 and N) for a certain land use type have been correlated with maximum attainalile yield for that land use type.
ACKNONLEIX^IENTS
The presentation of this paper has been made possible with assistance from the Land Resource Evaluation Project (Ministry of Agriculture/UNDP/FAO, MLW/85/011) and with kind permission of the Department of Agricultural Research and the Malawi Government.
The paper is based on the work of Messrs J.A. Eschweiler, S. Paris and J.H. Venema, FAD experts of the Land Research Evaluation Project.
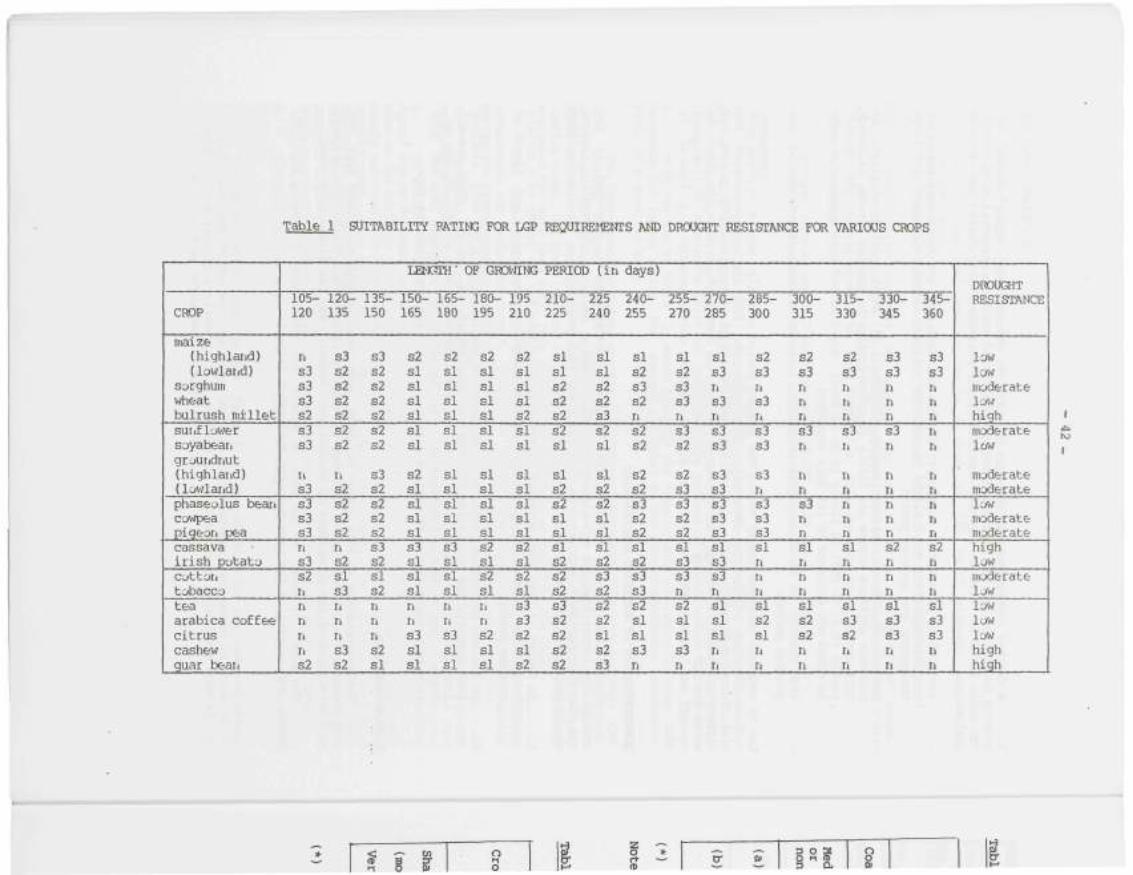
Table 1 SUITABILITY RATING FOR LGP REQUIREMENTS AND DROUGHT RESISTANCE FOR VARIOUS CROPS
CROP
maize (highland) (lowland)
sorghum wheat bulrush millet suiiflov/er soyabeari grouiidnut (highland) (lov/land) phaseolus bean cowpea pigeon pea cassava Irish potato cot tori tobacco tea arabica coffee citrus cashew guar beaii
105-120
n S3 s3 s3 s2 S3 S3
n s3 S3 S3 S3 n s3 s2 ii
n n n n s2
120-135
S3 s2 s2 s2 s2 s2 s2
n s2 s2 s2 s2 n s2 si s3 ii
n n S3 s2
135-150
S3 s2 s2 s2 s2 s2 s2
s3 s2 s2 s2 s2 S3 s2 si s2 n n n s2 si
LENGTH'
150-165
s2 si si si si si si
s2 si si si si s3 si si si n n s3 si si
165-180
s2 si si si si si si
si si si si si s3 si si si n ri s3 si si
OF GRDVJING
180-195
s2 si si si si si si
si si si si si s2 si s2 si ri
n s2 si si
195 210
s2 si si si s2 si si
si si si si si s2 si s2 si s3 s3 s2 si s2
PERIOD (in
210-225
si si s2 s2 s2 s2 si
si s2 s2 si si si s2 s2 s2 s3 s2 s2 s2 s2
225 240
si si s2 s2 s3 s2 si
si s2 s2 si si si s2 S3 s2 s2 s2 si s2 S3
days)
240-255
si s2 S3 s2 n s2 s2
s2 s2 S3 s2 s2 si s2 S3 S3 s2 si sl s3 n
255-270
sl s2 s3 S3 n S3 s2
s2 s3 s3 s2 s2 sl s3 s3 n s2 sl sl s3 n
270-285
sl s3 n S3 n s3 s3
S3 s3 S3 S3 s3 sl S3 s3 n sl sl sl n n
285-300
s2 s3 n S3 n s3 s3
s3 n S3 s3 s3 sl n n n sl s2 sl ii
n
300-315
s2 S3 n n n s3 n
n n s3 n n sl n n n sl s2 s2 n n
315-330
s2 s3 n ri n s3 ri
n n n n n sl n n n sl S3 s2 r» n
330-345
s3 s3 n n n s3 n
n n n n n s2 n n n sl s3 s3 n n
345-360
s3 s3 n n n ri
n
n n n n n s2 n n n sl s3 s3 n n
DROUGHT RESISTANCE
low low moderate low high moderate low
moderate moderate low moderate moderate high low moderate low low low low high high
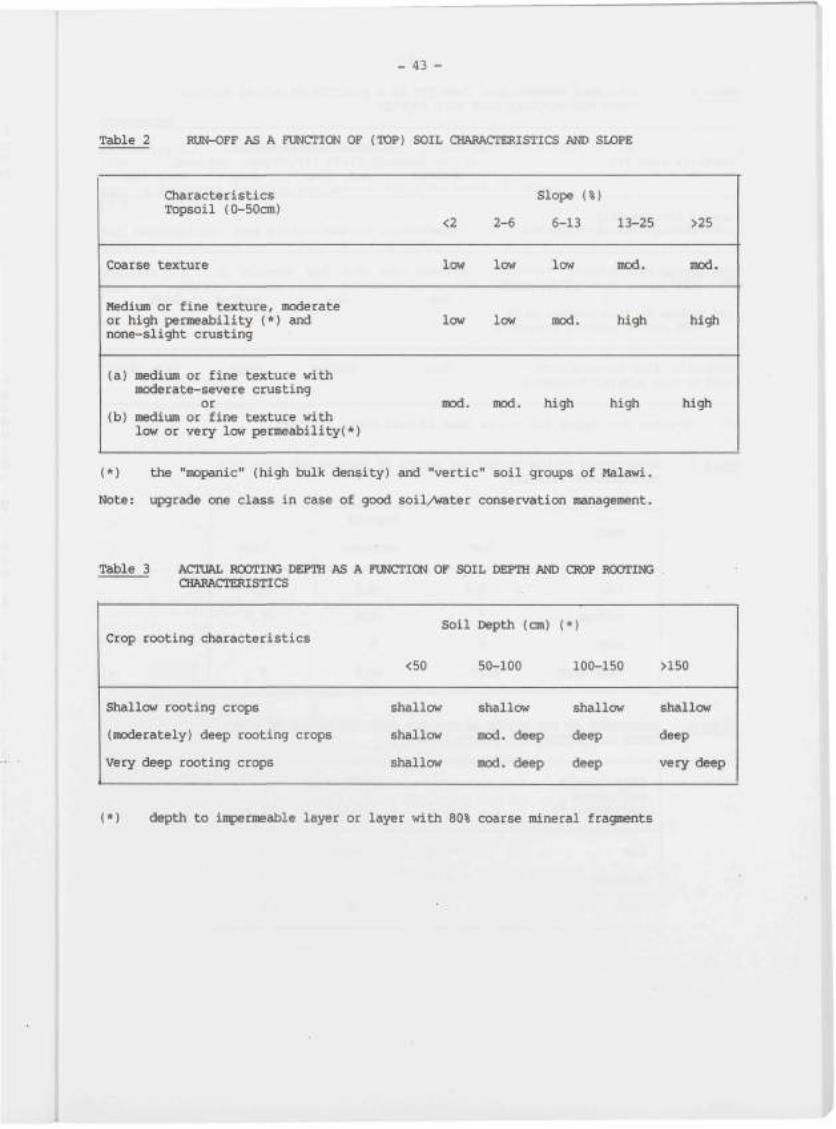
- 43 -
Table 2 RUN-OFF AS A FUNCTIC»! OF (TOP) SOIL CHARACTERISTICS AND SLOPE
Characteristics Topsoil (0-50cm)
Coarse texture
Medivun or fine texture, moderate or high permeability (*) and none-slight crusting
(a) medium or fine texture with moderate-severe crusting
or (b) medium or fine texture with
low or very low penneability(*)
<2
low
low
mod.
2-6
low
low
mod.
Slope (%)
6-13
low
mod.
high
13-25
mod.
high
high
>25
mod.
high
high
(*) the "mopanic" (high bulk density) and "vertic" soil groups of Malawi.
Note: upgrade one class in case of good soil/Vrater conservation management.
Table 3 ACTUAL ROOTING DEPTH AS A FUNCTIOI OF SOIL DEPTH AND CROP ROOTING . CHARACTERISTICS
Crop rooting characteristics
Shallow rooting crops
(moderately) deep rooting crops
Very deep rooting crops
Soil
<50
shallow
shallow
shallow
Depth (cm)
50-100
shallow
mod. deep
mod. deep
(*)
100-150
shallow
deep
deep
>150
shallow
deep
very deep
(*) depth to iit )ermeable layer or layer with 80% coarse mineral fragments

_ 44 -
Table 4 AVAILABLE WATERHOLDING CAPACITY AS A FUNCTION OF ACTUAL ROOTING DEPTH AND PARTICLE SIZE SOIL PROFILE
Particle size (*)
coarse texture with >40% coarse mineral fragments
(a) coarse texture with <40% coarse mineral fragments
or (b) medium or fine texture with
>40% coarse mineral fragments
medium or fine texture with <40% coarse mineral fragments
shallow
low
low
low
Actual rooting depth
mod. deep deep
low
low
mediiom
low
medium
high
very deep
medium
high
very high
(*) average over upper 150 cm, or less if soil depth is less.
Table 5 ADJUSTMENTS TO LGP RATING FOR EFFECT OF RUN-OFF AND AVAILABLE WATERHOLDING CAPACITY
AWHC
low
medivun
high
very high 1
low
-0.5
0
0
+1.0 ,
Run-off
moderate
-0.5
-0.5
0
+0.5
high
-1.0
-1.0
-0.5
0
Table 6 ADJUSTMENT OF LGP FACTOR RATING FOR COMBINED EFFECT OF P/PET RATIO AND DROUGHT RESISTANCE OF CROPS
Crop drought resistance (see Table 1) <1.0
P/PET ratio
1.0-1.3
low
moderate
high
-1.0
-0.5
0
-0.5
o'
0
>1.3
0
0
0
1
- 45 -
REFERENCES
Eschweiler J.A. Land evaluation in Malawi; preliminary guidelines for rainfed cropping, 1988 UNDP/FAO, MLW/85/011 Field Document No. 5.
FAO. A framework for land evaluation. Soils Bulletin 32, Rome. 1976
FAO. Guidelines: land evaluation for rainfed agriculture. Soils Bulletin 52, Rome. 1983
Rossiter D.G., M. Tolomeo and A.R. van Wambeke. Automated Land Evaluation System 1988 (ALES), version 1.0. Agronony Department, Cornell University, Ithaca, New
York.
- 47 -
6.6 RATING OF LAND QUALITIES: MOISTURE AVAILABILITY
A OOUNTBY APPRAISAL - BOTSWANA
by
T.D.Mafoko
INTROTÜCTICN
The development of a land evaluation system in Botswana started in 1981 in the context of the Soil Mapping and Advisory Services Project (BOT/80/003). These first rather ad hoc approaches were formulated by Veneraa, Eldridge and Remmelzwaal. In 1984 Venema and Rhebergen published a first version of this system in which the land quality "availability moisture" was based on the agroecological zone approach (FAG 1978), in v*iich a sinple water balance based on the rainfall in a mean year, lead to the calculation of length of available growing period. This approach proved less than satisfactory on a coxmtry scale. In 1984, Rhebergen introduced a system of climatic zones based on frequencies of efficiently long growing periods. This system was later refined by Dambe (1987).
To take into account soil characteristics in the evaluation of moisture availability, Rhebergen (1988) proposed a system of correction factors that started from a basic figure indicating the available water holding capacity of the soil and evaluated numerous characteristics, e.g. texture, soil depth, stoniness, bulk-density, infiltration rate, site characteristics and agroclimatic zone in which the soil was found.
Moisture Availability (m)
Moisture availability is, in general terms, determined by climate (rainfall and 'potential evapotranspiration), modified by topography (water shedding sites versus water receiving sites) and soil characteristics (infiltration, permeability, available water holding capacity).
1. Climate
Of importance is the rainfall in relation to the potential evapotranspiration.
Agro-Climatic Zones:
The differentiation of Botswana into agro-climatic zones is based on the variation in growing season lengths, the length of the humid period and on the number of dry days within the season.
Data of about 60 weather stations were processed by the Meteorological Department in Gaborone following the methodology of the FAO Agro-ecological Zones Project (FAO 1978). The reader is referred to the report 'Agro-climatic zones in Botswana' (Dambe 1987) for technical details. The following definitions apply:
Growing Season: The length of the growing season is equal to the length of the growing period if one growing period occurs or equals the total length of the growing periods, when two or more growing periods occur plus the number of dry days.
- 48 -
Grcfwing Period: The start of a growing period is assumed when precipitation exceeds half the potential evapotranspiration. The end of the period is assumed vrtien precipitation falls below half potential evapotranspiration plus a number of days required to evaporate as assumed 100mm of soil moisture reserve when available.
Humid Period: The period during a growing period when precipitation exceeds full potential evapotranspiration. Dry days: Days during the growing season when no soil moisture is available and rainfall is less than half the potential evapotranspiration.
It should be noted that the potential evapotranspiration was calculated using the Penman method with constants reflecting local conditions (S.M.E.C. 1987).
The agro-climatic zones are the basis for the determination of the moisture availability rating for dryland farming.
2. Water Retention Characteristics
Water retention characteristics (total available water, wilting point) of the soil determine how a crop will respond to rain. A crop on a dry sandy soil will respond to a 20 mm rainfall, vrtiile a crop on a dry clay soil will not respond to a 20 mm rainfall.
3. Lateral Movement of Water in the Soil
Within the soil, water may be lost or gained through lateral water movements. This is mainly a function of slope, slope position (site), infiltration rate, permeability and water holding capacity.
4. Downward Movement of Water in the Soil
Water can sink by gravity below a depth where it can be reached by plant roots. The amount of water lost through this process is very much a fxinction of plant rooting characteristics (shallow rooting plants vs. deep rooting plants). An important soil characteristic is the available water holding capacity.
5. Effective rooting depth
The effective rooting depth is influenced to a large extent by the available water holding capacity. The rooting depth is restricted not only by shallow rock but also by the presence of a (petro) calcic horizon, abrupt textural change and sedimentary stratification.
PROCEDURE
i. determine the available water holding capacity (AWHC) according to Table 1
ii. correct AWHC for infiltration rate
iii. read moisture availability rating combining AWHC/infiltration rating and climatic zone and correct if necessary for site characteristics using Table 2
iv. give final rating after texture correction if applicable using Table 3
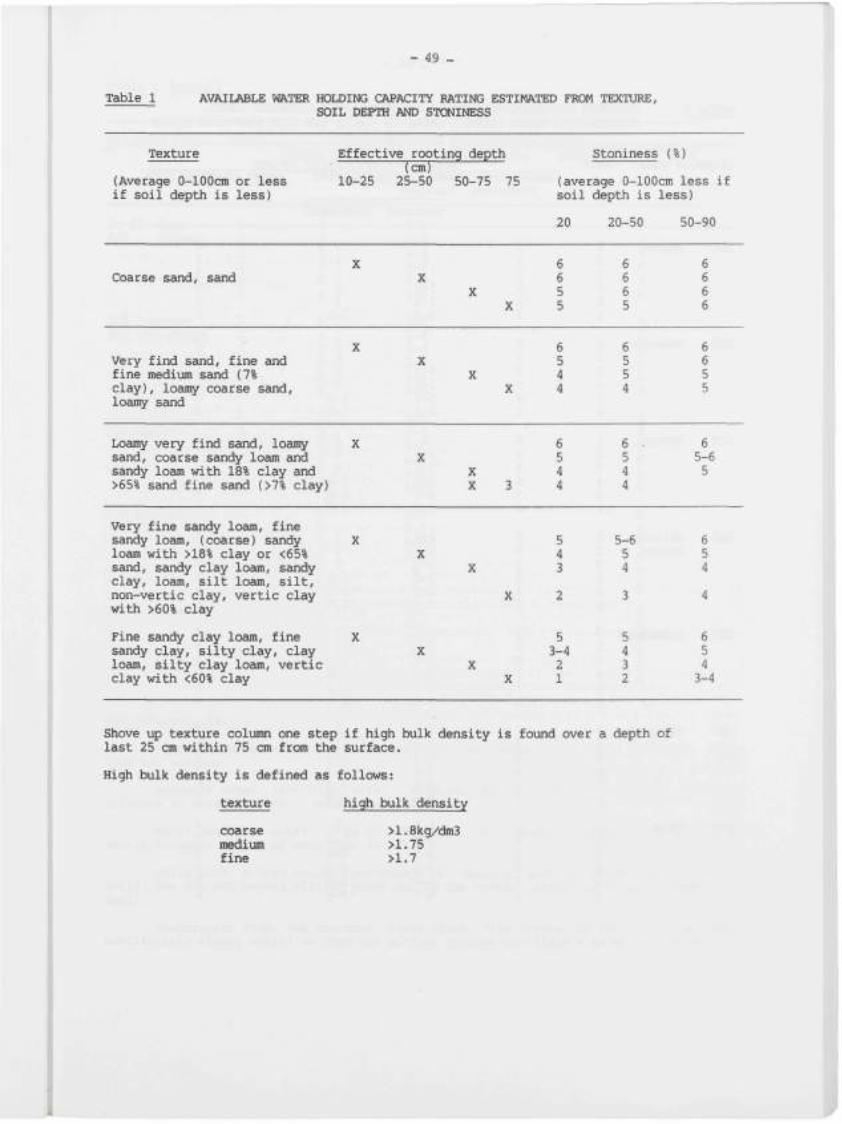
- 49 -
Table 1 AVAILABLE WATER HOLDING CAPACITY RATING ESTIMATED FROM TEXTURE, SOIL DEPTH AND STOJINESS
Texture
(Average 0-lOOcm or less if soil depth is less)
Effective rooting depth (cm)
10-25 25-50 50-75 75
Stoniness (%)
(average 0-lOOcm less if soil depth is less)
20 20-50 50-90
Coarse sand, sand X
X X
X
6 6 5 5
6 6 6 5
Very find sand, fine and fine medium sand (7% clay), loamy coarse sand, loany sand
X
X
6 5 4 4
6 5 5 4
6 6 5 5
Loamy very find sand, loamy sand, coarse sandy loam and sandy loam with 18% clay and >65% sand fine sand (>7% clay)
X
X X
6 5 4 4
6 5 4 4
6 5-6 5
Very fine sandy loam, fine sandy loam, (coarse) sandy X loam with >18% clay or <65% sand, sandy clay loam, sandy clay, loam, silt loam, silt, non-vertic clay, vertic clay with >60% clay
Fine sandy clay loam, fine X sandy clay, silty clay, clay loam, silty clay loam, vertic clay with <60% clay
X
X
5 3-4 2 1
5-6 5 4
5 4 3 2
6 5 4
6 5 4 3-4
Shove up texture column one step if high bulk density is found over a depth of last 25 cm within 75 cm from the surface.
High bulk density is defined as follows:
texture high bulk density
coarse mediixn fine
>1.8kg/dm3 >1.75 >1.7
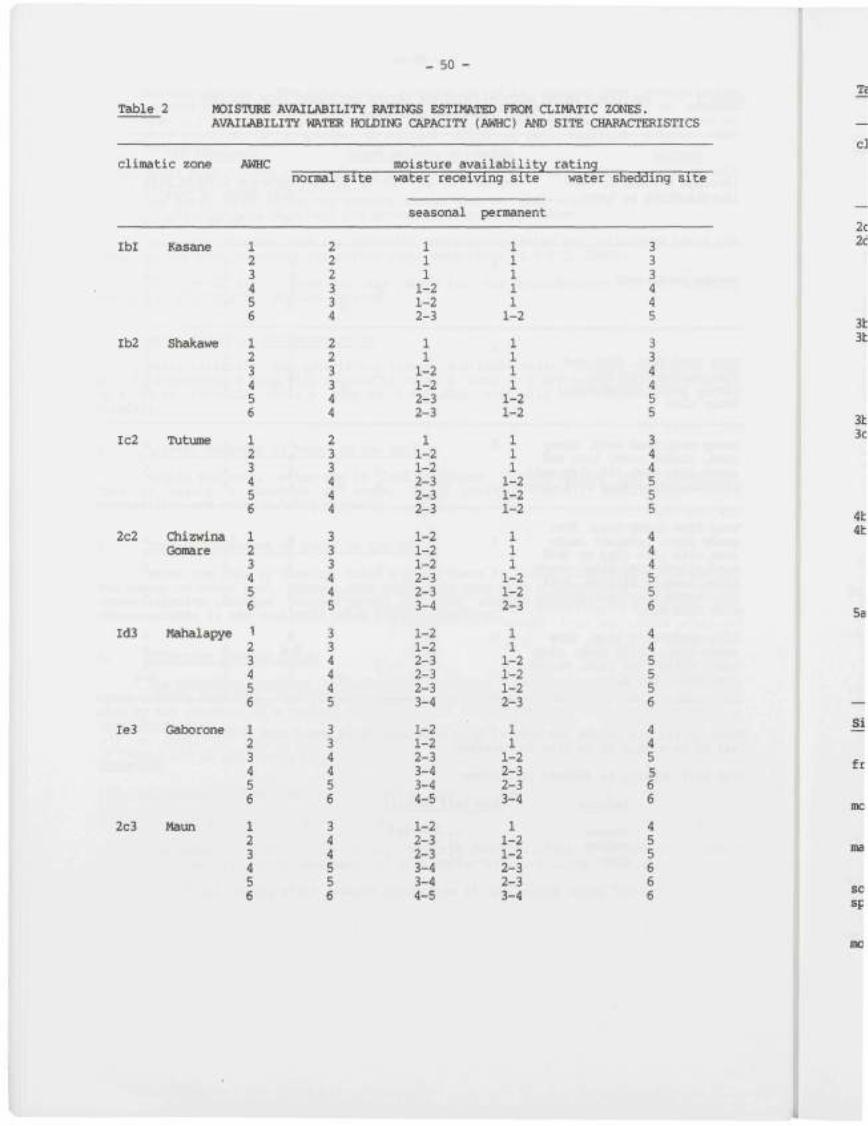
_ 50 -
Table 2 MOISTURE AVAILABILITY RATINGS ESTIMATED FROM CLIMATIC ZONES. AVAILABILITY WATER HOLDING CAPACITY (AWHC) AND SITE CHARACTERISTICS
climatic zone AWHC ^__^ moisture availability rating normal site water receiving site water shedding site
seasonal permanent
Ibl Kasane 1 2 3 4 5 6
2 2 2 3 3 4
1 1 1 1-2 1-2 2-3
1 1 1 1 1 1-2
Ib2 Shakawe 1 2 3 4 5 6
2 2 3 3 4 4
1 1 1-2 1-2 2-3 2-3
1 1 1 1 1-2 1-2
Ic2 Tutume 1 2 3 4 5 6
2 3 3 4 4 4
1 1-2 1-2 2-3 2-3 2-3
1 1 1 1-2 1-2 1-2
3 4 4 5 5 5
2c2 Chizwina Gomare
1 2 3 4 5 6
3 3 3 4 4 5
1-2 1-2 1-2 2-3 2-3 3-4
1 1 1 1-2 1-2 2-3
4 4 4 5 5 6
Id3 Mahalapye 1 2 3 4 5 6
3 3 4 4 4 5
1-2 1-2 2-3 2-3 2-3 3-4
1 1 1-2 1-2 1-2 2-3
4 4 5 5 5 6
Ie3 Gaborone 1 2 3 4 5 6
3 3 4 4 5 6
1-2 1-2 2-3 3-4 3-4 4-5
1 1 1-2 2-3 2-3 3-4
4 4 5 5 6 6
2c3 Maun 1 2 3 4 5 6
3 4 4 5 5 6
1-2 2-3 2-3 3-4 3-4 4-5
1 1-2 1-2 2-3 2-3 3-4
4 5 5 6 6 6
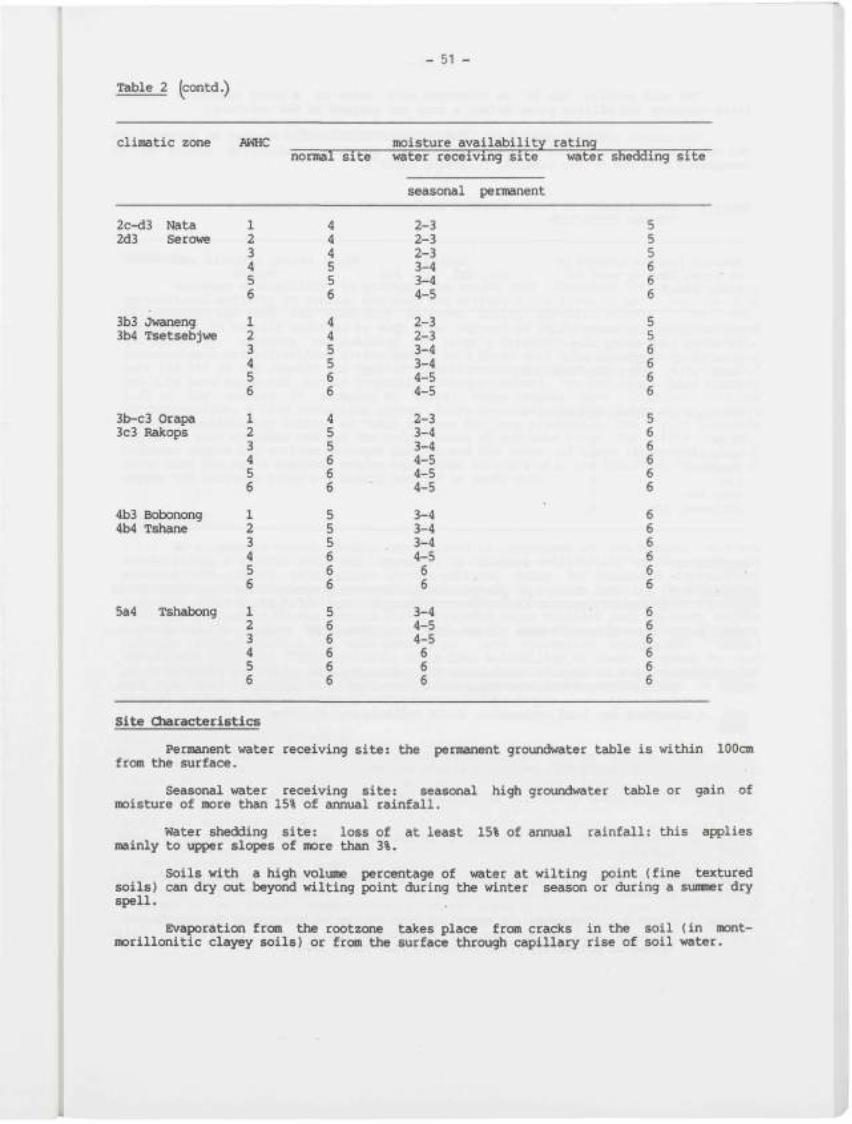
- 51 -
Table 2 (contd.)
climatic zone AWHC ^ moisture availability rating normal site water receiving site water shedding site
seasonal permanent
2c-d3 Nata 2d3 Serowe
3b3 Jwaneng 3b4 Tsetsebjwe
3b-c3 Orapa 3c3 Rakops
4b3 Bobonong 4b4 Tshane
5a4 Tshabong
1 2 3 4 5 6
1 2 3 4 5 6
1 2 3 4 5 6
1 2 3 4 5 6
1 2 3 4 5 6
Site Oiaracteristics
4 4 4 5 5 6
4 4 5 5 6 6
4 5 5 6 6 6
5 5 5 6 6 6
5 6 6 6 6 6
2-3 2-3 2-3 3-4 3-4 4-5
2-3 2-3 3-4 3-4 4-5 4-5
2-3 3-4 3-4 4-5 4-5 4-5
3-4 3-4 3-4 4-5 6 6
3-4 4-5 4-5 6 6 6
5 5 5 6 6 6
5 5 6 6 6 6
5 6 6 6 6 6
6 6 6 6 6 6
6 6 6 6 6 6
Permanent water receiving site: the permanent groxondwater table is within 100cm from the surface.
Seasonal water receiving site: seasonal high groundwater table or gain of moisture of more than 15% of annual rainfall.
Water shedding site: loss of at least 15% of annual rainfall: this applies mainly to upper slopes of more than 3%.
Soils with a high volume percentage of water at wilting point (fine textured soils) can dry out beyond wilting point during the winter season or during a summer dry spell.
Evaporation from the rootzone takes place from cracks in the soil (in mont-morillonitic clayey soils) or from the surface through capillary rise of soil water.
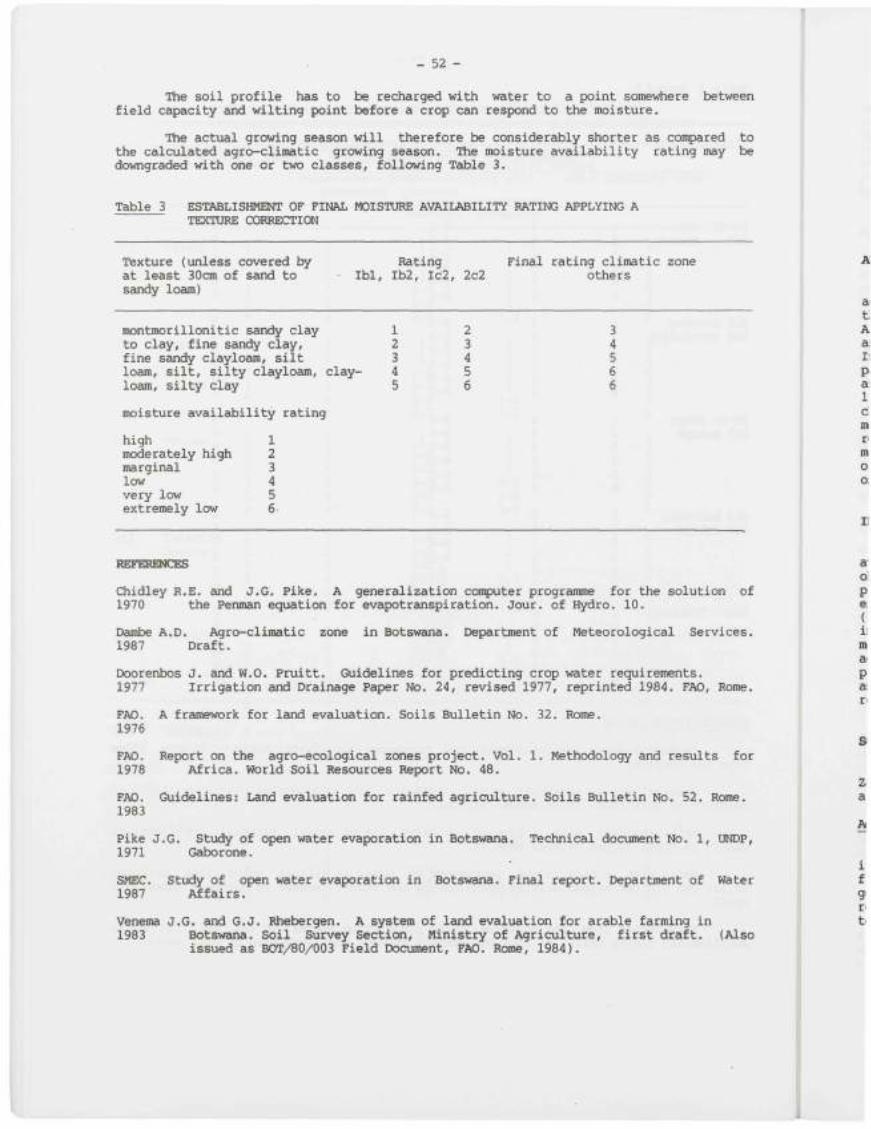
- 52 -
The soil profile has to be recharged with water to a point somevrfiere between field capacity and wilting point before a crop can respond to the moisture.
The actual growing season will therefore be considerably shorter as compared to the calculated agro-climatic growing season. The moisture availability rating may be downgraded with one or two classes, following Table 3.
Table 3 ESTABLISHMENT OF FINAL MOISTURE AVAILABILITY RATING APPLYING A TEXTURE CORRECTION
Texture (unless covered by Rating Final rating climatic zone at least 30cm of sand to - Ibl, Ib2, Ic2, 2c2 others sandy loam)
montmorillonitic sandy clay 1 2 3 to clay, fine sandy clay, 2 3 4 fine sandy clayloam, silt 3 4 5 loam, silt, silty clayloam, clay- 4 5 6 loam, silty clay 5 6 6
moisture availability rating
high moderately high marginal low very low extremely low
1 2 3 4 5 6
BEFESEtEICES
Chidley R.E. and J.G. Pike. A generalization computer programme for the solution of 1970 the Penman equation for evapotranspiration. Jour, of Hydro. 10.
Dambe A.D. Agro-climatic zone in Botswana. Department of Meteorological Services. 1987 Draft.
Doorenbos J. and W.O. Pruitt. Guidelines for predicting crop water requirements. 1977 Irrigation and Drainage Paper No. 24, revised 1977, reprinted 1984. FAO, Rome.
FAO. A framework for land evaluation. Soils Bulletin No. 32. Rome. 1976
FAO. Report on the agro-ecological zones project. Vol. 1. Methodology and results for 1978 Africa. World Soil Resources Report No. 48.
FAO. Guidelines: Land evaluation for rainfed agriculture. Soils Bulletin No. 52. Rome. 1983
Pike J.G. Study of open water evaporation in Botswana. Technical document No. 1, UNDP, 1971 Gaborone.
SMEC. Study of open water evaporation in Botswana. Final report. Department of Water 1987 Affairs.
Venema J.G. and G.J. Rhebergen. A system of land evaluation for arable farming in 1983 Botswana. Soil Survey Section, Ministry of Agriculture, first draft. (Also
issued as BOT/80/003 Field Document, FAO. Rome, 1984).
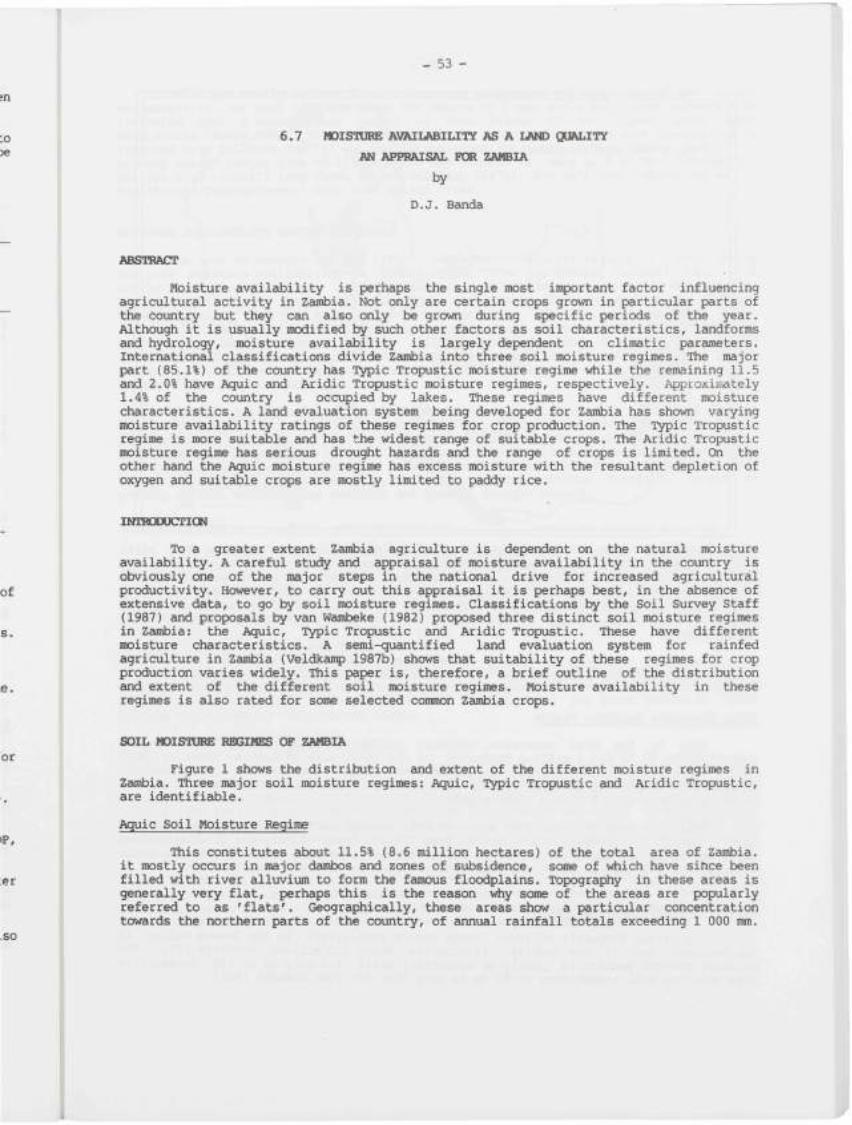
- 53 -
6.7 NOISTURE AVAILABILITY AS A LAND QUALITY
AN APPRAISAL FOR ZAMBIA
by
D.J. Banda
ABSTRACT
Moisture availability is perhaps the single most iitportant factor influencing agricultural activity in Zambia. Not only are certain crops grown in particular parts of the country but they can also only be grown during specific periods of the year. Although it is usually modified by such other factors as soil characteristics, landforms and hydrology, moisture availability is largely dependent on climatic parameters. International classifications divide Zambia into three soil moisture regimes. The major part (85.1%) of the country has Typic Tropustic moisture regime while the remaining 11.5 and 2.0% have Aquic and Aridic Tropustic moisture regimes, respectively, i^proxinately 1.4% of the country is occupied by lakes. These regimes have different moisture characteristics. A land evaluation system being developed for Zambia has shown varying moisture availability ratings of these regimes for crop production. The Typic Tropustic regime is more suitable and has the widest range of suitable crops. The Aridic Tropustic moisture regime has serious drought hazards and the range of crops is limited. On the other hand the Aquic moisture regime has excess moisture with the resultant depletion of oxygen and suitable crops are mostly limited to paddy rice.
INTRCXIUCTIGN
To a greater extent Zambia agriculture is dependent on the natural moisture availability. A careful study and appraisal of moisture availability in the country is obviously one of the major steps in the national drive for increased agricultural productivity. However, to carry out this appraisal it is perhaps best, in the absence of extensive data, to go by soil moisture regimes. Classifications by the Soil Survey Staff (1987) and proposals by van Wambeke (1982) prc xssed three distinct soil moisture regimes in Zambia: the Aquic, Typic Tropustic and Aridic Tropustic. These have different moisture characteristics. A semi-quantified land evaluation system for rainfed agriculture in Zambia (Veldkait 1987b) shows that suitability of these regimes for crop production varies widely. This paper is, therefore, a brief outline of the distribution and extent of the different soil moisture regimes. Moisture availability in these regimes is also rated for some selected common Zambia crops.
SOIL NOISTURE REGIMES OF ZAMBIA
Figure 1 shows the distribution and extent of the different moisture regimes in Zambia. Three major soil moisture regimes: Aquic, Typic Tropustic and Aridic Tropustic, are identifiable.
Aquic Soil Moisture Regime
This constitutes about 11.5% (8.6 million hectares) of the total area of Zambia, it mostly occurs in major dambos and zones of subsidence, some of vrtiich have sitice been filled with river alluvixim to form the famous floodplains. Topography in these areas is generally very flat, perhaps this is the reason why some of the areas are popularly referred to as 'flats'. Geographically, these areas show a particular concentration towards the northern parts of the country, of annvial rainfall totals exceeding 1 000 mm.
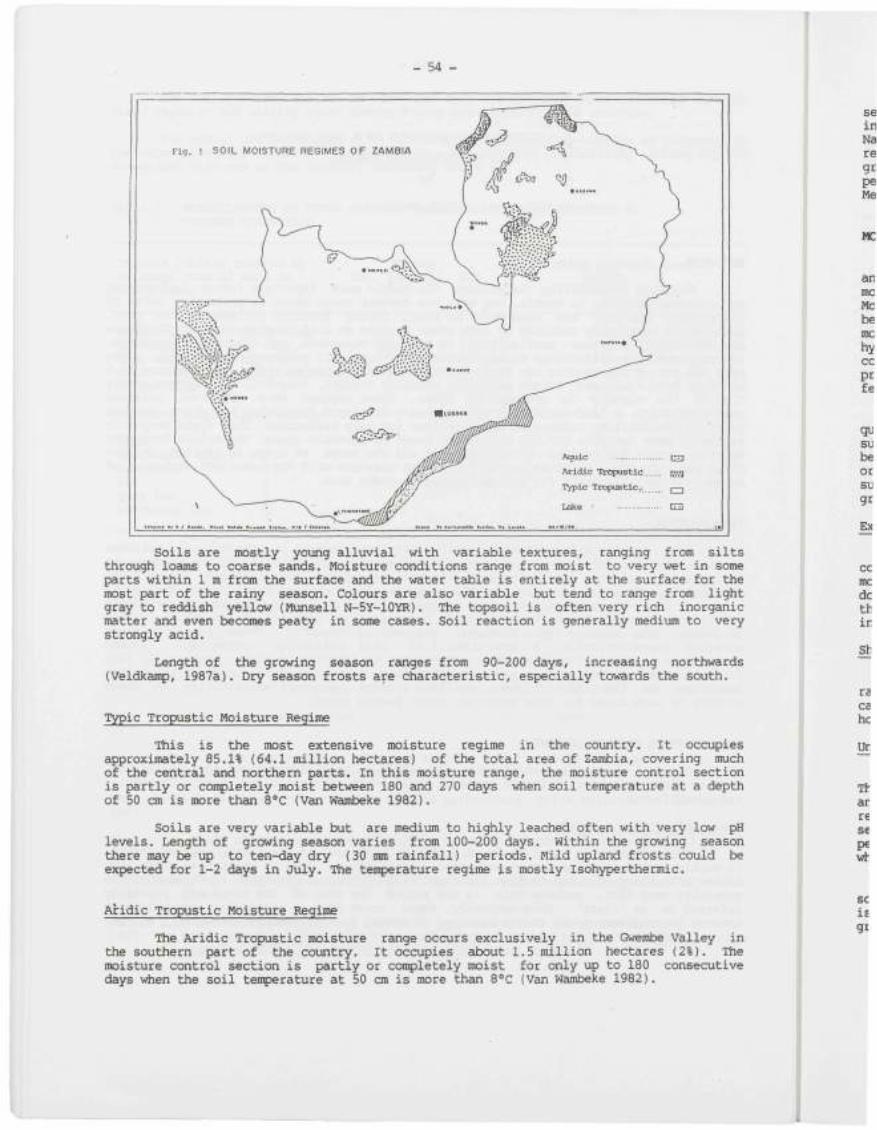
- 54 -
Soils are mostly young alluvial with variable textures, ranging from silts through loams to coarse sands. Moisture conditions range from moist to very wet in some parts within 1 m from the surface and the water table is entirely at the surface for the most part of the rainy season. Colours are also variable but tend to range from light gray to reddish yellow (Munsell N-5Y-10YR). The topsoil is often very rich inorganic matter and even becomes peaty in some cases. Soil reaction is generally medium to very strongly acid.
Length of the growing season ranges from 90-200 days, increasing northwards (Veldkamp, 1987a). Dry season frosts are characteristic, especially towards the south.
Typic Tropustic Moisture Regime
This is the most extensive moisture regime in the country. It occupies approximately 85.1% (64.1 million hectares) of the total area of Zambia, covering much of the central and northern parts. In this moisture range, the moisture control section is partly or completely moist between 180 and 270 days when soil tenperature at a depth of 50 cm is more than S^C (Van Wambeke 1982).
Soils are very variable but are medium to highly leached often with very low pH levels. Length of growing season varies from 100-200 days. Within the growing season there may be up to ten-day dry (30 mm rainfall) periods. Mild upland frosts could be expected for 1-2 days in July. The temperature regime is mostly Isohyperthermic.
Aridic Tropustic Moisture Regime
The Aridic Tropustic moisture range occurs exclusively in the Gwembe Valley in the southern part of the country. It occupies about 1.5 million hectares (2%). The moisture control section is partly or conpletely moist for only up to 180 consecutive days vihen the soil teiqperature at 50 cm is more than S'C (Van Wambeke 1982).
- 55 -
Soils are mostly derived from calcareous sandstones and mudstones of the Karroo sedimentaries. Not much is knovm about the nature of these soils but recent surveys have indicated that a considerable number of them belong to the highly sodic Typic Natrustalfs (Banda 1988). This area is relatively drier and has been more susceptible to repeated crop failures due to moisture stress than the rest of the country. Length of growing season ranges from 80-110 days and may contain as many as 5 or more ten-day dry periods with rainfall less than 30 mm (Veldkan j 1987a). The soil tertperature regime is Megathermic/Isomegathermic with rare upland frost.
MOISTURE AVAILABILITY BAnNS IN ZAMBIA
The work of Bunyolo et al. (1982) represents the first atteit jt to characterize and rate moisture availability in Zambia. Other than the annual rainfall, this work mostly considered the total available moisture and hinderances to root developnent. Moisture availability is largely dependent on climatic factors, mostly the balance between rainfall and the potential evapotranspiration. This is, however, most often modified by local environmental factors including soil characteristics, landforms and hydrology. A land evaluation system (Veldkait j 1987b) being developed for Zambia considers some of these factors in assessing moisture availability. Although most of the procedural details of this system are outside the scope of this paper, its major features are, however, outlined.
The system is based on the FAO (1983) guidelines. It considers a total of 21 land qualities among v*iich is moisture availability. These are subdivided into some 79 sub-qualities. Furthermore, the system recognizes that moisture availability can either be restricted or excessive, in v^ich case crop growth is limited due to moisture stress or oxygen depletion, respectively. Moisture availability, therefore, appears in five sub-qualities, viz excess rainfall, shortage in total minimum rainfall, length of growing season, waterlogging problems and general drought hazard.
Excess Rainfall
This mainly concerns excess rainfall during the rainy season v^ich largely corresponds with the main growing season. Some crops are more sensitive to excess moisture than others. The northern parts of Zambia receive rainfall almost more than double the amount in the South. Severity of constraints formed by this sub-quality, therefore varies from North to South. The total annual rainfall data are directly used in rating this sub-quality.
Shortage in total minimum rainfall
This deals mainly with the effective rainfall derived from the annual total rainfall (70% probability). Corrections are made for the available water holding capacity as well as soil drainage class. It is downgraded for lower available water holding capacities on well drained soils.
Unfavourable length of growing season
The balance between precipitation and potential evapotranspiration is considered. The growing season starts vrtien precipitation exceeds half potential evapotranspiration and ends v^en the reverse is true plus the time taken to deplete the soil moisture reserve. The length of growing season indicates the possible shortness of a cultivation season vrtiich may affect the later stages of crop growth as well as the final crop performance. This period shortens from the northern to the southern parts of the country v iere annual variations become even higher.
In the rating, corrections are made for the available water holding capacity, soil depth, gravel content and ground water influence within the upper 1 m. Downgrading is undertaken for low available water holding capacities, shallow soil depths, and high gravel content vrtien there is no groundwater influence within the upper 1 m.
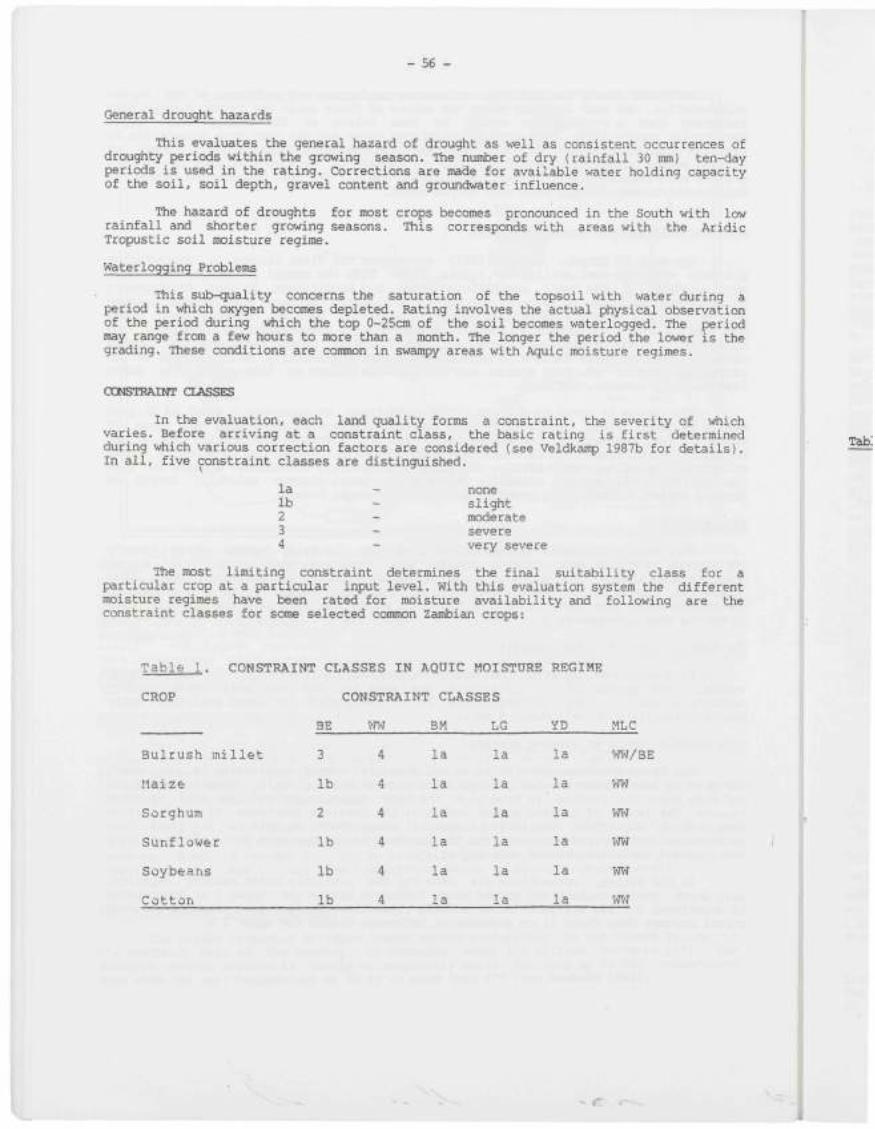
- 56 -
General drought hazards
This evaluates the general hazard of drought as well as consistent occurrences of droughty periods within the growing season. The number of dry (rainfall 30 mm) ten-day periods is used in the rating. Corrections are made for available water holding capacity of the soil, soil depth, gravel content and groxondwater influence.
The hazard of droughts for most crops becomes pronounced in the South with low rainfall and shorter growing seasons. This corresponds with areas with the Aridic Tropustic soil moisture regime.
Waterlogging Problems
This sub-quality concerns the saturation of the topsoil with water during a period in vrfiich oxygen becomes depleted. Rating involves the actual physical observation of the period during vrfiich the top 0-25cm of the soil becomes waterlogged. The period may range from a few hours to more than a month. The longer the period the lower is the grading. These conditions are common in swampy areas with Aquic moisture regimes.
CXXJSTRAINT OASSES
In the evaluation, each land quality forms a constraint, the severity of which varies. Before arriving at a constraint class, the basic rating is first determined during which various correction factors are considered (see Veldkamp 1987b for details). In all, five constraint classes are distinguished.
la - none lb - slight 2 - moderate 3 - severe 4 - very severe
The most limiting constraint determines the final suitability class for a particular crop at a particular input level. With this evaluation system the different moisture regimes have been rated for moisture availability and following are the constraint classes for some selected common Zambian crops:
Table 1. CONSTRAINT CLASSES IN AQÜIC KOISTDRE REGIME
CROP CONSTRAINT CLASSES
Bulrush mi
Maize
Sorghum
Sunflower
Soybeans
Cotton
llet
BE
3
lb
2
lb
lb
lb
vm 4
4
4
4
4
4
BM
la
la
la
la
la
la
LG
la
la
la
la
la
la
YD
la
la
la
la
la
la
MLC
T'W/BE
Wfl
W-7
V7W
WW
mi
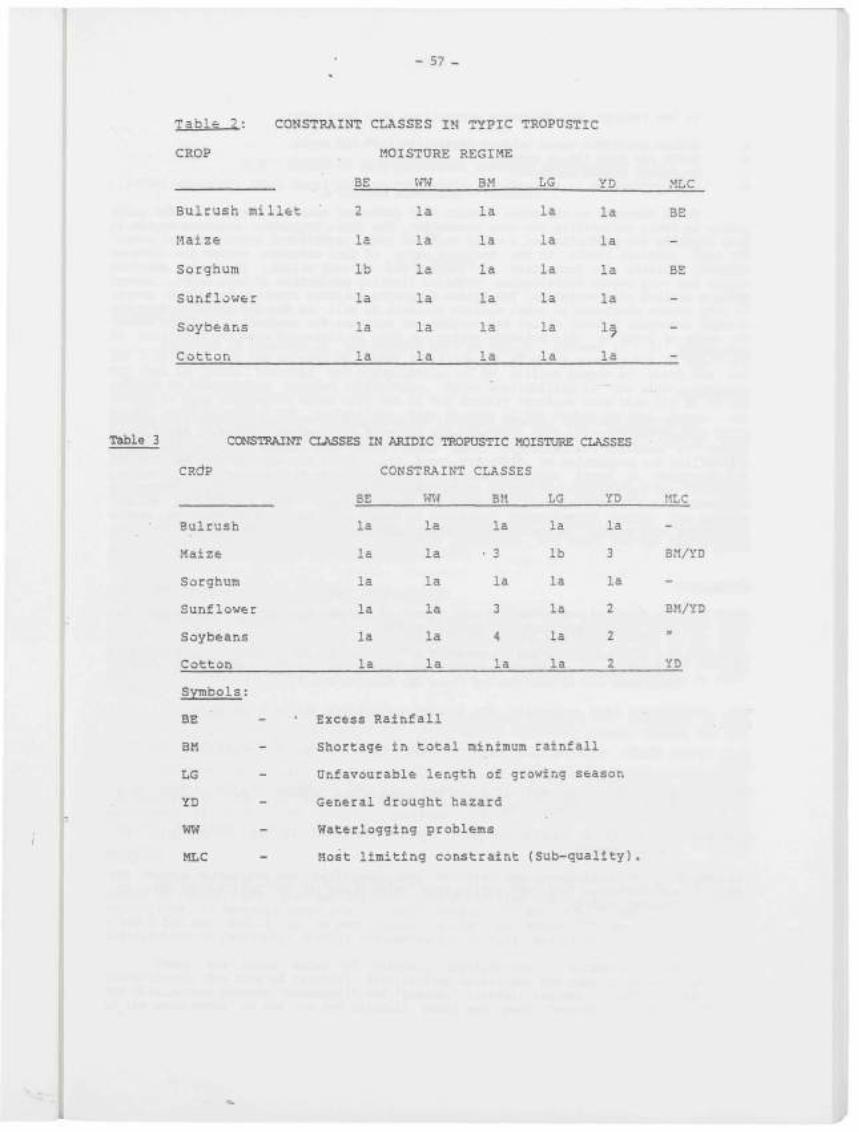
- 57 -
Table 2: CONSTRAINT CLASSES IN TYPIC TROPOSTIC
CROP MOISTURE REGIME
BE WW BM LG YD MLC
Bulrush mi
Maize
Sorghum
Sunflower
Soybeans
Cotton
llet • 2
la
lb
la
la
la
la
la
la
la
la
la
la
la
la
la
la
la
la
la
la
la
la
la
la
la
la
la
1^
la
BE
-
BE
-
-
-
CONSTRAINT CLASSES IN ARIDIC TROPUSTIC MOISTURE CLASSES •
CRdP CONSTRAINT CLASSES
BE WW BM LG YD MLC
Bul rush l a l a
Maize l a l a • 3 lb 3 BH/YD
Sorghum la l a
Sunflower la la 3 la 2 BM/YD
Soybeans la la
Cotton la la la la 2 YD
Symbols:
BE - • Excess R a i n f a l l
BM - Shor tage i n t o t a l minimum r a i n f a l l
LG - Unfavourable l e n g t h of growing season
YD - General d r o u g h t haza rd
WW - Water logging problems
MLC - Most l i m i t i n g c o n s t r a i n t (Sub-qua l i t y )
la
3
la
3
4
la
la
lb
la
la
la
la
la
3
la
2
2
2
- 58 -
In the ratings, the following assun jtions have been made:
a. Medium available water holding capacities (100-150 im/m) b. Soils are deep (Im or more) c. No gravel within Im depth. d. Crop production is exclusively rainfed and at high input level (Veldkamp 1987b).
It is observed in the above results that different moisture regimes differ quite widely in their suitability for crop production. The Typic Tropustic moisture regime is more suitable for production of a wider range of both traditional and commercial crops. The high rainfall levels in the northern parts of this moisture regime are however somev^at limiting for production of sorghum and bulrush millet. The Aquic moisture regime has very severe waterlogging problems limiting production of most crops, except perhaps wetland rice varieties. The Aridic Tropustic moisture regime experiences severe to very severe shortages in total minimum rainfall as well as drought hazards. Only the drought resistant bulrush millet and sorghum are suitable for production in these areas. The range of crops in this moisture regime can only be increased with the provision of irrigation.
CONCLUSION
Three soil moisture regimes (Aquic, Typic Tropustic and Ardic Tropustic) occur, their boundaries approximately coincide with those of the country's rainfall belts. With regard to moisture availability, these zones have been shown to vary in their suitability for production of different crops. Thus while the general drought hazards and shortages in total minimum rainfall severely limit the production of maize, sunflower and soybeans in the drier South, these crops are highly suited for extensive cultivation in the North. In the South, the most suitable crops are bulrush millet, sorghum and cotton. Waterlogging problems in areas with Aquic soil moisture regime constitute very severe constraints for the production of most crops except, perhaps, paddy rice.
INTI
29° the eng< fact annv vari avai suit
inf]
for the
REFEIRENCEIS
Banda D.J. A detailed/semi-detailed soil survey of Chikwangala Farms. Soils Report No. 1988 188. Soil Survey Unit, Mt. Makulu, Zambia.
Bunyolo A.M., A. Commissaris and Hennemann G.R. Rating of land qualities, soil moisture 1982 and climatic conditions and their conversion into land suitability in Zambia.
Soil Bui. No. 5. Soil Survey Unit, Mt. Makulu, Zambia.
FAO. Guidelines: Land evaluation for rainfed agriculture. Soils Bulletin No. 52, 1983 Rome.
Soil Survey Staff. Keys to soil taxonony. SMSS Tech. Mono. No. 6. Ithaca, New York. 1987
Van Wambeke A. Calculated soil moisture and ten^rature regimes of Africa. SMSS Tech. 1982 Mono. No. 3. Ithaca, New York.
Veldkamp W.J. Soils of Zambia (2nd ed.). Soils Bulletin No. 13, Soil Survey Unit, Mt. 1987a Makulu, Zambia.
Veldkan j W.J. Reconnaissance/semi-detailed semi-quantified land evaluation system for 1987b non-irrigated (rainfed) agriculture. Tech. Guide No. 19. Soil Survey Unit, Mt.
Makulu, Zambia.
COM
tope zonï zons supï limj
bar wate
clin avai deve the
Rair
amov agr i 1 OC dist
t rar The of t
- 59 -
6.8 BATINQ OF LAND QUALITIES: NOISTUBE AVAILABILITY
A OCXJNTRY APPRAISAL - TANZANIA
by
S.E. Mugogo
INTHOUUCnCN
Tanzania is situated in the Eastern part of Africa, between 1° - 12° South and 29° - 41° East. It has an area of about 1 million km^ of v^ich roughly 90% is land and the rest is water. Tanzania has a population of 25 million people of v^ich 90% are engaged in subsistence rainfed agriculture. Water availability is the major limiting factor to crop production since only 20% of the country receives more than 750 mm of the annual rainfall with a 90% probability. Even in many of the higher rainfall areas, the variability of rainfall in space and time is so great that the assessment of water availability for crop based on climate parameters forms an iitportant part of land suitability evaluation.
Land quality is a con jlex attribute of the land with a distinct and individual influence on the suitability of land for a specific kind of use (FAO 1976).
Moisture availability: this land quality refers to the availability of moisture for plant growth as determined by water supply (rainfall), and water storage capacity of the soil and water out-take by evapotranspiration.
CHARACTERISTICS AFFECTING MOISTURE AVAILABILITY
Moisture availability is a function of the climate, soil physical condition and topography. Water, to be supplied by the soil to the plants is either stored in the root zone or rises by upward flow from the water table or the unsaturated subsoil to the root zone. Moisture availability is therefore defined as the amount of water v*iich can be supplied to a crop in a well defined dry year vrfien the moisture supply capacity is most limiting.
"Available water" is defined as water held between pressing the potential of 1/3 bar (33 KPa) (field capacity) and (1 500 K.Pa) 15 bar (wilting point). Values (in mm water) are acc lmulated for the depth of rooting.
Moisture availability: as indicated elsevrtiere, land quality is determined by climate, soil and topographic factors. Climatic factors v^ich influence moisture availability include rainfall and evapotranspiration. Water is a key factor in the development of Tanzania and clearly, therefore, rainfall together with evaporation are the most inportant climatic elements.
Rainfall
Rainfall to a large extent determines the length of the growing period. The total amount of rainfall per year and its distribution in time and space greatly influences agriculture. In Tanzania there are 5 rainfall belts (<500 mm; 500-800 mm; 800-1 000 mm, 1 000-1 500 mm; and >1 500 mm mean annual rainfall per annum). The seasonal rainfall distribution in particular greatly influences agricultural practices.
There are three modes of rainfall distribution : Monomodal, bimodal and transitional. The mode of rainfall distribution determines the type of growing period. The distinction between "monomodal" and "bimodal" rainfall regimes is made on the basis of the occurrence of one or two rainfall peaks per year. Therefore in areas with a
- 60 -
monomodal and transitional mode of rainfall there is one growing period and in a bimodal pattern of rainfall there are usually two growing periods per year. Single growing periods are usually suited for annual crops because the growing period is concentrated. In contrast, double growing periods are usually better suited for perennial crops. The separation of single from double growing period areas is based on the following criteria:
a separation is only necessary if the secondary growing season is sufficiently long and reliable to influence agriculture
the dry period between the two growing periods should be of such intensity that in most years soil moisture storage cannot compensate for inadequate rainfall and therefore cultivation of rainfed annuals is virtually excluded. In general it can be pointed out that rainfall is more reliable in areas with a monomodal pattern of rainfall than in areas with a bimodal pattern of rainfall.
Another very iitpDrtant aspect of climate to be considered in land evaluation is rainfall variability. This factor affects crop production in two ways:
The time and duration of the growing season may vary considerably;
Short term dry'spells may occur within the growing season. The first situation iitplies that in years with timely and long growing periods, crop growth conditions in respect of moisture availability may be excellent and result in bumper harvests. Years with untimely and too short growing periods, drought and crop failures may occur even in areas with high average rainfall. This high variability rainfall makes planning of agricultural operations, particularly planting of crops, extremely difficult.
Short term dry spells within the growing season are short rainless periods up to a few weeks in duration, v^ich may interrupt crop growth and reduce yields. Their impact in yields depends on their timing and the drought tolerance of the particular crop.
In areas with pronounced rainfall variability, a growing period that is based on average rainfall data has little practical meaning, because the growing period may vary greatly from year to year, in such areas the use of average data tends to mask extremes of moisture deficiencies and leads in general to an overestimation of the growing period and moisture availability. It becomes essential to analyse the variation of the growing periods by means of the total rainfall record rather than the' average data and to derive likely conditions of moisture availability.
Rainfall intensity, duration and frequency
The foregoing rainfall characteristics are of great inportance in assessing both soil erosion and effective rainfcüLl. The latter refers to the rainfall that enters the soil and remains within the root zone. High rainfall intensity results in thunderstorms with an intensity that exceeds the threshold level at which rainfall becomes erosive. Moreover large storms of high intensity will result in considerable water losses by surface runoff and by deep percolation beyond the rooting zone, thus reducing the effective rainfall.
The soil factors vrtiich should be taken into account include particle-size distribution, bulk density, moisture retention and effective depth. These factors affect the inherent capacity of soils to store moisture within a given depth (the available waterholding capacity or AWC, expressed in xam/m).
There have been many studies carried out in Tanzania to determine moisture availability. However, two such studies warrant discussion since the results emanating from them are widely used at the moment at the national level.
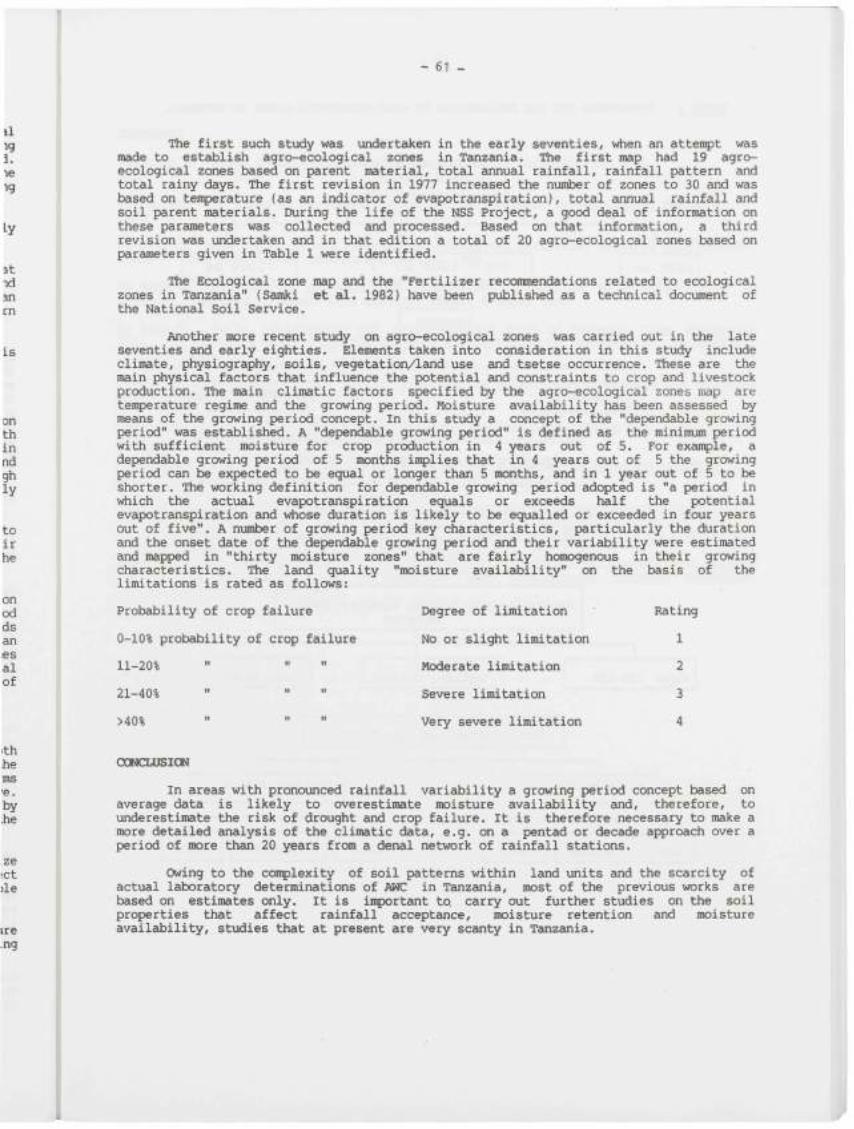
- 61 _
The first such study was undertaken in the early seventies, v^en an attempt was made to establish agro-ecological zones in Tanzania. The first map had 19 agro-ecological zones based on parent material, total annual rainfall, rainfall pattern and total rainy days. The first revision in 1977 increased the number of zones to 30 and was based on temperature (as an indicator of evapotranspiration), total annual rainfall and soil parent materials. During the life of the NSS Project, a good deal of information on these parameters was collected and processed. Based on that information, a third revision was undertaken and in that edition a total of 20 agro-ecological zones based on parameters given in Table 1 were identified.
The Ecological zone map and the "Fertilizer recommendations related to ecological zones in Tanzania" (Samki at êd. 1982) have been published as a technical document of the National Soil Service.
Another more recent study on agro-ecological zones was carried out in the late seventies and early eighties. Elements taken into consideration in this study include climate, physiography, soils, vegetation/land use and tsetse occurrence. These are the main physical factors that influence the potential and constraints to crop and livestock production. The main climatic factors specified by the agro-ecological zones map are temperature regime and the growing period. Moisture availability has been assessed by means of the growing period concept. In this study a concept of the "dependable growing period" was established. A "dependable growing period" is defined as the minimum period with sufficient moisture for crop production in 4 years out of 5. For exanple, a dependable growing period of 5 months implies that in 4 years out of 5 the growing period can be expected to be equal or longer than 5 months, and in 1 year out of 5 to be shorter. The working definition foir dependable growing period adopted is "a period in Tirfiich the actual evapotranspiration equals or exceeds half the potential evapotranspiration and vrtiose duration is likely to be equalled or exceeded in four years out of five". A number of growing period key characteristics, particularly the duration and the onset date of the dependable growing period and their variability were estimated and mapped in "thirty moisture zones" that are fairly homogenous in their growing characteristics. The land quality "moisture availability" on the basis of the limitations is rated as follows:
Probability of crop failure
0-10% probability of crop failure
11-20% " " "
21-40%
>40% " " "
Degree of limitation
No or slight limitation
Moderate limitation
Severe limitation
Very severe limitation
Rating
1
2
3
CC3NCLÜSIGN
In areas with pronounced rainfall variability a growing period concept based on average data is likely to overestimate moisture availability and, therefore, to underestimate the risk of drought and crop failure. It is therefore necessary to make a more detailed analysis of the climatic data, e.g. on a pentad or decade approach over a period of more than 20 years from a denal network of rainfall stations.
Owing to the con )lexity of soil patterns within land units and the scarcity of actual laboratory determinations of AWC in Tanzania, most of the previous works are based on estimates only. It is inpsrtant to. carry out further studies on the soil properties that affect rainfall acceptance, moisture retention and moisture availability, studies that at present are very scanty in Tanzania.
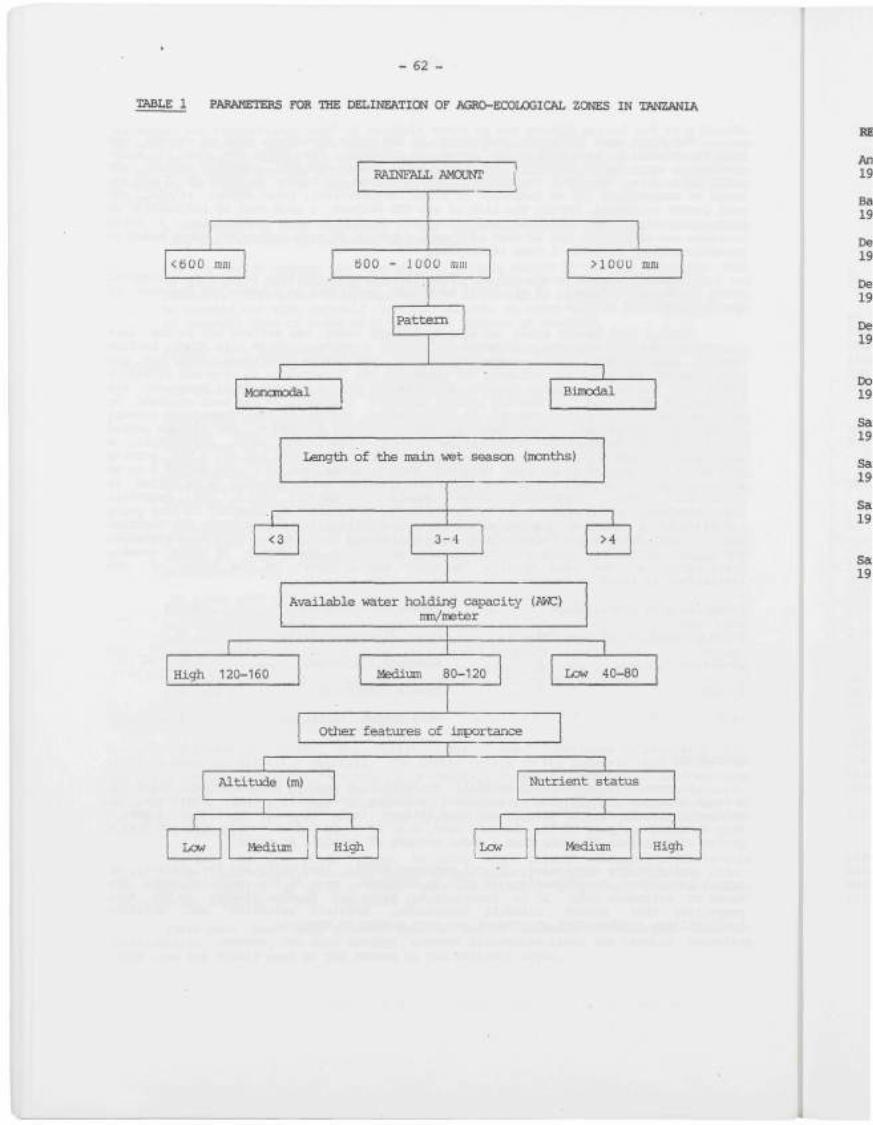
- 62
TABLE 1 PARAMETERS FOR THE DELINEATICW OF AGRO-ECOLOGICAL ZONES IN TANZANIA
<6Ü0 mm
RAINFAT.L AMOUNT j'
Ö00 - 1Ü0Ü mm > 1 0 ü ü mm
Moncrnodal
j — ^ — 1 P a t t e r n
^
Bimodal 1
Length of the main wet season (months)
<3 3-4 >4
Avai l ab le water ho ld ing c a p a c i t y (AWC) ram/meter
High 120-160 lïfediijm 80-120 Low 40-80
Other f e a t u r e s of i i rportance
Altitxade (m) Nutrient status
Low
1 Medi\3m High 1 Low Medium High
REFERENCE
Anderson B. Soils of Tanganyika. Min. of Agriculture. Bull. No. 16, 36p. 1963
Baker R.M. The soils of Tanzania. Ministry of Agriculture, Dar-es-Salaam, Mimeo. 1970
De Pauw E. Soil survey report of Geita and Sengerema Districts. National Soil Service, 1982a AG: URT/73/006, Technical Report 3. 198p.
De Pauw E. Agricultural potential and constraints in relation to growing periods in 1982b Tanzania. National Soil Service. Mimeo, 8 maps, 45p.
De Pauw E. Soils, physiography and agroecological zones of Tanzania. Crop Monitoring 1984 and Early Warning Systems Project, GCPS.URT/047/TSIET. Ministry of Agriculture,
FAO.
Doorenbos J. and A.H. Kassam. Yield response to water. FAO Irrigation and drainage 1979 paper No. 33. FAO, Rome.
Samki J.K. Provisional soil map of Tanzania, Surveys and Mapping Division, Min. of 1977 Lands, Dar-es-Salaam.
Samki J.K. and H.C. Dewan. Ecological zones map of Tanzania (Third revision). Taro 1981 Agricultural Research Institute, Mlingano, Tanzania.
Samki J.K. and H.C. Dewan. Rating of land qualities and their conversion into land 1982 suitability with particular enphasis on soil moisture storage and climate
conditions in Tanzania. World Soil Resources Report No. 54, pp 13-29, FAO, Rome.
Samki J.K., J.F. Harrop, Dewan H.C. and F.K. Miany. Fertilizer recommendations related 1982 to ecological zones in Tanzania. TARO Agricultural Research Institute,
Mlingano, Tanzania.
I
y
- 65 -
6.9 FATING OF LAND QUALITY: MOISTURE AVAILABILITY
A CXXJNTRY APPRAISAL - SUDAN
by
Abdulla Hassan Hag
1. INTROTÜCTICN
The capacity of soils to absorb and retain water may provide valuable information as to the amovuit that can be stored at a given time as a reservoir from which plants may draw their water needs. An initial determinant to moisture availability is the soil water balance. This balance is an interplay between amount of water - rainfall or irrigation - infiltration, run-off, drainage and evapotranspiration. These attributes of the physical environment have been studied and various soil water constants have been defined and used as indices for soil water holding capacity and plant available water.
Moisture availability as a land quality is an expression of the way in which the relevant land characteristics of the physical environment interact to meet the water requirement of a specific kind of land use.
Rating of land quality is determined by the degree or severity of the limitations that land characteristics may impose on land use.
2. AVAILABLE WATER CAPACITY
Available water capacity (AWC) is determined by soil physical characteristics, such as texture, structure and soil depth. AWC is usually an estimate from the difference between water content at field capacity (FC), and water content at permanent wilting point (PWP). The accuracy of the estimation of AWC is therefore dependent upon the reliability of estimates made for FC and PWP.
2.1 Field Capacity Concept
Field capacity is defined as the amount of water held by the soil after excess gravitational water has drained away and the rate of downward movement of water has materially decreased - two to three days after irrigation. However, the moisture held by the soil at 0.33 bar has been found to be closely correlated with field capacity for many soils. In soils with extremely low permeability and under humid climate, it is difficult to evaluate the upper limit of available water according to the procedure defined by field capacity. Under such conditions the upper limit of AWC is specified by the true equilibrium water content (Peters 1965). For irrigated Gezira Vertisols, it has been demonstrated by Farbrother (1972-86), that calculation of AWC is only of practical value vrtien the saturation capacity is used to define the upper limit of AWC.
2.2 Permanent Wilting Point Concept (PWP)
The permanent wilting point is defined as the water content of the soil when plants growing on that soil are reduced to a permanent wilt condition from vrtiich plants cannot recover in an approximately saturated atmosphere. The 15-bar moisture content has been found to be closely correlated with permanent wilting point (Richards and Weaver 1943).
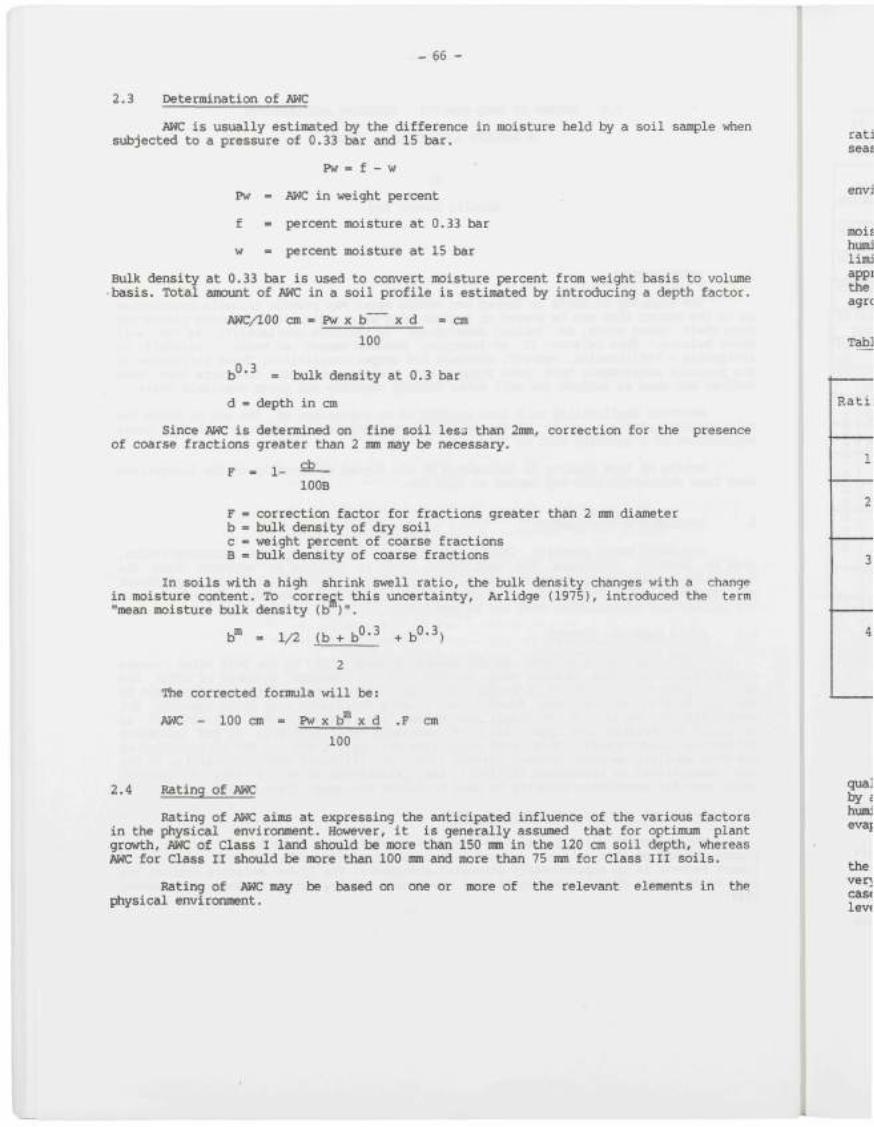
- 66 -
2.3 Determination of AWC
AWC is usually estimated by the difference in moisture held by a soil sample when subjected to a pressure of 0.33 bar and 15 bar.
Pw « f - w
Pw = AWC in weight percent
f = percent moisture at 0.33 bar
w = percent moisture at 15 bar
Bulk density at 0.33 bar is used to convert moisture percent from weight basis to volume -basis. Total amount of AWC in a soil profile is estimated by introducing a depth factor.
AWC/lOO cm = Pw X b" X d = cm
100
b°'^ = bulk density at 0.3 bar
d = depth in cm
Since AWC is determined on fine soil les3 than 2mm, correction for the presence of coarse fractions greater than 2 mm may be necessary.
cb F = 1-
lOOB
F = correction factor for fractions greater than 2 mm diameter b = bulk density of dry soil c = weight percent of coarse fractions B = bulk density of coarse fractions
In soils with a high shrink swell ratio, the bulk density changes with a change in moisture content. To correct this uncertainty, Arlidge (1975), introduced the term "mean moisture bulk density (b )".
m 1/2 (b + b°'^ + b°'^)
The corrected formula will be:
AWC - 100 cm = Pw X b"* X d .F cm
100
2.4 Rating of AWC
Rating of AWC aims at expressing the anticipated influence of the various factors in the physical envircmment. However, it is generally assumed that for optimiam plant growth, AWC of Class I land should be more than 150 mm in the 120 cm soil depth, whereas AWC for Class II should be more than 100 mm and more than 75 mm for Class III soils.
Rating of AWC may be based on one or more of the relevant elements in the physical environment.
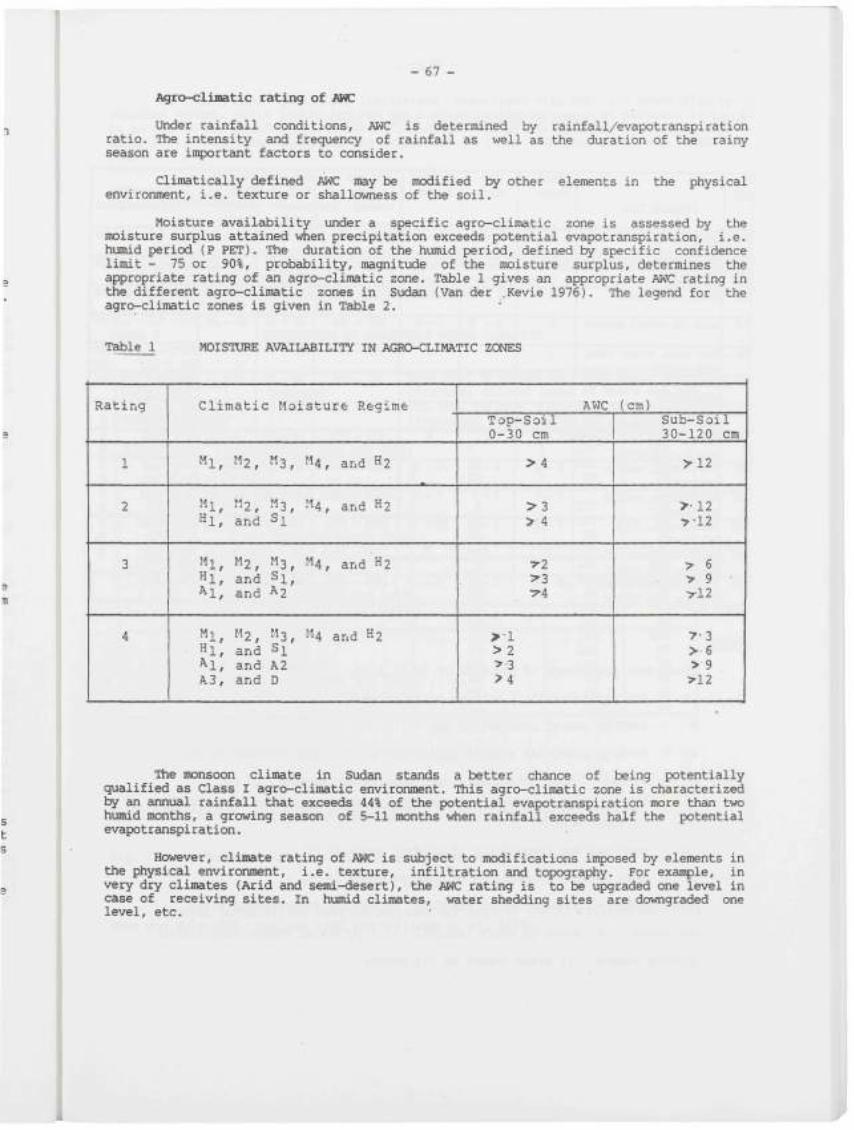
- 67 -
Agro-climatic rating of AWC
Under rainfall conditions, AWC is determined by rainfall/evapotranspiration ratio. The intensity and frequency of rainfall as well as the duration of the rainy season are important factors to consider.
Climatically defined AWC may be modified by other elements in the physical environment, i.e. texture or shallowness of the soil.
Moisture availability under a specific agro-climatic zone is assessed by the moisture surplus attained v^en precipitation exceeds potential evapotranspiration, i.e. humid period (P PET). The duration of the hvunid period, defined l^ specific confidence limit - 75 or 90%, probability, magnitude of the moisture surplus, determines the appropriate rating of an agro-climatic zone. Table 1 gives an appropriate AWC rating in the different agro-climatic zones in Sudan (Van der .Kevie 1976). The legend for the agro-climatic zones is given in Table 2. '
Table 1 MOISTURE AVAILABILITY IN AGRO-CLIMATIC ZONES
R a t i n g
1
2
3
4
C l i m a t i c M o i s t u r e Regime
M l , M2, " 3 , " 4 , and ^2
Ml, " 2 , " 3 , M4, and ^2 H i , a n d S i
Ml, M2, M3, M4, a n d ' H 2 H i , a n d S i , A l , a n d ^ 2
M l , M2, « 3 , t-U and H2 H i , a n d S i A i , a n d A2 A 3 , a n d D
AWC T o p - S o i l 0 - 3 0 cm
> 4
> 3 > 4
7-2 > 3 •74
> - l > 2 >-3 > 4
(cm) S u b - S o i l 3 0 - 1 2 0 cm
> 1 2
> - 1 2 >-12
> 6 > 9 >-12
7 -3 > 6 > 9
>12
The monsoon climate in Sudan stands a better chance of being potentially qualified as Class I agro-climatic environment. This agro-climatic zone is characterized by an annual rainfall that exceeds 44% of the potential evapotranspiration more than two humid months, a growing season of 5-11 months vrtien rainfall exceeds half the potential evapotranspiration.
However, climate rating of AWC is siobject to modifications imposed by elements in the physical environment, i.e. texture, infiltration and topography. For example, in very dry climates (Arid and semi-desert), the AWC rating is to be upgraded one level in case of receiving sites. In humid climates, water shedding sites are downgraded one level, etc.
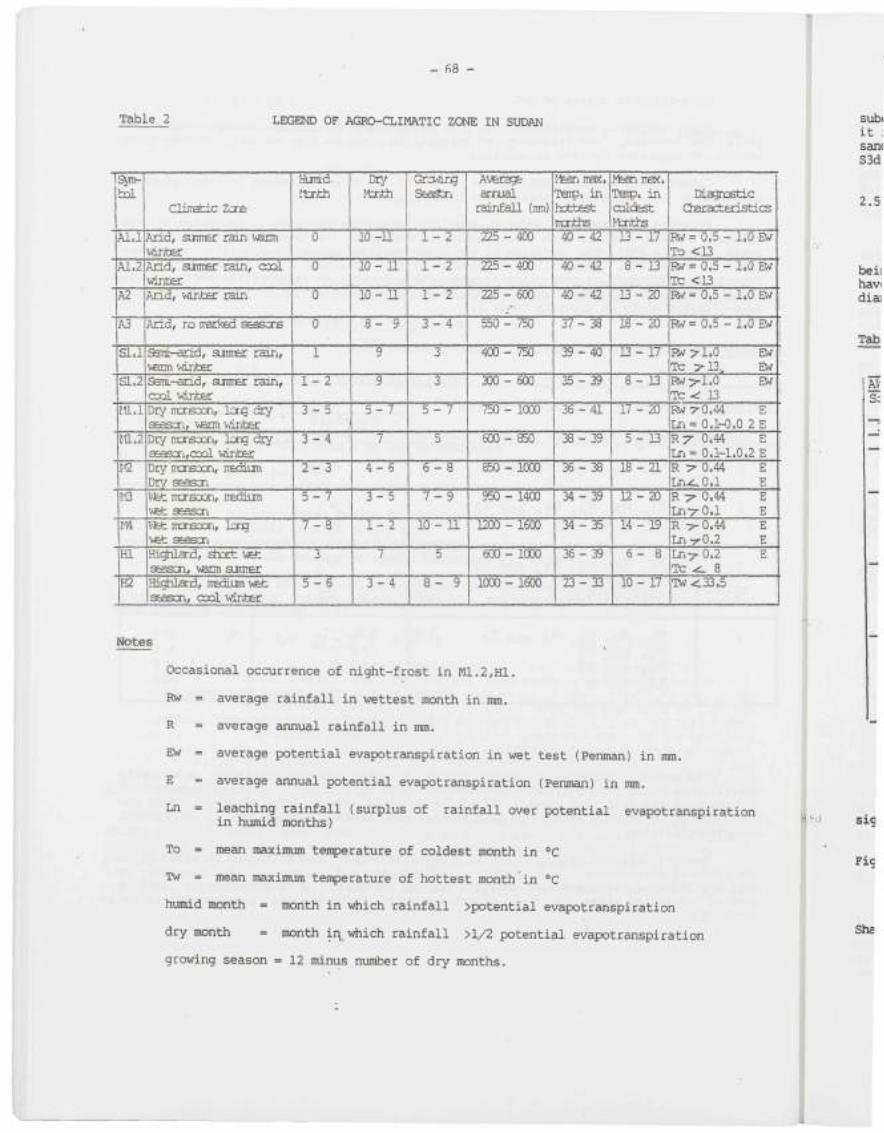
- 68 -
Table 2 LEGEND OF AGRO-CLIMATIC ZONE IN SUDAN
ISyrtt-
J A l . l '
A1.2
|A2
|A3
Sl . l
ISl.2
Itll.l
111.2
ll^
t-G
\m [HI"
H2
CliiTv=3tic Zcre
Arid, suntÊr ra in varm wixiter Arid, sumer rain, c x l winter Arid, vantec rain
Arid, ro marked seascrs
Sani-arid, sumer rain, varm wixiter Sam-and, samer rain, cod winter Dry mrTFoon, Icxg dry sbdscTi, varm variter Dry mrrRQcr., Icrg dry seasTijCxl winter Dry mcrsocti, mfcium Dry s s scn Vfet mcrsxTi, medium wet seascn Vfet mcrexTi, Icng Viet seascn .Highland, stort vet s=ascn, varm sutirer [Hii^iLard, nHÏJun vet iseasxi, cool winter
HuTid. t tnth
0
0
0
0
1
1 - 2
3 - 5
3 - 4
2 - - 3
5 - 7
7 - 8
3
5 - 6
Dry 1 ftoth
10-11 1
1 0 - 1 1
1 0 - 1 1
8 - 9
9
9
5 - 7
7
4 - 6
3 - 5
1 - 2
7
1 3 - 4
Gra-ir/g !
1 - 2
1 - 2
1 - 2
3 - 4
3
3
5 - 7
5
6 - 8
7 - 9
1 0 - n
5
8 - 9
Average arrual
rairfal l (irni)
225-400
725-400
225-600
550-750
400-750
300-600
750-1000
600-850
850-1000
^ - 1 4 0 0
1200 - 1600
600-1000
1000-1600
t-tan nsx. TaiD. in hottest iiuii±is 4 0 - 4 2
4 0 - 4 2
4 0 - 4 2
3 7 - 3 8
3 9 - 4 0
3 5 - 3 9
3 6 - 4 1
3 8 - 3 9
3 6 - 3 8
3 4 - 3 9
3 4 - 3 5
3 6 - 3 9
2 3 - 3 3
lyssannsx. Taip. in CDlcfest ^tnths
1 3 - 1 7
8 - 1 3
1 3 - 2 0
1 8 - 2 0
1 3 - 1 7
8 - 1 3
1 7 - 20
5 - B
1 8 - 2 1
1 2 - 2 0
1 4 - 1 3
6 - 8
10 - 17
Dtagncstic Gharacte-n s t ies
Rv= 0.5 - 1.0 Ew To <13 Rw= 0 . 5 - 1.0 Bv Tc <13 Rw= 0.5 - 1.0 Ew ;
ll
Rw= 0.5 - 1.0 erf j
Rw>1.0 EW ! Tc 5^13, EW Rw>-1.0 Ev; : 1te-< 13 ' Rw:^0.44 E Ln= 0.1-0.0 2 E RT" 0.44 E Ln= 0.1-1.0.2 E R T 0.44 E Lnx.0.1 E R -p- 0.44 E Ln-rO.l E R >-0.44 E Ln-rO.2 E Ln-7 0.2 E Tc - c 8 TH<33.5
Notes
Occasional occurrence of night-frost in Ml.2,Hi.
Rw = average rainfall in wettest month in mm.
R = average annual rainfall in mm.
Ew = average potential evapotranspiration in wet test (Penman) in mm.
E = average annual potential evapotranspiration (Penman) in mm.
Ln = leaching rainfall (surplus of rainfall over potential evapotranspiration in humid months)
To = mean maximum temperature of coldest month in °C
Tw = mean maximum temperature of hottest month in °C
humid month = month in vrtiich rainfall >potential evapotranspiration
dry month = month ir which rainfall >l/2 potential evapotranspiration
growing season = 12 minus number of dry months.

- 69 _
In rating land qualities, limitations associated with AWC are identified by a subclass symbol. Soils having low AWC get a climatic limitation C at subclass level; if it is due to low rainfall, a moisture limitation (m) at the subclass level; if it is a sandy soil, a siobclass depth (d) limitation and if it is a shallow soil, e.g. S3VC, S3m,
2.5 Prediction of AWC
AWC may be predicted from textural classes as shown in Table 3.
It can be seen in Table 3 that the loams and the clays stand a better chance of being qualified as a potential Class I land. But soils in the same texture class may have different amovmts of water, depending on the pres.ence of fractions greater than 2mm diameter. Gravelly clays are inferior to find sand. "
Table 3 ESTIMATION OF AVAILABLE WATER CAPACITY
AVC in cm. Soil depth
(cm) 3 - 30130-120
Textural class
Max.Vol. % coarse fraction allowed if soil is deep (v;eighted average
'
:>4
3 -4
2 - 3
1 - 3
^12
9 -12
6 - 9
3 - 6
Sandy clay loam and loam Clay loam, sandy clay, Clay Sandy loam, sandy clay loam Loam Clay loam and sandy clay Clay Loamy sand Sancty loam. Sandy clay loam and loam Clay loam and sandy clay Clay Fine sand Loamy sand^ Sandy loam' Sandy clay loam and loam Clay loam and sandy clay Clay
5 15 30
5 20 35 50 5 20 40 50 65 5 20 40 50 65 75
Min, soil depth all-l owed if there are ro coarse fragments (For AVC of Subsoil |
Hard 120 105 90
120 105 90 75 120 105 90 75 60, 120 105 90 75 60 50
Soft 1 100 85 75
100 85 70 55 1 100 85-70 55 40 1
100 85 70 55 45 40
AWC of soil may be predicted from other parameters. Abedine (1968) reported a significant correlation between ESP and AWC in Gezira Vertisols.
Fig. 1 The correlation is expressed by the equation
AWC % - 16.7 + ESP X 0.233
Similar correlations were established for some of the Australian Vertisols, e.g. Shaw and YUle 1978, Mullins 1981"and Williams et al. 1983.
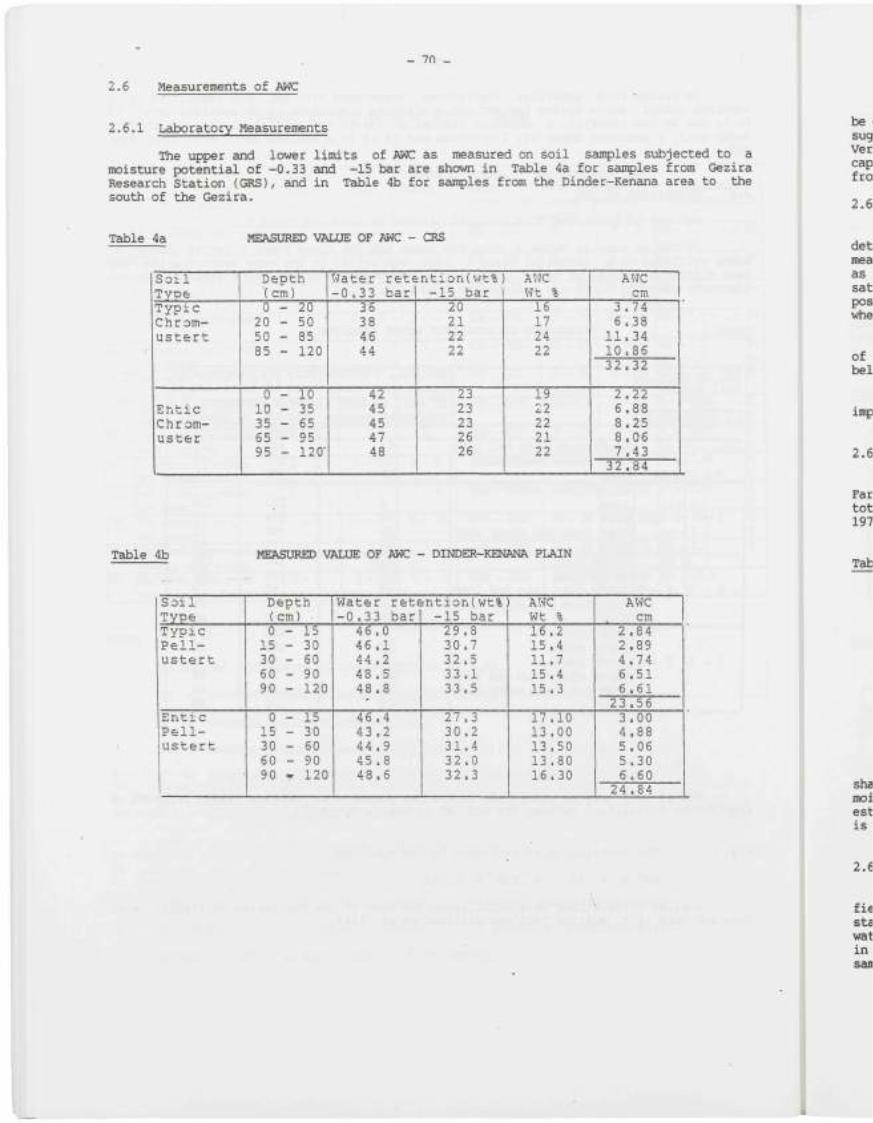
2.6 Measurements of AWC
- 7n _
2.6.1 Laboratory Measurements
The upper and lower limits of AWC as measured on soil samples si±)jected to a moisture potential of -0.33 and -15 bar are shown in Table 4a for san jles from Gezira Research Station (GRS), and in Table 4b for saitples from the Dinder-Kenana area to the south of the Gezira.
Table 4a MEASURED VALUE OF AWC - CRS
Soil Type Typic Chrom-ustert
Entic C h r om-uster
Depth (cin) 0 - 2 0
2 0 - 5 0 50 - 85 85 - 120
0 - 1 0 10 - 35 35 - 65 65 - 95 95 - 120-
•Jater retention(v/t% -0.33 barl -15 bar
36 38 46 44
42 45 45 47 48
20 21 22 22
23 23 23 26 26
AWC Wt % 16 17 24 22
19 22 22 21 22
AWC 1 cm
3.74 1 6.38
11.34 10.86 32.32
2.22 6.88 S.25 8.06 7.43 32.84
Table 4b MEASURED VALUE OF AWC - DINDER-KENANA PLAIN
Soil Type Typic Pell-ustert
Entic Pell-ustert
Depth (cm) • 0 - 1 5 15 - 30 30 - 60 60 - 90 90 - 120
0 - 1 5 15 - 30 30 - 60 60 - 90 90 . 120
Water retention(wt% -0.33 bar
46.0 46.1 44.2 48.5 48.8
46.4 43.2 44.9 45.8 48.6
-15 bar 29.8 30.7 32.5 33.1 33.5
27.3 30.2 31.4 32.0 32.3
AWC Wt % 16.2 15.4 11.7 15.4 15.3
17.10 13.00 13.50 13.80 16.30
AWC cm
2.84 2.89 4.74 6.51 6.61
23.56 3.00 4.88 5.06 5.30 6.60
24.84
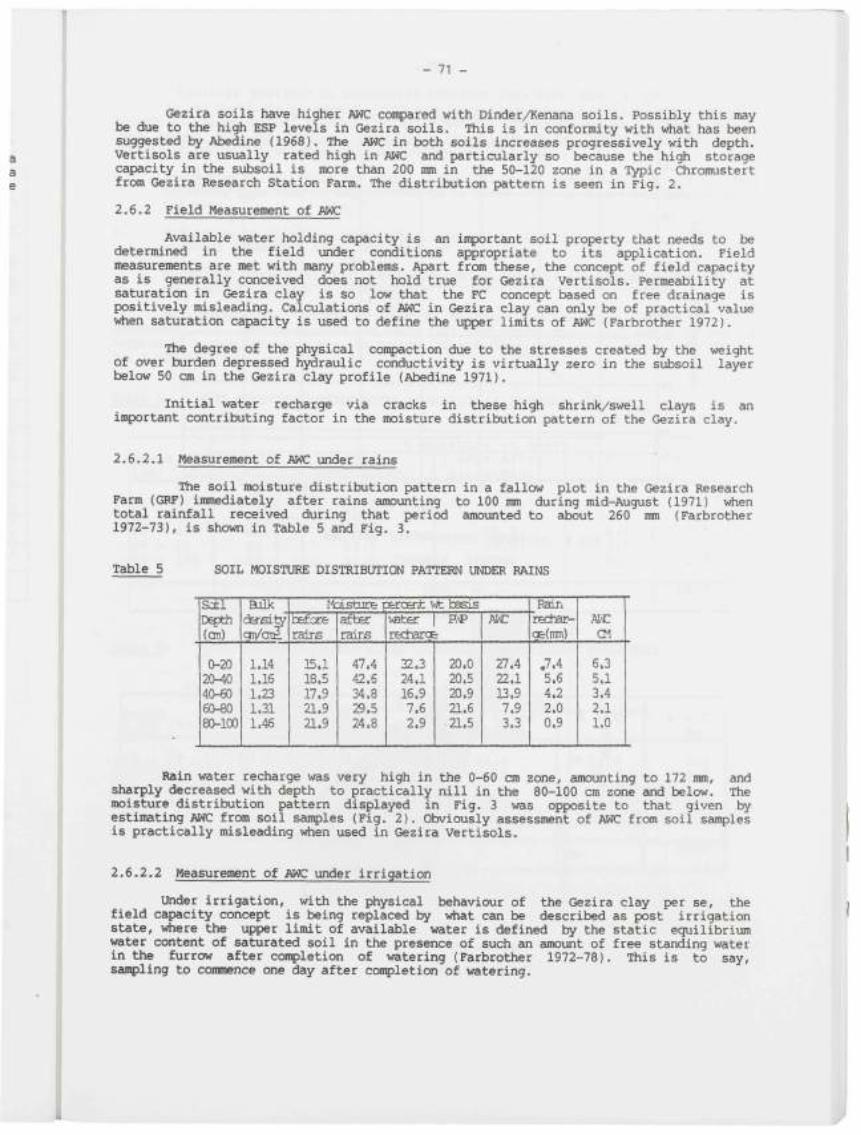
- 71 -
Gezira soils have higher AWC conpared with Dinder/Kenana soils. Possibly this may be due to the high ESP levels in Gezira soils. This is in conformity with vrtiat has been suggested by Abedine (1968). The AWC in both soils increases progressively with depth. Vertisols are usually rated high in AWC and particularly so because the high storage capacity in the subsoil is more than 200 mm in the 50-120 zone in a Typic Chromustert from Gezira Research Station Farm. The distribution pattern is seen in Fig. 2.
2.6.2 Field Measurement of AWC
Available water holding capacity is an inportant soil property that needs to be determined in the field under conditions appropriate to its application. Field measurements are met with many problems. ;^rt from these, the concept of field capacity as is generally conceived does not hold true for Gezira Vertisols. Permeability at saturation in Gezira clay is so low that the FC concept based on free drainage is positively misleading. Calculations of AWC in Gezira clay can only be of practical value vrtien saturation capacity is used to define the upper limits of AWC (Farbrother 1972).
The degree of the physical compaction due to the stresses created by the weight of over burden depressed hydraulic conductivity is virtually zero in the sx±)Soil layer below 50 cm in the Gezira clay profile (Abedine 1971).
Initial water recharge via cracks in these high shrink/swell clays is an inpartant contributing factor in the moisture distribution pattern of the Gezira clay.
2.6.2.1 Measurement of AWC \mder rains
The soil moisture distribution pattern in a fallow plot in the Gezira Research Farm (GRF) immediately after rains amounting to 100 mm during mid-August (1971) when total rainfall received during that period amounted to about 260 mm (Farbrother 1972-73), is shown in Table 5 and Fig. 3.
Table 5 SOIL MOISTURE DISTRIBUTION PATTERN UNDER RAINS
I.Sxl Depth (on)
0-20 2 0 ^ 40-60 60-80 80-100
Balk dersL^"
1.14 1.16 1.23 1.31 1.46
t'bistnirie percait vt bïsis hefcce rains
15.1 18.5 17.9 21.9 21.9
after rairjS
47.4 42.6 34.8 29.5 24.8
vater | R'P rechar^
32.3 24.1 16.9 7.6 2.9
20.0 20.5 20.9 21.6 21.5
AWC
27.4 22.1 13.9 7.9 3.3
_Pain rechar-< (nm)
.7.4 5.6 4.2 2.0 0.9
6.3 5.1 3.4 2.1 1.0
Rain water recharge was very high in the 0-60 cm zone, amounting to 172 mm, and sharply decreased with depth to practically nill in the 80-100 cm zone and below. The moisture distribution pattern displayed in Fig. 3 was opposite to that given by estimating AWC from soil saii?)les (Fig. 2). Obviously assessment of AWC from soil sanples is practically misleading when used in Gezira Vertisols.
2.6.2.2 Measurement of AWC under irrigation
Under irrigation, with the physical behaviour of the Gezira clay per se, the field capacity concept is being replaced by vrtiat can be described as post irrigation state, where the upper limit of available water is defined by the static equilibrium water content of saturated soil in the presence of such an amount of free standing water in the furrow after coitpletion of watering (Farbrother 1972-78). This is to say, san jling to commence one day after conpletion of watering.
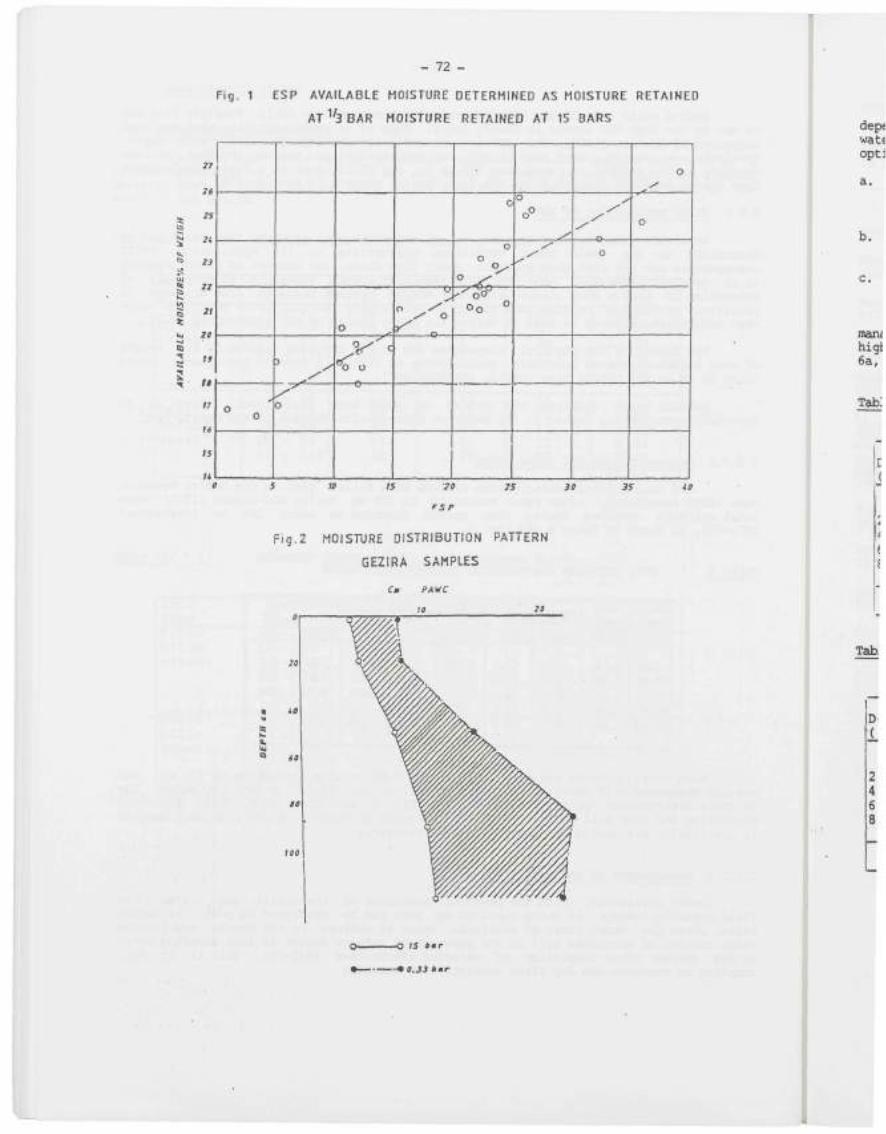
-12 -
Fig. 1 ESP AVAILABLE MOISTURE DETERMINED AS MOISTURE RETAINED
AT ""'a BAR MOISTURE RETAINED AT 15 BARS
a: to
Q
*
n\
26
25
2i
23
22
21
20
if
tt
11
16
IS
H
1
1 o 0
' / -
o
o
o
o o
o
o°
/ / y
/ " ^
/
o
o ^^ 1
o
10 15 '70
rs,P
2S 30 35 iO
Fig.2 MOISTURE DISTRIBUTION PATTERN
GEZIRA SAMPLES
Q
100
-O /5 * « r
••••0.33 * « r
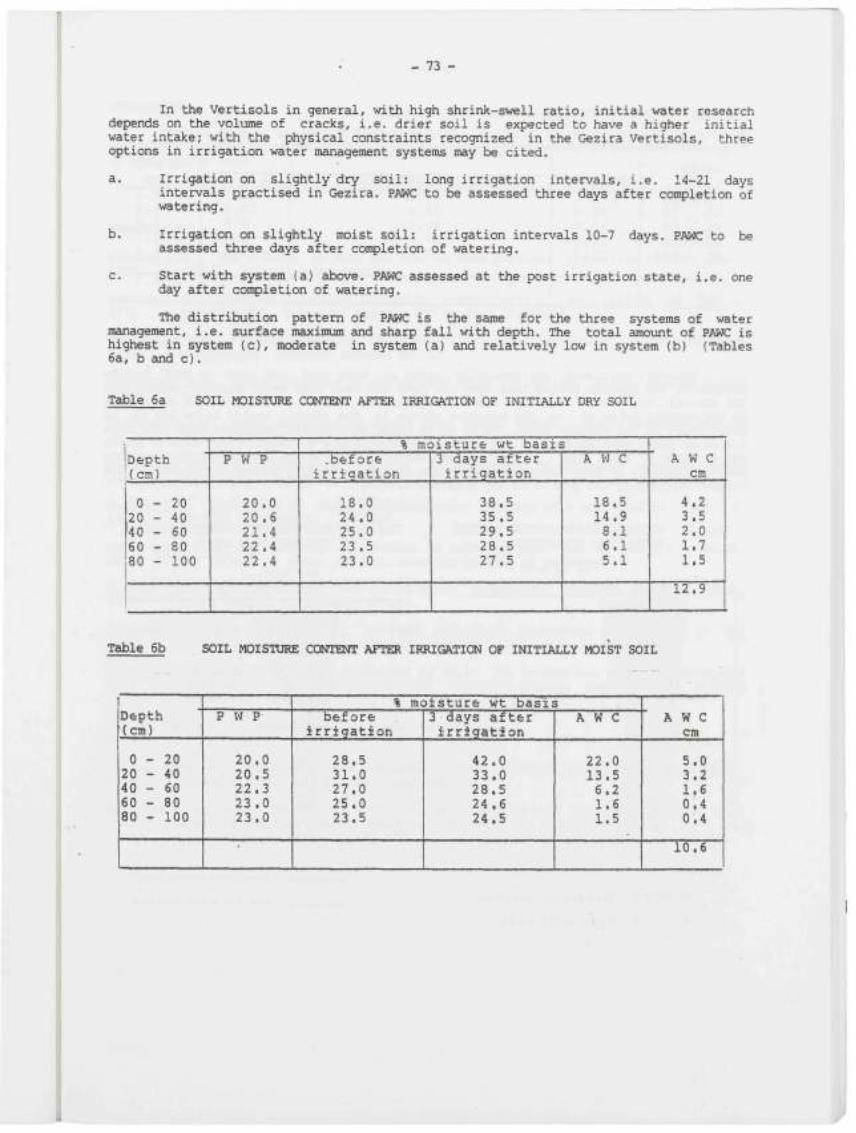
- 73 -
In the Vertisols in general, with high shrink-swell ratio, initial water research depends on the volume of cracks, i.e. drier soil is expected to have a higher initial water intake; with the physical constraints recognized in the Gezira Vertisols, three options in irrigation water management systems may be cited.
a. Irrigation on slightly' dry soil: long irrigation intervals, i.e. 14-21 days intervals practised in Gezira. PAWC to be assessed three days after completion of watering.
b. Irrigation on slightly moist soil: irrigation intervals 10-7 days. PAWC to be assessed three days after coii?)letion of watering.
c. Start with system (a) above. PAWC assessed at the post irrigation state, i.e. one day after completion of watering.
The distribution pattern of PAWC is the same for the three systems of water management, i.e. surface maximum and sharp fall with depth. The total amount of PAWC is highest in system (c), moderate in system (a) and relatively low in system (b) (Tables 6a, b and c).
Table 6a SOIL MOISTURE CONTENT AFTER IRRIGATION OF INITIALLY DRY SOIL
Depth (cm)
0 - 2 0 20 - 40 140 - 60 [60 - 80 80 - 100
P W P
20.0 20.6 21.4 22.4 22.4
% moisture wt basis .before
irrigation
18.0 24.0 25.0 23.5 23.0
3 days after irrigation
38.5 35.5 29.5 28.5 27.5
A W C
18.5 14.9 8.1 6.1 5.1
A W C cm
4.2 3.5 2.0 1.7 1.5
12.9
Table 6b SOIL MOISTURE CONTENT AFTER IRRIGATION OF INITIALLY MOIST SOIL
Depth (cm)
0 - 2 0 20 - 40 40 - 60 60 - 80 80 - 100
P W P
20.0 20.5 22.3 23.0 23.0
% moisture wt basis before
irrigation
28.5 31.0 27.0 25.0 23.5
3 days after irrigation
42.0 33.0 28.5 24.6 24.5
A W C
22.0 13.5 6.2 1.6 1.5
• A W C cm
5.0 3.2 1,6 0.4 0.4
10.6
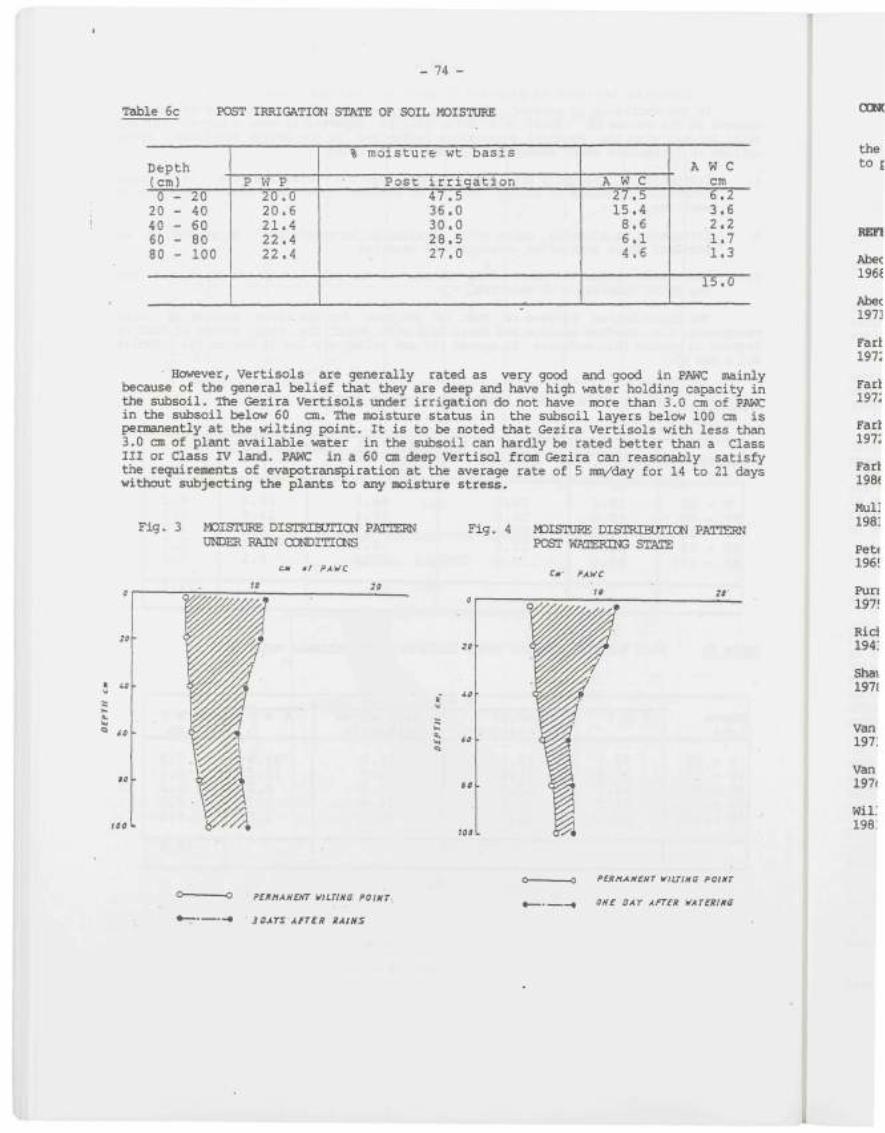
- 74 -
Table 6c POST IRRIGATION STATE OF SOIL MOISTURE
Depth (cm) 0 - 2 0
20 - 40 40 - 60 60 - 80 80 - 100
P W P 20.0 20.6 21.4 22.4 22.4
% moisture wt basis
Post irrigation 47.5 36.0 30.0 28.5 27.0
A W C 27.5 15.4 8.6 6.1 4.6
A W C cm 6.2 3.6 .2.2 1.7 1.3
15.0
• However, Vertisols are generally rated as very good and good in PAWC mainly because of the general belief that they are deep and have high water holding capacity in the subsoil. The Gezira Vertisols luider irrigation do not have more than 3.0 cm of PAWC in the subsoil below 60 cm. The moisture status in the subsoil layers below 100 cm is permanently at the wilting point. It is to be noted that Gezira Vertisols with less than 3.0 cm of plant available water in the sx±)soil can hardly be rated better than a Class III or Class rv land. PAWC in a 60 cm deep Vertisol from Gezira can reasonably satisfy the requirements of evapotranspiration at the average rate of 5 mm/day for 14 to 21 days without subjecting the plants to any moisture stress.
Fig. 3 MOISTURE DISTRIBUTICN PATTERN UNDER RAIN CCNDITrCNS
Fig. 4 MOISTURE DISTRXBOTIO^ PATTERN POST WATERING STATE
CM if PAVC
JO 20
( t,a
0 .
C3
100 *-
Cm- PAWC
10 20-
20
a,
Q
100
PSHMAHEMT Vimna POIMT
— — — o PERHAHEHT WILTlHa POIHT.
-. - • 3ajiYS AfTER SAIMS
- _ , OHS DAY AFTER WATERIJtC
- 75 -
CONCLUSIGN
PAWC in subsoil layers of Vertisols needs critical reevaluation. The stress of the weight of the over burden reduces the hydraulic conductivity in the subsoil layers to practically zero.
Measurements of PAWC in the laboratory gave misleading results.
REFERENCES
Abedine A.Z. The effects of ESLP and SAR on some physical properties of the Gezira 1968 soils. Private communication.
Abedine A.Z. Factors affecting hydraulic conductivity in soil profile of Gezira. 1971 J^pendix III, Technical Report, FAO Project SF/SUD/15.
Farbrother H.C. Field behaviour of Gezira clay vinder irrigation. Cotton Research 1972a Corporation. Research Memoirs No. 82.
Farbrother H.C. Field behaviour of Gezira clay \ander irrigation. Cotton Growing Review 1972b vol. 49 : 1972
Farbrother H.G. Water relations of Gezira clay. Annual Report, Gezira Research Station 1972c and Sub-stations, 1971/72 season.
Farbrother H.G. Supplementary irrigation. In: Management of Vertisols under semi-arid 1986 conditions. IBSRAM Proceedings No. 6.
Mullins J.A. Estimation of plant available water capacity of a soil profile. Aust. J. 1981 of Soil Research 19 : 197-207.
Peter D.B. Water availability. In: Methods of soil analysis. Ed. in Chief, C.A. Black. 1965 No. 9, Part I, Chap. 19. Pub. American Society of Agronony.
Purnell M.F. Soil conditions and cotton yield in selected Hawashas of Laota Block. 1975 Sudan Gezira. Soil Survey Report.
Richards L.A. and L.R. Weaver. Fifteen atmosphere percentage as related to the 1943 permanent wilting point percentage of soils. Soil Sci. 56 : 331-340.
Shaw R.J. and D.F. Yule. The assessment of soils for irrigation. Emerald Queensland 1978 Tech. Report No. 13, Agricultural Chemistry Branch, Department of Primary
Industries, Brisbane.
Van der Kevie W. Climatic zones in Sudan. SSA-Wad Medani. 1973
Van der Kevie W. Manual for land suitability classification for Agriculture. Part I. 1976 Technical Bull. No. 21, SSA - Wad Medani.
Williams J. et ad. The influence of texture, structure and clay mineralogy on soil 1983 moisture characteristics. Aust. J. Soil Res., 21: 15-32.
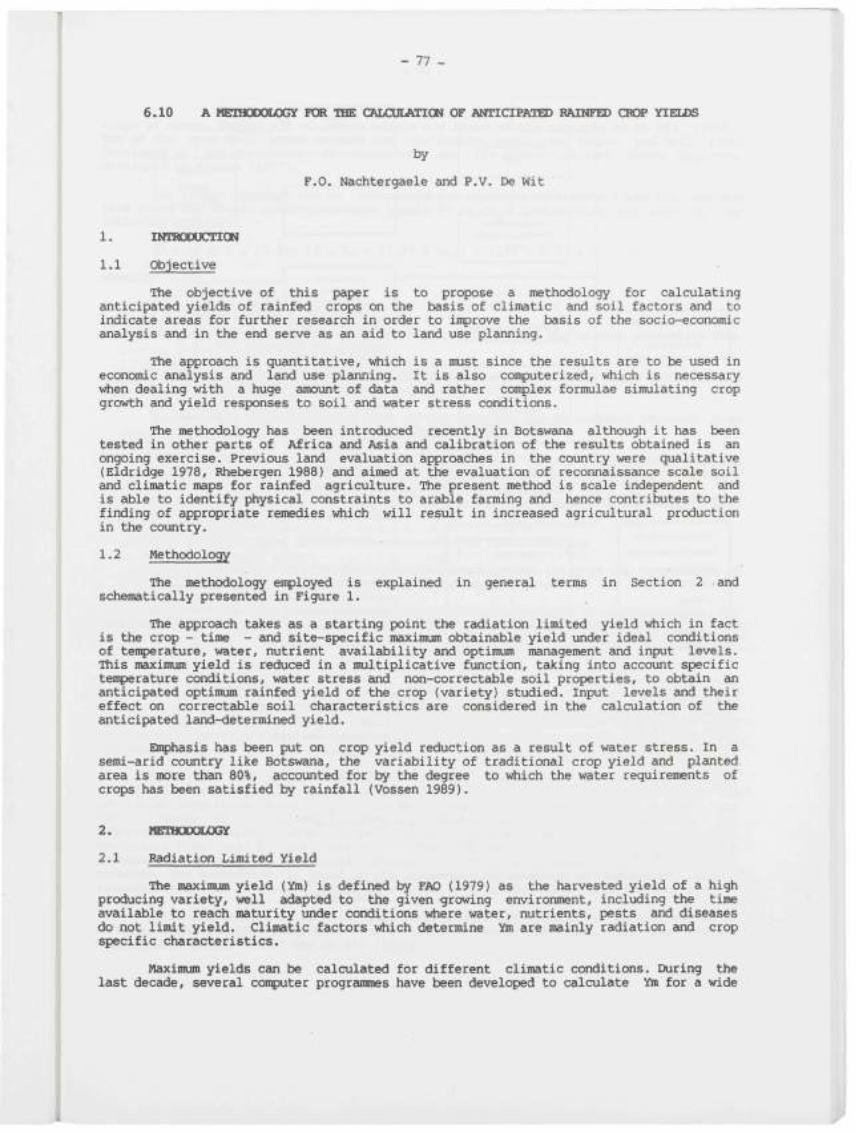
- 77 -
6.10 A NETBOOQLOGY POR THE CALCÜLATIGN OF ANTICIPAraD RAINFED CROP YIEIiJS
by
F.O. Nachtergae le and P.V. De w i t
1 . INUCDUCnCN
1.1 objective
The objective of this paper is to propose a methodology for calculating anticipated yields of rainfed crops on the basis of climatic and soil factors and to indicate areas for further research in order to iirprove the basis of the socio-economic analysis and in the end serve as an aid to land use planning.
The approach is quantitative, which is a must since the results are to be used in economic analysis and land use planning. It is also computerized, vrtiich is necessary when dealing with a huge amount of data and rather complex formulae simulating crop growth and yield responses to soil and water stress conditions.
The methodology has been introduced recently in Botswana although it has been tested in other parts of Africa and Asia and calibration of the results obtained is an ongoing exercise. Previous land evaluation approaches in the country were qualitative (Eldridge 1978, Rhebergen 1988) and aimed at the evaluation of reconnaissance scale soil and climatic maps for rainfed agriculture. The present method is scale independent and is able to identify physical constraints to arable farming and hence contributes to the finding of appropriate remedies vrtiich will result in increased agricultural production in the country.
1.2 Methodology
The methodology enployed is explained in general terms in Section 2 and schematically presented in Figure 1.
The approach takes as a starting point the radiation limited yield which in fact is the crop - time - and site-specific maximum obtainable yield under ideal conditions of ten^jerature, water, nutrient availability and optimum management and input levels. This maximum yield is reduced in a multiplicative function, taking into account specific tenperature conditions, water stress and non-correctable soil properties, to obtain an anticipated optimum rainfed yield of the crop (variety) studied. Input levels and their effect on correctable soil characteristics are considered in the calculation of the anticipated land-determined yield.
Eiiphasis has been put on crop yield reduction as a result of water stress. In a semi-arid country like Botswana, the variability of traditional crop yield and planted area is more than 80%, accounted for by the degree to vrtiich the water requirements of crops has been satisfied by rainfall (Vossen 1989).
2. HEIHODQLOGÏ
2.1 Radiation Limited Yield
The maximum yield (Ym) is defined by FAO (1979) as the harvested yield of a high producing variety, well adapted to the given growing environment, including the time available to reach maturity under conditions where water, nutrients, pests and diseases do not limit yield. Climatic factors vrtiich determine Ym are mainly radiation and crop specific characteristics.
Maximum yields can be calculated for different climatic conditions. During the last decade, several coitpater programmes have been developed to calculate Yta for a wide
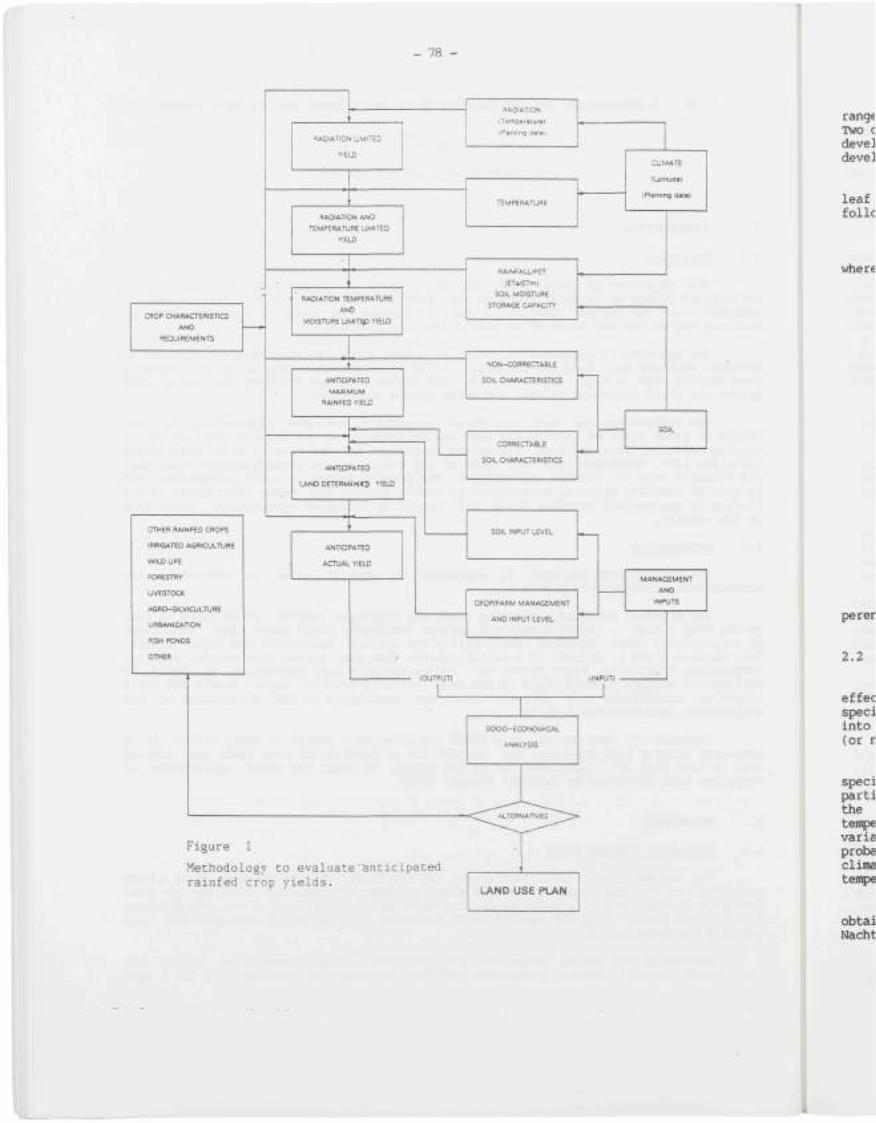
- 78 -
CBOP CHAHACTERISnCS
AND
•REQUIREMENTS
'
OTHER RAINFEO CROPS
IRRIGATED AGRICULTURE
WILD UfS
FORESTRY
UVESTOCK
AGRO-SILVICULTURE
URBANIZATION
nSH PONDS
OTHER
1 ^^AOIATION U.MITED
YIELD
RADIATION
iTemDeraluret
iPlaniinq aaiei
i RADIATION AND
TEMPERATURE UMITED
YIELD
'
RADIATION TEMPERATURE
A N O
MOISTURE U M I T ^ YIELD
-
TEMPERATURE
RAINFALUPET
(ETa/ETml
SOIL MOISTURE
STORAGE CAPACITY
CLJMATE
(Latitude!
(Planting dale)
-• ANTiapATED
MAXIMUM
RAINFED YIELD
'-
NON-CORRECTABLE
SOIL CHARACTERISTICS
.
ANTICIPATED
LAND DETERMi N«1) YIELD
_
ANTICIPATED
ACTUAL YIELD
CORRECTABLE
SOIL CHARACTERISTICS
SOIL INPUT LEVEL
SOIL
—
CHOP/FARM MANAGEMENT
AND INPUT LEVEL
MANAGEMENT
AND
INPUTS
lOUTPUn (INPUTI -
SOCIO-ECONOMICAL
ANALYSIS
Figure 1 Methodology to evaluate 'anticipated rainfed crop y ie lds .
LAND USE PLAN
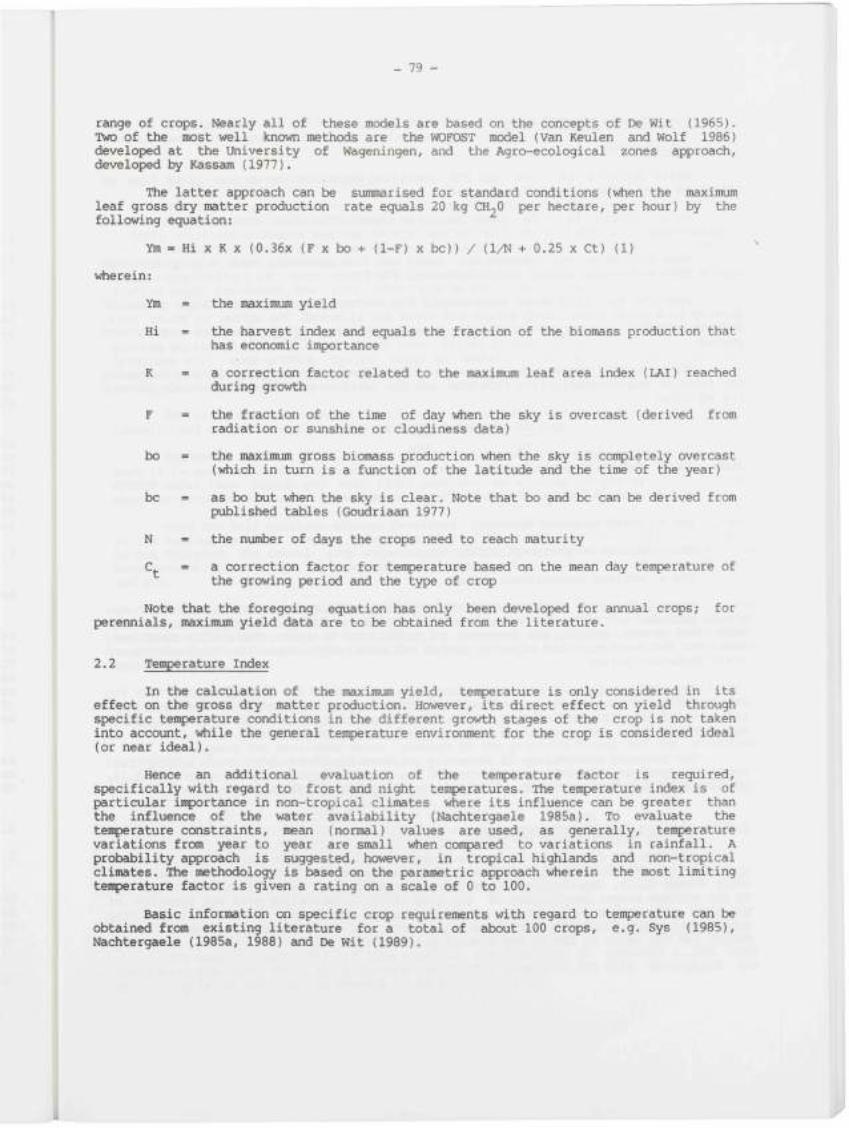
- 79 -
range of crops. Nearly all of these models are based on the concepts of De Wit (1965). Two of the most well known methods are the WOFOST model (Van Keulen and Wolf 1986) developed at the University of Wageningen, and the Agro-ecological zones approach, developed by Kassam (1977).
The latter approach can be summarised for standard conditions (vdien the maximum leaf gross dry matter production rate equals 20 kg CH2O per hectare, per hour) by the following equation:
Ym = Hi X K X (0.36x (F x bo + (1-F) x be)) / (1/N + 0.25 x Ct) (1)
\4ierein:
Ym = the maximum yield
Hi = the harvest index and equals the fraction of the biomass production that has economic importance
K = a correction factor related to the maximum leaf area index (LAI) reached during growth
F = the fraction of the time of day when the sky is overcast (derived from radiation or sunshine or cloudiness data)
bo = the maximum gross biomass production when the sky is completely overcast (v iich in turn is a fimction of the latitude and the time of the year)
be = as bo but when the sky is clear. Note that bo and be can be derived from published tables (Goudriaan 1977)
N = the number of days the crops need to reach maturity
C. = a correction factor for tenperature based on the mean day temperature of the growing period and the type of crop
Note that the foregoing equation has only been developed for annual crops; for perennials, maximum yield data are to be obtained from the literature.
2.2 Tertperature Index
In the calculation of the maximum yield, tenperature is only considered in its effect on the gross dry matter production. However, its direct effect on yield through specific temperature conditions in the different growth stages of the crop is not taken into account, while the general tenperature environment for the crop is considered ideal (or near ideal).
Hence an additional evaluation of the temperature factor is required, specifically with regard to frost and night temperatures. The temperature index is of particular inportance in non-tropical climates vrtiere its influence can be greater than the influence of the water availability (Nachtergaele 1985a). To evaluate the tenperature constraints, mean (normal) values are used, as generally, temperature variations from year to year are small v^en conpared to variations in rainfall. A probability approach is suggested, however, in tropical highlands and non-tropical climates. The methodology is based on the parametric approach v^erein the most limiting temperature factor is given a rating on a scale of 0 to 100.
Basic information on specific crop requirements with regard to temperature can be obtained from existing literature for a total of about 100 crops, e.g. Sys (1985), Nachtergaele (1985a, 1988) and De Wit (1989).
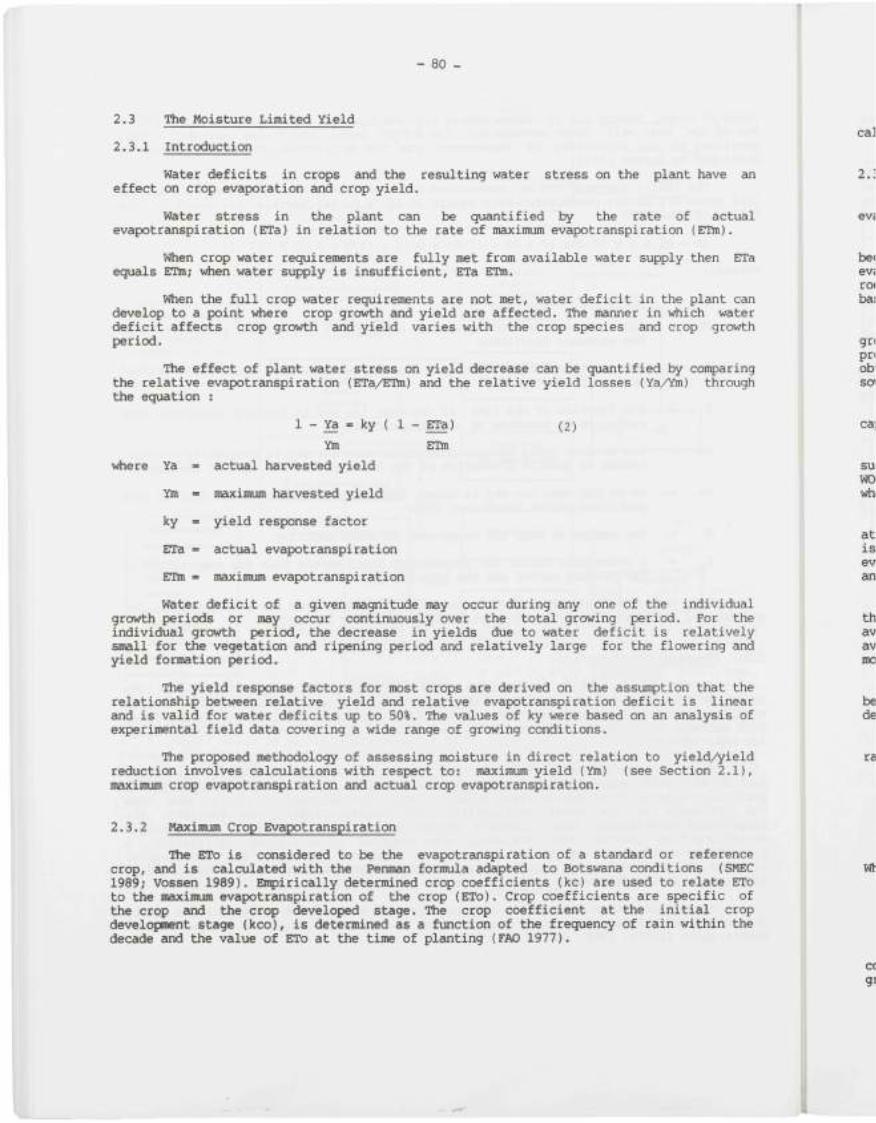
- 80 -
2.3 The Moisture Limited Yield
2.3.1 Introduction
Water deficits in crops and the resulting water stress on the plant have an effect on crop evaporation and crop yield.
Water stress in the plant can be quantified by the rate of actual evapotranspiration (ETa) in relation to the rate of maximum evapotranspiration (ETm).
When crop water requirements are fully met from available water supply then ETa equals ETta; vrtien water supply is insufficient, ETa ETm.
When the full crop water requirements are not met, water deficit in the plant can develop to a point v^ere crop growth and yield are affected. The manner in vrtiich water deficit affects crop growth and yield varies with the crop species and crop growth period.
The effect of plant water stress on yield decrease can be quantified by comparing the relative evapotranspiration (ETa/ETm) and the relative yield losses (Ya/Ym) through the equation :
1 - Ya = ky ( 1 - ETa) (2)
Ym ETm
where Ya « actual harvested yield
Ym » maximum harvested yield
ky = yield response factor
ETa « actual evapotranspiration
ETm » maximum evapotranspiration
Water deficit of a given magnitude may occur during any one of the individual growth periods or may occur continuously over the total growing period. For the individual growth period, the decrease in yields due to water deficit is relatively small for the vegetation and ripening period and relatively large for the flowering and yield formation period.
The yield response factors for most crops are derived on the assumption that the relationship between relative yield and relative evapotranspiration deficit is linear and is valid for water deficits up to 50%. The values of ky were based on an analysis of experimental field data covering a wide range of growing conditions.
The proposed methodology of assessing moisture in direct relation to yield/yield reduction involves calculations with respect to: maximum yield (Ym) (see Section 2.1), maximum crop evapotranspiration and actual crop evapotranspiration.
2.3.2 Maximum Crop Evapotranspiration
The ETo is considered to be the evapotranspiration of a standard or reference crop, euid is calculated with the Penman formula adapted to Botswana conditions (SMEC 1989; Vossen 1989). Empirically determined crop coefficients (kc) are used to relate ETo to the maximum evapotranspiration of the crop (ETo). Crop coefficients are specific of the crop and the crop developed stage. The crop coefficient at the initial crop development stage (kco), is determined as a function of the frequency of rain within the decade eind the value of ETo at the time of planting (FAO 1977).
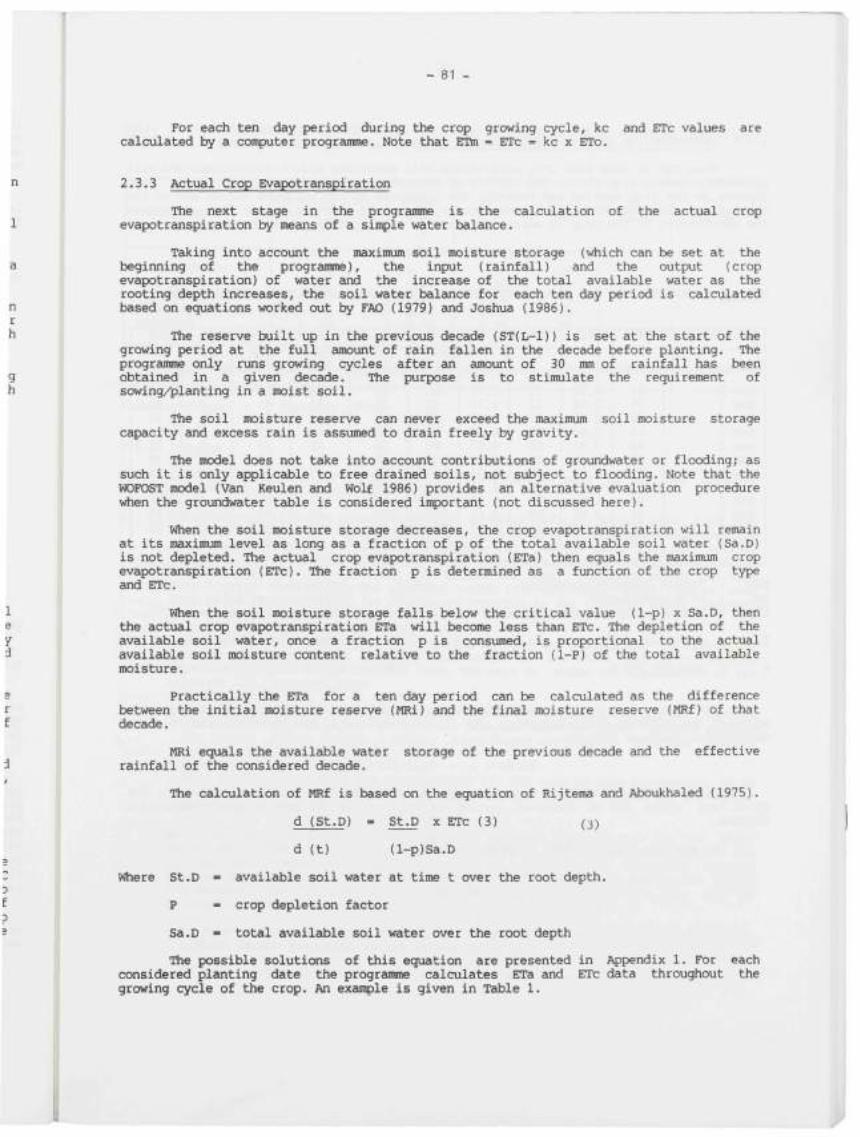
- 81 -
For each ten day period during the crop growing cycle, kc and ETc values are calculated by a con juter programme. Note that ETm = ETc = kc x ETo.
2.3.3 Actual Crop Evapotranspiration
The next stage in the programme is the calculation of the actual crop evapotranspiration by means of a single water balance.
Taking into account the maximum soil moisture storage (which can be set at the beginning of the programme), the input (rainfall) and the output (crop evapotranspiration) of water and the increase of the total available water as the rooting depth increases, the soil water balance for each ten day period is calculated based on equations worked out by FAO (1979) and Joshua (1986).
The reserve built up in the previous decade (ST(L-l)) is set at the start of the growing period at the full amount of rain fallen in the decade before planting. The programme only runs growing cycles after an amount of 30 mm of rainfall has been obtained in a given decade. The purpose is to stimulate the requirement of sowing/planting in a moist soil.
The soil moisture reserve can never exceed the maximum soil moisture storage capacity and excess rain is assumed to drain freely by gravity.
The model does not take into account contributions of groiondwater or flooding; as such it is only applicable to free drained soils, not subject to flooding. Note that the WOFOST model (Van Keulen and Wolf 1986) provides an alternative evaluation procedure vrtien the groundwater table is considered iitpDrtant (not discussed here).
When the soil moisture storage decreases, the crop evapotranspiration will remain at its maximum level as long as a fraction of p of the total available soil water (Sa.D) is not depleted. The actual crop evapotranspiration (ETa) then equals the maximum crop evapotranspiration (ETc). The fraction p is determined as a function of the crop type and ETC.
When the soil moisture storage falls below the critical value (1-p) x Sa.D, then the actual crop evapotranspiration ETa will become less than ETc. The depletion of the available soil water, once a fraction p is consumed, is proportional to the actual available soil moisture content relative to the fraction (1-P) of the total available moisture.
Practically the ETa for a ten day period can be calculated as the difference between the initial moisture reserve (MRi) and the final moisture reserve (MRf) of that decade.
MRi equals the available water storage of the previous decade and the effective rainfall of the considered decade.
The calculation of MRf is based on the equation of Rijtema and Aboukhaled (1975).
d (St.D) - St.D X ETC (3) (3)
d (t) (l-p)Sa.D
Where St.D - available soil water at time t over the root depth.
P " crop depletion factor
Sa.D " total available soil water over the root depth
The possible solutions of this equation are presented in Appendix 1. For each considered planting date the programme calculates ETa and ETc data throughout the growing cycle of the crop. An example is given in Table 1.
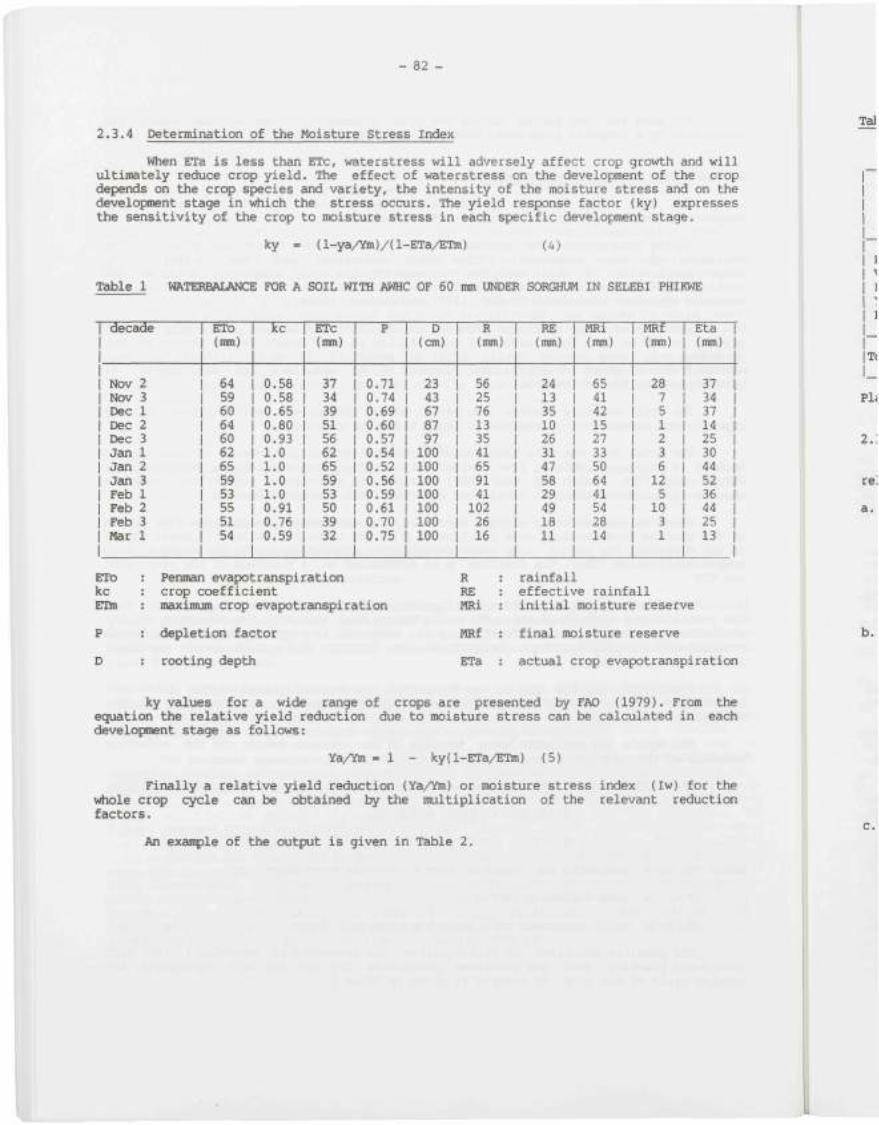
- 82 -
2.3.4 Determination of the Moisture Stress Index
When ETa is less than ETc, waterstress will adversely affect crop growth and will ultimately reduce crop yield. The effect of waterstress on the development of the crop depends on the crop species and variety, the intensity of the moisture stress and on the developanent stage in vrtiich the stress occurs. The yield response factor (ky) expresses the sensitivity of the crop to moisture stress in each specific development stage.
ky (l-ya/Ym)/( 1-ETa/ETm) (4)
Table 1 WATERBALANCE FOR A SOIL WITH AWHC OF 60 mm UNDER SORGHUM IN SELEBI PHIKWE
1 decade
1 Nov 2 1 Nov 3 1 Dec 1 1 Dec 2 1 Dec 3 1 Jan 1 1 Jan 2 1 Jan 3 1 Feb 1 1 Feb 2 1 Feb 3 1 Mar 1
ETo (mm)
64 59 60 64 60 62 65 59 53 55 51 54
kc
0.58 0.58 0.65 0.80 0.93 1.0 1.0 1.0 1.0 0.91 0.76 0.59
ETC (mm)
37 34 39 51 56 62 65 59 53 50 39 32
P
0.71 0.74 0.69 0.60 0.57 0.54 0.52 0.56 0.59 0.61 0.70 0.75
D (cm)
23 43 67 87 97 100 100 100 100 100 100 100
R (mm)
56 25 76 13 35 41 65 91 41 102 26 16
RE (mm)
24 13 35 10 26 31 47 58 29 49 18 11
MRi (mm)
65 41 42 15 27 33 50 64 41 54 28 14
MRf (mm)
28 7 5 1 2 3 6 12 5 10 3 1
Eta (mm)
37 34 1 37 1 14 1 25 1 30 1 44 1 52 1 36 1 44 1 25 1 13 1
ETo : Penman evapotranspiration kc : crop coefficient ETm : maximum crop evapotranspiration
P : depletion factor
D : rooting depth
R : rainfall RE : effective rainfall MRi : initial moisture reserve
MRf : final moisture reserve
ETa : actual crop evapotranspiration
ky values for a wide range of crops are presented by FAO (1979). From the equation the relative yield reduction due to moisture stress can be calculated in each developnent stage as follows:
Ya/Ym - 1 ky( 1-ETa/ETm) (5)
Finally a relative yield reduction (Ya/Ym) or moisture stress index (Iw) for the vrtiole crop cycle can be obtained by the multiplication of the relevant reduction factors.
An exaiq}le of the output is given in Table 2.
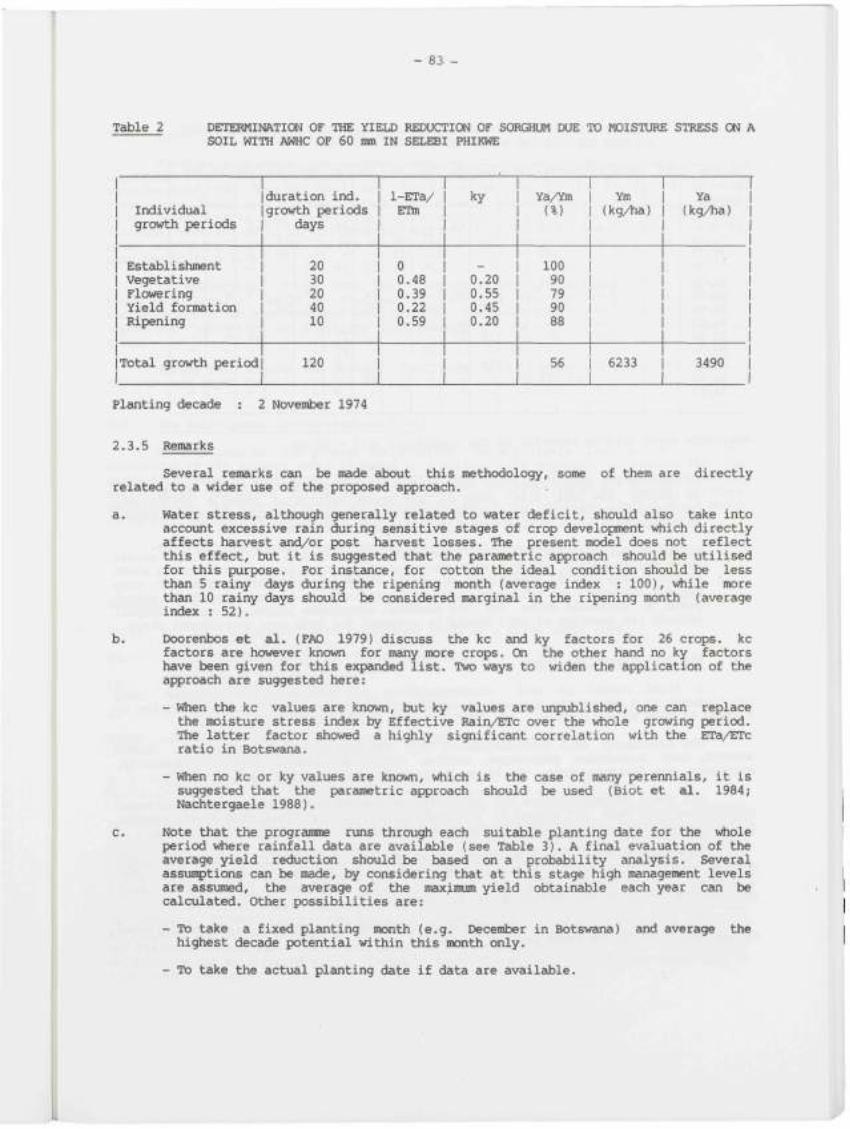
- 83- -
Table 2 DETEKMINATICW OF THE YIELD REDUCTIC»! OF SORGHUM DUE TO MOISTURE STRESS CW A SOIL WITH AWHC OF 60 mm IN SELEBI PHIKWE
j Individual 1 growth periods
1 Establishment 1 Vegetative 1 Flowering 1 Yield formation 1 Ripening
1 Total growth period
duration ind. growth periods
days
20 30 20 40 10
120
1-ETa/ ETm
0 0.48 0.39 0.22 0.59
ky
0.20 0.55 0.45 0.20
Ya/Ym (%)
100 90 79 90 88
56
Ym (kg/ha)
6233
Ya 1 (kg/ha) |
3490 1
Planting decade : 2 November 1974
2.3.5 Remarks
Several remarks can be made about this methodology, some of them are directly related to a wider use of the proposed approach.
a. Water stress, although generally related to water deficit, should also take into account excessive rain during sensitive stages of crop development vrtiich directly affects harvest and/or post harvest losses. The present model does not reflect this effect, but it is suggested that the parametric approach should be utilised for this purpose. For instance, for cotton the ideal condition should be less than 5 rainy days during the ripening month (average index : 100), v*»ile more than 10 rainy days should be considered marginal in the ripening month (average index : 52).
b. Doorenbos et al. (FAO 1979) discuss the kc and ky factors for 26 crops, kc factors are however known for many more crops. On the other hand no ky factors have been given for this expanded list. Two ways to widen the application of the approach are suggested here:
- When the kc values are known, but ky values are vinpublished, one can replace the moisture stress index by Effective Rain/ETc over the v*iole growing period. The latter factor showed a highly significant correlation with the ETa/ETc ratio in Botswana.
- When no kc or ky values are known, v^ich is the case of many perennials, it is suggested that the parametric approach should be used (Biot et 2Ü.. 1984; Nachtergaele 1988).
c. Note that the programme runs through each suitable planting date for the vrtiole period v^ere rainfall data are available (see Table 3). A final evaluation of the average yield reduction should be based on a probability analysis. Several assunptions Ccin be made, by considering that at this stage high management levels are assumed, the average of the maximum yield obtainable each year can be calculated. Other possibilities are:
- To take a fixed planting month (e.g. December in Botswana) and average the highest decade potential within this month only.
- To take the actual planting date if data are available.
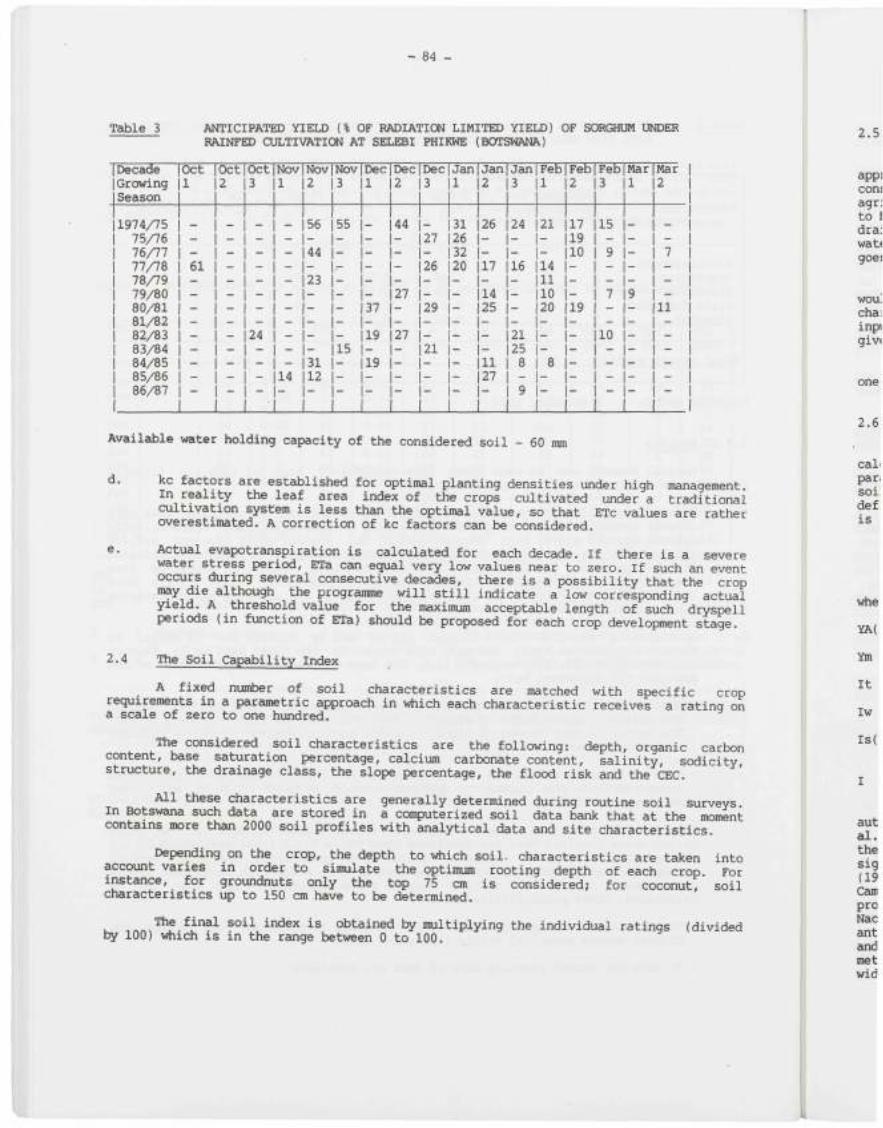
- 84 -
Table 3 ANTICIPATED YIELD (% OF RADIATICW LIMITED YIELD) OF SORGHUM UNDER RAINFED CULTIVATICW AT SELEBI PHIKWE (BOTSWANA)
1 Decade 1 Growing 1 Season
11974/75 1 75/76 1 76/77 1 77/78 1 78/79 1 79/80 1 80/81 1 81/82 1 82/83 1 83/84 1 84/85 1 85/86 1 86/87
Oct 1
_ -— 61 — -— -----—
Oct 2
_ -— -— -— -----—
Oct 3
_ -— -----24 ---—
Nov 1
_ -— ---— ----14 —
Nov 2
56 -44 -23 -----31 12 —
Nov 3
55 -— ------15 --—
Dec 1
_ -— ---37 -19 -19 -—
Dec 2
44 -— --27 --27 ---—
Dec 3
_ 27 — 26 --29 --21 --—
Jan 1
31 26 32 20 --------~
Jan 2
26 -— 17 -14 25 ---11 27 —
Jan 3
24 -— 16 ----21 25 8 -9
Feb 1
21 -— 14 11 10 20 ---8 -—
Feb 2
17 19 10 ---19 -----—
Feb 3
15 -9 --7 --10 ---—
Mar 1
_ ----9 ------—
Mar 2
_ -7 ---11 -----—
Available water holding capacity of the considered soil - 60 mm
d. kc factors are established for optimal planting densities under high management. In reality the leaf area index of the crops cultivated under a traditional cultivation system is less than the optimal value, so that ETc values are rather overestimated, A correction of kc factors can be considered.
e. Actual evapotranspiration is calculated for each decade, if there is a severe water stress period, ETa can equal very low values near to zero. If such an event occurs during several consecutive decades, there is a possibility that the crop may die although the programme will still indicate a low corresponding actual yield. A threshold value for the maximnjm acceptable length of such dryspell periods (in function of ETa) should be proposed for each crop development stage.
2.4 The Soil Capability Index
A fixed number of soil characteristics are matched with specific crop requirements in a parametric approach in v*iich each characteristic receives a rating on a scale of zero to one hundred.
The considered soil characteristics are the following: depth, organic carbon content, base saturation percentage, calcium carbonate content, salinity, sodicity, structure, the drainage class, the slope percentage, the flood risk and the CEC.
All these characteristics are generally determined during routine soil surveys. In Botswana such data are stored in a conputerized soil data bank that at the moment contains more than 2000 soil profiles with analytical data and site characteristics.
Depending on the crop, the depth to v^ich soil, characteristics are taken account varies in order to simulate the optimum rooting depth of each crop instance, for groundnuts only the top 75 cm is considered; for coconut, soil characteristics up to 150 cm have to be determined.
into For
The final soil index is obtained by multiplying the individual ratings by 100) vrtiich is in the range between 0 to 100.
(divided
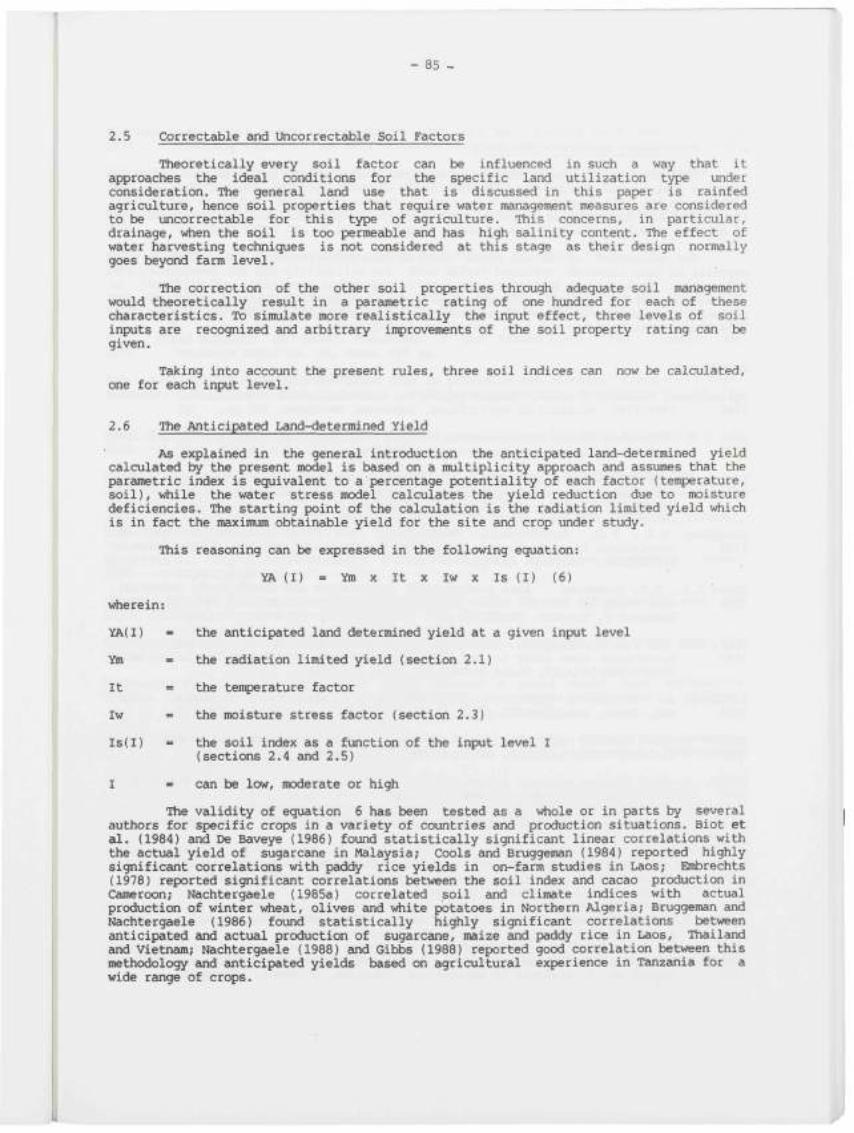
- 85 -
2.5 Correctable and Uncorrectable Soil Factors
Theoretically every soil factor can be influenced in such a way that it approaches the ideal conditions for the specific land utilization type under consideration. The general land use that is discussed in this paper is rainfed agriculture, hence soil properties that require water management measures are considered to be uncorrectable for this type of agriculture. This concerns, in particular, drainage, vrtien the soil is too permeable and has high salinity content. The effect of water harvesting techniques is not considered at this stage as their design normally goes beyond farm level.
The correction of the other soil properties through adequate soil management would theoretically result in a parametric rating of one hundred for each of these characteristics. To simulate more realistically the input effect, three levels of soil inputs are recognized and arbitrary in irovements of the soil property rating can be given.
Taking into account the present rules, three soil indices can now be calculated, one for each input level.
2.6 The Anticipated Land-determined Yield
As explained in the general introduction the anticipated land-determined yield calculated hy the present model is based on a multiplicity approach and assumes that the parametric index is equivalent to a percentage potentiality of each factor (temperature, soil), vrtiile the water stress model calculates the yield reduction due to moisture deficiencies. The starting point of the calculation is the radiation limited yield which is in fact the maximum obtainable yield for the site and crop imder study.
This reasoning can be expressed in the following equation:
YA (I) = Ym x It X Iw X Is (I) (6)
v^erein:
YA(I) - the anticipated land determined yield at a given input level
Ym = the radiation limited yield (section 2.1)
It = the tenï)erature factor
Iw = the moisture stress factor (section 2.3)
Is(I) = the soil index as a function of the input level I (sections 2.4 and 2.5)
I - can be low, moderate or high
The validity of equation 6 has been tested as a whole or in parts by several authors for specific crops in a variety of countries and production situations. Biot et al. (1984) and De Baveye (1986) fotind statistically significant linear correlations with the actual yield of sugarcane in Malaysia; Cools and Bruggeman (1984) reported highly significant correlations with paddy rice yields in on-farm studies in Laos; Embrechts (1978) reported significant correlations between the soil index and cacao production in Cameroon; Nachtergaele (1985a) correlated soil and climate indices with actual production of winter vrfieat, olives and vrtiite potatoes in Northern Algeria; Bruggeman and Nachtergaele (1986) found statistically highly significant correlations between anticipated and actual production of sugarcane, maize and paddy rice in Laos, Thailand and Vietnam; Nachtergaele (1988) and Gibbs (1988) reported good correlation between this methodology and anticipated yields based on agricultural experience in Tanzania for a wide reinge of crops.
- 86 -
2.7 Preliminary Results in Botswana
This methodology was introduced in Botswana early in 1989 and some time had to be spent to install and refine the methods of the authors cited in the introduction. In addition to the soil databank v^ich existed, a climatic databank had to be set up and links had to be made between these databases and the conputerized programmes in order to be able to calculate the soil and moisture stress indices.
The collection of actual yield figures has only recently been started with eitphasis on farm research obtained yields both for reliability and for consistency of information. Agricultural statistics are notoriously rather unreliable and difficult to link with specific soil and climatic conditions as they are generally presented for administrative units. The approach of Bruggeman and Nachtergaele (1986) which deals with this kind of matching has not been tested yet in Botswana.
BEFEDEtENCES
Agricultural Research Station. Annual report for the Division of arable crops research 1986 1984-1985. Ministry of Agriculture, Gaborone, Botswana. 282 pp.
Beek K.J. From soil survey interpretation to land evaluation. ILRI publication 23. Int. 1978 Inst. Land Reclam. and Iit rovement. Wageningen. 333 pp.
Biot Y., J. de Baveye, W. Bouckaert. A contribution towards the development of a 1984 methodology for the application of FAO framework for land evaluation in
Peninsular Malaysia, RUG, Ghent, Belgixjm. 63 pp.
Bruggeman H.Y., F.O. Nachtergaele. Methodology for identification of physical 1987 constraints to agricultural productivity. AG:GCP/RAS/107/JPN, Field Document
3, Bangkok, Thailand. 223 pp.
Cools J.W., H.Y. Bruggeman. Land productivity constraints and development potential, 1986 case study in Ban Na Phok, Ventiane Plain, Laos. AG:GCP/RAS/107/JPN, Field
Docviment 6, Bangkok, Thailand,
Cools J.W. and F.O. Nachtergaele. Land productivity constraints and development 1987 potentials, case study in Sri Racha district, Chon Buri province, Thailand,
AG:GCP/RAS/107/JPN, Field Document 6, RAPA, Bangkok.
De Baveye J. CYPPAC; A climatic yield potential prediction model for annual crops. 1986 RUG, Ghent, Belgium. 102 pp.
DLFRS. Dryland farming research scheme - Botswana. Second annual report, December 1981. 1981 Ministry of Agriculture, Gaborone, Botswana, 217 pp.
DLFRS. Dryland farming research scheme - Botswana. Final report, volume 2. Ministry of 1985 Agriculture, Gaborone, Botswana. 88 pp.
De wit C.T. Photosynthesis of leaf canopies. Agric. Res. Rep 663. Pudoc, Wageningen. 1965 57 pp.
De Wit P.V. Contribution to the land evaluation for forestry: Prosopis juliflora for 1986 fuelwood production in arid zones. Republic of Cape Verde.
FO:GCP/CVI/015/BEL; Praia, Cape Verde.
De Wit P.V. Land evaluation for irrigation. A case study: the Mavinatlala area. 1990 AG:DP/BOT/85/011. Field Document 20, Gaborone, Botswana.
EFSAIP. Evaluation of farming system and agricultural in jlements project - Botswana. 1981 Report No. 5. Ministry of Agriculture, Gaborone, Botswana. 149 pp.
- 87 -
Eldridge D.J. Soil survey interpretation for land use planning in Botswana. SARCCUS 1978 Standing Committee for Soil Science, Pretoria (mimeo).
Embrechts J. Determination et evaluation du Sud Cameroun pour la culture cacaoyère 1978 villageoise. Univ. de Yaoundé, ENSA, Dépt. Sci. Sol.
FAO. Effective rainfall in irrigation agriculture. (Dastane N.G.). FAO irrigation 1974 Drainage Paper No. 25, Rome.
FAG. Framework for land evaluation. Soils Bulletin No. 32. Rome. 79 pp. 1976
FAO. Report on the agro-ecological zones project. Volume I. Methodology and Results for 1978 Africa. World Soil Resources Report No. 48. Rome, 158 pp.
FAO. Yield response to water. (Doorenbos J. and Kassam A.H.). FAG irrigation and 1979 Drainage Paper No. 33, Rome. 193 pp.
FAO. Surveillance agro-météorologique pour la prevision des récoltes (Frère M. et Popov 1980 G.F.), Etudes FAO: Production végétale et protection des plantes No. 17. 67
pp.
FAO. Guidelines: land evaluation for rainfed agriculture. FAO Soils Bulletin No. 52, 1983 Rome. 237 pp.
Gibbs D. Rainfed crop development on the Central Mbuga Plain. AG:GCP/RAF/230/JPN. 1988 Consultant Report, MALD, Dar-es-Salaam, Tanzania.
Joshua W.D. Agro-ecological characterization in Sri Lanka. Land Use Division, Colombo, 1986 Sri Lanka.
Goudriaan J. Crop micrometeorology: a simulation study. Simulation Monographs. Pudoc, 1977 Wageningen. 249 p.
Kassam A.H. Net biomass production and yield of crops. Present and potential land use 1977 by agro-ecological zones project. FAO, Rome.
Nachtergaele F.O. Land evaluation in Northern Algeria based on small scale maps (in 1985a Dutch), PhD thesis, RUG, Ghent. 378 p.
Nachtergaele F.O. A con sarative study between a small scale land suitability 1985b methodology and actual crop production. Case study: paddy rice in Vietnam.
GCP/RAS/107/JPN, Technical Doojment 5, RAPA, Bangkok.
Nachtergaele F.O. Statistical interpretation of results from detailed case studies. 1986 Guidelines and conputer programmes for applied regression techniques.
GCP/RAS/107/JPN. Field Document.
Nachtergaele F. and H.Y. Bruggeman. Methodology for regional analysis of physical 1986 potential for crop production based on data from Khon Kaen Province, Thailand.
GCP/RAS/107/JPN. Field Document 5. RAPA, Bangkok. 144 pp.
Nachtergaele F.O., J.W. Cools, T, Yano. Land Productivity constraints and development potential, case study in Vu Ban District, Ha Nam Ninh Province, Vietnam. GCP/RAS/107/JPN.
Nachtergaele F.O. Methodology for regional analysis of physical potential for crop 1988 production. GCP/RAF/230/JPN, Field Dooment 1. MALD, Dar-es-Salaam, 136 pp.
Remmelzwaal A., E. Van Waveren. Botswana Soil Database and guidelines for soil profile 1988 description. DP/BOT/85/011. Field Doc\ament 9. Ministry of Agriculture,
Gaborone.
- 88 -
Rhebergen G. A system of land evaluation for arable farming in Botswana. DP/BOT/85/011 1988 Field Document 4. Ministry of Agriculture, Gaborone.
Riquier R.J., D.L. Bramao., J.P. Cornet. A new system of soil appraisal in terms of 1970 actual and potential productivity, FAO, Rome.
Schalk B., J. Tersteeg. Conputerized databanks of soil and climatic resources in 1989 Botswana. DP/BOT/85/011. Technical Paper No. 15 (in preparation). Ministry of
Agriculture, GatxDrone.
Sims D. Agro-climatic information, crop requirements and agricultural zones for 1981 Botswana. DLU Ministry of Agriculture, Gaborone.
SMEC. Study of open water evaporation in Botswana. Final report. Department of Water 1987 Affairs, Gaborone.
Sityth A.J. The selection of soils for Cocoa. Soils Bulletin 5. FAO, Rome. 1966
Sys C. Land evaluation. Course ITCSS, RUG, Ghent. 1985
Sys'C, J. Riquier. Ratings of FAO/Unesco soil units for specific crop production. In: 1990 Land resources for populations of the future. FAO/UNFPA Expert consultation.
Sys C , Verheye W. An attempt to evaluate the physical land characteristics for 1978 irrigation according to the FAO framework for land evaluation. RUG, Ghent.
Van Diepen CR. Evaluating land evaluation. ISM Annual Report, Wageningen. 29p. 1982
Van Keulen H., J. Wolf. Modelling of agricultural production: weather, soil and crops. 1986 Pudoc, Wageningen. 479p.
Vossen P. An agrometeorological contribution to quantitative and qualitative rainy 1989 season quality monitorong in Botswana. PhD thesis, RUG, Ghent.
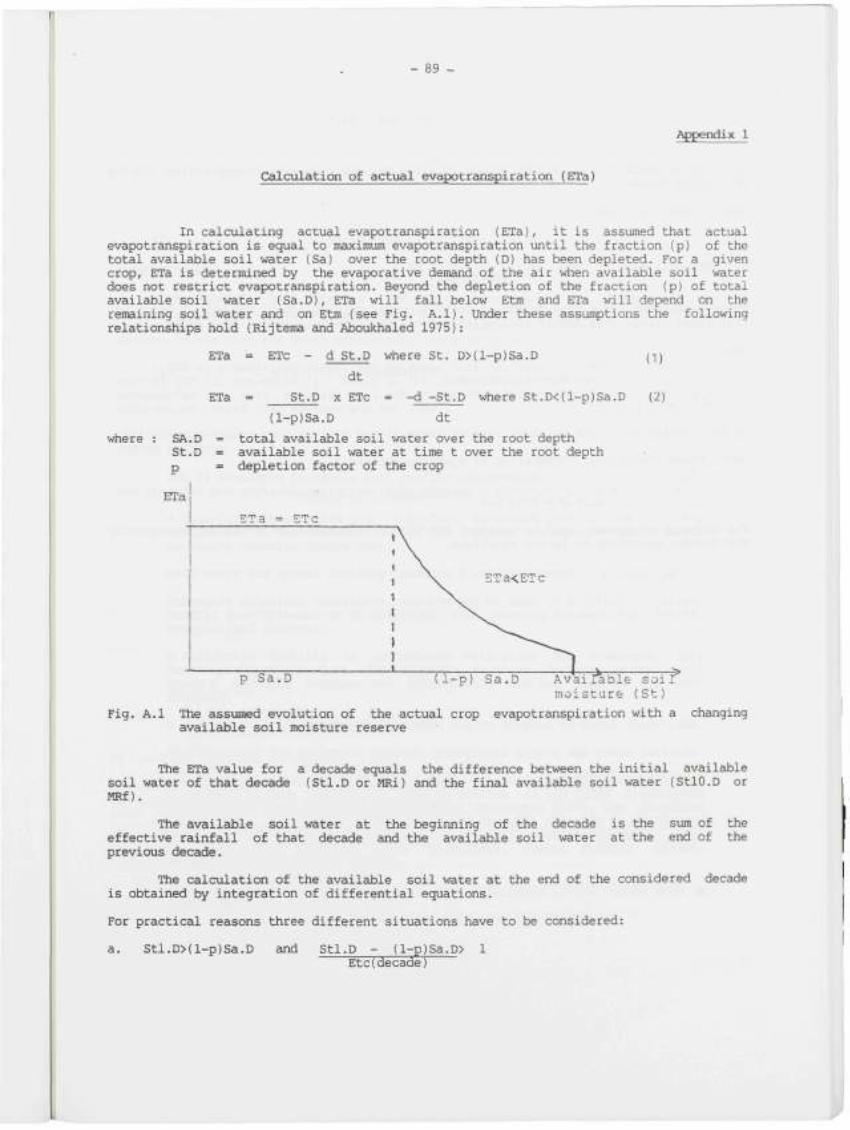
- 89 -
Appendix 1
Calculation of actual evapotranspiration (ETa)
In calculating actual evapotranspiration (ETa), it is assumed that actual evapotranspiration is equal to maximum evapotranspiration until the fraction (p) of the total available soil water (Sa) over the root depth (D) has been depleted. For a given crop, ETa is determined by the evaporative demand of the air when available soil water does not restrict evapotranspiration. Beyond the depletion of the fraction (p) of total available soil water (Sa.D), ETa will fall below Etm and ETa will depend on the remaining soil water and on Etm (see Fig. A.l). Under these assumptions the following relationships hold (Rijtema and Aboiikhaled 1975):
(1)
where
ETa = ETC - d St.D where St. D>(l-p)Sa.D
dt
ETa = St.D X ETC = -d -St.D where St.D<(l-p)Sa.D (2)
(l-p)Sa.D dt
SA.D = total available soil water over the root depth St.D = available soil water at time t over the root depth p = depletion factor of the crop
ETa
STa<ETc
p Sa.D 1-p) Sa.D • ^ A v a i l a b l e s o l m o i s t u r e (S t
t Fig. A.l The assumed evolution of the actual crop evapotranspiration with a changing
available soil moisture reserve
The ETa value for a decade equals the difference between the initial available soil water of that decade (Stl.D or MRi) and the final available soil water (StlO.D or MRf).
The available soil water at the beginning of the decade is the sum of the effective rainfall of that decade and the available soil water at the end of the previous decade.
The calculation of the available soil water at the end of the considered decade is obtained by integration of differential equations.
For practical reasons three different situations have to be considered:
a. Stl.D>(l-p)Sa.D and Stl.D - (l-p)Sa.D> 1 Etc(decade)
- 90 -
or in other words Stl.D is high enough to allow maximum crop evapotranspiration during the entire decade.
Under these conditions :
StlO.D = Stl.D - ETc(decade) (3)
b. Stl.D>(l.p)Sa.D and Stl.D - (l-p)Sa.D< 1 ETC(decade)
These conditions inï)ly that during a certain niomber of days (10-t) ETa equals ETc, but that after (10-t) days ETa is smaller than ETc, and this for a period of t days.
Thus :
StlO.D = (l-p)Sa.D.e - ETc(decade).t/10(l-p)Sa.D (4)
c. Stl. D<(l-p)Sa.D
or the initial available moisture reserve never allows maximum crop evapotranspiration.
Under these conditions, integration of equation 2 gives :
StlO ,D = Stl. D.e " ETc(decade)/ (l-p)Sa.D (5)
The coitputer programme used in project BOT/85/011 calculates StlO.D and consequently Eta(decade) according to latter equations.
6.11 FAO/ISRIC SOIL DATA BASE
by
Erik Van Waveren
INTRCXXJCnON
The FAO/ISRIC Soil Database (SDB) is a user-friendly micro-computer Program to store, organize and manipulate soil data of different climatic regions and geographical environments. SDB is developed for the Soil Resources, Management and Conservation Service of the Land and Water Development Division of FAO.
SDB is a modification of the Botswana Soil Database (Van Waveren 1988). A large part of SDB is, conceptually, based on the ISRIC Soil Information System (ISIS), which accomodates the soil monolith collection of the International Soil Reference and Information Centre (Van Waveren and Bos 1988).
SYSTEM OVERVIEW
SDB is developed to handle soil profile information, including field information and chemical and physical analytical data. The main features of the system are:
A menu-based interactive user interface. On-screen instructions and help screens assist the user in riinning SDB. Options are selected and started by siitply pressing single keys.
Data entry and update facility includes a validity control on coded data.
Extensive selection facilities. Results may be sent to a printer (tables, profile descriptions) or to diskfiles, thus creating datasets for further computerized analyses.
A read/Vrite facility to communicate with other SDB databases. This facility allows the user, for instance, to enter directly in the field using a portable coit iuter and s\±)sequently add the data to the main database.
A flexible coding system module, v*iich can be adapted to local conditions.
The databases are protected against operational errors and power failures.
SDB is a stand-alone program and does not need a supporting database management system. The program code is written in the dBASE programming language and later coitpiled with Clipper (Nantucket 1987). The datafiles have a dBASE format and consequently can be used directly in dBASE, as well as in any other application programme that reads dBASE files, such as, statistical packages, word processors, expert systems (ALES), geographical information systems.
Also, the datafiles can be transformed into ASCII (text) files with a sinple dBASE command.
- 92 -
SEB CC»ING SYSTEM
To facilitate effective database management the descriptive field data need to be stored in a coded format. Storage of coded data reduces the size of the databases and, equally inportant, it standardizes the descriptive data and thus allows for selection, comparison and validity control.
A coding system gives the classification and class codes of all the variable (attributes) that are for the soil description. For example:
Variable (attribute) Classification (code and related term
Landform ' PL plain
VA valley
etc
Cutans (abundance) F few
C common
M many
The coding system module forms an integral part of SDB and coitprises a number of conversion tables. A conversion table contains the classification of a single variable. For instance the conversion table for Cutans-abundance may look like:
0 nil
F few
C Common
M Many
Obviously, it is extremely difficult to design a coding system that is universally applicable and meets the requirements of all potential users. Therefore, SDB contains a flexible coding system module v*iich allows the user to make the necessary modifications in order to describe specific soil characteristics effectively. More precisely:
a. The classification of variables and the related class codes can be changed.
b. The standard sets of site, horizon and analytical variables can be extended by defining an additional number of 'blank' site and analytical variables.
These operations are done interactively and do not require any modifications to be made in the software.
SDB comes with a default coding system which is intended to serve as a basis for further development. It follows the EAO Guidelines for Soil Profile Description (FAO 1977) and has been updated according to the first draft of the Revised FAO Guidelines (March 1989).
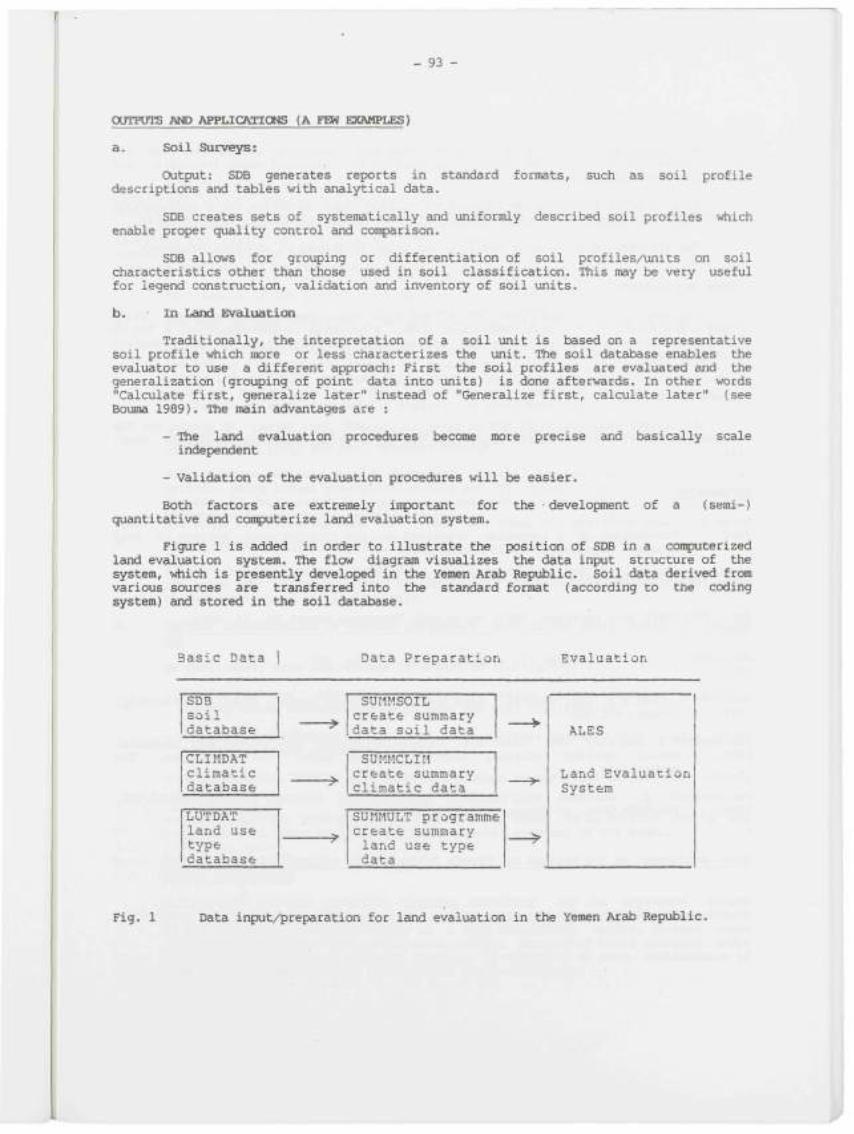
- 93 -
OUTPUTS AND APPLICATIC»tS (A FEW EXftMPLES)
a. Soil Surveys:
Output: SDB generates reports in standard formats, such as soil profile descriptions and tables with analytical data.
SDB creates sets of systematically and uniformly described soil profiles which enable proper quality control and comparison.
SDB allows for grouping or differentiation of soil profiles/tinits on soil characteristics other than those used in soil classification. This may be very useful for legend construction, validation and inventory of soil units.
b. In Land Evaluation
Traditionally, the interpretation of a soil unit is based on a representative soil profile which more or less characterizes the unit. The soil database enables the evaluator to use a different approach: First the soil profiles are evaluated and the generalization (grouping of point data into \anits) is done afterwards. In other words "Calculate first, generalize later" instead of "Generalize first, calculate later" (see Bouma 1989). The main advantages are :
- The land evaluation procedures become more precise and basically scale independent
- Validation of the evaluation procedures will be easier.
Both factors are extremely important for the - development of a quantitative and coitputerize land evaluation system.
(semi-)
Figure 1 is added in order to illustrate the position of SDB in a computerized land evaluation system. The flow diagram visualizes the data input structure of the system, which is presently developed in the Yemen Arab Republic. Soil data derived from various sources are transferred into the standard format (according to the coding system) and stored in the soil database.
Basic Data Data Preparation Evaluation
SDB soil database
CLIMDAT climatic database
LUTDAT land use type database
-»
1 SUMMSOIL 1 create summary 1 data soil data |
1 SUMMCLIM 1 create summary 1 climatic data |
1SUMMULT programme create summary land use type
1 data
ALES
Land Evaluation System
Fig. 1 Data input/preparation for land evaluation in the Yemen Arab Republic.
- 94 -
A conpucer program extracts relevant field and analytical information from the soil database, recalculates the profile information for standard depth intervals, and stores the data into a file.
This datafile provides the information on land characteristics for a computerized land evaluation system, v^ich is developed with ALES (Rossiter and Van Wambeke 1989).
The information on climate and land use types is stored in separate databases.
SYSTEM REQUIREMENTS
SDB runs on IBM (compatible) XT, AT and PS/2 micro conputer with at least 512kb of RAM and a harddisk. For small amounts of data, a harddisk is not essential. A 720 kb diskette is sufficient to store the SDB system files and information on approximately 30-40 profiles.
FURTHER INFORMATION
A conplete description of SDB is given in the SDB User Manual. To obtain the SDB package please write to: Chief, AGLS, FAO, Via delle Terme di Caracalla, 00100, Rome, Italy.
REFEIREMCES
Bouma J. Land qualities in space and time. In: Land qualities in space and time: 1989 Proceedings of a synpDsium organized by the International Society of Soil
Science, Wageningen, 22-28 August 1988.
FAO. Guidelines for soil profile description. 2nd. edition. Rome. 1977
FAO. FAO-ISRIC Soil Database (SDB). World Soil Resources Report No. 64, Rome. 1989
Nantucket. Clipper. A Dbase III coitpiler. Los Angeles, USA. 1977
Rossiter D., and A.R. Van Wambeke. Ales version 2. User's manual. Cornell University, 1989 Ithaca, NY, USA.
Van Waveren E. and A.B. Bos. ISRIC Soil Information System. User Manual and Technical 1988 Manual. Revised edition. ISRIC Technical paper 15. Wageningen, The
Netherlands.
Van Waveren, E. Botswana Soil Database Manual. Field document Project BOT/85/001, 1988. FAO/UNDP/Govt. of Botswana, Gaborone.
- 95 -
7. SUMMARY OF THE DISCUSSIONS
Availability of moisture is one of the most iit^rtant land qualities affecting crop production in Eastern and Southern Africa. It was observed, however, during the meeting that less attention was paid to this crucial area by most member countries in their programmes, hence the need to develop efficient and suitable methodology for assessing and rating it. Definition of this quality is essential both as a part of overall land evaluation and also to predict the inportance of interannual fluctuation in moisture availability on crop production.
As a result of the present meeting it was suggested that:
1. The year by year variation in laoisture availability should be taken into account
This is of particular inportance in predicting the incidence of drought and evaluating its potential impact on production. Neither of these assessments can be carried out using average data. Year by year analysis should be presented in terms of probability, and the number of years analysed should preferably be sufficient to that required for analysis of confidence limits.
2. A moisture balance model should be used, incorporating precipitation, evapo-transpiration (PET) and soil moisture storage
Soil moisture balance should preferably be carried out for 10 day or 5 day periods, using actual precipitation data and PET values interpolated from monthly figures. If daily rainfall figures are not available monthly values can be used although assessment will be less accurate.
3. Models should be crop and soil specific
Moisture balance model should take account of the specific moisture uptake abilities and yield responses of individual crops and the moisture retention characteristics of particular soils.
4. Further investigation of various parameters used in the model should be carried out
In particular, more information is needed on such factors as:
- correction for effective rainfall, taking into account intensity, run-off/rxin-on characteristics of site and soil infiltration;
- assessing contribution of groundwater to moisture balance, particularly under residual moisture cropping;
- estimating the initial soil moisture content at the start of the crop growing season;
- v*iat additional soil physical detei;rJi.ation needs to be carried out in the field or the laboratory, to assure reasjr?ble accuracy of the model.
5. Itesting and verification of the model should be carried out by con^rison with actual crop yieigj
The output of the moisture balance modelling may be expressed either quantitatively, as a yield relative to that which could be achieved when moisture is not limiting, or qualitatively as a land suitability rating. In both cases results should be verified with actual yields, preferably those obtained under controlled conditions on research stations. If agreement is poor, modification of some of the parameters used in the model may be necessary.
6.
7.
- 96 -
Spatied variation in moisture availability should be investigated
Actual field measurements have often revealed large variations in soil moisture content within short distances. Atteit jts should be made to assess the level of variation within mapping units or on individual farms.
ClassificaticHi of soil moisture regimes should be further developed
Soil moisture regimes are particularly valuable for classification and correlation purposes and existing classifications need to be expanded to improve definitions for tropical and subtropical conditions.
csn
aboi vis. seo par in 1
PRO
com pro
Cli
Mon
Jul Aug Sep Oct Nov Dec Jan Feb Mar Apr May Jur
Yea
rai Rec is The ani sys pec
rec
mar ma]
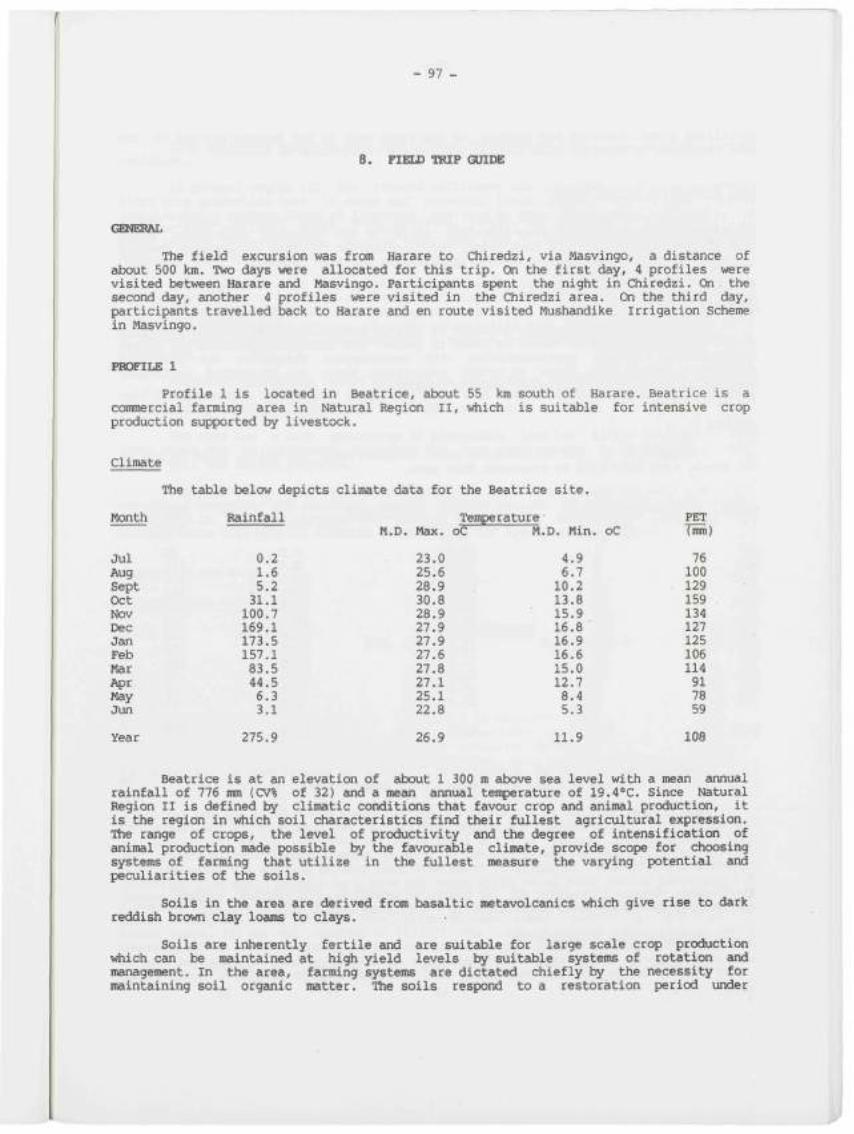
- 97 -
I
8 . FIELD TRIP GUIDE
GElfEBKL
The field excursion was from Harare to Chiredzi, via Masvingo, a distance of about 500 km. Two days were allocated for this trip. On the first day, 4 profiles were visited between Harare and Masvingo. Participants spent the night in Chiredzi. On. the second day, another 4 profiles were visited in the Chiredzi area. On the third day, participants travelled back to Harare and en route visited Mushandike Irrigation Scheme in Masvingo.
PROFILE 1
Profile 1 is located in Beatrice, about 55 km south of Harare. Beatrice is a commercial farming area in Natural Region II, v^ich is suitable for intensive crop production supported by livestock.
Climate
The table below depicts climate data for the Beatrice site.
Month
Jul Aug Sept Oct Nov Dec Jan Feb Mar Pipr May Jun
Year
Rainfall
0.2 1.6 5.2 31.1 100.7 169.1 173.5 157.1 83.5 44.5 6.3 3.1
275.9
M.D. Max.
23.0 25.6 28.9 30.8 28.9 27.9 27.9 27.6 27.8 27.1 25.1 22.8
26.9
Tenmerature oC M. D. Min. oC
4.9 6.7 10.2 13.8 15.9 16.8 16.9 16.6 15.0 12.7 8.4 5.3
11.9
PET (mm)
76 100
. 129 159 134 127 125 106 114 91 78 59
108
Beatrice is at an elevation of about 1 300 m above sea level with a mean annual rainfall of 776 mm (CV% of 32) and a mean annual ten^rature of 19.4°C. Since Natural Region II is defined by climatic conditions that favour crop and animal production, it is the region in vrtiich soil characteristics find their fullest agricultural expression. The range of crops, the level of productivity and the degree of intensification of animal production made possible by the favourable climate, provide scope for choosing systems of farming that utilize in the fullest measure the varying potential and peculiarities of the soils.
Soils in the area are derived from basaltic metavolcanics vrtiich give rise to dark reddish brown clay loams to clays.
Soils are inherently fertile and are suitable for large scale crop production vrtiich can be maintained at high yield levels by suitable systems of rotation and management. In the area, farming systems are dictated chiefly by the necessity for maintaining soil organic matter. The soils respond to a restoration period under
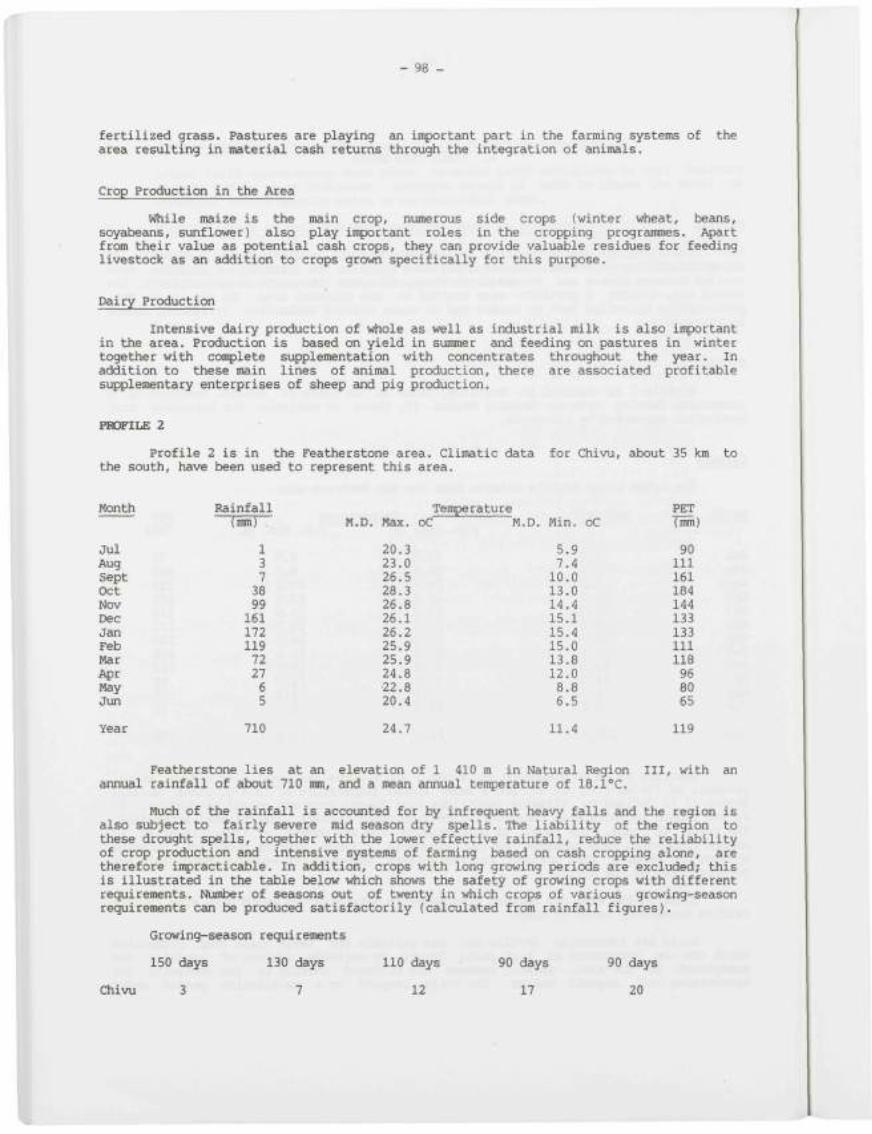
- 98 -
fertilized grass. Pastures are playing an iirpartant part in the farming systems of area resulting in material cash returns through the integration of animals.
the
Crop Production in the Area
While maize is the main crop, numerous side crops (winter wheat, beans, soyabeans, sunflower) also play iit^rtant roles in the cropping programmes. Apart from their value as potential cash crops, they can provide valuable residues for feeding livestock as an addition to crops grown specifically for this purpose.
Dairy Production
intensive dairy production of v^ole as well as industrial milk is also important in the area. Production is based on yield in summer and feeding on pastures in winter together with complete supplementation with concentrates throughout the year. In addition to these main lines of animal production, there are associated profitable supplementary enterprises of sheep and pig production.
PROFILE 2
Profile 2 is in the Featherstone area. Climatic data the south, have been used to represent this area.
for Chivu, about 35 km to
Month
Jul Aug Sept Oct Nov Dec Jan Feb Mar i r May Jun
Rainfall (mm) .
1 3 7 38 99 161 172 119 72 27 6 5
M.D. Max.
20.3 23.0 26.5 28.3 26.8 26.1 26.2 25.9 25.9 24.8 22.8 20.4
Temperature oC M.D. Min. oC
5.9 7.4 10.0 13.0 14.4 15.1 15.4 15.0 13.8 12.0 8.8 6.5
PET (mm
90 111 161 184 144 133 133 111 118 96 80 65
Year 710 24.7 11.4 119
Featherstone lies at an elevation of 1 410 m in Natural Region annual rainfall of about 710 mm, and a mean annual tenperature of 18.1''C.
Ill, with an
Much of the rainfall is accounted for by infrequent heavy falls and the region is also sxobject to fairly severe mid season dry spells. The liability of the region to these drought spells, together with the lower effective rainfall, reduce the reliability of crop production and intensive systems of farming based on cash cropping alone, are therefore iitpracticable. In addition, crops with long growing periods are excluded; this is illustrated in the table below v^ich shows the safety of growing crops with different requirements. Number of seasons out of twenty in which crops of various growing-season requirements can be produced satisfactorily (calculated from rainfall figures).
Growing-season requi rements
150 days 130 days 110 days 90 days 90 days
Chivu 3 7 12 17 20
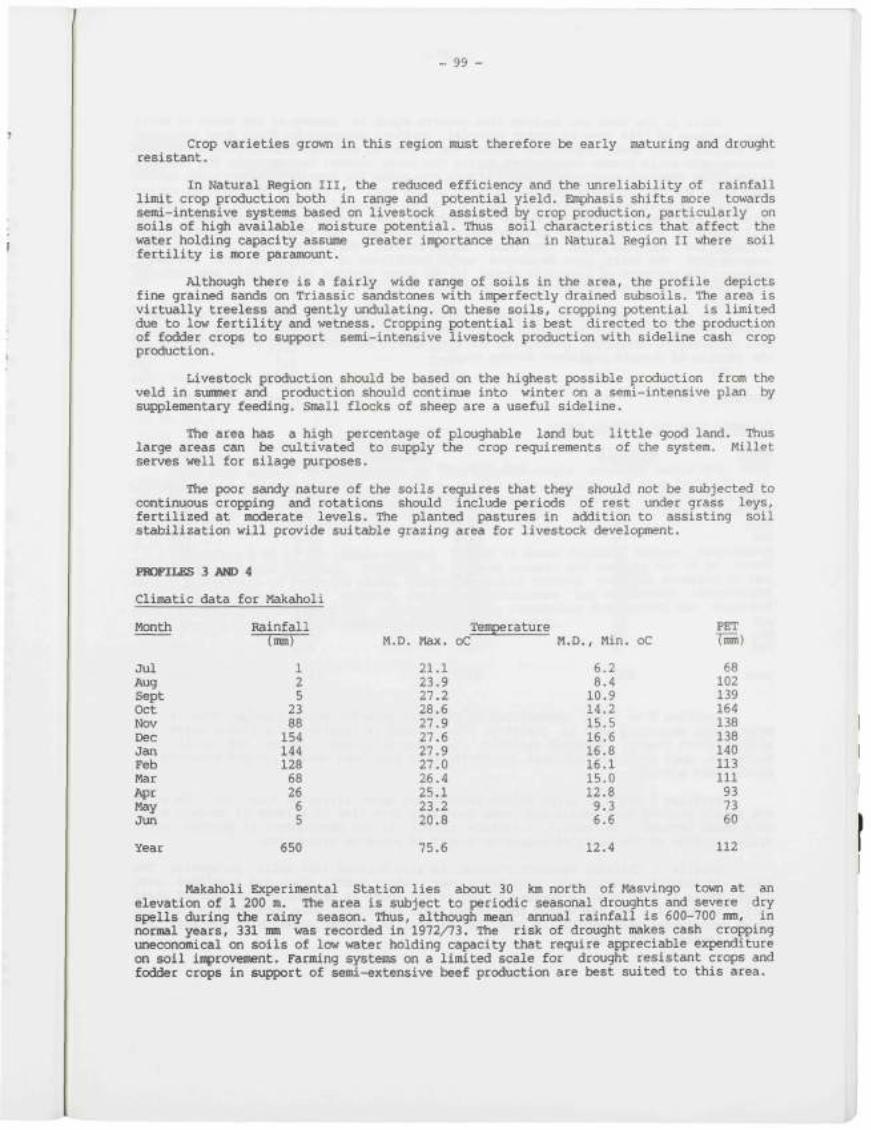
- 99 -
Crop varieties grown in this region must therefore be early maturing and drought resistant.
In Natural Region III, the reduced efficiency and the unreliability of rainfall limit crop production both in range and potential yield. Enphasis shifts more towards semi-intensive systems based on livestock assisted by crop production, particularly on soils of high available moisture potential. Thus soil characteristics that affect the water holding capacity assume greater inportance than in Natural Region II where soil fertility is more paramount.
Although there is a fairly wide range of soils in the area, the profile depicts fine grained sands on Triassic sandstones with inperfectly drained subsoils. The area is virtually treeless and gently undulating. On these soils, cropping potential is limited due to low fertility and wetness. Cropping potential is best directed to the production of fodder crops to support semi-intensive livestock production with sideline cash crop production.
Livestock production should be based on the highest possible production from the veld in summer and production should continue into winter on a semi-intensive plan by supplementary feeding. Small flocks of sheep are a useful sideline.
The area has a high percentage of ploughable land but little good land. Thus large areas can be cultivated to supply the crop requirements of the system. Millet serves well for silage purposes.
The poor sandy nature of the soils requires that they should not be subjected to continuous cropping and rotations should include periods of rest under grass leys, fertilized at moderate levels. The planted pastures in addition to assisting soil stabilization will provide suitable grazing area for livestock development.
PROFILES 3 AND 4
Climatic data for Makaholi
Month
Jul Aug Sept Oct Nov Dec Jan Feb Mar i r May Jun
Year
Rainfall (mm)
1 2 5 23 88 154 144 128 68 26 6 5
650
M.D. Max.
21.1 23.9 27.2 28.6 27.9 27.6 27.9 27.0 26.4 25.1 23.2 20.8
75.6
Tenperature oC M.D., Min. oC
6.2 8.4 10.9 14.2 15.5 16.6 16.8 16.1 15.0 12.8 9.3 6.6
12.4
PET (mm)
68 102 139 164 138 138 140 113 111 93 73 60
112
Makaholi Experimental Station lies about 30 km north of Masvingo town at an elevation of 1 200 m. The area is subject to periodic seasonal droughts and severe dry spells during the rainy season. Thus, although mean annual rainfall is 600-700 mm, in normal years, 331 mm was recorded in 1972/73. The risk of drought makes cash cropping uneconomical on soils of low water holding capacity that require appreciable expenditure on soil inprovement. Farming systems on a limited scale for drought resistant crops and fodder crops in support of semi-extensive beef production are best suited to this area.
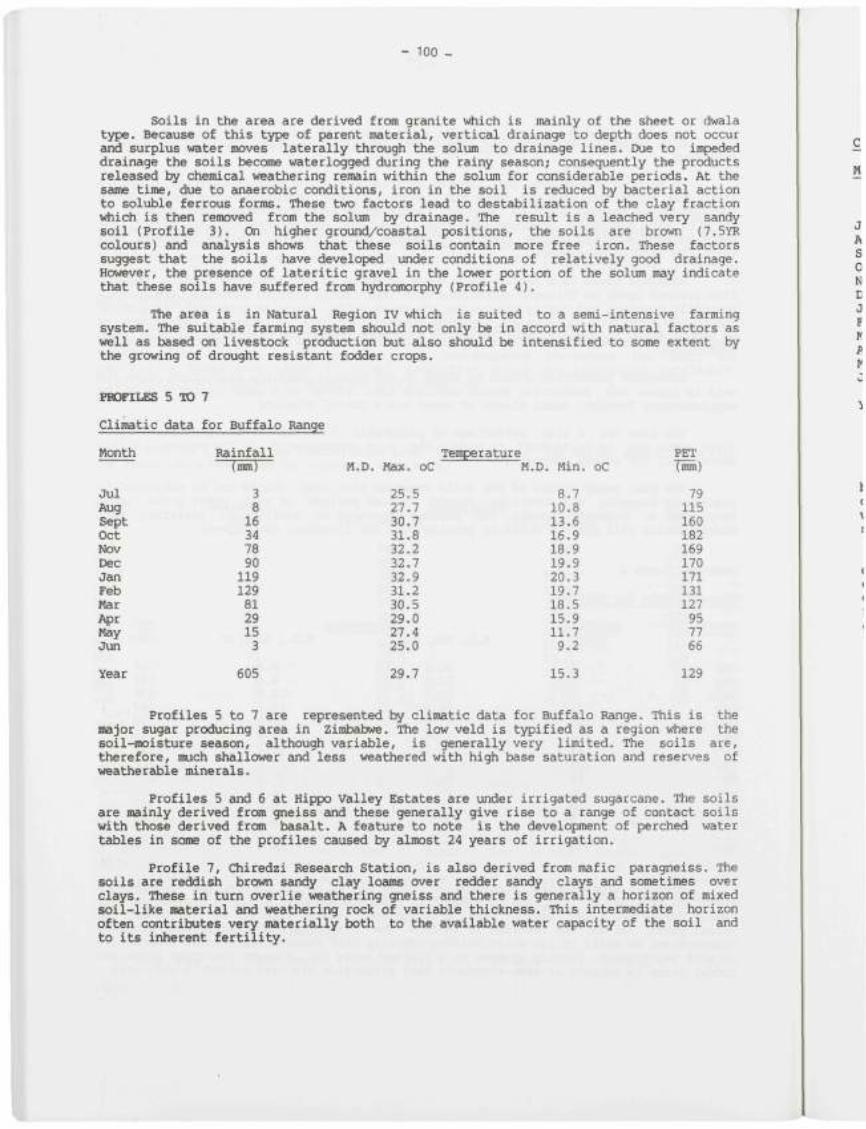
- 100 -
Soils in the area are derived from granite which is mainly of the sheet or dwala type. Because of this type of parent material, vertical drainage to depth does not occur and surplus water moves laterally through the solum to drainage lines. Due to impeded drainage the soils become waterlogged during the rainy season; consequently the products released by chemical weathering remain within the solvmi for considerable periods. At the same time, due to anaerobic conditions, iron in the soil is reduced by bacterial action to soluble ferrous forms. These two factors lead to destabilization of the clay fraction vrtiich is then removed from the solum by drainage. The result is a leached very sandy soil (Profile 3). On higher ground/coastal positions, the soils are brown (7.5YR colours) and analysis shows that these soils contain more free iron. These factors suggest that the soils have developed under conditions of relatively good drainage. However, the presence of lateritic gravel in the lower portion of the solum may indicate that these soils have suffered from hydromorphy (Profile 4).
The area is in Natural Region IV v^ich is suited to a semi-intensive farming system. The suitable farming system should not only be in accord with natural factors as well as based on livestock production but also should be intensified to some extent by the growing of drought resistant fodder crops.
PROFILES 5 TO 7
Climatic data for Buffalo Range
Month
Jul Aug Sept Oct Nov Dec Jan Feb Mar Apr May Jun
Year
Rainfall (mm)
3 8 16 34 78 90 119 129 81 29 15 3
605
M.D. Tenperature
Max. oC
25.5 27.7 30.7 31.8 32.2 32.7 32.9 31.2 30.5 29.0 27.4 25.0
29.7
M.D. Min. oC
8.7 10.8 13.6 16.9 18.9 19.9 20.3 19.7 18.5 15.9 11.7 9.2
15.3
PET (mm)
79 115 160 182 169 170 171 131 127 95 77 66
129
Profiles 5 to 7 are represented by climatic data for Buffalo Range. This is the major sugar producing area in Zimbabwe. The low veld is typified as a region where the soil-moisture season, although variable, is generally very limited. The soils are, therefore, much shallower and less weathered with high base saturation and reserves of weatherable minerals.
Profiles 5 and 6 at Hippo Valley Estates are imder irrigated sugarcane. The soils are mainly derived from gneiss and these generally give rise to a range of contact soils with those derived from basalt. A feature to note is the development of perched water tables in some of the profiles caused by almost 24 years of irrigation.
Profile 7, Chiredzi Research Station, is also derived from mafic paragneiss. The soils are reddish brown sandy clay loams over redder sandy clays and sometimes over clays. These in turn overlie weathering gneiss and there is generally a horizon of mixed soil-like material and weathering rock of variable thickness. This intermediate horizon often contributes very materially both to the available water capacity of the soil and to its inherent fertility.
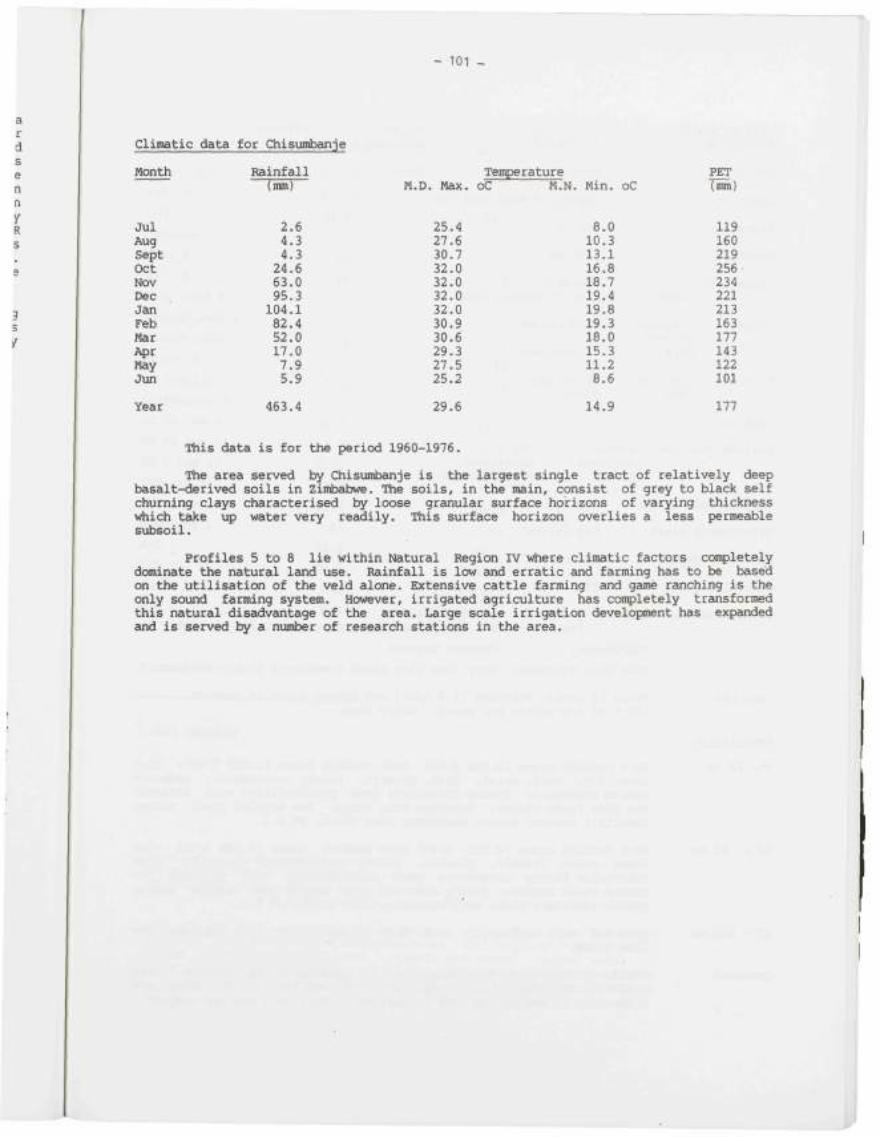
- 101 -
climatic data for Chisumbanje
Month Rainfall Temperature PET (mm) M.D, Max. oC M.N. Min. oC (mm)
Jul Aug Sept Oct Nov Dec Jan Feb Mar P>pt May Jun
Year
2.6 4.3 4.3 24.6 63.0 95.3 104.1 82.4 52.0 17.0 7.9 5.9
463.4
25.4 27.6 30.7 32.0 32.0 32.0 32.0 30.9 30.6 29.3 27.5 25.2
29.6
8.0 10.3 13.1 16.8 18.7 19.4 19.8 19.3 18.0 15.3 11.2 8.6
14.9
119 160 219 256 234 221 213 163 177 143 122 101
177
This data is for the period 1960-1976.
The area served by Chisumbanje is the largest single tract of relatively deep basalt-derived soils in Zimbabwe. The soils, in the main, consist of grey to black self churning clays characterised by loose granular surface horizons of varying thickness vrfiich take up water very readily. This surface horizon overlies a less permeable subsoil.
Profiles 5 to 8 lie within Natural Region IV vrtiere climatic factors conpletely dominate the natural land use. Rainfall is low and erratic and farming has to be based on the utilisation of the veld alone. Extensive cattle farming and game ranching is the only sound farming system. However, irrigated agriculture has conpletely transformed this natural disadvantage of the area. Large scale irrigation development has expanded and is served by a number of research stations in the area.
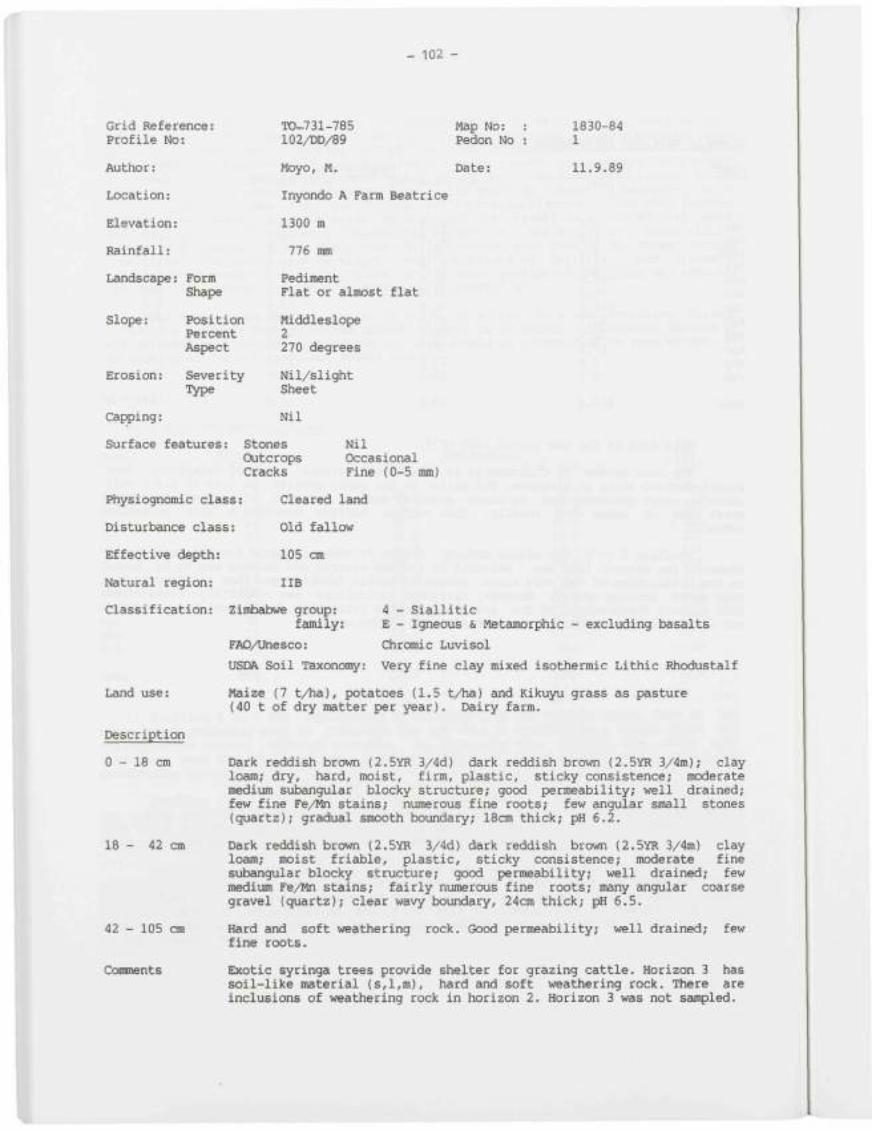
- 102 -
Grid Reference: Profile No:
Author:
Location:
Elevation:
Rainfall:
Landscape: Form Shape
TO-731-785 102/DD/89
Map No: Pedon No
Slope:
Erosion:
Position Percent Aspect
Severity Type
Capping:
Surface features:
Physiognomic class
Disturbance class:
Effective depth:
Natural region:
Classification
Moyo, M. Date:
Inyondo A Farm Beatrice
1300 m
776 mm
Pediment Flat or almost flat
Middleslope 2 270 degrees
Nil/slight Sheet
Nil
1830-84 1
11.9.89
Stones Outcrops Cracks
Nil Occasional Fine (0-5 mm)
Cleared land
Old fallow
105 cm
IIB
Zimbabwe group: family:
FAOA^nesco:
USDA Soil Taxonony:
4 - Siallitic
E - Igneous & Metamorphic - excluding basalts
Chromic Luvisol
Very fine clay mixed isothermic Lithic Rhodustalf
Land use:
Description
0 - 18 cm
18 - 42 cm
Maize (7 t/ha), potatoes (1.5 t/ha) and Kikuyu grass as pasture (40 t of dry matter per year). Dairy farm.
Dark reddish brown (2.5YR 3/4d) dark reddish brown (2.5YR 3/4m); clay loam; dry, hard, moist, firm, plastic, sticky consistence; moderate medium subangular blocky structure; good permeability; well drained; few fine Fe/Mn stains; numerous fine roots; few angular small stones (quartz); gradual smooth boundary; 18cm thick; pH 6.2.
Dark reddish brown (2.5YR 3/4d) dark reddish brown (2.5YR 3/4m) clay loam; moist friable, plastic, sticky consistence; moderate fine subeingular blocky structure; good permeability; well drained; few medium Fe/Mn stains; fairly numerous fine roots; many angular coarse gravel (quartz); clear wavy boundary, 24cm thick; pH 6.5.
42 - 105 cm
Comments
Hard and soft weathering rock. Good permeability; well drained; fine roots.
few
Exotic syringa trees provide shelter for grazing cattle. Horizon 3 has soil-like material (s,l,m), hard and soft weathering rock. There are inclusions of weathering rock in horizon 2. Horizon 3 was not sanpled.
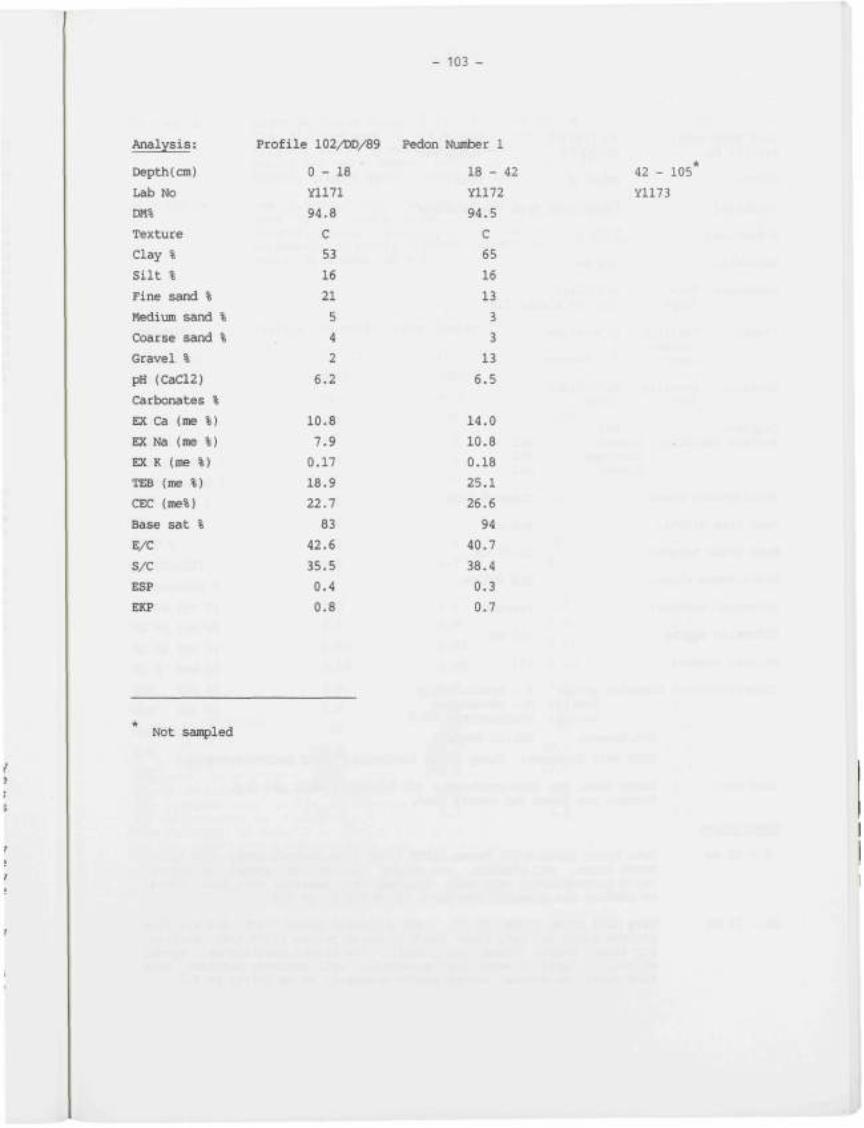
- 103 -
Analysis:
Depth(cm)
Lab No
DM%
Texture
Clay %
Silt %
Fine sand %
Medium sand %
Coarse sand %
Gravel %
pH (CaCl2)
Carbonates %
EX Ca (me %)
EX Na (me %)
EX K (me %)
TEB (me %)
CEC (me%)
Base sat %
E/C
S/C
ESP
EKP
Profile 102/DD/89
0-18
Y1171
94.8
C
53
16
21
5
4
2
6.2
10.8
7.9
0.17
18.9
22.7
83
42.6
35.5
0.4
0.8
Pedon Number 1
18 -
Y1172
94.5
C
65
16
13
3
3
13
6.5
14.0
10.8
0.18
25.1
26.6
94
40.7
38.4
0.3
0.7
Not sampled
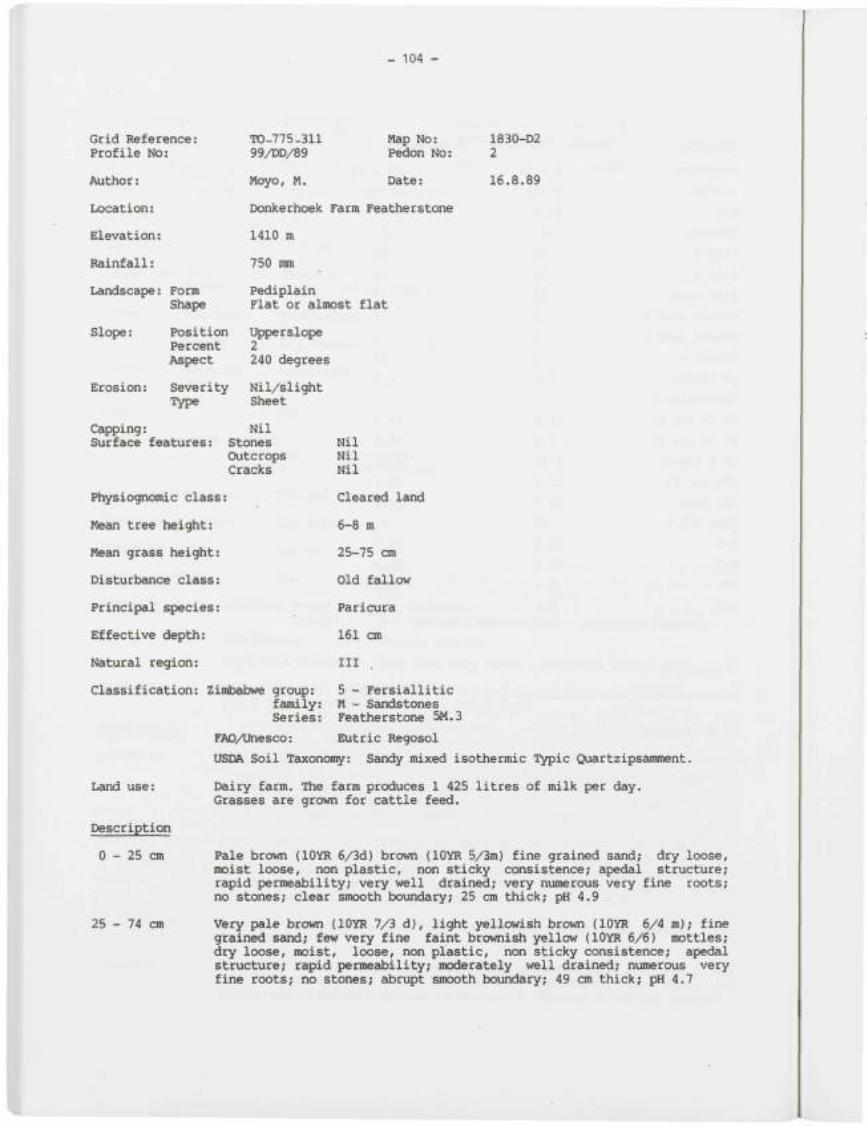
- 104 -
Grid Reference: Profile No:
Author:
Location:
Elevation:
Rainfall:
Landscape: Form Shape
slope: Position Percent Aspect
Erosion: Severity Type
Capping: Surface features:
Physiognomic class:
Mean tree height:
Mean grass height:
Disturbance class:
Principal species:
Effective depth:
Natural region:
TO-775-311 99/DD/89
Moyo, M.
Donkerhoek
1410 m
750 mm
Map No: Pedon No:
Date:
Farm Featherstone
Pediplain Flat or almost flat
I Upperslope 2 240 degrees
' Nil/slight Sheet
Nil Stones Outcrops Cracks
Classification: Zimbabwe group: family: Series:
Nil Nil Nil
Cleared land
6-8 m
25-75 cm
Old fallow
Paricura
161 cm
III
5 - Fersiallitic M - Sandstones Featherstone 5M.3
1830-D2 2
16.8.89
Land use:
Description
0 - 25 cm
25 - 74 cm
FAO/Unesco: Eutric Regosol
USDA Soil Taxonomy: Sandy mixed isothermic Typic Quartzipsamment.
Dairy farm. The farm produces 1 425 litres of milk per day. Grasses are grown for cattle feed.
Pale brown (lOYR 6/3d) brown (lOYR 5/3m) fine grained sand; dry loose, moist loose, non plastic, non sticky consistence; apedal structure; rapid permeability; very well drained; very numerous very fine roots; no stones; clear smooth boundary; 25 cm thick; pH 4.9
Very pale brown (lOYR 7/3 d), light yellowish brown (lOYR 6/4 m); fine grained sand; few very fine faint brownish yellow (lOYR 6/6) mottles; dry loose, moist, loose, non plastic, non sticky consistence; apedal structure; rapid permeability; moderately well drained; numerous very fine roots; no stones; abrupt smooth boundary; 49 cm thick; pH 4.7
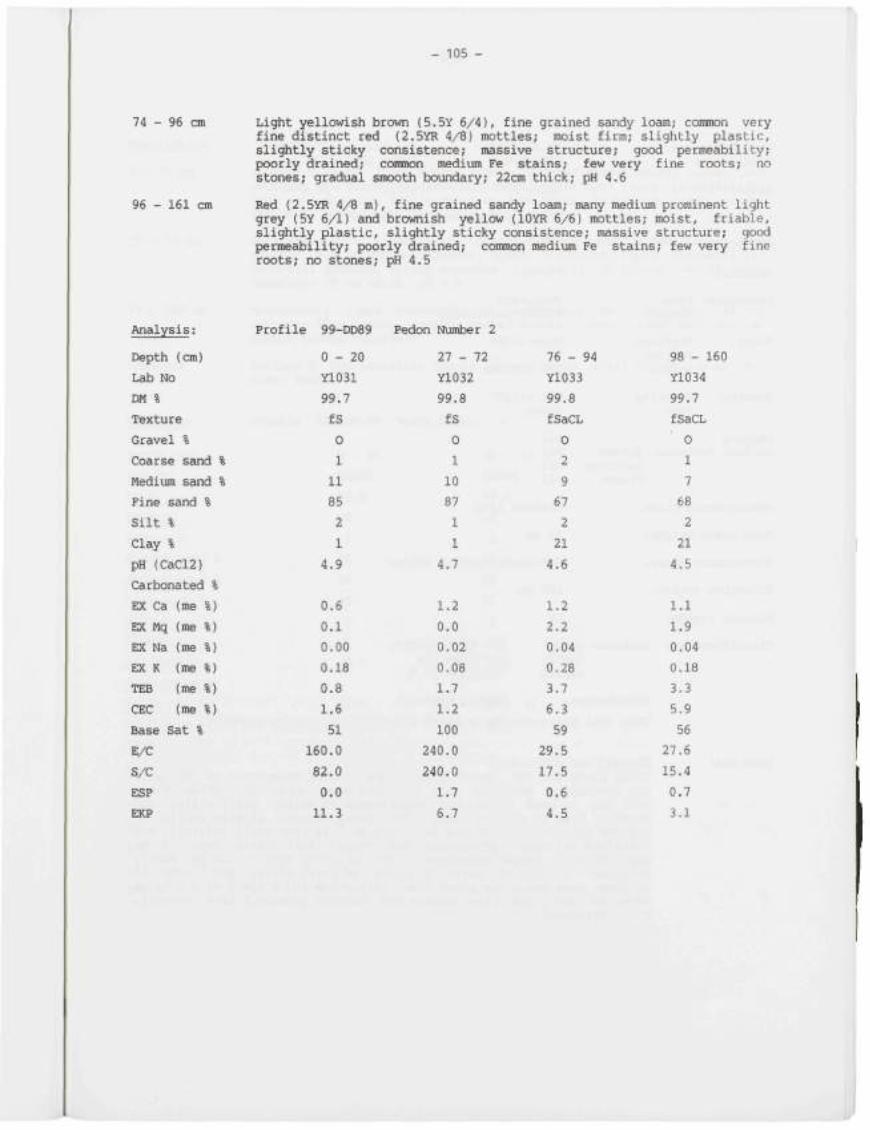
- 105 -
74 - 96 cm Light yellowish brown (5.5Y 6/4), fine grained sandy loam; common very fine distinct red (2.5YR 4/8) mottles; moist firm; slightly plastic, slightly sticky consistence; massive structure; good permeability; poorly drained; common medium Fe stains; few very fine roots; no stones; gradual smooth boundary; 22cm thick; pH 4.6
96 - 161 cm Red (2,SYR 4/8 m), fine grained sandy loam; many medium prominent light grey (5Y 6/1) and brownish yellow (lOYR 6/6) mottles; moist, friable, slightly plastic, slightly sticky consistence; massive structure; good permeability; poorly drained; common medium Fe stains; few very fine roots; no stones; pH 4.5
Analysis:
Depth (cm)
Lab No
DM %
Texture
Gravel %
Coarse sand
Medium sand
Fine sand %
Silt %
Clay %
pH (CaCl2)
Profile 99-DD89
0-20
Y1031
99.7
fS
0
% 1
% 11
85
2
1
4.9
Carbonated %
EX Ca (me %
EX Mq (me %
EX Na (me %
EX K (me %
TtB (me %
CEC (me %
Base Sat %
E/C
S/C
ESP
EKP
0.6
0.1
0.00
0.18
0.8
1.6
51
160.0
82.0
0.0
11.3
Pedon Number 2
27 - 72
Y1032
99.8
fS
0
1
10
87
1
1
4.7
1.2
0.0
0,02
0.08
1.7
1.2
100
240.0
240.0
1.7
6.7
76 - 94
Y1033
99.8
fSaCL
0
2
9
67
2
21
4.6
1.2
2.2
0.04
0.28
3.7
6.3
59
29.5
17.5
0.6
4.5
98 -
Y1034
99.7
fSaCL
0
1
7
68
2
21
4.5
1.1
1.9
0.04
0.18
3.3
5.9
56
27.6
15.4
0.7
3.1
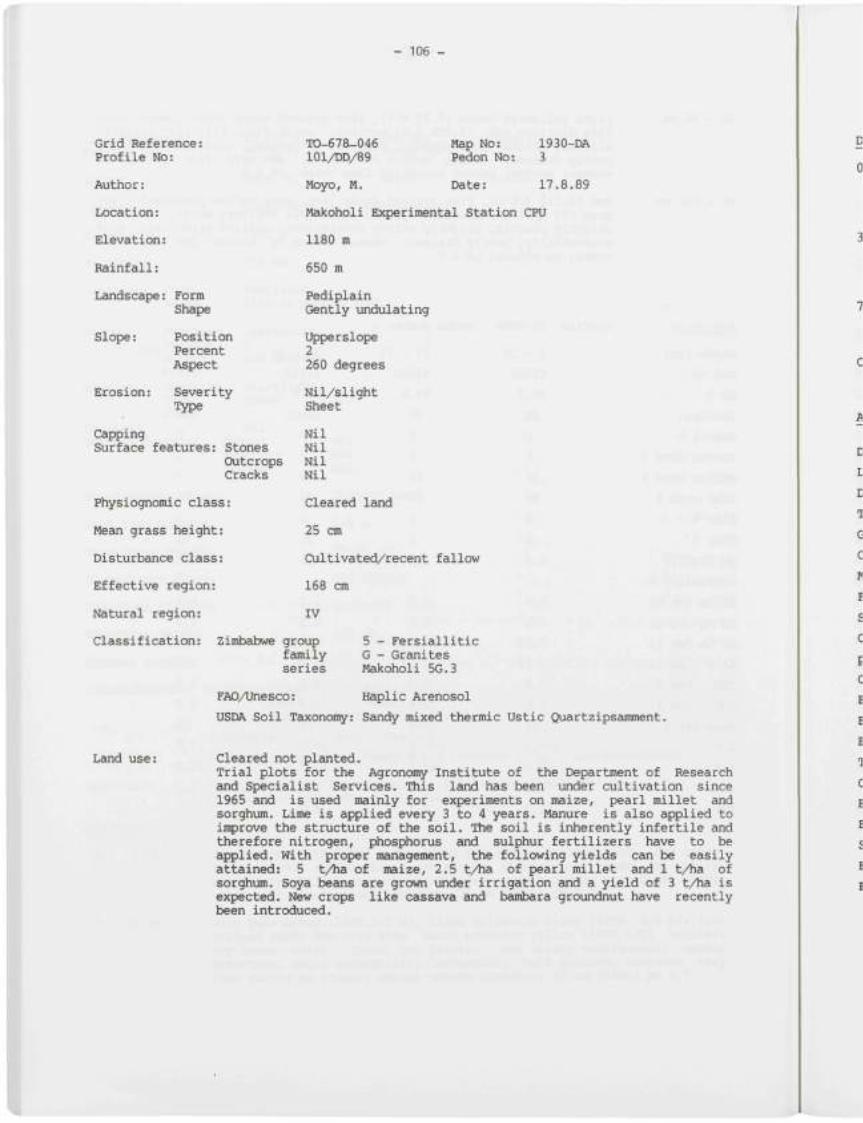
- 106 -
Grid Reference: Profile No:
Author:
Location:
Elevation:
Rainfall:
Landscape: Form Shape
10-678-046 lOl/DD/89
Map No: Pedon No:
1930-DA 3
Slope:
Erosion:
Position Percent Aspect
Severity Type
Capping Surface features: Stones
Outcrops Cracks
Physiognomic class:
Mean grass height:
Disturbance class:
Effective region:
Natural region:
Moyo, M. Date: 17.8.89
Makoholi Experimental Station CPU
1180 m
650 m
Pediplain Gently londulating
Upperslope 2 260 degrees
Nil/slight Sheet
Nil Nil Nil Nil
Cleared land
25 cm
Cultivated/recent fallow
168 cm
IV
Classification: Zimbabwe group family series
5 - Fersiallitic G - Granites Makoholi 5G.3
FAOAfnesco: Haplic Arenosol
USDA Soil Taxonomy: Sandy mixed thermic Ustic Quartzipsamment.
Land use: Cleared not planted. Trial plots for the Agronomy Institute of the Department of Research and Specialist Services. This land has been under cultivation since 1965 and is used mainly for experiments on maize, pearl millet and sorgh\jm. Lime is applied every 3 to 4 years. Manure is also applied to improve the structure of the soil. The soil is inherently infertile and therefore nitrogen, phosphorus and sulphur fertilizers have to be applied, with proper management, the following yields can be easily attained: 5 t/ha of maize, 2.5 t/ha of pearl millet and 1 t/ha of sorghum. Soya beans are grown under irrigation and a yield of 3 t/ha is expected. New crops like cassava and bambara groiondnut have recently been introduced.

- 107 -
Description
O - 35 cm
35 - 74 cm
74 - 168 cm
Comments
Yellowish brown (lOYR 5/4m) coarse grained sand; moist, loose; non plastic, non sticky consistence; apedal structure; rapid permeability; very well drained; fairly numerous fine roots; no stones; clear smooth boxondary; 35cm thick; pH 5.0
Brownish yellow (lOYR 6/6m), coarse grained sand; moist, loose; non plastic, non sticky consistence; apedal structure; rapid permeability; very well drained; fairly numerous fine roots; no stones; abrupt wavy bovmdary; 39 cm thick; pH 4.5
Excessively rapid permeability; moderately well drained; fairly nvmierous fine roots; loosely packed angular small stones and angular coarse gravel (quartz);
Horizon 3 has lateritic quartz stones v iich start at 105 cm at the other face.
Analysis;
Depth (cm)
Lab No
DM %
Texture
Gravel %
Coarse sand %
Medium sand %
Fine sand %
Silt %
Clay %
pH (CaCl2)
Carbonates %
EX Ca (me %)
EX Na (me %)
EX K (me %)
TEB (me %)
CEC (me %)
Base Sat %
E/C
S/C
ESP
EKP
Profile lOl-DD-89 Pedon Number 3
0-30
Y1039
99.9
cS
1
25
34
34
5
2
5.0
0.7
0.2
1.101 0.02
1.1
1.4
76
70.0
55.0
4.3
7.1
37 - 72
Y1040
99.8
cS
2
29
32
31
4
4
4.5
1.0
0.0
1.0
1.0
100
25.0
25.0
2.0
2.0
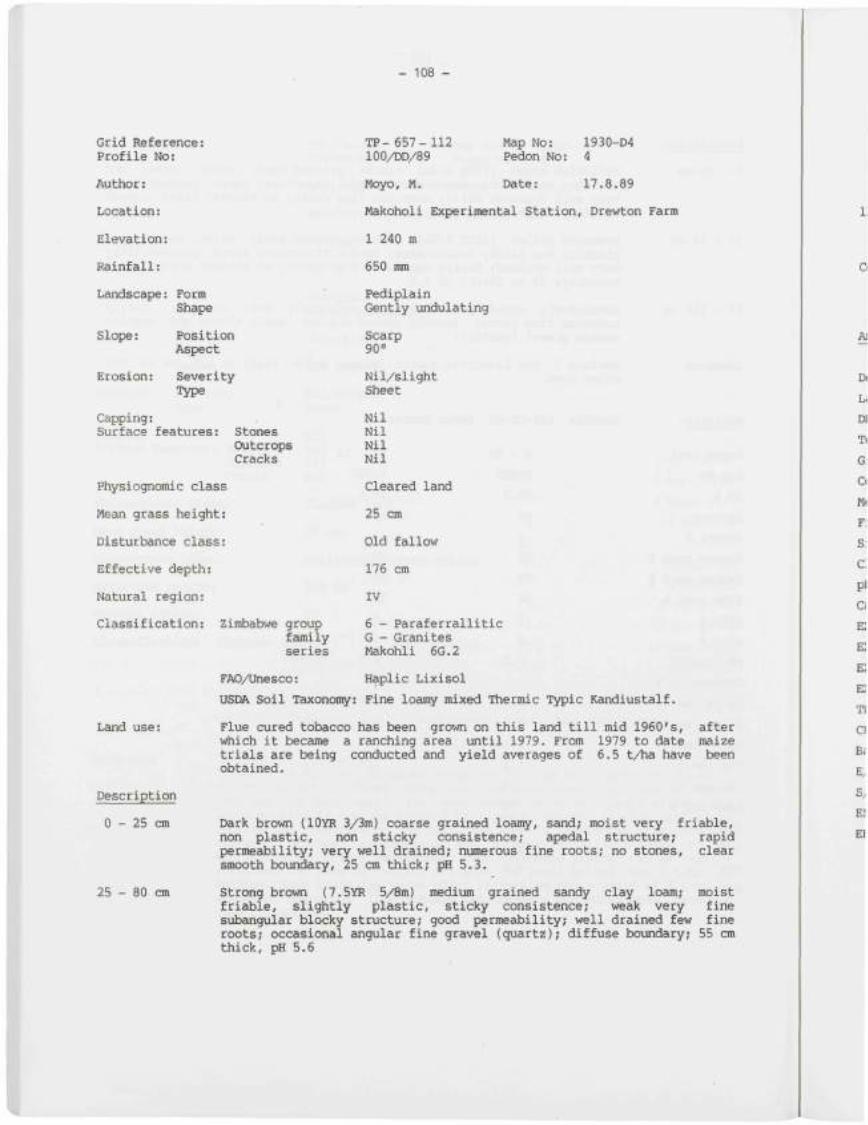
- 108 -
Grid Reference: Profile No:
Author:
Location:
Elevation:
Rainfall:
Landscape:
Slope:
Erosion:
Form Shape
Position Aspect
Severity lype
Capping: Surface features: Stones
Outcrops Cracks
TP-657-112 100A>D/89
Map No: Pedon No:
1930-D4 4
Physiognomic class
Mean grass height:
Disturbance class:
Effective depth:
Natural region:
Classification
Moyo, M. Date: 17.8.89
Makoholi Experimental Station, Drewton Farm
1 240 m
650 mm
Pediplain Gently undulating
Scarp 90°
Nil/slight Sheet
Nil Nil Nil Nil
Cleared land
25 cm
Old fallow
176 cm
IV
6 - Paraferrallitic G - Granites Makohli 6G.2
Haplic Lixisol
Land use:
Description
0 - 25 cm
25 - 80 cm
Zimbabwe group family series
FAO/Unesco:
USDA Soil Taxonomy: Fine loamy mixed Thermic Typic Kandiustalf.
Flue cured tobacco has been grown on this land till mid 1960's, after which it became a ranching area until 1979. From 1979 to date maize trials are being conducted and yield averages of 6.5 t/ha have been obtained.
Dark brown (lOYR 3/3m) coarse grained loamy, sand; moist very friable, non plastic, non sticky consistence; apedal structure; rapid permeability; very well drained; numerous fine roots; no stones, clear smooth boundary, 25 cm thick; pH 5.3.
Strong brown (7.5YR 5/8m) medium grained sandy clay loam; moist friable, slightly plastic, sticky consistence; weak very fine sxobangular blocky structure; good permeability; well drained few fine roots; occasional angular fine gravel (quartz); diffuse boundary; 55 cm thick, pH 5.6
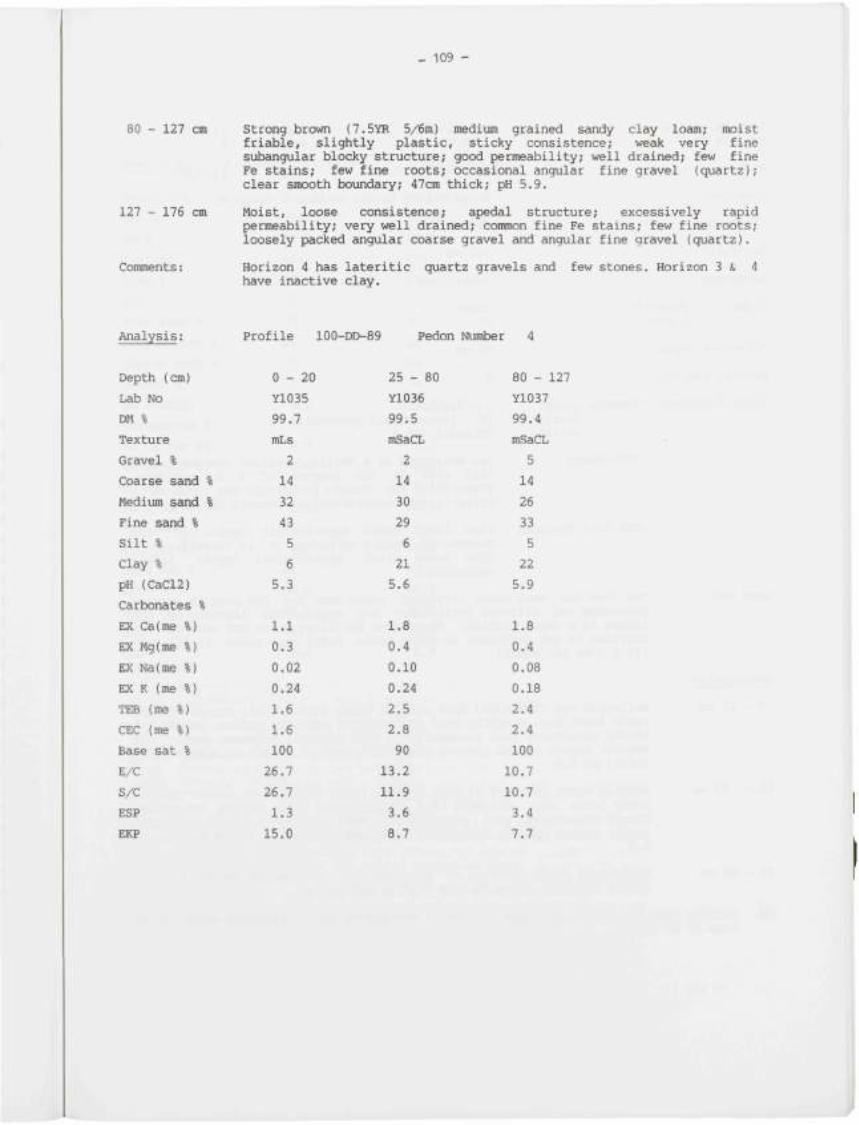
_ 109 -
80 - 127 cm Strong brown {7.5YR 5/6m) medium grained sandy clay loam; moist friable, slightly plastic, sticky consistence; weak very fine subangular blocky structure; good permeability; well drained; few fine Fe stains; few fine roots; occasional angular fine gravel (quartz); clear smooth boundary; 47cm thick; pH 5.9.
127 - 176 cm Moist, loose consistence; apedal structure; excessively rapid permeability; very well drained; common fine Fe stains; few fine roots; loosely packed angular coarse gravel and angular fine gravel (quartz).
Comments: Horizon 4 has lateritic quartz gravels and few stones. Horizon 3 & have inactive clay.
Analysis:
Depth (cm)
Lab No
DM %
Texture
Gravel %
Coarse sand %
Medivim sand %
Fine sand %
Silt %
Clay %
pH (CaCl2)
Carbonates %
EX Ca(me %)
EX Mg(me %)
EX Na(me %)
EX K (me %)
TEB (me %)
CEC (me %)
Base sat %
E/C
S/C
ESP
EKP
Profile 100-
0-20
yl035
99.7
mLs
2
14
32
43
5
6
5.3
1.1
0.3
0.02
0.24
1.6
1.6
100
26.7
26.7
1.3
15.0
-DD-89 Pedon Numbe
25 - 80
yl036
99.5
mSaCL
2
14
30
29
6
21
5.6
1.8
0.4
0.10
0.24
2.5
2.8
90
13.2
11.9
3.6
8.7
r 4
80 - 127
¥1037
99.4
mSaCL
5
14
26
33
5
22
5.9
1.8
0.4
0.08
0.18
2.4
2.4
100
10.7
10.7
3.4
7.7
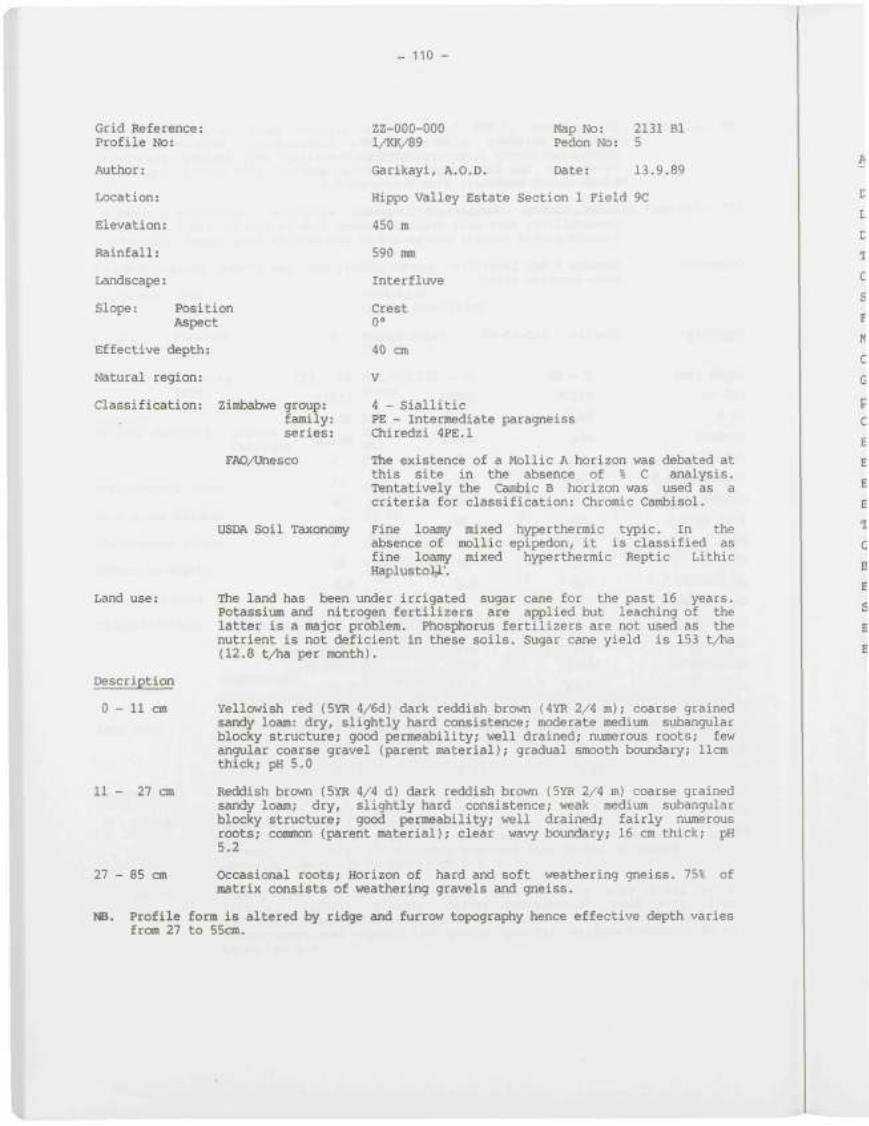
- 110 -
Grid Reference: Profile No:
Author:
Location:
Elevation:
Rainfall:
Landscape:
ZZ-000-000 l/KK/89
Map No: Pedon No:
2131 Bl 5
Slope: Position Aspect
Effective depth:
Natural region:
Classification: Zimbabwe group: family: series:
FAOAJnesco
USDA Soil Taxonorty
Garikayi, A.O.D. Date: 13.9.89
Hippo Valley Estate Section 1 Field 9C
450 m
590 mm
Interfluve
Crest 0°
40 cm
V
4 - Siallitic PE - intermediate paragneiss Chiredzi 4PE.1
The existence of a Mollic A horizon was debated at this site in the absence of % C analysis. Tentatively the Cambic B horizon was used as a criteria for classification: Chromic Cambisol.
Fine loamy mixed hyperthermic typic. In the absence of mollic epipedon, it is classified as fine loamy mixed hyperthermic Reptic Lithic Haplustoljl'.
Land use:
Description
0 - 11 cm
11 - 27 cm
The land has been under irrigated sugar cane for the past 16 years. Potassium and nitrogen fertilizers are applied but leaching of the latter is a major problem. Phosphorus fertilizers are not used as the nutrient is not deficient in these soils. Sugar cane yield is 153 t/ha (12.8 t/ha per month).
yellowish red (5YR 4/6d) dark reddish brown (4YR 2/4 m); coarse grained sandy loam: dry, slightly hard consistence; moderate mediiom subangular blocky structure; good permeability; well drained; numerous roots; few angular coarse gravel (parent material); gradual smooth boundary; 11cm thick; pH 5.0
Reddish brown (5YR 4/4 d) dark reddish brown (5YR 2/4 m) coarse grained sandy loam; dry, slightly hard consistence; weak mediiam si±iangular blocky structure; good permeability; well drained; fairly numerous roots; common (parent material); clear wavy boundary; 16 cm thick; pH 5.2
27 - 85 cm Occasional roots; Horizon of hard and soft weathering gneiss, matrix consists of weathering gravels and gneiss.
75% of
NB. Profile form is altered by ridge eund furrow topography hence effective depth varies from 27 to 55cm.
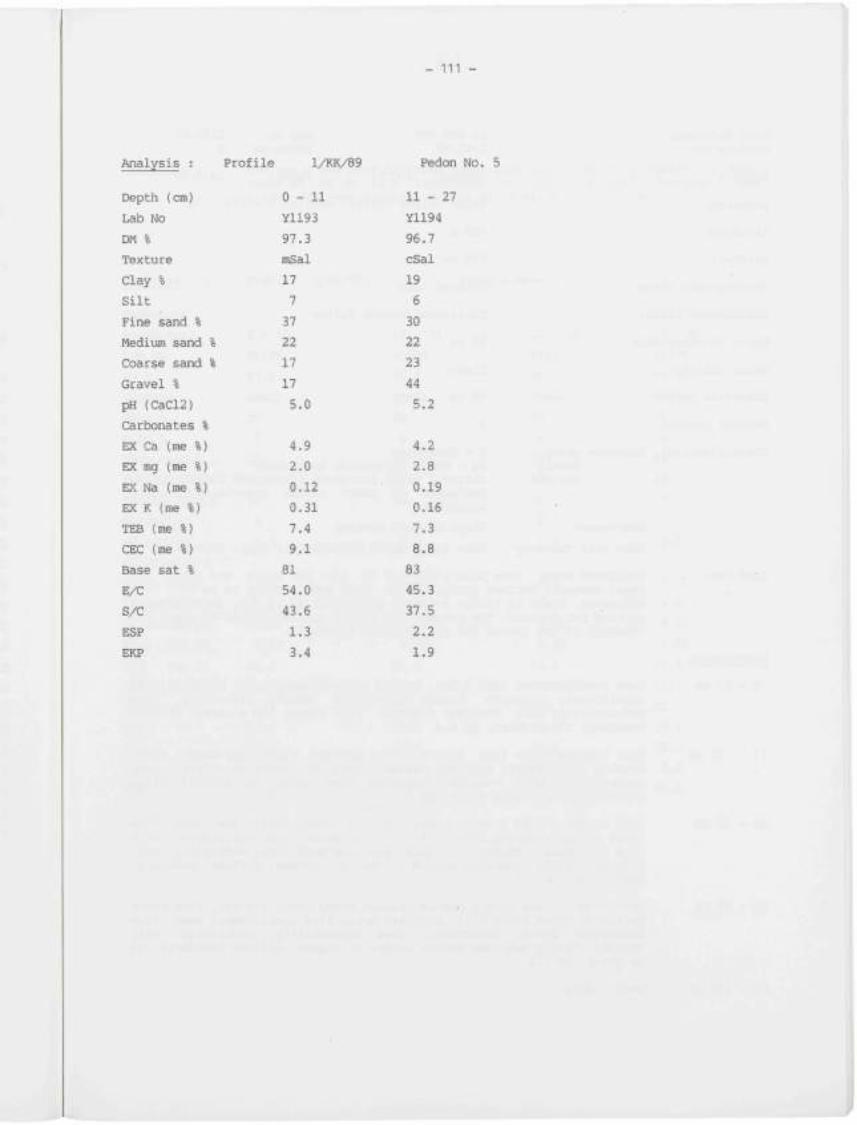
- I l l -
Analysis :
Depth (cm)
Lab No
DM %
Texture
Clay %
Silt
Fine sand %
Mediiam sand %
Coarse sand %
Gravel %
pH (CaCl2)
Carbonates %
EX Ca (me %)
EX mg (me %)
EX Na (me %)
EX K (me %)
TEB (me %)
CEC (me %)
Base sat %
E/C
S/C
ESP
EKP
Profile l/KK/89
0-11
Y1193
97.3
mSal
17
7
37
22
17
17
5,0
4.9
2.0
0.12
0.31
7,4
9.1
81
54.0
43.6
1.3
3.4
Pedon No.
11 - 27
Y1194
96.7
cSal
19
6
30
22
23
44
5.2
4.2
2.8
0.19
0.16
7.3
8.8
83
45.3
37.5
2.2
1.9
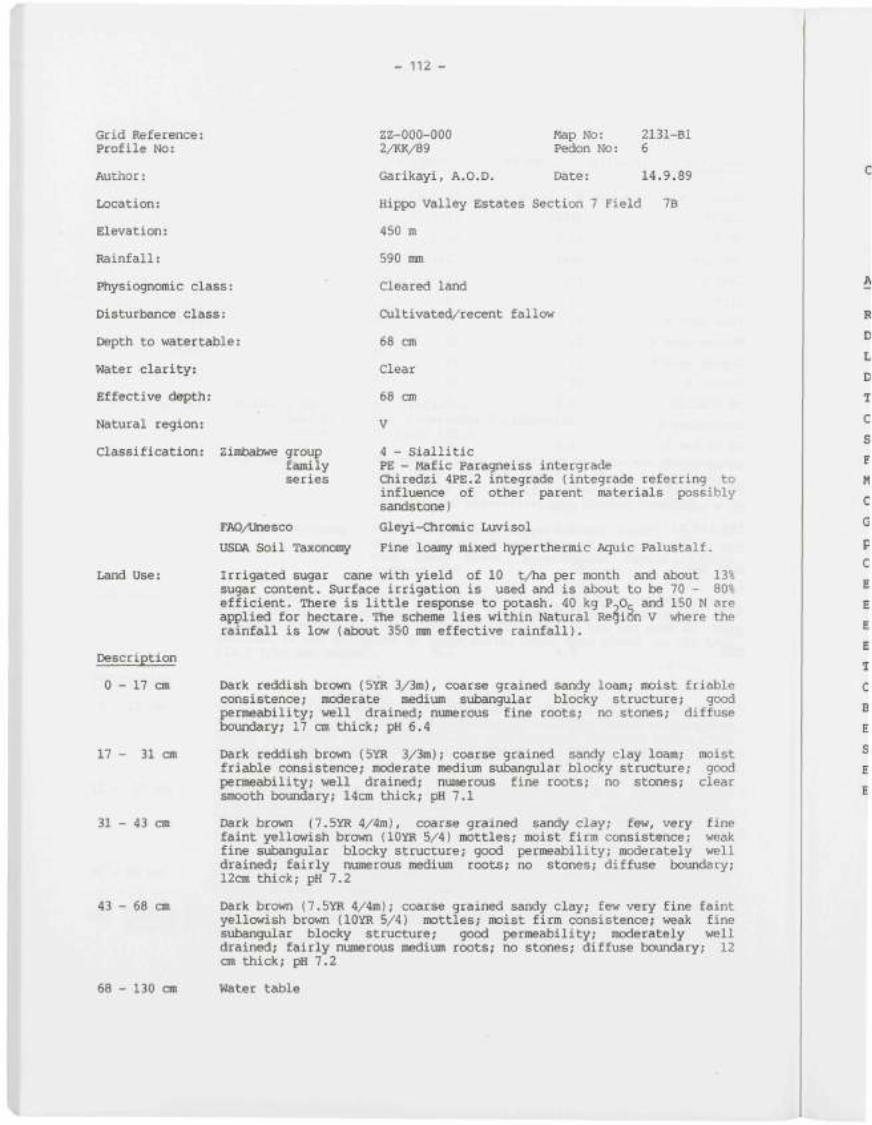
- 112 -
Grid Reference: Profile No:
Author:
Location:
Elevation:
Rainfall:
Physiognomic class:
Disturbance class:
Depth to watertable:
Water clarity:
Effective depth:
ZZ-000-000 2/KK/89
Map No: Pedon No:
2131-Bl 6
Natural region:
Classification:
Land Use:
Description
0 - 17 cm
17 - 31 cm
31 - 43 cm
43 - 68 cm
Zimbabwe group family series
FAO/Unesco
USDA Soil Taxonomy
Garikayi, A.O.D. Date: 14.9.89
Hippo Valley Estates Section 7 Field 7B
450 m
590 mm
Cleared land
Cultivated/recent fallow
68 cm
Clear
68 cm
V
4 - Siallitic PE - Mafic Paragneiss intergrade Chiredzi 4PE.2 integrade (integrade referring to influence of other parent materials possibly sandstone)
Gleyi-Chromic Luvisol
Fine loamy mixed hyperthermic Aquic Palustalf.
Irrigated sugar cane with yield of 10 t/ha per month and about 13% sugar content. Surface irrigation is used and is about to be 70 - 80% efficient. There is little response to potash. 40 kg P2OC and 150 N are applied for hectare. The scheme lies within Natural Region V where the rainfall is low (about 350 mm effective rainfall).
Dark reddish brown (5YR 3/3m), coarse grained sandy loam; moist friable consistence; moderate medium si±iangular blocky structure; good permeability; well drained; numerous fine roots; no stones; diffuse boundary; 17 cm thick; pH 6.4
Dark reddish brown (5YR 3/3m); coarse grained sandy clay loam; moist friable consistence; moderate medium subangular blocky structure; good permeability; well drained; nxomerous fine roots; no stones; clear smooth boiandary; 14cm thick; pH 7.1
Dark brown (7.5'XR 4/4m), coarse grained sandy clay; few, very fine faint yellowish brown (lOYR 5/4) mottles; moist firm consistence; weak fine sxibangular blocky structure; good permeability; moderately well drained; fairly numerous medium roots; no stones; diffuse boundary; 12cm thick; pH 7.2
Dark brown (7.5YR 4/4m); coarse grained sandy clay; few very fine faint yellowish brown (lOYR 5/4) mottles; moist firm consistence; weak fine si±)angular blocky structure; good permeability; moderately well drained; fairly numerous medium roots; no stones; diffuse boundary; 12 cm thick; pH 7.2
68 - 130 cm Water table
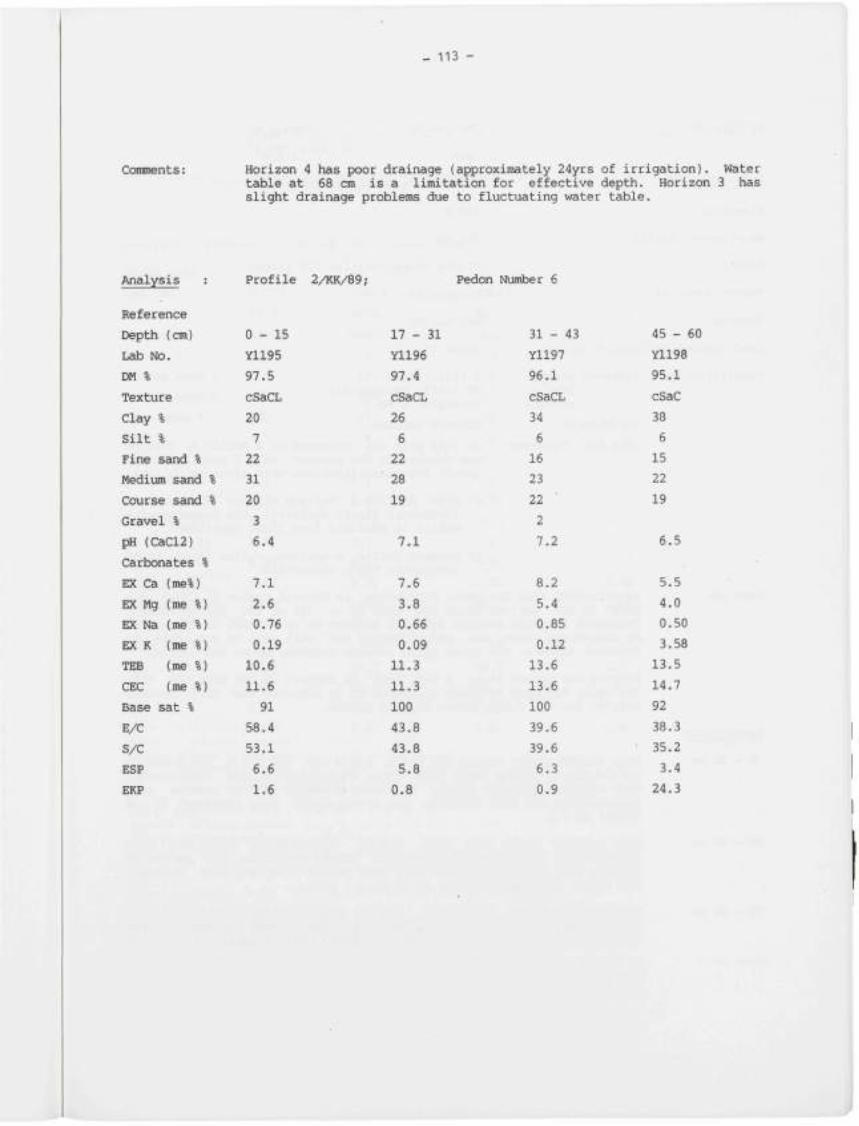
_ 113 -
Comments: Horizon 4 has poor drainage (approximately 24yrs of irrigation). Water table at 68 cm is a limitation for effective depth. Horizon 3 has slight drainage problems due to fluctuating water table.
Analysis Profile 2/KK/89;
Reference
Depth (cm)
Lab No.
DM %
Texture
Clay %
Silt %
Fine sand %
Medium sand
Course sand
Gravel %
pH (CaC12)
0-15
Y1195
97.5
cSaCL
20
7
22
% 31
% 20
3
6.4
Carbonates %
EX Ca (me%)
EX Mg (me %
EX Na (me %
EX K (me %
TEB (me %
CEC (me %
Base sat %
E/C
S/C
ESP
EKP
7.1
2.6
0.76
0.19
10.6
11.6
91
58.4
53.1
6.6
1.6
17 - 31
Y1196
97.4
cSaCL
26
6
22
28
19
7.1
7.6
3.8
0.66
0.09
11.3
11.3
100
43.8
43.8
5.8
0.8
Pedon Number 6
31 - 43
Y1197
96.1
cSaCL
34
6
16
23
22
2
7.2
8.2
5.4
0.85
0.12
13.6
13.6
100
39.6
39.6
6.3
0.9
45 - 60
Y1198
95.1
cSaC
38
6
15
22
19
6.5
5.5
4.0
0.50
3.58
13.5
14.7
92
38.3
• 35.2
3.4
24.3
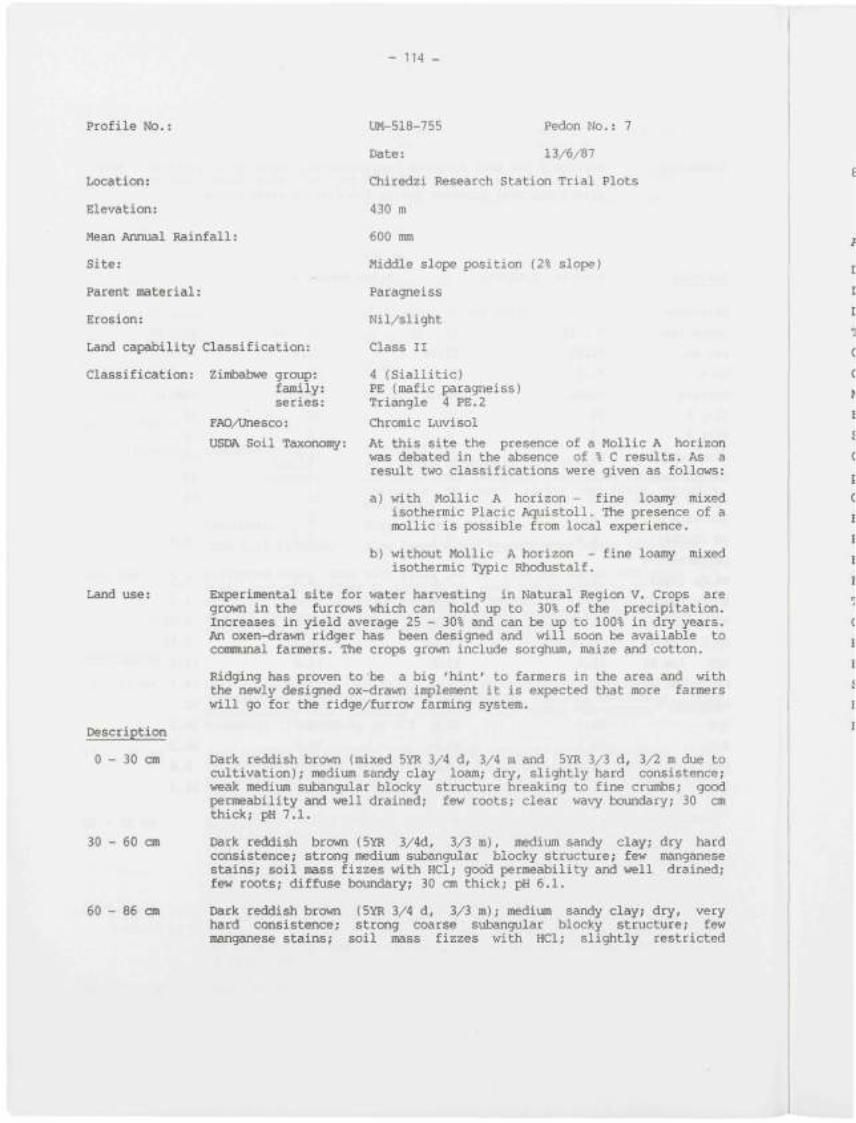
- 114 -
Profile No.: UM-518-755 Pedon No.
Location:
Elevation:
Mean Annual Rainfall:
Site:
Parent material:
Erosion:
Land capability Classification:
Classification: Zimbabwe group: family: series:
FAOAJnesco:
USDA Soil Taxonomy:
Date: 13/6/87
Chiredzi Research Station Trial Plots
430 m
600 mm
Middle slope position (2% slope)
Paragneiss
Nil/slight
Class II
4 (Siallitic) PE (mafic paragneiss) Triangle 4 PE.2 Chromic Luvisol
At this site the presence of a Mollic A horizon was debated in the absence of % C results. As a result two classifications were given as follows:
a) with Mollic A horizon - fine loamy mixed isothermic Placic Aquistoll. The presence of a mollic is possible from local experience.
Land use:
b) without Mollic A horizon - fine loamy isothermic Typic Rhodustalf.
mixed
Experimental site for water harvesting in Natural Region V. Crops are grown in the furrows v^ich can hold up to 30% of the precipitation. Increases in yield average 25 - 30% and can be up to 100% in dry years. An oxen-drawn ridger has been designed and will soon be available to communal farmers. The crops grown include sorghimi, maize and cotton.
Ridging has proven to be a big 'hint' to farmers in the area and with the newly designed ox-drawn inclement it is expected that more farmers will go for the ridge/furrow farming system.
Description
0 - 30 cm
30 - 60 cm
60 - 86 cm
Dark reddish brown (mixed 5YR 3/4 d, 3/4 m and 5YR 3/3 d, 3/2 m due to cultivation); medivmi sandy clay loam; dry, slightly hard consistence; weak medium subangular blocky structure breaking to fine crumbs; good permeability and well drained; few roots; clear wavy boundary; 30 cm thick; pH 7.1.
Dark reddish brown (5YR 3/4d, 3/3 m), medium sandy clay; dry hard consistence; strong medium subangular blocky structure; few manganese stains; soil mass fizzes with HCl; good permeability and well drained; few roots; diffuse boundary; 30 cm thick; pH 6.1.
Dark reddish brown (5YR 3/4 d, 3/3 m); medium sandy clay; dry, very hard consistence; strong coarse subangular blocky structure; few manganese stains; soil mass fizzes with HCl; slightly restricted
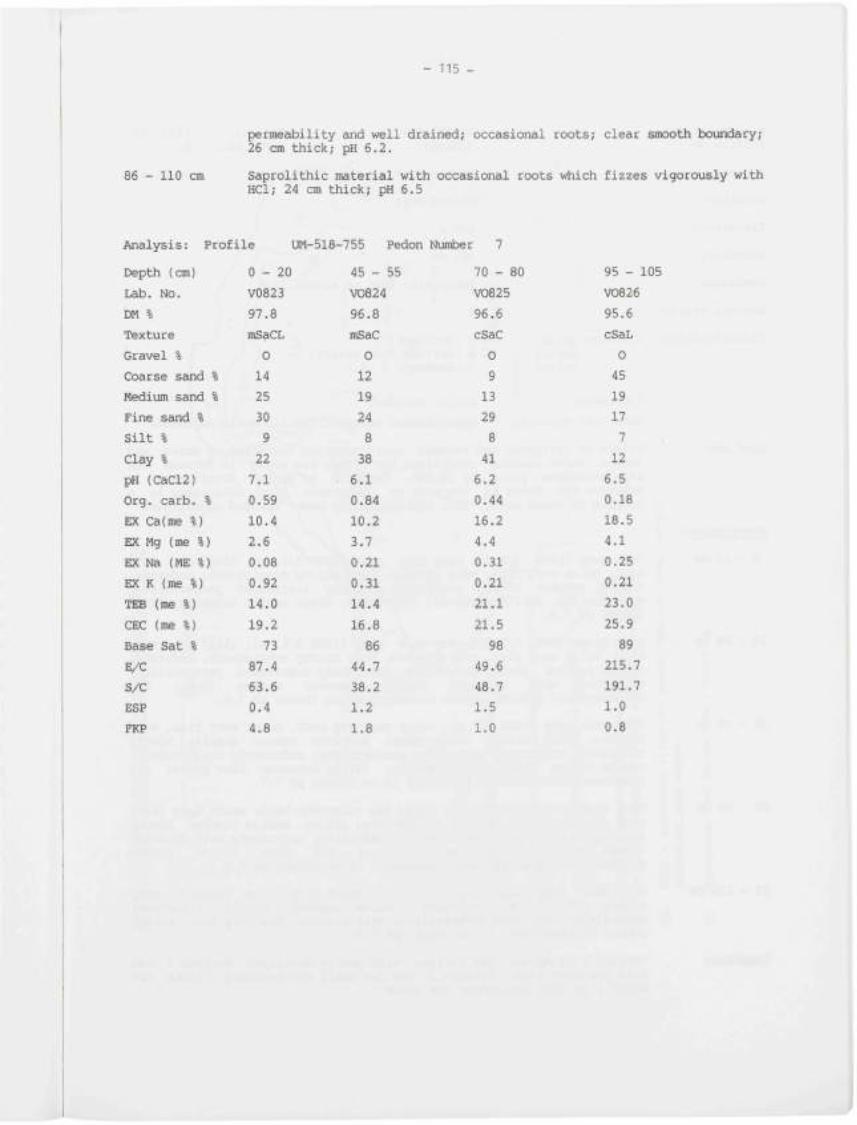
- 115 -
permeability and well drained; occasional roots; clear smooth boundary; 26 cm thick; pH 6.2.
86 - 110 cm Saprolithic material with occasional roots v^ich fizzes vigorously with HCl; 24 cm thick; pH 6.5
Analysis: Profile UM-518-
Depth (cm)
Lab. No.
DM %
Texture
Gravel %
Coarse sand %
Medium sand %
Fine sand %
Silt %
Clay %
pH (CaCl2)
Org. carb. %
EX Ca(me %)
EX Mg (me %)
EX Na (ME %)
EX K (me %)
TEB (me %)
CEC (me %)
Base Sat %
E/C
S/C
ESP
FKP
0-20
V0823
97.8
mSaCL
0
14
25
30
9
22
7.1
0.59
10.4
2.6
0.08
0.92
14.0
19.2
73
87.4
63.6
0.4
4.8
-755 Pedon
45 - 55
V0824
96.8
mSaC
0
12
19
24
8
38
6.1
0.84
10.2
3.7
0.21
0.31
14.4
16.8
86
44.7
38.2
1.2
1.8
Number 7
70 - 80
V0825
96.6
cSaC
0
9
13
29
8
41
6.2
0.44
16.2
4.4
0.31
0.21
21.1
21.5
98
49.6
48.7
1.5
1.0
95 -
V0826
95.6
cSaL
0
45
19
17
7
12
6.5
0.18
18,5
4.1
0.25
0.21
23.0
25.9
89
215.7
191.7
1.0
0.8
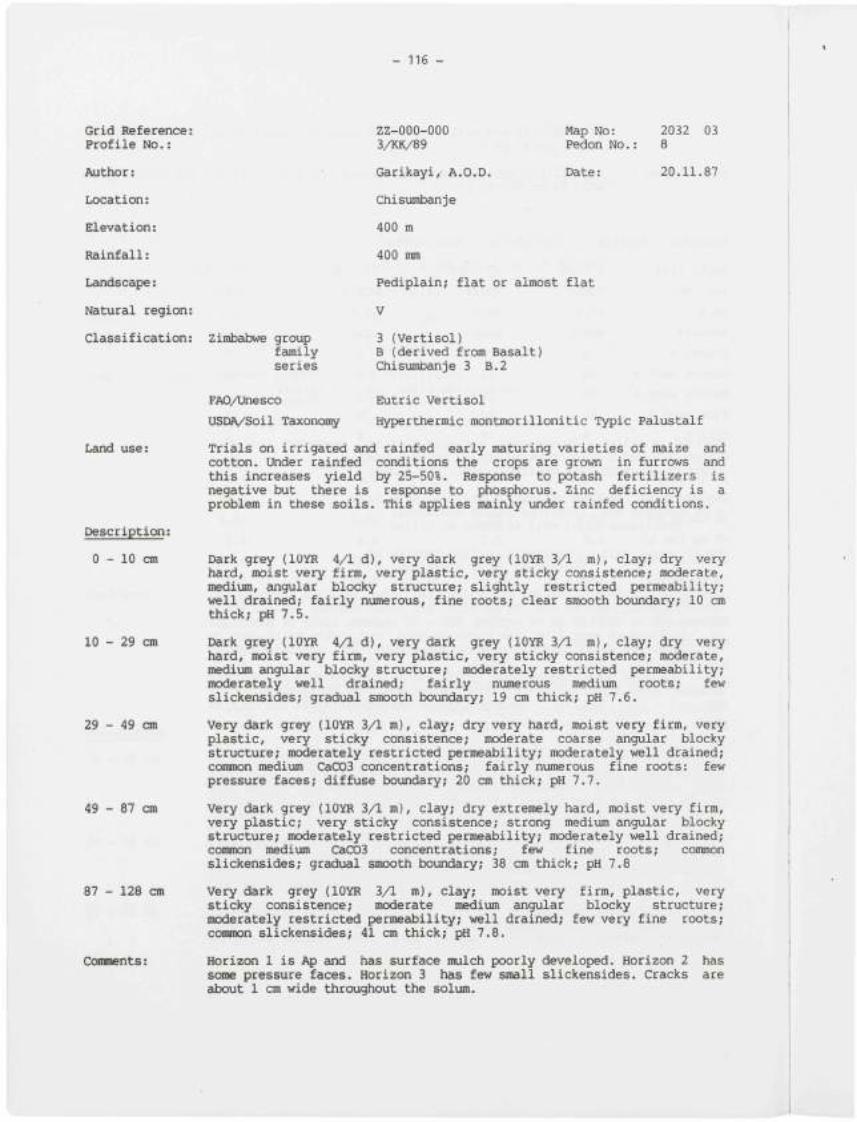
- 116 -
Grid Reference: Profile No,:
Author:
Location:
Elevation:
Rainfall:
Landscape:
Natural region:
Classification: Zimbabwe group family series
FAO/IKnesco
USDA/Soil Taxonoity
ZZ-000-000 Map No: 3/KK/89 Pedon No.
Garikayi,' A.O.D. Date:
Chisumbanje
400 m
400 mm
Pediplain; flat or almost flat
V
3 (Vertisol) B (derived from Basalt) Chisumoanje 3 B.2
Eutric Vertisol
Hyperthermic montmorillonitic Typic
2032 03 : 8
20.11.87
Palustalf
Land use:
Description;
0 - 10 cm
10 - 29 cm
29 - 49 cm
49 - 87 cm
87 - 128 cm
Comments:
Trials on irrigated and rainfed early maturing varieties of maize and cotton. Under rainfed conditions the crops are grown in furrows and this increases yield by 25-50%. Response to potash fertilizers is negative but there is response to phosphorus. Zinc deficiency is a problem in these soils. This applies mainly under rainfed conditions.
Dark grey (lOYR 4/1 d), very dark grey (lOYR 3/1 m), clay; dry very hard, moist very firm, very plastic, very sticky consistence; moderate, medivim, angular blocky structure; slightly restricted permeability; well drained; fairly numerous, fine roots; clear smooth boundary; 10 cm thick; pH 7.5.
Dark grey (lOYR 4/1 d), very dark grey (lOYR 3/1 m), clay; dry very hard, moist very firm, very plastic, very sticky consistence; moderate, medium angular blocky structure; moderately restricted permeability; moderately well drained; fairly numerous medium roots; few slickensides; gradual smooth boundary; 19 cm thick; pH 7.6.
Very dark grey (lOYR 3/1 m), clay; dry very hard, moist very firm, very plastic, very sticky consistence; moderate coarse angular blocky structure; moderately restricted permeability; moderately well drained; common medium CaC03 concentrations; fairly mamerous fine roots: few pressure faces; diffuse boxindary; 20 cm thick; pH 7.7.
Very dark grey (lOYR 3/1 m), clay; dry extremely hard, moist very firm, very plastic; very sticky consistence; strong mediiom angular blocky structure; moderately restricted permeability; moderately well drained; common medium CaC03 concentrations; few fine roots; common slickensides; gradual smooth boxmdary; 38 cm thick; pH 7.8
Very dark grey (lOYR 3/1 m), clay; moist very firm, plastic, very sticky consistence; moderate medium angular blocky structure; moderately restricted permeability; well drained; few very fine roots; common slickensides; 41 cm thick; pH 7.8.
Horizon 1 is i^ and has surface mulch poorly developed. Horizon 2 has some pressure faces. Horizon 3 has few small slickensides. Cracks are about 1 cm wide throughout the solum.
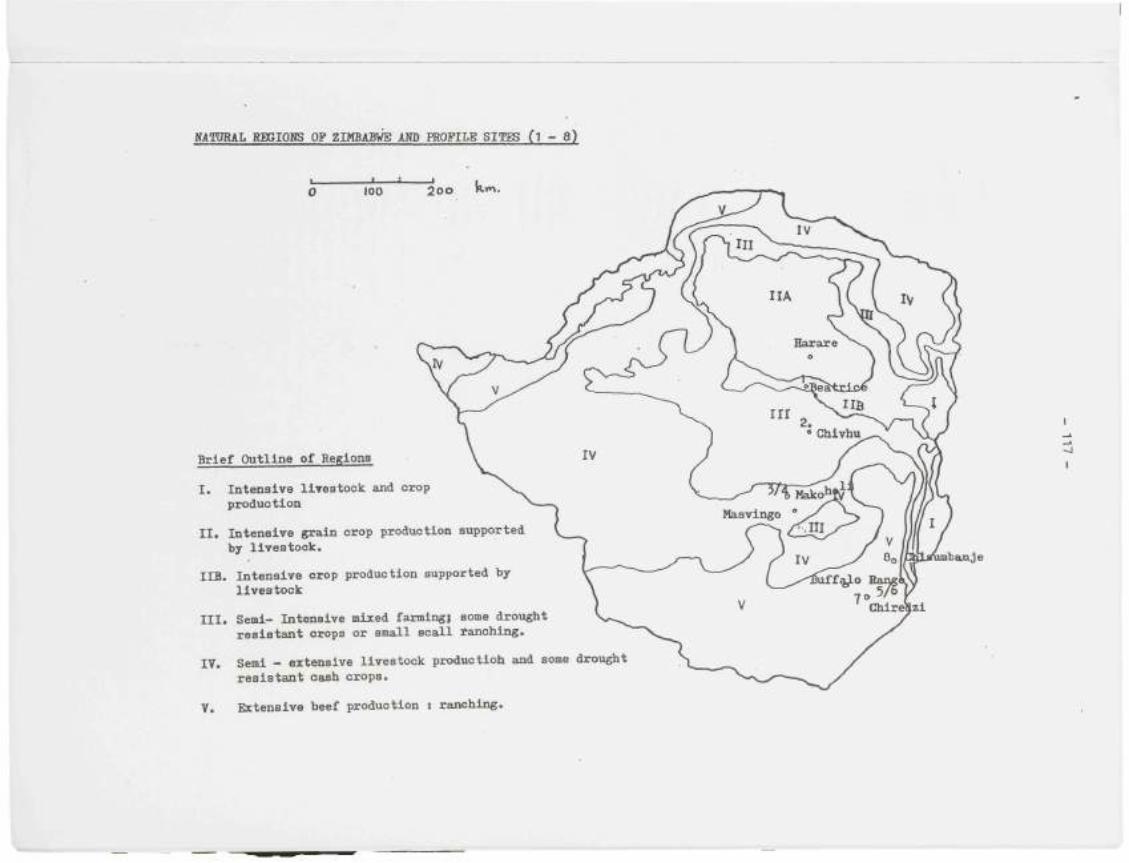
NATORAL RESIGNS OP ZIMBABWE AKD PROFILE SITES ( 1 - 8 )
100 2oo
Brief Outline of Regions
I. Intensive livestock and crop production
II. Intensive grain crop production supported by livestock.
IIB. Intensive crop production supported by livestock
III. Semi- Intensive mixed farmingi some drought resistant crops or small scall i anching.
17. Semi - extensive livestock productioh and some drought resistant cash crops.
V. Extensive beef production : ranching.
ibanje
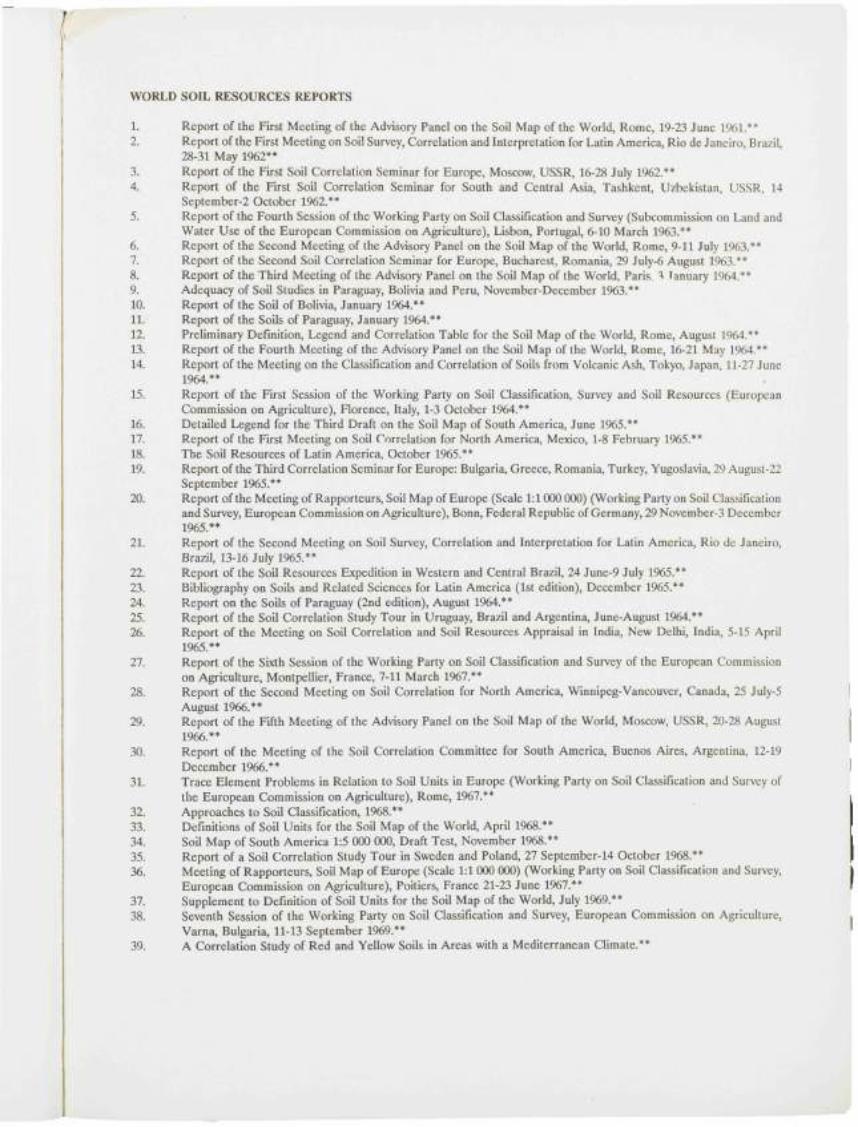
WORLD SOIL RESOURCES REPORTS
1. Report of the First Meeting of the Advisory Panel on the Soil Map of the World, Rome, 19-23 June 1961.** 2. Report of the First Meeting on Soil Survey, Correlation and Interpretation for Latin America, Rio de Janeiro, Brazil,
28-31 May 1962** 3. Report of the First Soil Correlation Seminar for Europe, Moscow, USSR, 16-28 July 1962.** 4. Report of the First Soil Correlation Seminar for South and Central Asia, Tashkent, Uzbekistan, USSR, 14
September-2 October 1962.** 5. Report of the Fourth Session of the Working Party on Soil Classification and Survey (Subcommission on Land and
Water Use of the European Commission on Agriculture), Lisbon, Portugal, 6-10 March 1963.** 6. Report of the Second Meeting of the Advisory Panel on the Soil Map of the World, Rome, 9-11 July 1963.** 7. Report of the Second Soil Correlation Semineu" for Europe, Bucharest, Romania, 29 July-6 August 1963.** 8. Report of the Third Meeting of the Advisory Panel on the Soil Map of the World, Paris ^ Tanuary 1964.** 9. Adequacy of Soil Studies in Paraguay, Bolivia and Peru, November-December 1963.** 10. Report of the Soil of Bolivia, January 1964.** 11. Report of the Soils of Paraguay, January 1964.** 12. Preliminary Definition, Legend and Correlation Table for the Soil Map of the World, Rome, August 1964.** 13. Report of the Fourth Meeting of the Advisory Panel on the Soil Map of the World, Rome, 16-21 May 1964.** 14. Report of the Meeting on the Classification and Correlation of Soils from Volcanic Ash, Tokyo, Japan, 11-27 June
1964.** 15. Report of the First Session of the Working Party on Soil Classification, Survey and Soil Resources (European
Commission on Agriculture), Florence, Italy, 1-3 October 1964.** 16. Detailed Legend for the Third Draft on the Soil Map of South America, June 1965.** 17. Report of the First Meeting on Soil Correlation for North America, Mexico, 1-8 February 1965.** 18. The Soil Resources of Latin America, October 1965.** 19. Report of the Third Correlation Seminar for Europe: Bulgaria, Greece, Romania, Turkey, Yugoslavia, 29 August-22
September 1965.** 20. Report of the Meeting of Rapporteurs, Soil Map of Europe (Scale 1:1000 000) (Working Party on Soil Classification
and Survey, European Commission on Agriculture), Bonn, Federal Republic of Germany, 29 November-3 December 1965.**
21. Report of the Second Meeting on Soil Survey, Correlation and Interpretation for Latin America, Rio de Janeiro, Brazil, 13-16 July 1965.**
22. Report of the Soil Resources Expedition in Western and Central Brazil, 24 June-9 July 1965.** 23. Bibliography on Soils and Related Sciences for Latin America (1st edition), December 1965.** 24. Report on the Soils of Paraguay (2nd edition), August 1964.** 25. Report of the Soil Correlation Study Tour in Uruguay, Brazil and Argentina, June-August 1964.** 26. Report of the Meeting on Soil Correlation and Soil Resources Appraisal in India, New Delhi, India, 5-15 April
1965.** 27. Report of the Sixth Session of the Working Party on Soil Classification and Survey of the European Commission
on Agriculture, Montpellier, France, 7-11 March 1967.** 28. Report of the Second Meeting on Soil Correlation for North America, Winnipeg-Vancouver, Canada, 25 July-5
August 1966.** 29. Report of the Fifth Meeting of the Advisory Panel on the Soil Map of the World, Moscow, USSR, 20-28 August
1966.** 30. Report of the Meeting of the Soil Correlation Committee for South America, Buenos Aires, Argentina, 12-19
December 1966.** 31. Trace Element Problems in Relation to Soil Units in Europe (Working Party on Soil Classification and Survey of
the European Commission on Agriculture), Rome, 1%7.** 32. Approaches to Soil Classification, 1968.** 33. Definitions of Soil Units for the Soil Map of the World, April 1968.** 34. Soil Map of South America 1:5 000 000, Draft Test, November 1968.** 35. Report of a Soil Correlation Study Tour in Sweden and Poland, 27 September-14 October 1968.** 36. Meeting of Rapporteurs, Soil Map of Europe (Scale 1:1 000 000) (Working Party on Soil Classification and Survey,
European Commission on Agriculture), Poitiers, France 21-23 June 1967.** 37. Supplement to Definition of Soil Units for the Soil Map of the World, July 1%9.** 38. Seventh Session of the Working Party on Soil Classification and Survey, European Commission on Agriculture,
Varna, Bulgaria, 11-13 September 1969.** 39. A Correlation Study of Red and Yellow Soils in Areas with a Mediterranean Climate.**
40. Report of the Regional Seminar of the Evaluation of Soil Resources in West Africa, Kumasi, Ghana, 14-19 December 1970.**
41. Soil Survey and Soil Fertility Research in Asia and the Far East, New Delhi, 15-20 February 1971.** 42. Report of the Eighth Session of the Working Party on Soil Classification and Survey, European Commission on
Agriculture, Helsinki, Finland, 5-7 July 1971.** 43. Report of the Ninth Session of the Working Party on Soil Classification and Survey, European Commission on
Agriculture, Ghent, Belgium 28-31 August 1973.** 44. First Meeting of the West African Sub-Committee on Soil Correlation for Soil Evaluation and Management, Accra,
Ghana, 12-19 June 1972.** 45. Report of the Ad Hoc Expert Consultation on Land Evaluation, Rome, Italy, 6-8 January 1975.** 46. First Meeting of the Eastern African Sub-Committee for Soil Correlation and Land Evaluation, Nairobi, Kenya, 11-
16 March 1974.** 47. Second Meeting of the Eastern African Sub-Committee for Soil Correlation and Land Evaluation, Addis Ababa,
Ethiopia, 25-30 October 1976. 48. Report on the Agro-Ecological Zones Project, Vol. 1 - Methodology and Results for Africa, 1978. Vol. 2 - Results
for Southwest Asia, 1978. Vol. 3 - Methodology and Results for South and Central America, 1981. Vol. 4 - Results for Southeast Asia, 1980.
49. Report of an Expert Consultation on Land Evaluation Standards for Rainfed Agriculture, Rome, Italy, 25-28 October 1977.
50. Report of an Expert Consultation on Land Evaluation Criteria for Irrigation, Rome, Italy, 27 February-2 March 1979.
51. Third Meeting of the Eastern African Sub-Committee for Soil Correlation and Land Evaluation, Lusaka, Zambia, 18-30 April 1978.
52. Land Evaluation Guidelines for Rainfed Agriculture, Report of an Expert Consultation, 12-14 December 1979. 53. Fourth Meeting of the Wesi African Sub-Committee for Soil Correlation and Land Evaluation, Banjul, The Gambia,
20-27 October 1979. 54. Fourth Meeting of the Eastern African Sub-Committee for Soil Correlation and Land Evaluation, Arusha, Tanzania,
27 October-4 November 1980. 55. Cinquième reunion du Sous-Comité Ouest et Centre africain de correlation des sols pour la mise en valeur dcs
terres, Lomé, Togo, 7-12 décembre 1981. 56. Fifth Meeting of the Eastern African Sub-Committee for Soil Correlation and Land Evaluation, Wad Medani, Sudan,
5-10 December 1983. 57. Sixième reunion du Sous-Comité Ouest et Centre Africain de correlation des sols pour la mise en valeur des
terres, Niamey, Niger, 6-12 février 1984. 58. Sixth Meeting of the Eastern African Sub-Committee for Soil Correlation and Land Evaluation, Maseru, Lesotho,
9-18 October 1985. 59. Septième reunion du Sous-Comité Ouest et Centre africain de correlation des sols pour la mise en valeur des
terres, Ouagadougou, Burkina Faso, 10-17 novembre 1985. 60. Revised Legend, Soil Map of the World, FAO/Unesco ISRIC, 1988. 61. Huitième reunion du Sous-Comité Ouest et Centre africain de correlation des sols pour la mise en valeur des
terres, Yaoundé, Cameroun, 19-28 janvier 1987. 62. Seventh Meeting of the East and Southern African Sub-Committee for Soil Correlation and Evaluation, Gaborone,
Botswana, 30 March-8 April 1987. 63. Neuvième reunion du Sous-Comité Ouest et Centre africain de correlation des sols pour la mise en valeur des
terres, Cotonou, Bénin, 14-23 novembre 1988. 64. FAO-ISRIC Soil Database (SDB), 1989. 65. Eighth Meeting of the East and Southern African Sub-Committee for Soil Correlation and Land Evaluation, Harare,
Zimbabwe, 9-13 October 1989.