World Regional Geography March 8, 2010 Reading: Marston Chapter 6 pages 272-283, 286-300 306-319...
17
World Regional Geography World Regional Geography March 8, 2010 March 8, 2010 Reading : Marston Chapter 6 pages 272-283, 286-300 306-319 (beginning with Rural Poverty) Goode’s World Atlas pages 67-69, 88-89 Next Week: Map Quiz #3 North America Alert, Nunavut – The World’s Northernmost inhabited place.
-
date post
21-Dec-2015 -
Category
Documents
-
view
216 -
download
2
Transcript of World Regional Geography March 8, 2010 Reading: Marston Chapter 6 pages 272-283, 286-300 306-319...
World Regional GeographyWorld Regional Geography
March 8, 2010March 8, 2010
Reading: Marston Chapter 6 pages
272-283, 286-300306-319 (beginning with
Rural Poverty)
Goode’s World Atlaspages 67-69, 88-89
Next Week: Map Quiz #3
North AmericaAlert, Nunavut – The World’sNorthernmost inhabited place.
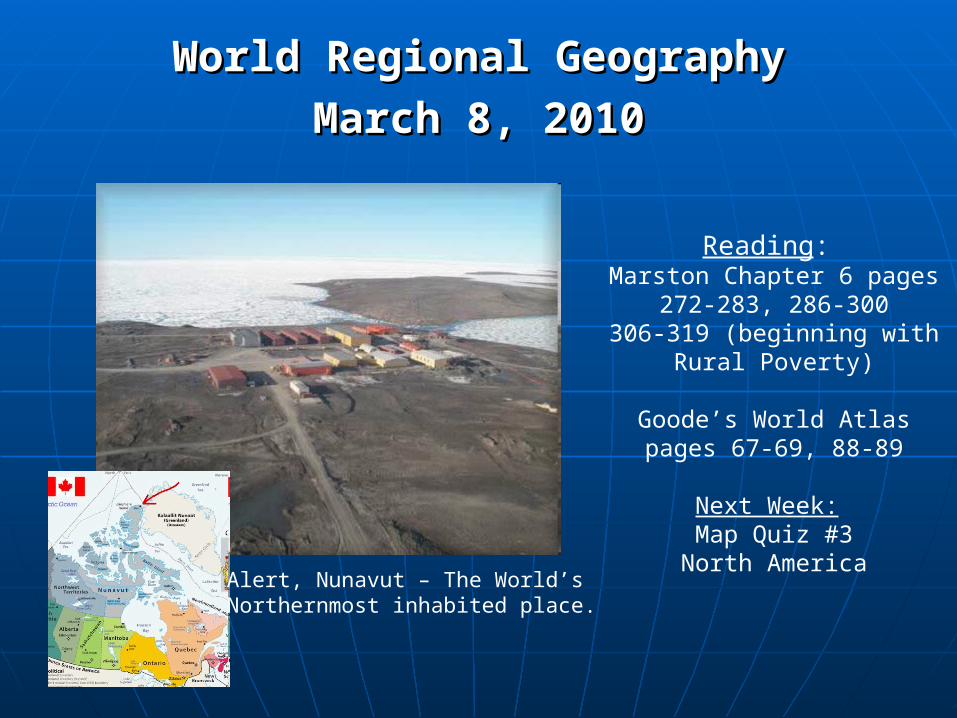
Midterm Exam Grades
0
10
20
30
40
50
60
70
80
95-100
90-94
85-89
80-84
75-79
70-74
65-69
60-64
55-59
50-54
45-49
40-45
Score
Mean: 76%Median: 77.5%Mode: 85%
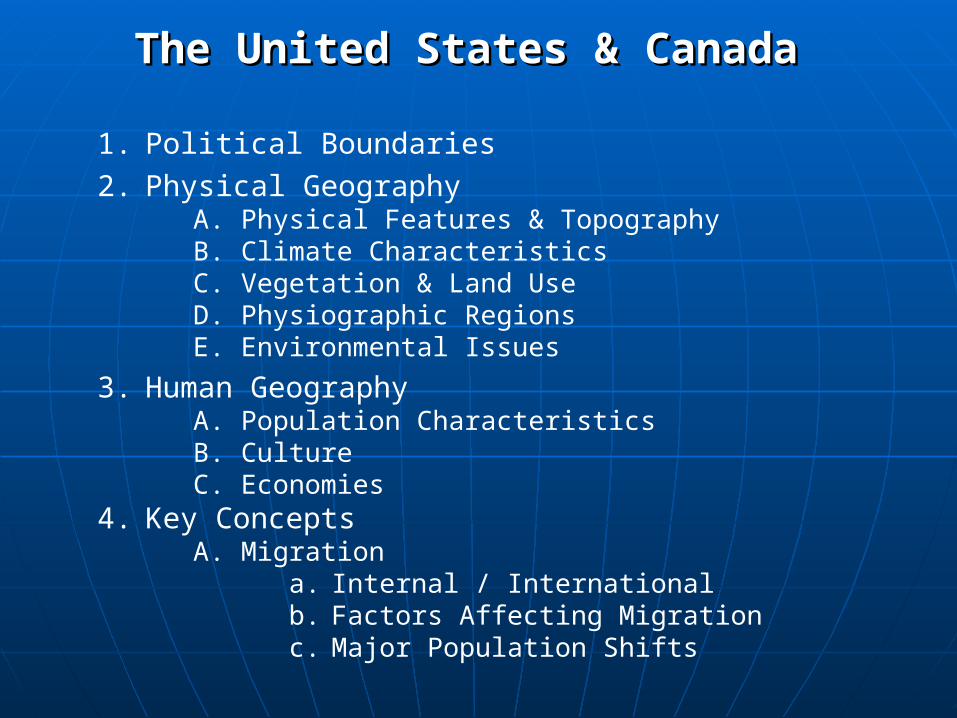
The United States & CanadaThe United States & Canada
1. Political Boundaries2. Physical Geography
A. Physical Features & Topography B. Climate CharacteristicsC. Vegetation & Land UseD. Physiographic RegionsE. Environmental Issues
3. Human GeographyA. Population CharacteristicsB. CultureC. Economies
4. Key ConceptsA. Migration
a. Internal / Internationalb. Factors Affecting Migrationc. Major Population Shifts
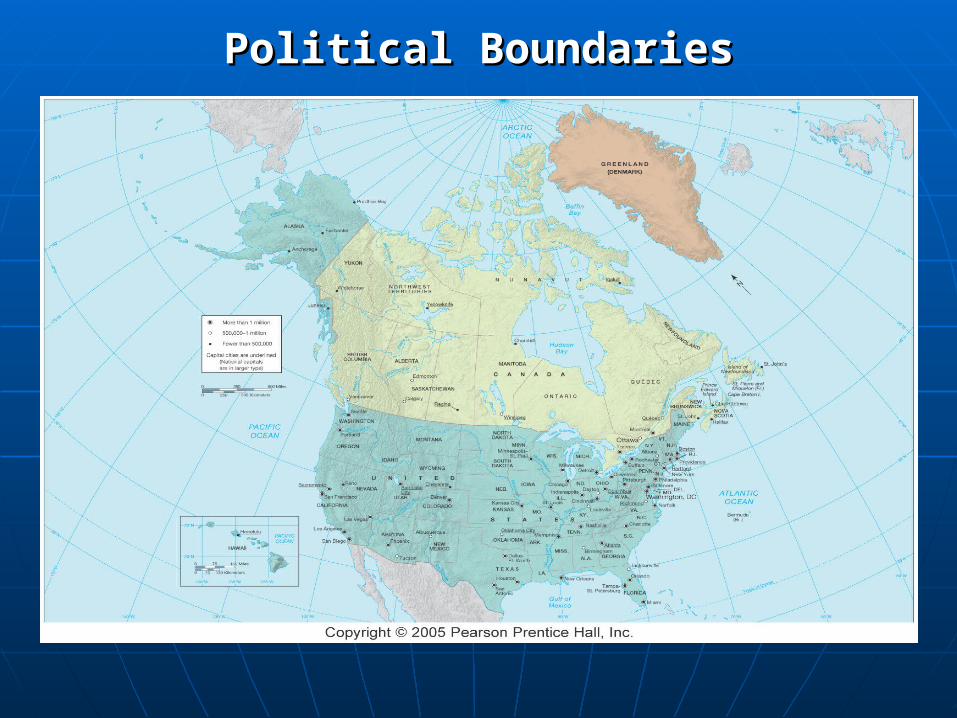
Political BoundariesPolitical Boundaries
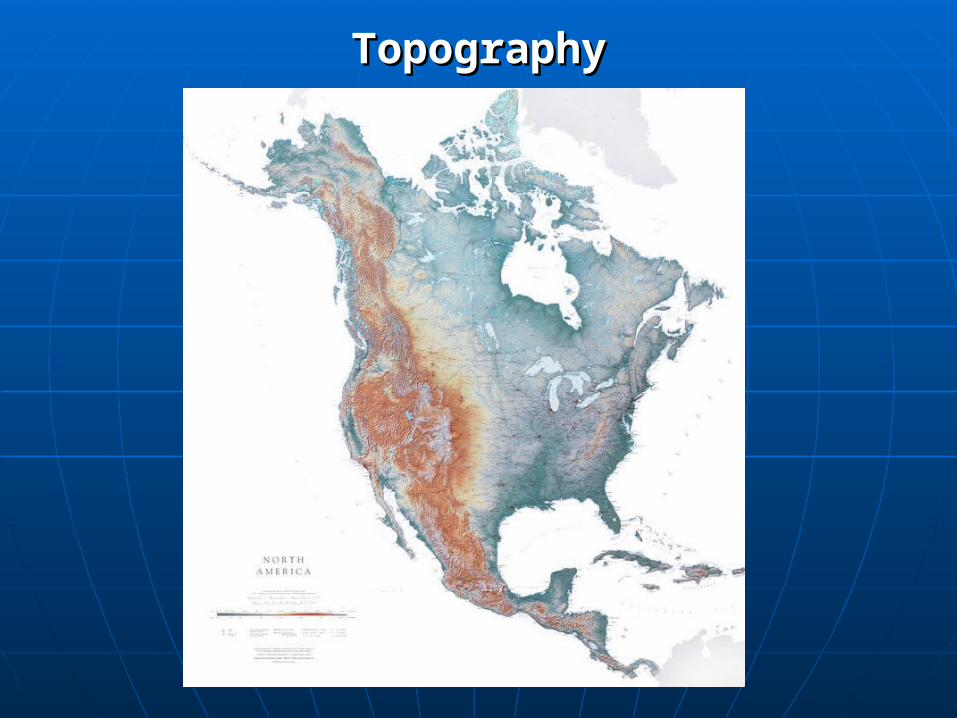
TopographyTopography
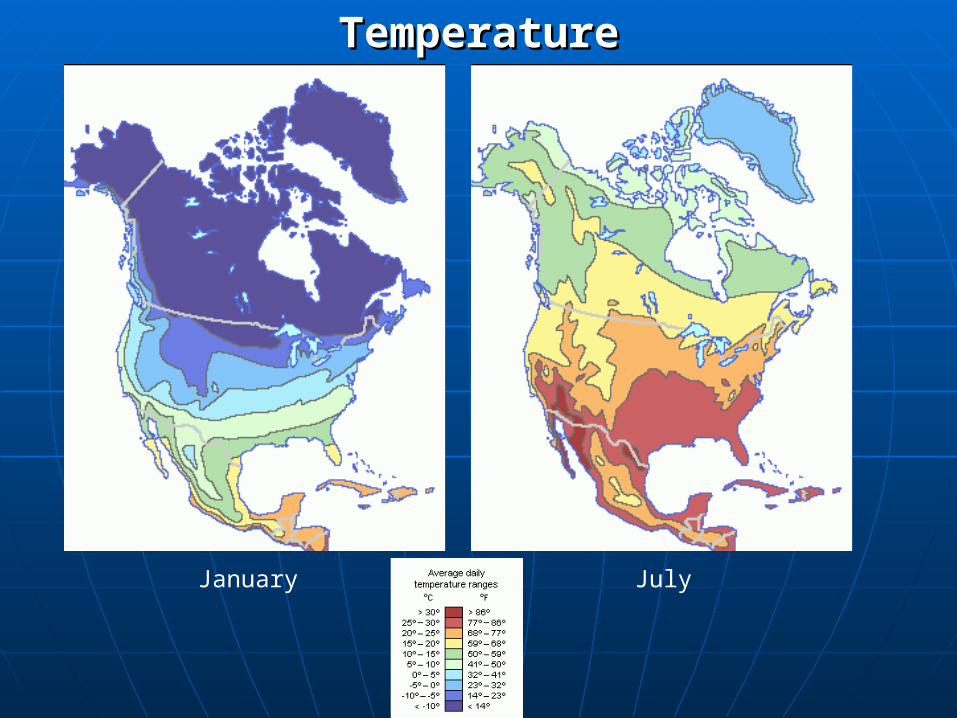
TemperatureTemperature
January July
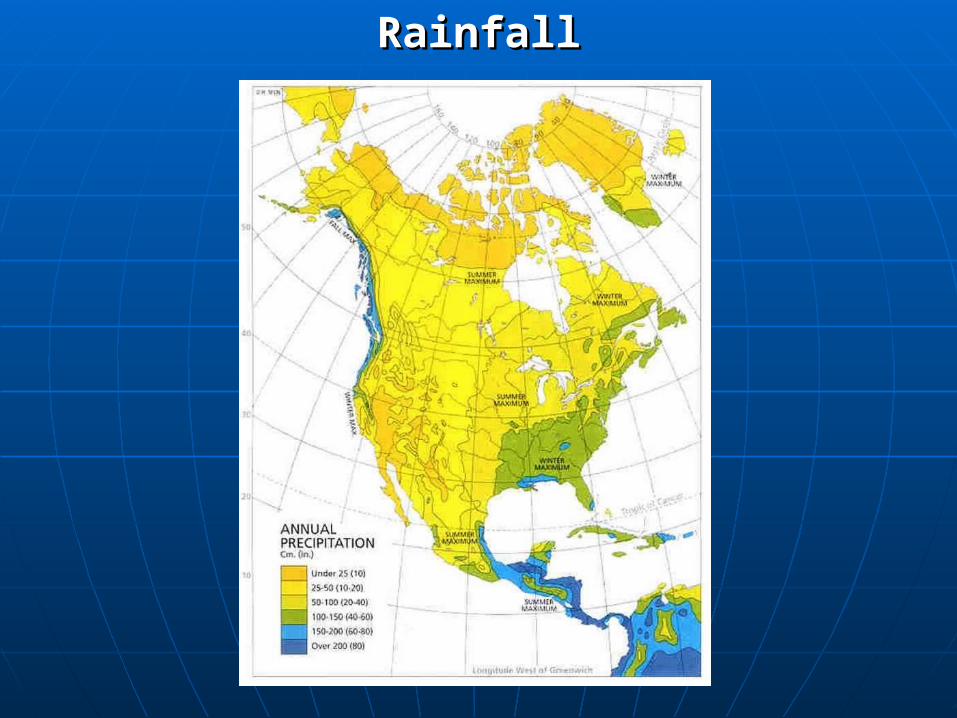
RainfallRainfall
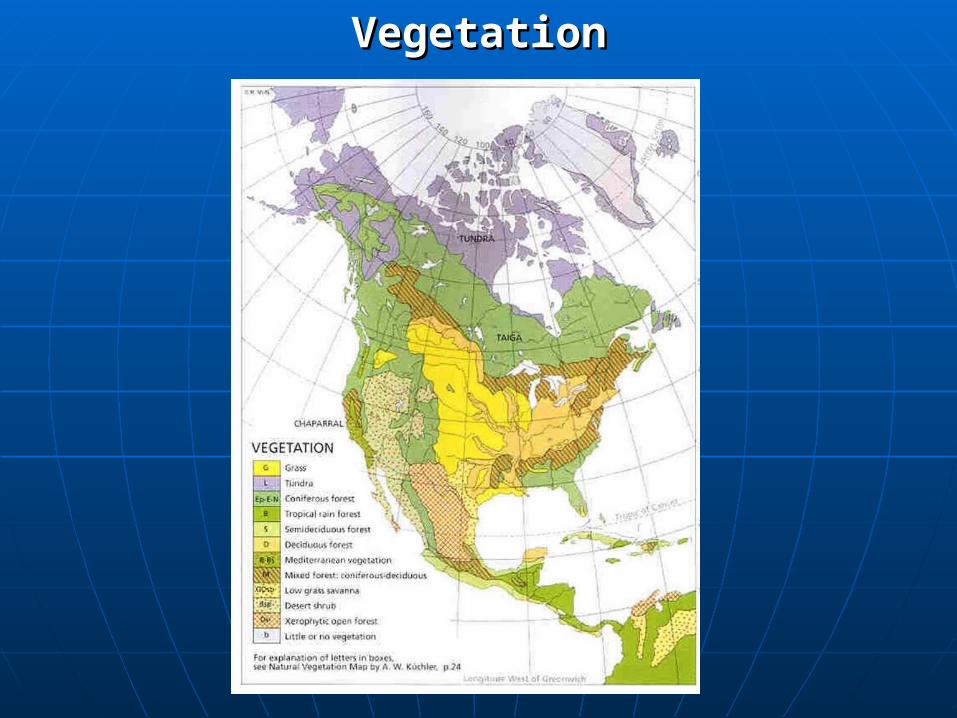
VegetationVegetation
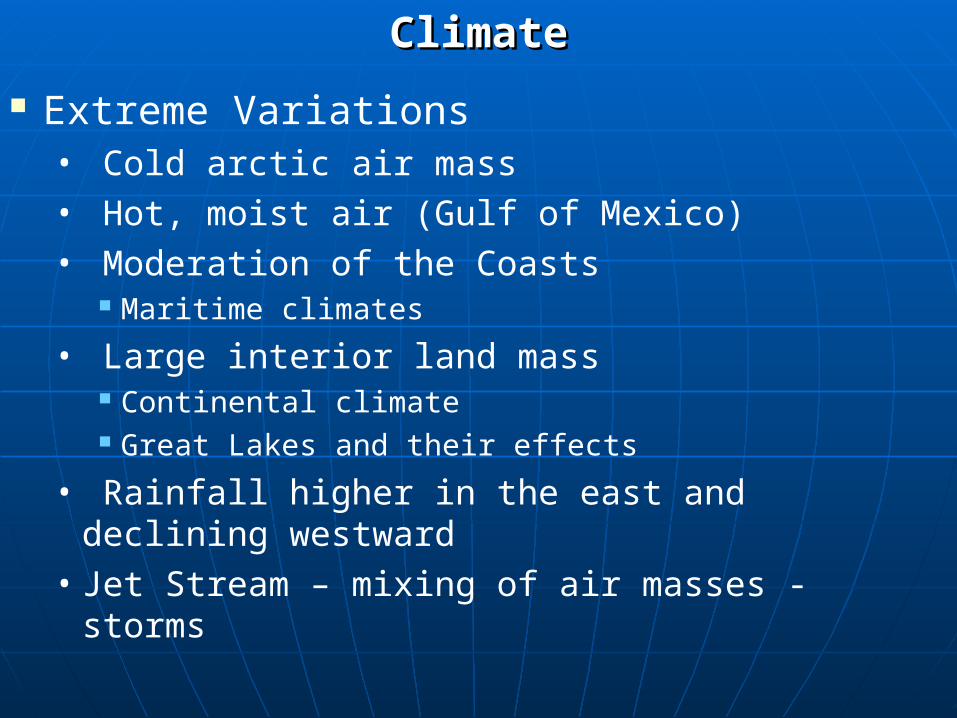
Extreme Variations• Cold arctic air mass• Hot, moist air (Gulf of Mexico)• Moderation of the Coasts
Maritime climates
• Large interior land mass Continental climate Great Lakes and their effects
• Rainfall higher in the east and declining westward
• Jet Stream – mixing of air masses - storms
ClimateClimate
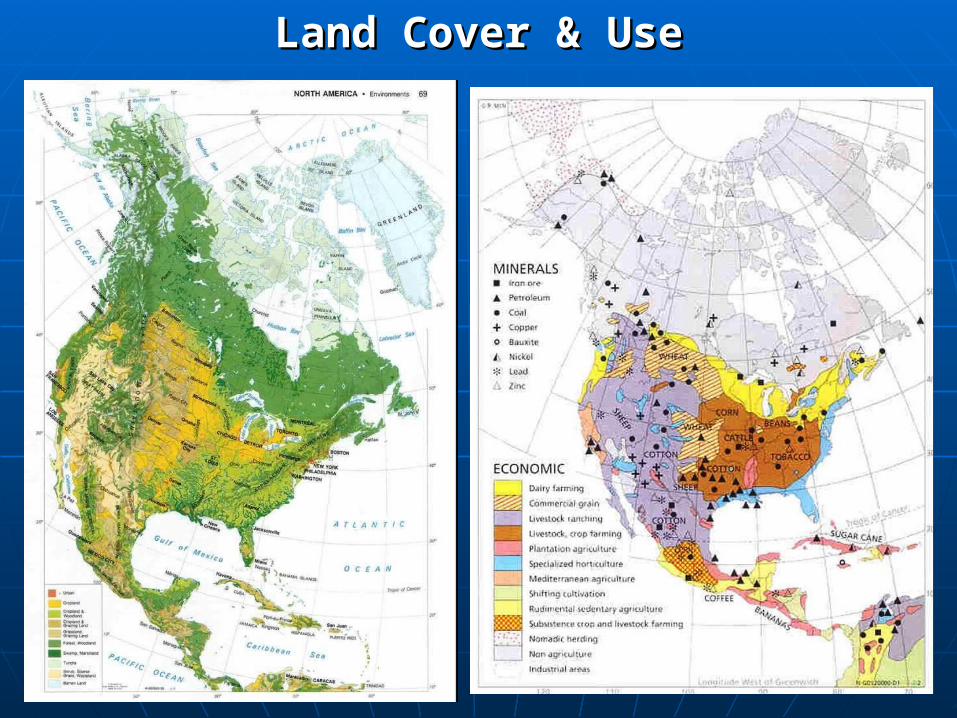
Land Cover & UseLand Cover & Use
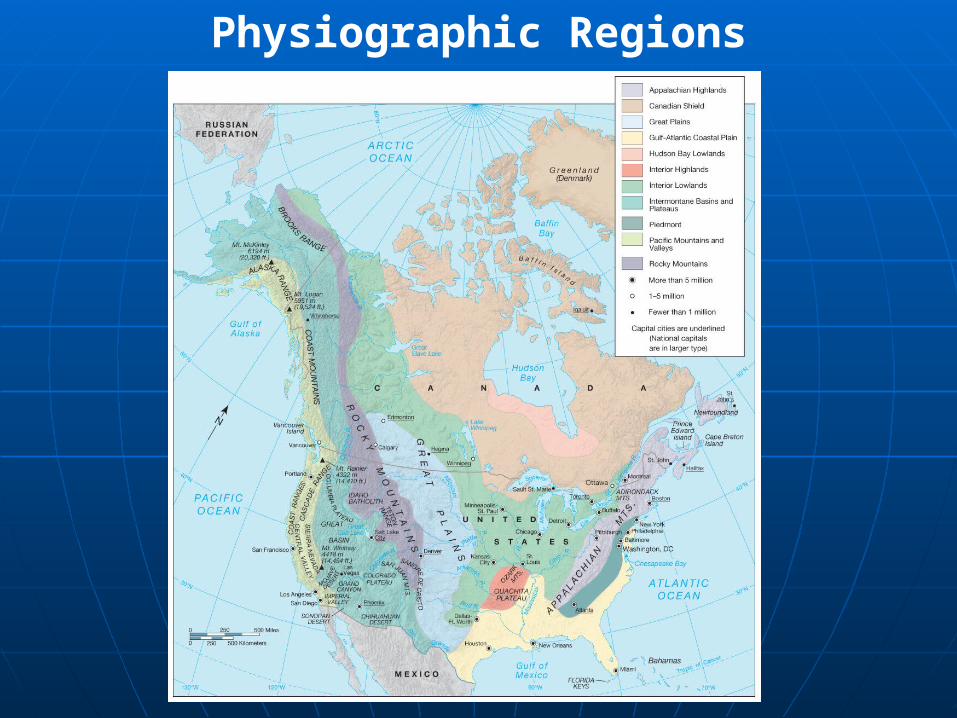
Physiographic Regions
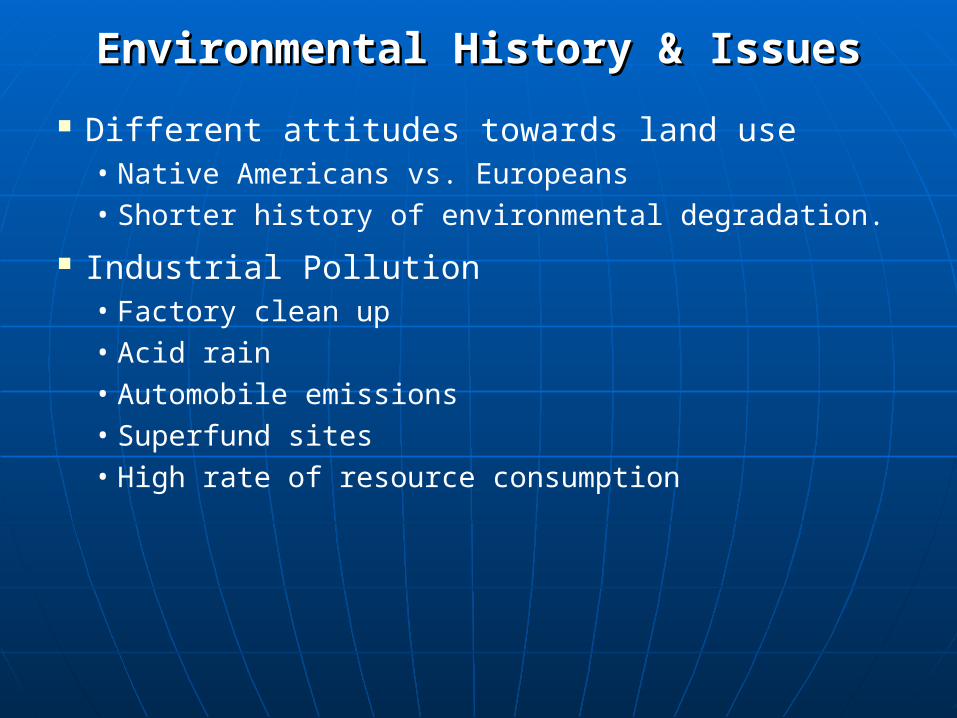
Environmental History & IssuesEnvironmental History & Issues
Different attitudes towards land use• Native Americans vs. Europeans• Shorter history of environmental degradation.
Industrial Pollution• Factory clean up• Acid rain• Automobile emissions• Superfund sites• High rate of resource consumption

Population DensityPopulation Density

Population DensityPopulation Density
U.S. – 306.8 million• Northeast – Megalopolis• Rust-belt• Sun-belt• West Coast
Canada – 33.7 million• 90% within 100 miles of US
border• U.S. Canadian Core• Pacific Coast - Vancouver
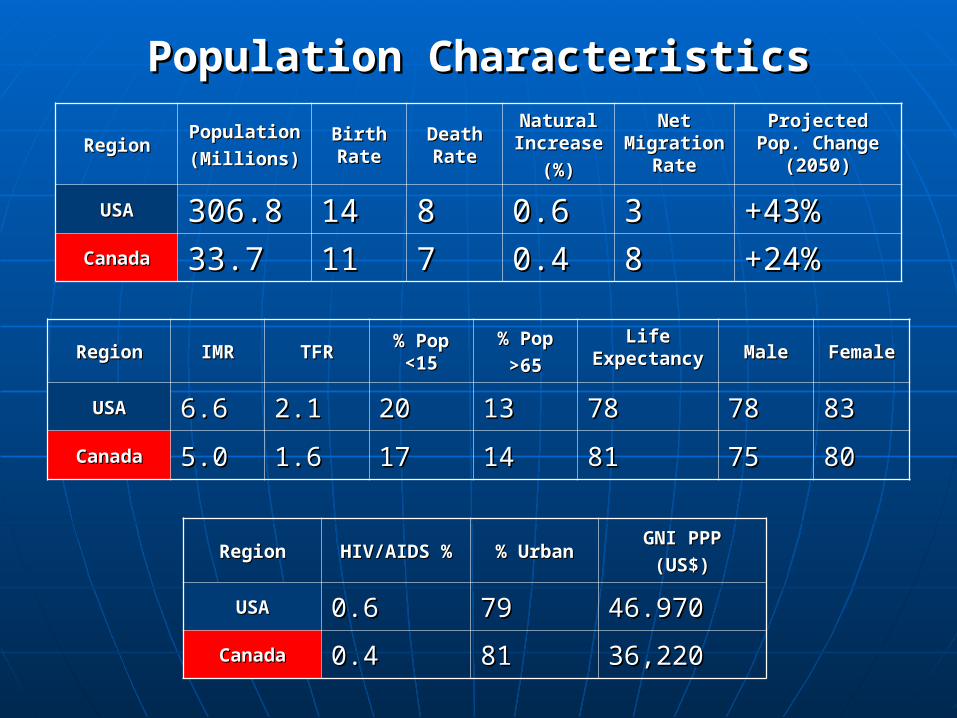
Population CharacteristicsPopulation Characteristics
RegionRegionPopulationPopulation
(Millions)(Millions)Birth Birth RateRate
Death Death RateRate
Natural Natural IncreaseIncrease
(%)(%)
Net Net MigratioMigration Raten Rate
Projected Projected Pop. Change Pop. Change
(2050)(2050)
USAUSA 306.8306.8 1414 88 0.60.6 33 +43%+43%CanadaCanada 33.733.7 1111 77 0.40.4 88 +24%+24%
RegionRegion IMRIMR TFRTFR % Pop % Pop <15<15
% Pop% Pop
>65>65
Life Life ExpectancyExpectancy MaleMale FemaleFemale
USAUSA 6.66.6 2.12.1 2020 1313 7878 7878 8383
CanadaCanada 5.05.0 1.61.6 1717 1414 8181 7575 8080
RegionRegion HIV/AIDS %HIV/AIDS % % Urban% UrbanGNI PPPGNI PPP
(US$)(US$)
USAUSA 0.60.6 7979 46.97046.970
CanadaCanada 0.40.4 8181 36,22036,220

Wednesday
• Culture & Ethnicity• Economics• Migration