
World Oil Outlook - IEF › _resources › files › events › ... · World oil supply long-term...
26
Organization of the Petroleum Exporting Countries The Organization of Petroleum Exporting Countries World Oil Outlook 8 th November, 2009 The International Energy Forum Riyadh, Saudi Arabia Hasan M Qabazard Director, Research Division OPEC Secretariat
Transcript of World Oil Outlook - IEF › _resources › files › events › ... · World oil supply long-term...
Organization of the Petroleum Exporting Countries
The Organization of Petroleum Exporting Countries
World Oil Outlook
8th November, 2009
The International Energy Forum
Riyadh, Saudi Arabia
Hasan M Qabazard
Director, Research Division
OPEC Secretariat
Organization of the Petroleum Exporting Countries
2.7
-1.2
2.9
0.6
-3.6
1.0
5.1
1.2
3.8
-6
-4
-2
0
2
4
6
8
05 06 07 08 09 10
World OECD DCs
2
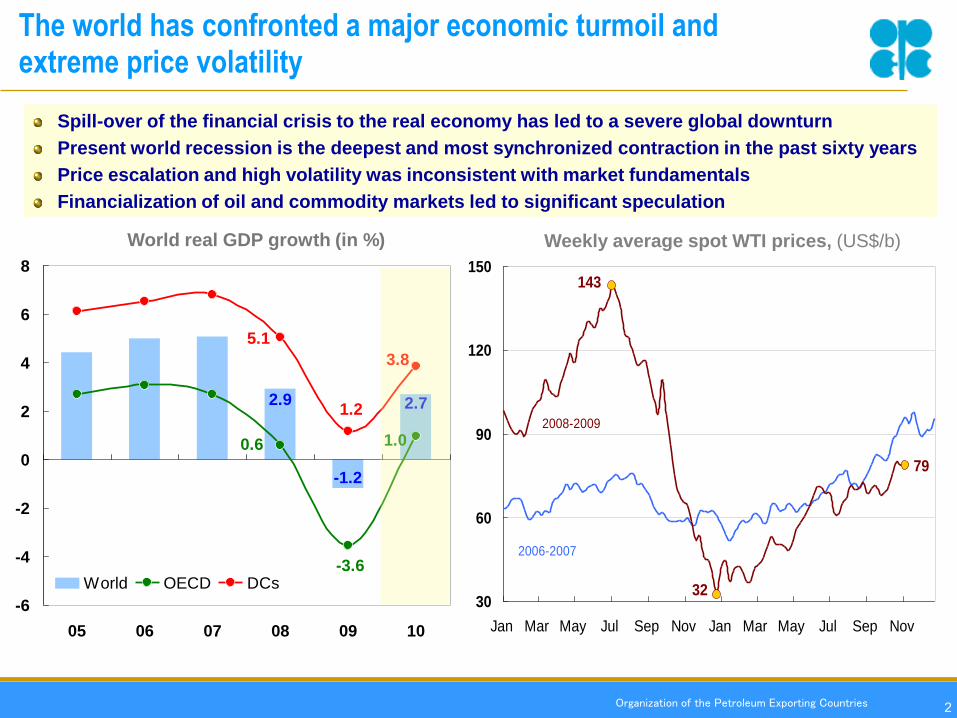
The world has confronted a major economic turmoil andextreme price volatility
World real GDP growth (in %) Weekly average spot WTI prices, (US$/b)
Spill-over of the financial crisis to the real economy has led to a severe global downturn
Present world recession is the deepest and most synchronized contraction in the past sixty years
Price escalation and high volatility was inconsistent with market fundamentals
Financialization of oil and commodity markets led to significant speculation
79
143
3230
60
90
120
150
Jan Mar May Jul Sep Nov Jan Mar May Jul Sep Nov
2006-2007
2008-2009
Organization of the Petroleum Exporting Countries
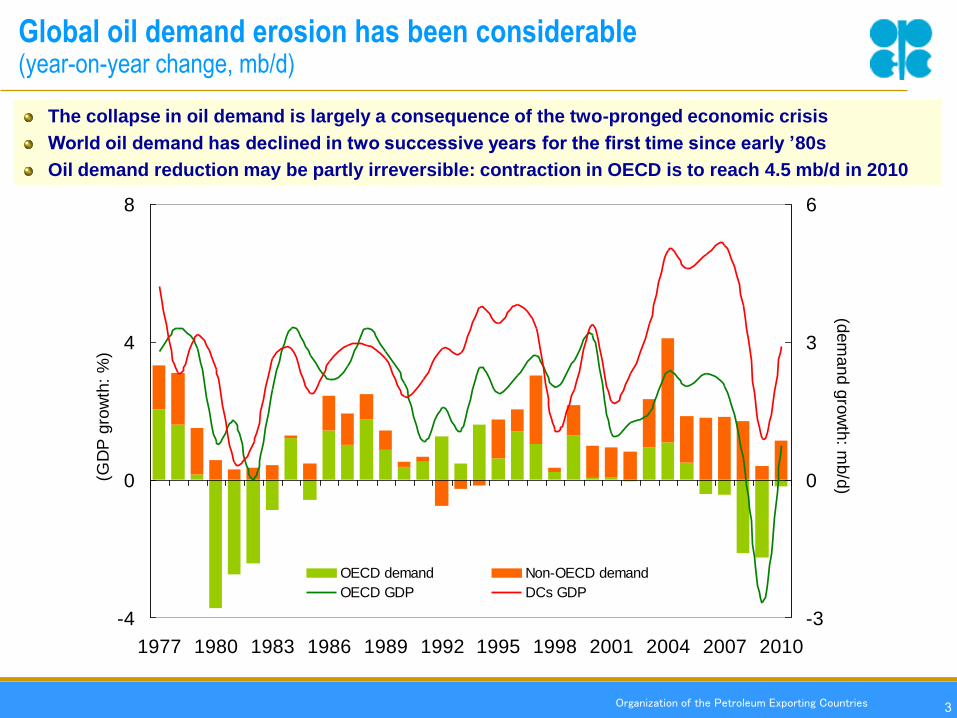
Global oil demand erosion has been considerable(year-on-year change, mb/d)
3
-4
0
4
8
1977 1980 1983 1986 1989 1992 1995 1998 2001 2004 2007 2010
-3
0
3
6
OECD demand Non-OECD demand
OECD GDP DCs GDP
(dem
and g
row
th: m
b/d
)(GD
P g
row
th:
%)
The collapse in oil demand is largely a consequence of the two-pronged economic crisis
World oil demand has declined in two successive years for the first time since early ’80s
Oil demand reduction may be partly irreversible: contraction in OECD is to reach 4.5 mb/d in 2010
Organization of the Petroleum Exporting Countries
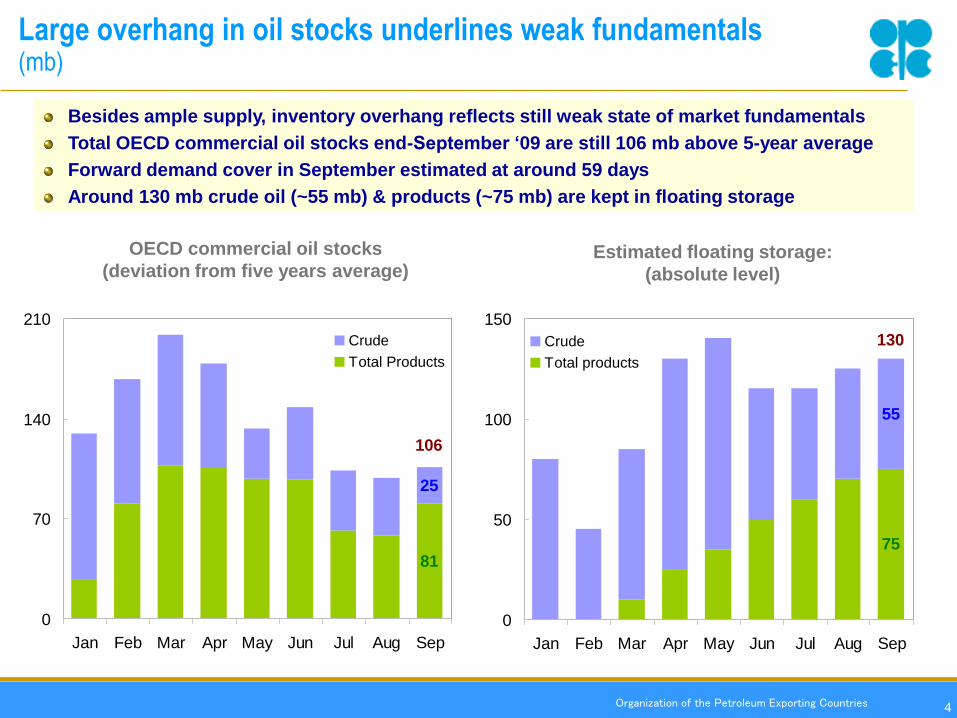
Large overhang in oil stocks underlines weak fundamentals(mb)
4
81
25
106
0
70
140
210
Jan Feb Mar Apr May Jun Jul Aug Sep
Crude
Total Products
75
55
130
0
50
100
150
Jan Feb Mar Apr May Jun Jul Aug Sep
Crude
Total products
OECD commercial oil stocks
(deviation from five years average)Estimated floating storage:
(absolute level)
Besides ample supply, inventory overhang reflects still weak state of market fundamentals
Total OECD commercial oil stocks end-September ‘09 are still 106 mb above 5-year average
Forward demand cover in September estimated at around 59 days
Around 130 mb crude oil (~55 mb) & products (~75 mb) are kept in floating storage
Organization of the Petroleum Exporting Countries
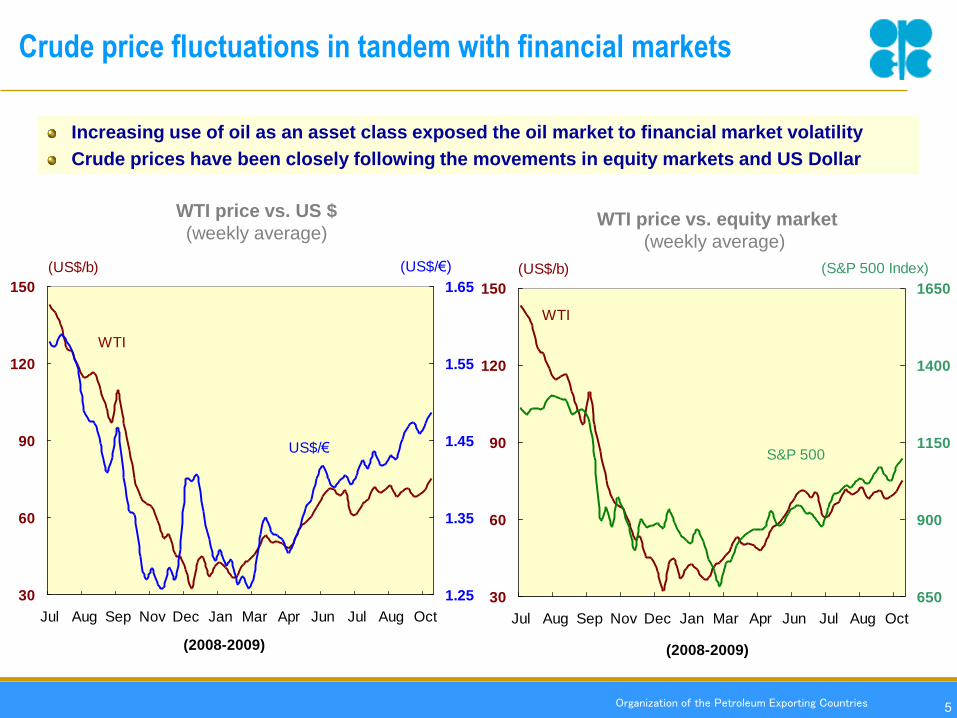
Crude price fluctuations in tandem with financial markets
Increasing use of oil as an asset class exposed the oil market to financial market volatility
Crude prices have been closely following the movements in equity markets and US Dollar
WTI price vs. US $
(weekly average)WTI price vs. equity market
(weekly average)
30
60
90
120
150
Jul Aug Sep Nov Dec Jan Mar Apr Jun Jul Aug Oct
1.25
1.35
1.45
1.55
1.65
(2008-2009)
(US$/€)(US$/b)
US$/€
WTI
30
60
90
120
150
Jul Aug Sep Nov Dec Jan Mar Apr Jun Jul Aug Oct
650
900
1150
1400
1650
(2008-2009)
(S&P 500 Index)(US$/b)
S&P 500
WTI
5
Organization of the Petroleum Exporting Countries
0
10
20
30
40
50
60
Sep-
07
Dec-
07
Mar-
08
Jun-
08
Sep-
08
Dec-
08
Mar-
09
Jun-
09
Sep-
09
Euro zone Japan USA
6
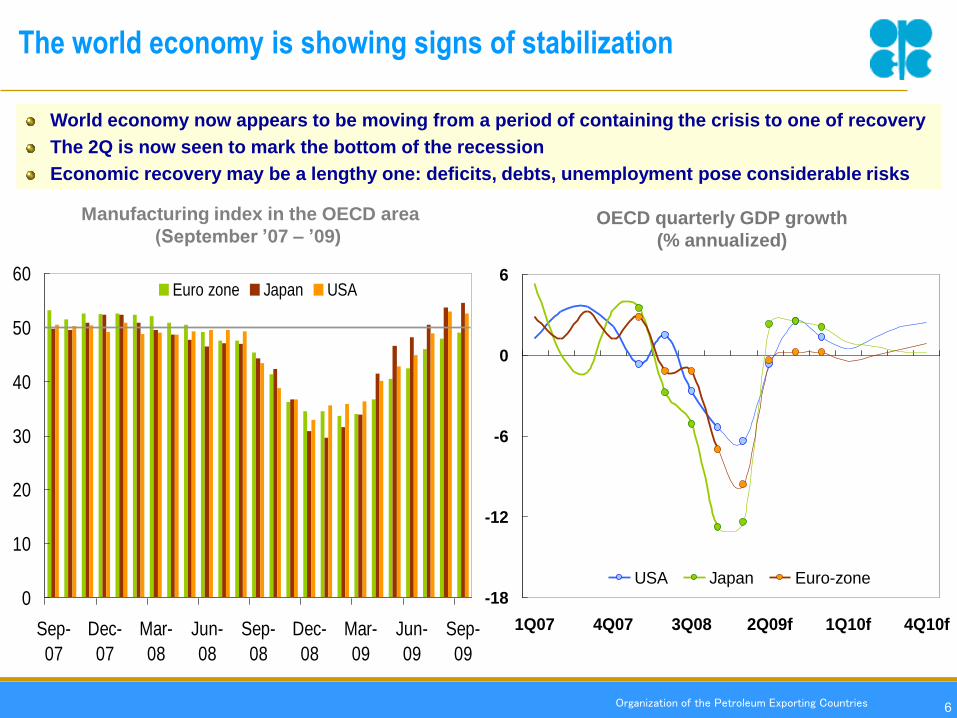
OECD quarterly GDP growth
(% annualized)
Manufacturing index in the OECD area
(September ’07 – ’09)
-18
-12
-6
0
6
1Q07 4Q07 3Q08 2Q09f 1Q10f 4Q10f
USA Japan Euro-zone
The world economy is showing signs of stabilization
World economy now appears to be moving from a period of containing the crisis to one of recovery
The 2Q is now seen to mark the bottom of the recession
Economic recovery may be a lengthy one: deficits, debts, unemployment pose considerable risks
Organization of the Petroleum Exporting Countries 7
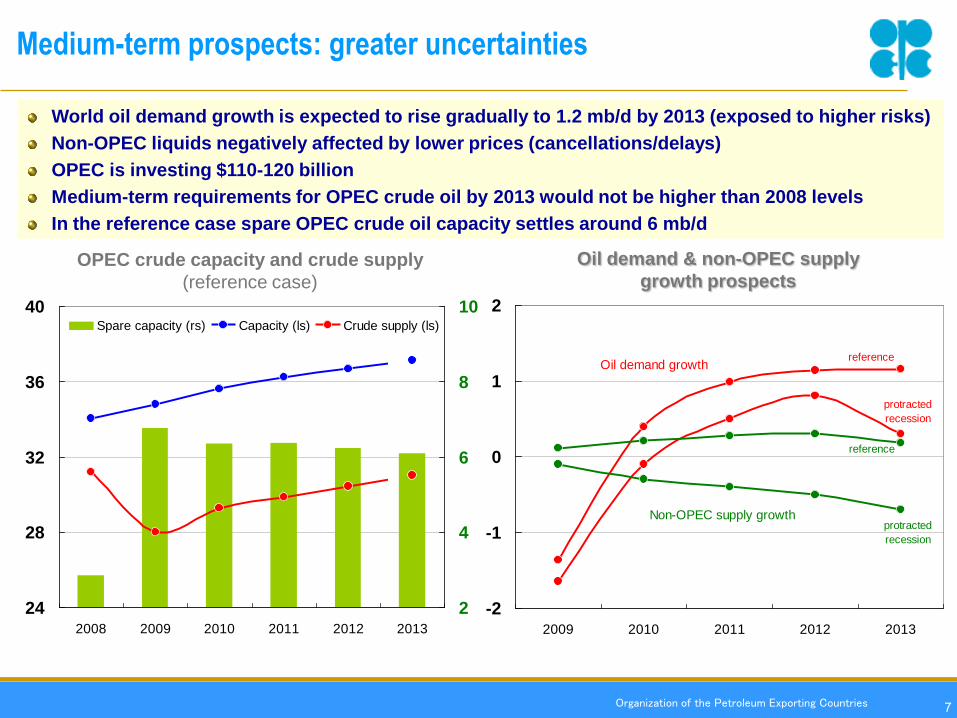
Medium-term prospects: greater uncertainties
24
28
32
36
40
2008 2009 2010 2011 2012 2013
2
4
6
8
10Spare capacity (rs) Capacity (ls) Crude supply (ls)
OPEC crude capacity and crude supply
(reference case)
Oil demand & non-OPEC supply
growth prospects
-2
-1
0
1
2
2009 2010 2011 2012 2013
Oil demand growth
Non-OPEC supply growth
reference
protracted
recession
reference
protracted
recession
World oil demand growth is expected to rise gradually to 1.2 mb/d by 2013 (exposed to higher risks)
Non-OPEC liquids negatively affected by lower prices (cancellations/delays)
OPEC is investing $110-120 billion
Medium-term requirements for OPEC crude oil by 2013 would not be higher than 2008 levels
In the reference case spare OPEC crude oil capacity settles around 6 mb/d
Organization of the Petroleum Exporting Countries
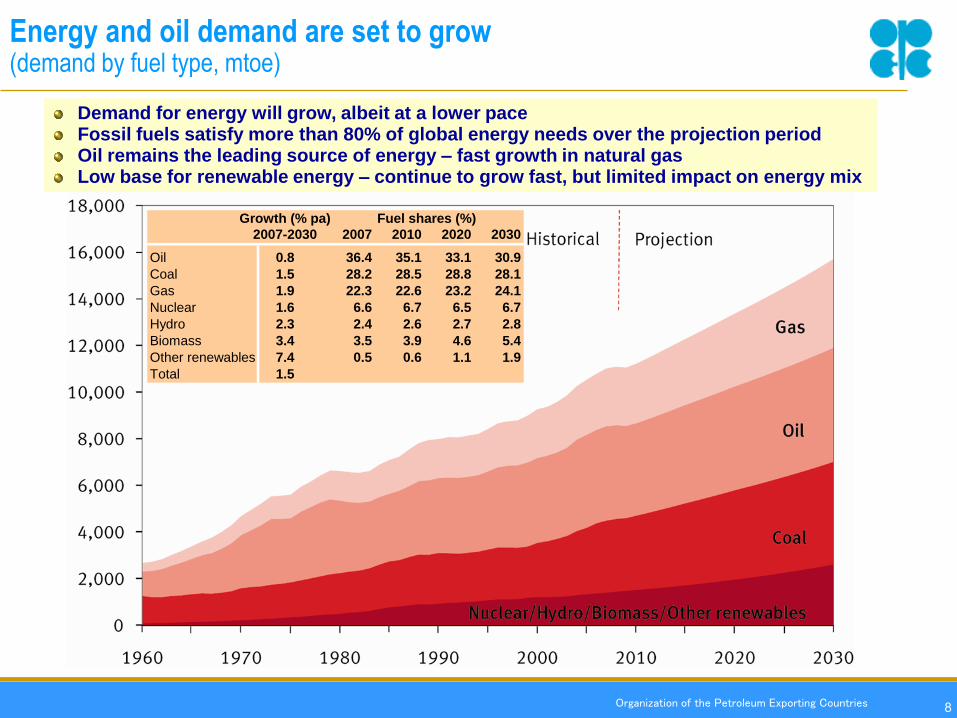
Energy and oil demand are set to grow(demand by fuel type, mtoe)
Demand for energy will grow, albeit at a lower paceFossil fuels satisfy more than 80% of global energy needs over the projection period Oil remains the leading source of energy – fast growth in natural gasLow base for renewable energy – continue to grow fast, but limited impact on energy mix
Growth (% pa) Fuel shares (%)
2007-2030 2007 2010 2020 2030
Oil 0.8 36.4 35.1 33.1 30.9
Coal 1.5 28.2 28.5 28.8 28.1
Gas 1.9 22.3 22.6 23.2 24.1
Nuclear 1.6 6.6 6.7 6.5 6.7
Hydro 2.3 2.4 2.6 2.7 2.8
Biomass 3.4 3.5 3.9 4.6 5.4
Other renewables 7.4 0.5 0.6 1.1 1.9
Total 1.5
8
Organization of the Petroleum Exporting Countries 9
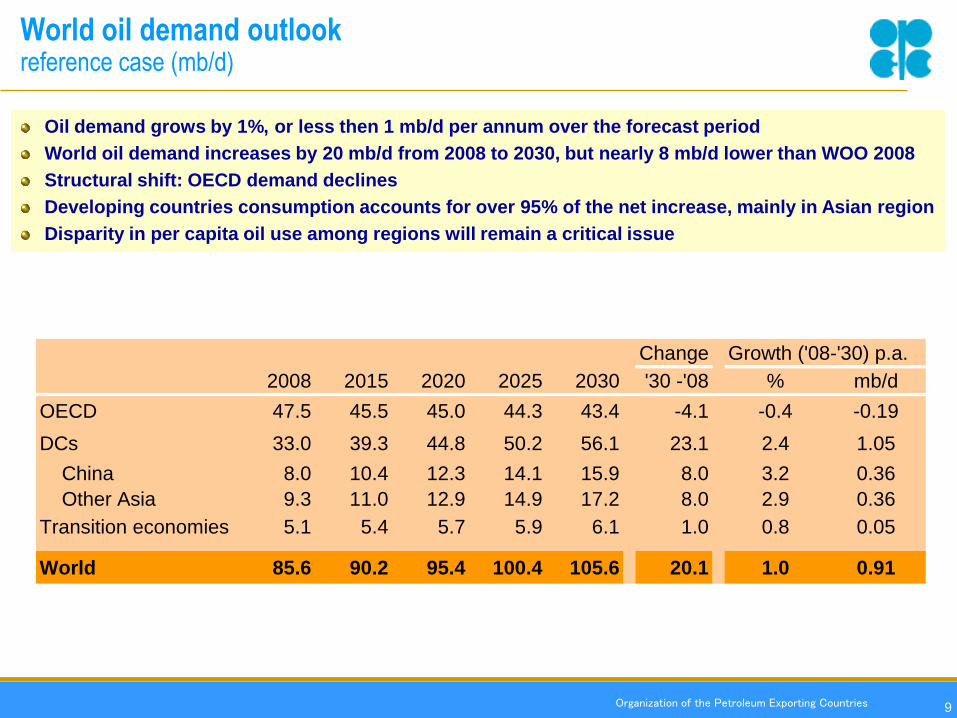
World oil demand outlookreference case (mb/d)
Oil demand grows by 1%, or less then 1 mb/d per annum over the forecast period
World oil demand increases by 20 mb/d from 2008 to 2030, but nearly 8 mb/d lower than WOO 2008
Structural shift: OECD demand declines
Developing countries consumption accounts for over 95% of the net increase, mainly in Asian region
Disparity in per capita oil use among regions will remain a critical issue
Change Growth ('08-'30) p.a.
2008 2015 2020 2025 2030 '30 -'08 % mb/d
OECD 47.5 45.5 45.0 44.3 43.4 -4.1 -0.4 -0.19
DCs 33.0 39.3 44.8 50.2 56.1 23.1 2.4 1.05
China 8.0 10.4 12.3 14.1 15.9 8.0 3.2 0.36
Other Asia 9.3 11.0 12.9 14.9 17.2 8.0 2.9 0.36
Transition economies 5.1 5.4 5.7 5.9 6.1 1.0 0.8 0.05
World 85.6 90.2 95.4 100.4 105.6 20.1 1.0 0.91

Organization of the Petroleum Exporting Countries
Transportation sector: main source of oil demand growth
Nearly half of world oil consumption will stem from transportation by 2030
Passenger cars and commercial vehicles: saturation versus economic activity
Greater potential for growth in the stock of vehicles in developing countries
Passenger car ownership
per 1,000 of population, 2006Average annual global growth
in oil demand by sector
10
Organization of the Petroleum Exporting Countries
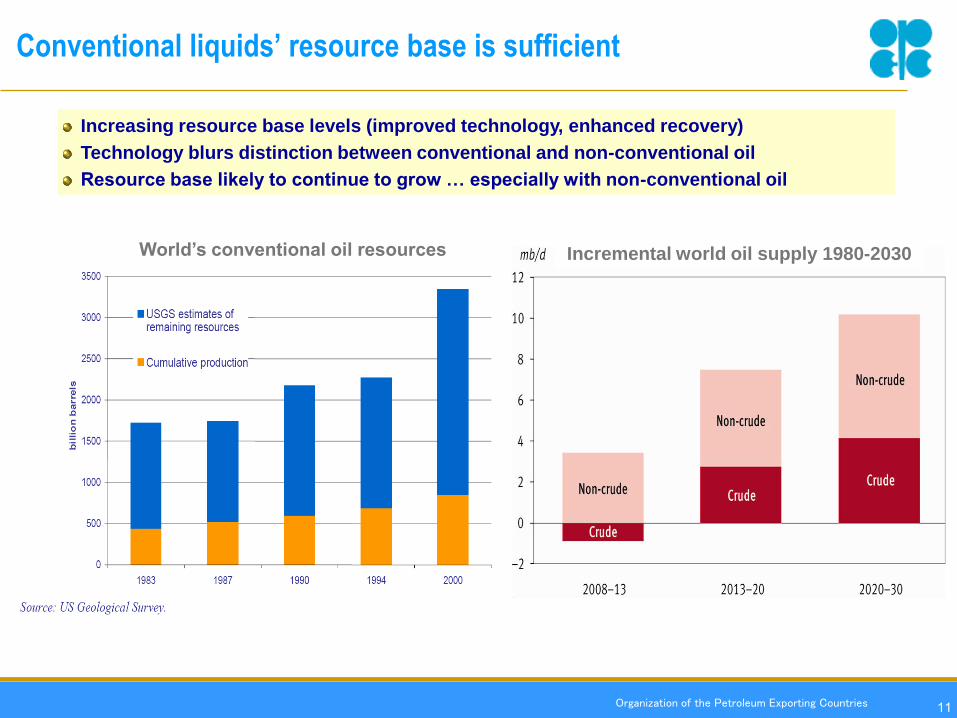
Conventional liquids’ resource base is sufficient
Date of assessment release
Increasing resource base levels (improved technology, enhanced recovery)
Technology blurs distinction between conventional and non-conventional oil
Resource base likely to continue to grow … especially with non-conventional oil
World’s conventional oil resources Incremental world oil supply 1980-2030
11
Organization of the Petroleum Exporting Countries 12
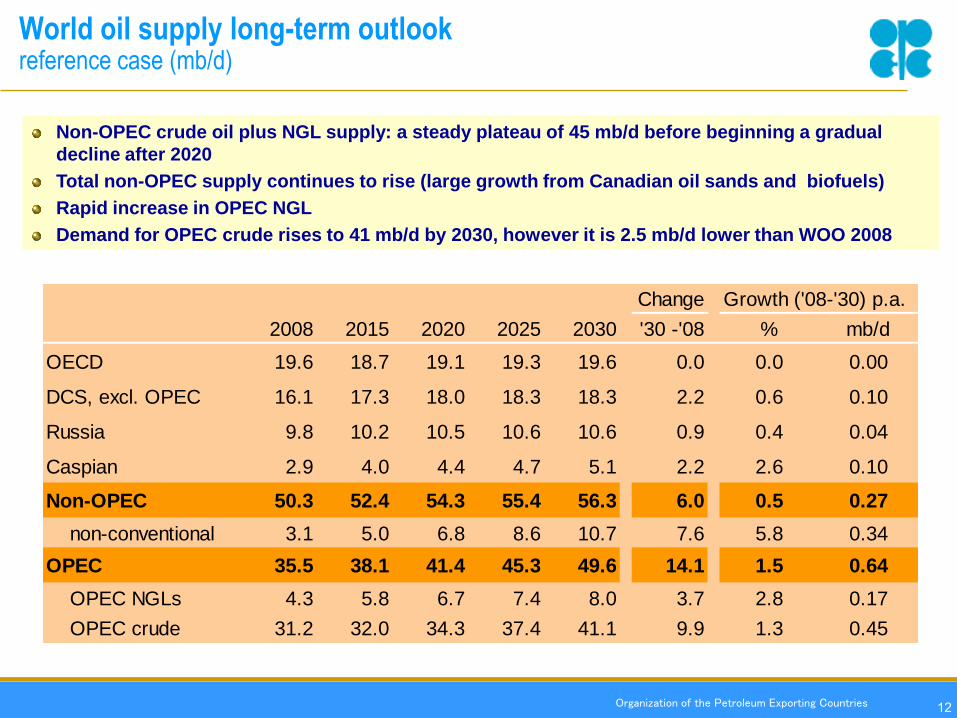
World oil supply long-term outlookreference case (mb/d)
Non-OPEC crude oil plus NGL supply: a steady plateau of 45 mb/d before beginning a gradual
decline after 2020
Total non-OPEC supply continues to rise (large growth from Canadian oil sands and biofuels)
Rapid increase in OPEC NGL
Demand for OPEC crude rises to 41 mb/d by 2030, however it is 2.5 mb/d lower than WOO 2008
Change Growth ('08-'30) p.a.
2008 2015 2020 2025 2030 '30 -'08 % mb/d
OECD 19.6 18.7 19.1 19.3 19.6 0.0 0.0 0.00
DCS, excl. OPEC 16.1 17.3 18.0 18.3 18.3 2.2 0.6 0.10
Russia 9.8 10.2 10.5 10.6 10.6 0.9 0.4 0.04
Caspian 2.9 4.0 4.4 4.7 5.1 2.2 2.6 0.10
Non-OPEC 50.3 52.4 54.3 55.4 56.3 6.0 0.5 0.27
non-conventional 3.1 5.0 6.8 8.6 10.7 7.6 5.8 0.34
OPEC 35.5 38.1 41.4 45.3 49.6 14.1 1.5 0.64
OPEC NGLs 4.3 5.8 6.7 7.4 8.0 3.7 2.8 0.17
OPEC crude 31.2 32.0 34.3 37.4 41.1 9.9 1.3 0.45
Organization of the Petroleum Exporting Countries
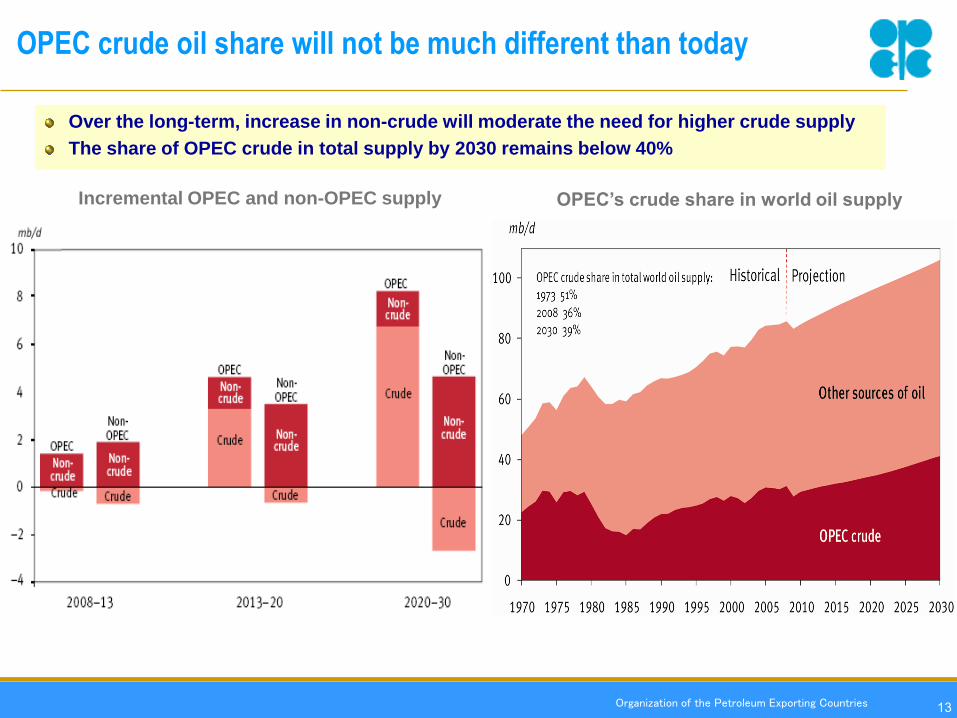
OPEC crude oil share will not be much different than today
Incremental OPEC and non-OPEC supply OPEC’s crude share in world oil supply
13
Over the long-term, increase in non-crude will moderate the need for higher crude supply
The share of OPEC crude in total supply by 2030 remains below 40%
Organization of the Petroleum Exporting Countries
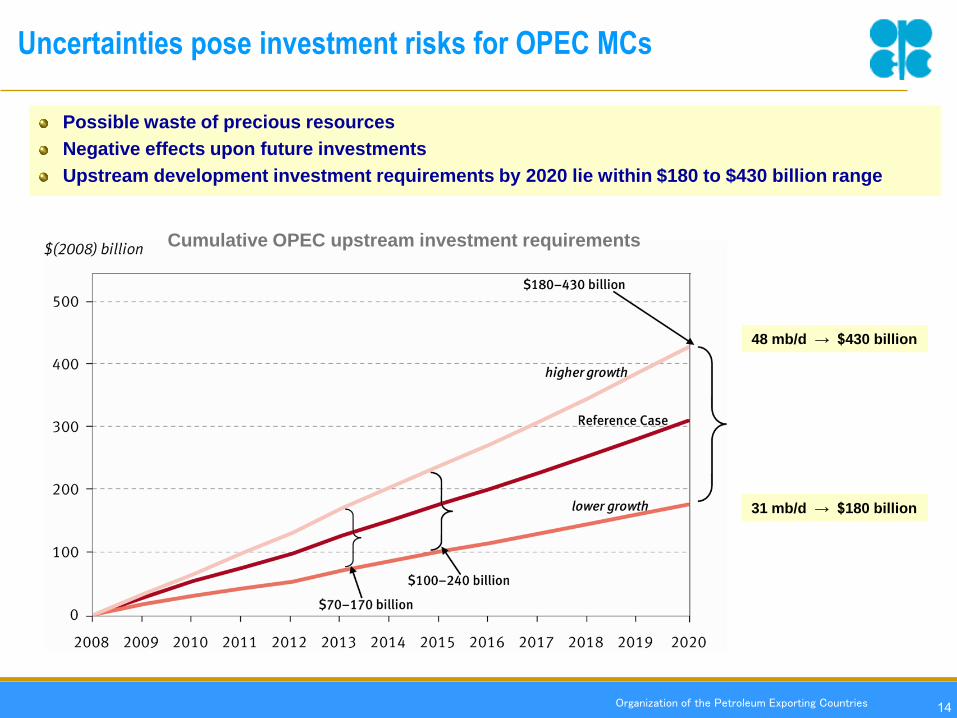
Uncertainties pose investment risks for OPEC MCs
Cumulative OPEC upstream investment requirements
Possible waste of precious resources
Negative effects upon future investments
Upstream development investment requirements by 2020 lie within $180 to $430 billion range
14
31 mb/d → $180 billion
48 mb/d → $430 billion
Organization of the Petroleum Exporting Countries
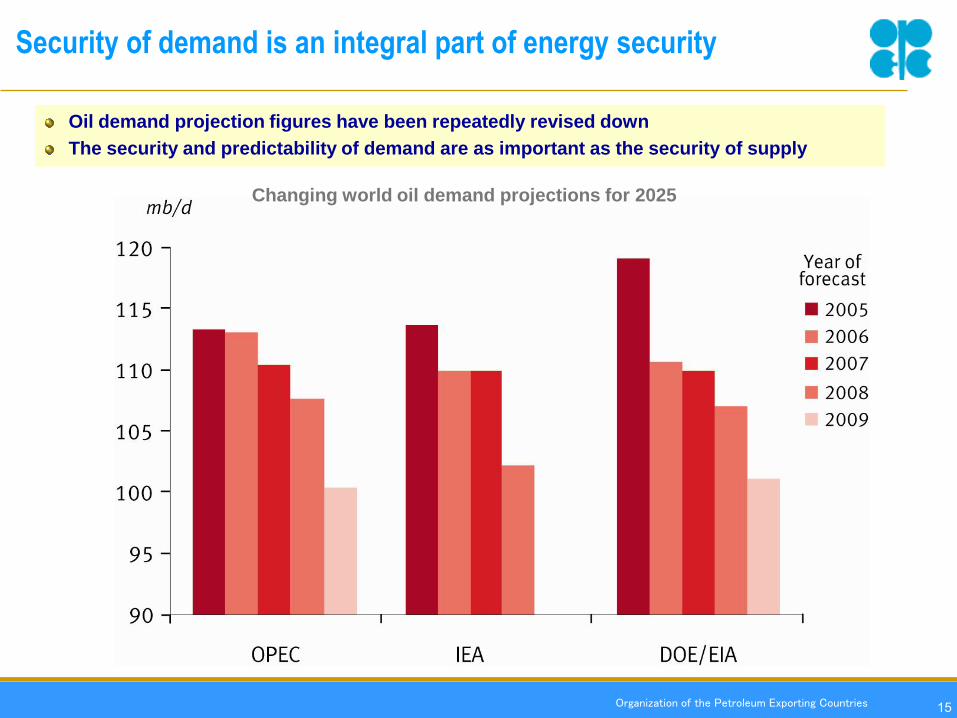
Security of demand is an integral part of energy security
15
Changing world oil demand projections for 2025
Oil demand projection figures have been repeatedly revised down
The security and predictability of demand are as important as the security of supply

Organization of the Petroleum Exporting Countries 16
Policy measures in major consuming countries impact oil demand
US Energy Independence and Security Act
CAFE standards
Renewable fuels standards (EISA targets)
EU Climate and Energy Legislative Package
20-20-20 package
10% renewables target for the transportation sector
Binding targets for CO2 emissions from new cars
Japan’s promotion of measures to cope with global warming
Energy saving measures in all sectors
China’s energy conservation law
Policy measures promoting new transportation technologies
Electric and hydrogen-fuelled cars
Organization of the Petroleum Exporting Countries
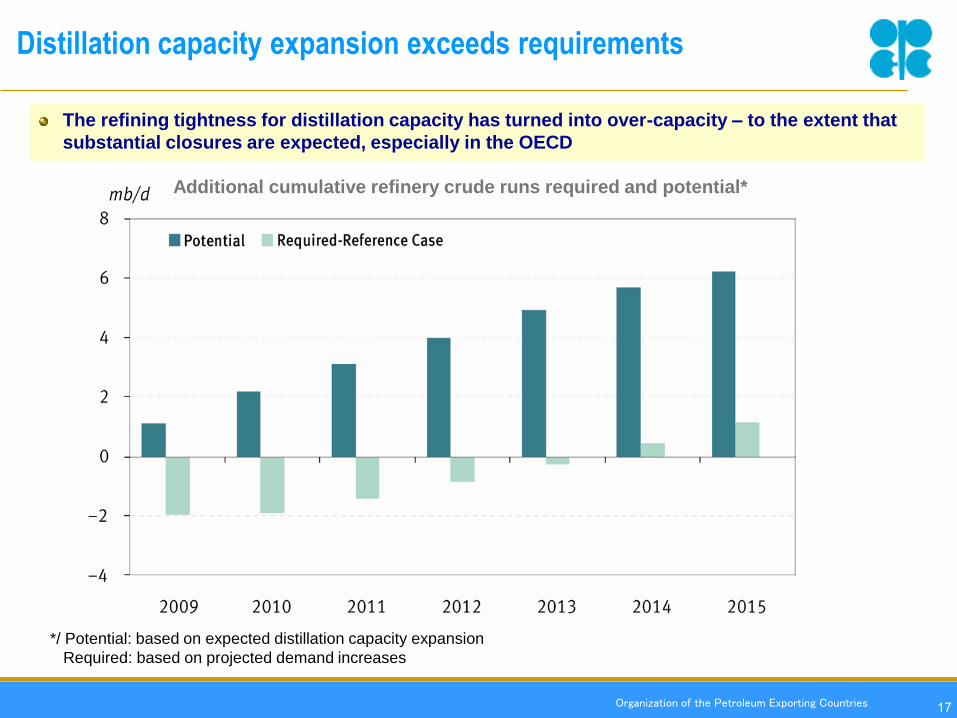
Distillation capacity expansion exceeds requirements
Additional cumulative refinery crude runs required and potential*
*/ Potential: based on expected distillation capacity expansion
Required: based on projected demand increases
The refining tightness for distillation capacity has turned into over-capacity – to the extent that
substantial closures are expected, especially in the OECD
17
Organization of the Petroleum Exporting Countries
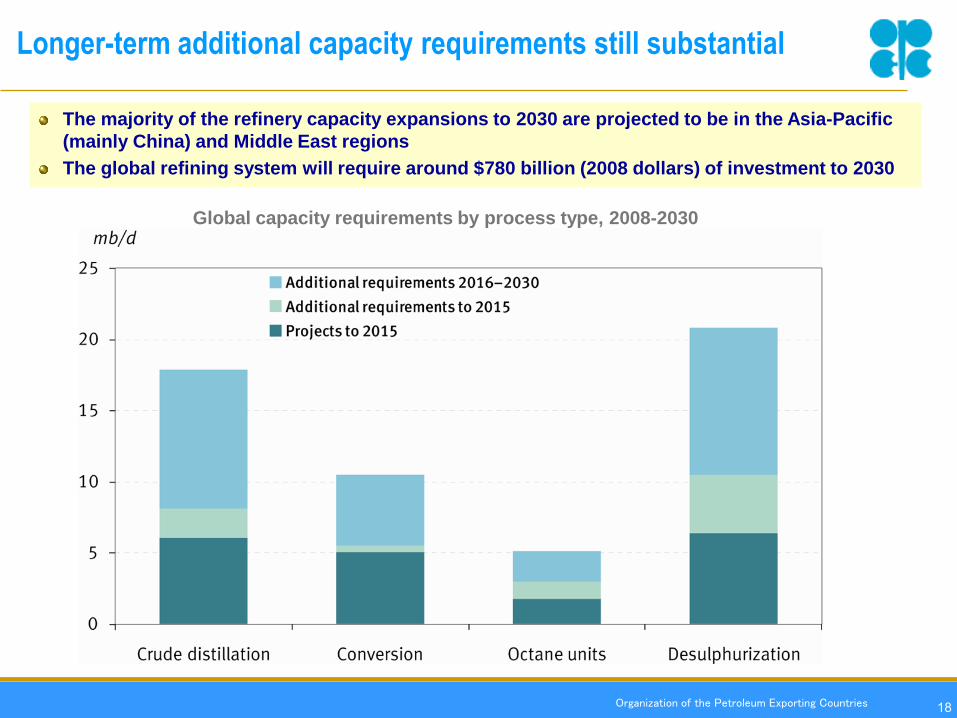
Longer-term additional capacity requirements still substantial
Global capacity requirements by process type, 2008-2030
18
The majority of the refinery capacity expansions to 2030 are projected to be in the Asia-Pacific
(mainly China) and Middle East regions
The global refining system will require around $780 billion (2008 dollars) of investment to 2030
Organization of the Petroleum Exporting Countries
0
10
20
30
40
50
2007 2015 2020 2025 2030
mb/d
Asia - Pacific
Middle East
FSU
Europe
Africa
Latin America
US & Canada
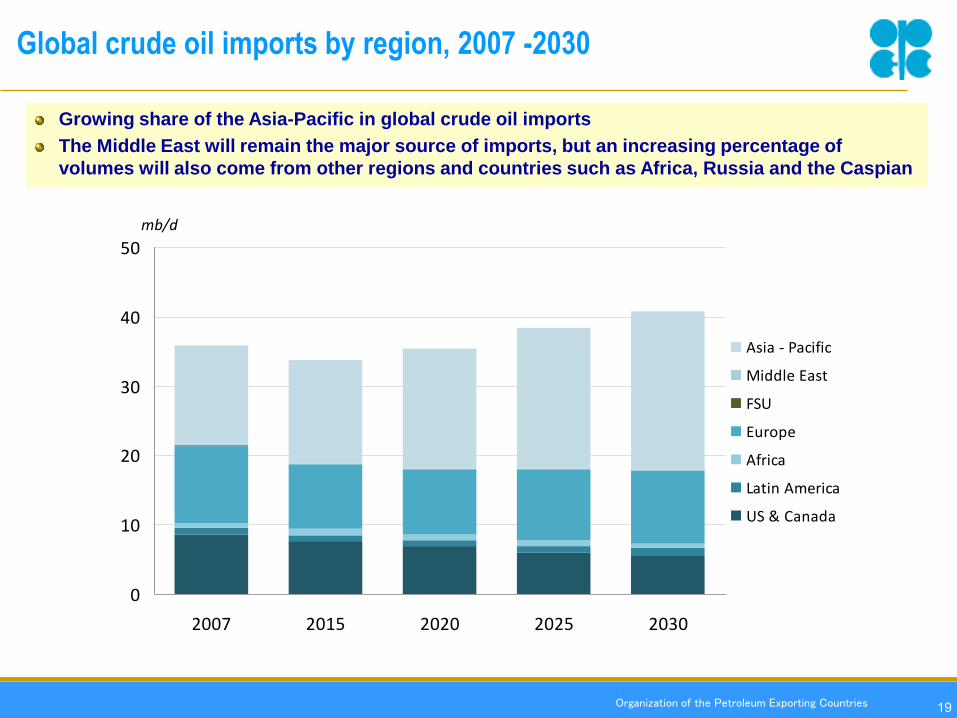
Global crude oil imports by region, 2007 -2030
19
Growing share of the Asia-Pacific in global crude oil imports
The Middle East will remain the major source of imports, but an increasing percentage of
volumes will also come from other regions and countries such as Africa, Russia and the Caspian
Organization of the Petroleum Exporting Countries 20
Sustainable development: a challenge for humanity
Energy is central to poverty eradication, sustainable development and
the achievement of the Millennium Development Goals
1.6 billion people have no access to electricity
2.5 billion people still rely on traditional biomass
Collective responsibility to help poorer nations
Future energy growth must support all three pillars of sustainable
development

Organization of the Petroleum Exporting Countries
CO2 emissions: the historical responsibility of developed countries
Cumulative CO2 emissions since 1900
GHG emissions will grow: mitigation options include Carbon Capture & Storage (CCS),
conservation and sinks
Historical responsibility of developed countries regarding the state of the Earth’s atmosphere
Ensure mitigation response measures and emission reduction commitments are fair and just
Developed countries should take the lead in mitigation, adaptation, funding & technology transfer
Looking for a win-win outcome for climate change negotiations
Per capita CO2 emissions (reference case)
21
Organization of the Petroleum Exporting Countries 22
Core industry challenges
Timely & sufficient investments along the entire supply chain
Adequacy of the human resources skills base
Technology role in
expanding production
improved recovery rates
deployment of cleaner technologies
Technology supporting sustainable development & environment
promotion of technologies that address climate change concerns
industrialized countries should take the lead in CCS
The critical importance of Research & Development & Deployment
Transfer of technology is vital
Organization of the Petroleum Exporting Countries
The role of NOCs and IOCs: enhanced cooperation
Many common objectives and challenges:
Important to enhance relationships among NOCs, as well as between
NOCs and IOCs
On such issues as the environment, the development of new
technologies, such as Carbon Capture and Storage (CCS), and helping
in the development of manpower and training (local content)
Such cooperation can also help bring down the high costs of services,
which are putting further pressure on well-devised output expansion
strategies
Aid further information exchange, as well as help evolve larger and
more developed research networks
Support broader socio-economic development and diversification
23
Organization of the Petroleum Exporting Countries 24
Common interest and shared responsibilities
Increasingly complex global energy system
Challenges und major uncertainties
Growing interdependence
Energy security should be treated as a shared responsibility by all parties
This is essential for the stable and sustainable oil market
Organization of the Petroleum Exporting Countries 25
In conclusion
Critical to bring all strands of the market together
Overall goal is to provide a stable setting for
expanding necessary investments
steady growth in economies
meeting environmental concerns
eradicating energy poverty
In-depth dialogue and cooperation among all stakeholders is the
way forward