World of Work Report 2008 - International Labour …dgreports/@dcomm/@publ/...x World of Work Report...
181
Income Inequalities in the Age of Financial Globalization World of Work Report 2008
Transcript of World of Work Report 2008 - International Labour …dgreports/@dcomm/@publ/...x World of Work Report...

Income Inequalities in the Age of Financial Globalization
World of Work Report 2008

World of Work Report 2008


INTERNATIONAL LABOUR ORGANIZATIONINTERNATIONAL INSTITUTE FOR LABOUR STUDIES
World of Work Report 2008Income Inequalities inthe Age of Financial Globalization

Published by the International Institute for Labour Studies
Th e International Institute for Labour Studies (IILS) was established in 1960 as an autonomous facility of the International Labour Organization (ILO) to further policy research, public debate and the sharing of knowledge on emerging labour and social issues of concern to the ILO and its constituents – labour, business and government.
Copyright © International Labour Organization (International Institute for Labour Studies)2008.
Short excerpts from this publication may be reproduced without authorization, on condition that the source is indicated. For rights of reproduction or translation, application should be made to the Director, International Institute for Labour Studies, P.O. Box 6, CH-1211 Geneva 22, Switzerland.
ISBN 978-92-9-014868-5 (print)
First published in 2008 byInternational Labour Offi ceCH-1211 Geneva 22, Switzerlandwww.ilo.org
Co-published in South Asia byAcademic Foundation4772/23 Bharat Ram Road, (23 Ansari Road), Darya Ganj,New Delhi – 110002, Indiawww.academicfoundation.com
ILO Cataloguing in Publication Data
World of work report 2008 : income inequalities in the age of fi nancial globalization / International Labour Offi ce, International Institute for Labour Studies. – Geneva: ILO, 2008180 p.
ISBN 978-92-9-014868-5
International Labour Offi ce; International Institute for Labour Studies
employment / labour market / wages / wage diff erential / income distribution / income redistribution / social policy / globalization / developed countries / developing countries
13.01.3
Photocomposed and printed in Switzerland ALI / WEI / SRO
Th e responsibility for opinions expressed in signed articles, studies and other contributions of this volume rests solely with their authors, and their publication does not constitute an endorsement by the International Institute for Labour Studies of the opinions expressed.
Copies can be ordered from: ILO Publications, International Labour Offi ce, CH-1211 Geneva 22, Switzerland. For on-line orders, see www.ilo.org/publns

Who are the authors of World of Work Report 2008?
Th e report has been prepared by staff of the International Institute for Labour Studies and is published under the responsibility of its Director. Chapter authors are:
● Steven Tobin, Matthieu Charpe, Ekkehard Ernst and Raymond Torres (Chapter 1)
● Ekkehard Ernst and Verónica Escudero (Chapter 2)
● Lucio Baccaro (Chapter 3)
● Uma Rani (Chapter 4)
● Naren Prasad (Chapter 5)
● Steven Tobin and Matthieu Charpe (Chapter 6).
Franz Ebert, Konstantinos Papadakis and Raymond Torres provided the analysis of executive compensation (Chapter 1) and its determinants (Chapter 2). Judy Raff erty was research assistant for the project.
Raymond Torres, Director of the Institute, edited and coordinated the report.
Th e International Institute for Labour Studies was established by the International Labour Organization in 1960 as a centre for advanced studies in the social and labour fi eld to further a better understanding of labour issues through education and research.


vii
Income inequalities are pervasive and growing in virtually all countries. Public debates and policies have focused on this challenge. Opinion surveys illustrate how people link the downsides of globalization to rising income inequalities. It is only appropriate there-fore for the International Institute for Labour Studies to apply its analytical expertise to a trend of direct relevance to the world of work.
The outcome is a comprehensive overview of key factors underlying unbalanced income developments. It shows that income inequality has risen more than can be justi-fi ed by economic analysis and entails major social and economic costs. What emerges is an evidence-based critique of the way fi nancial globalization has occurred so far.
Th e fi ndings assembled here provide analytical support to the ILO’s view that the growth model that led to the fi nancial crisis is not sustainable. It confi rms that a rebal-ancing between economic, social and environmental goals is vital both to recovery and also the shaping of a fair globalization.
Th e ILO, with its tripartite structure, is ideally placed to contribute to the eff ort to rebalance globalization to make it work for people and the real economy. Indeed, this is the essence of the ILO Declaration on Social Justice for a Fair Globalization, adopted by the International Labour Conference in June 2008. Th e Declaration recognizes that “In the context of accelerating change, the commitments and eff orts of Members and the Organ-ization to implement the ILO’s constitutional mandate, including through international labour standards, and to place full and productive employment and decent work at the centre of economic and social policies, should be based on the four equally important stra-tegic objectives of the ILO, through which the Decent Work Agenda is expressed …”.
Th e Institute’s fi ndings are published at a time of great fi nancial, economic and social stress marked by one of the most severe crises in recent times. National and global discus-sions about shaping more sustainable economic and social policies based on greater policy coherence and the Decent Work Agenda will greatly benefi t from the rich analysis devel-oped here.
Th e launch of the World of Work Report, the new annual fl agship publication of the International Institute for Labour Studies, cannot be more timely. Th is is a major contri-bution to the goal of decent work and a fair globalization for all.
PrefaceJuan Somavia Director-General


ix
The fi nancial crisis is hitting the world of work…
Th e fi nancial crisis which developed over the past year and erupted last August represents one of the most signifi cant threats to the world economy in modern history. Th e credit crunch and collapse of stock markets are starting to aff ect fi rms’ investment decisions as well as workers’ incomes and jobs. Several major developed economies have practically entered into recession and unemployment is on the rise. Economic growth in emerging economies and developing countries has slowed down, in some cases signifi cantly.
Ongoing attempts to overcome the fi nancial crisis are of course welcome and, in prin-ciple, should help avoid another Great Depression. Important as rescue packages are, how-ever, it is crucial to address the structural dimensions of the crisis as well. As this World of Work Report shows, the widening of income inequalities that occurred before the crisis is especially instructive in this respect.
… and happens in the face of income inequalities which are widening…
While the costs of the fi nancial rescue packages will be borne by all, the benefi ts of the earlier expansionary period were unevenly shared.
Between the early 1990s and the mid-2000s, in about two thirds of the countries for which data exist, the total income of high-income households expanded faster than was the case for their low-income counterparts (Chapter 1). Similar trends have occurred when looking at other dimensions of income inequality such as labour income vis-à-vis profi ts, or top wages vis-à-vis wages of low-paid workers. In 51 out of the 73 countries for which data are available, the share of wages in total income declined over the past two decades. Likewise, during the same period, the income gap between the top and bottom 10 per cent of wage earners increased in 70 per cent of the countries for which data are available.
Th is was a period of relatively rapid economic growth and strong job creation. In 2007, world employment was almost one third higher than in 1990. In short, the gains from the expansionary period which ended in 2007 benefi ted more high-income groups than their medium- and low-income counterparts.
Editorial
Editorial
Raymond Torres DirectorInternational Institute for Labour Studies

x
World of Work Report 2008: Income Inequalities in the Age of Financial Globalization
… at a pace which has probably been excessive
Wider income inequality can be helpful. It can signal stronger rewards to work eff ort, innovation and skill development. Th is, in turn, will improve economic prospects for all, rich and poor. Conversely, an overly compressed income diff erential may aff ect job pros-pects – for instance because the labour market is not suffi ciently attractive to would-be workers. Too little income inequality may also weaken the incentive to take risk or invest in human capital, thereby adversely aff ecting economic growth prospects.
However, there are instances where wider income inequality is both socially harmful and economically problematic.
Th ere is evidence that social confl ict grows when inequalities are perceived to be rising excessively. Social support for pro-growth policies will be eroded if low-income groups and the middle class believe that such policies do little to improve their situation or that of their children, while benefi ting high-income groups. Surveys suggest a declining tolerance among respondents vis-à-vis growing inequality.
Th e report also shows that, prior to the fi nancial crisis, there were already signs that observed trends in income inequality might not be sustainable. In the face of strong wage moderation, workers and their families became increasingly indebted in order to fund their housing investment decisions – and sometimes consumption decisions as well. Th is has sustained domestic demand and economic growth in some countries, and was made possible by fi nancial innovations. However, the crisis has underlined the limits to this growth model.
It is therefore crucial for policy makers to ensure that income inequality does not rise excessively. At the same time, any action in this area should take into account the need for sustaining employment. But the report shows that it is possible to fulfi l both employ-ment and equity objectives.
Inequality patterns refl ect, fi rst, a process of fi nancial globalization which has intensifi ed economic instability…
Chapter 2 of the report shows that fi nancial globalization – caused by deregulation of international capital fl ows – has been a major driver of income inequality.
Th e expectation was that fi nancial globalization would help improve the allocation of savings and thus stimulate economic growth, while also relaxing credit constraints and improve income prospects of low-income groups.
Yet, fi nancial globalization has failed to contribute to the enhancement of global productivity and employment growth. Moreover, fi nancial globalization has intensi-fi ed economic instability. In the 1990s, systemic banking crises were ten times more frequent than was the case at the end of the turbulent 1970s. Such increased insta-bility typically comes at a steep cost to low-income groups. Earlier experiences suggest that the job losses entailed by systemic fi nancial crisis have been especially strong, with long lasting eff ects on vulnerable groups. Unemployment will also rise signifi cantly as a result of the investment slump and this may further intensity income inequalities. Moreover, there is evidence that fi nancial globalization has reinforced the downward trend in the wage share recorded in most countries. On the other hand, fi nancial glo-balization has exercised a disciplining eff ect on macroeconomic policies, in both devel-oped and emerging countries.
Th erefore, the policy requirement is neither fi nancial deregulation nor isolation. There are several possible policy options to achieve this “mid-road”. What matters is that governments take into account the social impacts of each of the options. A cautious approach to fi nancial globalization is especially important in countries where fi nancial mar-kets are not suffi ciently developed and where supervision mechanisms are weak, as is the case in many developing countries. But in all countries, it is crucial to reinforce prudential

xi
Editorial
regulation so as to reduce irresponsible risk-taking on the part of certain fi nancial actors. Indeed, there is a “moral hazard” problem in that these actors grasp all the gains from irre-sponsible fi nancial positions, while the losses from such operations are partly shift ed to society and taxpayers. Th ere is also a role for coordinated action among countries.
…second, steep increases in executive pay de-linked from fi rm performance…
Developments in global corporate governance have also contributed to perceptions of excessive income inequality. A key development has been the use of so-called “perform-ance pay systems” for chief executive managers and directors.
Th e result has been a steep increase in executive pay. In the United States for example, between 2003 and 2007, executive managers’ pay grew in real terms by a total of 45%, compared with a real pay increase of 15% in the case of the average executive, and less than 3% for the average American worker. Hence, by 2007, the average executive man-ager in the 15 largest US fi rms earned more than 500 times the average employee in the United States, compared with over 300 times in 2003. Similar patterns can be observed in other countries such as Australia, Germany, Hong Kong (China), the Netherlands and South Africa.
Importantly, empirical studies show only very moderate, if any, eff ects of these systems on company performance. Moreover, large country variations exist, with some countries displaying virtually no relation between performance-pay and company profi ts. Th ough more research is clearly needed in this area, a plausible explanation behind observed trends is that executives are in a dominant bargaining position with respect to company owners, something which is facilitated by the institutional set-up.
Altogether, evidence suggests that developments in executive pay may have been both inequality-enhancing and economically ineffi cient. Th is suggests a role for policy action. In this regard, several options are being considered at present but it is too early to assess the pros and cons of each of them.
… third, institutional change and weaker redistribution policies
Domestic labour, social and tax policies too have contributed to observed outcomes. Labour institutions continue to play a redistributive role in the majority of countries under anal-ysis, despite the decline in trade union density documented in Chapter 3. In particular, high trade union density, a more coordinated collective bargaining structure, and greater coverage of collective bargaining agreements tend to be associated with lower inequality. However, it is diffi cult for these institutions to counteract the global trends arising from globalization. Overall, the bargaining position of employees has weakened, even in coun-tries where labour markets have been tight.
Another important factor has been the rising incidence of non-standard employment observed over the past 15 years or so in the majority of countries (Chapter 4). Indeed, non-standard jobs pay signifi cantly less than their standard counterparts. More funda-mentally, the changing employment patterns may have also contributed to weakening the bargaining position of workers, especially the low-skilled.
Finally, taxation has become less progressive in the vast majority of countries and thus less able to redistribute the gains from economic growth. Th is refl ects a cut in taxes on high incomes (Chapter 5). Between 1993 and 2007, the average corporate tax rate (for all countries for which data exist) was cut by 10 percentage points. In the case of top personal income tax rates, the cut was of 3 percentage points over the same period. Chapter 5 also shows that declining tax progressivity has generally not been off set by social policy.
Cutting taxes on high incomes or profi ts can be justifi ed on economic effi ciency grounds. Th ey may even meet equity objectives in certain cases – the lift ing-all-boats

xii
World of Work Report 2008: Income Inequalities in the Age of Financial Globalization
eff ect. However there are other cases where such tax cuts produce sub-optimal results, even when considering effi ciency-equity tradeoff s. Likewise, stronger social protection, if well designed, can serve employment objectives. Th e report gives examples of such policies among countries at diff erent levels of economic development. Th e use of conditional cash benefi ts provides an interesting innovation in this respect.
It is therefore time to move ahead with the Decent Work Agenda
But evidence presented in this World of Work Report shows that, if policy makers are concerned about excessive inequalities in their country while also sustaining employ-ment, they have at their disposal an eff ective tool. Countries that do well in terms of both employment and inequality are characterised by relatively strong tripartite institutions, well-designed labour regulations and social protection, and respect for basic workers’ rights (Chapter 6). Indeed, this is the essence of the Decent Work Agenda.
Moving ahead with the Agenda would help address the social consequences of the fi nancial crisis. Together with a reform of the fi nancial architecture, it would also con-tribute to achieve a more balanced, sustainable economy.

xiii
Preface . . . . . . . . . . . . . . . . . . . . . . . . . . . . . . . . . . . . . . . . . . . . . vii
Editorial . . . . . . . . . . . . . . . . . . . . . . . . . . . . . . . . . . . . . . . . . . . . . ix
Chapter 1. Trends in employment and inequality . . . . . . . . . . . . . . . . 1Main fi ndings . . . . . . . . . . . . . . . . . . . . . . . . . . . . . . . . . . . . . . . . . . . . . . . . . . . . . . . . . . . . . . . . 1Introduction . . . . . . . . . . . . . . . . . . . . . . . . . . . . . . . . . . . . . . . . . . . . . . . . . . . . . . . . . . . . . . . . . 2A. Overview of recent developments and employment trends . . . . . . . . . . . . . . . . . . . 3B. Trends in income inequality . . . . . . . . . . . . . . . . . . . . . . . . . . . . . . . . . . . . . . . . . . . . . . 8C. Why is income inequality a matter of policy concern? . . . . . . . . . . . . . . . . . . . . . . 22D. Bottom line and rationale for the next chapters . . . . . . . . . . . . . . . . . . . . . . . . . . . . 29Appendix A. Regional country groupings . . . . . . . . . . . . . . . . . . . . . . . . . . . . . . . . . . . . . . 30Appendix B. Calculation methods for wage dispersion, wage shares,
productivity and real wage growth . . . . . . . . . . . . . . . . . . . . . . . . . . . . . . . . . 31References . . . . . . . . . . . . . . . . . . . . . . . . . . . . . . . . . . . . . . . . . . . . . . . . . . . . . . . . . . . . . . . . . . . 34
Chapter 2. The role of fi nancial globalization . . . . . . . . . . . . . . . . . . 39Main fi ndings . . . . . . . . . . . . . . . . . . . . . . . . . . . . . . . . . . . . . . . . . . . . . . . . . . . . . . . . . . . . . . . . 39Introduction . . . . . . . . . . . . . . . . . . . . . . . . . . . . . . . . . . . . . . . . . . . . . . . . . . . . . . . . . . . . . . . . . 40A. Development of fi nancial globalization and wealth inequality . . . . . . . . . . . . . . . 41B. Financial markets and pro-poor growth . . . . . . . . . . . . . . . . . . . . . . . . . . . . . . . . . . . . 44C. Financial globalization, union bargaining power and the wage share . . . . . . . . . 50D. Financial globalization and the convergence of capitalisms . . . . . . . . . . . . . . . . . . 52E. Corporate governance and executive pay . . . . . . . . . . . . . . . . . . . . . . . . . . . . . . . . . . . 56F. Policy considerations . . . . . . . . . . . . . . . . . . . . . . . . . . . . . . . . . . . . . . . . . . . . . . . . . . . . . 59Appendix A. Th e impact of fi nancial market crises on growth and inequality:
An empirical assessment . . . . . . . . . . . . . . . . . . . . . . . . . . . . . . . . . . . . . . . . . . 60Appendix B. Empirical studies regarding pay for performance . . . . . . . . . . . . . . . . . . . 62References . . . . . . . . . . . . . . . . . . . . . . . . . . . . . . . . . . . . . . . . . . . . . . . . . . . . . . . . . . . . . . . . . . . 65
Table of Contents
Table of Contents

xiv
World of Work Report 2008: Income Inequalities in the Age of Financial Globalization
Chapter 3. Labour institutions and inequality . . . . . . . . . . . . . . . . . . 71Main fi ndings . . . . . . . . . . . . . . . . . . . . . . . . . . . . . . . . . . . . . . . . . . . . . . . . . . . . . . . . . . . . . . . . 71Introduction . . . . . . . . . . . . . . . . . . . . . . . . . . . . . . . . . . . . . . . . . . . . . . . . . . . . . . . . . . . . . . . . . 72A. Review of earlier studies . . . . . . . . . . . . . . . . . . . . . . . . . . . . . . . . . . . . . . . . . . . . . . . . . . 74B. Cross-country patterns of labour institutions and income inequality . . . . . . . . . 81C. Policy considerations . . . . . . . . . . . . . . . . . . . . . . . . . . . . . . . . . . . . . . . . . . . . . . . . . . . . . 91Appendix A. Measures of labour institutions . . . . . . . . . . . . . . . . . . . . . . . . . . . . . . . . . . 92Appendix B. Do labour institutions reduce inequality? An econometric analysis 94Appendix C. Is the inequality-reduction eff ect of industrial relations
institutions withering away in advanced countries? . . . . . . . . . . . . . . . . 103References . . . . . . . . . . . . . . . . . . . . . . . . . . . . . . . . . . . . . . . . . . . . . . . . . . . . . . . . . . . . . . . . . . . 110
Chapter 4. Changing employment patterns . . . . . . . . . . . . . . . . . . . . 115Main fi ndings . . . . . . . . . . . . . . . . . . . . . . . . . . . . . . . . . . . . . . . . . . . . . . . . . . . . . . . . . . . . . . . . 115Introduction . . . . . . . . . . . . . . . . . . . . . . . . . . . . . . . . . . . . . . . . . . . . . . . . . . . . . . . . . . . . . . . . . 116A. No clear link between income inequality and employment growth . . . . . . . . . . . 117B. Rising non-standard employment as a factor of income inequality . . . . . . . . . . . 118C. Policy considerations . . . . . . . . . . . . . . . . . . . . . . . . . . . . . . . . . . . . . . . . . . . . . . . . . . . . . 124References . . . . . . . . . . . . . . . . . . . . . . . . . . . . . . . . . . . . . . . . . . . . . . . . . . . . . . . . . . . . . . . . . . . 125
Chapter 5. Redistribution through taxes and social transfers . . . . . . . . 127Main fi ndings . . . . . . . . . . . . . . . . . . . . . . . . . . . . . . . . . . . . . . . . . . . . . . . . . . . . . . . . . . . . . . . . 127Introduction . . . . . . . . . . . . . . . . . . . . . . . . . . . . . . . . . . . . . . . . . . . . . . . . . . . . . . . . . . . . . . . . . 128A. Social transfers, taxation and income inequality: what are the trends? . . . . . . . . 129B. To what extent do taxes and social transfers shape income distribution? . . . . . . 136C. Policy considerations . . . . . . . . . . . . . . . . . . . . . . . . . . . . . . . . . . . . . . . . . . . . . . . . . . . . . 149References . . . . . . . . . . . . . . . . . . . . . . . . . . . . . . . . . . . . . . . . . . . . . . . . . . . . . . . . . . . . . . . . . . . 149
Chapter 6. Decent Work as a coherent policy package . . . . . . . . . . . . 153Introduction . . . . . . . . . . . . . . . . . . . . . . . . . . . . . . . . . . . . . . . . . . . . . . . . . . . . . . . . . . . . . . . . . 153A. Links between Decent Work and income inequality . . . . . . . . . . . . . . . . . . . . . . . . 153B. Policy coherence . . . . . . . . . . . . . . . . . . . . . . . . . . . . . . . . . . . . . . . . . . . . . . . . . . . . . . . . . 156C. Areas for further analysis . . . . . . . . . . . . . . . . . . . . . . . . . . . . . . . . . . . . . . . . . . . . . . . . . 158References . . . . . . . . . . . . . . . . . . . . . . . . . . . . . . . . . . . . . . . . . . . . . . . . . . . . . . . . . . . . . . . . . . . 159
Recent publications . . . . . . . . . . . . . . . . . . . . . . . . . . . . . . . . . . . . 161
xv
Table of Contents
List of tables, fi gures and boxes by chapter
FiguresChapter 1Figure 1.1. World employment trends . . . . . . . . . . . . . . . . . . . . . . . . . . . . . . . . . . . . . . . . 4Figure 1.2. Employment growth and dispersion . . . . . . . . . . . . . . . . . . . . . . . . . . . . . . . 5Figure 1.3. Trends in female employment growth . . . . . . . . . . . . . . . . . . . . . . . . . . . . . 5Figure 1.4. Development of wage shares, by region, 1985-2006 . . . . . . . . . . . . . . . . . 6Figure 1.5. Average annual wage and productivity growth, per cent, 1990-2006 7Figure 1.6. Gini index by region for 1990 and 2000 . . . . . . . . . . . . . . . . . . . . . . . . . . . 11Figure 1.7. Changes in Gini index between 1990 and 2005 . . . . . . . . . . . . . . . . . . . . 12Figure 1.8. Ratio of earnings of top 10 per cent earners vis-à-vis bottom
10 per cent earners, 1990-2006 . . . . . . . . . . . . . . . . . . . . . . . . . . . . . . . . . . . 13Figure 1.9. Evolution of executive pay versus average employee wages
in the United States, 2003-2007 . . . . . . . . . . . . . . . . . . . . . . . . . . . . . . . . . . 18Figure 1.10. Evolution of executive pay versus average employee wages
in the Netherlands, 2003-2007 . . . . . . . . . . . . . . . . . . . . . . . . . . . . . . . . . . . 19Figure 1.11. Estimated decline in purchasing power of Indian urban households
resulting from rising food prices, 2007 . . . . . . . . . . . . . . . . . . . . . . . . . . . . 21Figure 1.12. Estimated decline in purchasing power of households
in the United States resulting from rising fuel prices, 2007 . . . . . . . . . . 21Figure 1.13. Income inequality and inter-generational mobility . . . . . . . . . . . . . . . . . . 24Figure 1.14. Income inequality and corruption . . . . . . . . . . . . . . . . . . . . . . . . . . . . . . . . . 25Figure 1.15. Income inequality and spending on tertiary education . . . . . . . . . . . . . . 25Figure 1.16. Income inequality and trend per capita GDP growth . . . . . . . . . . . . . . . 26Figure 1.17. Income inequality and instability of economic growth . . . . . . . . . . . . . . 28
Chapter 2Figure 2.1. De jure measures of capital account opening . . . . . . . . . . . . . . . . . . . . . . . 42Figure 2.2. Financial globalization in seven world regions (% of GDP) . . . . . . . . . . 42Figure 2.3. Foreign direct investment in seven world regions (% of GDP) . . . . . . . 43Figure 2.4. Frequency of banking crises, systemic or otherwise, in OECD countries and the rest of the world (%) . . . . . . . . . . . . . . . . . . 48Figure 2.5. Development of current accounts and wage share during fi nancial crises in four countries . . . . . . . . . . . . . . . . . . . . . . . . . . . . . . . . . . . . . . . . . . . 49Figure 2.6. Impact of fi nancial development and crises on inequality and growth . . . . . . . . . . . . . . . . . . . . . . . . . . . . . . . . . . . . . . . . . . . . . . . . . . . . . . 51Figure 2.7. Financial globalization and the evolution of the wage share . . . . . . . . . 52Figure 2.8. Misery index . . . . . . . . . . . . . . . . . . . . . . . . . . . . . . . . . . . . . . . . . . . . . . . . . . . . 55
Chapter 3Figure 3.1. Bivariate correlation between average Gini coeffi cient
and average union density, 1989-2005 . . . . . . . . . . . . . . . . . . . . . . . . . . . . . 83Figure 3.2. Bivariate correlation between average Gini coeffi cient and average
collective bargaining structure index, 1989-2005 . . . . . . . . . . . . . . . . . . . 84Figure 3.3. Bivariate correlation between average Gini coeffi cient and average
severity score for Convention No. 87, 1990-2000 . . . . . . . . . . . . . . . . . . . 85Figure 3.4. Bivariate correlation between average Gini coeffi cient and average
severity score for Convention No. 98, 1990-2000 . . . . . . . . . . . . . . . . . . 85Figure 3.5. Relationship between labour power and welfare state size
in the periods 1978-1989 and 1990-2002 . . . . . . . . . . . . . . . . . . . . . . . . . . 88Figure 3.6. Relationship between welfare state size and inequality
in the periods 1978-1989 and 1990-2002 . . . . . . . . . . . . . . . . . . . . . . . . . . 89

xvi
World of Work Report 2008: Income Inequalities in the Age of Financial Globalization
Figure 3.7. Partial correlation between inequality and labour power, controlling for welfare state size, 1978-1989 . . . . . . . . . . . . . . . . . . . . . . . . 90
Figure 3.8. Partial correlation between inequality and labour power controlling for welfare state size, 1990-2002 . . . . . . . . . . . . . . . . . . . . . . . 90
Figure 3.A1. Average severity score over time, Convention No. 87 . . . . . . . . . . . . . . . 94Figure 3.A2. Average severity score over time, Convention No. 98 . . . . . . . . . . . . . . . 94
Chapter 4Figure 4.1. Average annual changes in income inequality and employment . . . . . . 117Figure 4.2. Part-time and temporary work are on the rise in advanced countries 119Figure 4.3. Trends in non-standard employment in Central and Eastern
European countries are mixed . . . . . . . . . . . . . . . . . . . . . . . . . . . . . . . . . . . . 119Figure 4.4. Informal employment in Latin American countries . . . . . . . . . . . . . . . . 120Figure 4.5. Informal employment in selected Asian countries . . . . . . . . . . . . . . . . . . 121Figure 4.6. Informal employment in selected African countries . . . . . . . . . . . . . . . . 121Figure 4.7. Fixed-term contracts pay less than permanent contracts . . . . . . . . . . . . . 122Figure 4.8. Informal sector jobs pay less than formal sector jobs . . . . . . . . . . . . . . . . 122Figure 4.9. Decomposition of income inequality by household characteristics,
urban China and India . . . . . . . . . . . . . . . . . . . . . . . . . . . . . . . . . . . . . . . . . . . 123Figure 4.10. Income gap between formal sector and informal sector households
in Latin America . . . . . . . . . . . . . . . . . . . . . . . . . . . . . . . . . . . . . . . . . . . . . . . . 123
Chapter 5Figure 5.1. Social transfers and income inequality . . . . . . . . . . . . . . . . . . . . . . . . . . . . . 130Figure 5.2. Trends in spending on social transfers (% GDP) . . . . . . . . . . . . . . . . . . . . 131Figure 5.3. Education spending and inequality . . . . . . . . . . . . . . . . . . . . . . . . . . . . . . . . 132Figure 5.4. Trends in education and health spending (% GDP) . . . . . . . . . . . . . . . . . 133Figure 5.5. Global corporate tax rates, 1997-2007 (%) . . . . . . . . . . . . . . . . . . . . . . . . . 134Figure 5.6. Top marginal individual income taxes, worldwide (%) . . . . . . . . . . . . . . 134Figure 5.7. VAT Trends in OECD countries, 1990-2007 . . . . . . . . . . . . . . . . . . . . . . 134Figure 5.8. Inequality and redistribution in OECD countries, 1980s and 1990s 137Figure 5.9. Share of taxes and transfers in redistribution in OECD countries (%) 137Figure 5.10. Redistribution and poverty in OECD countries . . . . . . . . . . . . . . . . . . . . 138Figure 5.11. Sectoral contribution to reduced income inequality, latest available data in OECD countries . . . . . . . . . . . . . . . . . . . . . . . . . . . . . . . . . . . . . . . . . 138Figure 5.12. Change in inequality, EPR and growth in countries with economies
in transition, 1990-2004 (%) . . . . . . . . . . . . . . . . . . . . . . . . . . . . . . . . . . . . . . 138Figure 5.13. Redistributive impact (average) of transfers and taxes on inequality
in six Latin American countries . . . . . . . . . . . . . . . . . . . . . . . . . . . . . . . . . . . 142Figure 5.14. Absolute incidence of social security provision in eight countries
in Latin America (%) . . . . . . . . . . . . . . . . . . . . . . . . . . . . . . . . . . . . . . . . . . . . . 142Figure 5.15. Social protection expenditure, by category, in Asia and the Pacifi c (%) 143Figure 5.16. Brazil: Change in inequality, employment and growth, 1990-2006 (%) 144Figure 5.17. Malaysia: Change in inequality, employment and growth, 1990-2007 (%) . . . . . . . . . . . . . . . . . . . . . . . . . . . . . . . . . . . . . . . . . . . . . . . . . . . 147
Chapter 6Figure 6.1. Principal component analysis for high per-capita GDP countries . . . . 154Figure 6.2. Principal component analysis for medium
and low per-capita GDP countries . . . . . . . . . . . . . . . . . . . . . . . . . . . . . . . . . 155

xvii
Table of Contents
TablesChapter 1Table 1.1. Executive pay, 2007 . . . . . . . . . . . . . . . . . . . . . . . . . . . . . . . . . . . . . . . . . . . . . . 17Table 1.2. Increase in executive pay components, United States, 2003-2007,
per cent . . . . . . . . . . . . . . . . . . . . . . . . . . . . . . . . . . . . . . . . . . . . . . . . . . . . . . . . . 19Table 1.3. Increase in executive pay components, Netherlands, 2003-2007,
per cent . . . . . . . . . . . . . . . . . . . . . . . . . . . . . . . . . . . . . . . . . . . . . . . . . . . . . . . . . 20
Chapter 2Table 2.1. Wealth inequality in selected countries . . . . . . . . . . . . . . . . . . . . . . . . . . . . 44Table 2.2. Redistribution: inequality before and aft er taxes . . . . . . . . . . . . . . . . . . . 53Table 2.A1. Defi nitions and sources of variables used in the regression analysis . . . 60Table 2.A2. Regression results . . . . . . . . . . . . . . . . . . . . . . . . . . . . . . . . . . . . . . . . . . . . . . . . 61
Chapter 3Table 3.1. Cross-country time-series studies of the relationship between
industrial relations institutions and inequality . . . . . . . . . . . . . . . . . . . . . 79Table 3.2. Change in union density rates, 2005-1989 . . . . . . . . . . . . . . . . . . . . . . . . . 82Table 3.3. Average collective bargaining structure and change, on a scale
of 1 to 5, 1989-2005 . . . . . . . . . . . . . . . . . . . . . . . . . . . . . . . . . . . . . . . . . . . . . 82Table 3.A1. Sources of trade union density data . . . . . . . . . . . . . . . . . . . . . . . . . . . . . . . 92Table 3.B1. List of predictors and expected impact on inequality . . . . . . . . . . . . . . . 96Table 3.B2. Determinants of Gini: fi xed-eff ects models, with AR(1) errors,
intercept and time dummies not reported . . . . . . . . . . . . . . . . . . . . . . . . . . 98Table 3.B3. Impact of globalization on union density rates: fi xed-eff ects models
with AR(1) errors, intercept and time dummies not reported . . . . . . . . 101Table 3.B4. Determinants of Gini coeffi cients: between eff ects
(constant not reported) . . . . . . . . . . . . . . . . . . . . . . . . . . . . . . . . . . . . . . . . . . . 102Table 3.C1. Determinants of the Gini coeffi cient in 16 advanced countries (fi xed
eff ects with AR(1) errors, time dummies and constant not reported) 104Table 3.C2. Principal component analysis of labour power: one component
retained, 366 observations . . . . . . . . . . . . . . . . . . . . . . . . . . . . . . . . . . . . . . . . 106Table 3.C3. Principal component analysis of welfare state size: one component
retained, 352 observations . . . . . . . . . . . . . . . . . . . . . . . . . . . . . . . . . . . . . . . . 106Table 3.C4. Principal component analysis of inequality . . . . . . . . . . . . . . . . . . . . . . . . . 106Table 3.C5. Determinants of inequality in 16 advanced countries (1978-1989),
between regressions (constants not reported) . . . . . . . . . . . . . . . . . . . . . . . 107Table 3.C6. Determinants of inequality in 16 advanced countries (1990-2002),
between regressions (constant not reported) . . . . . . . . . . . . . . . . . . . . . . . . 108
Chapter 5Table 5.1. Inequality and redistribution in countries with economies
in transition . . . . . . . . . . . . . . . . . . . . . . . . . . . . . . . . . . . . . . . . . . . . . . . . . . . . . 139Table 5.2. Average growth rates, Mauritius . . . . . . . . . . . . . . . . . . . . . . . . . . . . . . . . . . 148Table 5.3. Income inequality and poverty in Mauritius, by household . . . . . . . . . . 148
Chapter 6Table 6.1. Successful employment performers: two illustrative models . . . . . . . . . 157

xviii
World of Work Report 2008: Income Inequalities in the Age of Financial Globalization
BoxesChapter 1Box 1.1. Measurements of income inequality . . . . . . . . . . . . . . . . . . . . . . . . . . . . . . . . . . 10Box 1.2. Measurement of executive pay: methodological issues . . . . . . . . . . . . . . . . . 16Box 1.3. Inequality and reform: Experiences in Bolivia and the Republic
of South Korea . . . . . . . . . . . . . . . . . . . . . . . . . . . . . . . . . . . . . . . . . . . . . . . . . . . . . 27
Chapter 2Box 2.1. Sovereign wealth funds and global capital fl ows . . . . . . . . . . . . . . . . . . . . . . . 46Box 2.2. Cost of fi nancial crises in individual countries – the Asian crisis . . . . . . . 50Box 2.3. Importing macroeconomic discipline: Economic and social costs
and benefi ts in Argentina and Ecuador . . . . . . . . . . . . . . . . . . . . . . . . . . . . . . . 54
Chapter 5Box 5.1. Th e role of education and health in reducing income inequality . . . . . . . . 132Box 5.2. Brazil: Inequality employment and growth . . . . . . . . . . . . . . . . . . . . . . . . . . . 144Box 5.3. Malaysia: Inequality employment and growth . . . . . . . . . . . . . . . . . . . . . . . . 146Box 5.4. Mauritius: Inequality and growth . . . . . . . . . . . . . . . . . . . . . . . . . . . . . . . . . . . 148
Chapter 6Box 6.1. Analysing the links between income inequality and Decent Work . . . . . 154

1
Main findings
● Th e ongoing global economic slowdown is aff ecting low-income groups dispropor-tionately. Th is development comes aft er a long expansionary phase where income ine-quality was already on the rise in the majority of countries.
● Th e recent period of economic expansion was accompanied by substantial employ-ment growth across most regions. Between the early 1990s and 2007, world employ-ment grew by around 30 per cent. However, there was considerable variation in labour market performance between countries. In addition, not all individuals shared equally in the employment gains. In a number of regions, women continued to represent a disproportionate share of non-employed persons – reaching nearly 80 per cent in the Middle East, North Africa and Asia and the Pacifi c.
● Employment growth has also occurred alongside a redistribution of income away from labour. In 51 out of 73 countries for which data are available, the share of wages in total income declined over the past two decades. Th e largest decline in the share of wages in GDP took place in Latin America and the Caribbean (-13 points), followed by Asia and the Pacifi c (-10 points) and the Advanced Economies (-9 points).
● Between 1990 and 2005, approximately two thirds of the countries experienced an increase in income inequality (as measured by changes in the Gini index). In other words, the incomes of richer households have increased relative to those of poorer households. Likewise, during the same period, the income gap between the top and bottom 10 per cent of wage earners increased in 70 per cent of the countries for which data are available.
● Th e gap in income inequality is also widening – at an increasing pace – between the fi rms’ executives and the average employee. For example, in the United States in 2007, the chief executive offi cers (CEOs) of the 15 largest companies earned 500 times more than the average worker. Th is is up from 360 times more in 2003. Even in Hong Kong (China) and South Africa where executives are paid much less than their United States’ counterparts, CEO pay still represents 160 and 104 times, respectively, the wages of the average worker.
Trends in employment and inequality*
1. Trends in employment and inequality
* Excellent research assistance by Pascal Annycke is gratefully acknowledged.

2
World of Work Report 2008: Income Inequalities in the Age of Financial Globalization
● Th e prospects are for a continuation of a rise in income inequality in the course of the present economic slowdown and the recent developments such as the fi nancial crisis and the sharp rise in food prices. As this report shows, the latter has already dispro-portionately aff ected poorer households.
● Rising income inequality can be a good thing to the extent that it is crucial to reward work eff ort, talent and innovation – key engines of economic growth and wealth crea-tion. However, there are instances where income inequality reaches excessive levels, in that it represents a danger to social stability while also going against economic effi ciency considerations. Indeed, higher income inequality is associated with higher crime rates and lower life expectancy. Higher inequality may also deepen macroeconomic instability in the sense that low-income households may adjust more slowly to economic shocks. In addition, there are instances where richer groups may secure economically-ineffi cient advantages, such as distortive taxes or an allocation of public funds that goes against the economic interests of the country as a whole. More fundamentally, when income ine-qualities are perceived to reach excessive levels, social support for pro-growth policies may be strongly eroded. Already now, there are widespread perceptions in many coun-tries that globalization does not work to the advantage of the majority of the population.
● Th e policy challenge is therefore to ensure adequate incentives to work, learn and invest, while also avoiding socially-harmful and economically-ineffi cient income ine-qualities. Later chapters of this report examine this issue in detail.
Introduction
Since 2007, the world of work has been hit by a number of global developments, in partic-ular fi nancial turmoil, rising food prices and a shortage of raw materials. Th is has brought an end to the rapid growth and strong employment performance exhibited by the world economy almost uninterruptedly since the mid-1990s.
Looking forward, a critical issue is the extent to which the current fi nancial crisis and slowdown in the world economy may aff ect disproportionately low-income groups. Th is is all the more relevant given that, as this chapter will show, during the high-growth period, income inequality increased in the majority of countries, which may in turn damage the social fabric.
Th e purpose of this chapter is to discuss trends in employment and income inequality over the past two decades, and to assess why rising income inequality should be a matter of policy concern.
A number of the underlying factors behind rising income inequalities will be analysed in detail in later chapters. Chapter 2 examines the role of fi nancial globalization, while Chapter 3 off ers a comprehensive quantitative analysis of the role of domestic factors, notably tri-partite institutions, in shaping income inequalities, taking due account of trade and other dimensions of globalization. Chapter 4 considers trends in job quality and the extent to which these trends may have contributed to rising income inequality. Chapter 5 examines redistribu-tive policies through taxes and social transfers. Lastly, Chapter 6 considers Decent Work as a policy package to address excessive income inequalities and support employment growth.
Section A of this chapter provides an overview of developments in the world of work, especially as regards employment growth and labour’s share of income over the past two dec-ades. Section B reviews recent regional and country developments with respect to income ine-quality. Th is includes a special focus on the compensation of executives in selected countries. Th e extent to which income inequality is an issue of concern for policy-makers will be discussed in Section C. Lastly, Section D introduces some of the potential factors underlining the trend increase in income inequality and sets up a more detailed discussion in the chapters that follow.

3
1. Trends in employment and inequality
A. Overview of recent developments and employment trends
The world of work is being affected by the economic slowdown
Rapidly rising oil, food and raw material prices, as well as the global fi nancial turmoil, have aff ected the world economy over the past year.1 In the light of these developments, the International Monetary Fund (IMF) has revised global economic growth forecasts down-wards, especially for a number of the Advanced Economies – the United States, European Union (EU) 15 and Japan.2 Growth turned negative in a number of countries, including France, Germany, Japan and Italy, in the second quarter of 2008, with growth in emerging and developing economies expected to slow down, although to what degree will partly depend on how severe the situation in the Advanced Economies turns out to be.3
Th e current economic slowdown has already had an immediate impact, bringing to a halt the strong employment growth enjoyed, with little or no interruption, by most Advanced Economies since the early 1990s. Th e United States, for example, experienced negative employment growth in each of the fi rst nine months of 2008. Moreover, employ-ment growth in most countries of the Organisation for Economic Co-operation and Development (OECD) is expected to slow down over the remainder of 2008 and into early 2009 (OECD, 2008a; OECD, 2008b).
Global employment growth, although still positive, is slowing in 2008, as employ-ment gains diminish in developing economies. In the context of the current fi nancial crisis, it is also quite likely that the impact of these most recent developments has yet to be fully felt. In this respect, it will be important to monitor the extent to which low-income groups may be aff ected, especially in the developing world, where the recent steep increase in food prices has disproportionately reduced the purchasing power of poorer households (see Section B).
Th ese developments will likely intensify some of the changes that have characterized the world of work over the past two decades or so. First, as the Advanced Economies’ share of total employment has been in steady decline over the past decade, falling to just over 15 per cent in 2007, that of the developing economies has continued to rise (fi g. 1.1, panel A). In fact, the world of work is evolving in such a manner that the regions of Asia and the Pacifi c and Latin America and the Caribbean now account for nearly two thirds of world employment, the former alone accounting for more than half. Th e two regions have also enjoyed similar employment growth since 2000 (fi g. 1.1, panel B).
Second, even though the most recent period of economic expansion, from the early 1990s on, has been accompanied by relatively robust employment growth, this overall trend masks a number of important distributional factors: (i) employment growth has varied considerably within each region and large numbers of women remain excluded from the world of work; (ii) labour’s share of income has been declining; and, (iii) in the majority of cases, this period of expansion went hand in hand with wider income inequali-ties – the theme of this year’s World of Work Report.
1. In December 2007, the food price index issued by the Food and Agriculture Organization of the United Nations (FAO) stood at 187, the highest monthly average since its inception in 1990. On 11 July 2008, the price of a barrel of oil reached its highest ever price, at over US$ 147.2. See Appendix A for a list of country groupings.3. Th e recent slowdown in the United States and other developed nations has not yet become global, which suggests that there may be some decoupling of growth in developing countries from growth in the Advanced Economies. However, there is some considerable debate as to the reality of this supposition, especially when examined over the longer term (see, for example, Kose, Otrok and Prasad, 2008).

4
World of Work Report 2008: Income Inequalities in the Age of Financial Globalization
The slowdown follows a long period of rapid employment growth
Between the early 1990s and 2007, almost all regions of the world enjoyed relatively robust employment growth (fi g. 1.2, panel A). In particular, since 1991, the Middle East, Sub-Saharan and North Africa and Latin America and the Caribbean have experienced annual growth of nearly 2.8 per cent, and oft en more, which, over the years, amounts to around a 50 per cent total increase in employment. Jobs gains in the Advanced Economies have been steady, if unspectacular, at 1 per cent per annum, but they have been outpaced by the Asia and the Pacifi c region – by a factor of two since 2002. At the other end of the spec-trum, Central and Eastern Europe and the Former Soviet Republics saw a deterioration in the employment situation that accompanied a series of market reforms beginning in 1989, although that trend began to be reversed around 1999 (ILO, 1999).
Strong regional improvements in employment outcomes, however, tell only part of the story. Th e reality is that signifi cant variations in employment growth have occurred within all regions since the early 1990s, as shown by Figure 1.2, panel B. Moreover, the coeffi cient of variation reveals that the dispersion in country growth rates was highest in regions with stronger employment growth (the Middle East and Sub-Saharan Africa) and lowest where growth was more moderate (the Advanced Economies).4
Th e employment contribution of women to the world of work, since the early 1990s, has varied considerably from region to region. In the Advanced Economies, for example, women have accounted for the bulk of employment growth (over 60 per cent: see fi g. 1.3, panel A), but elsewhere for less than a third. Th ere have been considerable improvements in recent years in female labour market outcomes, with many women progressing from precarious jobs to wage and salaried employment. However, these trends have not made a substantial diff erence to the gender gap in the workplace (ILO, 2008b). Th e employment rates of women, at 49.1 per cent, continue to trail those of their male counterparts by some 25 percentage points (ILO, 2008a).
Not surprisingly, this has infl uenced the extent to which lower female employment rates drag down overall employment rates. For example, in the Middle East, North Africa and Asia and the Pacifi c, women constitute 80 per cent or more of the non-employed (fi g. 1.3, panel B).5 Even in the Advanced Economies and Central and Eastern Europe and
4. Th e coeffi cient of variation is measured as the standard deviation divided by the mean.5. “Non-employed” is defi ned as the sum of the diff erence, by country and gender, between the maximum and the prevailing employment rate among persons aged 15 and over in the region.
Figure 1.1. World employment trends
Source: Estimates by International Institute for Labour Studies (IILS); ILO, 2008a.
Panel A. Share of Advanced Economies in world employment, 1991-2007 Panel B. Share of employment growth by region, 2000-2007
AdvancedEconomies
Sub-SaharanAfrica
Asia & the Pacific
Central & Eastern Europe and Former
Soviet Republics
Latin America &the Caribbean Middle
East NorthAfrica
14.0
14.5
15.0
15.5
16.0
16.5
17.0
17.5
1991 1993 1995 1997 1999 2001 2003 2005 2007

5
1. Trends in employment and inequality
Former Soviet Republics, where women constitute a sizeable proportion of employment, they nonetheless also account for nearly two thirds of the non-employed. Th e development potential of many of these countries is thus constrained by the limited opportunities for women to benefi t from, and take part in, the world of work (ILO, 2008b). It should be noted, in that context, that the nature of employment has also changed dramatically. Th e evolution of non-standard work arrangements in which women participate to a dispropor-tionate degree, is discussed in Chapter 4.
Source: IILS estimates; ILO, 2008a.
Source: IILS estimates; ILO, 2008a.
Figure 1.2. Employment growth and dispersion
Figure 1.3. Trends in female employment growth
Panel A. Evolution of employment, 1991-2007 (1991 = 100) Panel B. Cross-country dispersion of employment growth, 1991-2007Average annual employment growth, per cent
1991 1993 1995 1997 1999 2001 2003 2005 2007
Advanced Economies
Asia & the Pacific Central & Eastern Europeand Former Soviet Republics
Sub-Saharan Africa
Latin America & the Caribbean
Middle East
North Africa
80
90
100
110
120
130
140
150
160
170
-4
-2
0
2
4
6
8
Best performer
Region average
Worst performer
Panel A. Contribution of women to employment growth, 1991-2007 (percentage)
Panel B. Percentage of women among the non-employed, 2007 (percentage)
30
40
50
60
70
80
90
100
20
25
30
35
40
45
50
55
60
65
Advanced Economies
Advanced Economies
Asia & the Pacific
Asia & the Pacific
Central & Eastern Europe
and FormerSoviet Republics
Central & Eastern Europe
and FormerSoviet Republics
Sub-SaharanAfrica
Sub-SaharanAfrica
LatinAmerica
& the Caribbean
LatinAmerica
& the Caribbean
MiddleEast
MiddleEast
NorthAfrica
NorthAfrica

6
World of Work Report 2008: Income Inequalities in the Age of Financial Globalization
Wage shares declined significantly over the expansionary period
Th e past few decades have witnessed a signifi cant change in the capital-labour income distribution (see Gollin, 2002; Krueger, 1999). An analysis of the data collected – for advanced economies, newly industrialized and developing nations alike – reveals that the wage (or labour) share of total income has declined in nearly three quarters of the countries considered. Th e decline occurred in most regions (fi g. 1.4).6 Th e fastest decrease occurred in Latin America (over 13 percentage points) and over a rather short period – 1993 to 2002 – but signifi cant declines were also found in the Advanced Economies and Asia, where wage shares fell over 9 percentage points during the periods 1980-2005 and 1985-2002, respectively. Exceptions to this downward trend are Central and Eastern Europe, the Russian Federation, the Middle East and North Africa where the labour share has fl uctuated but remained constant over the period 1995-2003.
Interestingly, the pattern of the decline has been similar in most countries: wage shares have declined steadily over the past three decades, except in the late 1980s/early 1990s and again in the late 1990s. Secondly, the drop in wage shares was particularly fast in the early 1980s and the early 2000s.
Much of the literature to date confi rms the results presented here, namely that labour’s share of income has been declining steadily over the past few decades. Several studies have tried to examine the factors that may have contributed to this, with a particular emphasis on the eff ects of globalization, including trade and technological change, but no partic-ular consensus has emerged.7 For example, Harrigan and Baladan (1999) found that skill-biased technological change had a greater eff ect on wage shares than the intensifi cation
6. Although the data on wage shares are widely available for OECD countries, considerable eff orts were made to collect data for additional countries in order to obtain a broader view: see Appendix B for a more detailed description of the data sources and calculations. It should be noted that a correction for the self-employed was not possible for all countries involved. Wage shares are, therefore, presented as an index, in order to indicate that the analysis focuses on changes rather than levels.7. See section C of this chapter for a discussion of the relationship between some of these developments and income inequality.
Figure 1.4. Development of wage shares, by region, 1985-2006(Wage share in 2000 = 100)
Source: IILS estimates (see Appendix B for methods, calculations and data sources).
1980 1982 1984 1986 1988 1990 1992 1994 1996 1998 2000 2002 2004 2006
Advanced EconomiesCentral & Eastern Europe and Former Soviet RepublicsAsia
1989 1991 1993 1995 1997 1999 2001 2003
North AfricaSub-Saharan AfricaLatin America and the CaribbeanMiddle East
85
90
95
100
105
110
115
85
90
95
100
105
110
115
7
1. Trends in employment and inequality
of trade did. In the view of Guscina (2006), meanwhile, the decline was due to openness and technological progress, while Jaumotte and Tytell (2007) held that globalization was only one of several factors and that others, including labour market reform, had also con-tributed. Note that these studies do not test for the eff ects of the development of fi nancial markets on wage share (see Chapter 2).
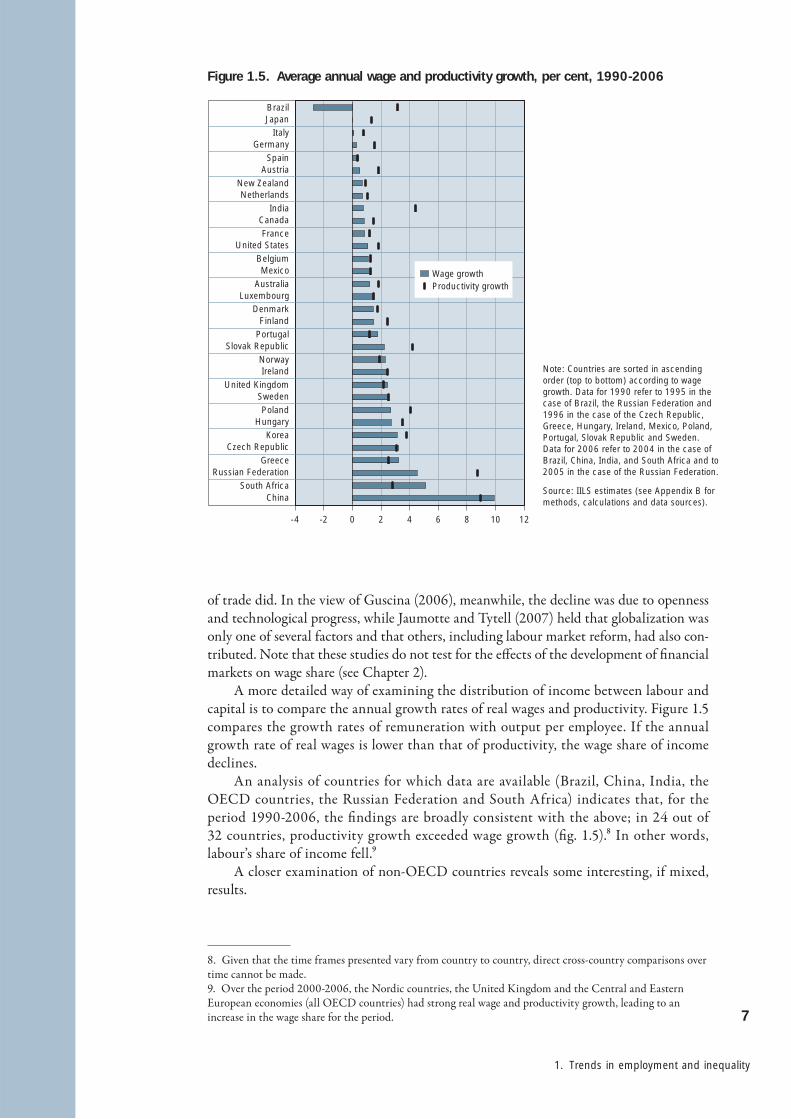
A more detailed way of examining the distribution of income between labour and capital is to compare the annual growth rates of real wages and productivity. Figure 1.5 compares the growth rates of remuneration with output per employee. If the annual growth rate of real wages is lower than that of productivity, the wage share of income declines.
An analysis of countries for which data are available (Brazil, China, India, the OECD countries, the Russian Federation and South Africa) indicates that, for the period 1990-2006, the fi ndings are broadly consistent with the above; in 24 out of 32 countries, productivity growth exceeded wage growth (fi g. 1.5).8 In other words, labour’s share of income fell.9
A closer examination of non-OECD countries reveals some interesting, if mixed, results.
8. Given that the time frames presented vary from country to country, direct cross-country comparisons over time cannot be made.9. Over the period 2000-2006, the Nordic countries, the United Kingdom and the Central and Eastern European economies (all OECD countries) had strong real wage and productivity growth, leading to an increase in the wage share for the period.
Figure 1.5. Average annual wage and productivity growth, per cent, 1990-2006
Note: Countries are sorted in ascending order (top to bottom) according to wage growth. Data for 1990 refer to 1995 in the case of Brazil, the Russian Federation and 1996 in the case of the Czech Republic, Greece, Hungary, Ireland, Mexico, Poland, Portugal, Slovak Republic and Sweden. Data for 2006 refer to 2004 in the case of Brazil, China, India, and South Africa and to 2005 in the case of the Russian Federation.
Source: IILS estimates (see Appendix B for methods, calculations and data sources).China
South AfricaRussian Federation
GreeceCzech Republic
KoreaHungary
PolandSweden
United KingdomIreland
NorwaySlovak Republic
PortugalFinland
DenmarkLuxembourg
AustraliaMexico
BelgiumUnited States
FranceCanada
IndiaNetherlands
New ZealandAustria
SpainGermany
ItalyJapanBrazil
-4 -2 0 2 6 84 10 12
Productivity growthWage growth

8
World of Work Report 2008: Income Inequalities in the Age of Financial Globalization
● China’s performance was among the best in terms of wage and productivity growth for both periods. Moreover, the rate of improvement compared with other countries increased;
● South Africa also experienced a growing wage share and a strong real wage and pro-ductivity growth rate, although to a lesser extent than China;
● Productivity growth in both Brazil and India consistently outpaced wage growth, with the former experiencing negative wage growth over the period 1995-2004.
Th e overall trend over the 1990s and early 2000s is that real wages increased less than productivity, generating a reduction of the wage share in the vast majority of countries considered. Any increase in the wage share that occurred in some OECD countries in the early 2000s did not make up for the decline that took place in the 1990s. In sum, the two diff erent ways of computing changes in the wage share ultimately yield similar results: the wage share declined in nearly three quarters of the countries considered.
B. Trends in income inequality
Th e debate regarding the impact of globalization, and its numerous manifestations, is widely documented (see, for example, Lee, 2008; IMF, 2007). Broadly speaking, deeper international economic integration can raise income levels for all participating coun-tries, albeit aft er a potentially diffi cult transition phase. On the other hand, it is argued that while overall income levels improve, the benefi ts of globalization are not shared equally.
Th ere have been three basic approaches to the assessment of how global income dis-tribution has evolved in the latest era of globalization (World Bank, 2007), involving a consideration of:10
(i) Within-country inequality – this approach takes into account the income distribu-tion within countries using measures such as the Gini index to illustrate the entire income distribution of a country. Recent studies, including this report, fi nd that within-country inequalities have increased over the past two decades or so;
(ii) International inequality – measures diff erences in average incomes across countries. Th ere are no references made to income distribution within each country as it is assumed that people have the mean income of their countries. According to some recent studies, international income inequality has tended to decline. Th is largely refl ects the trend increase in per capita income in emerging economies like China and India;
(iii) Global inequality – an approach that takes into account both within- and between-country income inequalities.11 According to this approach, income diff erences among all individuals in the world are considered, irrespective of the country of residence of the individuals.12
10. See also, for example, Capéau and Decoster, 2004 and Milanovic, 2005a and 2005b for a discussion of trends in world income inequalities.11. Household budget surveys are used to measure income shares to calculate a precise image of within country inequality. Th en, each income share is weighted by the GDP per capita of the country considered in order to calculate the mean income for each income class.12. Over the past few decades, conclusions regarding global income distribution have varied according to the approach taken, with no clear consensus emerging on trends or magnitude (see Anand and Segal, 2008; World Bank, 2007; and Chapter 2 of this report).

9
1. Trends in employment and inequality
A distinction also needs to be made between income inequality and wealth inequality. Income refers to fl ows, while wealth refers to stocks. As wealth depends on the accumu-lation of income fl ows, it is therefore determined by savings behaviour, levels of income such as labour income and fi nancial income (arising from interest returns, capital gains and dividends), taxes and inheritance.13 In this chapter, only the within-country income inequality approach will be considered.14 Measurement issues are discussed in box 1.1.
Rising income inequality since the early 1990s
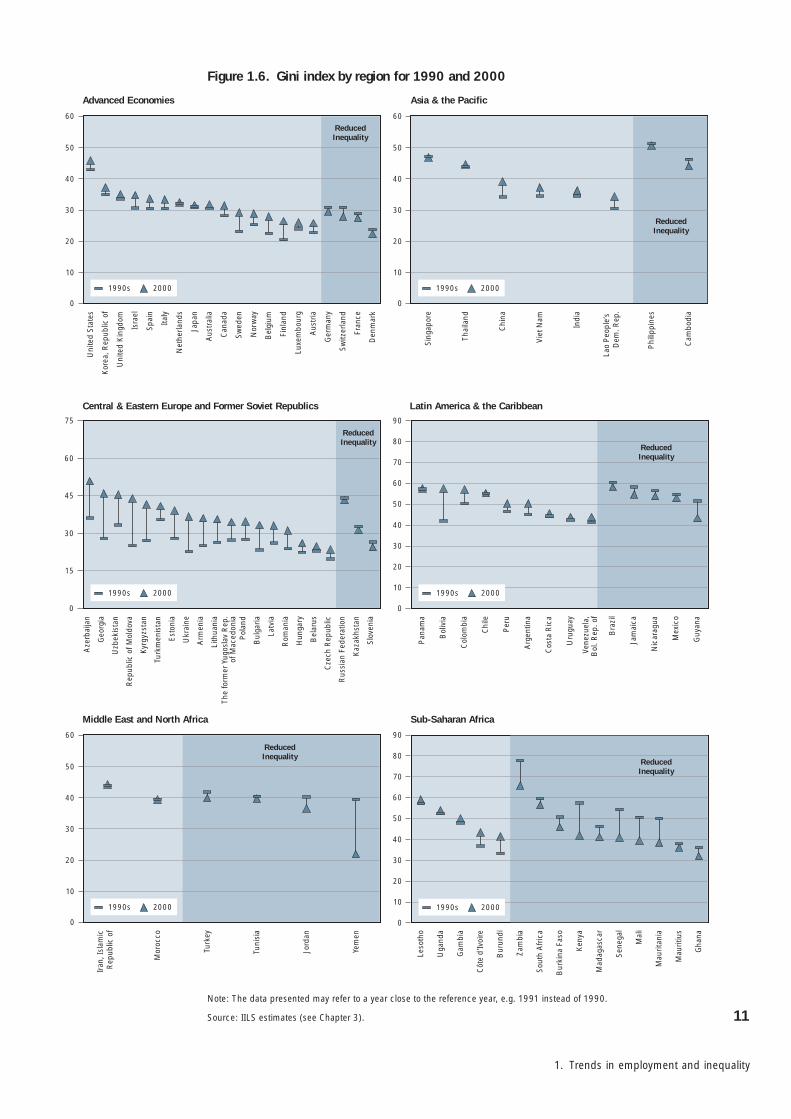
Th e period 1990-2000 off ers the most comprehensive snapshot of income inequality and patterns over time by region and country. Over this period, more than two thirds of the 85 countries for which data are available experienced an increase in income inequality, as measured by changes in the Gini index (fi g. 1.6). Th e few reductions were principally concentrated in Sub-Saharan Africa and the Middle East. However, within these regions, especially the former, the levels of inequality remain high.
Other notable developments in income inequality by region include:
● Advanced Economies: only Denmark, France, Germany and Switzerland recorded declines in income inequality, while the largest increases occurred in Belgium, Fin-land and Sweden. Generally, levels of income inequality remained low compared to other regions, although in the Republic of Korea, the United Kingdom and the United States, which have the highest levels in the region, they are almost as high as the highest levels in other regions;
● Asia and the Pacifi c: modest declines in the Gini index occurred only in Cambodia and the Philippines, where income inequality remains nonetheless among the highest in the region. China and Laos recorded substantial increases over the period 1990-2000;
● Central and Eastern Europe and Former Soviet Republics: there were noticeable increases in income inequality everywhere except the Russian Federation, Kazakhstan and Slovenia, where reductions were recorded, although the former continues to have one of the highest levels within the region;
● Latin America and the Caribbean: mixture of countries with rising and falling income inequality, with Bolivia and Colombia recording the largest increases and Guyana the largest decline. Guyana now has the lowest level of income inequality in the region and Panama the highest;
● Middle East and North Africa: among the few countries for which data were available, there were only moderate changes (in either direction), as income inequality remained close to levels present in the early 1990s. Only Yemen, and to some extent Jordan, expe-rienced noteworthy reductions in income inequality, with the former posting one of the most signifi cant declines found in any of the regions;
● Sub-Saharan Africa: nearly two thirds of the countries for which data are available saw reductions in income inequality, but levels remain among the highest worldwide.
13. While the two are highly correlated – typically, the distribution of wealth within countries is more unequal than the distribution of income – it is asset inequality that has the more profound and more direct consequences for economic growth. Social outcomes, however, are more directly aff ected by income inequality so public policies usually focus on income rather than on wealth (see section C of this chapter).14. Wealth inequality, the resulting fi nancial market problems and the consequences for economic growth will be discussed in Chapter 2.
10
World of Work Report 2008: Income Inequalities in the Age of Financial Globalization
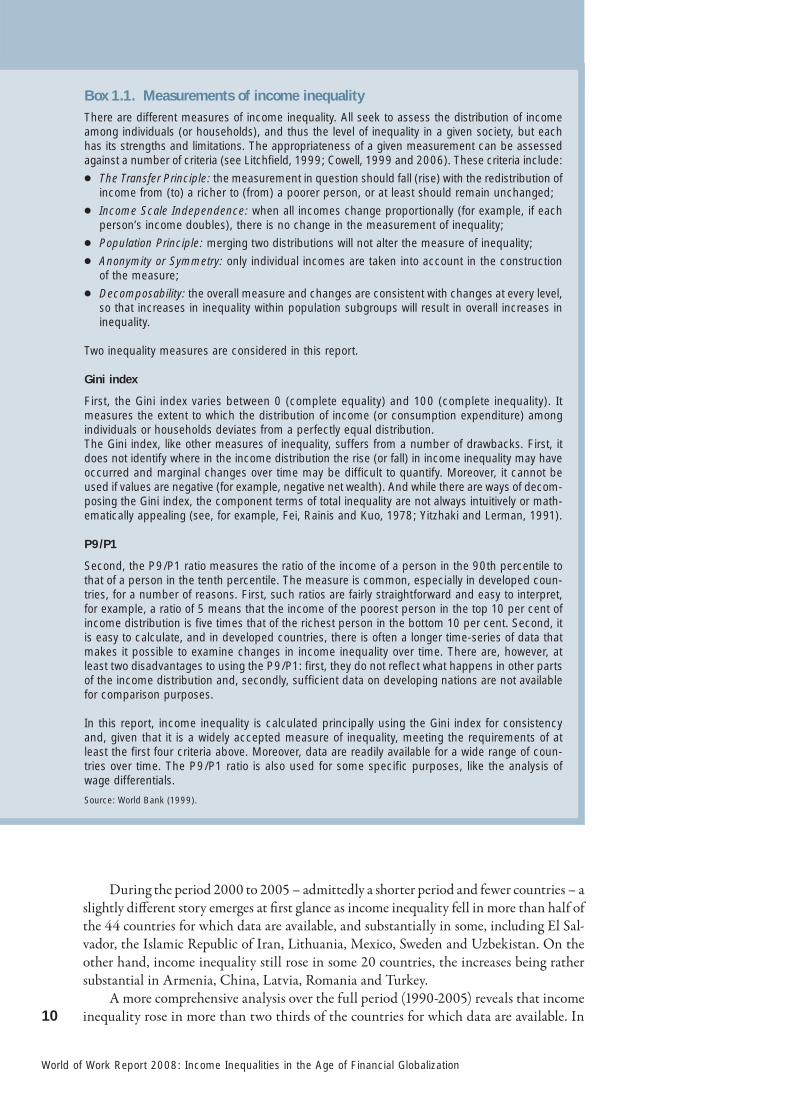
Box 1.1. Measurements of income inequalityThere are different measures of income inequality. All seek to assess the distribution of income among individuals (or households), and thus the level of inequality in a given society, but each has its strengths and limitations. The appropriateness of a given measurement can be assessed against a number of criteria (see Litchfield, 1999; Cowell, 1999 and 2006). These criteria include:
● The Transfer Principle: the measurement in question should fall (rise) with the redistribution of income from (to) a richer to (from) a poorer person, or at least should remain unchanged;
● Income Scale Independence: when all incomes change proportionally (for example, if each person’s income doubles), there is no change in the measurement of inequality;
● Population Principle: merging two distributions will not alter the measure of inequality;
● Anonymity or Symmetry: only individual incomes are taken into account in the construction of the measure;
● Decomposability: the overall measure and changes are consistent with changes at every level, so that increases in inequality within population subgroups will result in overall increases in inequality.
Two inequality measures are considered in this report.
Gini index
First, the Gini index varies between 0 (complete equality) and 100 (complete inequality). It measures the extent to which the distribution of income (or consumption expenditure) among individuals or households deviates from a perfectly equal distribution. The Gini index, like other measures of inequality, suffers from a number of drawbacks. First, it does not identify where in the income distribution the rise (or fall) in income inequality may have occurred and marginal changes over time may be difficult to quantify. Moreover, it cannot be used if values are negative (for example, negative net wealth). And while there are ways of decom-posing the Gini index, the component terms of total inequality are not always intuitively or math-ematically appealing (see, for example, Fei, Rainis and Kuo, 1978; Yitzhaki and Lerman, 1991).
P9/P1
Second, the P9/P1 ratio measures the ratio of the income of a person in the 90th percentile to that of a person in the tenth percentile. The measure is common, especially in developed coun-tries, for a number of reasons. First, such ratios are fairly straightforward and easy to interpret, for example, a ratio of 5 means that the income of the poorest person in the top 10 per cent of income distribution is five times that of the richest person in the bottom 10 per cent. Second, it is easy to calculate, and in developed countries, there is often a longer time-series of data that makes it possible to examine changes in income inequality over time. There are, however, at least two disadvantages to using the P9/P1: first, they do not reflect what happens in other parts of the income distribution and, secondly, sufficient data on developing nations are not available for comparison purposes.
In this report, income inequality is calculated principally using the Gini index for consistency and, given that it is a widely accepted measure of inequality, meeting the requirements of at least the first four criteria above. Moreover, data are readily available for a wide range of coun-tries over time. The P9/P1 ratio is also used for some specific purposes, like the analysis of wage differentials.
Source: World Bank (1999).
During the period 2000 to 2005 – admittedly a shorter period and fewer countries – a slightly diff erent story emerges at fi rst glance as income inequality fell in more than half of the 44 countries for which data are available, and substantially in some, including El Sal-vador, the Islamic Republic of Iran, Lithuania, Mexico, Sweden and Uzbekistan. On the other hand, income inequality still rose in some 20 countries, the increases being rather substantial in Armenia, China, Latvia, Romania and Turkey.
A more comprehensive analysis over the full period (1990-2005) reveals that income inequality rose in more than two thirds of the countries for which data are available. In
11
1. Trends in employment and inequality
Note: The data presented may refer to a year close to the reference year, e.g. 1991 instead of 1990.
Source: IILS estimates (see Chapter 3).
Figure 1.6. Gini index by region for 1990 and 2000U
nite
d St
ates
Kor
ea, R
epub
lic o
f
Uni
ted
Kin
gdom
Isra
el
Spai
n
Net
herl
ands
Jap
an
Aus
tral
ia
Can
ada
Swed
en
Nor
way
Bel
gium
Finl
and
Luxe
mb
ourg
Aus
tria
Ger
man
y
Switz
erla
nd
Fran
ce
Den
mar
k
Ital
y
0
10
20
30
40
50
60
Advanced Economies
20001990s
ReducedInequality
20001990s
ReducedInequality
0
10
20
30
40
50
60
20001990s
ReducedInequality
Asia & the Pacific
Sing
apor
e
Thai
land
Chi
na
Viet
Nam
Indi
a
Lao
Peo
ple’
s D
em. R
ep.
Phi
lippi
nes
Cam
bod
ia
0
10
20
30
40
50
60
20001990s
ReducedInequality
Central & Eastern Europe and Former Soviet Republics Latin America & the Caribbean
Sub-Saharan AfricaMiddle East and North Africa
0
15
30
45
60
75
Aze
rbai
jan
Geo
rgia
Uzb
ekis
tan
Rep
ublic
of M
oldo
va
Kyr
gyzs
tan
Turk
men
ista
n
Est
onia
Ukr
aine
Arm
enia
Lith
uani
aTh
e fo
rmer
Yug
osla
v R
ep.
of M
aced
onia
Pol
and
Bul
gari
a
Latv
ia
Rom
ania
Hun
gary
Bel
arus
Cze
ch R
epub
lic
Rus
sian
Fed
erat
ion
Kaz
akhs
tan
Slov
enia
0
10
20
30
40
50
60
70
80
90P
anam
a
Bol
ivia
Col
ombi
a
Chi
le
Per
u
Arg
entin
a
Cos
ta R
ica
Uru
guay
Vene
zuel
a,B
ol. R
ep. o
f
Bra
zil
Jam
aica
Nic
arag
ua
Mex
ico
Guy
ana
0
10
20
30
40
50
60
70
80
90
20001990s
20001990s
Leso
tho
Uga
nda
Gam
bia
Côt
e d'
Ivoi
re
Bur
undi
Zam
bia
Sou
th A
fric
a
Bur
kina
Fas
o
Ken
ya
Mad
agas
car
Sen
egal
Mal
i
Mau
rita
nia
Mau
ritiu
s
Gha
na
Iran
, Isl
amic
Rep
ublic
of
Mor
occo
Turk
ey
Tuni
sia
Jord
an
Yem
en
ReducedInequality
ReducedInequality

12
World of Work Report 2008: Income Inequalities in the Age of Financial Globalization
approximately half those countries, income inequality increased in both 2000 and 2005 (fi g. 1.7). In approximately another one third, any decline that occurred in the most recent period – albeit over a shorter time – was not enough to off set the increases that occurred over the 1990s. Only in a few countries (fewer than one third of the total), including for example Brazil, Burkina Faso and Mexico, were overall improvements to income inequality recorded.
Increasing wage gap between high- and low-wage earners
Th e wage gap between the highest 10 per cent and lowest 10 per cent earners has also tended to increase. An examination of existing data for OECD countries and microdata for Brazil, China and India reveals that inequality has risen in 18 of the 27 countries since the early 1990s for which data are available.15 Th e highest wage dispersion occurred in Brazil, China, India and the United States and the lowest in Belgium and the Nordic countries (fi g. 1.8).16
Over the past two decades, large increases have occurred in Hungary, Poland, Portugal and the United States, where the ratio is now near or above 4, but also, interestingly, in devel-oping countries and in countries that have low inequalities overall such as the Nordic coun-tries. Such a development in these countries, where low inequality is seen as a major element of social cohesion, provides an illustration of the trend toward increasing inequalities.
While some countries experienced overall declines, only in Belgium, France, Spain and Switzerland did the ratio fall more or less consistently over time. It is important to note, however, that most decreases took place for countries with short time-series data,
15. See Appendix B for methods and calculations.16. See Section B of this Chapter for evidence regarding the ratio of executive pay to average wages in a number of countries.
Panel A. Countries with increases in 2000 and 2005
OverallImprovement
Panel B. Countries with declines in 2000-2005
10
20
30
40
50
20001990s 2005
Chi
na
Cos
ta R
ica
Uni
ted
Stat
es
Vene
zuel
a,B
ol. R
ep. o
f
Uru
guay
Turk
ey
Arm
enia
The
form
er Y
ugos
lav
Rep
. of M
aced
onia
Latv
ia
Pol
and
Rom
ania
Kaz
akhs
tan
Bul
gari
a
Ger
man
y
Hun
gary
Cze
ch R
epub
lic
20001990s 2005
10
20
30
40
50
60
70
Bra
zil
Chi
le
Arg
entin
a
Rep
ublic
of M
oldo
va
Kyr
gyzs
tan
Uzb
ekis
tan
Est
onia
Aus
tral
ia
Lith
uani
a
Finl
and
Swed
en
Bel
arus
Mex
ico
Gam
bia
Bur
kina
Fas
o
Iran
, Isl
amic
Rep
. of
Slov
enia
Figure 1.7. Changes in Gini index between 1990 and 2005
Notes: The data presented may refer to a year close to the reference year, e.g. 2001 instead of 2000, and 2005 may refer to the most recent year available, for example, 2004.
Source: IILS estimates (see Chapter 3).

13
1. Trends in employment and inequality
Note: Data for Brazil (1992, 1999 and 2004), China (2001 and 2005) and India (1990 and 1999) refer to specific years only, not a full time series and refer to salaried employment.
Source: IILS estimates.
Figure 1.8 Ratio of earnings of top 10 per cent earners vis-à-vis bottom 10 per cent earners, 1990-2006
2.01990 1992 1994 1996 1998 2002 2004 2006
3.0
4.0
5.0
6.0
2.01990 1992 1994 1998 2000 2002 2004 2006
3.0
4.0
5.0
6.0
1.01990 1992 1994 1996 1998 2002 2004 2006
2.0
3.0
4.0
5.0
2.01990 1992 1994 1998 2000 2002 2004 2006
2.5
3.0
4.0
3.5
4.5
1.01990 1992 1994 1996 1998 2000 2002 2004 2006
2.0
3.0
4.0
5.0
0.01990 1992 1994 1996 1998 2000 2002 2004 2006
2.0
4.0
6.0
8.0
10.0
12.0
Republic of Korea
United States
Germany
Switzerland
Belgium
Spain
Finland
France
Brazil
China
India
United Kingdom
CanadaIreland
Japan
Australia
New Zealand
Portugal
Netherlands
Sweden
PolandCzech Republic
Austria
Norway
Hungary
Italy
Denmark

14
World of Work Report 2008: Income Inequalities in the Age of Financial Globalization
such as Belgium, Spain and Switzerland, or with series breaks, such as Canada and Fin-land.17 In fact, Canada, Finland, Ireland and the Republic of Korea have seen signifi cant increases in the ratio since the mid- to late-1990s.
More generally, the late 1990s are characterized by a marked increase in the wage gap between the top and bottom wage earners. Th e section on executive pay (see below), seems to suggest that the income of the top earning deciles grew much faster than that of the medium or bottom earnings deciles.
A comparison of changes over the 1990s and 2000s (using the Gini index) and wage gaps (using the P9/P1 ratio) can provide valuable information on the consistency of within-country income inequality measures. In particular, the P9/P1 ratio may help explain changes in the Gini index, since the former provides information regarding the gap between the extreme two deciles and the latter a summary of overall inequality.
Such a comparison shows that changes in the Gini index and P9/P1 ratio are con-sistent in most countries: movements in the P9/P1 (gap between the upper and lower wage earners) correspond with movements in the Gini index (overall income inequality). Of course, this does not mean that the P9/P1 ratio explains the dynamic of changes in the Gini, but there is some coherence between the movements (in the same direction) of both measures. For example: in France and Switzerland, there was a drop in both the Gini and the P9/P1 ratio in the 1990s; the large increases in the Gini and the P9/P1 ratio in Fin-land and Sweden during the 1990s were also consistent with each other. Th e small increase in inequality in the Republic of Korea, the United Kingdom and the United States in the 1990s was in line with the small increase in the P9/P1 ratio over that period. Th e same applies to the newly industrialized economies; large increases in overall income inequality in China in the early 2000s and in India in the 1990s are consistent with an increasing gap between the upper and lower wage distribution; and in Brazil, the small drop in the Gini index was accompanied by a reduction in the P9/P1 ratio during the 1990s and 2000s.
Rising income inequality between executives and average employees
Th e rise in executive pay, which is sometimes regarded as a driver of income inequality, has attracted considerable attention over the past few years but especially so in the context of the recent fi nancial crisis.18,19
Th is is an issue which needs to be treated in a dispassionate manner, avoiding informed perceptions. Indeed, the job of executives – the top managers of fi rms – has become more diffi cult owing to the fact that the market conditions under which fi rms operate have become more volatile. Enterprises are under increasing pressure to seize the opportunities of globalization and new technology. Th e gains from seizing those opportunities can be large indeed. Th e losses from failing to adapt can also be signifi cant, however, while the new technology and new forms of work organization being introduced by fi rms make the task of managers more complex. Th ese trends explain why fi rms are increasingly focusing on performance in determining executive pay.
Cross-country studies in this area are, however, diffi cult for a number of reasons, including variations in accounting and disclosure practices. Moreover, comparisons
17. In Finland, the P9/P1 decreased over the period 1980-2006 because of a series break between 1990 and 1994. Over the period 1994-2005, it increased from 2.3 to 2.4. In Canada a break came in 1994 and the index dropped from 4 to 3.5. Canada also experienced an increase in P9/P1 over the late 1990s and early 2000s. 18. Th roughout this section, the term “executive” refers to both CEOs and lower-level executives. 19. Shields (2005) provides an interesting analysis in this respect. He shows how companies affi liated to the Business Council of Australia constantly criticize the lack of competitiveness of the Australian workforce, while at the same time, their own executive pay is on the rise.

15
1. Trends in employment and inequality
through time are hampered by methodological changes in the way executive pay is calcu-lated and/or disclosed (box 1.2). With these caveats in mind, the purpose of this section is to examine the patterns of executive pay in some of the countries for which such data are available, namely Australia, Germany, Hong Kong (China), the Netherlands, South Africa and the United States.20
What is executive pay and how is it measured?
Executive pay includes various components. First, there is a fi xed component, which may be regarded as the basis of the compensation package and includes salary and certain ben-efi ts and allowances in kind, including the private use of company cars, aircraft , fi nancial counselling and home security.21
Second, there is oft en a variable component that is either accorded on a discretionary basis or based on previously defi ned performance criteria.22 Th ese are based on individual, business unit or corporate performance and may include thresholds or ceilings limiting the amount of payment involved (Lynch and Perry, 2003).23 Long-term variable compen-sation is typically based on certain performance criteria established in advance and oft en linked to a company’s stock in order to create incentives for greater shareholder value. Th ese can include a combination of stocks, restricted stock, stock options and stock appre-ciation rights.24
Th ird, companies oft en have a pension programme in place, either specifi cally designed for executives or open to a wider range of employees. In the United States, a certain part of the compensation is oft en deferred until the executive reaches retirement age.
Finally, many companies provide termination benefi ts for executives, either as a lump sum or in the form of continued payment of compensation aft er the expiry of a contract. Th e termination clauses may preclude payment if the termination of the contract is caused by the executive, in the event of unilateral termination of contract, for example, or as the result of a serious fault of the executive.
Refl ecting on these methodological issues (box 1.2), it is diffi cult to compare execu-tive pay across countries. To remedy this, it would be useful to develop a uniform way of calculating the value of the diff erent components of share-based compensation. Th is, how-ever, goes beyond the scope of this report. Rather, the purpose here is to provide a snap-shot of executive compensation and how it has evolved, over time, and in comparison with the average wage.
20. See Ebert, Papadakis and Torres (2008) for a more detailed analysis of executive pay.21. Certain companies also provide reimbursement for tax liabilities. Th e determination of fi xed compensation is usually based on “competitive benchmarking”, involving a general salary survey and detailed analysis of specifi c industries or market peers. See Murphy (1999) for criticism and further comments.22. Th e term “bonus” is misleading in this respect, as demonstrated by the disclosure practices in the United States. Prior to 2007, “bonus” referred to payments for predetermined targets, but it now means discretionary payment by the board.23. Criticism in some countries, for instance in the United Kingdom, has focused on the fact that bonus targets frequently remain unpublished. Further, Bruce et al. (2007) draw attention to an increasingly complex structure of bonus targets that is linked to higher bonus pay but not to higher shareholder return.24. Stocks refer to a specifi c number of shares, the value of which rises with the value of the stock; restricted stock refers to shares distributed to executives on the basis of performance or seniority; stock options to the right to purchase a certain number of shares at a predetermined price (the “exercise price”) for a specifi ed period of time; and stock appreciation rights refer to the right to receive payment in cash determined in line with the appreciation of the stock price.

16
World of Work Report 2008: Income Inequalities in the Age of Financial Globalization
Executive pay, excluding share-based compensation, exceeds average wages by a factor of at least 50 and, in some cases, 180
An examination of executive pay in 2007 for the 15 largest companies in six selected countries shows that chief executive offi cers (CEOs) earn, on average, between 71 and 183 times more than the average employee (table 1.1).25 Th e highest-paid CEOs are in the United States, where average pay exceeds US$ 10 million per year, or about 183 times
25. Available at: http://www.forbes.com/2008/04/02/worlds-largest-companies-biz-2000global08-cx_sd_0402global_land.html.
Box 1.2. Measurement of executive pay: methodological issuesDisclosure practices
Disclosure practices differ widely across countries. While some countries, including France, the Netherlands, the United Kingdom and the United States require companies to report detailed compensation data in a remuneration report, others like Greece, have no specific requirements. In some cases, such as France, Germany and the Netherlands, disclosure practices were ini-tially governed by codes of best practice but were transformed into legal provisions, since the compliance by firms was considered unsatisfactory (European Corporate Governance Institute, 2003 and Rang, 2008).
In addition, many regulatory provisions are vague, so companies in such countries as Brazil, Ger-many, Japan and Mexico frequently report only aggregate data on executive compensation. Even in Germany, where companies have been required to provide detailed individual data on execu-tive compensation since 2006, this “requirement” can be overturned by two thirds of share-holders. In some countries, executives seem to consider the disclosure of the precise amount of remuneration to be a risk to their personal safety (Leal and Carvalhal da Silva, 2005).
Stock options and share-based compensation
One of the principal difficulties associated with measuring executive compensation is to quantify the actual or prospective value of share-based compensation. Even in countries where disclo-sure of stock options is prescribed by national regulation, a specific methodology for calculating this value is seldom laid down. As a result, in France, South Africa and the United Kingdom, companies often disclose the number of the shares or options granted but without putting a value on them. Even where a value has been calculated, the methodology can vary. For example, companies in many countries calculate the value of share-based compensation at the time that it was granted, whereas in others they calculate the value of stock awards and options that have actually been exercised.
The situation is further complicated by the fact that there are also different methodologies for calculating the value of share-based compensation at the date on which it is granted. The most common method for calculating the cost to a company is the Black-Scholes model, which esti-mates the value of a stock option upon exercise. Whatever the model used by individual com-panies, it should be noted that, in the majority of the countries reviewed for the purposes of this study (principally Australia, France, Germany, Hong Kong (China), the Netherlands, South Africa and the United Kingdom), the regulations rarely lay down a specific method of calculation. As a result, calculations of the value of share-based compensation vary not only across countries but also across companies within the same country.
In addition, there are problems inherent in all the existing models used to calculate share-based compensation. For example, among other drawbacks, they do not take into account the fact that stock options may be cancelled if an executive leaves the company, with the result that they overstate the cost of the options for the company. Furthermore, the Black-Scholes model assumes that the stock options will be exercised upon expiration of the options. But in practice, executives may be free to exercise their options at any time between the vesting and the expiry of the options (see Hall and Murphy, 2000; Murphy, 1999). A recent study of stock options in Australia estimates that the average value at grant date ascribed to stock options amounted to only 26 per cent of the value of stock options actually exercised (Institutional Shareholder Services Australia, 2006).

17
1. Trends in employment and inequality
the wage of the average American worker. And while CEOs in Hong Kong (China) and South Africa, for example, are paid much less than their US counterparts, their com-pensation still represents between 160 and 104 times the wage of the average worker in these countries. Even average executives earn between 43 and 112 times as much as average employees.
It is also interesting to note that the diff erence between CEO and average executive compensation varies signifi cantly across countries. For example, in Australia and Hong Kong (China), CEOs earn 100 per cent more than the average executive, while they earn over 60 per cent more in Germany, the Netherlands and the United States and 50 per cent more in South Africa.
Th ese estimates must, however, be considered with some caution. Given that the exec-utive pay tends to rise with fi rm size, the magnitude of pay diff erences between executives (of the 15 largest companies) and employees may therefore have been overestimated.26 On the other hand, data presented in table 1.1 excludes share-based remuneration to enable cross-country comparisons. It is likely that, if share-based remuneration and other vari-able compensation – which can represent a sizeable percentage of total compensation – is included, the true diff erence in compensation between executives and employees has been underestimated. For example, in the United States and the Netherlands, the variable com-ponent (oft en linked to fi rm performance) represents a signifi cant percentage of overall compensation.
The gap between executive and employee pay has grown over time: cases of the United States and the Netherlands
An attempt has been made to obtain data on changes in executive pay, including share-based compensation, between 2003 and 2007 in the 15 largest companies in two coun-tries, the Netherlands and the United States.27 Th e choice of countries was determined mainly by the objective of comparing developments in two countries with diff erent cor-porate governance traditions and diff erent institutional frameworks. For example, unlike
26. According to theory (Murphy, 1999); and as confi rmed by empirical research in various countries, including the United States (Tosi et al., 1998), Australia (Merhebi et al., 2006), Portugal (Fernandes, 2008) France (Dardour, 2008) and Germany (albeit not consistently, according to Haid and Yurtoglu (2006); Rang 2006), executive pay increases with company size.27. In the event that companies were not listed on the national stock exchange or did not provide comparable data, it was decided to include, instead, the next biggest company on the list.
Table 1.1. Executive pay, 2007
CEO Average executive
Pay in US$(annual
average in millions)
Pay as a ratio of average employee
wages
Pay in US$(annual
average in millions)
Pay as a ratio of average employee
wages
Australia 6.0 135 2.4 53
Germany 6.8 148 3.8 82
Hong Kong 2.7 160 1.1 63
Netherlands 3.6 71 2.2 43
South Africa 1.4 104 0.9 71
United States 10.3 183 6.3 112
Source: IILS estimates based on the annual reports of 15 of the largest companies in the respective countries.

18
World of Work Report 2008: Income Inequalities in the Age of Financial Globalization
the United States, the Netherlands is a relatively small country, whose companies employ a two-tier governance system. Elements that have long been inherent in executive com-pensation in the United States, such as comprehensive disclosure of compensation and the frequent use of share-based compensation, have emerged only relatively recently in the Netherlands (see De Jong et al, 2005; Duffh ues and Kabir, 2008).
It was possible to obtain data on share-based compensation in both countries. How-ever, unlike the companies in the United States, various Dutch companies did not provide the information necessary for the share-based calculation according to the Black-Scholes model (see box 1.2). Th e value of stock awards and stock options was therefore determined by calculating the value of the stock awards vested in the year of the annual report and the stock options actually exercised in that year. Any direct comparison between the two countries, in this respect, should, therefore, be made with some caution.
United StatesThe real average pay of American CEOs, including share-based compensation, rose from over US$ 16 million per year in 2003 to nearly US$ 24.5 million in 2007. Th is increase – nearly 10 per cent per year on average – far exceeded that of 2.5 per cent for other executives and 0.7 per cent for employees (fi g. 1.9, panel A).
Including share-based compensation, therefore, accentuates the gap between CEO compensation and average salaries. In 2007, US CEOs earned more than 521 times the average employee, as against 370 times four years earlier (fi g. 1.9, panel B). When share-based compensation is included, CEOs also earned nearly twice as much as average execu-tives in 2007, compared to one and a half times as much in 2003.
Clearly, variable compensation represents an important contribution to overall remu-neration. In fact, an analysis of the principal components of compensation reveals that, in 2007, variable compensation (share-based and variable in cash) constituted nearly 90 per cent or more of total compensation for CEOs and average executives in the United States. Furthermore, share-based compensation was the dominant component of total compensation, constituting more than 60 per cent for CEOs and 50 per cent for average executives.
A quantitative analysis of the compensation components provides additional inter-esting insights with respect to the evolution of variable compensation. For example, from 2003 to 2007, the salary component of CEOs and executive managers rose at similar
Panel A. Average annual increase in pay by category of employee, adjusted for inflation, per cent
Panel B. Ratio of CEO compensation to average employee wages
CEO Average executive Average employee 2003 2005 2007
9.7
3.5
0.7
369
440
521
0
2
4
6
8
10
12
0
200
400
600
Figure 1.9. Evolution of executive pay versus average employee wages in the United States, 2003-2007
Source: IILS estimates based on the annual reports of 15 of the largest companies in the United States.

19
1. Trends in employment and inequality
rates of around 20 per cent (table 1.2). For CEOs, however, variable compensation in cash increased roughly 45 per cent and share-based compensation 70 per cent, whereas, for the average executive, variable compensation in cash declined and share-based compensation increased 48 per cent. Deferred payments such as pension rights rose more than 200 per cent between 2003 and 2007 for both CEOs and average executives, but such payments represent only a small share of overall remuneration (less than 4 per cent in both cases).
Thus, not only is there an increasing gap in pay between CEOs and employees (including other executives) in the United States, but variable compensation accounts for a signifi cant, and growing share of this diff erence.
NetherlandsTh e real average pay of Dutch CEOs, including share-based compensation, tripled from over US$ 2 million per year in 2003 to over US$ 6 million in 2007. Th e increase – over 30 per cent per annum on average – marginally exceeded the growth in average execu-tive pay (25 per cent) but clearly dwarfed the growth in average employee remuneration of 0.6 per cent per annum (fi g. 1.10, panel A). As a result, in 2007 Dutch CEOs earned over 100 times more than the average Dutch employee, compared to 50 times in 2003 (fi g. 1.10, panel B). Th e gap between CEOs and other executives was far less dramatic: Dutch CEOs earned only 1.9 times more than the average executive in 2007, up from 1.4 in 2003.
Table 1.2. Increase in executive pay components, United States, 2003-2007, per cent
Salary and perquisites
Variable compensation
in cash
Share-based compensation
Deferred payment
CEO pay 20 45 70 294
Executive pay 18 -0.9 48 227
Source: ILS estimates based on the annual reports of 15 of the largest companies in the United States.
Figure 1.10. Evolution of executive pay versus average employee wages in the Netherlands, 2003-2007
Source: IILS estimates based on the annual reports of 15 of the largest companies in the Netherlands.
Panel A. Average annual increase in pay by category of employee, adjusted for inflation, per cent
Panel B. Ratio of CEO compensation to average employee wages
CEO Average executive Average employee 2003 2005 2007
30.7
25.3
0.6
53.1
71.8
102.7
0
40
0
120
30
20
10
20
40
60
80
100

20
World of Work Report 2008: Income Inequalities in the Age of Financial Globalization
In the Netherlands, executive compensation has also undergone some interesting developments in recent years as regards the composition of compensation. Th e relation between fi xed and variable remuneration in Dutch compensation packages has tradition-ally been diff erent from the corresponding packages in US and UK companies, in that basic salary constitutes the most important component of compensation. However, the share of variable compensation is increasing in importance.
Fixed compensation, which comprised more than 70 per cent of both CEO and average executive compensation packages in 2003, fell to 61 per cent and 57 per cent, respectively, in 2007. Interestingly, this is mainly due to developments in share-based com-pensation – a fairly recent phenomenon, in the Netherlands – which increased by more than 5000 per cent for CEOs and more than 3700 per cent for average executives between 2003 and 2007, albeit from relatively low levels (table 1.3). In fact, while share-based com-pensation played only a marginal role in 2003, it constituted about one third of the com-pensation package for both CEOs and executives in 2007.28
Looking forward: potential impact of food and commodity price hikes
While some developments in the global economy have clearly benefi ted those in the highest income brackets, others have made the poorest worse off . Th is is particularly the case of rising food and commodity prices – particularly fuel prices. Th ese increases are part of a general infl ationary trend of prices for raw materials, partly linked to increasing demand for food and fuel from newly industrialized economies such as China. Declining stocks of crude oil and disappointing harvests have also contributed to the infl ationary pressure. Other factors, including, speculation in fi nancial markets and changing consumption pat-terns, are also likely to be contributing to rising food and commodity prices.
Th e peculiarity of food and fuel is that they have virtually no substitutes. An increase in their price does not, therefore, generate a large decrease in consumption, so any increase in food prices aff ects households’ purchasing power. Moreover, low-income households are likely to be more adversely aff ected, in that they spend a large proportion of their income on such goods, as illustrated by the examples of India and the United States.
In India, since 2006, food prices have grown by 9 per cent, compared with 6.3 per cent for non-food prices. Th is is predicted to have a negative eff ect on the purchasing power of all urban households (fi g. 1.11). Th e only exception, of course, is those households
28. It should be noted that even before 2005 many Dutch companies had share-based incentive programmes in place. However, as share-based compensation is a relatively recent phenomenon in the Netherlands, numerous stock awards and options had not, in 2007, yet vested. In addition, various share-based compensation programmes gave only limited value, as stock prices were relatively low at that time.
Table 1.3. Increase in executive pay components, Netherlands, 2003-2007, per cent
Salary and perquisites
Bonus Share-based compensation
Deferred payment
CEO pay 50 174 5391 8
Average executive pay 35 163 3706 -9
Source: IILS estimates based upon on the annual reports of 15 of the largest companies in the Netherlands.

21
1. Trends in employment and inequality
All households
Richest households(over 1925 Rupees)
1500-1925
1120-1500
915-1120
775-915
665-775
575-665
500-575
425-500
350-425
300-350
Poorest households(less than 300 Rupees)
0 1 2 3 4 5 6
0 0.1 0.2 0.3 0.4 0.5 0.6 0.7 0.8
All
Q5
Q4
Q3
Q2
Q1
Percentage points by income quintile(Q1 poorest quintile)
that produce food and benefi t from the increase in food prices – but this is less likely in urban areas than rural ones.
Food price infl ation aff ects those who spend a larger proportion of their income on food, in particular poorer households. For example, the poorest households in urban India experienced an estimated drop in purchasing power of over fi ve per cent, while the richest in urban areas in 2007 experienced only a drop of 2.2 per cent.29
Over the period 1999-2007, fuel price infl ation in the United States was, on average, four times the infl ation in the general consumer price index. In fact, over the most recent period – 2003 to 2007 – the price of fuel grew six times faster than the consumer price index. Th e most recent price increase in 2007, amounting to 7 per cent, adversely aff ects the poorest households (fi g. 1.12). In particular, the poorest 20 per cent of households will see an estimated drop in their purchasing power nearly four times greater than that in the richest households, owing to the fact that they spend a larger fraction of their net income on fuel: 11 per cent, as against 2.5 per cent.30
29. An analysis of food price elasticities in India confi rms that food is considered a necessity. In other words, price elasticities are lower than 1 and close to zero: 0.13 and 0.17 for rural and urban areas respectively.30. Fuel price elasticities in the United States are also lower than 1 (necessity), being on average equal to 0.27 across households over the period 2003-2007.
Note: Y-axis refers to monthly per capita expenditures (in Rupee).
Source: IILS estimates based on Household Expenditure Survey, India.
Source: IILS estimates based on consumer expenditure survey (US Bureau of Labor Statistics).
Figure 1.11. Estimated decline in purchasing power of Indian urban households resulting from rising food prices, 2007 (percentage points)
Figure 1.12. Estimated decline in purchasing power of households in the United States resulting from rising fuel prices, 2007
22
World of Work Report 2008: Income Inequalities in the Age of Financial Globalization
C. Why is income inequality a matter of policy concern?
Rising inequalities, as documented in the previous sections, can be a sign of robust eco-nomic growth, as some members of society get ahead, work harder or introduce innovative products and services. Indeed, inequalities may be linked to a number of developments, which, in the long run, may generate unambiguous positive eff ects. For example, certain structural reforms, such as those that were implemented in transition economies in the early 1990s, may have increased income inequalities, but this was necessary in order to ensure adequate incentives to work and invest.
On the other hand, inequalities may have ineffi cient social and economic outcomes. In particular, when inequalities become persistent and some groups are systematically barred from the benefi ts of growth, the economic and social costs are likely to intensify as those at the bottom claim their share of the national income by any means possible, thus creating a more unstable macroeconomic environment. Th ere may also be cases where wealthy groups try to block pro-growth policies, if such groups fear that the opportuni-ties may be too widely redistributed.
Th e purpose of this section is to review the evidence on changes in income ine-quality and the impact on social outcomes and macroeconomic stability. It also discusses labour market discrimination and political economy problems that arise from distribu-tional issues.
Social and economic costs of inequality
Inequality and crime
Th ere comes a point where income inequality increases black-market activity and prop-erty crimes. Illegal activities oft en provide better returns for less affl uent households, even when the risk of punishment is taken into account (Glaeser, 2005): inequality may dilute the deterrent eff ect of sanctions when low-income households are as badly off out-side prison as they are inside (McAdams, 2007). Moreover, segregation arising from the unequal distribution of income reinforces opportunistic behaviour – at both ends of the income spectrum (Bowles, Choi and Hopfensitz, 2003) – as people belonging to diff erent social strata have fewer interactions. Lastly – and more subtly – rising inequality may lower the amount of policing, as richer households attempt to limit public spending on police forces in low-income neighbourhoods.
Reviewing the empirical literature, Soares (2004) confi rms the positive relationship between inequality and crime rates. Quantitatively, reducing inequality is far more eff ec-tive in reducing crime than such alternatives as better education or policies to promote growth. According to the study, if inequality were reduced from the levels observed in Colombia to those found in the United Kingdom (roughly corresponding to 1 standard deviation in the sample), theft s would fall by 50 per cent and contact crimes by 85 per cent. A similarly large increase in education spending or a 1 percentage point increase in average growth would bring crime rates down by only 30 per cent and 6 per cent respectively.
Inequality and health
Rich people live longer (Deaton, 2003), whereas low-income households oft en lack the resources to maintain and improve their health status. Access to ambulatory or stationary health-care services is more limited or even non-existent for those on lower incomes. Simi-larly, lifestyle choices are heavily infl uenced by individual income: the incidence of obesity,
23
1. Trends in employment and inequality
alcohol or drug abuse typically decreases with increasing income. Inequality also has a strong impact on disease prevention and immunization, in that low-income households are less well informed and less likely to visit a doctor or to get a second opinion in the event of health problems, although preventive measures are recognized to be one of the most effi cient ways to provide health-care services.
High income inequality is also refl ected in lower average life expectancy rates as noted already by Preston in 1975. Cross-country evidence suggests that such a negative relation-ship does indeed exist, with the 10 per cent most equal countries enjoying an average life expectancy (at birth) of 77.4 years in 2006, and the 10 per cent least equal countries only 60.
However, there is some debate whether there is an economically or socially mean-ingful correlation between inequality and aggregate health outcomes or whether it is purely compositional (Deaton, 2001). Th e spread of disease in richer neighbourhoods arising from lack of hygiene in those with lower average incomes constitutes one such direct link. Nevertheless, little evidence exists to date as to the quantitative impact of this aspect of income inequality on health. Hence, while from a public policy point of view it may be preferable to target spending so that low-income households have access to appropriate health-care services; it is less clear whether redistribution and lower income inequality would in themselves be suffi cient to improve the health status of those at the bottom of the income distribution.
Labour market discrimination and employment
Large inequalities in income may result in racial and gender discrimination in the labour market, thereby discouraging participation and reducing labour supply (World Bank, 2006). Historically, reduced inequality has been shown to lie at the heart of the increase in female labour force participation rates in most developed economies over the past 30 years. Th is is refl ected in the fall in the gender wage gap and a decrease in discrimination against women (see Bar and Leukhina, 2006, for recent estimates for the United States). Never-theless, gender discrimination remains a major issue in most, if not all, ILO countries.
Similarly, urban and job segregation have been shown to weigh against African-Amer-icans in the US labour market (Dickerson, 2007). Comparable patterns hold for devel-oping economies, where the labour market and well-paid jobs continue to be segregated, creating ethnic faultiness that result in social upheaval and civil strife (Chua, 2003).
Inequality and social mobility
Th e relationship between income inequality and social mobility (as measured, for instance, by the correlation of inter-generational earnings) is inevitably ambiguous. On the one hand, when income inequality is based on merit and equal opportunities, the prospect of a higher income may increase incentives to get an education and work harder. On the other hand, where inequality results in segregation, richer families may fi nd it easier to pay for good quality education for their children than their poorer counterparts. Th is tends to perpetuate existing income inequalities.
Empirical evidence suggests inequalities can be persistent, as they reduce social mobility. Low-income households are largely confi ned to their current income strata even across diff erent generations (see fi g. 1.13). At the microeconomic level, persistent inequality can cause demotivation and discouragement among low-income groups, depressing their productivity levels (Torgler, Schmidt and Frey, 2006). At the macroeconomic level, seg-regation resulting from inequality results in adverse peer eff ects for children from low-income families and a lack of role models that would help them aspire to education and training to improve their future income prospects (Durlauf, 2004).

24
World of Work Report 2008: Income Inequalities in the Age of Financial Globalization
The political economy of inequality
Inequality and corruption
Th ere is an association between inequality and corruption (see fi g. 1.14), similar to the link between inequality and crime. Th e unequal distribution of income and wealth may create incentives for certain high-income groups to interfere with the political process and democratic governance (You and Khagram, 2005). In particular, a heavy concentration of wealth and income will provide richer individuals with suffi cient resources to off er bribes even to high-ranking offi cials and policy-makers.31
Th ere is a risk that political power arising from excessively large income and wealth inequalities will enable richer households to maintain the profi tability of their economic activities by promoting anti-competitive measures. Th anks to such inequalities, richer households can buy political infl uence to protect their economic interests and shield them-selves from market competition. Indicators on product market regulation collected by the World Bank suggest that the administrative requirements for setting up a new company are more than twice as high in the least equal compared with the most equal countries. Such obstacles may also help the incumbent elite to stay in power since there is less polit-ical competition prevalent (Acemoglu and Robinson, 2002). In extreme cases, well-con-nected individuals or family members of the political and economic elite receive licences for monopolies. Less restricting but equally ineffi cient are licensing and entry restrictions used mainly for sunset industries or the use of trade policy and subsidies to protect labour-intensive and agricultural production (maize in Mexico, steel in the United States, agricul-ture subsidies in the EU). Such badly designed restrictions on product market competition not only create distortions that result in higher prices and reduced consumer welfare but also lead to dynamic misallocations by hampering the introduction of new technologies and lowering potential economic growth (Scarpetta and Tressel, 2002).
31. Such bribes may not be opposed, by their adversaries, who could be tempted to off er even more in order to avoid adverse eff ects for themselves from policy distortions. In that context, the cost, for richer individuals of not-bribing is much higher in unequal societies than in those with more equally distributed resources (Glaeser, Scheinkmann and Shleifer, 2003).
Figure 1.13. Income inequality and inter-generational mobility
Income Inquality Gini index 1975
0.5
0.2
0.0
0.4
0.3
0.1
0.1 0.2 0.3 0.4 0.5
Australia
Canada
Chile
Cyprus
Czech RepublicWest Germany
Hungary
Latvia
New Zealand
Norway
Poland
Russia
Slovak Republic
Spain
Sweden
USA Note: The graph displays the inter-generational income correlation calculated from the International Social Survey Programme (1999) against the Deininger-Squire Gini coefficient in 1975.
Source: IILS estimates based on Andrews and Leigh, 2008.

25
1. Trends in employment and inequality
Inequality and redistribution
A specifi c link between inequality and lobbying lies in the infl uence wealthy households have on the allocation of public money. Wealth decreases the opportunity cost of lob-bying and increases the chance that like-minded people will band together to infl uence government activity (Zhang, 2008). For instance, one area in which wealthier house-holds lobby to divert public spending into channels benefi cial to themselves is education (see fi g. 1.15). When spending on primary and secondary education is low in compar-ison to spending on tertiary education, children from low-income households will have fewer chances to obtain the secondary education that is a prerequisite for attending uni-versity. Richer households may also infl uence public infrastructure expenditure, such as road construction, in order to obtain public contracts for their own companies, or inter-fere with the political process in order to divert public spending to subsidies for specifi c industries or goods that they themselves consume. Estimates of the incidence of fuel subsidies in Indonesia show, for instance, that two thirds of such subsidies (representing around 11 per cent of central government expenditure in 2007) will go to the top two income quintiles (OECD, 2008b).
An additional mechanism through which inequality can generate ineffi ciencies is dis-tortive taxation. In countries where income is spread more unevenly, distributional con-fl ict will become more intense (this is because the median voter will tend to earn much less than average income; see, for example, Persson and Tabellini, 1991; Alesina and Rodrik, 1994). Th is will modify the agenda of the competing political parties, which may lead to more distortive taxation, with adverse eff ects on income growth. In practice, such a mechanism leads to two testable hypotheses neither of which has, however, received strong support in the literature. Th e fi rst is that, when more inequality leads to more redistribu-tion, inequality should become less persistent, which does not seem to be the case, as indi-cated above. Secondly, there should be a negative correlation between income inequality and GDP per capita growth, a claim that might seem to be supported by cross-country
Note: High (low) income inequality countries include the 20 per cent of countries with the highest (lowest) income inequality according to the Gini index. Medium income inequality countries include the other countries.
Source: IILS estimates based on Transparency International, 2008 and World Development Indicators, 2008.
Note: High (low) income inequality countries include the 20 per cent of countries with the highest (lowest) income inequality according to the Gini index. Medium income inequality countries include the other countries.
Source: IILS estimates based on World Development Indicators, 2008.
Low incomeinequality
Medium incomeinequality
High incomeinequality
0.0
1.4
0.2
0.4
0.6
0.8
1.2
1.0
Low incomeinequality
Medium incomeinequality
High incomeinequality
Countries according to level of income inequality Countries according to level of income inequality
0
7
Corruption perception index Total expediture per student, tertiary versus primary (logarithmic scale)
1
2
3
4
6
5
Figure 1.14. Income inequality and corruption Figure 1.15. Income inequality and spending on tertiary education

26
World of Work Report 2008: Income Inequalities in the Age of Financial Globalization
empirical evidence (see fi g. 1.16). However, when controlling for country or regional fi xed eff ects, more recent studies do not corroborate this result, as they fi nd either a positive cor-relation (Forbes, 2000) or a correlation of which the sign depends on the level of develop-ment, suggesting that only low-income countries may experience low growth as a result of high inequality (Barro, 2000).
Inequality and pro-growth policies
Large income disparities may result in resistance to policies promoting pro-growth and pro-free trade policies, such as lower tariff barriers or the phasing out of subsidies for spe-cifi c industries, particularly when the benefi ts of an open market are expected to reach only a minority (see box 1.3 for a discussion of some recent country experiences). Oft en, these policies require economic adjustments and reallocation across sectors, as competition and deregulation change relative prices in the economy. Since the cost of such adjustments will be borne by a well-defi ned group, opposition will grow and have to be appeased by the redistribution of some of the gains from economic deregulation, either to smooth the tran-sition or to fi nance income-support schemes for those losing out (so-called “compensating reforms”: see Roland, 2002; Delpla and Wyplosz, 2007). However, there may be opposi-tion to the unequal distribution of benefi ts, even though all groups may win on a net basis. In other words, distributional confl ict may result from the post-reform heterogeneity of gains (Alesina and Drazen, 1991; Drazen and Grilli, 1993). In this regard, opposition is particularly strong when benefi ts go mainly to a (small) minority of the society, such as enterprises or professions benefi ting from rents (Chua, 2003). Successful reform, there-fore, requires not only a level playing-fi eld, so that all sections of society can benefi t from market openness, but also concrete action to spread the benefi ts, for instance through tax-and-transfer schemes (see Chapter 5) or by supporting access to land and property, espe-cially by those on low incomes (De Soto, 2003; Bardhan et al., 2006).
Note: Countries are ranked according to their level of income inequality using the Gini index, and then separated into tertiles corresponding to high, medium and low income inequality.
Source: IILS estimates based on IMF, 2008 and World Development Indicators, 2008.
Figure 1.16. Income inequality and trend per capita GDP growth
Low incomeinequality
Medium incomeinequality
High incomeinequality
Countries according to level of income inequality
0.0
3.0
0.5
1.0
1.5
2.0
2.5
Average GDP per capita growth, 1980-2006, per cent

1. Trends in employment and inequality
Box 1.3. Inequality and reform: Experiences in Bolivia and the Republic of South Korea
Bolivia
Among Latin American countries, Bolivia stands out as the one with the most unequal after-tax income inequalities, mainly as a result of unequal market-income distribution and weak redistribution through trans-fers and taxes. Informal employment is widespread (estimated at around 68 per cent of total employment) and the large gas sector does not contribute to the country’s economic development as much as it could, either directly through employment creation (0.04 per cent of total employment is in the gas sector) or indirectly through higher government investment (27 per cent of government revenues came in 2006 from gas exports but were almost fully absorbed in building up a large fiscal surplus: IMF, 2007). The situation is partly due to pension reform: a fully-funded system was introduced in 1998, costing the government around 4.1 per cent of GDP per year, until the system became self operating (Weisbrot and Sandoval, 2006).
During the 1980s and 1990s, a series of reforms was enacted, mainly under the auspices of the World Bank and the IMF, which included: (i) the privatization of the state oil company (YPFB), municipal water suppliers, and public pensions; (ii) financial market liberalization; and (iii) tax reforms. Overall, Bolivia has in Latin America the most active structural reform agenda (Lora, 2001). Despite this, however, trend GDP growth did not show any signs of picking up (IMF, 2005).
Following a series of external and domestic shocks (curtailing of credit lines, the acceleration of the coca eradication programme, the devaluation of the Brazilian Real and the Argentinean crisis), real GDP per capita growth started to slow down and even became negative at the turn of the century. The failure of the reforms to produce sizeable benefits to everyone, in addition to the cyclical turnaround, triggered the emergence of a vigorous Indian movement that came into being with the aim of forcing policy-makers into reverse gear. The political agenda of the Indian movement was dominated by conflict over water, as the privatization had led to rapid price increases and left large parts of the poorer population without access to running water. The benefits from privatization had mainly gone to foreign investors and some richer groups, which gained from the improved water infrastructure.
In 2005, the movement cumulated in the election of the first Indian president of Bolivia, Evo Morales, who was prompt in reversing some of the earlier reforms by renationalizing the incumbent oil company, on the grounds that the contract signed with the new private owner took an unduly large share out of the hands of the government.
The failure of the earlier reform agenda to relieve poverty and lift GDP and employment growth can mainly be attributed to the perverse effects of inequality on economic performance. Corruption and political interference by interest groups remained widespread, adding to the cost of doing business in a landlocked country with poor infrastructure. As a consequence, the investment ratio remained among the lowest in Latin America, limiting the potential for catching up. Moreover, well-organized interest groups continued to benefit from existing regulations, keeping informal employment high and reducing the potential for improve-ments in productivity growth promised by the structural reform agenda.
Republic of South Korea
The Republic of Korea has long been characterized by low and stable income inequality, reaching levels comparable to those observed in other – notably European – OECD countries. In the wake of the Asian financial crisis in 1997, however, income inequality started to rise, even though social transfer programmes managed to limit the effect on disposable income and to stabilize inequality, albeit at a slightly higher level (OECD, 2000; OECD, 2007). Moreover, despite the favourable aggregate picture, the socio-economic chal-lenge remains substantial: the degree of informality is high (almost 26 per cent of all employees outside agriculture are not registered for mandatory social security, OECD, 2008b), the participation rate of women is low and jobs are precarious for some groups, like women and older workers (with potentially adverse effects on their productivity and employability: OECD, 2007).
Against the background of Asian crisis, the government enacted a series of labour market reforms, while at the same time complying with ILO international labour standards (on freedom of association principle, for example). Earlier restrictions on trade union pluralism had involved tight regulation of industrial activi-ties and labour contracts. Dismissal law formulated very specifically the circumstances under which an employee could be fired. Trade union representatives were restricted in the type and manner of industrial action that could be undertaken. In the face of increasing resistance, in particular, with the unofficial Korean Confederation of Trade Unions (KCTU), the government decided to change its stance on industrial rela-tions, recognized KCTU in 1999 and eased some of the more restrictive parts of the dismissal law. At the same time, regulations on temporary employment were reformed, in particular with the introduction of the Dispatched Workers Act in 1998, which allows temporary work agencies to organize the market.
In sum, this suggests that reforms are feasible, despite increased income inequality, if the measures ensure that the interests of workers and employers are better balanced.
27

28
World of Work Report 2008: Income Inequalities in the Age of Financial Globalization
Inequality and instability
Income inequality is also related to macroeconomic instability. Distributive struggles can lead to infl ationary pressures, which, in the case of emerging economies, can result in disorderly exchange rate devaluations and sudden stops in economic growth. Moreover, income inequality – even where it is not causally linked to instability – may magnify the costs of adjustment for low-income households in the wake of a macroeconomic crisis. For instance, the Argentine peso crisis in 2001-2002 worsened inequality as richer households managed to protect their assets from devaluation. More generally, there is evidence that the (measured) labour share decreases following a fi nancial crisis as workers, predomi-nantly those in the formal sector, lose their jobs (Diwan, 2001). Not only is the variability of macroeconomic outcomes greater in more unequal economies, but such economies also experience extreme situations – that is, extremely weak or, less commonly, extremely strong economic performance – more oft en than other countries (so called “fat tails” see fi g. 1.17). In other words, stop-and-go growth episodes are more frequent, the more une-qual the income distribution in an economy. At least for middle-income countries, such boom-bust episodes may, nevertheless, have resulted in higher trend growth, insofar as they are symptoms of deeper fi nancial development and structural changes in the economy (Tornell and Westermann, 2002; Rancière, Tornell and Westermann, 2008). Whether such a link exists more generally is, however, an open question and may depend also on an economy’s capacity to absorb such a crisis rapidly, which in itself is a function of its degree of inequality and its structural policies.
Figure 1.17. Income inequality and instability of economic growth
Low incomeinequality
Medium incomeinequality
High incomeinequality
Countries according to level of income inequality
0.4
1.6
0.8
1.2
Degree of instability of economic growth, 1980-2006(Kurtosis of GDP per capita growth, logarithmic scale
Note: Countries are ranked according to their level of income inequality using the Gini index, and then separated into tertiles corresponding to high, medium and low income inequality.
Source: IILS estimates based on IMF, 2008 and World Development Indicators, 2008.

29
1. Trends in employment and inequality
D. Bottom line and rationale for the next chapters
Th is chapter has shown that, over the past two decades, income inequality followed an upward trend in the majority of countries. Recent developments point to a further wid-ening of income inequality, as the ongoing economic slowdown and fi nancial crisis in the world economy combined with food price increases are likely to aff ect low-income groups disproportionately.
Th e chapter also highlights the policy relevance of these trends. Th ere are cases where income inequality supports economic growth and social development. But in other cases income inequality can be harmful and may therefore require policy action. Much depends on (i) whether income inequality is perceived to be excessive – and, according to the World Value Survey, this is indeed increasingly the case;32 and (ii) the root causes of growing income inequalities. Th e purpose of the next chapters is to address the latter issue.
Globalization has manifested itself in a number of ways, including more liberal trade and direct investment agreements, and freer movement of capital – or fi nancial globaliza-tion more generally.33 While much work has been done on the socio-economic eff ects of trade and foreign direct investment, the extent to which fi nancial globalization can cause higher income inequality has received less attention. Th e issue is therefore examined in detail in Chapter 2.
Domestic factors can also contribute to higher income inequalities. Th ese are exam-ined in chapters 3 to 5. Chapter 3 examines how labour market institutions, including col-lective bargaining and tripartite dialogue, are linked with income inequality, controlling for trade and other globalization factors. Traditionally, these institutions have provided a framework for ensuring that the gains from economic growth are shared in a balanced manner, consistent with market realities. Th e issue analysed in Chapter 3 is whether the distributive role of labour marker institutions has changed.
Th e links between employment and income inequality are discussed in Chapter 4. Th is includes an analysis of the possible eff ects on income inequality of changing employ-ment patterns – characterised by a growing incidence of non-standard employment. Th e issue of whether employment gains help reduce income inequality, or on the contrary exac-erbates it, is also examined in that chapter.
Th e welfare state is oft en considered a powerful redistributive instrument. Social ben-efi ts and transfers may help alleviate low-income traps. And, progressive taxation will exert a broader income redistribution eff ect. Chapter 5 looks at whether these instruments con-tinue to play this role.
Finally, Chapter 6 examines how the diff erent policy planks discussed in earlier chap-ters can be combined so as to limit the trend rise in income inequality, while at the same time supporting employment growth. Th e chapter considers the role of the Decent Work Agenda in this respect.
32. Th e World Value Surveys provides information on the degree of tolerance vis-à-vis income inequality. In the 23 countries where respondents replied to the three waves of the survey (1989-1993, 1994-1999 and 1999-2004), the tolerance index declined from a value of 6.5 in the fi rst wave, to 5.6 in the second wave and 5.4 in the third wave (lower values of the index indicate lower degree of tolerance vis-à-vis income inequality). See www.worldvaluessurvey.org ( http://www.worldvaluessurvey.org ) for more details.33. See, for example, Heshmati A. (2003) for a discussion of the impact of globalization on inequality. Cornia G. A. (2005) also provides an extensive discussion of the impact technological change, external liberalization or social spending on inequalities.

30
World of Work Report 2008: Income Inequalities in the Age of Financial Globalization
Appendix A
Regional country groupings
Advanced EconomiesWestern EuropeAustriaBelgiumCyprusDenmark Finland France Germany Greece Iceland Ireland Italy Luxembourg Malta Netherlands Norway Portugal Spain Sweden Switzerland United Kingdom
Other Advanced EconomiesAustralia Canada Israel Japan Korea, Republic of New Zealand United States
Sub-Saharan AfricaAngola Benin Botswana Burkina Faso Burundi Cameroon Cape Verde Central African Republic Chad Comoros Congo Congo, Democratic Republic of Côte d’Ivoire Djibouti Equatorial Guinea Eritrea Ethiopia Gabon Gambia Ghana Guinea Guinea-Bissau Kenya Lesotho Liberia
Madagascar Malawi Mali Mauritania Mauritius Mozambique Namibia Niger Nigeria Rwanda Sao Tome and Principe Senegal Seychelles Sierra Leone Somalia South Africa Swaziland Tanzania, United Republic of Togo Uganda Zambia Zimbabwe
North AfricaEgypt Libyan Arab Jamahiriya Morocco Sudan Tunisia
Middle EastBahrain Iran, Islamic Republic of Iraq Jordan Kuwait Lebanon Oman Qatar Saudi Arabia Syrian Arab Republic Turkey United Arab Emirates West Bank and Gaza Strip Yemen
Latin America & The CaribbeanAntigua and Barbuda Argentina Aruba Bahamas Barbados Belize Bolivia
Brazil Cayman Islands Chile Colombia Costa Rica Cuba Dominica Dominican Republic Ecuador El Salvador Grenada Guatemala Guyana Haiti Honduras Jamaica Mexico Netherlands Antilles Nicaragua Panama Paraguay Peru Puerto Rico Saint Kitts and Nevis Saint Lucia Saint Vincent and the
Grenadines Suriname Trinidad and Tobago United States Virgin Islands Uruguay Venezuela, Bolivian Republic of
Central & Eastern Europe and Former Soviet RepublicsCentral and Eastern EuropeBosnia and Herzegovina Bulgaria Croatia Czech Republic Estonia Hungary Latvia Lithuania The former Yugoslav Republic
of Macedonia Montenegro Poland Romania Serbia, Republic of Slovakia Slovenia
Commonwealth of Independent StatesArmenia Azerbaijan Belarus
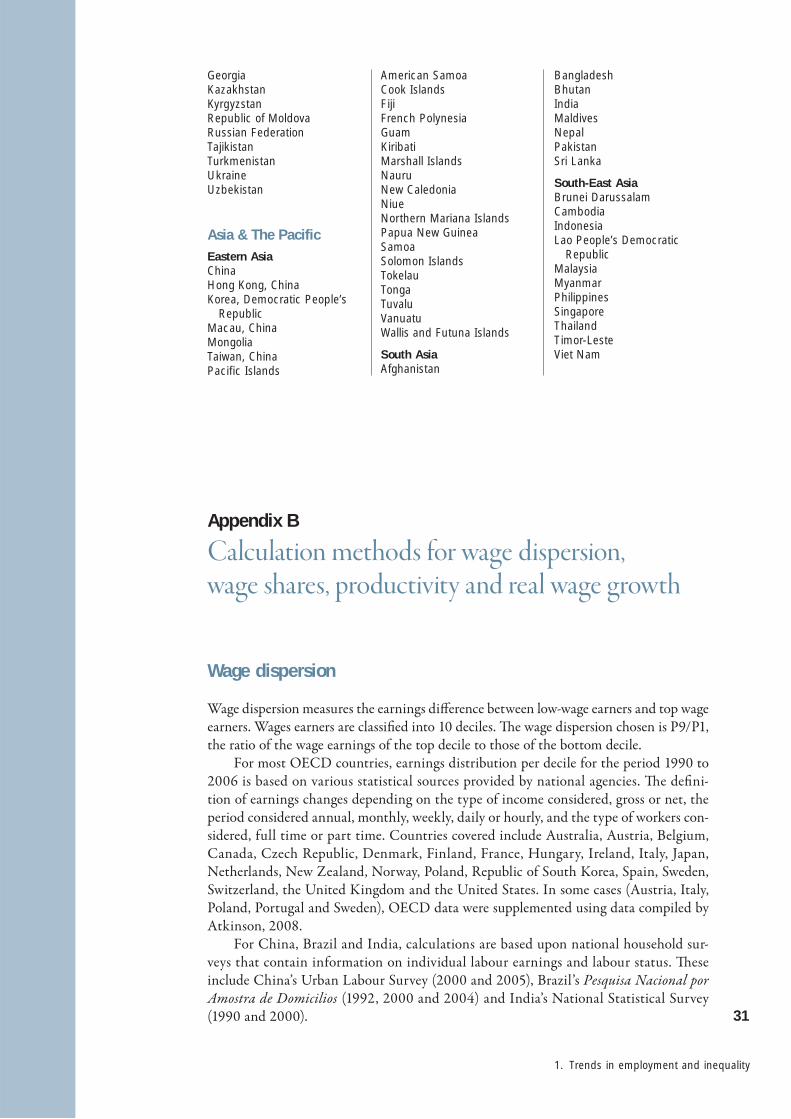
31
1. Trends in employment and inequality
Appendix B
Calculation methods for wage dispersion, wage shares, productivity and real wage growth
Wage dispersion
Wage dispersion measures the earnings diff erence between low-wage earners and top wage earners. Wages earners are classifi ed into 10 deciles. Th e wage dispersion chosen is P9/P1, the ratio of the wage earnings of the top decile to those of the bottom decile.
For most OECD countries, earnings distribution per decile for the period 1990 to 2006 is based on various statistical sources provided by national agencies. Th e defi ni-tion of earnings changes depending on the type of income considered, gross or net, the period considered annual, monthly, weekly, daily or hourly, and the type of workers con-sidered, full time or part time. Countries covered include Australia, Austria, Belgium, Canada, Czech Republic, Denmark, Finland, France, Hungary, Ireland, Italy, Japan, Netherlands, New Zealand, Norway, Poland, Republic of South Korea, Spain, Sweden, Switzerland, the United Kingdom and the United States. In some cases (Austria, Italy, Poland, Portugal and Sweden), OECD data were supplemented using data compiled by Atkinson, 2008.
For China, Brazil and India, calculations are based upon national household sur-veys that contain information on individual labour earnings and labour status. Th ese include China’s Urban Labour Survey (2000 and 2005), Brazil’s Pesquisa Nacional por Amostra de Domicilios (1992, 2000 and 2004) and India’s National Statistical Survey (1990 and 2000).
Georgia Kazakhstan Kyrgyzstan Republic of Moldova Russian Federation Tajikistan Turkmenistan Ukraine Uzbekistan
Asia & The PacificEastern AsiaChina Hong Kong, China Korea, Democratic People’s
Republic Macau, China Mongolia Taiwan, ChinaPacific Islands
American Samoa Cook IslandsFiji French Polynesia Guam Kiribati Marshall Islands NauruNew Caledonia NiueNorthern Mariana Islands Papua New Guinea Samoa Solomon Islands TokelauTongaTuvalu Vanuatu Wallis and Futuna Islands
South AsiaAfghanistan
Bangladesh Bhutan India Maldives Nepal Pakistan Sri Lanka
South-East AsiaBrunei Darussalam Cambodia Indonesia Lao People’s Democratic
Republic Malaysia Myanmar Philippines Singapore Thailand Timor-Leste Viet Nam

32
World of Work Report 2008: Income Inequalities in the Age of Financial Globalization
Wage shares
Th e wage share measures the share of total income or gross domestic product (GDP) that goes to labour. Broadly speaking, GDP can be decomposed into three income compo-nents: capital, labour and taxes. Labour income (wages) usually comes under the heading of “compensation of employees” in national accounts, with total income measured using “gross value added at factor costs”.
To adjust for the fact that “compensation of employees” only captures the income of salaried workers (not of self-employed persons), for a number of countries, “compensation of employees” was divided by the ratio of employees to total employment. As such, the assumption is that self-employed persons earn, on average, the same as employees.
For OECD countries, wage shares are calculated using OECD detailed national accounts data for Australia, Austria, Belgium, Canada, Czech Republic, Denmark, Fin-land, France, Germany, Greece, Hungary, Iceland, Ireland, Italy, Japan, Republic of South Korea, Luxembourg, Mexico, Netherlands, New Zealand, Norway, Poland, Portugal, Slo-vakia, Spain, Sweden, Switzerland, Turkey, the United Kingdom and the United States. Th e wage share is calculated as:
Total labour cost divided by nominal output, where:
Total labour cost = (compensation per employees * number of employees * hours worked employment)/ (hours worked employees)34, and nominal output refers to annual current price value added compiled according to the System of National Accounts 93.
For Argentina, Brazil, China, Egypt, Nigeria and Th ailand, data from national statis-tics offi ces and, in some cases, ILO KILM data (ratio of employees in total employment) were used.
● Argentina: wage share = (remuneración al trabajo asalariado / valor agregado bruto (VAB) a precios corrientes de productor) *1/ (ratio of employees in total employment). All data come from Dirección Nacional de Cuentas Nacionales (INDEC), except for the ratio of employees in total employment (ILO KILM).
● Brazil: wage share = (remuneração dos empregados / produto interno bruto) *1/ (ratio of employees in total employment). All data come from national accounts (ft p://ft p.ibge.gov.br), except for the ratio of employees in total employment (ILO KILM).
● China: wage share = total wages of staff and workers / nominal GDP. Statistics are drawn from the Statistical Yearbook (http://www.stats.gov.cn).
● Egypt: wage share is calculated as compensation of employees divided by net operating surplus from Annual National Account data (http://www.mop.gov.eg/English/eng-lish.html).
● Nigeria: wage share is calculated compensation of employees divided by operating sur-plus using National Account data (http://www.nigerianstat.gov.ng/index.php).
● Th ailand: wage share = (Compensation of employees / GDP at factor cost)*1/ (ratio of employees in total employment). All data come from National Account data (http://www.nesdb.go.th/Default.aspx?tabid=94), except for the ratio of employees in total employment (ILO KILM).
For the remainder of countries (Asia: Bahrain, Hong Kong (China)λ, India, Islamic Republic of Iran, Israelλ, Jordan, Kuwait, Oman and Sri Lankaλ; Eastern Europe and Rus-sian Federation: Armeniaλ Azerbaijan, Belarus, Bulgariaλ, Estoniaλ, Kyrgyzstanλ, Latviaλ,
34. If the variable “hours worked” is not available, the adjustment for the self-employed is made by making using the self-employment ratio (total employment divided by the number of employees.

33
1. Trends in employment and inequality
Lithuaniaλ, Republic of Moldovaλ, Romaniaλ, Russian Federationλ; Latin America: Chileλ, Colombiaλ, Costa Ricaλ, Panamaλ, Venezuelaλ, Peruλ; North Afr ica: Algeriaλ, Tunisia; and sub-Saharan Africa: Botswanaλ, Côte d'Ivoire, Kenya, Mauritiusλ, Namibiaλ, Nigeria, South Africaλ), wage shares were calculated as the ratio of compensation of employees to gross value added at basic prices, using UN National Accounts data and ILO KILM data for the ratio of employees in total employment.35
Real wages and productivity
Real wages are calculated as nominal wages (ratio of total compensation to total employees), discounted for infl ation or the consumer price index (CPI). Productivity is measured by dividing real GDP, or an alternative measure of production, by the number of employees.
For OECD countries, real wage growth is calculated as the ratio of compensation per employee to the consumer price index (CPI). Real productivity growth is calculated as the real output at constant prices divided by total employment. For Australia, Austria, Bel-gium, Canada, Denmark, Finland, France, Germany, Italy, Japan, Luxembourg, Nether-lands, New Zealand, Norway, Spain, Republic of South Korea, the United Kingdom and the United States, wage and productivity annual growth rates are calculated for the fol-lowing periods: 1990-2006, 1990-2000, and 2000-2006. For the Czech Republic, Greece, Hungary, Ireland, Poland and Slovakia, annual growth rates are calculated for the fol-lowing periods: 1996-2006, 1996-2000, and 2000-2006: For Mexico, data begin in 1995 and end in 2004, and for Portugal, begin in 1995 and end in 2005.
For Brazil, India, Russian Federation and South Africa, annual real wage and produc-tivity growth are calculated using data from UNIDO (wages and salaries of employees, number of employees, and value added) and IMF (CPI and GDP defl ator).36
For China annual real wage growth was calculated as the average wage of staff and workers to CPI and productivity as the ratio of value added to the Number of employed persons at year end times the GDP defl ator. Data are taken from Statistical Yearbook (http://www.stats.gov.cn) and from the IMF (for CPI and GDP defl ator).
35. Countries marked λ are those for which the wage share is corrected for the self employed. 36. To obtain time series for the 1990s and 2000s, two UNIDO databases were merged, namely INDSTAT3 2006 ISIC Rev 2 and INDSTAT3 2008 ISIC Rev 34. Th e baseline series is INDSTAT3 2008 ISIC Rev 34, which is completed by applying growth rate calculated from INDSTAT3 2006 ISIC Rev 2.

34
World of Work Report 2008: Income Inequalities in the Age of Financial Globalization
References
Acemoglu, D.; Robinson, J. A. 2002. Economic backwardness in political perspective, National Bureau Economic Research (NBER), Working Paper, No. 8831.
Aghion, P.; Caroli, E.; García-Peñalosa, C. 1999. “Inequality and economic growth: Th e perspective of the new growth theories”, in Journal of Economic Literature, Vol. 37, No. 4.
Alesina, A.; Drazen, A. 1991. “Why are stabilizations delayed?”, in American Economic Review, Vol. 81, No. 5, pp. 1170-1188.
Alesina, A.; Rodrik, D. 1994. “Distributive politics and economic growth”, in Quarterly Journal of Economics, Vol. 109, No. 2, pp. 465-490.
Anand, S.; Segal, P. 2008. “What do we know about global income inequality?”, in Journal of Economic Literature, Vol. 46, No. 1, pp. 57-94.
Andrews, D.; Leigh, A. 2008. More inequality, less social mobility, Th e Australian National University, Center for Economic Policy Research, Discussion Paper, No. 566.
Arjona, R.; Ladaique, M.; Pearson, M. 2003. “Growth, inequality and social protection”, in Canadian Public Policy, Vol. 29, pp. S119-S139.
Atkinson, A. B. 2008. Th e changing distribution of earnings in OECD countries (Oxford, Oxford University Press).
Bar, M.; Leukhina, O. 2006. Accounting for changes in labor force participation of married women: Th e case of the U.S. since 1959, paper presented at the IZA/EUI Workshop on Demographic Change and Secular Transitions in Labor Markets: What Can We Learn from a Dynamic Perspective?, Bonn, 3-4 September.
Bardhan, P.; Bowles, S.;Wallerstein, M. 2006. Globalization and egalitarian redistribution, (Princeton, NJ, Princeton University Press).
Barro, R. 2000. “Inequality and growth in a panel of countries”, in Journal of Economic Growth, Vol. 5, No. 1, pp. 5-32.
Bart, C.; Decoster A. 2004. “Th e rise or fall of world inequality: a spurious controversy?” UNU-WIDER Discussion paper 2004/02.
Boone, J. 2000. “Competitive pressure: the eff ects on investments in product and process innovation”, in RAND Journal of Economics, Vol. 31, No. 3, pp. 549-569.
Bowles, S.; Choi, J-K.; Hopfensitz, A. 2003. “Th e coevolution of individual behaviors and social institutions”, in Journal of Th eoretical Biology, Vol. 223, pp. 135-147.
Bruce, A.; Skovoroda, R.; Fattorusso, R.; Buck, T. 2007. “Executive bonus and fi rm performance in the UK”, in Long Range Planning, Vol. 40, pp. 280-294.
Chua, A. 2003. World on fi re (London, Arrow Books).Cornia, G.A., (eds.). 2005. Inequality, Growth, and Poverty in an Era of Liberalization and
Globalization (Oxford University Press).Cowell, F.A. 2000. “Measurement of inequality”, in A.B. Atkinson; F. Bourguignon (eds.):
Handbook of income distribution (Amsterdam, North Holland), Vol. 1, pp. 87-166. —. 2006. Inequality: measurement, Distributional Analysis Discussion Paper 86, STICERD,
London School of Economics.Dardour, A . Forthcoming. 2008. Les déterminants de la rémunération du premier dirigeant
des sociétés cotées en France , Etude empirique sur les sociétés de l’ indice SBF 250, working paper.
De Jong, et al. 2005. “Th e role of self-regulation in corporate governance: evidence and implications from the Netherlands”, in Journal of Corporate Finance, Vol. 11, pp. 473-503.
De Soto, H. 2003. Th e mystery of capital: Why capitalism triumphs in the West and fails everywhere else (London, Basic Books).
Deaton, A. 2001. Health, inequality, and economic development, NBER Working Paper, No. 8318.
—. 2003. “Health, income, and inequality”, in NBER Reporter: (Research Summaries), Spring.Delpla, J.; Wyplosz, C. 2007. La fi n des privilèges. Payer pour reformer (Paris, Hachette
littérature). Dickerson, N.T. 2007. “Black employment, segregation, and the social organization of
metropolitan labor markets”, in Economic Geography, Vol. 83, No. 3, pp. 283-307.Diwan, I. 2001. Debt as sweat: Labor, fi nancial crises, and the globalization of capital
(Washington D.C., World Bank), unpublished manuscript.

35
1. Trends in employment and inequality
Drazen, A.; Grilli, V. 1993. “Th e benefi ts of crises for economic reforms”, in American Economic Review, Vol. 83, No. 3, pp.598-607.
Duffh ues, P.; Kabir, R. 2008. “Is the pay-performance relationship always positive? Evidence from the Netherlands”, in Journal of Multinational Financial Managagement, Vol. 18, No. 1, 45-60.
Duménil, G.; Levy, D. 1993. Th e economics of the profi t rate: Competition, crises, and historical tendencies in capitalism (Aldershot, Edward Elgar).
Durlauf, S.N. 2004. “Neighborbood eff ects” in J.V. Henderson, J. Th isse (eds.) Handbook of Regional and Urban Economics, Vol. 4, pp. 2173-2242.
Ebert, F.; Papadakis. K.; Torres R. Forthcoming. 2008. “Executive compensation: trends and policy issues”, Discussion Paper No. 190 (International Institute for Labour Studies, Geneva).
European Corporate Governance Institute. 2003. Directors’ remuneration in listed companies: Consolidated answers for the 15 EU Member States. Available at: http://www.ecgi.org/remuneration/questionnaire/consolidated.pdf [20August 2008].
Fei, J.C.H.; Rainis, G.; Kuo, S.W.Y. 1978. “Growth and the family distribution of income by factor components”, in Quarterly Journal of Economics, Vol. 92, No. 1, pp. 17-53.
Fernandes, N. 2008. “EC: Board compensation and fi rm performance: the role of “independent” board members”, in Journal of Multinational Financial Management, Vol. 18, No. 1, pp. 30–44.
Forbes, K.J. 2000. “A reassessment of the relationship between inequality and growth”, in American Economic Review, Vol. 90, No. 4, pp. 869-887.
Glaeser, E.L. 2005. Inequality, Harvard Institute of Economic Research, Discussion Paper, No. 2078.
—.; Scheinkmann, J.; Shleifer, A. 2003. “Th e injustice of inequality”, in Journal of Monetary Economics, Vol. 50, No. 1, pp. 199-222.
Gollin, D. 2002. “Getting income shares right”, in Journal of Political Economy, Vol. 110, No. 2, pp. 458-74,
Guscina, A. 2006. Eff ects of globalization on Labor’s share in national income, IMF Working Paper No. 294 (IMF, Washington, DC).
Haid, A.; Yurtoglu, B. 2006. Th e impact of ownership structure on executive compensation in Germany, paper presented at the 32nd Conference of the European Association for Research in Industrial Economics (EARIE), September 2005. Available at:
http://www.fep.up.pt/conferences/earie2005/cd_rom/Session%20VII/VII.A/burcin.pdf [20 August 2008].
Hall, B.; Murphy, K. 2000. “Optimal exercise prices for executive stock options”, in American Economic Review, Vol. 20, No. 2, pp. 209-214.
Harrigan, J.; Baladan, R. 1999. U.S. Wages in General Equilibrium: the Eff ects of Prices, Technology, and Factor Supplies, 1963-1991, NBER Working Paper No. 6981.
Heshmati, A. 2003. “Measurement of a Multidimentional Index of Globalization and its Impact on Income Inequality”, UNU- WIDER, Discussion Paper 2003/69.
International Labour Offi ce (ILO). 1999. World Employment Report (Geneva).—. 2008a. Global Employment Trends (Geneva, January).—. 2008b. Global Employment Trends for Women (Geneva, March). International Monetary Fund. 2005. Bolivia: Ex post assessment of longer-term program
engagement, IMF Country Report, No. 05/139 (Washington, DC). —. 2007. World Economic Outlook: Globalization and Inequality (Washington, DC, October).—. 2007. Bolivia: Selected issues, IMF Country Report, No. 07/249 (Washington, DC).—. 2008. World Economic Outlook (Washington, DC, July).Institutional Shareholder Services Australia. 2006. CEO pay – It’s even higher than you think.
Valuation of executive options in Australia, ISS Research Paper. Jaumotte, F.; Tytell, I. 2007. How has the globalization of labour aff ected the labour income share
in advanced countries?, IMF Working Paper No. 298 (IMF, Washington, DC).Kapsos, S. 2005 “Th e employment intensity of growth: Trends and macroeconomic
determinants”, Employment Strategy Paper No. 12 (Geneva, ILO).Kose, M.A.; Otrok, C.; Prasad, E. 2008. Global business cycles: Convergence or decoupling? IZA
Discussion Paper No. 3442 (Bonn, Forschungsinstitut zur Zukunft der Arbeit).Krueger, A. 1999. “Measuring labor s share”, in American Economic Review, Vol. 89, No. 2,
pp. 45-51.

36
World of Work Report 2008: Income Inequalities in the Age of Financial Globalization
Lavoie, M. 1995. “Th e Kalekian model of growth and distribution and its neo-Ricardian and neo-Marxian critiques”, in Cambridge Journal of Economics, Vol. 19, No. 6, pp. 789-818.
Leal, R.P.C.; Carvalhal Da Silva, A. 2005. Corporate governance and value in Brazil (and in Chile), Working Paper. Available at: http://www.fep.up.pt/investigacao/cempre/actividades/sem_fi n/sem_fi n_01_05/PAPERS_PDF/paper_sem_fi n_16jun05.pdf [20August 2008].
Lee, E. 2008. Harnessing globalization for development: Opportunities and obstacles, Discussion paper, International Institute for Labour Studies (Geneva, ILO). Available at: http://www.ilo.org/public/english/bureau/inst/download/dp18708.pdf [20August 2008].
Litchfi eld, J.A. 1999. Inequality: Methods and Tools, Available at: http://www.worldbank.org/poverty/inequal/index.htm. (World Bank, Washington, DC) [20 August 2008].
Lora, E. 2001. Structural reforms in Latin America: What has been reformed and how to measure it, Inter-American Development Bank, Working Paper No. 348 (Washington, DC).
Lynch, L.J.; Perry, S.E. 2003 “An overview of management compensation”, in Journal of Accounting Education, Vol. 21, No. 1, pp. 43-60.
McAdams, R.H. 2007, “Economic costs of inequality”, University of Chicago Law School, Olin Working Paper, No. 370.
Merhebi, R. et al. 2006. “Australian chief executive remuneration: Pay and performance”, in Accounting and Finance, Vol. 46, pp. 481-487.
Milanovic, B. 2005a. Worlds Apart: Measuring International and Global Inequality (Princeton: Princeton University Press).
—. 2005b. “Can We Discern the Eff ect of Globalization on Income Distribution? Evidence from Household Surveys,” World Bank Economic Review, Oxford University Press, vol. 19(1), pp. 21-44.
Murphy, K. 1999. “Executive compensation”, in O. Ashenfelter and D. Card (eds.): Handbook of Labor Economics, Vol. III (Amsterdam: North-Holland), pp. 2485-2563. Available at: http://www-rcf.usc.edu/~kjmurphy/ceopay.pdf [20 August 2008].
Organisation for Economic Co-operation and Development (OECD). 2000. Pushing ahead with reform in Korea: Labour market and social safety-net policies (Paris).
—. 2007, Economic Surveys: Korea (Paris).—. 2008. Economic Surveys: Indonesia – economic assessment (Paris).—. 2008a. Economic Outlook, No. 83 (Paris).—. 2008b, Employment Outlook (Paris).Persson, T.; Tabellini, G. 1994. “Is inequality harmful for growth? Th eory and evidence”, in
American Economic Review, Vol. 84, No. 3, pp. 600-621.Rancière, R.; Tornell A.; Westermann, F. 2008. “Systemic crises and growth”, in Quarterly
Journal of Economics, Vol. 123, No. 1, pp. 359-406.Rang, R. 2008. Vorstandsvergütung 2006. Eine Detailstudie. Hans-Böckler-Stift ung.
Available at: http://www.boeckler.de/pdf/Detailstudie_Vorstandsverguetung_2006.pdf [21 August 2008].
Rodrik, D. 1999, “Where did all the growth go? External shocks, social confl ict, and growth collapses”, in Journal of Economic Growth, Vol 4 , No. 4, pp. 385-412.
Roland, G. 2002. “Th e political economy of transition”, in Journal of Economic Perspectives, Vol. 16, No. 1, pp. 29-50.
Scarpetta, S.; Tressel, T. 2002. Productivity and convergence in a panel of OECD industries: Do regulations and institutions matter?”, OECD Economics Department Working Papers, No. 342 (Paris).
Shields, J. 2005. “Setting the double standard: CEO pay the BCA way”, in Journal of Australian Political Economics, Vol. 56, December, pp. 299-326.
Soares, R.R. 2004. “Development, crime and punishment: Accounting for the international diff erences in crime rates”, in Journal of Development Economics, Vol. 73, No. 1, pp. 155-184.
Torgler, B.; Schmidt, S. L.; Frey, B. S. 2006. “Th e Power of Positional Concerns: A Panel Analysis”, Working Paper No. 2006-19 (Basel, Center for Research in Economics, Management and the Arts).
Tornell, A.; Westermann, F. 2002. Boom-bust cycles in middle income countries: Facts and explanations, NBER Working Paper, No. 9219.

37
1. Trends in employment and inequality
Tosi, H.L. et al. 2000. “How much does performance matter? A meta-analysis of CEO pay studies”, in Journal of Management, Vol. 26, pp. 301-339.
Weisbrot, M.; Sandoval, L. 2006. Bolivia’s Challenges, Center for Economic and Policy Research, (Washington DC).
World Bank. 2008. World Development Indicators Online (WDI). Available at: http://go.worldbank.org/U0FSM7AQ40 [7 October, 2008].
—. 2007. Global Economic Outlook (Washington, DC).—. 2006. World Development Report (Washington, DC).World Trade Organization (WTO). 2008. World Trade Report. Available at: http://www.wto.
org/english/res_e/reser_e/wtr08_e.htm#download [20 August 2008].Yitzhaki, S.; Lerman, R. 1991. “Income stratifi cation and income inequality”, in Review of
Income and Wealth. Vol. 37, No. 3, pp. 313-329.You, J.; Khagram, S. 2005. “A comparative study of inequality and corruption”, in American
Sociological Review, Vol. 70, No. 1, pp. 136-157.Zhang, L. 2008. “Political economy of income distribution dynamics”, in Journal of
Development Economics, Vol. 87, No. 1, pp. 119-139.

39
Main findings
● Financial globalization has accelerated since the early 1990s, with advanced countries investing fi nancial assets in international markets amounting to several times their GDP. However, despite these substantial capital fl ows around the globe, fi nancial glo-balization has failed to improve global productivity or employment growth. Th is stands in stark contrast to the benefi ts brought by domestic fi nancial development.
● Moreover, despite accelerating fi nancial globalization, less developed economies are not receiving their share of global savings. On the contrary, savings continue to fl ow from less to more developed economies, in contrast with theoretical predictions (the “Lucas paradox”). Th e presumption is that this may have to do with a lack of domestic fi nan-cial market development, with adverse eff ects on the rates of return necessary to attract international investors and to prevent capital outfl ows of excess savings.
● Partly through the lack of proper regulation or an adequate supervisory framework, the frequency of fi nancial crises has increased in both developed and emerging econo-mies as a consequence of fi nancial globalization. Worldwide, systemic banking crises have been 10 times more likely throughout the 1990s than during the late 1970s, which was hardly a period of calm economic activity. Such increased instability has come at a steep cost to inequality, as low-income households have been particularly aff ected by repeated boom-bust cycles. Th ere is also evidence off ered in this chapter that fi nancial globalization is associated with higher unemployment. From a longer-term perspective, however, and at least as regards economic growth, the benefi ts of fi nancial liberalization outweigh the costs of crises.
● Financial globalization has also led to a depression of the share of wages in GDP, reinforcing the downward trend recorded in most countries, as documented in Chapter 1. Th is eff ect is over and above any trend decline in the wage share that may have resulted from sectoral shift s, rising labour demand elasticities from trade openness or changes in labour market regulations and institutions. Th ere is empir-ical evidence that fi nancial globalization has led to an increase in income inequality,
Th e role of fi nancialglobalization
2. Th e role of fi nancial globalization
40
World of Work Report 2008: Income Inequalities in the Age of Financial Globalization
owing both to a trend increase in fi nancial assets (relative to GDP) and to a growing incidence of crises.
● Financial liberalization has had a disciplining eff ect on macroeconomic policies in both developed and emerging countries, although it has also led to a reduction in the margin for redistributive policies, as discussed in detail in Chapter 5. However, certain countries – in particular in Northern Europe – have demonstrated that it is possible to build complementarities between strong and well-designed welfare policies, on the one hand, and a competitive economy, on the other. In this way, the threat to redistri-bution policies posed by fi nancial globalization is reduced.
● Developments in corporate governance mechanisms have led to an increasing use of performance-related pay systems for executive managers and directors. Nevertheless, empirical studies show that such systems have only a very moderate eff ect, if any, on company performance. Moreover, wide variations exist, with some countries displaying virtually no relation between performance-related pay and company profi ts. Th is sug-gests that managers are in a dominant wage-bargaining position with respect to com-pany owners, partly as a result of institutional fl aws.
Introduction
Trade liberalization, and its impact on economic growth, employment and inequality, has come under considerable scrutiny in recent years, but much less attention has been paid to the eff ect of fi nancial market liberalization.1 Now that the recent fi nancial market tur-moil in the United States has turned into the “fi rst global fi nancial crisis of the twenty-fi rst century” (Felton and Reinhart, 2008), however, the labour market fall-out from such crises deserves renewed interest. Th e spillover of US fi nancial market stress to other devel-oped and emerging markets, in the form of interest rate hikes and the loss of liquidity, has demonstrated yet again that events in international fi nancial markets can have a sub-stantial impact on domestic economic and social development, with adverse consequences for employment growth and income opportunities. Th is chapter presents a review of the existing evidence, with a particular focus on the impact of fi nancial liberalization on growth, employment creation and income inequality.
In theory, fi nancial liberalization and the free allocation of global capital fl ows should generate substantial macroeconomic benefi ts for both capital exporters and recipient coun-tries. Global trend productivity and employment are believed to grow faster, thereby lift ing less developed countries out of poverty and helping to maintain (or further improve) living standards in the developed world. Low-income households are expected to benefi t in par-ticular, with the result that both global and within-country inequality are decreased. It has been suggested that fi nancial globalization can both boost average per capita income and – potentially – lower income and wealth inequality in the following three ways:
● It can provide low-income countries with access to capital and help to improve the allo-cation of funds. It should also make it easier for low-income households to access the capital market and thereby lower income inequality within countries.
1. Financial liberalization refers to de jure measures aimed at both international fi nancial markets (the removal of restrictions on capital import and export – “capital account opening” and exchange restrictions) and domestic capital markets (the removal of interest rate freezes or credit controls, as opposed to fi nancial globalization, which refers to the de facto development of international capital fl ows. Financial openness refers to the de facto openness of the capital account (free entry and exit of capital fl ows to and from abroad).

41
2. The role of fi nancial globalization
● By imposing discipline on governments, it can improve macroeconomic policy-making and encourage the implementation of pro-growth reforms. Th is would improve income prospects across the board but would be particularly benefi cial for low-income house-holds (“pro-poor growth”).
● By strengthening corporate governance (for instance, through a more competitive market for corporate control), the argument goes, fi nancial globalization helps to put capital fl ows to the most effi cient and productive use and ensure that executives are per-forming at their best. Th is improves the business environment in both emerging and developed countries.
Th e experience of the past two decades has, however, shed signifi cant doubt on whether these benefi ts have materialized. Trend productivity growth rates have accelerated – but not necessarily in the countries that opened their capital accounts the widest. Regular boom-bust cycles have wiped out earlier income gains to a large extent – mainly in middle-income countries – despite a global trend towards less volatility in economic activity. Low-income households do not seem to have benefi ted from improved access to fi nancial markets to insure themselves against shocks. As a consequence, global inequality has, at best, remained constant, while inequality within countries seems to be rising, regardless of their level of economic development (see Chapter 1).
Th is chapter reviews the empirical evidence for the macroeconomic eff ects of fi nan-cial globalization and discusses why several of the expected benefi ts have failed to mate-rialize, in terms of both long-term economic growth and the vulnerability of low-income households. Th e indirect eff ects that fi nancial liberalization may have on inequality are discussed in the light of its impact on domestic policy-making. Lastly, one specifi c dimen-sion of fi nancial globalization, namely the spread of modern corporate governance prac-tices, is considered, and in particular the links between executive pay and performance.
A. Development of financial globalizationand wealth inequality
Uneven progress in opening capital accounts…
Th e opening of capital accounts has progressed unevenly across the globe (see fi g. 2.1). Th e developed economies of Asia were among the fi rst to embark on fi nancial liberalization but gradually re-introduced restrictions, in particular in the aft ermath of the Asian fi nan-cial crisis in 1997. High-income OECD countries have opened their capital accounts more gradually but eventually became the most fi nancially open economies around the globe. Most other regions have shown only very limited eff orts to follow suit, although, among these, Latin American countries have recently progressed the most. Th ere are also signifi -cant intra-regional diff erences in fi nancial liberalization. Except for high-income OECD countries – where there has been a convergence of policies– most of the countries with the least open capital accounts have not adopted any fi nancial liberalization measures.
...has led to uneven acceleration of fi nancial globalization…
Like fi nancial liberalization, fi nancial globalization has progressed unevenly across the world over the past two decades (fi g. 2.2). Th e sum of gross fi nancial assets and liabilities exceeded the (nominal) GDP of High-income OECD countries by 200 per cent at the end of the 1990s, whereas it had been at par with GDP at the end of the 1980s. An accel-eration of fi nancial market development has also been observed in High-income Non-OECD countries and East Asia and the Pacifi c. Th ere has been no such acceleration in

42
World of Work Report 2008: Income Inequalities in the Age of Financial Globalization
The figure displays the country median of a de-jure measure of capital account openness for eight world regions (based on the geographical definition used by the World Bank, see http://go.worldbank.org/D7SN0B8YU0 ). The measure is based on the first principal component of (i) a variable indicating the presence of multiple exchange rates, (ii) a variable indicating restrictions on current account transactions, (iii) a variable indicating restrictions on capital account transactions and (iv) a variable indicating the requirement of the surrender of export proceeds. All variables are based on information contained in the IMF Annual Report on Exchange Arrangements and Exchange Restrictions.
Source: IILS estimates based on Chinn and Ito (2007).
1970 1972 1974 1976 1978 1980 1982 1984 1986 1988 1990 1992 1994 1996 1998 2002-2.0
-1.5
-1.0
-0.5
0
0.5
1.0
1.5
2.0
2.5
3.0
Europeand Central Asia
Latin Americaand the Carribean
Middle Eastand North Africa
High-incomeOECD countries
South Asia
Sub-saharan Africa
East Asiaand the Pacific
High-incomenon-OECD countries
Figure 2.1. De jure measures of capital account opening
0
50
100
150
250
200
300
350
0
50
100
150
250
200
300
350
1970 1972 1974 1976 1978 1980 1982 1984 1986 1988 1990 1992 1994 1996 1998 2002 2004
1970 1972 1974 1976 1978 1980 1982 1984 1986 1988 1990 1992 1994 1996 1998 2002 2004
High-income OECD
High-income non-OECD
Europe and Central Asia
East Asia and the Pacific
Latin America and the Caribbean
Middle East and North Africa
South Asia
Sub-Saharan Africa
Note: Financial globalization is measured as the sum of foreign assets and liabilities as a share of GDP. Foreign assets include portfolio debt and equity assets, foreign direct investment assets and reserves excluding gold stocks. Foreign liabilities include portfolio debt and equity liabilities and foreign direct investment liabilities. Regional averages have been constructed on the basis of GDP-weighted country averages. Geographical regions are based on the geographical definition used by the World Bank, see http://go.worldbank.org/D7SN0B8YU0.
Source: IILS estimates based on Lane and Milesi-Feretti, 2006.
Figure 2.2. Financial globalization in seven world regions (% of GDP)

43
2. The role of fi nancial globalization
other regions, in particular in the emerging markets of South Asia and Latin America; and their fi nancial market openness has barely changed over the past decade.
Th e picture changes only slightly when foreign direct investment (FDI) is considered (fi g. 2.3). High-income Non-OECD countries again stand out as the main force behind fi nancial globalization, followed by East Asia and High-income OECD countries. Europe and Central Asia also benefi ted from a rapid increase in investment fl ows following the widespread privatization aft er the fall of the communist regimes. More recently, Sub-Saharan Africa and Latin America and the Caribbean also seem to have gained ground in integrating with global fi nancial markets, with the rapid infl ow of foreign capital in African countries being expected to accelerate further over the coming years, partly as a result of large investments in the mining and extracting industries (Nellor, 2008). Th ere was no such increase in FDI in Middle Eastern and North African countries or – notably – in South Asian economies.
…and has not helped to reduce wealth inequality
Th e diff erent rates of development of fi nancial openness have so far prevented a conver-gence of wealth inequalities between developed and emerging countries (table 2.1). Indeed, despite the potential of capital fl ows to alleviate borrowing constraints for low-income households, their rise has been so disjointed, geographically speaking, that they have not yet
Note: Financial globalization is measured as the sum of foreign assets and liabilities as a share of GDP. Foreign assets include portfolio debt and equity assets, foreign direct investment assets and reserves excluding gold stocks. Foreign liabilities include portfolio debt and equity liabilities and foreign direct investment liabilities. Regional averages have been constructed on the basis of GDP-weighted country averages. Geographical regions are based on the geographical definition used by the World Bank, see http://go.worldbank.org/D7SN0B8YU0.
Source: IILS estimates based on Lane and Milesi-Feretti, 2006.
Figure 2.3. Foreign direct investment in seven world regions (% of GDP)
1970 1972 1974 1976 1978 1980 1982 1984 1986 1988 1990 1992 1994 1996 1998 2002 2004
1970 1972 1974 1976 1978 1980 1982 1984 1986 1988 1990 1992 1994 1996 1998 2002 2004
50
100
150
200
250
0
50
100
150
200
250
0
High-income OECD
High-income non-OECD
Europe and Central Asia
East Asia and the Pacific
South Asia
Latin America and the Caribbean
Middle East and North Africa
Sub-Saharan Africa

44
World of Work Report 2008: Income Inequalities in the Age of Financial Globalization
aff ected wealth inequalities in developing countries, which remain – on average – higher than in developed economies. Moreover, global wealth inequality as measured by the global Gini coeffi cient stands at 89.2, substantially higher than most measures for global income inequality (Anand and Segal, 2008) and higher than would be suggested by the relationship between wealth and income inequality within developed countries. In short, the current dynamics of fi nancial globalization have prevented a further convergence of wealth both across and within countries, with income inequality in low-income countries remaining unaff ected by fi nancial openness. Th is is in marked contrast with the sanguine predictions of some proponents of fi nancial globalization.
B. Financial markets and pro-poor growth
Financial liberalization has the potential to improve trend growth…
Standard growth theory predicts that fi nancial liberalization helps to accelerate growth in low-income countries by raising domestic savings and giving access to global capital fl ows (Fisher, 2003; Obstfeld, 1998; Summers, 2000) and at the same time developing the domestic fi nancial market, which is itself conducive to the more effi cient allocation of resources and higher growth (King and Levine, 1993). Th e increase in available funds also brings interest rates down in emerging economies, thereby fostering investment and employment growth, and helps to alleviate poverty and reduce between-country income inequality by lowering the borrowing constraints of the households with the least access
Table 2.1. Wealth inequality in selected countries
Wealth Gini (2000)
Income Gini Year
Argentina 74.0 50.1 2005
Australia 62.2 31.2 2003
Bangladesh 65.8 33.5 1996
Brazil 78.3 56.6 2004
Canada 66.3 31.5 2000
China 55.0 44.9 2003
France 73.0 27.8 2000
Germany 67.1 31.1 2004
India 66.9 36.5 1997
Indonesia 76.3 39.6 1996
Italy 60.9 33.3 2000
Japan 54.7 31.9 1998
Republic of Korea 57.9 37.2 1998
Mexico 74.8 49.9 2004
Nigeria 73.5 52.2 1996
Pakistan 69.7 39.8 1996
Spain 56.5 33.6 2000
Taiwan (China) 65.4 33.9 2003
Thailand 70.9 42.7 2001
United States 80.1 46.4 2004
Viet Nam 68.0 37.3 1998
Source: Davies et al., 2008; World Bank, 2008.

45
2. The role of fi nancial globalization
to fi nance. Moreover, with improved opportunities for international risk-sharing, coun-tries may be better able to exploit gains from specialization in international trade (Ace-moglu and Zilibotti, 1997; Kalemi-Özcan, Sørensen and Yosha, 2001). Lastly, additional, indirect benefi ts may be expected from the transfer of technology and knowledge that comes with foreign direct investment, which improves total factor productivity (Bonfi g-lioli, 2007; Kose, Prasad and Terrones, 2008).
Th e least controversial of these claims relates to a basic aspect of fi nancial liberalization, that is, the liberalization of the domestic fi nancial system. Th is typically involves disman-tling systems of credit rationing and interest rates controls. Th e case for such liberaliza-tion was made in the early 1970s in the literature on development economics (McKinnon, 1973; Shaw, 1973). It was argued, that in the context of the import substitution strategies that were then prevalent in most developing countries, controls that repressed the growth of the fi nancial system lowered growth and exacerbated general ineffi ciency in the allo-cation of resources. Th ey also increased inequality in the distribution of income by sup-porting increased industrial concentration and limiting access to credit for enterprises that were not favoured by the economic planners. Removing these distortions, the argument went, would both increase economic growth and reduce income inequality.
A basic way in which this could be done is to lift ceilings on interest rates. A rise in interest rates should increase the supply of domestic savings and screen out ineffi cient investments that had previously been artifi cially promoted. Although there were some concerns that a rise in interest rates might not lead to the expected increase in growth rates (because of its negative eff ect on the cost of capital and on the level of eff ective demand), the macroeconomic case for domestic fi nancial liberalization was, and still is, generally accepted. Even critics of external fi nancial liberalization such as Rodrik and Subrama-nian (2008) see special benefi ts in domestic fi nancial liberalization that avoids the costs of external liberalization. For example, domestic fi nancial liberalization, unlike external liberalization, tends to lower the exchange rate, because the increase in domestic saving reduces the need to rely on foreign borrowing. Such an exchange rate outcome is favour-able to the growth of the tradeables sector, the main potential engine of growth.
Domestic fi nancial liberalization and development are also essential if countries are to take advantage of their integration into the world economy. Weak fi nancial development and distorted saving incentives at home, combined with substantial gains in international market shares, will lead to increasing current account surpluses. Th is, in turn, means that low-income countries become exporters of capital to high-income countries. Indeed, the fact is that capital tends to fl ow from capital-poor to capital-rich countries – the Lucas paradox – in contrast to theoretical predictions. It is only recently, however, that the link between capital account surpluses and (domestic) fi nancial market development has been explicitly recognized (Mendoza, Quadrini and Rios-Rull, 2003). Empirical analysis on the basis of this line of research shows that such a link holds quite consistently, even when account is taken of various other factors that may contribute to current account surpluses.2 Another interpretation of these results is that fi nancial globalization without proper devel-opment of domestic fi nancial markets is likely to increase global wealth and income ine-quality. It may also increase within-country inequality to the extent that those with the least access to credit markets are likely to be even more credit-constrained following mas-sive capital outfl ows. On the other hand, those with access to international fi nancial mar-kets – in most cases high-income individuals and international corporations – benefi t fully from investment opportunities outside their home country. Whether the emergence of large sovereign wealth funds will resolve these global current account imbalances – as some have suggested (Beck and Fidora, 2008) – remains an open question, as long as the under-lying structural problems in capital-constrained countries are not addressed (see box 2.1).
2. See the background paper prepared for this chapter for more details (Ernst and Escudero, 2008).

46
World of Work Report 2008: Income Inequalities in the Age of Financial Globalization
…but benefi ts have been slow to materialize…
Despite these theoretical benefi ts of fi nancial liberalization for trend growth and ine-quality, empirical studies have so far produced mixed evidence, particularly regarding the impact of fi nancial globalization on productivity and employment growth. A recent review of the literature by the IMF concluded that “[o]ur reading of this large literature based on aggregate data is that it remains diffi cult to fi nd robust evidence that fi nancial integration systematically increases growth, once other determinants are controlled for” (Kose et. al, 2006). In particular, the level of fi nancial market openness does not seem to play any particular role, whereas there is some indication that the change in fi nancial inte-gration could be a driver of productivity acceleration and employment growth. Th is debate is by no means over (see Henry, 2007; Rodrik and Subramanian, 2008), but it is suffi cient to note for the purposes of this report that it is far from an accepted fact that fi nancial openness increases growth. Instead, there is intriguing counter-evidence from a number of studies that the countries that have grown fastest have relied least on foreign capital (Gourinchas and Jeanne, 2007; Prasad, Rajan and Subramanian, 2007).
Part of the diffi culty in fi nding a defi nite relationship between fi nancial globalization and growth may lie in the fact that fi nancial market openness interacts with the overall regulatory environment in any particular country. A supporting business environment with effi cient governance, productive industrial relations and predictable labour regula-tion helps foreign investors to identify business opportunities quickly and channel funds towards their most productive use (Mishkin, 2006). On the other hand, the recapitaliza-tion of fi rms through portfolio fl ows on equity and corporate bond markets may suff er from inadequate corporate governance institutions, badly designed product market regulations
Box 2.1. Sovereign wealth funds and global capital flowsFuelled by the recent surge in the price of oil and other commodities, a group of resource-rich emerging market economies has managed to build up substantial financial funds, often man-aged by sovereign wealth funds (SWFs). These SWFs are set up primarily to prevent that tempo-rary surges in world market prices for a country’s main export commodities lead to overheating, exchange rate appreciation or rapid, unsustainable increases in government expenditure. Although SWFs have been around for several decades, the earliest example being the Kuwait Investment Board set up in 1953, it is only recently that they have attracted more widespread interest, in view of both their impact on capital market developments in individual countries and their effect on global capital flows. In particular, their (presumed) lack of transparency over their investment strategies and the potential consequences of such financial power for global stability have raised concern and caused policy-makers to consider the possibility of intervention.
The optimistic view has it that, given the size of SWFs, they need to make diversified investments on global capital markets, which might correct some of the current account imbalances that have built up over the past decade (Beck and Fidora, 2008). Such a correction would undoubtedly improve the stability of the international financial system. As discussed in the text, however, these imbalances seem to be due to investors’ perceptions about distortions on individual financial mar-kets and the relative returns they can receive by investing in different countries. As long as these distortions are not removed, or at least reduced to the low levels as found in advanced economies, SWFs are unlikely to play an important role in equilibrating global current account imbalances.
A more pessimistic outlook on SWFs relates to their financial importance and the potential for political interference in their investment strategies. This is particularly likely in resource-rich countries that suffer from weak governance and might be tempted to use the wealth of the funds to promote their own international political agenda. More importantly, the sheer size of SWFs – often representing several hundred per cent of the GDP of their countries of origin (Mitchell, Piggott and Kumru, 2008) – runs the risk of influencing the market. In particular, in more volatile times, there is a danger that the investment behaviour of such powerful bodies will be used as a public signal for other investors, with the potential to lead to sudden stops and capital flow reversals.

47
2. The role of fi nancial globalization
or anti-competitive behaviour by executive directors and special interest groups. In such situations, the over-hasty opening of the capital account, accompanied by loose prudential regulation and distortions in the domestic fi nancial system, has been held responsible for many of the recent diffi culties faced by emerging economies in benefi ting from fi nancial globalization (Obstfeld, 2007).
Consistent with the mixed evidence found in earlier studies, this report fi nds confl icting eff ects of fi nancial market liberalization on labour market outcomes.3 Financial globaliza-tion could have been benefi cial for employment growth. Domestic fi nancial liberalization, however, has contributed to a rise in the unemployment rate, partly as a result of increased turbulence on the labour market. In comparison with trade liberalization the average net eff ect of fi nancial market liberalization (that is, fi nancial globalization and domestic fi nan-cial liberalization combined) appears to be modest. Moreover, it should be noted that the evi-dence reveals only the average impact of fi nancial globalization for large country groups over a comparatively longer time period. Individual countries, at specifi c (short) periods, may not have been aff ected by fi nancial market liberalization as much as suggested by these estimates.
…and increased the vulnerability of low-income countries to shocks
Th e increasing frequency of systemic fi nancial crises may have been another reason why the benefi ts of fi nancial globalization, if any, appear so far to have been limited. In par-ticular, the vulnerability of low-income households in such crises may have largely wiped out earlier gains in the form of reduced income inequality and higher growth. As men-tioned above, the theory suggests that fi nancial globalization and access to global capital markets can increase the potential for international risk-sharing, thereby enabling low-income countries and households to mitigate the economic eff ects of fl uctuations in their current account. However, fi nancial liberalization may fail to deliver improvements in living standards if the vulnerability of low-income households and the volatility of output, employment and consumption subsequently increase. Th ere are, indeed, signs that both developed and emerging economies have experienced more frequent fi nancial market crises in recent years, which have increased consumption and employment volatility (Kose et al. 2006). Indeed, data assembled by Laeven and Valencia (2008) show that the incidence of banking crises increased in line with fi nancial globalization worldwide and remained high throughout much of the 1990s, especially in emerging economies (fi g. 2.4). A more detailed analysis of the underlying factors suggests that an increase in vulnerability as a result of fi nancial liberalization is particularly likely in emerging economies with rel-atively fragile fi nancial systems. Developed economies with consolidated fi nancial sys-tems off ering a wide range of fi nancial products to insure against a multitude of risks may already take full advantage of their fi nancial integration by experiencing more stable con-sumption and employment.
A rise in a country’s vulnerability to shocks may be, in part, related to its failure to strengthen its domestic fi nancial system prior to liberalization, whatever its level of development. Th e risk of a fi nancial market crisis is not inherent to fi nancial liberaliza-tion, even though the two are closely related, as recently shown by Reinhart and Rogoff (2008). Rather, institutional weaknesses in the fi nancial system or the prudential reg-ulation and supervision regime can be held accountable. Inadequate supervision when opening fi nancial markets does not aff ect only emerging economies, as the recent burst of the sub-prime bubble has demonstrated. Nevertheless, since the vulnerability of low-income households is higher in emerging economies, both inequality and poverty levels typically take a harder hit at the onset of a fi nancial market crisis in such countries than in more developed ones. Th is occurs through several mutually reinforcing channels.
3. See Ernst and Escudero (2008) for details.

48
World of Work Report 2008: Income Inequalities in the Age of Financial Globalization
Source: IILS estimates based on Laeven and Valencia, 2008.
Figure 2.4. Frequency of banking crises, systemic or otherwise, in OECD countries and the rest of the world (%)
0
10
20
30
40
50
60
Non-OECD countries
OECD countries
1974 1976 1978 1980 1982 1984 1986 1988 1990 1992 1994 1996 1998 2000 2002 2004 2006
Th e rise in real interest rates that typically occurs as a result of attempts to stem cap-ital outfl ows at the onset of a crisis tends to favour high-income over low-income house-holds, as central banks try to stabilize the external value of the currency. Similarly, the rise in infl ation oft en associated with fi nancial crises tends to have a negative eff ect on income distribution and poverty. Real wages decline, and so does the wage share in national income (Diwan, 2001). Th ese eff ects are over and above the negative impact of the sharp rise in unemployment that occurs at the onset of a serious fi nancial crisis (fi g. 2.5). Moreover, the negative labour market consequences of such crises have a particularly long-lasting impact, sometimes reversed only several years later.
Th ese negative primary economic eff ects of fi nancial crises tend to be reinforced by the eff ects of policies adopted in their wake. Contractionary fi scal policies usually have a negative impact on income distribution and poverty. Public expenditure on social serv-ices such as health and education that are important for the welfare of low-income house-holds is oft en reduced. Expenditure on agricultural extension services and credit, and on other anti-poverty programmes, suff er a similar fate. In addition, programmes to bail out the country’s fi nancial system typically have a regressive eff ect on income inequality. Large depositors, who are also usually better connected and better informed, benefi t most, while small depositors are rarely adequately protected. Th e same goes for small fi rms, which have less access to credit markets in the event of fi nancial diffi culties then larger fi rms, which are “too big to fail”.
As mentioned above, it is important to note that the negative eff ects of fi nancial crises on the labour market and on distribution oft en persist well into the period of eco-nomic recovery. Th e loss of property and productive assets as a result of foreclosure or distress sales is not immediately rectifi ed by an economy’s overall recovery aft er a crisis. Similarly, there are longer-term negative consequences for the low-income households from crisis-induced developments such as the withdrawal of children from school, mal-nutrition, increased indebtedness and prolonged unemployment. Such negative distri-butional consequences have to be set against the possible long-term trend improvements brought about by boom-bust cycles. Th ere is evidence that sudden stops following periods of rapid economic expansion are characteristic of countries that undergo a fundamental transformation and development of their fi nancial sector, helping to alleviate fi rms’ and households’ borrowing constraints (Rancière, Tornell and Westermann, 2008), with a resulting trade-off between higher long-term growth and lower inequality (fi g. 2.6). In particular, the acceleration of credit growth seems to fuel both trend GDP per capita

49
2. The role of fi nancial globalization
growth and inequality. However, the theory that regular boom-bust cycles produce a cleansing eff ect, by shedding ineffi cient production units, receives only modest support in our empirical analysis. Indeed, an estimate of the impact of the frequency of crises in the banking sector on both inequality and trend GDP per capita growth indicates that the eff ect is statistically signifi cant but economically negligible. Rather, it seems that the development of the fi nancial sector and its positive contribution to employment creation, as identifi ed above, has a more substantial eff ect, resulting in the trade-off between ine-quality and long-term growth, mentioned above. Such an eff ect is, however, felt only in the longer term. For individual countries, at the moment when a crisis hits, these costs may be substantial (see box 2.2).
Note: Quarterly data based on HP-filtered percentage changes of real unit labour costs, HP-filtered absolute levels of current account balances (as a percentage of GDP) and HP-filtered unemployment rates. Data are collected around the year of the crisis as documented by Reinhart and Rogoff (2008). Crisis years are 1994 for France, 1991 for Finland and Sweden and 1974 for the United Kingdom.
Source: IILS estimates based on OECD, 2008a.
Figure 2.5. Development of current accounts and wage share during financial crises in four countries
-8 -6 -4 -2 0 2 4 6 8 10 12 14 16 18 200
2
4
6
8
10
16
14
12
18
-8 -7 -6 -5 -4 -3 -2 -1 0 1 2 3 4 5
-5
-4
-3
-2
-1
0
1
2
Real unit labour costs before and after financial crises (y-o-y changes) (%)
-8 -7 -6 -5 -4 -3 -2 -1 0 1 2 3 4 5
France
Finland
Sweden
United Kingdom
Current account developments before and after financial crises (% of GDP)
Unemployment rates before and after financial crises (% of labour force)
-1.2
-1.0
-0.8
-0.6
-0.4
-0.2
0
0.2
0.4
0.6
0.8

50
World of Work Report 2008: Income Inequalities in the Age of Financial Globalization
Box 2.2. Cost of financial crises in individual countries – the Asian crisisThe chapter argues that, from a longer-term perspective, the benefits of financial development outweigh its costs, in terms of both inequality and job creation. In individual countries that have been hit by a financial crisis, the temporary costs can be substantial with long-lasting conse-quences that may wear off only in the very long run.
Following the Asian crisis, GDP contracted on average by 7.7 per cent between 1997 and 1998 in the five hardest hit countries (Indonesia, Malaysia, the Philippines, the Republic of Korea, Thailand) and took between two and seven years to recover to pre-crisis levels. With the notable exception of Indonesia, labour force participation rates declined by up to 2 per cent but recovered in most cases to previous levels after three to eight years. More importantly, (formal) employment rates fell by up to 3.1 per cent and took between five to 10 years to return to pre-1997 levels. No international comparison exists as to the impact of the Asian crisis on income inequality and poverty, but data for Indonesia – admittedly the country that had been hit the hardest – suggest that the incidence of poverty took around seven years to return to pre-crisis levels (OECD, 2008b). This has to be set against the fact that, before the financial crisis, poverty had fallen continuously by around 1 percentage point per year. Cumulatively, therefore, the gains in poverty reduction have still not caught up with the increase in poverty due to the crisis.
In sum, the effects of a financial crisis have proved in the past to cause substantial damage that takes several years to wear off. The differences in the speed with which countries recover show, however, that policies can and do have an effect on a country’s ability to cope. The imple-mentation of proper labour and product market policies to help countries adjust quickly in the aftermath of a shock therefore remains an important way of enhancing the benefits of financial globalization and limiting its costs (Duval, Elmeskøv and Vogel, 2007).
C. Financial globalization, union bargaining power and the wage share
Financial liberalization has contributed signifi cantly to the spectacular rise in the income of the top 1 per cent of income earners in the United States, a major proportion of which is fi nance-derived. Th is includes not only the income of rentiers but also that of a growing number of people that are nominally classifi ed as employees, such as investment bankers, CEOs with stock options, fi nancial advisers and analysts, and lawyers and accountants in the fi nancial sector. At the same time, regulatory failures and supervisory negligence have led to fi nancial excesses, with the burden of adjustment borne by the less well-off and the average tax-payer, as is the case at present. For example, the sub-prime borrowers in mort-gage markets are at the lowest end of the income spectrum and risk crippling losses from falling property prices and repossession of their homes. In the case of the United States, the crisis has caused a signifi cant reversal of the gains of earlier programmes that aimed at increasing home-ownership among low-income households. In some cases whole com-munities have been aff ected, suff ering not only the loss of their homes but also increased crime and declining local tax revenues and public services.
Another side eff ect of fi nancial liberalization that has contributed to growing ine-quality in some industrialized countries is the even greater importance attached to “share-holder value” maximization and to private equity funds in corporate management. Th e demand for higher dividend payouts by active shareholders has made managers more resistant to claims for wage increases than in the past, while the threat of outsourcing and downsizing has weakened the bargaining position of workers (Choi, 2001). Mean-while, the increasing role of private equity funds that are not subject to the regulatory controls faced by public companies has led to greater “short-termism” and increased risk in corporate management. In their bid to satisfy shareholders who seek short-term profi t maximization, managers are no longer able to share the benefi ts of long-term coopera-tion with employees that would result in higher productivity and stronger investment in

51
2. The role of fi nancial globalization
fi rm-specifi c capital (Ernst, Amable and Palombarini 2005; Pagano and Volpin, 2005). Rather, they align themselves with their shareholders by selecting investment projects that promise tangible profi ts over the short term and restrict incentives established to reward employees over the long term.
This trend, which is caused by financial globalization, has been detrimental to workers’ wages and employment security and has in some cases led to the unnecessary dismantling of fi rm-specifi c assets, such as organizational capital. Th e eff ect on the wage
Note: The contributions are based on FGLS estimates, including regional dummies (see Appendix A for a discussion of the methodology).
Source: IILS estimates.
Figure 2.6. Impact of financial development and crises on inequality and growth
Log(Gini)
Other factors
Averagecredit growth
Variability ofcredit growth
Frequency ofcredit crises
GDP percapita growth
Other factors
Averagecredit growth
Variability ofcredit growth
Frequency ofcredit crises
Log(Gini)
Other factors
Averagecredit growth
Variability ofcredit growth
Frequency ofcredit crises
GDP percapita growth
Other factors
Averagecredit growth
Variability ofcredit growth
Frequency ofcredit crises
Log(Gini)
Other factors
Averagecredit growth
Variability ofcredit growth
Frequency ofcredit crises
GDP percapita growth
Other factors
Averagecredit growth
Variability ofcredit growth
Frequency ofcredit crises
Emerging economies Emerging economies
Advanced economies Advanced economies
All countries All countries
Estimated impact on income inequality levels Estimated impact on GDP per capita growth
0.26
0.02
-0.03
0.01
0.26
0.20
0.02
-0.03
0.01
0.20
0.22
0.02
-0.03
0.01
0.21
1.37
0.65
-0.40
0.01
1.62
2.34
0.60
-0.26
0.06
2.74
1.65
0.64
-0.36
0.02
1.95

52
World of Work Report 2008: Income Inequalities in the Age of Financial Globalization
share has also been quite sizeable, with an estimated elasticity of around 0.3 (in other words, an increase of fi nancial openness by 1 percentage point reduces the labour income share by 0.3 percentage points). Th is contrasts with evidence on the eff ects of openness to trade, off shoring and immigration on the wage share (Jaumotte and Tytell, 2007), which seem to have had a smaller impact than other external factors such as (skill-biased) tech-nological change. In sum, over and above the downward trend in the wage share that may have been induced by sectoral shift s, rising labour demand elasticities or changes in labour market regulations and institutions, fi nancial globalization has had a distinct eff ect on the labour income share in both developed and emerging economies (fi g. 2.7).
Not only has workers’ bargaining position been weakened, but, in addition the ben-efi ts of fi nancial liberalization may be distributed unequally, thereby increasing within-country inequality. Indeed, the rapid increase in foreign direct investment observed in emerging economies in particular may have contributed to a global increase in the skill premium for high-skilled workers (IMF, 2007), despite the potential of trade openness to reduce economic inequality by improving opportunities on the labour market. Th rough the transfer of technology that creates particular employment opportunities for high-skilled workers foreign direct investment causes inequality to increase as the upper tail of the wage distribution moves further eastwards.
D. Financial globalization and the convergence of capitalisms
Financial liberalization also has indirect eff ects on macroeconomic performance and income inequality, by imposing additional constraints on the ability of governments to pursue redistributive policies. Th e increased mobility of capital further restricts still the extent to which it can be taxed without provoking the relocation of production and reversing capital fl ows. It also reduces the bargaining strength of workers and increases the temptation for governments to shift tax burdens on to this relatively immobile section of society. Analysis presented in Chapter 5 suggests that this process is probably under way already. On a more positive note, however, risky macroeconomic policies that result in overvalued exchange rates and rampant infl ation, with adverse implications for inequality, are becoming much more costly for governments. It would therefore seem that the eff ects of fi nancial liberali-zation on inequality are mixed, when such indirect factors are taken into account.
In many emerging countries, low-income households can make significant gains from the macroeconomic discipline imposed on their governments. High infl ation hits
Note: The graph displays the deviation of the wage share from country-specific trends for 71 countries against deciles of financial globalization.
Source: IILS estimates based on IILS Database on Labour Shares and Lane and Milesi-Feretti, 2006.
Figure 2.7. Financial globalization and the evolution of the wage share
-0.08
-0.06
-0.04
-0.02
0
1 2 3 4 5 6 7 8 9 10Financial globalization deciles
0.02
0.04
0.06
0.08
Wage share (deviation in % of country-trend)

53
2. The role of fi nancial globalization
low-income households particularly hard, as they spend most of their income on primary commodities, for which there are practically no alternatives (see Chapter 1, Appendix 1). Moreover, overvalued exchange rates (such as that of the Argentine peso before the 2001/2002 crisis) mainly benefi t the middle- and high-income groups, easing their con-sumption of cheap imported goods, but hurt the employment prospects of low-income households in the exporting sector. Th is is important, because many low- and middle-income countries hardly redistribute to start with, in part because of the existence of a large informal sector (table 2.2). In such countries, more stable and predictable macroeconomic policies will have benefi cial eff ects not only on trend growth but also on inequality. It should be stressed, however, that some measures dictated by fi nancial liberalization, which are meant to address lax macroeconomic policies, come at a high cost, in terms of both eco-nomic growth and inequality (see box 2.3). More importantly, they usually do not address the underlying structural problem, namely huge income inequalities (see Chapter 1).
Financial globalization is also said to put pressure on national policy-makers to adjust their structural policies to favour capital owners. Over and above sound macr-oeconomic policies and a lower tax burden for richer households – a topic discussed in Chapter 5 – such adjustments also involve implementing specifi c accounting rules and supervisory standards and striking a balance between creditor and equity owner rights. Having similar standards across countries facilitates the activities of global investment
Table 2.2. Redistribution: inequality before and after taxes
Market income inequality
Inequality after transfers
Disposable income inequality (after
transfers and taxes)
Argentina 50.0 48.6 48.1
Australia 46.0 na 31.2
Austria 37.5 30.4 24.8
Belgium 46.5 36.4 29.2
Bolivia 56.0 54.1 54.3
Brazil 47.2 45.8 45.6
Canada 42.9 na 31.5
Chile 56.8 53.3 52.2
Denmark 48.6 34.9 28.5
Finland 49.3 36.3 31.6
France 42.0 34.5 30.9
Germany 43.0 33.3 28.2
Greece 47.4 40.0 36.3
Ireland 53.1 38.9 33.8
Italy 47.5 41.0 37.4
Luxembourg 41.3 30.1 23.8
Mexico 51.0 50.3 49.4
Netherlands 38.7 29.7 26.1
Norway 37.2 na 23.1
Peru 48.6 48.8 47.9
Portugal 49.4 43.0 38.1
Spain 46.8 39.6 34.8
Sweden 45.2 32.8 29.0
Switzerland 39.2 na 27.4
United Kingdom 52.3 38.8 34.3
United States 48.1 na 37.2
Note: na = not available.
Source: Mahler and Jesuit, 2006; OECD, 2008c.

54
World of Work Report 2008: Income Inequalities in the Age of Financial Globalization
Box 2.3. Importing macroeconomic discipline: Economic and social costs and benefits in Argentina and Ecuador
Financial and currency crises have hit Latin American countries at regular intervals. In order to respond to the resulting threat to macroeconomic stability, several countries in the region have, at times, sought to import monetary stability through various forms of fixed exchange rate regimes. Some have experimented with linking the domestic currency to the US dollar or to a basket of internationally recognized currencies, while few others have taken the more radical step of replacing the domestic currency by the US dollar altogether (among them El Salvador, Panama and – more recently – Ecuador). Although it involves the loss of monetary sovereignty, dollarization avoids some of the negative consequences that fixed exchange rates may have in terms of risky international speculation and thus contributes to macroeconomic stability. This box discusses the Argentine and Ecuadorian experiences with these two strategies to foster currency stability and compares the costs and benefits of the two approaches.
Argentina: the failure of the Convertibility Plan
Argentina introduced a fixed peg (the “Convertibility Plan”) in 1991 as a reaction to macr-oeconomic instability that had caused 15 years of economic stagnation and inflation. The Plan included a requirement for the Central Bank to ensure that every peso issued was matched by a US dollar in its accounts and structural reforms to strengthen the domestic financial sector, open the economy to international capital markets and boost microeco-nomic efficiency through trade liberalization and the privatization of state enterprises.
In its initial phase, the Plan successfully stabilized the economy, achieving a fast reduction of inflation and interest rates, which brought the misery index down by over 60 per cent (fig. B1).a Output growth soared between 1992 and 2000, reaching 4.2 per cent per year, partly driven by strong export growth (5.1 per cent per year) and the favourable interna-tional financial environment. The number of households living below the poverty line fell in tandem with the misery index.
Signs of weakness first appeared during the Mexican crisis of 1995, when capital flows went into reverse gear, but it took the Asian and Russian crises to make the limitations of the Plan openly visible. By the end of 1998, Argentina was back into recession, mainly owing to an overvalued real exchange rate and a current account deficit of 3 per cent of GDP, which led to a rapid build-up of short-term foreign liabilities (“hot money”). Moreover, the increasing use of deficit spending to create economic stimulus and boost employ-ment creation led to a steady rise in general government net debt, which fuelled concerns among both foreign and domestic investors regarding the credibility of the currency peg. In early 2002, after having lost 12 billion pesos in trying to stabilize the currency, the Central Bank was forced to abandon the peg. The Plan was repealed by Congress and the peso was allowed to float freely again.
The ensuing rapid capital outflow and run on the banks made the economic recession even worse (between 1999 and 2002 GDP per capita contracted by more than 21 per cent). Unemployment jumped from 15 per cent to 21 per cent over the four years of the crisis. More importantly, the level of absolute poverty increased from 2.6 per cent of the total population in 1998 to 8.4 per cent in 2003 (World Bank, 2008). Similarly, the incidence of poverty based on a measure indicating whether a household could afford a basket of basic commodities (the poverty gap) almost doubled in the first year after the peg had been abandoned (INDEC, 2008).
Most macroeconomic indicators have recovered since the end of the crisis and labour market outcomes have improved, with unemployment having returned to its previous levels. The financial sector has stabilized but lending activity lags behind pre-crisis levels, with loans still below 11 per cent of GDP, compared to 25 per cent of GDP in 1998 (EIU, 2006). Finally, inflation – the main reason for the Convertibility Plan – has returned as an important policy issue, reaching double figures in 2006.
a The misery index measures the sum of inflation and unemployment rates.

55
2. The role of fi nancial globalization
Ecuador: mixed effects of dollarization
In Ecuador, policy-makers replaced the national currency (the sucre) by the dollar in 2001, in the aftermath of the 1999 financial crisis that had caused GDP to contract by 7 per cent, inflation to accelerate to over 50 per cent per year and the currency to depreciate by 200 per cent. Against the background of social unrest, a lack of congressional support for structural reform and the spectre of a run on the banks, dollarization brought immediate benefits by helping the macroeconomy to stabilize rapidly. The misery index fell by 45 per cent within 4 years (fig. 2.8).
Replacing the national currency by the dollar, however, caused the Ecuadorian govern-ment to lose revenues from seigniorage of around 7 per cent per year of GDP (Ecuador does not benefit from a seigniorage-sharing agreement with the United States). In addi-tion, deposit insurance is now the responsibility of a government agency, with an annual budget of around 0.2 per cent of GDP, further rising fiscal costs of dollarization. It is issued with an unlimited guarantee (Demirgüç-Kunt et al., 2006), creating a moral hazard bias that may have caused this contingent liability to generate a substantial fiscal burden in case another banking crisis hits the economy.b
More importantly, even though macroeconomic instability declined rapidly, real lending rates remain high and sovereign bond spreads are no lower than they were before the crisis period (and are still far higher than those observed in other Latin American countries). On the other hand, price competitiveness does not seem to have suffered from dollarization, as (non-oil) exports started to expand following a sharp contraction during the crisis, thus helping to reduce the (non-oil) current account deficit by 3 per cent between 2000 and 2005 (IMF, 2006).
So far, the benefits of dollarization have far outweighed its costs. Nevertheless, the mac-roeconomic environment needs to be strengthened further to lower the country’s vulner-ability to shocks. With only one policy instrument left, and against the background of a persistently high level of foreign debt, fiscal policies could play a more important role in helping to lower sovereign bond rates and improve financing conditions for domestic enterprises. This would further strengthen export growth securing the monetary base and could help bring down the unemployment rate, which is still high.
Figure 2.8. Misery index
1980 1982 1984
Argentina
Ecuador
1986 1988 1990 1992 1994 1996 1998 2000 2002 2004 2006
0
1
2
3
4
5
6
7
8
9
Ln(Misery index)
Source: IILS estimates based on IMF, World Economic Outlook database, 2007
b Since 2003, the guarantee has been restricted to 400% of GDP per capita, i.e. around $6600.

56
World of Work Report 2008: Income Inequalities in the Age of Financial Globalization
funds, which lobby for ever greater uniformity across the globe. Th e introduction of the legal framework of the European public company and the evolution and convergence of prudential regulation regimes towards the Basel II accord may be seen as evidence of their success. More broadly, fi nancial globalization is expected to lead to a convergence of capi-talisms, as capital owners will not accept diff erences in rates of return between countries when allocating their funds (Lorenzi, 2008).
Whether or not such a convergence of capitalisms or a level playing-fi eld among wel-fare states actually occur will depend on the interplay between two factors. On the one hand, further policy convergence allows fi nancial investors to exploit economies of scale and to maximise their profi t share. On the other hand, diff erent welfare state and policy confi gurations have been shown to be related to distinct comparative advantages in the tradable sector, producing similar aggregate productivity and employment growth rates (Ernst, 2004). In particular, Northern European countries have weathered their integra-tion into global capital markets remarkably well. Whether or not a country is coming under pressure to reform its welfare state policies towards less redistribution, therefore, depends to a large extent whether policy complementarities within the existing frame-work can be built up such as to guarantee suffi ciently high rates of returns for interna-tional investors.
E. Corporate governance and executive pay
An important microeconomic aspect of fi nancial liberalization concerns the expected pos-itive impact of a deeper, more competitive market for corporate control over executive performance and the quality of corporate governance. A key issue, in this regard, is the extent to which the level and growth of executive compensation corresponds to corpo-rate performance. Th e following section reviews the empirical evidence regarding the link between a fi rm’s performance and executive pay and discusses country specifi cities.
Does executive pay respond to performance?
Th e question of whether executive compensation refl ects economic performance is very controversial; the results partly depend on the geographical focus of a given study. Research originally concentrated on the United States, where the bulk of studies reported a posi-tive relation between pay and performance (Jensen and Murphy, 1990; Joskow and Rose, 1994; Kaplan, 1994; Boschen and Smith, 1995; Hallock, 1998; Hall and Liebman, 1998). Yet the validity of the fi ndings has been questioned. A number of studies have found a sta-tistically signifi cant link, which is, however, fi nancially unattractive and therefore fails to provide a strong incentive for executives (Jensen and Murphy, 1990; Garen, 1994). Other studies have found an even stronger link between compensation and performance (Hall and Liebman, 1998, Boschen and Smith, 1995). Several papers providing a meta-analysis of existing research (Tosi et al., 2000; Dalton et al, 2003) suggest that no widespread, strong link between compensation and performance has been established so far.
The pay-performance relation has also been examined in companies outside the United States. A statistically signifi cant pay-performance relation has been reported with regard to Canada (Zhou, 1999). Th e fi ndings of research focusing on Asia are more com-plex. Kato and Long (2005) document a positive relation between pay and performance among Chinese companies. According to Firth et al. (2006), however, the pay-perform-ance link is weak, which – in their view – raises questions about the eff ectiveness of fi rms’ incentive systems. Kato and Kubo (2006), Kato et al. (2006) and Unite et al. (2008)
57
2. The role of fi nancial globalization
also identify a positive relationship with regard to Japanese, Korean, and Philippine fi rms, respectively. Evidence from European countries presents a mixed picture. A number of studies relating to the United Kingdom fi nd a low pay-performance sensitivity (Gregg et al., 2005; Conyon and Murphy, 2000; Ozkan, 2007). Bruce et al. (2007) come to the same conclusion with regard to bonuses within UK companies. For Germany, Haid and Yurtoglu (2006) report a weak relation between compensation and performance, whereas Conyon and Schwalbach (2000) fi nd that the relation is positive in both Germany and the United Kingdom. By contrast, recent studies on Portugal (Fernandes, 2008) and the Netherlands (Dufh ues et al., 2007) do not fi nd any such relation. In Australia, the fi nd-ings vary. While Defi na et al. (1994) do not fi nd a signifi cant connection between pay and performance, Matolcsy (2000) reports that such a connection exists at times of economic growth but not during an economic slowdown. Recently, Merhebi et al. (2006) have doc-umented a statistically signifi cant link between pay and performance but concede that its economic relevance is rather low.
Overall, a stable and signifi cant relation between pay and performance has yet to be established; where such exists, it may be expected to be country-specifi c, depending largely on a country’s economic, institutional and cultural peculiarities. Moreover, various studies focusing on Asian countries emphasize that a positive pay-performance relation holds only for a certain type of fi rms. No such relation could be identifi ed in Chinese state-owned companies (Firth et al., 2006, Kato and Long, 2005), in Korean non-chaebol companies (Kato et al., 2006) or in companies with an affi liation to a family group (Unite et al., 2008). In Japanese companies, Abe et al. (2005) fi nd that compensation is less sensitive to performance in fi rms with a main bank relationship or a bank-appointed member of the board of directors.
Diversity of corporate governance models and executive pay
Th ree factors have been found to shape the evolution of executive pay: (a) the role of direc-tors; (b) the role of institutional investors and employee representatives; and (c) the role of consultancy fi rms.
A number of studies, in particular those using the managerial power approach, have devoted considerable attention to the link between compensation and performance and to the presence (or absence) of institutional factors restricting (or increasing) executives’ managerial discretion. Among other things, these studies highlight the role of the com-position of the board of directors. Evidence relating to US and Portuguese fi rms suggests that compensation is higher when the board is larger, since this renders organized opposi-tion by directors against executives more diffi cult (see Core et al, 1999, Fernandes, 2008). Th is fi nding has recently been confi rmed in a cross-national study by Otten and Heu-gens (2007) of executive salaries and bonuses in 17 countries. Similarly, compensation is higher if the appointment of the majority of the executives has been infl uenced by the CEO. Th e CEO’s relationship with the other executives and with the bodies in charge of determining executive compensation also seems to be a relevant factor. As far as the United States is concerned, it has been argued that directors’ and executives’ interests are closely intertwined, as directors have an interest in being reappointed to the board (for fi nancial and social reasons). Since the slate containing the list of candidates to be nom-inated in the management is normally the only slate for elections, CEOs in the United States have signifi cant infl uence over re-appointment. Directors therefore have an interest in maintaining a good relationship with the CEO. Th is may, however, aff ect their capacity to supervise decisions on the compensation of executives (Bebchuk and Fried, 2003). Evi-dence confi rming this assumption is provided by Core et al. (1999), who show that CEO compensation is higher when directors have been appointed by the CEO directly.

58
World of Work Report 2008: Income Inequalities in the Age of Financial Globalization
Secondly, the presence of institutional investors has been identifi ed as having an infl u-ence on executive compensation. A study by Hartzell and Starks (2002) covering a large number of fi rms in the United States between 1991 and 1997 fi nds that the higher the number of institutional investors, the lower the compensation of executives, and vice versa. David, Kochar and Levitas (1998) distinguish between institutional investors that have other business relationships with the fi rm and those that have not. Th ey fi nd that the level of executive compensation is positively related with the former and negatively with the latter. Comparable fi ndings are reported in the case of the United Kingdom, where, in their study of a large number of companies, Dong and Ozkan (2007) document that, while the mere presence of institutional investors neither constrains the level of executive pay nor strengthens the pay-performance relationship, “dedicated investors with long-term horizons” do have a positive infl uence on both factors.
A fi nal factor in the shaping of executive compensation is the role played by com-pensation consulting fi rms providing companies with data and advice regarding compen-sation. Bebchuk and Fried (2003) argue, with regard to the United States, that since it is typically the human resources departments of companies that select such consultancy fi rms (which are in turn accountable to the executive board) a confl ict of interest may arise: consultants have an interest not only in providing the best advice regarding execu-tive compensation but also in being rehired by the company (or hired by other companies). Crystal (1991) has also documented that consultants who provide CEO compensation advice frequently conduct work in the same fi rms in other areas. Th is may create an incentive for the consultants to avoid giving advice that may be regarded as inconven-ient by the executive board, in order not to lose additional contract opportunities (ibid.). Other studies show that consultancy fi rms may propose an increase in executive compen-sation even when the company performance is below par. According to Gillan (2001), they usually propose compensation packages that are either performance-driven or peer group-driven, that is, based on a comparison with compensation packages in other fi rms. Th ey can thus shift from one method of calculation to another, depending on the cir-cumstances, but not necessarily on the basis of corporate performance. Moreover, a mem-orandum of the House of Representatives of the United States, dated 6 March 2008, provides evidence of a case where, aft er one consultancy fi rm had recommended a reduc-tion in CEO pay, the management of the company had hired another which was more compliant with the CEO’s interests (House of Representatives, 2008).
Policy developments
In many countries, proposals have been put forward with a view to mitigating the prob-lems of executive compensation illustrated above. Understandably, given the wide varia-tions that exist, proposals are highly country-specifi c.
A number of the proposals deal with the institutional framework in which execu-tive compensation is determined. In the United States, some urge that the share holder meeting, usually referred to as “say on pay”, should have an enhanced role, in the form of a non-binding vote on executive compensation. While not having a veto, shareholders would thus have an institutional platform at which to express their disagreement with a compa-ny’s remuneration policy (Gopalan, 2007). Similarly, the Austrian trade unions recently proposed stronger information rights for shareholders on executive compensation (Arbeit-nehmerkammer Wien, 2008). Another proposal is to strengthen the committee in charge of determining compensation. For instance, German trade unions suggest that supervi-sory boards in that country should have more power and, in particular, that employee rep-resentatives should be involved more closely in determining compensation (German Trade Union Federation, 2008).

59
2. The role of fi nancial globalization
Secondly, there are also proposals relating to the criteria used to set executive com-pensation. German and Austrian trade unions have proposed that not only personal per-formance and fi rm performance but also social and environmental sustainability should be taken into account (ibid.; Arbeitnehmerkammer Wien, 2008).
A third group of proposals – in the United States, Austria and elsewhere (Anderson et al., 2007 and Arbeitnehmerkammer Wien, 2008) – calls for more rigid taxation, the suggestion being that companies should no longer be able to deduct executive compensa-tion as a business expense. Th is would discourage excessively high executive compensation by increasing the costs to the company.
F. Policy considerations
Financial globalization has not lived up to its promises. True, fi nancial globalization can contribute to improve the allocation of savings and investment and thus support growth and incomes –this is why it would be wrong to close the economy to international cap-ital fl ows. However, the chapter has argued that benefi ts have been slow to emerge even in countries that opened up more quickly and have oft en been reversed by fi nancial crises that wiped out earlier income and employment gains. Moreover, fi nancial globalization seems to have eroded bargaining power of employees, contributing to the trend decline in the wage share over and above any eff ect resulting for instance from trade integration or sectoral change. Financial globalization under insuffi ciently developed domestic banking markets will increase the risk of fi nancial crises.
Th e main policy implication from these fi ndings is that governments should take into account the social impacts of fi nancial globalization before engaging in an all-embracing opening of capital markets. A cautious approach to fi nancial globalization is especially important in countries where fi nancial markets are not suffi ciently developed and where supervision mechanisms are weak. But in all countries, it is crucial to reinforce prudential regulation so as to reduce irresponsible risk-taking on the part of certain fi nancial actors. Indeed there is a “moral hazard” problem in that these actors grasp all the gains from irre-sponsible fi nancial positions, while the losses from such operations are partly shift ed to society. However, foreign direct investment should be allowed to enter, especially in the case of emerging economies and developing countries, which can benefi t the most from such investments in terms of technological transfer and productivity growth.
Th ere is also a role for coordinated action among countries. As the recent sub-prime crisis has demonstrated, fi nancial turbulence in one country (especially if it is a large one) tends to spill over to other countries. Several policy options have been put forward in this respect, such as a more wide-spread use of regional currency areas with “seigniorage” sharing agreements. Th ough the merits and de-merits of each proposed solution could not be analyzed in this chapter, it is interesting to note that most of the proposals involve some form of regulation of fi nancial practices.

60
World of Work Report 2008: Income Inequalities in the Age of Financial Globalization
Appendix A
Th e impact of fi nancial market crises on growth and inequality: An empirical assessment
Th e purpose of this Appendix is to present baseline evidence of the link between fi nancial crisis and growth and fi nancial crisis and inequality. Th is is done by means of panel regres-sions estimated by FGLS using fi ve eight-year non-overlapping windows for the period 1960-2006. Th e sample used in the regressions consists of 146 countries in the analysis of economic growth and 102 countries in the case of inequality. Th e diff erence in the number of countries taken into account by both regressions is explained by the diffi culty in fi nding information on inequality for all countries for the period studied.
Th e methodology employed is similar to that presented in Rancière et al. (2008), but adding an equation to test for the eff ect of banking crisis on inequality. Th e following equations have been estimated:
(1) ΔYit = γXit + β1 μ ΔB,it + β2 σ ΔB,it + β3 sk ΔB,it + εit
(2) Git = γXit + β1 μ ΔB,it + β2 σ ΔB,it + β3 sk ΔB,it + εit
Growth (ΔYit) is measured by the average growth rate of per-capita GDP and inequality (Git) by the Gini coeffi cient (expressed in logs). Regarding the explanatory variables, the three moments of credit growth: the mean (μ ΔB,it), the standard deviation (σ ΔB,it), and the skewness (sk ΔB,it), are used as a measure of fi nancial development and fi nancial crisis. Th e
Table 2.A1. Definitions and sources of variables used in the regression analysis
Variable Definition Source
GDP per capita growth Annual growth rate. World Development Indicators (2007).
Gini coefficients World Development Indicators (2007).
Initial GDP per capita Initial value of ratio of total GDP to total population (in logs). GDP is in 2000 constant US$.
World Development Indicators (2007).
Initial secondary schooling Ratio of total secondary enrolment, regardless of age, to the population of the age group that officially corresponds to that level of education. Expressed in logs.
World Development Indicators (2007).
CPI Consumer price index Consumer price index (2000 = 100) at the end of the year.
IFS data – line 64 ZF and 64 XZF.
Real credit growth Annual growth rate of real domestic bank credit claims on the private sector.
Institute calculations based on data from IFS – line 22: Claims on Private Sector. Domestic bank credit claims are deflated with end of the year CPI index.
Government consumption General government final consumption expenditure as a % of GDP. Expressed in logs.
World Development Indicators (2007).
Inflation rate Annual % change in CPI. World Development Indicators (2007).
Trade openness Trade (Exports + Imports) as a % of GDP. World Development Indicators (2007).

61
2. The role of fi nancial globalization
variable used for this purpose is the growth rate of real bank credit to the private sector. Finally, Xit is a vector of control variables and εit is the error term. In this analysis, the control set used includes initial per-capita GDP (in logs), the initial ratio of secondary schooling, the infl ation rate, the ratio of government consumption as a percentage of GDP (in logs) and a measure of trade openness (X+M / GDP). An overview of the diff erent vari-ables used and their sources and defi nitions can be found in table 2.A1.
Th e moments of credit growth and the variables measured in averages are computed over each of the fi ve diff erent periods considered (1960-1969; 1970-1978; 1979-1987; 1988-1996, and; 1997-2006) and the initial variables are measured in the fi rst year of each period. All panel regressions are estimated with fi xed-eff ects and controlled for het-eroskedasticity and auto-correlation of the error terms.
Robustness tests include the restriction of the country sample by excluding emerging Europe and Central Asian countries due to their more limited coverage over time. More-over, the estimates have also been run by weighting observations with GDP per capita levels and by excluding outliers to ensure that no particular data point is driving the regression. Outlier detection has been based on the Cook statistics. Table 2.A2 summa-rizes the diff erent equations and robustness checks.
Table 2.A2. Regression results
Baseline regression Reduced sample Weighted regression Outlier control
GDP per capitagrowth
Gini (log)
GDP per capitagrowth
Gini (log)
GDP per capitagrowth
Gini (log)
GDP per capitagrowth
Gini (log)
Bank credit growth 0.079 1.2E-03 0.079 1.2E-03 0.026 6.9E-04 0.123 7.5E-04
(26.40)** (27.55)** (26.40)** (27.55)** (9.25)** (12.37)** (50.80)** (7.33)**
Bank credit variance -0.021 -1.2E-03 -0.021 -1.2E-03 0.005 -3.0E-04 -0.035 -1.6E-03
(-20.74)** (-41.00)** (-20.74)** (-41.00)** (2.13)* (-4.24)** (-36.95)** (-20.16)**
Bank credit skewness
-0.183 -4.4E-03 -0.183 -4.4E-03 -0.134 -2.2E-02 -0.244 -4.6E-03
(-5.35)** (-2.64)** (-5.35)** (-2.64)** (-3.28)** (-10.41)** (-7.90)** (-2.63)**
Initial level of GDP per capita
-0.662 3.3E-02 -0.662 3.3E-02 -1.53 -4.7E-03 -0.447 2.9E-02
(-10.94)** (14.70)** (-10.94)** (14.70)** (-16.83)** (-2.18)* (-8.59)** (9.22)**
Initial level of secondary schooling
0.032 3.2E-02 2.9E-02 2.7E-02
(13.27)** (13.27)** (8.85)** (18.15)**
Inflation rate
-0.003 1.6E-05 -0.003 1.6E-05 -0.004 -5.4E-05 -0.002 7.7E-06
(-32.98)** (3.79)** (-32.98)** (3.79)** (-10.46)** (-11.06)** (-13.85)** (1.12)
Government consumption
-1.39 -0.032 -1.39 -0.0322 -1.102 -0.190 -0.799 -2.1E-02
(-13.63)** (-8.09)** (-13.63)** (-8.09)** (-7.34)** (-32.46)** (-11.18)** (-3.02)**
Trade openness 0.018 -1.2E-04 0.018 -1.2E-04 0.013 -1.0E-03 0.011 8.1E-05
(14.30)** (-3.70)** (14.30)** (-3.70)** (10.64)** (-32.94)** (12.75)** (2.24)*
Constant 6.33 3.46 5.88 3.39 13.42 4.08 4.81 3.33
(13.72)** (408.28)** (13.10)** (212.42)** (19.92)** (209.57)** (13.16)** (92.33)**
Observations 559 236 559 236 559 236 509 223
Number of countries 146 102 146 102 146 102 135 96
Note: Estimated based on feasible generalized least squares. All regressions are controlled for regional-fixed effects. Absolute value of z statistics in parentheses. The error terms are corrected for heteroskedasticity and autocorrelation. Significance levels: * significant at 5%; ** significant at 1%.
Source: IILS estimates

62
World of Work Report 2008: Income Inequalities in the Age of Financial Globalization
Appendix B
Empirical studies regarding pay for performance
Author and country
Reference Findings on the link between executive compensation and firm performance
Method used
Dardour, A.(2008)France
Forthcoming. Finds a positive but weak and insig-nificant link between executive com-pensation and firm performance.
Examines 250 companies for the period of 2002-2005.Analyzes fixed and variable cash compensa-tion and share-based compensation.Takes into account stock market based and accounting-based performance measures.
Fernandes, N.(2008)Portugal
Board compensation and firm performance: the role of “independent” board members, Journal of Multinational Finan-cial Management 78, 30–44.
Does not find a link between execu-tive compensation and firm perform-ance and documents that not even the variable component is related to firm performance.
Examines 58 companies for the period of 2002-2004.Analyzes fixed and variable cash compensa-tion and share-based compensation.Takes into account stock market based per-formance measures.
Ozkan, N. (2008)United Kingdom
CEO Compensation and Firm Performance: An Empirical Investigation of UK Panel Data, available at SSRN: http://ssrn.com/abstract=1102703.
Finds a weak positive link between executive compensation and firm performance.
Examines 390 companies for the period of 1999-2005.Analyzes fixed and variable cash compensa-tion and share-based compensation.Takes into account stock market based per-formance measures.
Unite, A.A., Sullivan M.J., Brookmann, J., Majadillas, M.A., and Taningco, A. (2008)Philippines
Executive pay and firm perform-ance in the Philippines,Pacific-Basin Finance Journal forthcoming, Available in the final version as accepted by the journal under: https://science-direct.com.
Finds a positive link between executive compensation and firm performance.This holds, however, only for com-panies that are not affiliated to a corporate group.
Examines 125 companies for the period of 2001-2002 and 148 firms for the period of 2002-2003.Analyzes fixed and variable cash compensation.Takes into account stock market based and accounting-based performance measures.
Duffhues, P. and Kabir, R.(2007)Netherlands
Is pay-performance relationship always positive? Evidence from the Netherlands, Journal of Mul-tinational Financial Management 18, 45-60.
Does not find a link between executive compensation and firm performance.
Examines 135 companies for the period of 1998-2001.Analyzes fixed and variable cash compensa-tion, but also includes a smaller sample of companies in order to analyze share-based compensation.Takes into account stock market based and accounting-based performance measures.
Firth, M., Fung, P., Rui, O. (2006)China (mainland)
Corporate performance and CEO compensation in China, Journal of Corporate Finance 12, 693–714.
Finds a positive but weak link between executive compensation and firm performance, and only for firms whose major shareholder is not a state agency.
Examines 549 companies for the period of 1998-2000.Analyzes fixed and variable cash compensation.Takes into account stock market based and accounting-based performance measures.
Haid, A., Yurtoglu, B.(2006)Germany
The impact of ownership struc-ture on executive compensation in Germany, Journal of Multina-tional Financial Management, forthcoming.
Finds a “negligibly” weak link between executive compensation and firm performance.
Examines 160 companies for the period of 1987-2001.Analyzes fixed and variable cash compensation.Takes into account stock market based per-formance measures.
Kato, T., Kim, W. and Lee, J.H. (2006)South Korea
Executive compensation, firm performance and chaebols in Korea: evidence from new panel data, Pacific-Basin Finance Journal 15, 36–55.
Finds a positive link between execu-tive compensation and firm perform-ance.This does, however, not apply to chaebol firms.
Examines 246 companies for the period of 1998-2001.Analyzes fixed and variable cash compensation.Takes into account stock market based and accounting-based performance measures.

63
2. The role of fi nancial globalization
Author and country
Reference Findings on the link between executive compensation and firm performance
Method used
Kato, T., Kubo, K.(2006)Japan
CEO compensation and firm performance in Japan: evi-dence from new panel data on individual CEO pay, Journal of Japanese and International Economies 20, 1–19.
Finds a positive link between executive compensation and firm performance.
Examines 51 companies for the period of 1986-1995.Analyzes fixed and variable cash compensation.Takes into account stock market based and accounting-based performance measures.
Merhebi, R, Pattenden, K., Swan, P.L. and Xianming, Z.(2006)Australia
Australian chief executive remu-neration: pay and performance, Accounting and Finance 46, 481-487.
Finds a positive link between executive compensation and firm performance, admitting that the link is statistically but not economically relevant.
Examines 722 companies for the period of 1990-1999.Analyzes fixed and variable cash compensation.Takes into account stock market based per-formance measures.
Abe, N., Gaston, N. and Kubo, K.(2005)Japan
Executive pay in Japan: the role of bank-appointed monitors and the main bank relationship, Japan and the World Economy 17, 371–394.
Finds a positive link between executive compensation and firm performance. The pay-performance relation in Japan is weaker for companies with a Main Bank link or a bank-appointed member of the board of directors, but executive compensation in those companies is also lower.
Examines 55 companies for the period of 1989-1999.Analyzes fixed and variable cash compensation.Takes into account stock market based and accounting-based performance measures.
Paul Gregg, P., Jewell, S.,Tonks, I. (2005)UK
Executive Pay and Perform-ance in the UK 1994-2002, CMPO Working Paper Series No. 05/122.
Find a weak positive link between executive compensation and firm performance.Also identify an asymmetric link between pay and performance: In years and for companies in which stock returns are relatively high, pay-performance elasticities are high, but executive pay is less sensitive to per-formance in those cases when stock returns are low.
Examines 415 companies for the period of 1994-2002.Analyzes fixed and variable cash compensation.Takes into account stock market based and accounting-based performance measures.
Kato, T. and Long, C.(2005)China (mainland)
Executive compensation, firm performance, and corporate governance in China: evidence from firms listed in the Shanghai and Shenzhen stock exchanges, Economic Development and Cultural Change 54, 945-983.
Finds a positive link between executive compensation and firm performance.Chinese executives are penalized for making negative profits although they are neither penalized for declining profits nor rewarded for rising profits insofar as it is positive.The pay-performance link is weaker with regard to companies whose major share-holder is a state agency.
Examines 942 companies for the period of 1998-2002.Analyzes fixed and variable cash compensation.Takes into account stock market based and accounting-based performance measures.
Dalton, D.R., Daily, C.M., Certo, S.T. and Roengpitya, R. (2003).
Meta-analysis of Financial Per-formance and Equity: Fusion or Confusion? Academy of Man-agement Journal 46, 13-26.
Reports that only a few studies find a systematic link between executive compensation and firm performance.
Provides a meta-analysis of 229 empirical studies on the link between executive com-pensation and firm performance.
Conyon, M., Murphy, K.(2000)UK
The prince and the pauper? CEO pay in the United States and United Kingdom, EconomicJournal 110, 640–671.
Documents a stonger pay-perform-ance link for the US than for the UK.
Examines 510 companies for 1997.Analyzes fixed and variable cash compensa-tion and share-based compensation.Takes into account stock market based per-formance measures.
Conyon and Schwalbach(2000)UKGermany
Conyon, M.J. and Schwalbach, J.. (2000). Executive Compen-sation: Evidence from the UK and Germany, Long Range Plan-ning 33, 504-526.
Finds a positive link between execu-tive compensation and firm perform-ance in both countries.
Examines 102 companies for the period of 1969-1995 (UK) as well as 48 companies for the period of 1968-1994 (Germany).Analyzes fixed and variable cash compensation.Takes into account stock market based per-formance measures.

64
World of Work Report 2008: Income Inequalities in the Age of Financial Globalization
Author and country
Reference Findings on the link between executive compensation and firm performance
Method used
Matolcsy, Z.P.2000Australia
Executive cash compen-sation and corporate per-formance during different economic cycles, Contempo-rary Accounting Research, 17, 671-688, also available at SSRN: http://ssrn.com/abstract=167068.
Finds a positive link between execu-tive compensation and firm perform-ance during periods of economic growth but no link during periods of economic downturn.
Examines 100 companies for the period of 1988-1995.Analyzes fixed and variable cash compensation.Takes into account accounting-based per-formance measures.
Zhou, X. (2000)Canada
CEO pay, firm size, and cor-porate performance: evidence from Canada, Canadian Journal of Economics 33, 213–252.
Finds a positive link between executive compensation and firm performance.
Examines 755 companies for the period of 1991-1995.Analyzes fixed and variable cash compensa-tion and share-based compensation.Takes into account stock market based per-formance measures.
Hall, B., Liebman, J.(1998)USA
Are CEOs really paid like bureaucrats?, Quarterly Journal of Economics 113, 653–691.
Finds a strong positive link between executive compensation and firm performance, pay-performance sensitivity increased over the period studied.
Examines 426 companies for the period of 1980-1994.Analyzes fixed and variable cash compensa-tion and share-based compensation.Takes into account stock market based and accounting-based performance measures.
Tosi , H.L., Werner, S., Katz, J.P. & Gomez-Mejia, L.R. (2000). USA
How much does performance matter? A meta-analysis of CEO pay studies. Journal of Manage-ment, 26, 301-339.
Reports that the empirical research has only documented a weak link between executive compensation and firm performance.
Provides a meta-analysis of 137 empirical studies on the link between executive com-pensation and firm performance.
Boschen, J.F. and K.J. Smith(1995)USA
You can pay me now and you can pay me later: the dynamic response of executive compensa-tion to firm performance, Journal of Business 68, 577–608.
Finds a positive link between execu-tive compensation and firm perform-ance, pay-performance sensitivity increased over the four decades studied.
Examines 16 companies for the period of 1948-1990.Analyzes fixed and variable cash compensa-tion and share-based compensation.Takes into account stock market based measures.
Defina, A, Harris, T.C., Ramsay, I.M.1994Australia
What is Reasonable Remunera-tion for Corporate Officers? An Empirical Investigation into the Relationship between Pay and Per-formance in the Largest Australian Companies Company and Securi-ties Law Journal 12, 6, 341-356.
Does not find a significant link between executive compensation and firm performance.
Examines 89 companies for the period of 1989-1990.Analyzes fixed and variable cash compensa-tion and share-based compensation.Takes into account stock market based and accounting-based performance measures.
Garen, J.E., 1994,USA
Executive Compensation and Principal-Agent Theory, Journal of Political Economy, 102, 6, 1175-1199.
Finds a weak link between firm-performance and executive compensation.
Examines 415 companies for 1988.Analyzes fixed and variable cash compensation.Takes into account stock market based and accounting-based performance measures.
Joskow, P. and Rose, N. (1994)USA
CEO pay and firm insurance: dynamics, asymmetries, and alternative performance meas-ures. NBER Working Paper No. 4976, National Bureau of Economic Research.
Finds a positive link between executive compensation and firm performance.
Examines 678 companies for the period of 1970-1990.Analyzes fixed and variable cash compensa-tion and share-based compensation.Takes into account stock market based and accounting-based performance measures.
Kaplan, S. (1994)USAJapan
Kaplan, S. (1994), Top executive rewards and firm performance: a comparison of Japan and the United States, Journal of Polit-ical Economy 102, 510–546.
Finds a positive link between executive compensation and firm performance.
Examines 119 Japanese companies and 146 US companies for 1980.Analyzes fixed and variable cash compensa-tion and share-based compensation.Takes into account stock market based and accounting-based performance measures.
Jensen, M. and Murphy, K. (1990)USA
Jensen, M. and Murphy, K.J. (1990), Performance pay and top-management incentives, Journal of Political Economy 98, 225–264.
Finds a statistically significant but weak positive link between executive compensation and firm performance.
Examines 73 Japanese for the period of 1969-1983.Analyzes fixed and variable cash compensa-tion and share-based compensation.Takes into account stock market based per-formance measures.

65
2. The role of fi nancial globalization
References
Abe, N.; Gaston, N.; Kubo, K. 2005. “Executive pay in Japan: Th e role of bank-appointed monitors and the main bank relationship”, in Japan and the World Economy, Vol. 17, No. 3, pp. 371-394.
Acemoglu, D.; Zilibotti, F. 1997. “Was Prometheus unbound by chance? Risk, diversifi cation, and growth”, in Journal of Monetary Economics, Vol. 50, No. 1, pp. 709-751.
Anand, S.; Segal, P. 2008. “What do we know about global income inequality”, in Journal of Economic Literature, Vol. 46, No. 1, pp. 57-94.
Anderson, S. et al. 2007. Executive excess 2007. Th e staggering social cost of U.S. business leadership, (Washington D.C., US, Institute for Policy Studies and United for a fair Economy). Available at: http://www.ips-dc.org/reports/070829-executiveexcess.pdf
Arbeitnehmer-Kammer Wien. 2008. Trotz Börsenkrise erneut Rekordgagen für ATX-Manager. Available at: http://www.arbeiterkammer.at/www-192-IP-41005.html
Bebchuk, L.A.; Fried, J.A. 2003. “Executive compensation as an agency problem”, in Journal of Economic Perspectives, Vol. 17, No. 3, pp. 71-92.
Beck, R.; Fidora, M. 2008. “Th e impact of sovereign wealth funds on global fi nancial markets”, Occasional Paper Series No. 91 (Frankfurt am Main, European Central Bank).
Bonfi glioli, A. 2007. Financial integration, productivity and capital accumulation, (Barcelona, Centre de Recerca en Economia Internacional), unpublished document.
Boschen, J.F.; Smith, K.J. 1995. “You can pay me now and you can pay me later: the dynamic response of executive compensation to fi rm performance”, in Journal of Business, Vol. 68, No. 4, pp. 577-608.
Bruce, A. et al. 2007. “Executive bonus and fi rm performance in the UK”, in Long Range Planning, Vol. 40, No. 3, pp. 280-294.
Chinn, M.; Ito, H. 2007. “A new measure of fi nancial openness”, unpublished document.Choi, M. 2001. “Th reat eff ect of foreign direct investment on labor union wage premium”,
Working Paper No. 27 (Amherst, MA, Political Economy Research Institute).Conyon, M.J.; Murphy, K.J. 2000. “Th e prince and the pauper? CEO pay in the United States
and United Kingdom”, in Economic Journal, Vol. 110, No. 461, pp. 640-671.Conyon, M.J.; Schwalbach, J. 2000. “Executive compensation: Evidence from the UK and
Germany”, in Long Range Planning, Vol. 33, No. 4, pp. 504-526.Core, J.E.; Holthausen, R.W.; Larcker, D.F. 1999. “Corporate governance, chief executive offi cer
compensation, and fi rm performance”, in Journal of Financial Economics, Vol. 51, No. 3, pp. 371-406.
Crystal, G. S. 1991. In search of excess. (New York, NY Norton)Dalton, D.R. et al. 2003. “Meta-analyses of fi nancial performance and equity: fusion or
confusion?”, in Academy of Management Journal, Vol. 46, No. 1, pp. 13-26. Dardour, A. 2008, “Les déterminants de la rémunération du premier dirigeant des sociétés
cotées en France Etude empirique sur les sociétés de l’indice SBF 250”, forthcoming.David, P.; Kochhar, R.; Levitas, E. 1998, “Th e eff ect of institutional investors on the level and
mix of CEO compensation”, in Academy of Management Journal, Vol. 41, pp. 200-208.Davies, J.B.; Sandström, S.; Shorrocks, A.; Wolff , E. N. 2008. Th e world distribution of
household wealth, Discussion Paper No. 2008/03 (Helsinki, UNU-WIDER).Defi na, A.; Harris, T.; Ramsay, I. 1994. “What is reasonable remuneration for corporate
offi cers? An empirical investigation into the relationship between pay and performance in the largest Australian companies”, in Company and Securities Law Journal, Vol. 12, No. 6, pp. 341-356.
Demirgüç-Kunt, A.; Kane, E.; Laeven, L. 2006. “Deposit insurance design and implementation: Policy lessons from research and practice”, World Bank Policy Research Working Paper 3969.
Deutscher Gewerkschaft sbund (German Trade Union Confederation), Bundesvorstand. 2008. DGB Vorschläge für ein gesetzliches Maßnahmebündel zur Regulierung der Vorstandsvergütung. http://www.dgb.de/themen/mitbestimmung/untern_mitbest/weiterentwicklung.htm
Diwan, I. 2001. “Debt as sweat: Labor, fi nancial crises, and the globalization of capital”, unpublished manuscript

66
World of Work Report 2008: Income Inequalities in the Age of Financial Globalization
Dong, M.; Ozkan, A. 2007. “Institutional investors and director pay. An empirical study of UK companies”, in Journal of Multinational Financial Management, Vol. 18, pp. 16-29.
Duffh ues, P.; Kabir, R. 2007. “Is pay-performance relationship always positive? Evidence from the Netherlands”, in Journal of Multinational Financial Management, Vol. 18, pp. 45-60.
Duval, R.; Elmeskøv, J.; Vogel, L. 2007. Structural policies and economic resilience to shocks, OECD Economics Department Working Paper No. 567 (Paris).
Ernst, E. 2004. “Financial systems, industrial relations and industry specialization: An econometric analysis of institutional complementarities”, in H. Schubert (ed.): Th e Transformation of the European Financial System, (Vienna, Austrian Central Bank), pp. 60-95.
Ernst, E.; Amable, B.; Palombarini, S. 2005. “How do fi nancial markets aff ect industrial relations: An institutional complementarity approach”, in Socio-Economic Review, Vol. 3, No. 2, pp. 311-330.
Ernst, E.; Escudero, V. Forthcoming. 2008. “Will the next globalization be great? Evidence on the eff ects of globalization on employment and inequality”, Discussion Paper No. 191 (International Institute for Labour Studies, Geneva).
Felton, F.; Reinhart, C. (eds.) 2008. Th e fi rst fi nancial crisis of the 21st century (London, Center for Economic Policy Research).
Fernandes, N. 2008. “Executive compensation: Board compensation and fi rm performance: the role of “independent” board members”, in Journal of Multinational Financial Management, Vol. 18, No. 1, pp. 30-44.
Firth, M.; Fung, P.; Rui, O. 2006. “Corporate performance and CEO compensation in China”, in Journal of Corporate Finance, Vol. 12, No. 4, pp. 693-714.
Fisher, S. 2003. “Globalization and its challenges”, in American Economic Review, Vol. 93, No. 2, pp. 1-30.
Garen, J.E. 1994. “Executive compensation and principal-agent theory”, in Journal of Political Economy, Vol. 102, No. 6, pp. 1175-1199.
Gillan, S.L. 2001. “Has pay for performance gone awry? Views from a corporate governance forum”, in Research Dialogue, Vol. 68, No. 1, pp. 1-16.
Gopalan, S. 2007. “Say on pay, and the SEC disclosure rules: Expressive law and CEO compensation”, in Pepperdine Law Review, Vol. 35, pp. 101-163.
Gourinchas, P.-O.; Jeanne, O. 2007. Capital fl ows to developing countries: Th e allocation puzzle, National Bureau of Economic Research (NBER), Working Paper, No. 13602 (Cambridge, MA).
Gregg, P.; Jewell, S.; Tonks, I. 2005. “Executive pay and performance in the UK 1994-2002”, Center for Market and Public Organisation (CMPO) Working Paper Series No. 05/122 (University of Bristol). Available at: http://www.bristol.ac.uk/cmpo/publications/papers/2005/wp122.pdf [21 August 2008].
Haid, A.; Yurtoglu, B. 2005 Th e impact of ownership structure on executive compensation in Germany, paper presented at the 32nd Conference of the European Association for Research in
Industrial Economics (EARIE), September 2005. Available at: http://www.fep.up.pt/conferences/earie2005/cd_rom/Session%20VII/VII.A/burcin.pdf [20 August 2008].
Hall, B.; Liebman, J. 1998. “Are CEOs really paid like bureaucrats?”, in Quarterly Journal of Economics, Vol. 113, Aug., pp. 653-691.
Hallock, K. F. (1997). “Reciprocally interlocking boards of directors and executive compensation”, in Journal of Financial & Quantitative Analysis, Vol. 32, No. 3, pp. 331-344.Hartzell, J.C.; Starks, L.T. 2002. “Institutional investors and executive compensation”, in Th e
Journal of Finance, Vol. 58, No. 6, pp. 2351-2374.Henry, P. B. 2007. “Capital Account Liberalization: Th eory, Evidence, and Speculation” in
Journal of Economic Literature, Vol. 45, pp. 887–935.House of Representatives, Committee on Oversight and Government Reform. 2008.Institutional Shareholder Service (Australia). 2006. CEO pay – It’s even higher than you think.
Valuation of executive options in Australia 2006 (Melbourne).Instituto Nacional de Estadística y Censos (INDEC). 2008. Brecha de la pobreza en el total de
aglomerados urbanos, desde mayo 2001 en adelante [Poverty gaps in urban agglomerations from 2001 onwards] (Buenos Aires).
International Monetary Fund (IMF). 2006. Ecuador: Selected issues, Country Report No. 06/103 (Washington, DC).

67
2. The role of fi nancial globalization
—. 2007. World Economic Outlook: Globalisation and Inequality (Washington, DC).Jaumotte, F.; Tytell, I. 2007. How has the globalization of labor aff ected the labor income share in
advanced countries?, IMF Working Paper, no. 07/298 (Washington, DC).Jensen, M. and Murphy, K.J. 1990. “Performance pay and top-management incentives”, in
Journal of Political Economy, Vol. 98, pp. 225-264.Joskow, P.; Rose, N. 1994. CEO pay and fi rm insurance: dynamics, asymmetries, and alternative
performance measures. National Bureau of Economic Research Working Paper No. 4976.Kalemli-Özcan, S.; Sorensen, B. E.; Yosha, O. 2001. “Risk sharing and industrial specialization:
Regional and international evidence”, in American Economic Review, Vol. 93, No. 3, pp. 903-918.
Kaplan, S. 1994. “Top executive rewards and fi rm performance: a comparison of Japan and the United States”, in Journal of Political Economy, Vol. 102, pp. 510-546.
Kato, T.; Kim, W.; Lee, J.H. 2006. “Executive compensation, fi rm performance and chaebols in Korea: evidence from new panel data”, in Pacifi c-Basin Finance Journal, Vol. 15, No. 1, pp. 36-55.
Kato, T.; Kubo, K. 2006. “CEO compensation and fi rm performance in Japan: evidence from new panel data on individual CEO pay”, in Journal of Japanese and International Economies, Vol. 20, No. 1, pp. 1-19.
Kato, T.; Long, C. 2005. “Executive compensation, fi rm performance, and corporate governance in China: Evidence from fi rms listed in the Shanghai and Shenzhen stock exchanges”, in Economic Development and Cultural Change, Vol. 54, pp. 945-983.
King, R. G.; Levine, R. 1993. “Finance and growth: Schumpeter might be right”, in Quarterly Journal of Economics, Vol. 108, No. 3, pp. 717-738.
Kose, M. A. et al. 2006. Financial globalization: A reappraisal, IMF Working Paper No. 06/189 (Washington, DC).
Kose, M. A.; Prasad, E. S.; Terrones, M. E. 2008. “Does openness to internacional fi nancial fl ows contribute to productivity growth?”, IZA Discussion Paper, no. 3634.
Lane, P; Milesi-Feretti, G. M. 2006. Th e external wealth of nations mark II: revised and extended estimates of foreign assets and liabilities, 1970-2004, IMF Working Paper No. 06/69 (Washington, DC).
Laeven, L.; Valencia, F. 2008. “Systemic Banking Crises: A New Database”, IMF Working Paper, No. 08/224 (Washington, DC).
Lorenzi, J.-H. (ed.) 2008. La guerre des capitalismes aura lieu. [Th e war of capitalisms will take place] (Paris, Editions Perrin).
Lucas, R. E. 1990. “Why doesn’t capital fl ow from rich to poor countries?”, in American Economic Review, Vol. 80, No. 2, pp. 92-96.
Mahler, V. A.; Jesuit, D. K. 2006. “Fiscal Redistribution in the Developed Countries: New Insights from the Luxembourg Income Study,” in Socio-Economic Review, Vol. 4, No. 3, pp. 483-511.
Matolcsy, Z.P. 2000. “Executive cash compensation and corporate performance during diff erent economic cycles”, in Contemporary Accounting Research, Vol. 17, pp. 671-688.
McKinnon, R. I. 1973. Money and Capital in Economic Development (Washington, DC, Brookings Institution).
Mendoza, E. G.; Quadrini, V.; Rios-Rull, J.-V. 2007. Financial integration, fi nancial deepness and global imbalances, National Bureau of Economic Research (NBER), Working Paper, No. 12909.
Merhebi, R. et al. 2006. “Australian chief executive remuneration: Pay and performance”, in Accounting and Finance, Vol. 46, No. 3, pp. 481-487.
Mitchell, O. S.; Piggott, J.; Kumru, C. 2008. Managing public investment funds: Best practices and new challenges. National Bureau of Economic Research (NBER), Working Paper, No. 14078 (Cambridge, MA).
Nellor, D. C. L. 2008. “Th e Rise of Africa’s ‘Frontier’ Markets”, in Finance and Development, Vol. 45/3.
Obstfeld, M. 1998. “Th e global capital market: Benefactor or menace?”, in Journal of Economic Perspectives, Vol. 12, No. 4, pp. 9-30.
Obstfeld, M. 2007. International fi nance and growth in developing countries: What have we learned?, Draft prepared for the Commission on Growth and Development.

68
World of Work Report 2008: Income Inequalities in the Age of Financial Globalization
Organisation for Economic Cooperation and Development (OECD). 2008a. Economic Outlook no. 83 (Paris, June).
—. 2008b. Economic Assessment of Indonesia (Paris).—. 2008c. Latin American Outlook (Paris).Otten, J. and Heugens, P. P.M.A.R. 2007. Extending the managerial power theory of executive
pay: A cross national test, ERIM Report Series Reference No. ERS-2007-090-ORG. Available at SSRN: http://papers.ssrn.com/sol3/papers.cfm?abstract_id=1088215
Ozkan, N. 2007. CEO compensation and fi rm performance: An empirical investigation of UK panel data, Working Paper. Available at SSRN: http://papers.ssrn.com/sol3/papers.cfm?abstract_id=1102703
Pagano, M.; Volpin, P. F. 2005. “Managers, Workers, and Corporate Control”, in Journal of Finance, vol. 60/2, pp. 841-868.
Prasad, E. S.; Rajan, R. G.; Subramanian, A. 2007. “Foreign capital and economic growth”, in Brookings Papers on Economic Activity, Vol. 2007:1, pp. 153-209.
Rancière, R.; Tornell, A.; Westermann, F. 2008. “Systemic Crises and Growth”, in Quarterly Journal of Economics, Vol. 123/1, pp. 359-406.
Reinhart, C.; Rogoff , K. 2008. “Is the 2007 US sub-prime fi nancial crisis so diff erent? An international historical comparison”, in American Economic Review, Vol. 98, No. 3, pp. 339-344.
Rodrik, D.; Subramanian, A. 2008. Why did fi nancial globalization disappoint? (Cambridge, MA, Harvard University) unpublished document.
Shaw, E. S. 1973. Financial Deepening in Economic Development (New York, Oxford University Press).
Summers, L. H. 2000. “International fi nancial crises: Causes, prevention, and cures”, in American Economic Review, Vol. 90, No. 2, pp. 1-16.
Supplemental Information on CEO Pay and the Mortgage Crisis. Memorandum of 6 March 2008.
Th e Economist Intelligence Unit (EIU). 2006. Country Profi le 2006: Argentina, (London).Tosi , H.L. et al. 2000. “How much does performance matter? A meta-analysis of CEO pay
studies.” in Journal of Management, Vol. 26, pp. 301-339.Unite, A.A. Forthcoming. “Executive pay and fi rm performance in the Philippines”, in Pacifi c-
Basin Finance Journal. Preliminary version available at: http://www.sciencedirect.com/science?_ob=ArticleURL&_udi=B6VFF-4R53W77-1&_user=1991186&_rdoc=1&_fmt=&_orig=search&_sort=d&view=c&_version=1&_urlVersion=0&_userid=1991186&md5=30ccbb457c8e0bec0b284df8fbedd02b [13 October 2008].
World Bank. 2008. World Development Indicators Online (WDI). Available at: http://go.worldbank.org/U0FSM7AQ40 [7 October, 2008].
Zhou, X. 2000. “CEO pay, fi rm size, and corporate performance: evidence from Canada”, in Canadian Journal of Economics, Vol. 33, No. 1, pp. 213-252.


71
1
Main findings
● Th ere has been a considerable decline in unionization over the past two decades. Union density declined in almost all the 51 countries considered in this analysis. Th e decline was dramatic in Central and Eastern European countries, where levels had initially been very high. On the other hand, changes in collective bargaining structure were less spectacular, according to the data that were collected. In most countries, the basic level of collective bargaining did not change. Th ere was, however, a modest trend towards more decentralization and/or less coordination of collective bargaining.
● While, as shown in chapter 1, income inequality increased in almost all the countries under consideration, there is no evidence to support the claim that this increase was caused by changes in labour institutions. In particular, the decline in trade union den-sity does not explain the rise in income inequality, except in the Central and Eastern European countries, where it seems to have been a signifi cant factor. Elsewere, there is no statistical association between changes in union density, and other labour institu-tions, and changes in inequality within countries, when other determinants are taken into account.
● Th e analysis carried out for the purposes of this chapter suggests that recent changes in inequality seem better predicted by economic factors than by changes in labour institu-tions. Th us, technology-induced shift s in the demand for skilled labour, as illustrated by the incidence of investment in information and communication technology (ICT) tend to increase inequality, as does higher foreign direct investment (FDI). Tariff lib-eralization also seems associated with greater income inequality, but the impact of this variable seems less robust. By contrast, a larger supply of human capital – as expressed in average years of education – lowers income inequality.
1. Many thanks to Jelle Visser of the University of Amsterdam, Patrick Hettinger and Subir Lall of the IMF Secretariat, and Andrea Bassasini and Douglas Lippoldt of the OECD Secretariat, for sharing their data. Excellent research assistance by Pascal Annycke and Melissa Luongo is gratefully acknowledged.
3. Labour institutions and inequality
Labour institutions and inequality 1

72
World of Work Report 2008: Income Inequalities in the Age of Financial Globalization
● Despite the above, labour institutions continue to play a redistributive role in the majority of the countries under consideration, with the notable exception of Latin America, where labour institutions generally fail to address inequality concerns. In advanced countries, in particular, high trade union density, a more coordinated collective bargaining struc-ture, and wider coverage of collective bargaining agreements tend to be associated with a larger welfare state. Large welfare states, in turn, are associated with lower inequality. For instance, the analysis suggests that if the country with the highest level of inequality in the sample (the United States) had raised its welfare state levels to those of the average country during the period under consideration, it would have reduced its predicted level of inequality by 48 per cent in 1978-1989 and by 70 per cent in 1990-2002.2 What diminished, from the 1990s on, was the capacity of labour institutions to reduce ine-quality directly by compressing market earnings. In particular, centralized collective bar-gaining seems to have become much less redistributive than it once was.
Introduction
Th e promise held out by globalization is to increase standards of living for all by virtue of greater specialization and higher productivity, cheaper goods and services, better access to credit and capital, and quicker diff usion of technological innovation. At the same time, there is growing concern in international policy circles, and among the general public, that in its current form globalization is not working (Wade 2004; Goldberg and Pavcnik 2007 p. 39). Increasingly, there is a suspicion that its benefi ts accrue only to a small por-tion of the population (the very rich), while others gain little, except greater anxiety and a growing sense of precariousness (Luebker 2004). It is also feared that the adverse distribu-tional consequences of globalization may lead to a political backlash against it, and even to its undoing (Berger 2000; Scheve and Slaughter 2004; OECD 2007; Scheve and Slaughter 2007; Rodrik 1997). Chapter 2 of this World of Work Report sheds further light on this issue by considering the impact of fi nancial globalization on income inequality.
Concerns about the sustainability of the current globalization regime are not to be taken lightly: the fi rst wave of globalization, before the First World War, resulted in some respects, in even closer economic integration across countries than today, for example as far as migration fl ows were concerned (O’Rourke 2001; Berger 2003). Yet, in the years before the Second World War, this wave of globalization gave way not only to economic protectionism but, more importantly, to fascist regimes in some countries. One of the rea-sons for the failure of the fi rst globalization was the inability of governments to solve the “Polanyi problem”: how to manage the social disruption associated with unfettered eco-nomic competition and a global free-market economy (Polanyi 1957; Munck 2004).
It has been argued repeatedly, – among others by the ILO (2004), – that, in order to be sustainable and bring positive outcomes for all, globalization needs a new regulatory framework, which requires the introduction of an appropriate governance structure at the international level. However, as there is no consensus on how exactly to proceed, few posi-tive steps have so far been taken to this end and, in all likelihood, few will be taken in the foreseeable future. As a consequence, the international governance regime will prob-ably remain under-institutionalized and the task of protecting societies from the poten-tially undesirable consequences of globalization will still fall largely, if not exclusively, on national-level institutions, however weakened these may be at the moment. Th is chapter focuses on some of these institutions, in particular on those that have to do with workers’ rights, trade unionism and collective bargaining.
2. Th is simulation exercise is based on the regression coeffi cients in tables 3.C5 and 3.C6, column 1.

73
3. Labour institutions and inequality
Th e research question driving the chapter is whether the institutions with which the ILO is traditionally associated, especially trade unionism and collective bargaining, can be said to contribute to the reduction of inequality in the current globalization era and, if so, to what extent. It is known from previous research on advanced countries that trade unionism and collective bargaining have redistributive eff ects. Th is chapter seeks to ascer-tain whether such inequality-reducing eff ects were still present at a more recent period (the 1990s and early 2000s) than those considered in previous studies and looks also at the record of developing countries.
Th ere is reason to suspect that the same institutions that once improved earnings and income distribution may have recently become much less adept at doing so. Indeed, given that one of the eff ects of globalization is to increase competition among fi rms and workers, for example by increasing product and labour demand elasticities (Rodrik 1997; Scheve and Slaughter 2004; OECD 2007 pp. 130-7), so that firms cannot afford to deviate from market outcomes without running a serious risk of going out of business, and workers – particularly low-skilled workers – cannot, without jeopardizing their jobs, push for wages higher than those prevailing in a competitive equilibrium, the impact of unions and collective bargaining on distributional outcomes is likely to be reduced.3
Among the developments that may have contributed to this state of aff airs is the emergence in several countries, predominantly but not exclusively European, of a partic-ular kind of centralized collective bargaining, known as a social pact, which, although apparently similar to past arrangements as far as its institutional form is concerned, has rather diff erent outcomes and, in particular, is more focused on national competitive-ness than on redistribution (Rhodes 1996; Fajertag and Pochet 1997; idem 2000; Streeck 2000; Rhodes 2001; Berger and Compston 2002; Hassel 2003; Baccaro and Lim 2007). Other suggestive evidence comes from a recent shift in union wage policies: in several advanced countries, trade union confederations no longer explicitly seek the compression of wage diff erentials, as they did in the past, but have moved to more distributionally neu-tral wage policies (Edin and Holmlund 1995; Baccaro and Locke 1998; Schulten 2002). Even in a country like Sweden, oft en considered a beacon of egalitarian capitalism, its very high trade union density and – despite a recent shift from the national to the industry level (Pontusson and Swenson 1996; Swenson and Pontusson 2000) – relatively central-ized collective bargaining structure have not prevented inequality from growing in the past few years (Smeeding 2002; Gustavsson 2007, pp. 85-7; Atkinson 2008; Bjorklund and Freeman 2008).
Any attempt to answer the question whether labour institutions still reduce ine-quality in the current era presents considerable empirical challenges. Country estimates of inequality are often based on different income concepts, population coverage, age coverage, thus making both cross-sectional and longitudinal comparisons problematic (Atkinson and Brandolini 2001). Also, and perhaps more importantly, unlike advanced countries, for which full-time series data on union density and collective bargaining struc-tures are available,4 data on labour rights and industrial relations institutions for non-advanced countries are sparse, to say the least. For this chapter, the available evidence was collected from various sources and an eff ort was made to fi ll in as many gaps in the data as possible. Based on the availability of trade union, inequality and other data, the anal-ysis focuses on 51 countries – advanced, Asian, Central and Eastern European and Latin American – between 1989 and 2005.
3. To use the words of Richard Freeman: “When fi rms do not have ‘rents’ to share with workers, institutions cannot aff ect redistribution” (Freeman 2007a, p. 15).4. Th is is thanks to the data collection eff orts of Jelle Visser over the years.
74
World of Work Report 2008: Income Inequalities in the Age of Financial Globalization
A. Review of earlier studies
Th ere was a general consensus in the previous literature that trade unionism and associ-ated institutions reduced inequality. In a recent literature review, Richard Freeman, one of the key scholars in this domain, argued not only that unions and collective bargaining improved income distribution but also that this was the only robust eff ect of labour insti-tutions on outcomes: “For all of the diffi culties in pinning down the impact of institutions on aggregate economic performance across countries, analyses have found that institutions have a major impact on one important outcome: the distribution of income” (Freeman 2007a, pp. 19-20).
Yet what now seems almost received wisdom was controversial only a few years ago. In his infl uential Capitalism and Freedom, Milton Friedman (1962, p. 124), for example, articulated a powerful argument as to why unions, far from acting as a “sword of justice,” according to Flanders’ famous expression (Flanders 1970; Metcalf, Hansen and Charlwood 2001), were to be regarded as “vested interests”, as far as their distributional consequences were concerned:
“If unions raise wage rates in a particular occupation or industry, they necessarily make the amount of employment available in that occupation or industry less than it other-wise would be – just as any higher price cuts down the amount purchased. Th e eff ect is an increased number of persons seeking other jobs, which forces down wages in other occupa-tions. Since unions have generally been strongest among groups that would have been high-paid anyway, their eff ect has been to make high-paid workers higher paid at the expense of lower-paid workers.”
According to Friedman’s argument, unions create inequality between two identical workers by pushing up wages in the union sector and thus, because there is a larger supply of workers who cannot fi nd jobs in the unionized sector, depressing wages in the non-union sector. If the workers’ skill levels are not identical, but, as Friedman believes, union members are more highly skilled, then unions contribute still further to increasing ine-quality by pushing up the skill premium.
In a classic study on the eff ect of unionism in the United States, using microdata, Freeman and Medoff (1984, chapter 5) reversed this argument. Th ey showed that the eff ect of unions was theoretically ambiguous (see also Gottschalk and Smeeding 1997, p. 647), in that although unions did, as argued by Friedman, push up the wages of their members relative to non-members, this “monopoly” (or “between”) eff ect was in fact counteracted by three other factors that reduced inequality. First the dispersion of earnings within estab-lishments was lower in union than non-union establishments; second, the dispersion across establishments was also lower, owing to the coordinated wage policies pursued by unions in collective bargaining; and, third, the skill premium (as between blue-collar and white-collar workers) was lower in unionized establishments. Because the union wage premium ben-efi ted blue-collar workers more than others, the “monopoly” eff ect operated in the oppo-site direction from the one hypothesized by Friedman: it reduced rather than increased inequality. As to mechanisms, the authors pointed to two in particular. In the fi rst place, unions are democratic organizations, whose policy decisions may be expected to refl ect the preferences of the median union member. If such a member is less skilled, and therefore less well paid, than the average worker, the union will pursue redistributive wage policies that reduce the skill premium. Secondly, union wage policies attach wages to occupations rather than to individual workers on the basis of supervisors’ assessments. Since the distribution of supervisors’ assessments of workers is probably wider than the distribution of occupations, union establishments have lower within-group dispersion than non-union establishments.
Twenty years aft er Freeman and Medoff (1984), these empirical fi ndings still appeared very solid, having been corroborated by numerous subsequent studies (see Freeman 2007b
75
3. Labour institutions and inequality
for a review). For example, Card, Lemieux and Riddell (2007) conducted a similar anal-ysis to Freeman and Medoff (1984) based on microdata for three countries – the United States, Canada and the United Kingdom – which were all characterized by a sharp divide between union and non-union sectors. Th ey found that the dispersion of wages was lower for union than for non-union workers, even within narrowly defi ned skill categories, thus confi rming one of Freeman and Medoff ’s key results, and that unions also contributed to reducing the skill premium but only for male workers. Th e net eff ect was to decrease income inequality for men but not for women. For the female workers, the inequality-increasing “monopoly” (or “between”) effect prevailed over the inequality-decreasing “within” eff ect. Th is divergence was due to the diff erent distribution of union member-ship according to skill between the two sexes: whereas male union members were con-centrated in the middle of the skill distribution, so that the “monopoly” eff ect boosted their wages in relation to those of more highly skilled workers, female union members were positioned closer to the top. Th is was because a higher proportion of female union members was in the public sector (Card, Lemieux and Riddell 2007, p. 134). Interest-ingly, this analysis also revealed that the wage premium enjoyed by unionized workers over their non-organized counterparts had declined between the early 1980s and early 2000s and, consequently, that the ability of unions to compress the distribution of wages had also been declining over time (ibid. pp. 137 and 149-150). Overall, the analysis sug-gests that the impact of unionism on inequality is empirically dependent on whether the equalizing within-group eff ect prevails over the disequalizing between-group eff ect, which in turn depends on whom the unions represent: if they predominantly represent the most skilled workers, the net eff ect could be (as in Friedman’s passage above and as in the case of women in the United States, Canada and the United Kingdom) to increase the dis-persion of wages. Also, according to this analysis, the union impact on wages seems to be declining over time. In other words, unions seem less and less capable of aff ecting either the level or the distribution of wages relative to a competitive scenario. Th is theme will be considered further in the analysis below.
Th e work of Blau and Kahn (1996) has an important place in the comparative lit-erature on institutions and inequality, because theirs seems to be the only study in which the comparison relies on microdata relating to workers rather than on aggregate cross-section time-series data at the country level. Th e data these authors used came from var-ious sources, but principally from the International Social Survey Programme (ISSP). Th e authors examined ten advanced countries in the mid- to late-1980s, with particular refer-ence to diff erences between the United States and the other countries. Th ey found that the most important determinants of the greater dispersion in the bottom half of the wage dis-tribution in the United States relative to other countries were not demand and supply con-ditions but institutional diff erences in wage-setting. Focusing on the wage gap between two workers in the 50th and in the tenth percentile of the wage distribution, respectively, they found that while the diff erence in dispersion between the United States and the rest was not so great for the unionized sectors (union workers in the United States had almost the same degree of wage compression as in other countries), the dispersion of wages for non-union workers was much greater in the United States than in other countries. Th e authors interpreted this diff erence as due to institutional diff erences in the structure of collective bargaining which allowed unions to infl uence the wage structure of non-union workers to a much greater extent than in the United States, through various mechanisms like extension clauses, industry fl oors, or (given the greater power of unions outside of the United States) spontaneous adoption of union rates by non-union companies. In other words more centralized wage setting institutions in other countries brought about more wage compression than in the United States not so much among union members, but among workers that were not affi liated to trade unions. Consistent with these results, the authors also found that the union/non-union gap was greater in the United States than in other countries.

76
World of Work Report 2008: Income Inequalities in the Age of Financial Globalization
Partly as a result of the diffi culty of collecting and standardizing microdata sets for a large number of countries, most comparative research on the determinants of inequality takes a given country in a given year as the unit of analysis. Th is approach exploits the variation in union density rates and degrees of collective bargaining centralization across countries and/or within time to identify the eff ects of industrial relations institutions. Th e results almost always suggest that institutions make a diff erence to inequality; but opin-ions are divided as to exactly which institutions play the most important role. Th e main problem with the country/year approach – which is also the approach adopted in this chapter – is that, while it makes it possible to estimate net eff ects, it does not allow for analysis of the diff erent and possibly contradictory channels by which unionization and collective bargaining have an impact on inequality.
Wallerstein (1999) examined the eff ect of wage-setting institutions on earnings ine-quality in 16 OECD countries between (roughly) 1980 and 1992. Th is study used a rich data set of industrial relations institutional characteristics (measuring, for example, the locus of bargaining, the degree of government involvement in wage bargaining, the degree of union confederation involvement in wage bargaining, the internal concentration of union confederations and the concentration across union confederations). Th is data set was developed by the author and two of his colleagues, and, updated aft erwards, was to become an essential reference for quantitative comparative studies on industrial relations systems (Golden, Lange and Wallerstein 2006). Wallerstein pooled observations across countries at three points in time and estimated a model that had a measure of wage dis-persion as the dependent variable,5 several institutional predictors as independent vari-ables (including the level of wage-setting and the union density rate), and controlled for additional political and institutional determinants that could aff ect the distribution of earnings. Owing to the small sample size, limited number of economic controls like trade exposure and measures of human capital supply were also included. Wallerstein found that the degree of collective bargaining centralization was by far the most important predictor of cross-country within-time diff erences in wage inequality, so much so that “it [was] diffi -cult to fi nd other variables that matter[ed] once the institutional variation in wage-setting [was] controlled for” (Wallerstein 1999, p. 650).
A similar study was performed by Rueda and Pontusson (2000), who examined the determinants of earnings inequality in the period between 1973 and 1995 in 16 OECD countries by using a dynamic model with country fi xed eff ects and an instrumental variable approach (the Anderson-Hsiao estimator) to address the problem of the endogeneity of the lagged dependent variable. Th e model tested the eff ects of union density and collective bar-gaining centralization. Th is model went further than the Wallerstein (1999) specifi cation in attempting to control for economic conditions, since it included the share of government employment and the partisan composition of governments among the institutional predic-tors. Th e choice of a fi xed-eff ects estimator implied an exclusive focus on within-country changes in earnings inequality, controlling for time-unchanging diff erences in the average level of inequality across countries. Th e theoretical set-up also assumed that the eff ects of both economic and institutional eff ects varied systematically across diff erent “varieties of capitalism” (Hall and Soskice 2001) and were potentially very diff erent in “liberal” market economies (United States and other Anglo-Saxon countries) and in “coordinated” market economies (Germany and the Nordic countries). Th e econometric results suggested that trade union density was the only predictor whose within-country variation was uncondi-tionally negatively correlated with earnings dispersion, regardless of the political economy of the country in question, while the eff ects of all other variables varied across regimes. Bargaining centralization, for example, contributed to a reduction in inequality far more
5. Th is measure of wage inequality was drawn from the OECD Earnings Database.

77
3. Labour institutions and inequality
in coordinated economies than in liberal ones.6 Rueda and Pontusson (2000) ultimately agreed with Wallerstein (1999) that institutions reduced inequality, but they gave greater emphasis to trade union density than to collective bargaining structure.7
In a recent article, Koeniger, Leonardi and Nunziata (2007) improved on previous analyses by considering the impact of a wider array of labour market institutions: not just collective bargaining structure and trade union density rates, but also employment pro-tection, replacement rates of unemployment insurance, duration of unemployment insur-ance and size of the tax wedge. For data on labour market institutions, they relied on a database assembled by Nickell and Nunziata and used previously to analyse the impact of labour market institutions on unemployment in OECD countries (Nickell et al. 2001). Th e data on earnings inequality came from the OECD database on earnings. Greater rich-ness in institutional detail came at the expense of a smaller number of advanced coun-tries included in the analysis: a total of 11. Th e time frame was 1973-1998. Th e analysis sought to build on the previous Wallerstein (1999) analysis. As in Rueda and Pontusson (2000), the focus was on within-country changes. Th e basic theoretical premise was that labour market institutions reduced wage inequality by improving the bargaining position of unskilled workers more than that of skilled workers, thus bringing about wage com-pression. Th e models also controlled for trade- and technology-induced demand shocks and for skill supply. Th e theoretical predictions were largely confi rmed by econometric results, which showed that all institutional variables were negatively associated with wage dispersion, except collective bargaining coordination, which, depending on specifi cation, oft en had a positive eff ect. Th e authors concluded that changes in institutions explained the trajectory of wage inequality within countries at least as well as economic variables did. Some of the econometric results were counterintuitive, however. For example, the proxy for labour demand shift s favouring the more highly skilled appeared to reduce, not increase, wage inequality, while a greater supply of skilled labour seemed associated with an increase rather than a reduction in inequality. As acknowledged by the authors, these unexpected coeffi cients possibly signalled specifi cation problems.
Within this literature, the work of Bradley et al. (2003), while similar in style and methodological approach to others, stands out because, unlike the studies reviewed above, which focus on earnings inequality alone, it investigates the determinants of inequality both in market income and in post-tax and transfer income. Th e dependent variables (market income and disposable income) are measured using aggregate microdata from the Luxembourg Income Study (LIS),8 a collection of country-based microdata sets harmo-nized to increase their comparability both across countries and over time.9 In the study by Bradley et al. (2003), the sample covered 14 advanced countries. Most data points used in the analysis were placed at approximately 5-year intervals between the early 1980s and the mid-1990s. Although the specifi cations included a number of controls for economic conditions, the institutional variables considered were the union density rate and collec-tive bargaining centralization. Moreover, since the main focus was on eff ects of the polit-ical parties, the cumulative shares of social democratic and Christian democratic parties in government were included among the predictors.
6. Th ese results concerning the heterogeneity of institutional eff ects across models of capitalism do not seem very robust. For example, Wallerstein, too, (1999, p. 670) tested for diff erent eff ects in coordinated as against liberal market economies (albeit with a smaller sample size) but could fi nd no essential diff erences. 7. However, in a related article relying on very similar data and specifi cations, Pontusson, Rueda and Way (2003) found that both union density and bargaining centralization were important. Th ese slightly diff erent fi ndings may be due to the diff erent estimator used in the second analysis: a least squares dummy variable estimator (which is inconsistent with a dynamic model with a small time dimension).8. Market income includes wages and salaries, self-employment earnings, property income and private pension income. Disposable income is market income aft er cash transfers and taxes. Th e unit of analysis is the household, not the individual, and the analysis is restricted to households where the head is of working age, i.e. between 25 and 59. 9. For information, see: http://www.lisproject.org/.

78
World of Work Report 2008: Income Inequalities in the Age of Financial Globalization
Like Rueda and Pontusson (2000), the authors found that trade union density was a more important determinant of inequality in market earnings than collective bargaining centralization and that, while redistribution through taxes and transfer was substantial in all countries, including those, like the Anglo-Saxon countries, characterized by a smaller welfare state (Esping-Andersen 1990), it was greatest in countries where governments were dominated by social democratic parties. Interestingly, the study found that trade union density and collective bargaining coverage did not just determine market incomes but were also statistically associated with the extent of redistribution through taxes and transfer. Indeed, the authors argued that, owing to collinearity among institutional and political indicators, a model in which redistribution was a function of the partisan composition of governments was statistically indistinguishable from models in which the main institu-tions considered were trade union density or collective bargaining centralization. How-ever, a comparison of historical situations – in Australia, for example, a strong labour movement failed to reduce inequality because of the lack of social-democratic political dominance – led the authors to concentrate on political factors. On the basis of this study, one may hypothesize that trade unions have an eff ect not just on market earnings but also, indirectly, on post-tax and transfer redistribution. Strong trade unions may proxy for other political variables, such as social democracy and associated policies, that reduce inequality by other means than the compression of market earnings.
All the cross-country longitudinal studies on the relationship between industrial rela-tions institutions and inequality reviewed so far are based on a limited number of advanced countries. Th ere is at least one exception to this, however: a study by Calderón, Chong and Valdés (2004) on the impact of labour market regulation on income inequality in 121 countries between 1970 and 2000. Th is study draws on various indices of labour regula-tions, both de jure (by counting the cumulative number of ILO core Conventions ratifi ed by the country concerned for the year in question) and de facto. Most of the institutional information is drawn from an unpublished database assembled by Rama and Artecona (2002) for the World Bank.10 Another source of information is the cross-sectional data set of Botero et al. (2003) on the legislative protection of employment, industrial relations and social security. Owing to a concern that, given the long time period, labour institutions may respond endogenously to income inequality, the authors use a dynamic generalized method of moments (GMM) estimator and control for country and time eff ects. Despite the much larger sample size and the inclusion in the analytical framework of a number of developing countries, the econometric results are in line with other studies. In particular, trade union density is found to diminish income inequality. Th e number of core ILO Conventions ratifi ed does not seem to have an impact on inequality.
Th e research reviewed so far (see table 3.1 for a summary) suggests that industrial rela-tions institutions are important determinants of cross-country diff erences in inequality. Several studies fi nd that high trade union density rate is associated with lower inequality. A centralized collective bargaining structure also seems associated with greater equality, but not all the studies bear this out. Trade unions and collective bargaining exert a net eff ect, resulting from various forces that may operate at cross-purposes. Indeed, as shown by micro-studies, the question of whether trade unions reduce or increase inequality depends strongly on whom the unions represent, and particularly on whether union members are on average more skilled than other workers. Also, trade unions not only aff ect market earnings directly, by compressing the wage distribution, but also indirectly aff ect fi nal incomes by being associated with other institutional and political variables, such as social-democratic regimes and associated economic policies, whose eff ect is either to compress
10. Many thanks to Martin Rama of the World Bank for making this database available. Th e information on trade union density contained therein was not used in this chapter for two reasons: 1) the data in the database are aggregated in fi ve-year averages; 2) they are expressed as a percentage of the total labour force rather than of wage and salary earners.

79
3. Labour institutions and inequality
further the distribution of market earnings or to redistribute disposable incomes through progressive taxes and transfers.
Th e analysis that follows examines whether these conclusions remain valid for a more recent period (from the late 1980s to the early 2000s) than those considered in previous studies. It includes not just advanced countries but also Latin American, Central and Eastern European, and a number of Asian countries, and considers various dimensions of economic globalization that may have an impact on within-country inequality.
Expected effects of globalization variables
While the focus of the analysis in this chapter is the impact of labour institutions on inequality, it is nonetheless helpful to review briefl y the expected eff ects of globalization measures (for recent reviews, see Brady, Beckfi eld and Zhao 2007; Goldberg and Pavcnik 2007). According to the Stolper-Samuelson theorem, the consequences of trade openness should diff er systematically across countries, depending on their relative endowment of skilled and unskilled labour.11 Countries that are relatively rich in skilled labour should thus specialize in skilled-intensive productions. Th is should increase the eff ective demand for skilled labour and depress the demand for unskilled workers in skilled-endowed coun-tries, and vice versa for countries rich in unskilled labour. To the extent that unskilled labour is the abundant factor in developing countries, and skilled labour the abundant factor in advanced countries, Stolper-Samuelson predicts that trade openness will reduce inequality in developing countries by compressing skill diff erentials and increase ine-quality in advanced countries by widening skill diff erentials. Th is pattern is, however, not
11. Th e paragraphs that follow draw on Goldberg and Pavcnik (2007).
Table 3.1. Cross-country time-series studies of the relationship between industrial relations institutions and inequality
Authors Dependent variable Country coverage
Time coverage Estimator used Impact of institutions
Wallerstein (1999)
Earnings inequality 16 advanced countries
1980-1992 Feasible generalized least squares (FGLS)error correction model, with and without country effects
Significant negative coefficient for level of wage setting
Rueda and Pontusson (2000)
Earnings inequality 16 advanced countries
1973-1995 Anderson-Hsiao estimator, dynamic model with country effects
Significant negative coefficient for union density
Bradley et al. (2003)
Market income inequality; post-tax and transfer reduction in inequality
14 advanced countries
Early 1980s- mid-1990s (for most countries)
Pooled ordinary least squares (OLS) with cluster-robust standard errors, no country effects
Significant negative coefficient for union density
Calderón, Chong and Valdés (2004)
Income inequality 121 countries
1970-2000 System GMM (dynamic model with country and time effects)
Significant negative coefficient for union density; insignificant coefficient for ratifications of ILO core Conventions
Koeniger, Leonardi and Nunziata (2006)
Earnings inequality 11 advanced countries
1973-1998 Panel-weighted least squares, with country and time effects
Significant negative coefficient for union density

80
World of Work Report 2008: Income Inequalities in the Age of Financial Globalization
exactly in line with the available evidence. Indeed, inequality has been growing in various developing countries commensurately with their increased exposure to trade (Goldberg and Pavcnik 2007, p. 55).
One argument about the eff ects of globalization that is compatible with the cur-rent trend of growing inequality in both advanced and developing countries is the one advanced by Feenstra and Hanson (2001), to the eff ect that one of the main features of globalization is the current international restructuring of production processes in global supply chains (Gereffi , Humphrey and Sturgeon 2005; Barrientos 2007). According to this model, fi rms in advanced countries outsource particular phases of the production process to developing countries, those phases being less skill-intensive from the point of view of developed countries but relatively skill-intensive in the receiving countries. Th us the eff ect of global production-sharing is to shift labour demand away from unskilled workers and towards skilled workers in both developed and developing countries.
One of the most visible aspects of economic globalization is the increase in foreign direct investment (FDI). In theory, the impact of FDI on inequality should be similar to the Stolper-Samuelson prediction for trade: if FDI is attracted to a country because of the relative abundance of a particular factor of production, then it should, by increasing demand for unskilled labour (the abundant factor), in developing countries lead to more equitable distribution in those countries (Cornia 2004; Vivarelli 2004) but the opposite in developed countries. However, there are also various ways in which FDI may worsen dis-tribution. As pointed out by Feenstra and Hanson (2001), FDI may increase the demand for skilled labour in both advanced and developing countries, even if the transferred tech-nology is neutral. Another factor is what Cornia (2004, p. 197) calls “systemic eff ect”: in order to attract a greater share of FDI, a country may relax a series of policy and regulatory constraints (relating to working conditions or taxation, for example) that are associated with a more compressed income distribution. A third factor may be linked to the com-plementarity between capital and skilled labour (Acemoglu 2002). Th is also pertains to another dimension of globalization: capital liberalization. To the extent that capital and skilled labour are complementary, and capital liberalization facilitates access to capital, there should be an increase in the relative demand for skilled workers.
Another channel by which globalization may aff ect inequality is by facilitating the transmission of skill-biased technological change from advanced to developing countries (Lee and Vivarelli 2006, p. 7). Such change increases both the relative price and the relative quantity of skilled labour (Berman and Machin 2004). If greater international competi-tion forces companies to restructure and upgrade to defend themselves against competitors (in which case technological change would be an endogenous response to globalization), or if the technology transferred with FDI is itself skill-biased, trade and fi nancial liberaliza-tion may push out the relative demand for skilled labour and increase inequality.
In brief, there are multiple channels by which diff erent features of economic glo-balization may lead to greater within-country inequality. Some of these channels may operate at cross-purposes: for example, trade openness may reduce inequality in a devel-oping country by Stolper-Samuelson eff ects, while capital openness increases it. More-over, net eff ects may vary from one country to another (Goldberg and Pavcnik 2007). A recent analysis of the impact of globalization on inequality by the International Mone-tary Fund (IMF 2007) fi nds that, while trade liberalization has contributed to reducing within-country inequality, fi nancial globalization – and particularly a growing share of FDI liabilities as a percentage of gross domestic product (GDP) – has increased it.

81
3. Labour institutions and inequality
B. Cross-country patterns of labour institutionsand income inequality
Th is chapter considers the role of three labour institutions 1) trade union density, namely the percentage of workers affi liated to trade unions in a given country in a given year; 2) collective bargaining structure, particularly the degree to which collective bargaining is centralized or coordinated and whether if takes place at levels above the enterprise (for example at the industry or national level), or is coordinated through other mecha-nisms, including powerful and internally cohesive employer and worker organizations; and 3) labour law, and in particular the extent to which national regulations comply with international labour standards. Data for each of these dimensions were collected from various sources. In total, a comprehensive data set covering 51 countries has been gath-ered for the purposes of this report (see Appendix A for the sources and defi nitions of these indicators).
Trade union density has tended to decline over the past two decades…
Table 3.2 summarizes the change in union density since 1990 or so. Between 1989 and 2005, union density declined in the 51 countries or territories for which data could be collected, with the exception of seven – Brazil, China, Hong Kong (prior to reunifi cation with China), India, Paraguay, Singapore, and Spain – in which union density increased, and three – Belgium, Finland and Pakistan – in which it was stable. Th e decline was dra-matic in Central and Eastern European countries: more than 50 per cent in the Czech Republic, Estonia, Hungary, Latvia and Lithuania, where there was almost universal union affi liation in the Communist years.
… but collective bargaining structures have remained broadly stable in a majority of countries
Besides union density, the way employers and workers bargain over wages and working conditions is also crucial for understanding the functioning of labour markets. Collec-tive bargaining can be more or less centralized and coordinated. In some countries, such as the Nordic countries and Uruguay, employer and trade union federations agree on national guidelines, which serve as a benchmark for lower-level negotiations. By contrast, bargaining is more decentralized in other countries, such as the Republic of Korea, the United Kingdom and the United States.
Table 3.3 shows estimates of the extent of coordination of collective bargaining in the 51 countries under consideration. Th ese estimates, graded in value from 1 (in cases where bargaining is mainly confi ned to individual enterprises) to 5 (where bargaining is cen-tralized and coordinated by national federations, are provided as averages for the period between 1989 and 2005, so that collective bargaining structures may be compared across countries. It will be seen that there are signifi cant cross-country diff erences. Coordination is greatest in Ireland, closely followed by Norway. Among the largest economies, Germany, Italy and Japan appear to have relatively coordinated bargaining structures. By contrast, bargaining is strongly decentralized in China, the United Kingdom and the United States. Brazil, France and India lie somewhere in between these groups, with bargaining taking place between the plant and the sectoral level.
Th e third column of the table shows changes in the structure of collective bargaining between 1989 and 2005. For 31 countries, there is no apparent change. For 8 (Belgium, Fin-land, Hungary, Ireland, Italy, Portugal, Slovenia and Spain), collective bargaining seems to have become more coordinated or centralized. Th ese are the countries that saw the emer-gence in the 1990s of social pacts. For 12 countries (Argentina, Australia, Czech Republic,

82
World of Work Report 2008: Income Inequalities in the Age of Financial Globalization
Table 3.2. Change in union density rates, 2005-1989
Country Union density change
Last/initial year
Singapore 0.08 2005/1989
Paraguay 0.06 2004/1994
China 0.04 2005/1989
Hong Kong 0.04 1999/1989
Spain 0.04 2005/1989
India 0.03 2002/1991
Brazil 0.01 2005/1991
Finland 0.00 2005/1989
Belgium 0.00 2005/1989
Pakistan 0.00 2005/1989
Chile -0.01 2005/1989
Jamaica -0.01 2005/1991
Turkey -0.01 1999/1989
Taiwan (China) -0.02 2005/1989
Netherlands -0.02 2005/1989
France -0.02 2005/1989
Norway -0.03 2005/1989
Philippines -0.03 1998/1989
Canada -0.03 2005/1989
Denmark -0.04 2005/1989
United States -0.04 2005/1989
Argentina -0.04 2005/1989
Dominican Republic -0.04 2005/1990
El Salvador -0.04 2005/1990
Switzerland -0.05 2005/1989
Italy -0.05 2005/1989
Mexico -0.05 2002/1989
Sweden -0.07 2005/1989
Japan -0.07 2005/1989
Costa Rica -0.08 2003/1993
Republic of Korea -0.08 2003/1989
Uruguay -0.08 2005/1990
Germany -0.11 2005/1989
United Kingdom -0.12 2005/1989
Honduras -0.13 2001/1990
Greece -0.14 2005/1989
Austria -0.15 2005/1989
Australia -0.17 2005/1989
Venezuela -0.19 2005/1989
Portugal -0.20 2005/1989
Ireland -0.22 2005/1989
Peru -0.31 2005/1989
New Zealand -0.32 2005/1989
Slovenia -0.32 2005/1989
Poland -0.42 2005/1990
Slovakia -0.53 2005/1990
Hungary -0.54 2005/1989
Latvia -0.61 2005/1991
Czech Republic -0.62 2005/1990
Lithuania -0.82 2005/1989
Estonia -0.83 2005/1989
Source: see Appendix A.
Table 3.3. Average collective bargaining structure and change, on a scale of 1 to 5, 1989-2005
Country Collective Bargaining Structure
Change
Slovenia 3.47 3
Italy 3.65 2
Belgium 4.35 1
Finland 3.71 1
Hungary 1.76 1
Ireland 4.71 1
Portugal 2.88 1
Spain 3.24 1
Austria 4.00 0
Brazil 2.00 0*
Canada 1.00 0
Chile 1.00 0
China 1.00 0
Costa Rica 1.00 0
Denmark 3.29 0
Dominican Republic 1.00 0
El Salvador 1.00 0
France 2.00 0
Germany 4.00 0
Greece 3.94 0
Honduras 1.00 0
Hong Kong (China) 1.00 0
India 2.00 0
Jamaica 1.00 0
Republic of Korea 1.00 0
Mexico 2.12 0
Netherlands 4.00 0
New Zealand 1.00 0
Norway 4.65 0
Pakistan 1.00 0
Paraguay 1.00 0
Philippines 1.00 0
Poland 2.00 0
Singapore 2.00 0
Taiwan China 2.00 0
Turkey 1.00 0
United Kingdom 1.00 0
United States 1.00 0
Venezuela 2.00 0
Argentina 2.35 -1
Peru 1.59 -1
Slovakia 4.24 -1
Sweden 3.29 -1
Switzerland 3.41 -1
Uruguay 3.29 -1
Australia 2.82 -2
Japan 3.59 -2
Czech Republic 2.59 -3
Estonia 2.38 -3*
Latvia 2.71 -3
Lithuania 2.35 -3
* 2005/1990. Source: See Appendix A.

83
3. Labour institutions and inequality
Estonia, Japan, Latvia, Lithuania, Peru, Slovakia, Sweden, Switzerland and Uruguay), the index signals a trend towards more decentralized or uncoordinated bargaining.
In parallel with the trend rise in income inequality documented in Chapter 1, unionization has followed a downward trend, while collective bargaining structures have remained broadly stable – or, in some countries, become somewhat more decentralized or less coordinated. Th e next step is to establish whether, side by side with this temporal coin-cidence between declining unionism and growing inequality, there is also a causal relation-ship between the two. We begin with a simple examination of bivariate correlation and follow with a more detailed analysis.
Highly unionized countries and countries where collective bargaining is more coordinated tend to have low income-inequality…
Figure 3.1 shows a clear negative correlation between unionization and inequality: the countries in which income inequality is on average lower in the period 1989-2005 tend to be those in which a greater proportion of workers is affi liated to trade unions.
Th e structure of collective bargaining is also associated with income inequality: as Figure 3.2 shows, the more collective bargaining takes place at levels above the enterprise, the less unequal the distribution of income. Conversely, the countries in which collective bargaining is on average more highly centralized or coordinated are those in which ine-quality tends to be lower.
However, it is not the case that the change in bargaining structure within countries is negatively related to inequality or that the more collective bargaining becomes decentral-ized or uncoordinated, the more inequality grows within a country, or vice versa. Th is is somewhat at odds with conventional wisdom. Indeed, historically, centralized collective
Figure 3.1. Bivariate correlation between average Gini coefficient and average union density, 1989-2005
0 0.2 0.4 0.6 0.8 1.0Union density (country average)
Log Gini (country average)
–0.6
–0.8
–1.0
–1.2
–1.4
–1.6
Argentina
Australia
Austria
Belgium
Brazil
Canada
Chile
China
Costa Rica
Czech RepublicDenmark
Dominican RepublicEl Salvador
Estonia
France
Germany
Greece
Honduras
Hong Kong (China)
Hungary
India
Ireland
Italy
Jamaica
Japan
Korea, Republic of
Latvia
Lithuania
Mexico
Netherlands
NZ
Norway
Pakistan
Paraguay
Peru
Philippines
Poland
Portugal
Singapore
Slovakia
Slovenia
Spain
Sweden
Switzerland
Taiwan (China)
Turkey
UK
United States
UruguayVenezuela, Bolivarian Republic of
Finland
Source: IILS estimates.

84
World of Work Report 2008: Income Inequalities in the Age of Financial Globalization
bargaining has contributed to the reduction of inequality by reducing wage dispersion across sectors and skill levels, as suggested by the literature reviewed above. Th e countries in which the indicator of collective bargaining structure has changed the most are the advanced countries.
… and greater compliance with the Freedom of Association and Protection of the Right to Organize, 1948 Convention (No. 87) and the Right to Organize and Col-lective Bargaining Convention, 1949 (No. 98) tends to be associated with lower inequality
Th ere seems to be a marginally negative relationship between the average number of core Conventions ratifi ed by a given country and income inequality in that country. On the other hand, when one looks at the relation between changes in the ratifi cation of core Conventions and changes in inequality within countries over time, the slope of the curve is positive.12 Th is relationship is, however, not only statistically very weak but also, in all likelihood, spurious. It is probably due to the fact that both indicators – namely, ratifi -cations and inequality – tend to grow over time for unrelated reasons. At any rate, the bivariate associations suggest that the ratifi cation of core Conventions is not signifi cantly linked to income inequality.
More important seems the degree of compliance with the specifi c norms contained in Conventions No. 87 and No. 98. Figures 3.3 and 3.4 plot average compliance with the two Conventions (the “severity score”) against average inequality and reveal a positive
12. Similar conclusions (both cross-sectionally and longitudinally) are reached if one focuses on ratifi cation of Conventions No. 87 and No. 98 alone.
1 2 3 4 5Collective bargaining structure index (country average)
Log Gini (country average)
–5
–1.0
–1.5
Argentina
Australia
Austria Belgium
Brazil
Canada
Chile
China
Costa Rica
Czech RepublicDenmark
Dominican Republic
El Salvador
Estonia
France
Germany
Greece
Honduras
Hong Kong (China)
Hungary
India
Ireland
Italy
Jamaica
Japan
Korea, Republic of
LatviaLithuania
Mexico
Netherlands
NZ & UK
Norway
Pakistan
Paraguay
Peru
Philippines
Poland
Portugal
Singapore
Slovakia
Slovenia
Spain
Sweden
Switzerland
Taiwan (China)
Turkey
United States
Uruguay
Venezuela, Bolivarian Republic of
Finland
Figure 3.2. Bivariate correlation between average Gini coefficient and average collective bargaining structure index, 1989-2005
Source: IILS estimates.

85
3. Labour institutions and inequality
Figure 3.4. Bivariate correlation between average Gini coefficient and average severity score for Convention No. 98, 1990-2000
Figure 3.3. Bivariate correlation between average Gini coefficient and average severity score for Convention No. 87, 1990-2000
0 20 40 60Severity score for Convention No. 87 (country average)
Log Gini (country average)
–5
–1.0
–1.5
Argentina
Australia
Austria
Belgium
Canada
Czech RepublicDenmark
France
Germany
Greece
Honduras
Hong Kong (China)
Hungary
Ireland
Italy
Jamaica
Japan
Mexico
Netherlands United Kingdom
Norway
Pakistan
Peru
Philippines
Poland
Portugal
Spain
Sweden
Switzerland
Uruguay
Venezuela, Bolivarian Republic of
Finland
0 5 10 15 20Severity score for Convention No. 98 (country average)
Log Gini (country average)
–5
–1.0
–1.5
Argentina
Australia
AustriaBelgium
Brazil
Czech Republic Denmark
France
Germany
Greece
Honduras
Hong Kong (China)
Hungary
Ireland
Italy
Jamaica
JapanNetherlands
United Kingdom
Norway
Pakistan
Peru
Philippines
Poland
Portugal
Singapore
Spain
Sweden
Turkey
Uruguay
Venezuela, Bolivarian Republic of
Finland
Source: IILS estimates.
Source: IILS estimates.

86
World of Work Report 2008: Income Inequalities in the Age of Financial Globalization
relationship for both: the more serious, on average, the violation of fundamental norms relating to freedom of association and collective bargaining, the greater the average level of inequality in the country in question.13 Th e positive association seems stronger for Con-vention No. 87 than for Convention No. 98.
If one were to plot changes in severity scores against changes in inequality within countries, however, a much smaller positive relationship would emerge (though it would be larger for Convention No. 98 than for Convention No. 87). Hence, again, cross-sec-tional diff erences in institutions seem more closely associated with income inequality than do changes over time.
Th e simple bivariate correlations discussed above suggest that labour institutions are important determinants of inequality, not so much over time (with the possible exception of the union density rate) as across countries. Cross-country diff erences in institutions are likely to refl ect a constellation of factors that historically have led, either directly or indi-rectly, to a more compressed distribution of incomes. Labour institutions tend to come together as parts of a system.14 Th e countries in which union density rates are higher are also the ones in which the welfare state is more developed, taxation levels higher and more progressive, collective bargaining more centralized and labour law both closer to interna-tional labour standards and better implemented. What is more surprising is that changes in these institutions seem less clearly associated with the increase in inequality. Th at con-clusion is also valid when other potential determinants of income inequality are taken into account on the basis of econometric analysis.
Detailed analysis confi rms that changes in labour institutions are not strongly related to changes in income inequality, which are due rather to technical change and globalization…
Appendix B presents the fi ndings of what is probably the fi rst comparative assessment of the impact of domestic and external factors of inequality. It shows that changes through time in income inequality are robustly associated with an increase in the stock of FDI as a percentage of GDP and somewhat less robustly with trade liberalization (in the form of tariff reductions). Other facets of globalization such as capital openness do not seem signifi cant predictors of income inequality. Technology-induced shift s in the demand for skilled labour, as captured by the share of information and communication technology (ICT) investment in the capital stock, also tend to increase inequality. By contrast, changes in labour institutions within countries do not seem responsible for growing inequality over time, with the exception of trade union decline in the Central and Eastern European countries, which seems to have contributed to the growth in ine-quality in that region.
…while labour institutions are more systematically related to differences in income inequality across countries…
Rather diff erent results concerning the impact of industrial relations institutions are reached if one focuses on diff erences across countries as opposed to diff erences within a given country. Diff erences in average levels of income inequality across countries seem to depend entirely on institutional diff erences, while the economic predictors are hardly ever statistically diff erent from zero.
13. Th ese unpublished data on severity of violations were elaborated by the OECD Secretariat. Many thanks to Douglas Lippoldt of the OECD Secretariat for providing them. For more information on the construction of the index, see OECD (2000: 85-7).14. Statistically, this phenomenon manifests itself as positive correlation among the labour institutions indicators.

87
3. Labour institutions and inequality
On average, the countries in which trade union density is higher are those in which the income distribution is less unequal on average. Consistently with results from the within country analysis, there seem to be regional diff erences in the impact of unioni-zation. Greater union density in Latin American countries is not associated with lower inequality: although the coeffi cient is positive, it is insignifi cant. Th is may be due to the historical corporatist nexus linking trade unions to the state in some Latin American countries (Zapata 1998; Murillo 2001). Also, if trade unions represent predominantly skilled (for example, public sector) workers, then the “monopoly” eff ect (the enhancement of skill diff erentials) may eff ectively dominate the “within” eff ect (more compressed distri-bution), thus leading to a more unequal income distribution. On the other hand, union density is associated with lower inequality in advanced, Central and Eastern European and Asian countries.
Th e eff ects of collective bargaining structure also seem regionally specifi c: in Latin America, more centralized collective bargaining is associated with greater inequality, whereas the opposite is true in advanced, Central and Eastern European and Asian coun-tries. Overall, collective bargaining coeffi cients seem less robustly signifi cant than union density rates. It is telling that the more politically illiberal the government, the greater the inequality is on average. Th is is not surprising and may be due to the fact that illiberal gov-ernments may be less disposed than democratic ones to correct inequality through redis-tributive policies (Meltzer and Richard 1981; Sen 1999). Other institutional measures having to do with labour law (the core Conventions, severity of violations of international norms for Conventions No. 87 or No. 98) do not seem to have a signifi cant cross-sectional association with inequality.
Overall, econometric analysis suggests the following: despite a rather impressive bivar-iate association, it cannot be said that the pronounced fall in trade union density in the last two decades, or the more modest trend towards collective bargaining decentralization, has caused income inequality to rise. Th ere seems to be no robust statistical association between changes in inequality within countries and changes in the labour institutions considered here, when other possible determinants of inequality are taken into account.
Th e increase in inequality in the past 15 years seems due mostly to economic forces, particularly a technologically induced shift in the demand for skilled labour and the increase in FDI as a percentage of GDP. Tariff liberalization may also have contributed, although less markedly than other predictors.
When it comes to explaining diff erences in average levels of inequality across coun-tries, however, it remains the case that labour institutions play a substantial role. On average, the countries in which trade unions are stronger have lower levels of inequality than others. It is also the case that a more centralized or coordinated structure of collective bargaining and more extensive political rights are associated with more income equality. Th ese results do not seem very surprising: labour institutions are generally parts of social systems, and high trade union density and centralized collective bargaining structures are likely to be associated with other features (such as social democratic governments in some countries, or redistributive social policies), which in turn are likely to be conducive to a more egalitarian distribution of incomes. Interestingly enough, the estimation results sug-gest that labour institutions may function diff erently in diff erent regions of the world. In Latin American countries, for example, high trade union density and a more centralized collective bargaining structure may not be conducive to greater equality.
…and the inequality-reducing effect of labour institutions seems to have weakened in advanced countries over the pas few years
Appendix C contains the fi ndings of an analysis of inequality trends in 16 advanced coun-tries for which longer time-series data on institutions and other variables are available: Australia, Austria, Belgium, Canada, Denmark, Finland, France, Germany, Ireland, Italy,
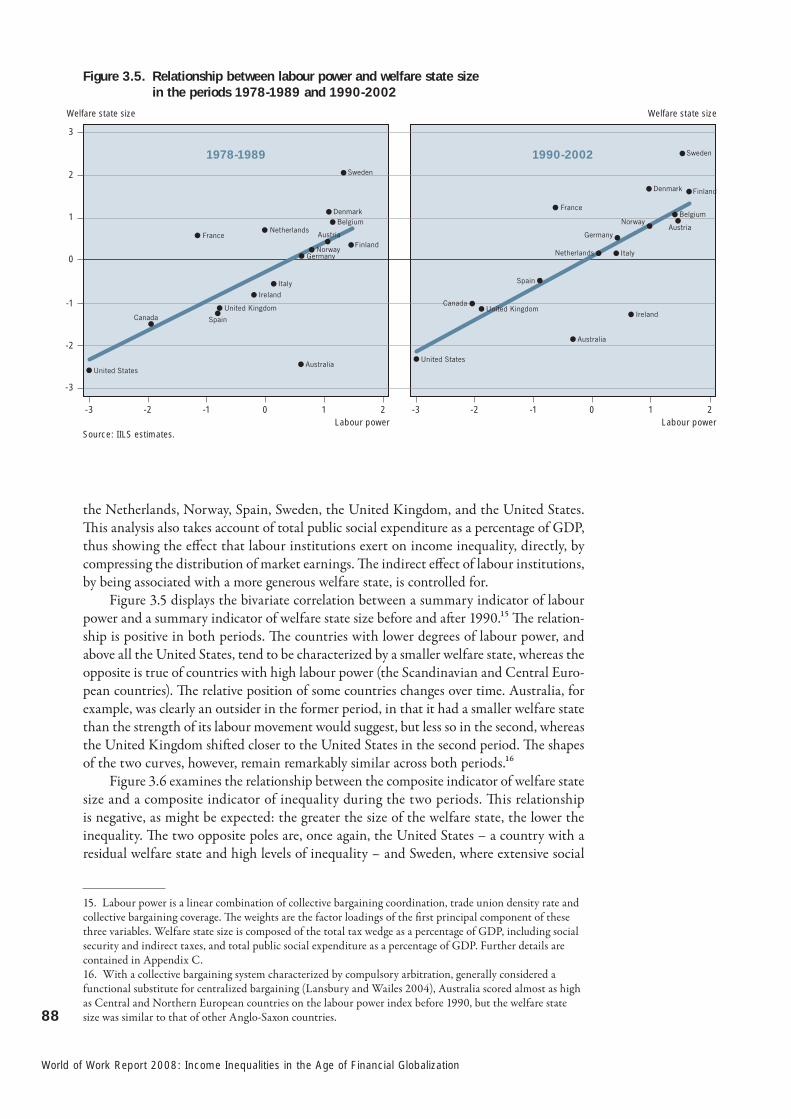
88
World of Work Report 2008: Income Inequalities in the Age of Financial Globalization
the Netherlands, Norway, Spain, Sweden, the United Kingdom, and the United States. Th is analysis also takes account of total public social expenditure as a percentage of GDP, thus showing the eff ect that labour institutions exert on income inequality, directly, by compressing the distribution of market earnings. Th e indirect eff ect of labour institutions, by being associated with a more generous welfare state, is controlled for.
Figure 3.5 displays the bivariate correlation between a summary indicator of labour power and a summary indicator of welfare state size before and aft er 1990.15 Th e relation-ship is positive in both periods. Th e countries with lower degrees of labour power, and above all the United States, tend to be characterized by a smaller welfare state, whereas the opposite is true of countries with high labour power (the Scandinavian and Central Euro-pean countries). Th e relative position of some countries changes over time. Australia, for example, was clearly an outsider in the former period, in that it had a smaller welfare state than the strength of its labour movement would suggest, but less so in the second, whereas the United Kingdom shift ed closer to the United States in the second period. Th e shapes of the two curves, however, remain remarkably similar across both periods.16
Figure 3.6 examines the relationship between the composite indicator of welfare state size and a composite indicator of inequality during the two periods. Th is relationship is negative, as might be expected: the greater the size of the welfare state, the lower the inequality. Th e two opposite poles are, once again, the United States – a country with a residual welfare state and high levels of inequality – and Sweden, where extensive social
15. Labour power is a linear combination of collective bargaining coordination, trade union density rate and collective bargaining coverage. Th e weights are the factor loadings of the fi rst principal component of these three variables. Welfare state size is composed of the total tax wedge as a percentage of GDP, including social security and indirect taxes, and total public social expenditure as a percentage of GDP. Further details are contained in Appendix C.16. With a collective bargaining system characterized by compulsory arbitration, generally considered a functional substitute for centralized bargaining (Lansbury and Wailes 2004), Australia scored almost as high as Central and Northern European countries on the labour power index before 1990, but the welfare state size was similar to that of other Anglo-Saxon countries.
-3 -2 -1 0 1 2Labour power
Welfare state size Welfare state size
3
1
0
-1
-2
-3
2
-3 -2 -1 0 1 2Labour power
1978-1989 1990-2002
AustriaAustria
BelgiumBelgiumDenmark
Denmark
France
France
Germany
Germany
Ireland
Ireland
Italy
Italy
Netherlands
NetherlandsNorway
Norway
Sweden
Sweden
United Kingdom United Kingdom
United States
United States
Finland
Finland
Australia
Australia
Spain
Spain
Canada
Canada
Figure 3.5. Relationship between labour power and welfare state size in the periods 1978-1989 and 1990-2002
Source: IILS estimates.

89
3. Labour institutions and inequality
protections is accompanied by a much more egalitarian distribution of incomes. Th e slope of the two curves remains similar over time. However, the second graph seems to have shift ed rightwards compared to the fi rst: both the size of the welfare state and inequality grew on average during the period 1990-2002. Th e increase in the size of the welfare state is due to the well-known phenomena of population ageing and the coming to maturity of various social programmes (see Pierson 2001). Also, the graphs in fi gure 3.5 confi rm that, over time, the United Kingdom shift ed its relative position in the direction of the United States.
Figures 3.7 and 3.8 display the partial correlation of the inequality indicator and the labour power indicator, controlling for welfare state size, over the two periods. Th e graphs plot the residual of a regression of inequality on welfare state size against the residuals of a regression of labour power on welfare state size. Th e linear fi t becomes much less steep in the period between 1990 and 2002 than in the previous period between 1978 and 1989.
Th ese graphs suggest that, from the early 1990s on, the institutions associated with labour power – high trade union density, high collective bargaining coverage, and a coor-dinated bargaining structure (particularly coordinated bargaining) – largely forfeited their capacity to reduce inequality directly by compressing market earnings, and retained only an indirect eff ect on inequality thanks to the welfare state size factor. Th is is con-sistent with micro-evidence suggesting that the ability of unions to compress the distribu-tion of wages has been declining over time (Card, Lemieux and Riddell 2007, pp. 137 and 149-150). It is also consistent with case study evidence on recent developments in some of the countries included in this analysis. Some time ago, unions participating in national collective bargaining engaged in explicit attempts to compress skill diff erentials through various means, including requests for lump-sum wage increases, which tend to favour low-paid workers; tapered percentage wage increases, with the highest increases for low-paid workers; and skewed indexation mechanisms (like the Italian scala mobile), which assured those on low earnings a greater degree of protection from infl ation and which, particularly in times of double digit infl ation, helped to compress earnings (Edin and Holmlund 1995; Erickson and Ichino 1995; Baccaro and Locke 1998; Schulten 2002).
-3 -2 -1 0 2 3Welfare state size
Inequality Inequality
3
1
0
-1
-2
-3
2
1 -3 -2 -1 0 2 31Welfare state size
1978-1989 1990-2002
Austria
Austria
Belgium
Belgium
Denmark
Denmark
France France
Germany
Germany
IrelandIreland
Italy
Italy
Netherlands Netherlands
Norway Norway
Sweden
Sweden
United Kingdom
United Kingdom
United States
United States
Finland Finland
Australia
Australia
Spain
Spain
CanadaCanada
Figure 3.6. Relationship between welfare state size and inequality in the periods 1978-1989 and 1990-2002
Source: IILS estimates.

90
World of Work Report 2008: Income Inequalities in the Age of Financial Globalization
Over time, these strategies and institutional arrangements were largely discarded. In Sweden and other Scandinavian countries, the egalitarian wage policies pursued by the unions from the late 1960s on created considerable problems for employers, who found it diffi cult to recruit and motivate highly skilled labour (Pontusson and Swenson 1996; Swenson and Pontusson 2000). Th ey also generated problems for unions. For example, in the early 1980s the Swedish blue-collar union Metall found itself losing many members to the white-collar union where workers who did similar jobs were paid more, and had eventually to drop the policy of wage compression as well as the whole model of national bargaining associated with it, which was replaced by sectoral bar-gaining (Th elen 1993, p. 39).
Centralized bargaining used to be one of the key institutions in “social corporatist” countries (Korpi 1978; Pekkarinen, Pohjola and Rowthorn 1992; Rowthorn 1992; Pon-tusson 2005), with unions negotiating at the national level and exchanging wage modera-tion for both a more equitable distribution of earnings and more extensive social protection networks (Pizzorno 1978; Mares 2006). It suff ered a temporary decline in the 1980s, but, in the 1990s, it surprisingly resurfaced in a number of countries, primarily but not exclusively European (Fajertag and Pochet 1997; idem 2000; Berger and Compston 2002; Hassel 2003; Baccaro and Lim 2007). However, the social outcomes of these new forms of centralized bargaining, also known as social pacts, were quite diff erent; they were mark-edly less redistributive than in the past and much more concerned with increasing country competitiveness (Rhodes 1996; Streeck 2000; Rhodes 2001). In Ireland, for example, the collective bargaining system has been strongly recentralized in the past two decades, yet there is little evidence that this has contributed to reducing wage diff erentials (Barrett, Gerald and Nolan 2000; Baccaro and Simoni 2007). In Italy, the scala mobile was abol-ished in 1992 and the unions negotiated with employers and the government a new archi-tecture of nationally coordinated sectoral bargaining, which did not, however, prevent wage and income inequality from rising (Erickson and Ichino 1995; Brandolini, Cipol-lone and Sestito 2001; Baccaro 2002).
Figure 3.7. Partial correlation between inequality and labour power, controlling for welfare state size, 1978-1989
Figure 3.8. Partial correlation between inequality and labour power controlling for welfare state size, 1990-2002
Labour power residuals
Inequality residuals Inequality residuals
Labour power residuals
1.0
–0.5
–1.5
0.5
0
–1.0
-2 -1 0 1 2 -2 -1 0 1 2
2
–1
–2
1
0
United States
Australia
AustriaBelgium
Denmark
France
Germany
IrelandItaly
Netherlands
United Kingdom
Norway
Spain
Sweden
Canada
Finland
United States
Australia
Austria
Belgium
Denmark
France
Germany
Ireland
Italy
Netherlands
United Kingdom
Norway
Spain
Sweden
Canada Finland
Source: IILS estimates. Source: IILS estimates.

91
3. Labour institutions and inequality
In short, faced with new market constraints – more elastic labour demand, particu-larly for the low-skilled, and high skill premiums as a result of skill-biased technological change – union behaviour seems, over time, to have started to conform more closely with market outcomes and in so doing to have lost much of its redistributive impetus. Large welfare states, on the other hand, continued to play an important redistributive role well into the 1990s. Indeed, an even greater proportion of the cross-country variation in ine-quality was due to diff erences in welfare state size during this period than it was earlier. Th is may seem surprising, given the current debate on the crisis of the welfare state; but it is in line with the fi ndings of other scholars as well (Bradley et al. 2003; Kenworthy and Pontusson 2005; Pontusson 2005, chap. 7).
C. Policy considerations
Th e Chapter shows that countries that have stronger tripartite institutions are better placed to ensure that the gains from globalization are distributed in a balanced manner. However, the income distribution eff ects of tripartite institutions have become weaker. Th is refl ects mainly the inequality-increasing impacts of rapid technological change and globalization – and the fact that such underlying trends are diffi cult to arrest directly through tripartite institutions.
Th e policy issue is how tripartite institutions can continue to shape income distri-bution, consistent with economic realities. Th is is an area where country specifi cities are important, so there is no one-size-fi ts-all model of industrial relations. Yet, policies can promote the involvement of employers and workers in various ways.
First, governments may engage with social partners –and revitalise social dialogue where needed – to discuss reforms of labour markets and, particularly, social protection. Experience shows that this may be a helpful way to ensure that the interests of all parties are well understood. Th e involvement of social partners in the reform process may also facilitate implementation of any agreed measures. And experience shows that strong tri-partite institutions tend to be associated with social protection designed in a way which protects workers, and yet is consistent with high employment (see evidence in this Chapter, as well as Chapter 6).
Second, in the case of skill development policies, evidence suggests that the involve-ment of social partners is crucial for an effi cient design of the measures. Th is may help enhance workers’ skills, and thus achieve better income distribution outcomes.

92
World of Work Report 2008: Income Inequalities in the Age of Financial Globalization
Appendix A
Measures of labour institutions
Information on the three labour institutions considered here – trade union density, i.e. the percentage of wage and salaried workers affi liated to trade unions, collective bargaining structure more or less centralized or coordinated, and labour law – is drawn largely from the database assembled by Jelle Visser for advanced and Central and Eastern European countries.17 Th is was then supplemented by data from various sources for Latin American and Asian countries.18 Table 3.A1 reports the sources of union density data.19
Table 3.A1. Sources of trade union density data
Frequence %
OECD.Stat 26 3.22
Jelle Visser 438 54.21
Institute estimates 344 42.57
Total 808 100.00
For the index of collective bargaining structure, Visser’s database – which was comple-mented by our own research for other countries20 – provides an index of collective bar-gaining coordination, which in turn updates a previous index elaborated by Kenworthy (2003). Th is 1-to-5 index is coded as follows:
1 = Fragmented wage bargaining, confi ned largely to individual fi rms or plants.
2 = Mixed industry- and fi rm-level bargaining, with little or no pattern-setting and rela-tively weak elements of government coordination, such as setting of basic pay rate or wage indexation.
3 = Industry-level bargaining with somewhat irregular and uncertain pattern-setting and only moderate union concentration.
4 = Centralized bargaining by peak confederation(s) OR government imposition of a wage schedule/freeze, without a peace obligation OR informal centralization of industry- and fi rm-level bargaining by peak associations OR extensive, regularized pattern-set-ting coupled with a high degree of union concentration.
17. Many thanks to Jelle Visser for making this database available.18. Initially, data on union density were collected for 139 countries from various sources, but the analysis ended up focusing on only 51 countries, those in which there was a meaningful time variation and for which information on other variables was available. For Asian countries, an important source was Kuruvilla et al. (2002). Many thanks to Pascal Annycke and Melissa Luongo for the excellent work they did in assembling some of the data and, in the case of Melissa Luongo, for her research on a number of countries. Th e data from the Visser database are adjusted density rates: the number of union affi liates who are not wage and salary workers is subtracted from the numerator, and the number of wage and salary workers who do not have the right to organize (such as public sector workers in some countries) is subtracted by the denominator. For the other countries, such adjustments were not possible. However, the denominator was kept constant as far as possible. 19. Th e union density variable was linearly interpolated. Th is increased the number of data points from 719 to 808.20. Again, many thanks to Melissa Luongo for providing the information needed for the coding through various secondary sources.

93
3. Labour institutions and inequality
5 = Centralized bargaining by peak confederation(s) OR government imposition of a wage schedule/freeze, with a peace obligation OR informal centralization of industry-level bargaining by a powerful, monopolistic union confederation.
For the non-advanced countries, however, there was oft en not enough information on the degree of coordination brought about by institutional features other than the struc-ture of wage-setting. For these countries, therefore, the index is really an index of collec-tive bargaining centralization, and the coding is simplifi ed as follows (Golden, Lange and Wallerstein 2006):
1 = Plant-level wage-bargaining
2 = Mixed industry- and fi rm-level wage bargaining
3 = Industry-level wage bargaining
4 = Centralized wage-bargaining without sanctions
5 = Centralized wage-bargaining with sanctions.
It should also be added that most of the variation in this index is cross-sectional. Th is is not surprising, since the institutional structure of collective bargaining tends to be resil-ient over time; but it may also be due to measurement error. Moreover, most of the within-country, longitudinal variation in the index is provided by the advanced countries. For the Asian countries, the index is entirely time-invariant.
Th e third dimension of labour institutions considered in this analysis is compliance with international labour standards. Th ree indicators were used: 1) the number of core ILO Conventions ratifi ed by a given country in a given year;21 2) the number of ratifi ca-tions of Convention No. 87 and Convention No. 98; and 3) unpublished violation severity scores elaborated and kindly made available to us by the OECD Secretariat.22 Th e severity scores are based on the biannual reports on Convention No. 87 and Convention No. 98, the two core Conventions on freedom of association and collective bargaining, respec-tively, by the ILO Committee of Experts on the Application of Conventions and Recom-mendations (CEACR). For the countries that have ratifi ed either Convention, CEACR writes a report every two years, which measures the distance between the norms con-tained in the Convention and the de jure (and, to a lesser extent, also de facto) situation in each country. Th e OECD Secretariat coded the CEACR reports for a number of coun-tries between 1990 and 1999 and elaborated a violation severity index for each Conven-tion23 Th ese indices (which are not available for all countries in the sample) tell us not just whether one of the Conventions has been ratifi ed but also the extent of a country’s compliance with it.24 Figures 3.A1 and 3.A2 plot the average severity scores over time. For Convention No. 87 the graph reveals fi rst an increase in the severity of violations in the early 1990s and then a decrease. For Convention No. 98 there seems to be a constant increase over time.
21. Th e ILO core Conventions are eight in number and pertain to: the Forced Labour Convention, 1930 (No. 29) and the Abolition of Forced Labour Convention, 1957 (No. 105); Conventions No. 87 and No. 98); the Equal Remuneration Convention, 1951 (No. 100) and the Discrimination (Employment and Occupation) Convention 1958 (No. 111); and the Minimum Age Convention, 1973 (No. 138) and the Worst Forms of Child Labour Convention, 1999, (No. 182).22. Many thanks to Douglas Lippoldt of the OECD Secretariat for providing these data.23. Th e index weights the perceived severity of the labour violation (based on the OECD Secretariat’s assessment) against the severity of the CEACR evaluation of the situation. For more information on the construction of the index, see OECD (2000, pp. 85-87). Th e data have been linearly interpolated.24. Th e number of countries for which the Convention No. 87 severity score is available is 30 in 1990 and 32 in 2000. For the Convention No. 98 severity score, these numbers are 29 and 32, respectively. It needs to be taken into account that several countries in the sample have not ratifi ed either or both Conventions. For these countries, the severity scores are obviously not available.
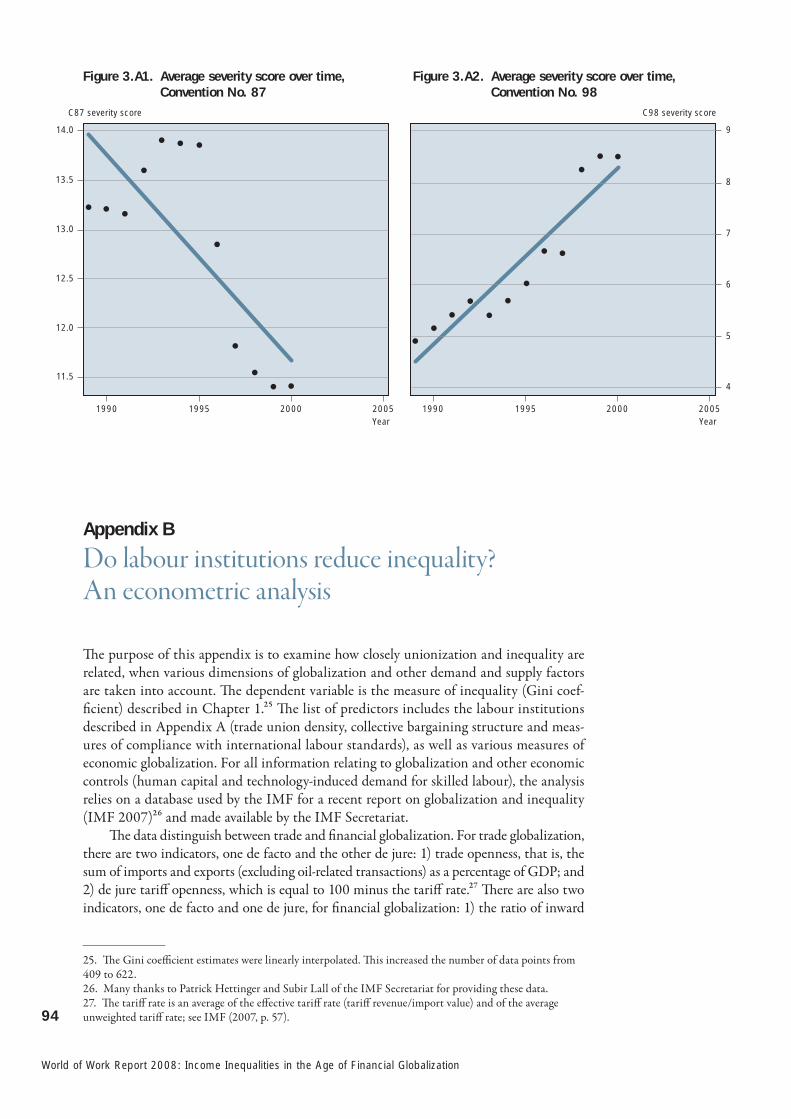
94
World of Work Report 2008: Income Inequalities in the Age of Financial Globalization
Appendix B
Do labour institutions reduce inequality? An econometric analysis
Th e purpose of this appendix is to examine how closely unionization and inequality are related, when various dimensions of globalization and other demand and supply factors are taken into account. Th e dependent variable is the measure of inequality (Gini coef-fi cient) described in Chapter 1.25 Th e list of predictors includes the labour institutions described in Appendix A (trade union density, collective bargaining structure and meas-ures of compliance with international labour standards), as well as various measures of economic globalization. For all information relating to globalization and other economic controls (human capital and technology-induced demand for skilled labour), the analysis relies on a database used by the IMF for a recent report on globalization and inequality (IMF 2007)26 and made available by the IMF Secretariat.
Th e data distinguish between trade and fi nancial globalization. For trade globalization, there are two indicators, one de facto and the other de jure: 1) trade openness, that is, the sum of imports and exports (excluding oil-related transactions) as a percentage of GDP; and 2) de jure tariff openness, which is equal to 100 minus the tariff rate.27 Th ere are also two indicators, one de facto and one de jure, for fi nancial globalization: 1) the ratio of inward
25. Th e Gini coeffi cient estimates were linearly interpolated. Th is increased the number of data points from 409 to 622.26. Many thanks to Patrick Hettinger and Subir Lall of the IMF Secretariat for providing these data.27. Th e tariff rate is an average of the eff ective tariff rate (tariff revenue/import value) and of the average unweighted tariff rate; see IMF (2007, p. 57).
1990 1995 2005Year
C87 severity score C98 severity score
14.0
13.0
12.5
12.0
11.5
13.5
9
7
6
5
4
8
2000 1990 1995 20052000Year
Figure 3.A1. Average severity score over time, Convention No. 87
Figure 3.A2. Average severity score over time, Convention No. 98

95
3. Labour institutions and inequality
FDI stock as a percentage of GDP (Lane and Milesi-Ferretti 2006);28 and 2) Menzie D. Chinn and Hiro Ito’s measurement of capital openness, which, based on the coding of infor-mation from the IMF Annual Report on Exchange Arrangements and Exchange Restric-tions (AREAER) (Chinn and Ito forthcoming),29 captures the extent of capital controls.
In addition, the econometric analysis reported below also controls for the degree of devel-opment of the credit market,30 for human capital supply31 and for the technological inten-sity of the capital stock.32 A more developed credit market may reduce income inequality by facilitating access to credit by the less wealthy. Similarly, a greater relative supply of skilled labour is likely to reduce inequality by reducing skill premiums. Finally, the higher the (tech-nology-induced) demand for skills, the higher the inequality, all other things being equal.
Among the institutional predictors, in addition to the ones whose eff ects are discussed in chapter 3 – trade union density and collective bargaining coverage, both of which the previous literature considered to be negatively related to inequality – two other indicators relating to labour law indicators are considered: core Convention ratifi cation and compli-ance with the rights of association and collective bargaining. While there is no clear guid-ance in the literature concerning their eff ects, they should theoretically operate in the same way as other institutions: to the extent that they strengthen the bargaining position of less skilled workers or proxy for a government’s favourable attitude towards redistribution, they should be associated with a more equal distribution. Th e analysis also controls for political regime, and specifi cally for political rights violations, by using the Freedom House indi-cator.33 Th is is done for two reasons. First, it is more than likely that the eff ects of trade unionism and collective bargaining are contingent on the prevailing political regime: trade unions in non-democratic countries (where membership may be compulsory, or eff ectively so) may not redistribute as much as in democratic countries if at all. Also, to the extent that, in democratic regimes, political parties are pushed by the logic of electoral competi-tion to compensate for increasing market inequality (where the income of the median voter falls below average income) with redistributive taxes and transfers (Meltzer and Richard 1981), it may be assumed that countries with fewer violations of political rights would have lower income inequality than others.34 Table 3.B1 summarizes the list of predictors included in the econometric analysis and theoretical expectations about their eff ects. Th e analysis begins by examining changes within countries over time.35
28. Th e Lane and Milesi-Ferretti data set on gross foreign asset and liability positions for 145 countries is available online at: http://www.tcd.ie/iiis/pages/people/planedata.php/. 29. Th e Chinn-Ito de jure measure of capital openness is available online at: http://www.web.pdx.edu/~ito/kaopen_2006.xls/. 30. Th e measure of fi nancial sector development is private credit provided by deposit money banks and that provided by other fi nancial institutions as a percentage of GDP. See Beck, Demirguc-Kunt and Levine (2007). Th e measure is available online at: http://siteresources.worldbank.org/INTRES/Resources/469232-1107449512766/FinStructure_60_06_fi nal.xls/. 31. Th e measure of human capital is Barro and Lee’s average number of schooling years in the population aged 15+ (Barro and Lee 2000). Th ese data, which are available at fi ve-year intervals until 2000, have been interpolated and extrapolated to cover the 2001-2005 period. Th e Barro and Lee database is available online at: http://www.cid.harvard.edu/ciddata/barrolee/appendix_data_tables.xls/. 32. Th e proxy used is the ratio of the stock of ICT capital to total capital. For more information on this variable, see IMF 2007, p. 58).33. Th e Freedom House scores are available at: http://www.freedomhouse.org/uploads/FIWAllScores.xls. Th e political rights index is graded 1 to 7, with the higher scores indicating more serious violations of political rights.34. Owing to lack of data, it was not possible to consider the impact of other institutional predictors, such as the minimum wage, which is likely to pull up the lower tail of the distribution, or labour market institutions like employment protection and generous unemployment insurance, which are likely to improve the position of less skilled workers. However, in so far as such institutions are closely correlated with unionization and collective bargaining, the latter proxy for the missing institutions as well. Data on 18 advanced countries between 1960 and 1998 suggest that this may indeed be the case: the correlation between union density rates and/or collective bargaining coordination scores, on the one hand, and measures of employment protection, unemployment benefi t replacement and unemployment benefi t duration, on the other, is always positive and signifi cantly diff erent from zero (Baccaro and Rei 2007).35. Th e soft ware used for all analyses is Stata 10 SE.

96
World of Work Report 2008: Income Inequalities in the Age of Financial Globalization
(a) Within-country regression analysis
Th e model estimated is as follows:36
ln (ginii , t) = a + Χ i,t β + Ζ i,t γ + δi + τt + ε
where ln(gini) is the natural logarithm of the Gini coeffi cient in country i at time t ; X is a vector of labour institutions variables, including the trade union density rate, the index of collective bargaining centralization/coordination, the number of core Convention rati-fi cations, particularly of Conventions No. 87 and No. 98, and the OECD indices of the severity of violations of those Conventions; and Z is a vector of economic and social con-trols, which includes the measures of trade discussed above (trade openness, tariff liber-alization) and fi nancial globalization (FDI stock as a percentage of GDP, capital account
36. Th e econometric model assumes that there is no reversed causation (and hence endogeneity) from income inequality to the right-hand side predictors. Th is assumption seems warranted, as far as institutional variables are concerned: institutions are highly path-dependent and, to the extent that they change, the motivation is oft en more political than economic. It also seems unlikely that inequality causes globalization, especially the more de jure dimensions of it, such as tariff and capital account liberalization. One possible source of endogeneity may be found in human capital supply: the individual’s decision to invest in human capital may be related to skill premiums. For this reason, the measure used is average years of education, rather than the percentage of population with higher education (which is more likely to depend on skill diff erentials). Th ere could be endogeneity on the right-hand side of the model, since some of the predictors may be causally related to one another. Th e analysis below tests explicitly for the possible endogeneity of union density to globalization. Endogeneity on the right-hand side of the statistical model is likely to manifest itself as multicollinearity, which makes it more diffi cult to reject hypotheses about zero coeffi cients.
Table 3.B1. List of predictors and expected impact on inequality
Variable Description Expected
Globalization measures
FDI Ratio of inward FDI stock to GDP Ambiguous
Tariff openness 100 minus tariff rate Ambiguous
Capital account openness Index capturing extent of de jure capital controls Ambiguous
Trade openness Sum of imports and exports (excluding oil-related transactions) as a percentage of GDP;
Ambiguous
Other factors
Average education Average number of schooling years in the population aged 15+
Negative
ICT share Stock of ICT capital as a percentage of total capita Positive
Financial sector development Private credit by deposit money banks and other financial institutions as a percentage of GDP
Negative
Institutional factors
Trade union density Union membership as a percentage total wage and salary earners
Negative
Collective bargaining structure Growing incidence of coordination/centralization Negative
Core Convention ratification Number of ILO core Conventions ratified Negative
Convention No. 87 severity index Index capturing compliance with provisions in Convention No. 87
Negative
Convention No. 98 severity index Index capturing compliance with provisions in Convention No. 98
Negative
Reversed democracy index Freedom House political liberty index Negative

97
3. Labour institutions and inequality
openness), as well as the average number of years of education, credit by banks and other fi nancial institutions as a percentage of GDP.37 Th e insertion of the country dummies δi ensures that the focus is exclusively on the time variation within countries. Th e time dummies (τt), which relate to shocks aff ecting all countries simultaneously, seek to cap-ture any cross-sectional dependence in the errors and to account for the cyclical behaviour (around a growing trend) of all the globalization variables. Since the series are trended, it seems implausible that a shock (captured by the error term) should be absorbed in only one year. For this reason, the econometric model allows for fi rst-order serial correlation in the errors:
εi , t = ρεi , t –1 + νi , t
where νi , t is assumed to be independent and identically distributed (i.i.d.) and | ρ | <1.38Th e econometric analysis reported below covers 42 countries for which there are data
on all variables. Th ere are 13 in Latin America and the Caribbean: Argentina, Brazil, Chile, Costa Rica, Dominican Republic, El Salvador, Honduras, Jamaica, Mexico, Para-guay, Peru, Uruguay and Venezuela; 21 advanced countries: Australia, Austria, Belgium, Canada, Denmark, Finland, France, Germany, Greece, Ireland, Italy, Japan, Netherlands, New Zealand, Norway, Portugal, Spain, Sweden, Turkey, United Kingdom and United States; 2 Central and Eastern European countries: Hungary and Poland; and 6 Asian countries: China, India, Republic of Korea, Pakistan, Philippines and Singapore 39 Th e time frame is 1989-2003, since in no instances is the capital openness indicator avail-able for 2004-2005. All variables, except tariff liberalization, capital openness, union den-sity and collective bargaining structure, are transformed to natural logarithms in order to make them more normally distributed.40
Columns 1 to 4 in table 3.B2 present the results of estimations in which the within-country variation in the Gini coeffi cient is solely a function of economic variables (globali-zation measures and controls). Column 1 includes FDI, the index of tariff liberalization, the index of capital account openness, the average number of years of education and a measure of the development of the fi nancial sector. Column 2 replaces the tariff -based
37. Separate specifi cations not reported here also control for the share of ICT investment in total capital stock, which acts as proxy for relative labour demand. Th is measure is available for a subset of countries and turns out to have substantial positive relation to inequality. See Baccaro (2008) for these additional results.38. Th e time series are too short for meaningful tests of stationarity and cointegration. However, while the series are certainly long-memoried (De Boef 2001), a unit-root problem is unlikely. Inspection of the coeffi cient of the lagged dependent variable in a specifi cation including labour institutions, globalization variables and other economic controls (the right-hand variables are the same as in column 1 of table B2 below, except that the lagged dependent variable is also included) but excluding the country dummies indicates that not even with this estimator, which is known to bias the coeffi cient of the lagged dependent variables upwards, does the 95 per cent confi dence interval of the lagged dependent variable cover one (Bond 2002).39. Data on the capital account openness index are unavailable for Taiwan (China) and several Central and Eastern European countries Czech Republic, Estonia, Latvia, Lithuania, Slovakia and Slovenia). For Estonia, Latvia, Lithuania and Taiwan (China), data on average number of years of education are also unavailable. Th ere are no data on the variable credit by bank and other fi nancial institutions as a percentage of GDP for Taiwan (China) and the reversed democracy index is not available for Hong Kong (China).40. Th e Stata command used for estimation is xtregar, fe. Th is routine estimates time-series cross-section regressions when the error term is fi rst-order autoregressive (AR(1)). It is based on Baltagi and Wu (1999) and is appropriate for unbalanced panels and for observations that are unequally spaced over time. Th e option onestep – used to estimate the autoregressive parameter ρ – implements the method proposed by Baltagi and Wu (1999). Aft er ρ is estimated, the data are transformed in two stages: fi rst to remove the Ar(1) component and then to remove the fi xed eff ects (“within” transformation). In this second transformation, the fi rst observation of each panel is dropped (see Stata Corporation 2007, pp. 421-427). Note that the AR(1) component estimated to be around 0.6 in all specifi cations, which is a sizeable fi gure. Th is implies that ignoring serial correlation of the errors, especially in the presence of heavily trended independent variables, is likely to underestimate severely the standard errors of the coeffi cients and overestimate the R2, which would give over-generous signifi cance levels (see Gujarati 2003, pp. 449-460). Indeed, estimates of fi xed-eff ects models identical to the ones reported in table 3.5 that disregard (fi rst-order) serial correlation in the error term show up many more economic variables signifi cantly diff erent from zero and the R2 is more than 20 per cent higher.

98
World of Work Report 2008: Income Inequalities in the Age of Financial Globalization
Table 3.B2. Determinants of Gini: fixed-effects models, with AR(1) errors, intercept and time dummies not reported
Dependent variable 1 2 3 4 5 6 7 8 9 10
FDI 0.0243 b 0.0209 b 0.0215 b 0.0275 a 0.0237 b 0.0260 b 0.0263 b 0.0263 b 0.0264 b 0.0266 b
(0.0101) (0.0104) (0.0105) (0.0105) (0.0104) (0.0107) (0.0106) (0.0107) (0.0106) (0.0106)
Tariff liberalization 0.00133 — — 0.00130 0.00147 0.00150 0.00183 c 0.00190 c 0.00184 c 0.00196 c
(0.00102) — — (0.00102) (0.00106) (0.00107) (0.00108) (0.00112) (0.00109) (0.00109)
Capital account openness
-0.00342 -0.00341 -0.00347 -0.00326 -0.00331 -0.00337 -0.00408 -0.00413 -0.00429 -0.00376
(0.00338) (0.00337) (0.00338) (0.00339) (0.00348) (0.00351) (0.00351) (0.00354) (0.00352) (0.00354)
Education years (average)
-0.256 -0.238 -0.239 -0.207 -0.212 -0.201 -0.194 -0.197 -0.203 -0.200
(0.186) (0.188) (0.189) (0.190) (0.192) (0.193) (0.187) (0.187) (0.187) (0.185)
Credit to private sector -0.0118 -0.0108 -0.0107 -0.0123 -0.00956 -0.0102 -0.0106 -0.0109 -0.0115 -0.0106
(0.0111) (0.0111) (0.0111) (0.0111) (0.0114) (0.0115) (0.0114) (0.0114) (0.0114) (0.0113)
Trade openness — 0.00831 0.0121 — — — — — — —
— (0.0195) (0.0209) — — — — — — —
Trade openness in advanced countries
— — -0.0208 — — — — — — —
— — (0.0409) — — — — — — —
GDP — — — -0.0412 — — — — — —
— — — (0.0432) — — — — — —
GDP squared — — — 0.00532 — — — — — —
— — — (0.00421) — — — — — —
Union density (UD) — — — — -0.0159 -0.0203 0.0526 0.0515 0.0529 0.0513
— — — — (0.0628) (0.0633) (0.0749) (0.0764) (0.0751) (0.0752)
Reversed Democracy index
— — — — — 0.000228 0.00154 0.00163 0.00168 0.00129
— — — — — (0.00473) (0.00479) (0.00484) (0.00480) (0.00481)
UD in advanced — — — — — — 0.0123 0.0212 0.00715 0.0325
— — — — — — (0.190) (0.190) (0.190) (0.190)
UD in Central and East European countries
— — — — — — -0.356 b -0.357 b -0.353 b -0.346 b
— — — — — — (0.152) (0.150) (0.151) (0.151)
UD in Asia — — — — — — -0.231 -0.222 -0.218 -0.220
— — — — — — (0.359) (0.362) (0.360) (0.361)
Collective bargaining structure
— — — — — — — -0.00114 — —
— — — — — — — (0.00521) — —
No. of ratifications of core Conventions
— — — — — — — — 0.00295 —
— — — — — — — — (0.00425) —
No. of ratifications of Conventions No. 87 and No. 98
— — — — — — — — — -0.0130
— — — — — — — — — (0.0138)
Time dummies Yes Yes Yes Yes Yes Yes Yes Yes Yes Yes
Observations 435 441 441 435 422 417 417 416 417 417
Number of countries 43 44 44 43 43 42 42 42 42 42
Coefficient of determi-nation (R2) (within)
0.158 0.147 0.147 0.165 0.156 0.157 0.188 0.193 0.191 0.194
Estimated ρ 0.633 0.643 0.643 0.628 0.621 0.621 0.592 0.583 0.589 0.585
Figures in brackets represent standard errors. a p < 0.01. b p < 0.05 c p < 0.1

99
3. Labour institutions and inequality
measure of trade liberalization with trade openness. Column 3 tests whether trade open-ness has different impacts in advanced and developing countries, as suggested by the Stolper-Samuelson theorem (see Perry and Olarreaga 2007), by introducing an interac-tion between the trade openness variable and a dummy that captures whether a country is advanced or developing. Column 4 estimates a Kuznets (1955)-type model by checking whether the trajectory of within-country inequality is aff ected by levels of income. To this end, GDP and its square are entered.
Of all economic controls, the only one that seems robustly associated with inequality is FDI levels as a percentage of GDP: the greater the growth in FDI, the greater the increase in inequality within a country. Th ere may be at least two reasons for this. First, FDI may increase demand for skills in the receiving country at the same time as it decreases the rela-tive demand for semi-skilled workers in the sending country (Feenstra and Hanson 2001), the assumption being that FDI replaces low-skill activities in the sending country, with activities that are relatively skill-intensive in the receiving country, for example in such sec-tors as textiles and apparel (IMF 2007, p. 45). Second, the need to attract FDI may induce a country to reduce taxes and adopt less redistributive social policies (Cornia 2004). Of the other economic variables, tariff liberalization seems positively associated with income inequality, while capital account liberalization, average years of education and credit to the private sector are negatively signed. However, one cannot reject the hypothesis of zero coeffi cients for these variables, with the exception of the tariff liberalization index which is oft en signifi cant at the 10 per cent level.
Columns 4 to 10 examine the impact of labour institutions, taking other economic determinants into account. Column 5 includes union density and column 6 the reversed democracy score (the higher the score, the more undemocratic the country concerned in year in question). Column 7 examines possible variations in the impact of unionization and to this end introduces specifi c terms for advanced countries, Central and Eastern Euro-pean countries, and Asian countries, the reference category being unionization in Latin American countries. It is conceivable that, in an economy characterized by a large informal sector, a high degree of organization among formal-sector workers may increase income inequality, especially if trade unions represent predominantly skilled workers (Heckman and Pagés 2000). Column 8 includes collective bargaining structure, the assumption being that a more centralized/coordinated collective bargaining structure tends to reduce ine-quality.41 Column 9 checks whether an increase in the number of ratifi cations of core Con-ventions has a signifi cant impact on income inequality. Column 10 focuses exclusively on the two core Conventions on freedom of association and collective bargaining (FACB).42
Th e pattern of results in table 3.B2 remains valid even when a number of robustness checks (not shown here), including the use of alternative estimators, are performed (Bac-caro 2008). In particular, the introduction of an important additional control – the share of ICT investment in the capital stock – does not seem fundamentally to change conclu-sions concerning other predictors. Although available only for a subset of countries and for no Central or Eastern European country, which precludes any estimation of the eff ect of union density in the region43, this proxy, which captures technology-induced demand for skilled labour, turns out to be a signifi cant predictor of inequality: the higher the share
41. Th e collective bargaining structure index is entirely time-invariant for Asian countries; any time variation that does appear is due to variation within the advanced countries. An analysis of regional heterogeneity similar to that conducted for trade union density would therefore make little sense in this case. 42. Th e regression coeffi cient on the FACB variable depends only on Hong Kong (China), the Netherlands and New Zealand, which were the only countries for which the 0-2 index of ratifi cations of Conventions No. 87 and No. 98 changed in the period under consideration. Th e overall number of core Conventions ratifi ed, however, had greater time variation.43. Data on IT investments as a percentage of capital stock are unavailable for the following countries and territories: Czech Republic, Dominican Republic, Estonia, Greece, Hong Kong (China), Hungary, Jamaica, Latvia, Lithuania, New Zealand, Poland, Portugal, Slovakia, Slovenia, Switzerland and Taiwan (China).

100
World of Work Report 2008: Income Inequalities in the Age of Financial Globalization
of ICT, the higher the inequality. With this alternative specifi cation, the coeffi cients of FDI and tariff liberalization become insignifi cant. Also, the number of years of education emerges as a signifi cant negative predictor of inequality.
Table 3.B3 examines possible endogeneity on the right-hand side of the Gini equa-tion. Specifi cally, it considers whether the reason why union density has no signifi cant eff ect on income inequality, even when globalization forces are taken into account, is that union density is itself aff ected by globalization. Th e results of two fi xed-eff ects models with AR(1) errors, where the dependent variable is unionization and within-country changes in unionization are regressed on globalization variables, suggest that the increase in FDI stock as a percentage of GDP within countries is associated with a decline in union den-sity in those countries. Th ere is case-study evidence on Ireland (a country in which FDI plays a key role) suggesting that as FDI was attracted to the country in large quantities in the 1990s, multinational corporations (particularly those from the United States) increas-ingly went back on their previous practice and refused to recognize trade unions. Th is was possible because the public agency responsible for attracting FDI waived the union recog-nition requirement for location grants (Roche and Geary 1997; Gunnigle and McGuire 2001). Th ese examples suggest possible channels through which an increase in FDI may thus lead to lower unionization. Other facets of globalization (tariff liberalization, cap-ital openness, trade openness) do not seem to have a signifi cant impact on unionization. When the models in table 3.B2 are re-estimated by dropping the FDI factor and thus allowing union density a potentially greater impact on inequality, not mediated by FDI, the results do not change much (Baccaro 2008). Both trade union density and other insti-tutional variables remain insignifi cant predictors of inequality, again with the exception of trade union density in Central and Eastern European countries.
Overall, the results of the within-country analysis suggest that, generally speaking, changes in union density are not signifi cantly associated with changes in income ine-quality in the period under investigation. If one distinguishes by region, however, one fi nds that in the Central and Eastern European countries, the precipitous decline in unionization aft er the collapse of the Berlin Wall seems to have signifi cantly contrib-uted to an increase in inequality.44 Interestingly enough, while they are not signifi cantly diff erent from zero, the coeffi cients for unionization in Latin American and advanced countries are positive rather than negative. Th e political freedom index is positive (indi-cating that the more political rights are violated, the greater the inequality) but statisti-cally insignifi cant. Nor does the centralization or coordination of collective bargaining reduce inequality: the coeffi cient is negative but statistically insignifi cant.45 Finally, the ratifi cation of core Conventions, including Conventions No. 87 and No. 98, is not sig-nifi cantly associated with inequality.46
44. Since the capital openness and education variables are not available for a number of Central and Eastern European countries – only Hungary and Poland have data on the former – and these variables seem insignifi cant according to the previous analysis, they are removed from the econometric model, using an alternative specifi cation not shown here (see Baccaro 2008, table 9), in order to demonstrate the impact of union density for a greater number of countries in the region. With this alternative specifi cation, the coeffi cient of unionization can refer to a much larger sample of countries: Czech Republic, Estonia, Latvia, Lithuania, Slovakis and Slovenia, in addition to Hungary and Poland. It remains negative, approximately of the same magnitude as before and highly signifi cant. 45. As argued above, the coeffi cient of the collective bargaining structure largely depends on developments in advanced countries, which are the only regional groups with substantial within-country variation.46. Additional models have been estimated to assess the impact on inequality of variations in the severity of violations of Conventions No. 87 and No. 98, with controls for other determinants. None of these additional institutional variables seems to have a signifi cant impact on inequality. Th ese additional results are available upon request.

101
3. Labour institutions and inequality
(b) Between-country regression analysis
Having examined how the change in labour institutions within countries has aff ected the change in inequality in the past few years, the goal of this subsection is to examine whether countries that are more institutionally dense – that is, having a higher unioniza-tion rate, a more centralized collective bargaining system and greater respect for political rights and core labour rights— tend to be associated with lower average levels of ine-quality, taking into account various features of globalization.
Table 3.B4 estimates essentially the same specifi cations as table 3.B2, but focuses on the cross-sectional variation in the data. Columns 1 and 2 contain only economic controls. Columns 3 to 8 check for the impact of institutional predictors, thus enabling the eff ects of trade unionism (columns 5 and 6), of collective bargaining structure (column 7) and of the two together (column 8) to be regionally-diff erentiated.
Th e results of the between-country estimators are rather diff erent from those of the within-country estimators. Diff erences in average levels of income inequality across countries seem to be due entirely to institutional diff erences. Th e economic predictors are hardly ever statistically diff erent from zero. Th e two exceptions are the measure of human capital, which (as expected) is negatively associated with inequality in the model including only economic controls (table 3.12, column 1), although its coeffi cient declines dramatically in absolute value, and becomes statistically insignifi cant, once the institu-tional predictors are inserted; and the extent of FDI, which is positive but rarely signifi -cantly diff erent from zero.
As stated in the body of the chapter, labour institutions make a significant dif-ference to average levels of inequality across countries; yet they do not seem to signifi -cantly aff ect recent changes in inequality. Th ere are several possible reasons for this. One reason could be measurement error: since the institutional variables are not measured very precisely – probably less precisely than the economic variables – their impact may be
Table 3.B3. Impact of globalization on union density rates: fixed-effects models with AR(1) errors, intercept and time dummies not reported
Dependent variable 1 2
FDI -0.000930 a -0.000966 a
(0.000358) (0.000359)
Tariff liberalization 0.000348 0.000385
(0.000570) (0.000572)
Capital account openness 0.00111 0.00108
(0.00240) (0.00240)
Trade openness 0.00680
(0.0135)
Time dummies Yes Yes
Observations 564 564
No. of countries 43 43
R2 (within) 0.0919 0.0950
Estimated ρ 0.714 0.708
Figures in brackets represent standard errors. a p < 0.01. b p < 0.05 c p < 0.1

102
World of Work Report 2008: Income Inequalities in the Age of Financial Globalization
Table 3.B4. Determinants of Gini coefficients: between effects (constant not reported)
Dependent variable (1) (2) (3) (4) (5) (6) (7) (8)
FDI 0.0639 c 0.0467 0.0648 b 0.0397 0.0326 0.0231 0.0270 0.0253
(0.0377) (0.0458) (0.0312) (0.0295) (0.0226) (0.0231) (0.0253) (0.0240)
Tariff liberalization 0.00647 0.00735 0.00466 0.00446 0.00207 0.00257 0.00434 0.00214
(0.00769) (0.00819) (0.00641) (0.00560) (0.00442) (0.00434) (0.00491) (0.00468)
Capital account openness -0.0470 -0.0725 -0.0469 -0.00747 -0.0192 -0.0103 -0.0237 -0.00575
(0.0419) (0.0501) (0.0347) (0.0320) (0.0266) (0.0266) (0.0284) (0.0279)
Education years (average) -0.0566 a -0.0297 -0.0308 -0.00429 0.00288 -0.00240 -0.00342 -0.00667
(0.0207) (0.0275) (0.0183) (0.0176) (0.0141) (0.0142) (0.0157) (0.0149)
Credit to private sector -0.0862 -0.120 -0.0691 -0.0748 -0.00655 -0.0000386 -0.0109 0.0160
(0.0666) (0.0751) (0.0559) (0.0487) (0.0554) (0.0545) (0.0518) (0.0574)
ICT share capital (%) -0.00865
(0.0129)
Union density (UD) -0.660 a -0.822 a 0.348 0.462 -0.598 a 0.421
(0.161) (0.149) (0.322) (0.323) (0.143) (0.489)
Reversed democracy index 0.0909 a 0.0638 b 0.0542 c 0.0542 b 0.0535 c
(0.0262) (0.0268) (0.0270) (0.0261) (0.0281)
UD • in advanced countries -1.137 a -1.152 a -1.067 b
(0.283) (0.277) (0.490)
• in Central and Eastern European countries -1.707 a -1.716 a -3.835 b
(0.345) (0.338) (1.824)
• in Asia -0.964 b -1.016 a -0.980 c
(0.372) (0.366) (0.535)
Collective bargaining structure -0.0317 0.0715 c -0.0164
(0.0213) (0.0392) (0.0545)
• advanced countries -0.114 a -0.0200
(0.0358) (0.0558)
• in Central and Eastern European countries -0.226 a 0.395
(0.0613) (0.326)
• Asia -0.103 -0.00743
(0.0625) (0.0760)
Year d -0.0216 -0.0172 -0.000853 0.0257 0.0226 0.0220 0.0184 0.0229
(0.0266) (0.0338) (0.0230) (0.0217) (0.0164) (0.0161) (0.0180) (0.0170)
No. of countries 43 35 43 42 42 42 42 42
R2 0.449 0.487 0.627 0.730 0.860 0.870 0.845 0.879
Figures in brackets represent standard errors. a p < 0.01. b p < 0.05 c p < 0.1 d Since the sample is unbalanced, and the countries are observed at different points in time, the variable “Year” checks whether the period in which the countries are observed affects the assessment of their average inequality.
diminished. Secondly, changes in institutions take a long time to aff ect income distribu-tion, so, given the short time frame of the analysis here, their eff ects perceptible. Th irdly, labour institutions may have begun to function diff erently: whereas in the past: stronger trade unions and a more centralized structure of bargaining led to a more compressed income distribution through various means, more recently they no longer do so, or do so to a much lesser extent. Th e results of a more detailed analysis of inequality trends reported in Appendix C seem to support this third hypothesis.

103
3. Labour institutions and inequality
Appendix C
Is the inequality-reduction eff ect of industrial relations institutions withering away in advanced countries?
Th is appendix addresses the question of whether the impact of labour institutions has been changing over time by taking a closer look at 16 advanced countries for which longer time-series data on institutions and other variables are available (Australia, Austria, Bel-gium, Canada, Denmark, Finland, France, Germany, Ireland, Italy, Netherlands, Norway, Spain, Sweden, United Kingdom and United States). Th e analysis begins by re-estimating essentially the same within-country model as in table B2, over the same time frame, but controlling for the proportion of ICT investment in total capital – a measure which is available for all the above countries (columns 1 and 3 in table 13). Th e reversed democ-racy index is not included, as it is entirely time-invariant for the 16 countries in question.47 Another predictor for which time-series data are available – total public social expenditure as a percentage of GDP – is added (column 3). Th us the focus is on the eff ects that labour institutions exert directly on income inequality. Th ose that these institutions exert indi-rectly, by being associated with a more generous welfare state are now controlled for.48
Th ere are some interesting changes in the globalization variables when the focus is on advanced countries: FDI comes out as a signifi cant predictor only when technology-induced demand for skilled labour is not explicitly taken into account (column 2), which suggests that the FDI term is likely to act as proxy for this omitted variable and that FDI in developed countries probably leads to greater demand for skilled labour (Feen-stra and Hanson 2001). Moreover, an increase in de jure capital openness seems to lead to greater income inequality in these countries, whereas a greater supply of skills is associated with lower inequality. Th e higher the share of ICT investment (signalling greater relative demand for skilled labour), the more inequality increases. Total public social expendi-ture emerges as a highly signifi cant predictor: the more social expenditure declines in a country, the more inequality (measured by the Gini coeffi cient of equivalized net house-hold disposable income) increases.49
In line with previous results changes in unionization and collective bargaining coor-dination are both negatively signed but not signifi cantly diff erent from zero. Th is runs counter to previous research fi ndings – all relating to an earlier period – reported in this chapter, which suggested that industrial relations institutions had an equalizing eff ect on earnings and hence on income distribution. To check whether the eff ects have indeed changed compared to the past, the remainder of this appendix considers a longer time frame – 1978-2002 – for the 16 advanced countries in question.
Th e analysis that follows is freely inspired by a theoretical paradigm known as power resource theory (PRT), which was elaborated to explain the historical trajectory of the Scandinavian countries, advanced capitalist societies characterized by a highly egali-tarian distribution of incomes (Korpi and Shalev 1979; Stephens 1979; Korpi 1983; Esping-Andersen and Korpi 1984; Esping-Andersen 1990). According to PRT, there are
47. All 16 countries score 1 (minimum level of political rights violation) throughout the period under consideration.48. Th e data, which cover the period up to 2003, come from the OECD Social Expenditure Database.49. One legitimate concern about the social expenditure variable has to do with possible reversed causation (from inequality to social expenditure) and hence endogeneity. However, if high inequality leads governments to increase social expenditure, then the correlation between the two should be positive rather than negative, as it appears in column 3 of table 3.C1. Th e coeffi cient of social expenditure can thus be considered a lower bound.

104
World of Work Report 2008: Income Inequalities in the Age of Financial Globalization
substantial variations in the organization of capitalist societies that ultimately lead to dif-ferent levels of equality or inequality in the distribution of incomes (Korpi 2006). Th e cru-cial factor determining these diff erences is the power of organized labour. Th e argument is that at crucial moments in history – the period between the First and Second World Wars and then in the early post-war years – in some countries, although not in others, the labour movement and its political allies were able, through mobilization and industrial action, to force capital into a compromise, whereby, in exchange for accepting capitalist organization of the economy, labour obtained not only a recognition of its prerogatives as the labour market intermediary, by means of protective regulations on trade unionism and collective bargaining, but also protection against various social risks and an increasing range of social rights.
Over time, this historical compromise crystallized into a specifi c type of organized capitalism, quite unlike the model prevailing in the United States and subsequently in other Anglo-Saxon countries: a highly institutionalized labour market structure, in which a large percentage of the workforce belonged to trade unions, wages and working conditions were determined through collective bargaining at the national level and there was an exten-sive welfare state whose provisions were a matter of citizenship rights, not of the individual’s ability to pay. Th ere was consequently a relatively equitable distribution of incomes.
Table 3.C1. Determinants of the Gini coefficient in 16 advanced countries (fixed effects with AR(1) errors, time dummies and constant not reported)
Dependent variable 1 2 3
FDI 0.0157 0.0293 c -0.00214
(0.0151) (0.0152) (0.0147)
Tariff liberalization 0.00271 0.00498 0.00397
(0.00402) (0.00413) (0.00385)
Capital openness 0.0192 c 0.0132 0.0229 b
(0.0105) (0.0109) (0.00963)
Education years -0.707 -1.124 b -0.838 b
(0.460) (0.475) (0.404)
Credit to private sector -0.0154 -0.0197 -0.00426
(0.0138) (0.0143) (0.0132)
ICT share 0.197 a 0.0922 c
(0.0554) (0.0540)
Union density -0.283 -0.226 -0.230
(0.179) (0.186) (0.169)
Collective bargaining coordination -0.00312 -0.000705 -0.000978
(0.00541) (0.00555) (0.00525)
Public social expenditures -0.0113 a
(0.00261)
Time dummies Yes Yes Yes
Observations 175 175 174
No. of countries 16 16 16
Adjusted R2 0.168 0.0894 0.292
Estimated ρ 0.595 0.611 0.532
Figures in brackets represent standard errors. a p < 0.01. b p < 0.05 c p < 0.1

105
3. Labour institutions and inequality
In brief, according to PRT, labour power is responsible both for the establishment of a large welfare state and for a highly institutionalized structure of the industrial rela-tions system. It thus aff ects inequality through both channels. On the one hand, it con-tributes to the direct compression of market earnings (the industrial relations channel), because trade unionism is historically associated with egalitarian wage policies (“equal pay for equal work”) and centralized wage bargaining further contributes to wage compres-sion by reducing inter-establishment and inter-sector dispersion. On the other hand, it also reduces inequality indirectly by contributing to the establishment and gradual devel-opment of a large, redistributive welfare state, which corrects market-generated inequality through redistributive taxes and transfers. Th e PRT argument incorporates an element of path-dependency (Th elen 1999; Pierson 2004): the events that shaped organized capi-talism took place far back in history. However, since institutions are resilient and tend to change only slowly over time, those formative events still shape cross-national diff erences in industrial relations and welfare systems.
In this appendix, the applicability of the theoretical framework summarized above is tested through the simple empirical strategy of comparing cross-sectional regressions at two points in time: the decades 1978-1989 and 1990-2002.50 Th e year 1990 was selected as a cut-off point simply because it divides the sample more or less in two. Moreover, the 1990s were when the economic processes associated with globalization started to become most visible and when the whole globalization debate began.
One obvious shortcoming of such an empirical approach is that the sample size is very small. As hypothesized by PRT, institutions are likely to form part of a system. In eff ect, this means that their individual features will be highly correlated and that it is dif-fi cult to separate out their respective contributions to inequality patterns. Th e analysis here relies on principal component analysis (PCA) to summarize the information under-lying multiple indicators. PCA assumes that the data are visible manifestations of under-lying hidden constructs, to which they are related, and expresses these hidden constructs as linear combinations of standardized observed variables.
To operationalize labour power, three related indicators were used: 1) the bargaining coordination index described in Appendix A (“BargCoord”); 2) the collective bargaining coverage rate (“BargCov”), namely the percentage of workers covered by collective bar-gaining agreements (see Ochel 2001); and 3) the trade union density rate (“TUDens”). Th ese indicators are all positively correlated and the pairwise correlation coeffi cient is always higher than 0.5 as well as highly signifi cant.
Th e results of the PCA given in table 3.C2 suggest that the three indicators belong together: only one component has higher eigenvalue than 1 and captures about 63 per cent of the total variance. Th e composite indicator of labour power uses the factor load-ings of the fi rst component as weights. Th ese are all positively signed, with bargaining coordination carrying a little more weight than collective bargaining coverage or trade union density in determining a given country’s score. Labour power is thus high in coun-tries with more coordinated bargaining, higher collective bargaining coverage and greater trade union density.
Encouraging results are also obtained from the PCA of the other two constructs. For welfare state size (table 3.C3), two indicators are used: 1) the total tax wedge as a percentage of GDP, including social security and indirect taxes, which, as a proxy for state intervention, indicates how far a state can extract resources from its citizens for its
50. A time series cross-sectional model (TSCS) with annual data was not estimated for a number of reasons: 1) all indicators of inequality, which are drawn from the LIS database – and some institutional indicators, too, such as collective bargaining coverage – are annual interpolations from fi ve-year data; 2) while a TSCS approach generally requires fi xed eff ects to control for time-invariant omitted variables, the labour institutions under consideration do not vary much over time but rather across countries; and 3) the series are long-memoried and seem highly serially correlated. Given the short duration of the series, no reliable tests of stationarity and cointegration are available.
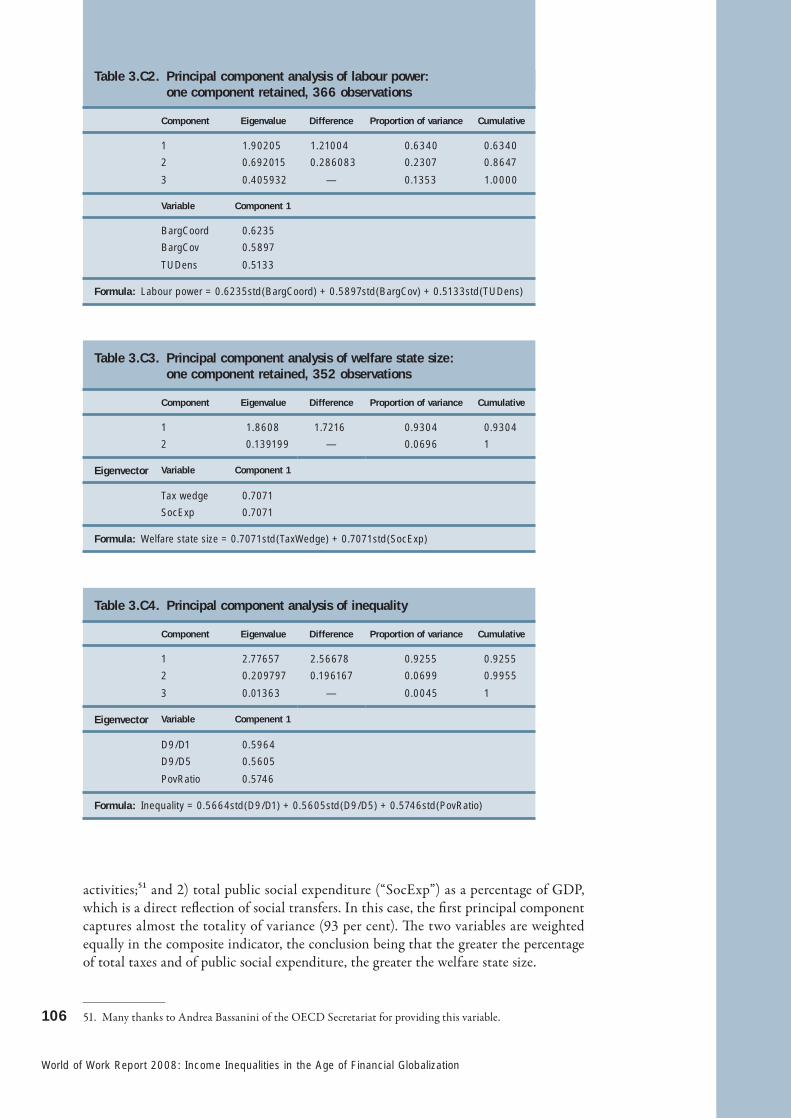
106
World of Work Report 2008: Income Inequalities in the Age of Financial Globalization
activities;51 and 2) total public social expenditure (“SocExp”) as a percentage of GDP, which is a direct refl ection of social transfers. In this case, the fi rst principal component captures almost the totality of variance (93 per cent). Th e two variables are weighted equally in the composite indicator, the conclusion being that the greater the percentage of total taxes and of public social expenditure, the greater the welfare state size.
51. Many thanks to Andrea Bassanini of the OECD Secretariat for providing this variable.
Table 3.C2. Principal component analysis of labour power: one component retained, 366 observations
Component Eigenvalue Difference Proportion of variance Cumulative
1 1.90205 1.21004 0.6340 0.6340
2 0.692015 0.286083 0.2307 0.8647
3 0.405932 — 0.1353 1.0000
Variable Component 1
BargCoord 0.6235
BargCov 0.5897
TUDens 0.5133
Formula: Labour power = 0.6235std(BargCoord) + 0.5897std(BargCov) + 0.5133std(TUDens)
Table 3.C3. Principal component analysis of welfare state size: one component retained, 352 observations
Component Eigenvalue Difference Proportion of variance Cumulative
1 1.8608 1.7216 0.9304 0.9304
2 0.139199 — 0.0696 1
Eigenvector Variable Component 1
Tax wedge 0.7071
SocExp 0.7071
Formula: Welfare state size = 0.7071std(TaxWedge) + 0.7071std(SocExp)
Table 3.C4. Principal component analysis of inequality
Component Eigenvalue Difference Proportion of variance Cumulative
1 2.77657 2.56678 0.9255 0.9255
2 0.209797 0.196167 0.0699 0.9955
3 0.01363 — 0.0045 1
Eigenvector Variable Compenent 1
D9/D1 0.5964
D9/D5 0.5605
PovRatio 0.5746
Formula: Inequality = 0.5664std(D9/D1) + 0.5605std(D9/D5) + 0.5746std(PovRatio)

107
3. Labour institutions and inequality
Th e third PCA captures the level of inequalities in a given country. For this purpose, it uses three highly correlated indicators from the LIS database: 1) the D9/D152 ratio of net disposable income, 2) the D9/D553 ratio of net disposable income; which captures ine-quality in the upper part of the distribution, where, according to some analyses (Atkinson 2007; Atkinson 2008) inequality has grown the most; and 3) the poverty ratio (“Pov-Ratio”), which applies to people with less than 50 per cent of the median net disposable income. Once again, the fi rst principal component captures most of the information in the data (93 per cent). All three factor loadings are positive, with approximately the same weight. A more unequal country is one in which the D9/D1, D9/D5 and poverty ratios are higher.
Table 3.C5 contains estimates of the impact that labour power and welfare state size had on inequality, separately and jointly, in the period 1978-1989. Additional specifi ca-tion (column 2) take account of the power of left -oriented parties (measured through the proportion of seats that they held in the lower chamber of parliament), which, it has been argued, aff ected redistributive stance of governments (Stephens 1979; Bradley et al.
52. D9/D1 is the ratio of the upper limit of earnings of workers in the ninth decile of the earnings distribution to the upper limit of earnings of workers in the fi rst decile.53. D9/D5 is the ratio of the upper limit of earnings of workers in the ninth decile of the earnings distribution to median earnings.
Table 3.C5. Determinants of inequality in 16 advanced countries (1978-1989), between regressions (constants not reported)
Dependent variable (1) (2) (3) (4) (5) (6) (7) (8) (9) (10) (11) (12)
Welfare state -0.650 a -0.659 a -0.844 a -0.845 a -0.716 a -0.642 a -0.887 a -0.643 a -0.707 a -0.576 a -0.646 a -0.647 a
0.0993 0.101 0.144 0.160 0.153 0.122 0.265 0.111 0.150 0.139 0.108 (0.136)
Labour power -0.492 a -0.522 b -0.488 a -0.384c -0.620 a -0.516 a -0.595 a -0.472 a -0.617 a
0.131 0.198 0.127 0.201 0.130 0.133 0.165 0.116 (0.139)
Left power 0.00418
0.0203
Collective bargaining coverage -0.0180
0.0109
Union density -1.571
1.109
Collective bargaining coordination -0.446 b
0.180
FDI 0.0605
0.336
Tariff liberalization 0.136
0.104
Capital openness -0.428 b -0.415 c
0.141 (0.227)
Education years -0.209 c -0.0152
0.102 (0.146)
Credit to private sector -0.442
0.459
ICT Share 0.252
0.497
Adjusted R2 0.748 0.729 0.685 0.682 0.732 0.728 0.760 0.846 0.781 0.741 0.730 0.832
Figures in brackets represent standard errors. a p < 0.01. b p < 0.05 c p < 0.1

108
World of Work Report 2008: Income Inequalities in the Age of Financial Globalization
2003), as well as of other economic determinants (columns 6 and following), which are entered individually, in view of the small sample size. Th e main goal of the analysis is to see whether the coeffi cients of the two main predictors change over time and, if so, in which direction.
Th e compact model with only two predictors in table 3.C5, column 1 – welfare state size and labour power – performs remarkably well in explaining cross-country diff erences in inequality in the 1978-1989 period, accounting for almost 75 per cent of the variance in the dependent variable. All the regression coeffi cients are beta coeffi cients and there-fore directly comparable. Th e most important determinant is the size of the welfare state: one-standard deviation increase in the size of the welfare state reduces inequality by 0.65 standard deviations. Another predictor that has a consistent impact is the labour power indicator, one-standard deviation increase in which is associated with lower inequality of about 0.5 standard deviations. Th e electoral strength of the parliamentary left is insignifi -cant in comparison with welfare state size and labour power (column 2). Th e models in columns 3 to 5 estimate separately the impact of diff erent elements in the labour power indicator. Th e coeffi cient of the collective bargaining coordination term is signifi cantly diff erent from zero (column 5), while the others are not. Th e models in columns 6 to 11 relate to the same economic and globalization factors as examined above (FDI stock, tariff liberalization, capital openness, years of education, credit to the private sector and share of ICT investment in capital stock): they are considered individually in view of the small
Table 3.C6. Determinants of inequality in 16 advanced countries (1990-2002), between regressions (constant not reported)
Dependent variable (1) (2) (3) (4) (5) (6) (7) (8) (9) (10) (11)
Welfare state -0.816 a -0.800 a -0.873 a -0.899 a -0.948 a -0.851 a -0.886 a -0.753 a -0.857 a -0.799 a -0.823 a
0.196 0.210 0.180 0.162 0.157 0.240 0.170 0.181 0.200 0.231 0.208
Labour power -0.314 -0.306 -0.303 -0.365 b -0.411 b -0.348 b -0.393 -0.340
0.187 0.187 0.214 0.135 0.168 0.143 0.248 0.201
Left power -0.00365
0.0144
Collective bargaining coverage -0.00287
0.0135
Union density -1.678
1.026
Collective bargaining coordination -0.219
0.158
FDI -0.228
0.387
Tariff liberalization 0.244
0.182
Capital openness -0.765
0.607
Education years -0.317 b
0.117
Credit to Private Sector -0.595
0.966
ICT share -0.341
0.849
Adjusted R2 0.739 0.718 0.744 0.739 0.731 0.726 0.741 0.751 0.821 0.730 0.720
Figures in brackets represent standard errors. a p < 0.01. b p < 0.05 c p < 0.1

109
3. Labour institutions and inequality
size of the sample. Both capital openness and years of education have a negative value and are of signifi cant size. Yet, when they are entered in the specifi cation simultaneously in column 12, the years of education factor becomes insignifi cant in comparison with welfare state size and labour power; indeed the coeffi cient of the latter even increases in absolute value. Th ese regression results suggest that institutional features of both the welfare state and of the labour market are the most important predictors of cross-country diff erences during inequality levels in the 1978-1989 period.54
In table 3.C6 the same models are re-estimated for the period 1990-2002 to see if coeffi cients change. Th e most important diff erence is that labour power is much less robustly associated with inequality than in the previous period.55 Th e coeffi cient of labour power is still negative, but its magnitude is smaller in absolute value and oft en not signifi -cantly diff erent from zero. Conversely, the welfare state size variable now plays a greater role in explaining cross-country diff erences. A closer look at the individual components of labour power reveals that the biggest change pertains to the collective bargaining coordi-nation index, whose coeffi cient is practically halved and no longer signifi cant (column 5). Th us it looks as though, from the 1990s on, coordinated bargaining no longer signifi -cantly reduced inequality. In controlling economic determinants one by one, as before, one notices that capital openness is no longer signifi cantly associated with lower inequality (column 8). Th e eff ect in the previous period was probably due to small, open societies like the Scandinavian countries, which simultaneously had high capital openness and an egalitarian income structure. As more countries opened up their capital markets, the eff ect disappeared in the later period. Th e human capital control (years of education) remains signifi cantly negative (column 9). Even taking that into account, however, the impact of labour power is lower than in the previous period.56
Th ese results suggest that, from the early 1990s on, the institutions associated with labour power – high trade union density, high collective bargaining coverage and, in par-ticular, a coordinated bargaining structure – largely forfeited their capacity to reduce ine-quality directly by compressing market earnings and only retained an indirect infl uence on inequality by virtue of the size of the welfare state.
54. Th ese results hold good if the dependent variable is the Gini coeffi cient of net disposable income. Th e main diff erences using these alternative specifi cations are that the union density rate coeffi cient is signifi cantly diff erent from zero and that the capital openness and years of education variables are both insignifi cant in column 12. Th e results also apply if the equation in column 1 is re-estimated aft er one country is extracted at a time. Th ese additional analyses are available upon request. 55. It is worth mentioning that a previous analysis found that the impact of bargaining centralization on reducing wage dispersion was “virtually identical” in 1973 and 1985 (Rowthorn 1992, p. 111).56. Again, these results remain valid when the Gini coeffi cient is used as the dependent variable. Th e main peculiarity is that union density does have a signifi cant negative association with the use of the Gini coeffi cient, with a magnitude only slightly smaller than in the previous period. As suggested above, it is bargaining coordination rather than union density that seems to have lost its inequality-reducing eff ects. Th e results also hold good overall if the equation in column 1 is re-estimated aft er the extraction of one country at a time. Interestingly, the labour power term is signifi cant if Canada, Ireland and Italy are taken out of the sample. Th is suggests that in the above-mentioned countries labour power is less conducive to redistribution than elsewhere. Ireland and Italy experienced a marked increase in collective bargaining coordination in the 1990s, with the establishment of “social pacts,” but in both countries inequality not only did not decline but may even have increased. Th ese additional analyses are available upon request.

110
World of Work Report 2008: Income Inequalities in the Age of Financial Globalization
References
Acemoglu, D. 2002. “Technical change, inequality, and the labour market”, in Journal of Economic Literature, Vol. XL, pp. 7-72.
Atkinson, A. B. 2007. “Th e distribution of earnings in OECD countries”, in International Labour Review, Vol. 146, Nos. 1-2, pp. 41-60.
— 2008. Th e changing distribution of earnings in OECD countries (Oxford, Oxford University Press).
—; Brandolini, A. 2001. “Promise and pitfalls in the use of ‘secondary’ data-sets: Income inequality in OECD countries as a case study”, in Journal of Economic Literature, Vol. XXXIX, pp. 771-799.
Baccaro, L. 2002. “Th e construction of “democratic” corporatism in Italy”, in Politics & Society, Vol. 30, No. 2, pp. 327-357.
— 2008. Labour, globalization and inequality: Are trade unions still redistributive?”, Discussion Paper No. 192 (International Institute for Labour Studies, Geneva).
—; Lim, S.-H. 2007. “Social pacts as coalitions of the weak and moderate: Ireland, Italy and South Korea in comparative perspective.” in European Journal of Industrial Relations, Vol. 13, No. 1, pp. 27-46.
—;Locke, R. M. 1998. “End of solidarity? Th e decline of egalitarian wage policies in Italy and Sweden.” in European Journal of Industrial Relations, Vol. 4, No. 3, pp. 283-308.
—; Rei, D. 2007. “Institutional determinants of unemployment in OECD countries: Does the deregulatory view hold water?” in International Organization, Vol. 61, No. 3.
—; Simoni, M. 2007. “Centralized wage bargaining and the ‘Celtic tiger’ phenomenon”, in Industrial Relations, Vol. 46, No. 3, pp. 426-455.
Baltagi, B. H.; Wu, P.X. 1999. “Unequally spaced panel data regressions with AR(1) disturbances”, in Econometric Th eory, Vol. 15, pp. 814-23.
Barrett, A.; Gerald, J. F.; Nolan, B. 2000. “Earnings inequality, returns to education and low pay”, in B. Nolan; P. O’Connell; C. T. Whelan (Dublin, Institute of Public Administration), pp. 127-46.
Barrientos, S. 2007. Global production systems and decent work (Geneva, ILO Policy Integration Department).
Barro, R. J.; Lee, J.-W. 2000. International data on educational attainment: Updates and implications. Center for International Development Working Paper, No. 42. (Cambridge, MA, Harvard University).
Beck, T.; Demirguc-Kunt, A.; Levine, R. 2007. “A new database on fi nancial development and structure”, in World Bank Economic Review, Vol. 14, No. 3, pp. 597-605.
Bennett, J.T.; Kaufman, B.E. (eds). 2007. What do unions do? A twenty-year perspective (New Brunswick, NJ, Transaction).
Berger, S. 2000. “Globalization and politics”, in Annual Review of Political Science, Vol. 3, pp. 43-62.
— 2003. Notre première mondialisation: Leçons d’un échec oublié (Paris, Seuil).—; Compston, H. 2002. Policy concertation and social partnership in Western Europe: Lessons for
the 21st century (New York, Oxford, Berghahn Books).Berman, E.; Machin, S. 2004. “Globalization, skill-biased technological change and labour
demand”, in Lee and Vivarelli, pp. 39-63.Bjorklund, A.; Freeman, R. 2008. Searching for optimal inequality incentives (Cambridge, MA,
National Bureau of Economic Research (NBER)).Blau, F. D.; Kahn, L.M. 1996. “International diff erences in wage male inequality: Institutions
versus market forces”, in Journal of Political Economy, in Vol. 104, No. 4, pp. 791-837.Bond, S. 2002. Dynamic panel data models: A guide to microdata methods and practice, Centre
for Microdata Methods and Practice (CEMMAP) Working Paper 09/02 (London, Institute for Fiscal Studies).
Botero, J. et al. 2003. Th e regulation of labor (Cambridge, MA, NBER).Bradley, D. et al. 2003. “Distribution and redistribution in postindustrial democracies”, in
World Politics, Vol. 55, pp. 193-228.Brady, D.; Beckfi eld, J.; Zhao, W. 2007. “Th e consequences of economic globalization for
affl uent democracies”, in Annual Review of Sociology, Vol. 33, pp. 313-34.

111
3. Labour institutions and inequality
Brandolini, A.; Cipollone, P.; Sestito, P. 2001. Earnings dispersion, low pay and household poverty in Italy. Temi di discussione (Rome, Bank of Italy).
Calderon, C.; Chong, A.; Valdés, R. 2004. Labor market regulations and income inequality: Evidence for a panel of countries (Washington, DC, Inter-American Development Bank).
Card, D.; Lemieux, T.; Riddell, W.C. 2007. “Unions and wage inequality”, in Bennett and Kaufman, pp. 114-59.
Chinn, M.; Ito, H. Forthcoming. “A new measure of fi nancial openness”, in Journal of Comparative Policy Analysis.
Cornia, G. A. 2004. “Trade liberalization, foreign direct investment and income inequality” in Lee and Vivarelli, pp. 169-208.
De Boef, S. 2001. “Modeling equilibrium relationships: Error correction models with strongly autoregressive data”, in Political Analysis, Vol. 9, No. 1, pp. 78-94.
Edin, P.-A.; Holmlund, B. 1995. “Th e Swedish wage structure: Th e rise and fall of solidarity wage policy?” in Freeman and Katz (eds.), pp. 265-306.
Erickson, C. L.; Ichino, A. 1995. “Wage diff erentials in Italy: Market forces, institutions, and infl ation”, in Freeman and Katz (eds.), pp. 265-305.
Esping-Andersen, G. 1990. Th e three worlds of welfare capitalism (Cambridge, Polity).—; Korpi, W. 1984. “Social policy as class politics in postwar capitalism”, in J. Goldthorpe (ed.)
Order and confl ict in contemporary capitalism (Oxford, Oxford University Press), pp. 179-208.Fajertag, G.; Pochet, P. (eds.). 1997. Social pacts in Europe (Brussels, ETUI).—; – (eds.). 2000. Social pacts in Europe. New dynamics (Brussels, ETUI).Feenstra, R. C.; Hanson, G.H. 2001. Global production sharing and rising inequality: A survey of
trade and wages (Cambridge, MA, NBER).Flanders, A. 1970. Management and unions (London, Faber).Freeman, R. B. 2007a. Labor market institutions around the world (Cambridge, MA, NBER).— 2007b. “What do unions do? Th e 2004 M-brane stringtwister edition”, in Bennett and
Kaufman, pp. 607-636.—; Katz, L.F. (eds.). 1995. Diff erences and changes in wages structures. (Chicago, University of
Chicago Press).—; Medoff , J.L. 1984. What do unions do? (New York, Basic Books).Friedman, M. 1962. Capitalism and fr eedom (University of Chicago Press).Gereffi , G.; Humphrey, J.; Sturgeon, T. 2005. “Th e governance of global value chains”, in Review
of International Political Economy, Vol. 12, pp. 78-104.Goldberg, P. K.; Pavcnik, N. 2007. “Distributional eff ects of globalization in developing
countries”, in Journal of Economic Literature, Vol. XLV, pp. 39-82.Golden, M.; Lange, P.; Wallerstein, M. 2006. Union centralization among advanced industrial
societies: An empirical study. Dataset available at http://www.shelley.polisci.ucla.edu/ [16 June]Gottschalk, P.; Smeeding, T.M. 1997. “Cross-national comparisons of earnings and income
inequality”, in Journal of Economic Literature, Vol. XXXV, pp. 633-687.Gujarati, D. N. 2003. Basic econometrics. Fourth Edition (Boston, McGraw-Hill).Gunnigle, P.; McGuire, D. 2001. “Why Ireland? A qualitative review of the factors infl uencing
the location of US multinationals in Ireland with particular reference to the impact of labour issues”, in Th e Economic and Social Review, Vol. 32, No. 1, pp. 43-67.
Gustavsson, M. 2007. “Th e 1990s rise in Swedish earnings inequality – Persistent or transitory?” in Applied Economics, Vol. 39, No. 1, pp. 25 - 30.
Hall, P.A.; Soskice, D. (eds.). 2001. Varieties of capitalism: Th e institutional foundations of comparative advantage (New York, Oxford University Press).
Hassel, A. 2003. “Th e politics of social pacts”, in British Journal of Industrial Relations, Vol. 41, No. 4, pp. 707-726.
Heckman, J. J.; Pagés, C. 2000. Th e cost of job security regulation: Evidence fr om Latin American labor markets (Cambridge, MA, NBER).
International Labour Offi ce (ILO). 2004. A fair globalization: Creating opportunities for all (Geneva).
International Monetary Fund (IMF). 2007. Globalization and inequality. World Economic Outlook 2007 (Washington, D.C.), pp. 31-65.
Kenworthy, L. 2003. “Quantitative indicators of corporatism”, in International Journal of Sociology, Vol. 33, No. 3, pp. 10-44.

112
World of Work Report 2008: Income Inequalities in the Age of Financial Globalization
—; Pontusson, J. 2005. “Rising inequality and the politics of redistribution in affl uent countries”, in Perspectives on Politics, Vol. 3, No. 3, pp. 449-71.
Koeniger, W.; Leonardi, M.; Nunziata, L. 2007. “Labor market institutions and wage inequality”, in Industrial and Labor Relations Review, Vol. 60, No. 3, pp. 340-356.
Korpi, W. 1978. Th e working class in welfare capitalism: Work, unions and politics in Sweden (London, Routledge).
—. 1983. Th e democratic class struggle (London, Routledge).—. 2006. “Power resources and employer-centered approaches in explanations of welfare states
and varieties of capitalism: Protagonists, consenters, and antagonists”, in World Politics, Vol. 58, No. 2, pp. 167-206.
—; Shalev, M. 1979. “Strikes, industrial relations and class confl ict in capitalist societies”, in British Journal of Sociology, Vol. 30, No. 2, pp. 164-187.
Kuruvilla, S. et al. 2002. “Trade union growth and decline in Asia”, in British Journal of Industrial Relations, Vol. 40, No. 3, pp. 431-461.
Kuznets, S. 1955. “Economic growth and income inequality”, in American Economic Review, Vol. 45, pp. 1-28.
Lane, P.R.; Milesi-Ferretti, G.M. 2006. Th e external wealth of nations mark II: Revised and extended estimates of foreign assets and liabilities, 1970-2004. IMF Working Paper (Washington, D.C., IMF).
Lansbury, R.; Wailes, N. 2004. “Employment relations in Australia”, in G. Bamber, R. Lansbury and N. Wailes (eds.) International and comparative industrial relations: globalization and the development market economies (Sydney, Allen & Unwin), pp. 119-145.
Lee, E.; Vivarelli, M. 2006a. “Globalization, employment and distribution in developing countries”, in Understanding globalization, employment and poverty reduction (Houndmills, Palgrave)
—; —. 2006b. Lee and Vivarelli, pp. 1-23.Luebker, M. 2004. Globalization and perceptions of social inequality (Geneva, ILO).Mares, I. 2006. Taxation, wage bargaining, and unemployment (Cambridge, Cambridge
University Press).Meltzer, A. H.; Richard, S. F. 1981. “A rational theory of the size of government”, in Journal of
Political Economy, Vol. 89, No. 5, pp. 914-27.Metcalf, D.; Hansen, K.; Charlwood, A. 2001. “Unions and the sword of justice: unions and pay
systems, pay inequality, pay discrimination and low pay”, in National Institute Economic Review, Vol. 176, No. 1, pp. 61-75.
Munck, R. 2004. “Globalization, labor and the ‘Polanyi problem’”, in Labor History in Vol. 45, No. 3, pp. 251-269.
Murillo, M. V. 2001. Labor unions, partisan coalitions, and market reforms in Latin America (New York, Cambridge University Press).
Nickell, S. et al. 2001. “Th e Beveridge curve, unemployment and wages in the OECD from the 1960 to the 1990s”. Centre for Economic Performance (CEP) Discussion Paper 0502 (London School of Economics, CEP).
O’Rourke, K. H. 2001. Globalization and inequality: Historical trends (Cambridge MA, NBER).Ochel, W. 2001. “Collective bargaining coverage in the OECD from the 1960s to the 1990s”.
CESifo Forum, Winter, pp. 62-65.Organisation for Economic Co-operation and Development (OECD). 2000. International trade
and core labour standards (Paris).— 2007. “OECD workers in the global economy: Increasingly vulnerable?” OECD Employment
Outlook 2007 (Paris), pp. 105-148.Pekkarinen, J.; Pohjola, M.; Rowthorn, B. (eds.). 1992. Social corporatism: A superior economic
system? (Oxford, Clarendon Press).Perry, G.; Olarreaga, M. 2007. “Trade liberalization, inequality, and poverty reduction in Latin
America”, in F. Bourgignon; B. Pleskovic (eds.). Annual World Bank Conference on Development Economics 2007 – Regional: Beyond Transition (Washington, World Bank), pp. 103-139.
Pierson, P. (ed.). 2001. Th e new politics of the welfare state (Oxford, Oxford University Press).— 2004. Politics in time: History, institutions, and social analysis (Princeton, NJ, Princeton
University Press).Pizzorno, A. 1978. “Political exchange and collective identity in industrial confl ict”, in C. Crouch
and A. Pizzorno (eds.) Th e resurgence of class confl ict in Western Europe since 1968 (London, Macmillan).

113
3. Labour institutions and inequality
Polanyi, K. 1957. Th e great transformation (Boston, Beacon Press).Pontusson, J. 2005. Inequality and prosperity: Social Europe vs. liberal America (Ithaca, NY,
Cornell University Press).—; Rueda, D.; Way, C.R. 2003. “Comparative political economy of wage distribution: Th e
role of partisanship and labour market institutions”, in British Journal of Political Science, Vol. 32, pp. 281-308.
—; Swenson, P.; 1996. “Labor markets, production strategies, and wage bargaining institutions: Th e Swedish employer off ensive in comparative perspective”, in Comparative Political Studies, Vol. 29, No. 2, pp. 223-250.
Rama, M.; Artecona, R. 2002. A database of labor market indicators across countries (Washington, DC, World Bank).
Rhodes, M. 1996. Globalisation, labour markets and welfare states: A future of ’ “competitive corporatism”? (Florence, European University Institute).
—; 2001. “Th e political economy of social pacts: ‘Competitive corporatism’ and European welfare reform”, in Pierson, pp. 165-194.
Roche, W. K.; Geary, J.F. 1997. “Multinationals and industrial relations practices”, in T. V. Murphy and W. K. Roche (eds.) Irish industrial relations in practice (Dublin, Oak Tree Press), pp. 277–298.
Rodrik, D. 1997. Has globalization gone too far? (Washington, DC, Institute for International Economics).
Rowthorn, B. 1992. “Corporatism and labour market performance”, in Pekkarinen, Pohjola and Rowthorn, pp. 82-131.
Rueda, D.; Pontusson, J. 2000. “Wage inequality and varieties of capitalism”, in World Politics, Vol. 52 (April), pp. 350-383.
Scheve, K.; Slaughter, M.J. 2004. “Economic insecurity and the globalization of production”, in American Journal of Political Science, Vol. 48, No. 4, pp. 662-674.
—; — 2007. “A new deal for globalization”, in Foreign Aff airs, Vol. 86, No. 4, pp. 34-47.Schulten, T.; 2002. “A European solidaristic wage policy?”, in European Journal of Industrial
Relations, Vol. 8, No. 2, pp. 173-196.Sen, A. 1999. Development as fr eedom (New York, Random House).Smeeding, T.M. 2002. “Globalisation, inequality and the rich countries of the G-20: Evidence
from the Luxembourg Income Study (LIS), in D. Gruen, T.O’Brien and J. Lawson (eds.) in Globalization, living standards and inequality: Recent Progress and Continuing Challenges (Sydney Reserve Bank of Australia).
Stata Corporation 2007. Longitudinal/panel-data reference manual release 10 (College Station, TX)
Stephens, J.D. 1979. Th e transition fr om capitalism to socialism (London, Macmillan).Streeck, W. 2000. “Competitive solidarity: Rethinking the ‘European social model’”,
in K. Hinrichs, H. Kitschelt and H. Wiesenthal (eds.) Kontingenz und Krise: Institutionenpolitik in kapitalistischen und postsozialistischen Gesellschaft en (Frankfurt, Campus Verlag), pp. 245-262.
Swenson, P.; Pontusson, J. 2000. “Th e Swedish employer off ensive against centralized bargaining”, in T. Iversen, J. Pontusson and D. Soskice (eds.) Unions, employers, and central banks: Macroeconomic coordination and institutional change in social market economies (New York, Cambridge University Press), pp. 77-106.
Th elen, K. 1993. “European labor in transition: Sweden and Germany compared”, in World Politics, Vol. 46, No. 1, pp. 23-49.
— (1999). “Historical institutionalism in comparative politics”, in Annual Review of Political Science, Vol. 2, pp. 369-404.
Vivarelli, M. 2004. “Globalization, skills and within-country income inequality in developing countries”, in Lee and Vivarelli, pp. 211-243.
Wade, R. H. 2004. “Is globalization reducing poverty and inequality?” in World Development, Vol. 32, No. 4, pp. 567-589.
Wallerstein, M. 1999. “Wage-setting institutions and pay inequality in advanced industrial societies”, in American Journal of Political Science, Vol. 43, No. 3, pp. 649-680.
Zapata, F. 1998. “Trade unions and the corporatist system in Mexico”, in P. Oxhorn and G. Ducatenzeiler (eds.) What kind of democracy? What kind of market? Latin America in the age of neoliberalism (University Park, PA, Penn State Press), pp. 151-68.


115
Main findings
● No clear link emerges between overall changes in employment and inequality. Some countries have created many jobs and at the same time income inequality increased signifi cantly. Other good employment performers saw stable or even declining income inequality. Th e chapter shows that, to some extent, this refl ects the diverse nature of the jobs created.
● Over the past 15 years or so, the incidence of non-standard employment has tended to increase in the majority of countries for which information could be collected. In Advanced Economies, part-time and temporary employment are generally on the rise, although the patterns diff er signifi cantly from country to country. In Central and Eastern European countries, however, the trend is for a decline in the incidence of part-time and self-employment and only a marginal increase in temporary employ-ment. Th e incidence of informal employment in the few African, Asian and Latin American countries for which data exist remains signifi cant and is on the rise. Th is includes populous, high-growth countries like Brazil, China and India, where informal employment, already common, is becoming even more widespread.
● Non-standard jobs are generally less well remunerated than standard jobs. In Euro-pean countries, temporary jobs pay, on average, 20 per cent less than permanent jobs. In Latin America, workers with informal jobs earn, on average, 43 per cent less than workers with formal jobs, while in India, casual workers (who form the bulk of informal employment) earn 45 per cent less than regular employees. Th ese fi ndings rest on a small set of countries and do not cover all forms of non-standard employ-ment, so further analysis is needed in this area. If confi rmed, however, the existence of a wage gap between non-standard and standard employment, combined with the rising incidence of non-standard employment, would be a factor to take into account when analysing the income inequalities described in Chapter 1.
● Th e income eff ects of rising non-standard employment depend crucially on the extent to which low-income households increase their work eff ort in order to compen-sate for the low earnings obtained from employment. In most countries, increased
4. Changing employment patterns
Changingemployment patterns
116
World of Work Report 2008: Income Inequalities in the Age of Financial Globalization
work eff ort has probably been insuffi cient to off set the income eff ect of rising non-standard employment. Th ere are exceptions, however. For instance, in Brazil, despite increasing wage diff erentials between formal and informal workers and an increase in the incidence of informal employment, income inequality has declined over the past two decades. Th is could be due to additional work eff ort among low-income households, but could also refl ect state support in the form of social programmes (see Chapter 5).
● For policy-makers, it is crucial to avoid too great a gap between standard and non-standard employment. In this respect, reforms in some Latin American countries aimed at making the formal sector more attractive to employers are an interesting recent example of what can be done.
Introduction
Globalization holds out the promise of enhanced economic growth and employment crea-tion. Th e latter, in particular, with the improvement in living standards that it brings, is the primary means through which individuals may share the benefi ts of economic growth. As Chapter 1 shows, the recent period of economic expansion has been accompanied by fairly substantial employment growth in most regions of the world. However, the type of employment being created has given rise to some concern.
Changes in employment patterns may refl ect the fact that the world of work is char-acterized by intense competition and constant change, in which both employers and employees face increasing risk and uncertainty. In order to retain markets, producers have to be more responsive to consumer demand through constant innovation and attractive prices. Th is process may also involve sharing economic risks between fi rms and workers through subcontracting and other arrangements (Reich 2001). Non-standard forms of employment – temporary, part-time or informal employment 1 – have thus become more common.
With that in mind, the purpose of this chapter is to assess the extent to which changes in employment patterns are associated with rising income inequality. It was not possible to integrate this question into the analysis carried out in Chapter 3, owing to lack of infor-mation on countries’ policies on non-standard employment. More specifi cally, this chapter examines the potential linkages between trends in income inequality and total employ-ment growth (Section A); and presents the trends in non-standard employment, looks at the extent to which non-standard jobs pay less than standard ones and considers the impli-cations in terms of income inequality (Section B). Th e fi nal section (Section C) examines a number of policy considerations to address any linkages between patterns of employment and income inequality.
1. Th is includes both the informal sector and informal employment in the formal sector.

117
4. Changing employment patterns
A. No clear link between income inequalityand employment growth
Over the past two decades, the world of work has been characterized by relatively robust employment growth in most regions. At the same time, however, as Chapter 1 shows, income inequality, as measured using the Gini index, has also risen in the majority of countries where data are available. Of course, as this report and others studies demon-strate, the linkages among globalization, economic growth, employment and income ine-quality are diffi cult to disentangle. Policy makers may be concerned that, by limiting income inequality, employment performance may worsen. But if employment growth is plotted against changes in income inequality since the early 1990s, there is no apparent relationship between the two (fi g. 4.1). In other words, it is not the case that more (or less) employment growth is necessarily associated with more (or less) income inequality.
Perhaps more importantly, though, this simple correlation shows that few countries managed to experience both an improvement in labour market performance, as measured by employment growth, and a reduction in income inequality. In fact, for the period 1990-2000, this occurred in only 24 of 85 countries, and the fi gure was 20 of 44 countries for the most recent period, 2000-2005.
Th e complex relationship between employment gains and income inequality may refl ect the increasingly diverse nature of the jobs which are created – an issue addressed in the next section.
Figure 4.1 Average annual changes in income inequality and employment
-5 -3 -1 1 3 5 7 -5 -3Employment growthEmployment growth
Employment growth and reduced inequality
Employment growth and reduced inequality
Changes in Gini index (%)Changes in Gini index (%)
-10 0 1 3 5 7
-6
-4
-2
0
2
4
6
8
-6
-4
-2
0
2
4
6
8
1990-2000 2000-2005
Note: The Figure shows how income inequality (proxied by the Gini index) and employment grew in the countries for which data are available for the relevant periods.
Source: IILS estimates.

118
World of Work Report 2008: Income Inequalities in the Age of Financial Globalization
B. Rising non-standard employment as a factor of income inequality
The incidence of non-standard employment has increased in many countries, especially among women
“Non-standard” employment refers to employment other than permanent salaried employ-ment and comprises part-time or temporary work and self-employment. Temporary work comprises employment on fi xed-term contracts, agency work and seasonal work. Th is sec-tion looks at trends in such forms of employment, particularly part-time and temporary work in Advanced Economies and informal employment in developing countries.2 It makes no value judgements as to whether such work is precarious or not, whether it is socially harmful or, whether on the contrary it is a useful stepping-stone to the labour market. Th ese are matters that lie beyond the scope of this report. Instead, the aim is to examine whether the incidence of these forms of employment has increased, as is oft en argued. Later sections will look at the implications of observed trends as they aff ect income ine-quality, which is the theme of the report.
In Advanced Economies, standard employment – full-time, permanent work arrange-ments – has long been regarded as the norm and the framework within which labour law, collective bargaining and social security systems developed. Th e past two decades, how-ever, have witnessed a rise in non-standard work arrangements.
● Th e incidence of part-time employment has increased signifi cantly since the early 1990s in most Advanced Economies, especially among women (fi g. 4.2, panel A). Th is trend could refl ect demand-side developments, such as the need for greater fl exibility in the workforce; but supply-side factors, such as the desire to strike a better balance between work and family life or study, have also been infl uential (Fagan and Ward, 2003). Part-time employment is oft en voluntary.
● Th e incidence of temporary employment has also tended to increase over the past two decades (fi g. 4.2, panel B), particularly among women, largely because fi rms needed to be able to respond to rapid changes in supply and demand conditions in the face of stiff er product-market competition (Kalleberg, 2000; Dorantes, 2005). In addi-tion, new technology has made it possible to fragment the production process and outsource certain tasks, a trend that has been associated with less stable employment. Some authors also argue that badly designed employment regulations make employers reluctant to recruit under permanent contracts (Atkinson, Morris and Williams, 1999; Davis-Blake and Uzzi 1993).
● By contrast, the share of self-employment in total employment declined in most of the advanced economies, especially among female workers. Th is trend largely refl ects the declining incidence of employment in the agricultural sector, where self-employment is typically dominant.
In transition economies by contrast, non-standard employment has not shown a clear trend over the past few years.3 First, the share of part-time employment in total employ-ment has tended to decline, especially among men (fi g 4.3, Panel A).4 Th e majority of part-time jobs in transition economies are voluntary, as in advanced economies, the only exceptions being Bulgaria, Lithuania and Romania, where they are mainly involuntary.
2. See Chapter 1, Appendix A for a list of country groupings.3. Th e data for the transition economies are available on a continuous basis only from 1998, so the analysis is restricted to the short period 1998-2006.4. Th e country diff erences in the incidence of part-time employment may be due to the various degrees of underemployment in each country (Cazes and Nesporova, 2004).

119
4. Changing employment patterns
Second, the share of temporary employment in total employment has increased only mar-ginally (fi g. 4.3, Panel B). Th ird, there has been a decline in the share of self-employment in total employment among both male and female workers. According to a recent study (Cazes and Nesporova 2004), this trend refl ects persistent administrative and other bar-riers to small business development.
In emerging economies and developing countries, non-standard work mainly takes the form of informal employment, that is, workers in very small fi rms (fewer than fi ve
0 105 15 20 25 30 35 40 45 50
2006
1991
0 5 10 15 20 25 30
Greece
Ireland
Cyprus
Korea
Malta
Portugal
Spain
United States
Finland
Luxembourg
France
Canada
Iceland
Austria
New Zealand
Belgium
Denmark
Germany
Sweden
Japan
United Kingdom
Australia
Norway
Switzerland
Netherlands
Ireland
Malta
Australia
United States
Luxembourg
United Kingdom
Iceland
Greece
Belgium
Austria
Japan
Denmark
Italy
Italy
Norway
Cyprus
Switzerland
Germany
France
Canada
Netherlands
Finland
Sweden
Portugal
Spain
2006
1991
Panel A. Incidence of part-time employment, 1991 and 2006
Panel B. Incidence of temporary employment, 1991 and 2006
0 2 4 6 8 10 0 2 4 6 8 1012 14 16 18 12 14 16 18 20
Bulgaria
Slovakia
Hungary
Czech Republic
Estonia
Latvia
Lithuania
Slovenia
Croatia
Romania
Poland
Romania
Estonia
Slovakia
Lithuania
Bulgaria
Hungary
Latvia
Czech Republic
Croatia
Slovenia
Poland
2006
1998
2006
1998
Panel A. Incidence of part-time employment, 1998 and 2006
Panel B. Incidence of temporary employment, 1998 and 2006
Figure 4.2 Part-time and temporary work are on the rise in advanced countries
Source: IILS estimates based on Eurostat Labour Force Survey and OECD.
Source: IILS estimates based on Eurostat Labour Force Survey and OECD.
Figure 4.3 Trends in non-standard employment in Central and Eastern European countries are mixed

120
World of Work Report 2008: Income Inequalities in the Age of Financial Globalization
Note: Informal employment in the formal sector includes those workers who do not have a proper contract. Informal-sector employment includes workers in small firms (less than five workers), self-employed (other than administrative, professional and technical workers), unpaid family workers and domestic workers.
Source: IILS estimates based on data processed by the ILO’s Information System and Labour Analysis in Panama.
1995 2005 1995 2005 1995 2005 1995 2005 1995 2005 1995 2005 1995 2005 1995 2005 1995 2005 1995 2005 1995 2005
Paraguay Honduras Brazil Ecuador Mexico Panama Venezuela Argentina Costa Rica Uruguay Chile
0
10
20
30
40
50
60
70
80
90
Employment in informal sector
Informal employment in formal sector
Figure 4.4. Informal employment in Latin American countries
workers), self-employment, unpaid family work and salaried employment without a proper work contract in the formal sector. Unfortunately, data on informal employment are scarce and diffi cult to compare across countries. Such data that exist, covering a relatively long time span, are shown in fi gures 4.5 to 4.7. In the majority of the countries in question, the incidence of informal employment has increased.
● In most of the Latin American countries shown in figure 4.4, informal employ-ment represented over half of total employment in 2006. Th e incidence of informal employment has risen over the past decade or so. Th is trend has been recorded even in the countries that experienced high economic and employment growth, which sug-gests that employment informality is a structural phenomenon. Interestingly, higher employment informality in Latin America refl ects two opposing trends. On the one hand, there is less employment in the informal sector 5, owing to a decline in the number of very small fi rms as a result of pension and labour legislation reform, which has both increased the advantages for fi rms gaining formal status and raised the pen-alties of staying informal (Saavedra and Chong, 1999) 6. On the other hand, the extent of informal employment in the formal sector has grown: a growing proportion of the new jobs in the formal sector are of a casual nature and come without a work con-tract. According to some studies, this trend refl ects various reforms that have facili-tated the use of temporary contracts and subcontracting arrangements (Pianto and Pianto, 2002).
● In all the Asian countries for which data could be gathered (China, India, Myanmar, Sri Lanka and Th ailand), the incidence of informal employment has increased, or at least, remained high (fi g. 4.5). Only in Th ailand did it decline somewhat, and that from high levels.
5. “Informal sector” means employment in small fi rms (with fewer than fi ve workers), self-employed (other than administrative, professional and technical workers), unpaid family workers and domestic workers.6. “Th e policies that aff ected the relative costs and benefi ts of entering or staying in the informal sector took many forms, such as: binding minimum wage regulations, specifi c mandated benefi ts, forced savings schemes, extremely high hiring costs, job stability rules, and an array of other required administrative procedures and tax rules and regulations” (Saavedra and Chong, 1999: 97).

121
4. Changing employment patterns
● A large proportion of the workforce in Africa7 is also engaged in informal work. And the trend is towards further informality (fig. 4.6). Most jobs are characterized by greater insecurity, low remuneration and lack of social security (Devey, Skinner and Valodia, 2003; ILO, 2002; Van der Hoeven, 2000). Th e only notable exception to the trend is South Africa.
Non-standard jobs tend to pay less than standard jobs
Th e rise in non-standard employment observed in the majority of the countries for which data could be collected has been a source of earnings inequality, in that non-standard jobs pay less than standard ones.
In European countries, fixed-term employment pays much less than permanent employment (fi g. 4.7) the only exception being Ireland, where the two are remunerated equally. Such comparisons should be treated with caution: fi xed-term jobs may diff er from permanent jobs in terms of the sectoral location of the job, the seniority of the wage earner or skill intensity and such diff erences may explain the wage gap up to a point. Even con-trolling for these factors, however studies have found that fi xed-term jobs pay less than permanent ones (Gash and McGinnity, 2005)
Th ere is also evidence from Latin America that informal jobs pay signifi cantly less than formal ones (fi g. 4.8) not only in the informal sector but also within the formal sector, where workers who have informal arrangements are paid less than their permanent counterparts. Th e wage gap between the two is found to be statistically signifi cant, even aft er controlling for a number of personal and household characteristics (Gindling (1991) for Costa Rica; Funkhouser (1996) for the fi ve Spanish-speaking Central American repub-lics; Marcouiller, Ruiz de Castilla and Woodruff (1997) for Mexico, El Salvador and Peru; Saavedra and Chong (1999) for Peru; and Pianto and Pianto (2002) for Brazil).
Interestingly, over the past decade, the wage gap between informal and formal sector employment has widened in all the countries shown in fi gure 4.8 except Chile, Mexico and Venezuela. Th e hourly wage diff erential between workers who have an informal arrange-
7. Data on informal employment in African countries are very scarce. Th e only source the household labour force surveys, where they exist at all are carried out at irregular intervals.
1990 2004 1990 2003 1990 2003 1994 2001 1990 1998 1990 2002 1990 1996 1994 2001 2001 2007
India Sri Lanka China Thailand Egypt Zimbabwe Swaziland Botswana South Africa
0
10
20
30
40
50
60
70
80
90
100
0
10
20
30
40
50
60
70
80
90
100
Figure 4.5. Informal employment in selected Asian countries
Source: IILS estimates based on Ghose, Majid and Ernst, 2008, Appendix Table A4.1.
Figure 4.6. Informal employment in selected African countries
Source: IILS estimates based on Ghose, Majid and Ernst, 2008, Appendix Table A4.1 and data compiled by Jacque Charmes from household survey data sets.

122
World of Work Report 2008: Income Inequalities in the Age of Financial Globalization
ment in the formal sector and their permanent counterparts has also widened over the same period.8
Outside Latin America, it has not been possible to gather comparable data on wages by employment status. However, some information exists. For instance, in India, the wages of casual workers who make up a substantial share of the large informal sector in that country constituted about 44 per cent of the wages of a regular salaried worker in 2004-2005 as against 62 per cent in 1983, which shows that wage diff erentials between informal and formal employment have grown much wider.
Changes in employment patterns have had an impact on income inequality
As suggested by evidence from earlier studies the rise in non-standard employment, with the concomitant increase in wage gaps has been a factor behind the growing income inequalities described in Chapter 1. For instance, Gregg and Wadsworth (1996) found increased income inequality in Britain among households with multiple earners and households with single or multiple adults with no work. Th ey also found that part-time employment as the prime income source had risen over the period. Th is explained around one quarter of the relative deterioration in the position of workless families. Tachibanaki and Yagi (1992) showed that the degree of income inequality in Japan was closely related to whether there were working wives or double earners within a household. Leibbrandt
8. Th e data are not shown in fi gure 4.8 but are available upon request.
Romania
Spain
Greece
Slovenia
Bulgaria
Germany
Netherlands
Lithuania
Hungary
Czech Republic
United Kingdom
Estonia
Italy
Norway
Portugal
Finland
Austria
Belgium
Denmark
Slovakia
Latvia
Ireland
Panama
Honduras
Paraguay
Brazil
Mexico
Costa Rica
Argentina
Ecuador
Venezuela
Uruguay
Chile
0.0 0.1 0.2 0.3 0.4 0.5 0.6 0.7 0.8 0.9 1.0 0.0 0.1 0.2 0.3 0.4 0.5 0.6 0.7 0.8 0.9 1.0
2006
1991
Hourly wages of fixed-term employment as a ratio of hourly wages of permanent employment, 2002
Hourly wages of informal sector employment as a ratioof hourly wages of formal sector employment
Figure 4.7 Fixed-term contracts pay less than permanent contracts
Source: IILS estimates based on Structure of Earnings Survey, 2002.
Figure 4.8. Informal sector jobs pay less than formal sector jobs
Source: IILS estimates based on data processed by the ILO’s Information System and Labour Analysis in Panama.

123
4. Changing employment patterns
and Woolard (2001), in their study on South Africa, demonstrated that wage income was the primary cause of income inequality and that at least half of this wage inequality was attributable to households with no labour income at all. A detailed decomposition of the factors of income inequality in China and India has been carried out for the pur-poses of this report.9 As can be seen from fi gure 4.9, the main fi nding is that, on average,
9. For a detailed analysis, see the background paper to this chapter (Rani, 2008).
Figure 4.9 Decomposition of income inequality by household characteristics, urban China and India
Figure 4.10 Income gap between formal sector and informal sector households in Latin America
Source: IILS estimates based on computations prepared by Du Yang, Institute of Population and Labour Economics, Chinese Academy of Social Sciences, Beijing and data obtained from National Sample Survey Organization, Ministry of Statistics, Government of India.
Source: IILS estimates based on data processed by the ILO’s Information System and Labour Analysis in Panama.
Urban China Urban India
2001 20050
10
20
30
40
50
60
70
80
90
100
2000 20050
10
20
30
40
50
60
70
80
90
100
Othercharacteristics
Region
Education
Industry
Employmentstatus
0.0 0.1 0.2 0.3 0.4 0.5 0.6 0.7 0.8 0.9
Panama
Brazil
Honduras
Paraguay
Argentina
Mexico
Costa Rica
Ecuador
Venezuela
Uruguay
Chile
2006
1996

124
World of Work Report 2008: Income Inequalities in the Age of Financial Globalization
a household’s income depends mainly on the level of education of its members, the sector in which they are employed and other household characteristics, such as the age and sex of household members, and, in China, the regional location. Th e employment status of household members is a far less important factor although its role has recently increased in signifi cance in both China and India.
However, such labour market trends are not automatically translated into greater income inequality. Much depends on whether low-wage households increase their work eff ort in order to compensate for their low earnings.
Th is may be illustrated by looking at the total income of the average household where the main earner works in the informal sector. “Total income” means not only the wages of the main earner but also earnings by other household members, social benefi ts – less any taxes paid by the household – and other sources of income. For instance, in Latin America, the total income of a household where the main earner has a job in the informal sector is lower than one where the job is in the formal sector. However, this income gap is smaller than the wage gap between informal-sector employment and formal-sector employment (fi g. 4.10), the reason being that households with low earnings probably have more mem-bers in the labour market or engaged in multiple jobs to increase their incomes. In other words, low informal sector wages encourage a higher additional work eff ort in order to improve income levels and thus compensate for the low wages paid in the informal sector. Th is strategy helps such households increase their incomes, and at the same time reduces income inequality across households. A case in point is Brazil, where, despite increasing wage diff erentials between formal and informal workers and an increase in the incidence of informal employment, income inequality has declined by 2.3 per cent over the past two decades. Th is could be due to the additional work eff ort among low-income households. Th e narrowing of the income gap (as opposed to the wage gap) may also be due to support from the state in the form of social programmes like cash transfers, public works and wage subsidies, which have been implemented in several Latin American countries.
C. Policy considerations
Against the backdrop of relatively strong employment growth in most regions and coun-tries, this chapter has shown that in the majority of countries with available data, there has been a shift – in some cases structural – towards non-standard forms of employment. Th is has meant more part-time and temporary employment in Advanced Economies and more informal employment in developing countries. Putting aside normative statements regarding the issue of non-standard employment, the evidence presented here suggests that the increased trend towards these forms of employment has contributed to rising income inequality. This is due, in part, to lower levels of remuneration among non-standard workers when compared to regular employees. In many cases, this holds, even aft er the eff ect of increased work eff ort associated with lower wages is taken into consideration.
Th e challenge for policy makers is therefore to arrest the increase in labour market duality, while maintaining labour market dynamism. This means that consideration should be given to both the quantity and quality of jobs when formulating reforms of employment regulations, wage formation systems and social protection. Th ere are exam-ples of how this can be achieved in Advanced Economies (OECD, 2006). Th e experience of conditional cash transfers in some Latin American countries, where employment infor-mality and income inequality declined in a context of rapid job creation, off ers a basis from which to consider a number of policy options.

125
4. Changing employment patterns
ReferencesAtkinson, J.J.; Rick, S.; Morris; Williams, M. 1996. Temporary work and the labour market,
Institute for Employment Studies Report 311 (Poole, BEBC Distribution).Cazes, S.; Nesporova, A. 2004. Labour markets in transition: Balancing fl exibility and security in
Central and Eastern Europe (Geneva, ILO).Carré, F. 2003. “Nonstandard work arrangements in France and the United States: Institutional
contexts, labor market conditions, and patterns of use”, in Houseman, S.N.; Machiko, O. (eds.): Nonstandard work in developed economies: causes and consequences (W.E. Upjohn Institute).
Davis-Blake, A.; Uzzi, B. 1993. “Determinants of employment externalization: A study of temporary workers and independent contractors”, in Administrative Science Quarterly, Vol. 38. pp. 195-223.
Devey, R.; Skinner, C.; Valodia, I. 2003. Informal economy employment data in South Afr ica: A critical analysis, paper presented at the Trade and Industrial Policy Strategies (TIPS) and Development Policy Research Unit (DPRU): TIPS/DPRU Forum 2003, Johannesburg, Sep.
Dorantes, C.A. 2005. “Work contracts and earnings inequality: Th e case of Chile”, in Journal of Development Studies, Vol. 41, No. 4, pp. 589-616.
Statistical Offi ce of the European Communities. 2002. Structure of Earnings Survey, Eurostat.Fagan, C.; Ward, K. 2003. “Regulatory convergence? Nonstandard work in the United
Kingdom and Netherlands”, in Houseman, S.N.; Machiko, O. (eds.): Nonstandard work in developed economies: causes and consequences (W.E. Upjohn Institute).
Funkhouser, E. 1996. “Th e urban informal sector in central America: Household survey evidence”, in World Development, Vol.24, No. 11, pp. 1737-1751.
Gash, V.; McGinnity, F. 2005. Temporary contracts – the new European inequality? Comparing men and women in West Germany and France, paper submitted to the 2005 EPUNet Conference, Colchester, United Kingdom, June.
Ghose, A.; Majid, N.; Ernst, C. 2008. Th e Global Employment Challenge (Geneva, ILO). Gindling, T.H. 1991. “Labor market segmentation and the determination of wages in the public,
private formal and informal sectors in San Jose, Costa Rica”, in Economic Development and Cultural Change, Vol. 39, No.3, pp. 585-606.
Gregg, P.; Wadsworth, J. 1996. “More work in fewer households”, in J. Hills (ed): New inequalities: Th e changing distribution of income and wealth in the United Kingdom (Cambridge University Press).
International Labour Offi ce (ILO). 2002. Men and women in the informal economy: A statistical picture (Geneva).
Kalleberg, A.L. 2000. “Non standard employment relations: Part-time, temporary and contract Work”, in Annual Review of Sociology, Vol. 26, pp. 341-365.
Leibbrandt, M.; Woolard, I. 2001. “Th e labour market and household income inequality in South Africa: Existing evidence and new panel data”, in Journal of International Development, Vol. 13, pp. 671-89.
Marcouiller, D.; Ruiz de Castilla, V.; Woodruff , C. 1997. “Formal measures of the informal-sector wage gap in Mexico, El Salvador and Peru”, in Economic Development and Cultural Change, Vol. 45, No. 2, pp. 367-392.
Organisation for Economic Co-operation and Development (OECD). 2006. Employment Outlook (Paris).
Pianto, M.T.; Pianto, D.M. 2002. Informal employment in Brazil – A choice at the top and segmentation at the bottom: A quantile regression approach, Working Paper No. 236, Department of Economics, University of Brasilia.
Rani, U. 2008. “Impact of Changing Work Patterns on Income Inequality”, Discussion Paper No. 193 (International Institute for Labour Studies, Geneva).
Reich, R. 2001. Th e future of success: Work and life in the new economy (London, Heinemann). Saavedra, J.; Chong, A. 1999. “Structural reform, institutions and earnings: Evidence from the
formal and informal sectors in urban Peru”, in Journal of Development Studies, Vol. 35, No. 4, pp. 95-116.
Tachibanaki, T.; Yagi, T. 1992. Welfare improvements caused by changes in income distribution, needs and labour supply: A theoretical and empirical investigation, Mimeographed (Kyoto, Kyoto Institute of Economic Research).
van der Hoeven R. 2000. Labour markets and income inequality: what are the new insights aft er the Washington consensus? United Nations University/WIDER Working Paper No. 209, (Helsinki: UNU/WIDER).


127
Main findings
● Th is chapter examines the extent to which taxes and social transfers have managed to redistribute the gains and losses from economic growth over the past 15 years or so. As shown in Chapter 3, the tax/transfer system can be a powerful redistribution mech-anism and this is confi rmed by more detailed analysis set out in this chapter. A key fi nding is that, despite increasing income inequality, the redistributive impact of taxes and social transfers has generally not been able to reverse this raising trend.
● One reason for this is that taxation has become less progressive and therefore less likely to address the growing income inequality found in the majority of ILO member states (see Chapter 1). Generally speaking, indirect taxes – which are typically regres-sive – have become a more important source of government revenue. By contrast, tax rates both on corporate income and on top personal incomes have, on average, declined over the past 15 years or so. Between 1993 and 2007, the average corporate tax rate (for all countries for which data exist) was cut from 37.5 per cent to 27.1 per cent. In the case of top personal income taxes, the average rate was cut from 37 per cent to 34 per cent over the same period.
● Another factor is that the weaker progressivity of tax systems has in general not been off set by increased recourse to social transfers for redistribution. Over the past 15 years, social transfers as a percentage of GDP have declined in developed countries and in Africa and slightly increased in the rest of the developing world. Although targeted social assistance is much more progressive than other social transfers, especially in developing countries, the budget allocated to assistance is too small to make any sig-nifi cant diff erence to inequality. On the other hand, spending on social insurance pro-grammes has grown relatively quickly in many developing countries, but oft en with little eff ect on reducing income inequality. Indeed, such programmes tend to be only slightly progressive (as is the case in many developed countries and those countries with universal non-contributory social protection) or actually regressive, as in many devel-oping countries they exclude workers from the informal sector.
5. Redistribution through taxes and social transfers
Redistribution through taxesand social transfers*
* Excellent research assistance was provided by Megan Gerecke, including data gathering and editorial suggestions.

128
World of Work Report 2008: Income Inequalities in the Age of Financial Globalization
● Any policy using taxes and benefi ts as instruments to address income inequality needs to ensure that it is eff ective. Taxes and benefi ts, if badly designed, can aff ect growth and job prospects, and in some cases even increase inequality. Th e analysis in this chapter shows, however, that it is possible both to meet growth and employment objectives and reduce inequality. Brazil, Mauritius and Malaysia are interesting cases in point.
Introduction
Th e widening income inequalities seen around the world have triggered a debate over the extent to which taxes and/or social transfers should be used more actively for redis-tribution. Income redistribution can be justifi ed not only on ethical, but also on eco-nomic or political grounds. For instance, by reinforcing perceptions that economic growth is advantageous for all groups, redistribution policies may enhance political support for pro-growth policies (Boadway and Keen 2000; Commission on Growth and Development 2008). Chapter 3 of this report showed that the welfare state, in its broadest sense, is a powerful mechanism for redistribution. Th is chapter focuses on the issue in further detail.
Government-led redistribution uses three principal mechanisms: progressive taxa-tion; social transfers that favour the poor; and public provision of social services, such as education and health care. While all three will be considered, this chapter will focus most closely on taxation and social transfers.
Progressive taxation, by defi nition, contributes to income redistribution, as wealthier individuals pay proportionately more taxes than those on lower incomes. Personal income taxes and property taxes are generally believed to be progressive, whereas corporate taxes tend to be “U-shaped”, being regressive at low levels of corporate income and progressive beyond a certain threshold. Indirect taxes such as consumption taxes are generally regres-sive and tend to fall disproportionately on people with low incomes.1
However, great care needs to be taken in using the tax instrument for redistribution purposes. It is crucial that taxes should not distort incentives to work, invest and create wealth. Any recourse to tax reform to reduce income inequalities should therefore take into account the possible impact on economic growth and employment.
Redistribution can also take place through social transfers, including social assist-ance benefi ts and social insurance programmes. Th e former typically target the needy and can therefore be expected to have a strong redistributive eff ect. In developing countries, however, social insurance programmes (such as pensions and unemployment insurance) may be regressive rather than progressive; and this tendency is exacerbated by the fact that such programmes tend to exclude workers in the informal economy, who dispropor-tionately comprise the poor.
Lastly, investment in education, health and other social services can also exert a redistributive eff ect (box 5.1). While taxes and social transfers have an immediate eff ect on income distribution, public provision of social services tends to have a more long-term impact. Government programmes in primary education or health care and infrastructure investment in areas such as water and sanitation may help alleviate the deep-rooted aspects of inequality by creating opportunities (or what Amartya Sen calls capabilities).
Inequality can thus be addressed through a combination of social service provision, social transfers and taxation; and ideally, the redistributive eff ects of taxes and social
1. In developing countries, as will be seen below, the tax system as a whole is generally regressive (Gemmell and Morrissey 2005).

129
5. Redistribution through taxes and social transfers
expenditure should be analysed in tandem (Burgess and Stern 1993).2 Such an analysis should take into account the eff ects of redistribution policies on economic incentives. As emphasized by the Commission on Growth and Development (2008), excessive or badly designed redistribution eff orts will damage growth prospects and hinder development.
Th e aim of this chapter is to examine how far recent changes in national tax systems and government expenditure on social transfers have aff ected inequality over the past few years. First, the chapter discusses trends in the composition and levels of social transfers and taxes and explores how these trends relate to income inequality. Second, it addresses in detail the extent to which taxes and social transfers are eff ective in redistributing income. Th is is done by comparing income inequality before and aft er the payment of taxes and benefi ts.3 In the fi nal section, country examples will be presented to show how diff erent government policy frameworks have made it possible to maintain income inequality at reasonable limits, while at the same time supporting economic growth and job creation.
A. Social transfers, taxation and income inequality:what are the trends?
In the following section, simple associations between various redistribution instruments and income inequality are presented. Obviously, these associations do not necessarily imply causality and the next section will examine in greater depth the causal links at work.
Social transfers and inequality
Th ere is a relatively strong negative association between spending on social transfers and inequality (fi g. 5.1).4 Th e correlation between social benefi t spending by central govern-ment and income inequality is -0.75 for the 64 countries for which data are available. In other words, countries that spend more on social transfers tend to have lower income ine-quality. For example, among developed countries, income inequality is relatively high in the United States, where spending on social transfers is limited. By contrast, the countries that spend the most on social transfers (mostly European countries, such as Austria, Bel-gium, Denmark5, France, Germany and Sweden) have relatively low income inequality.
Th e negative relationship between income inequality and social transfers can be inter-preted as evidence that high-inequality countries lack the economic or political means to
2. Historically, there were only two kinds of redistributive tax-based social spending: poor relief and public schools (Lindert 2004). Lindert argues that social transfer increased in all developed countries in the twentieth century and that by the 1980s most of them devoted 10 per cent of their revenue to social transfers. In other words, “the history of taxing and transferring is not just a miscellany of separate and unique national histories, but a common pattern” (p. 11).3. Pre-tax income is usually defi ned as all sources of “market income” or “private sector income”, including wages and salaries (before social security contributions), bonuses and exercised stock-options, employer and private pensions, self-employment income, business income, dividends, interest, rents and realized capital gains. Disposable income is calculated as pre-tax income + social benefi ts – taxes. 4. Social benefi t spending (consolidated central government) is defi ned by the IMF’s Government Finan-cial Statistics Manual (2001) as transfers to protect the entire population against certain social risks such as medical services, unemployment compensation, social security pensions, and social assistance benefi ts. Social security benefi ts include sickness and invalidity benefi ts, maternity allowances, children’s or family allow-ances, unemployment benefi ts, retirement and survivors’ pensions, and death benefi ts. Subsidies, grants and other social benefi ts include all unrequited, non-repayable transfers on current account to private and public enterprises; grants to foreign governments, international organizations and other government units; and social security, social assistance benefi ts and employer social benefi ts in cash and in kind.5. General government spending on social transfers.

130
World of Work Report 2008: Income Inequalities in the Age of Financial Globalization
fund social programmes. Some authors have referred to the so-called “Robin Hood par-adox”, whereby redistribution is least when it is most needed (Lindert 2004). In fact, how-ever, the reverse causality may be true: the low spending on social transfers in a high-income country like the United States may help explain its above-average income inequality.
Spending on social transfers has tended to decline as a percentage of GDP, except in Latin America and some Asian and Middle Eastern countries
Th ere are wide regional variations in social transfer spending (fi g. 5.2). OECD high-income countries spend the most, on average, though their spending decreased slightly over the period 1990-2004, from 13.5 per cent to 12.7 per cent of GDP. Spending on social trans-fers was also relatively high in the former communist countries, at around 9 per cent of GDP, although there, too, there was a marked decline in spending over the period 1990-2004. Among the developing countries, spending on social transfers is highest in Latin America, where it increased over the period 1990-2004 from 3.6 per cent to 4.2 per cent. Latin America is closely followed by the Middle East and North Africa. Developing coun-tries in Asia and sub-Saharan Africa spend the least, at around 1 per cent of GDP, although within the sub-Saharan Africa region, two countries defy the regional trend: Mauritius and Seychelles. Mauritius devoted 3.6 per cent of its GDP to social transfers in 1990-94 and 5.2 per cent in 2000-04, while in Seychelles the fi gure stayed stable at around 7.55 per cent. If we exclude these two small island countries, however, the average for sub-Saharan Africa is reduced to 0.83 per cent of GDP for the fi rst period and 0.73 per cent for the second.
Note: OECD countries are shown in color.
Source: IILS estimates; social transfer spending from International Monetary Fund 2007.
Figure 5.1. Social transfers and income inequality
Spending on social transfers (% GDP)
Gini (%)
1050 15 20 25
Albania
Argentina
Armenia
Australia
Austria
Belgium
Bulgaria
Belarus
Bolivia
Canada
Switzerland
Chile
Côte d’Ivoire
Colombia
Costa Rica
Cyprus
Czech Republic
Germany
Denmark
DominicanRepublic
Spain
Estonia
Finland
France
United Kingdom
Georgia
GreeceCroatia
Hungary
Ireland
Iran, Islamic Republic of
Israel Italy
Jamaica
Kazakhstan
Lithuania
Luxembourg
Latvia
Moldova
Madagascar
Mongolia
Mauritius
Nicaragua
Netherlands
Norway
Panama
PolandPortugal
Paraguay
Romania
Russian Federation
El Salvador
Slovakia
Slovenia
Sweden
Swaziland
Thailand
Tajikistan
Tunisia
Ukraine
UruguayUnited States
Venezuela, Bolivarian Rep. of
South Africa
15
25
35
45
55
65

131
5. Redistribution through taxes and social transfers
Th ese data show that social transfers as a percentage of GDP declined in developed countries but increased in most developing countries over the 15-year period, with the exception of Africa, where average spending on social transfers slightly decreased.
The role of taxes
Taxes are generally used to raise revenues for government, provide incentives for certain activities and correct market failures. Of particular relevance to this report is their role in redistributing income for the benefi t of people on low incomes.6
Th e approach to taxation has changed over time. During the 1950s and 1960s, the distributive and developmental role of taxes was widely acknowledged. From the 1970s on, however, there has been growing attention to the perverse eff ects of excessively high taxes on economic activity and incomes. In addition, the international dimension of taxes has become increasingly visible. In particular, taxes may aff ect the location decisions of fi rms and high-income groups. As a result, it is argued that there may be a risk of tax competi-tion among countries that try to attract foreign capital and wealthy individuals.
The tax system relies increasingly on indirect taxes and less on income taxes
Th e data reveal that the contribution of the various taxes to total government revenue has changed since the early 1990s.
First, the revenue contribution of taxes on goods and services – including value added tax (VAT) – has increased in a majority of countries, whatever their level of economic development. In high-income countries, the share of taxes on goods and services in total government revenues grew by 8.5 percentage points between the periods 1990-94 and 2000-04. In middle-income and low-income countries, the increase was 11.5 percentage points and 4 percentage points, respectively.
6. Musgrave (1959) described taxation as playing various roles: stabilization, allocation and distribution. Stabilization refers to counter-cyclic roles that governments engage in to smooth economic activity and consumption. Allocation refers to the provision of public goods and distribution refers to transferring income from the rich to the poor for a more equitable society.
Source: IILS estimates based on International Monetary Fund 2007 and Global Development Network Growth Database (http://www.nyu.edu/fas/institute/dri/global%20development%20network%20growth%20database.htm [18 July 2008]). GDP from World Bank, World Development Indicators 2008.
Figure 5.2. Trends in spending on social transfers (% GDP)
0
2
4
6
8
10
12
14
Former communist
OECD high-income
Middle East Africa Latin America Asia
Transfers 2000-2004
Transfers 1990-1994

132
World of Work Report 2008: Income Inequalities in the Age of Financial Globalization
Second, the share of taxes on income, profi ts and capital gains in total government revenues has decreased in all the country groups. For high-income countries, this fi gure decreased by 1 percentage point between the periods 1990-94 and 2000-04. In middle-income and low-income countries, the decrease was 3.5 percentage points and 1.7 per-centage points, respectively.
Th ird, the contribution of taxes from international trade also decreased considerably in all the groups. It used to be an important source of revenue for most of the developing countries, but, as a result of trade liberalization, revenues from trade taxes as a percentage of total government revenues fell by 6.5 percentage points between the periods 1990-94 and 2000-04, and by as much as 8.5 points in developed countries and 10.7 points in middle-income countries.
Th e above trends seem to refl ect deliberate policy choices. For example, the average corporate tax rate for the world as a whole decreased from 38 per cent in 1993 to less than
Box 5.1. The role of education and health in reducing inequalityAlthough this chapter is primarily concerned with social transfers, other government pro-grammes may also have a significant effect on income inequality. This is particularly the case with education and health programmes, which directly support low-income groups, since they tend to benefit all individuals more or less equally and replace private spending on health care and schooling. In addition, education and health programmes may help redistributive opportunities over the long run, enhancing human capital in all groups and thus changing income capabilities. Moreover, spending on education and health is unlikely to create significant economic distortions: on the contrary, it is likely to be associated with higher economic potential, while also addressing existing inequalities. The fact is that coun-tries that spent more on education in the early 1990s tend to have lower income inequality in the 2000s (see fig. 5.3).
Figure 5.3. Education spending and inequality
Education spending 1990-1994 (% GDP)
Gini (%) 2000-2004
25
35
45
55
1 2 3 5 74 6
Argentina
Australia
Austria
Belgium
Burkina Faso
Bulgaria
Bahamas
Belarus
Bolivia
Canada
Switzerland
Chile
China
Cameroon
Colombia
Cape VerdeCostaRica
Denmark
Egypt
Spain
Finland
France
United Kingdom
Gambia
Guatemala
Honduras
Croatia
Haiti
HungaryIreland
Iran, Islamic Rep. of
IsraelLithuaniaLatvia
Moldova
Madagascar
Mexico
Mauritania
Mauritius
Malawi
Nicaragua
Netherlands
Norway
Nepal
PolandPortugal
Paraguay
Romania
Russian Federation
Senegal
El Salvador
Slovakia Sweden
Thailand
Tunisia
Tanzania,United Rep. of
Uganda
Ukraine
Uruguay United States
Venezuela,BolivarianRep. of
Source: IILS estimates; education spending from World Bank 2008
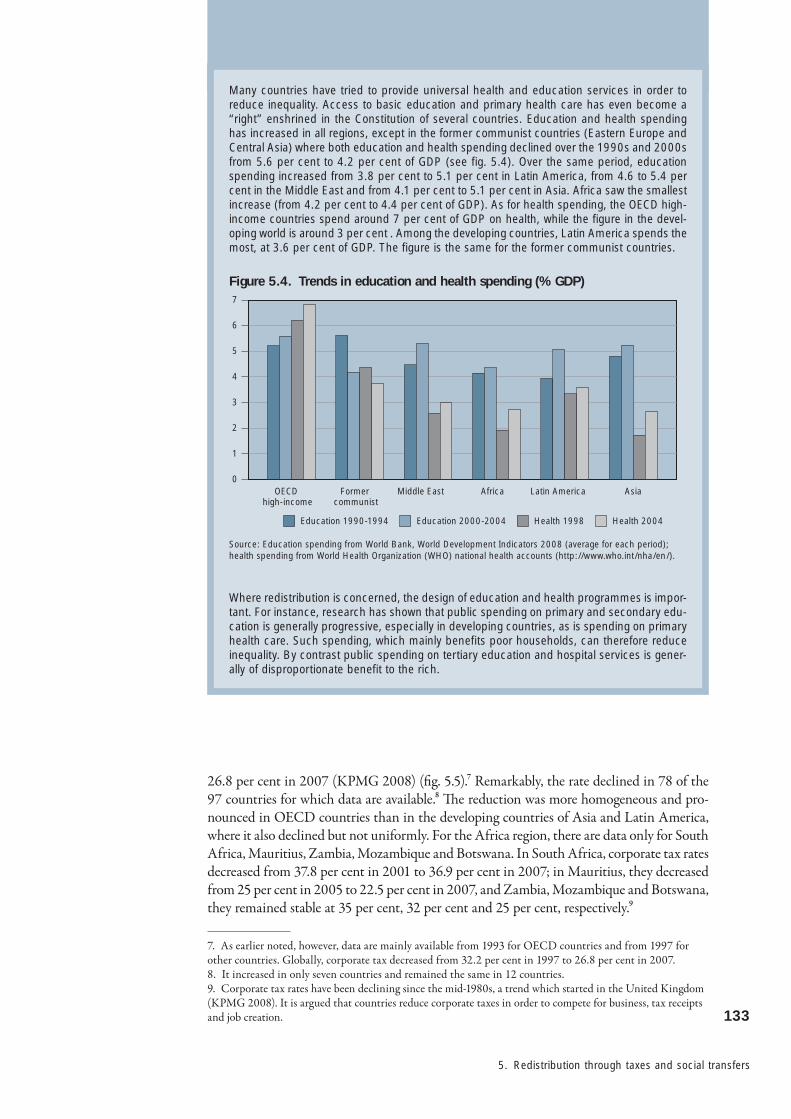
133
5. Redistribution through taxes and social transfers
26.8 per cent in 2007 (KPMG 2008) (fi g. 5.5).7 Remarkably, the rate declined in 78 of the 97 countries for which data are available.8 Th e reduction was more homogeneous and pro-nounced in OECD countries than in the developing countries of Asia and Latin America, where it also declined but not uniformly. For the Africa region, there are data only for South Africa, Mauritius, Zambia, Mozambique and Botswana. In South Africa, corporate tax rates decreased from 37.8 per cent in 2001 to 36.9 per cent in 2007; in Mauritius, they decreased from 25 per cent in 2005 to 22.5 per cent in 2007, and Zambia, Mozambique and Botswana, they remained stable at 35 per cent, 32 per cent and 25 per cent, respectively.9
7. As earlier noted, however, data are mainly available from 1993 for OECD countries and from 1997 for other countries. Globally, corporate tax decreased from 32.2 per cent in 1997 to 26.8 per cent in 2007.8. It increased in only seven countries and remained the same in 12 countries.9. Corporate tax rates have been declining since the mid-1980s, a trend which started in the United Kingdom (KPMG 2008). It is argued that countries reduce corporate taxes in order to compete for business, tax receipts and job creation.
Many countries have tried to provide universal health and education services in order to reduce inequality. Access to basic education and primary health care has even become a “right” enshrined in the Constitution of several countries. Education and health spending has increased in all regions, except in the former communist countries (Eastern Europe and Central Asia) where both education and health spending declined over the 1990s and 2000s from 5.6 per cent to 4.2 per cent of GDP (see fig. 5.4). Over the same period, education spending increased from 3.8 per cent to 5.1 per cent in Latin America, from 4.6 to 5.4 per cent in the Middle East and from 4.1 per cent to 5.1 per cent in Asia. Africa saw the smallest increase (from 4.2 per cent to 4.4 per cent of GDP). As for health spending, the OECD high-income countries spend around 7 per cent of GDP on health, while the figure in the devel-oping world is around 3 per cent . Among the developing countries, Latin America spends the most, at 3.6 per cent of GDP. The figure is the same for the former communist countries.
Figure 5.4. Trends in education and health spending (% GDP)
Former communist
OECD high-income
Middle East Africa Latin America Asia0
1
2
3
4
5
6
7
Health 2004Health 1998Education 2000-2004Education 1990-1994
Source: Education spending from World Bank, World Development Indicators 2008 (average for each period); health spending from World Health Organization (WHO) national health accounts (http://www.who.int/nha/en/).
Where redistribution is concerned, the design of education and health programmes is impor-tant. For instance, research has shown that public spending on primary and secondary edu-cation is generally progressive, especially in developing countries, as is spending on primary health care. Such spending, which mainly benefits poor households, can therefore reduce inequality. By contrast public spending on tertiary education and hospital services is gener-ally of disproportionate benefit to the rich.

134
World of Work Report 2008: Income Inequalities in the Age of Financial Globalization
Source: KPMG 20081997 1998 1999 2000 2001 2002 2003 2004 2005 2006 2007
24
26
28
30
32
34
Former communist
OECD high-income
Middle East Africa Latin America Asia
2000s
1990s
0
10
20
30
40
50
0 5 10 15 20 25 30
2007
1990s
Sweden
Norway
Denmark
Iceland
Finland
Portugal
Ireland
Belgium
Italy
Austria
France
Netherlands
Greece
Germany
United Kingdom
Spain
Luxembourg
New Zealand
Korea, Rep.
Australia
Switzerland
Canada
Japan
Source: World Bank, World Development Indicators 2008 (average for each period).
Figure 5.6. Top marginal individual income taxes, worldwide (%)
Source: KPMG 2008 and OECD database(http://www.oecd.org/dataoecd/12/13/34674429.xls)
Figure 5.5. Global corporate tax rates, 1997-2007 (%)
Figure 5.7. VAT Trends in OECD countries, 1990-2007 (%)

135
5. Redistribution through taxes and social transfers
Th e lowest corporate tax rates in 2007 were found in Cyprus, Bulgaria and Paraguay at 10 per cent followed by Ireland at 12.5 per cent. Th e highest rates – 55 per cent – are found in the oil-producing countries, Kuwait and United Arab Emirates, followed by the OECD countries Japan (41 per cent), USA (40 per cent) and Germany (38 per cent). Th e high-spending welfare states (Denmark, Finland, Norway and Sweden) have taxes at around 28 per cent. Th is confi rms Lindert’s (2004) argument, that welfare states generally have a more pro-growth tax system and business-friendly environment than low-spending countries like the United States and Japan. Corporate tax rates are generally higher in low-income than in high-income countries. In the seven low-income countries for which data are available,10 corporate tax rates have remained stable at about 33 per cent since 1997. No country has increased corporate tax rates since 2000, although some OECD coun-tries did so slightly in the mid-1990s (these being Australia, Canada, Finland, France, Greece, Italy and Luxembourg). Only seven countries have increased their corporate tax rate since 1997: Argentina, Brazil, Chile, Dominican Republic, Hong Kong, China Paki-stan, and Papua New Guinea. Th e general decline in corporate taxes worldwide is based on the assumption that higher corporate taxes discourage private sector investment and are therefore harmful for economic growth (Johansson et al. 2008).
Taxes on the highest personal incomes have also decreased (see fi g. 5.6). Since the early 1990s, they have fallen by 3 percentage points, on average. Decreases have been recorded in 66 of the 110 countries for which data are available. Th ere were slight increases in 28 coun-tries and rates were stable in the remaining 16. Th e former communist countries tend to have the lowest top individual taxes, followed by Latin America and Asia, while the OECD high-income countries and the Middle Eastern countries have the highest rates, averaging over 40 per cent.
Cuts in corporate tax and top personal income tax have been accompanied by increased indirect taxation, in particular by higher VAT rates.
In 2007, the global average VAT rate was 17 per cent. Th e European countries have the highest rates, at around 20 per cent, followed by the OECD countries at 18 per cent (see fi g. 5.7). Th e average rate is 11 per cent in the Asia and Pacifi c region and 14 per cent in Latin America. Among individual countries, Denmark, Norway and Sweden have the highest rate, at 25 per cent, followed by Iceland at 24.5 per cent, Uruguay at 23 per cent, Finland, Croatia and Poland at 22 per cent, and Argentina, Belgium and Portugal at 21 per cent. Th e lowest rates – 5 per cent – are found in Japan, Canada, Panama and Taiwan (China). Some countries, including the United States, still do not have VAT.
VAT rates generally increased in the 1990s, except in Ireland, but stabilized in the 2000s. In Germany, it has increased continually, rising from 13 per cent in 1980 to 19 per cent in 2007; the same is true in Norway, where it increased from 20 per cent to 25 per cent. In the Latin American region, the rate rose steadily, from 10 per cent in 1980 to 15 per cent in 2007. In other developing countries, it stayed stable over the period 1990-2007.
In many countries, social spending is funded not only through taxation, but also through social contributions, including social security contributions by employees, employers and self-employed individuals. Th is is signifi cant, in that social contributions are regressive in some countries and thus tax low-paid employment disproportionately. Looking at the trend since the 1990s, we fi nd that social contributions as a percentage of revenue have increased from an average of 18 per cent to 20 per cent in 2004. Th e pro-portion is much higher in developed countries, rising from 25 per cent in the 1990s to over 27 per cent in 2004. In the developing countries, it increased from 13 per cent to 16 per cent.
10. Th ese are Bangladesh, India, Mozambique, Pakistan, Papua New Guinea, Viet Nam and Zambia.

136
World of Work Report 2008: Income Inequalities in the Age of Financial Globalization
B. To what extent do taxes and social transfers shape income distribution?
Th e previous section presented general trends in social transfers and taxes, and their rela-tionship with income inequality. Th is section examines in detail the extent to which social transfers and taxes shape income distribution in diff erent regions and countries. It focuses on countries for which data exist on individuals’ market income (that is, income before taxes and social transfers) and fi nal income (income aft er taxes and social transfers).
Redistribution in developed countries
The extent of fiscal redistribution has remained broadly constant
Taken as a whole, taxes and social transfers have failed to stop the trend of rising market income inequality in developed countries. Data for 14 developed countries based on the Luxembourg Income Study (LIS) show that, since the 1980s, the Gini coeffi cient on fi nal income has risen almost as much as that on market income.11
Except in Switzerland where it remained stable, income inequality before tax increased in the countries surveyed between the early 1980s and late 1990s. Th e average Gini coeffi -cient before tax for all 14 countries rose from 0.41 in the 1980s to 0.45 in the late 1990s, increasing by 3.4 per cent points (see fi g. 5.8).
Inequality in terms of disposable income also increased for most of the countries (except for Denmark, the Netherlands and Switzerland, where it decreased, and France where it remained stable). Th e Gini index for disposable income inequality averaged 0.26 in the 1980s and increased by 0.9 percentage points to reach 0.28 in the late 1990s.
As a result, the extent of fiscal redistribution also increased, on average, only slightly over the same period from 0.15 to 0.17 (increasing by 2.5 percentage points 12 and actually decreased in two countries, Sweden and the Netherlands, where both private income inequality and disposable income inequality have decreased. Th ese two countries, together with Belgium, Denmark and Finland, redistribute the most, com-pared to the OECD average. Meanwhile, the lowest level of distribution takes place in Australia, Canada, Switzerland and the United States. Th e slight average increase in fi scal redistribution has not generally kept pace with the rapidly increasing levels of ine-quality. In other words and to be precise, the private income Gini increased by 3.4 per cent, while redistribution only increased by 2.5 per cent, resulting in a net increase of inequality by 0.9 percentage points.
Th ese fi ndings on redistribution are supported by the literature, such as Estes (2004), which identifi ed the Nordic countries (Denmark, Finland, Norway and Sweden) as “social leaders” within the developed countries, and Esping-Andersen (1990), which posited three models of the welfare state: the socio-democrats (the Nordic countries and the Nether-lands), the liberal (Australia, Canada, Japan, Switzerland and the United States) and the
11. LIS is an impressive and very valuable data set on fi scal redistribution (see Mahler and Jesuit 2006). Th e data set, which contains 68 data points for 14 OECD countries, covering the period from the late 1970s to 2004, includes: a measure of fi scal redistribution (pre-tax minus aft er-tax Gini index); the share of redistribution explained by progressive taxation; the share of redistribution explained by social transfers (disaggregated by pensions, unemployment and other benefi ts); a measure of the overall size of social transfers (average transfers / pre-tax household income); a measure of how well social transfers are targeted towards low-income groups (Kakwani’s “index of concentration”); and the extent to which taxes and social transfers reduce poverty. Th ere are, however, some shortcomings in the data set. For example, it includes only direct taxes (income taxes and payroll taxes). Indirect taxes, such as VAT, which are likely to be more regressive, are omitted.12. Fiscal redistribution is represented by the diff erence between the Gini index for fi nal income and the Gini index for market income.

137
5. Redistribution through taxes and social transfers
conservative (Austria, Belgium, France, Germany and Italy). Esping-Andersen’s work is one of the most important and most frequently cited contributions to recent debates on social policy and welfare. Other researchers using the LIS data set drew similar conclu-sions (Kenworthy and Pontusson 2005; Pontusson 2005; Mahler and Jesuit 2006).
Th e fact that the Nordic countries perform well on redistribution conforms with their reputation as generous welfare states (Esping-Andersen 1990; Kangas and Palme 2005). France too, as the literature shows, stands out as a generous welfare state in terms of its net public social spending, at 30 per cent of GDP (OECD 2006, p. 79).
Social transfers, not taxes, are the main source of redistribution
According to a study (Mahler and Jesuit 2006), social transfers generally have a greater impact on redistribution than taxes. On average, transfers contribute to 75 per cent of fi scal distribution in OECD countries, compared to only 25 per cent for taxes (see fi g. 5.9). Moreover, the share of fi scal distribution through taxes decreased from 27 per cent in 1980s to 24 per cent in the late 1990s, while the contribution of transfers increased in the same proportion.
Low-inequality countries (the Nordic countries, Germany, Belgium and the Nether-lands) rely heavily on social transfers as a redistribution device. By contrast, countries with higher inequality (Australia, Canada and the United States) rely more heavily on taxes.
Th e strong redistributive eff ects of social transfers can also be illustrated by consid-ering the links between transfers and poverty (see fi g. 5.10). Countries that have higher levels of poverty –individuals with lower disposable income – tend to redistribute less. For example, the United States, which has the highest level of poverty in the developed world redistributes the least, while Denmark, Finland and Sweden, which have low levels of pov-erty, redistribute the most.13
13. See Prasad (2008) for more details.
A definition of private sector income is given in footnote 3. Disposable income means private income plus social transfers (retirement benefits, child and family allowances, unemployment compensation, sickness, maternity, disability, accident or other social insurance and benefits in cash or in kind), once direct taxes – income taxes and mandatory social insur-ance contributions – have been deducted. Fiscal distribution is the differ-ence between the Gini coefficient in private and in disposable income.
Source: Mahler and Jesuit 2006
Source: Mahler and Jesuit 2006
Redistribution
Disposable
Private
Average 1980s Average 1990s Average 1980s Average 1990s0
0.1
0.2
0.3
0.4
0.5
Taxes
Transfers
0
20
40
60
80
100
Figure 5.8 Inequality and redistribution inOECD countries, 1980s and 1990s
Figure 5.9. Share of taxes and transfers inredistribution in OECD countries (%)

138
World of Work Report 2008: Income Inequalities in the Age of Financial Globalization
Poverty (per capita disposable income)
Redistribution (absolute) (%)
Australia
Belgium
CanadaSwitzerland
Germany
Denmark
Finland
France
United Kingdom
Ireland
Netherlands
Norway
Sweden
United States
0.10
0.15
0.20
0.25
0 5 10 15 20
Source: Mahler and Jesuit 2006 on the basis of LIS for latest years.
Figure 5.10. Redistribution and poverty in OECD countries
Source: Mahler and Jesuit 2006
Figure 5.11. Sectoral contribution to reduced income inequality, latest available data in OECD countriesPrivate income inequality reduction
Pensions
Unemployment
Other
0
0.04
0.08
0.12
0.16
0.20
France Belgium Germany Switzer-land
Finland Sweden Denmark Norway Nether-lands
UnitedKingdom
Canada UnitedStates
Australia Ireland
CIS EU-10 and SEE CIS EU-10 and SEE CIS EU-10 and SEE
1990-1994 1995-1999 2000-2004
-15
-10
-5
0
5
10
-2.5
-2.0
-1.5
-1.0
-0.5
0
0.5
1.0
0
10
20
30
40
50
60Average Annual GDP Change Average Annual EPR Change
Average Change in Gini comparedto pretransition levels (1989)
Source: IILS estimates 2008; growth from World Bank, World Development Indicators 2008.
Figure 5.12. Change in inequality, EPR and growth in countries with economies in transition, 1990-2004 (%)

139
5. Redistribution through taxes and social transfers
Pensions have a strong redistributive effect in developed countries
More than half the redistributive impact of social transfers comes from pension benefi ts (and as much as 80 per cent or more in Switzerland and 70 per cent in Germany) (see fi g. 5.11). As for unemployment transfers, their contribution to redistribution is around 7 per cent. Other benefi ts such as social assistance and sickness benefi ts are responsible for around a third of redistribution.
Redistribution in countries with economies in transition
In countries with economies in transition, inequality has typically increased since the 1990s (though Slovenia is a notable exception to this trend). In Central and Eastern Europe, ine-quality has grown at a gradual and steady rate on average, whereas in the Commonwealth of Independent States (CIS) inequality initially increased sharply, peaked in the late 1990s and, since this time, stabilized or even moderately declined (see fi g. 5.12).
Aft er the initial economic crisis brought on by transition, many Central and Eastern European states were able to stimulate growth and some, employment; despite these suc-cesses, slow or non-existent employment growth and high unemployment continue to be problems in the region. By contrast, while the CIS economies were harder hit by transi-tion, since the late 1990s they have been able to increase growth and create employment.
Th e factors that contributed to increased income inequality are beyond the scope of this chapter, which primarily focuses on redistributive policies. Diff erent regions chose diff erent paths with social protection spending. Th e EU-accession countries and South Eastern Europe (SEE) focused on social security and approached social assistance as a residual benefi t for those not covered by the broadly-based pensions, unemployment and child allowance benefi ts. Countries like Poland and Hungary retained their safety nets in an attempt to make the economic reforms more palatable. Th eir broad coverage has meant that the programs have strong political support, but lack funds.14 Middle-income CIS countries have also retained social insurance schemes, in addition to a wide range of subsidies for various goods and an array of benefi ts targeted at particular groups, like war veterans. By contrast, low-income CIS countries faced drastic reductions in government revenue and, thus, had to reduce their safety nets and focus spending more intensely on targeted social assistance.
Utilizing a variety of diff erent inequality indicators, Giammetteo (2006) fi nds that social transfers and taxes reduced income inequality in Poland, Hungary, and to a lesser extent Russia (see table 5.1). Similar results have been found for other central European countries (Cerami 2003).
Table 5.1 Inequality and redistribution in countries with economies in transition
Poland Russia Hungary
1992 1995 1999 1992 1995 2000 1991 1994 1999
Market income Gini 0.341 0.391 0.372 0.418 0.499 0.493 0.386 0.422 0.478
Disposal income Gini 0.27 0.301 0.284 0.393 0.445 0.435 0.28 0.32 0.291
Source: Giammatteo 2006
14. Indeed, most countries in this region had to reform their social insurance schemes in the late 1990s to address fi scal constraints.

140
World of Work Report 2008: Income Inequalities in the Age of Financial Globalization
In most former communist countries, pensions dominate public transfer spending. For example, in 2005 they made up 70% of social protection spending in the EU-8 coun-tries and 50% in the poorest CIS countries (World Bank 2005). While pensions are gener-ally not distributed equally, their distribution is more equitable than market incomes, thus they help reduce inequity (Mitra and Yemtsov 2006). Family and child assistance benefi ts tend to be progressive in the region, especially in CIS countries (Fox 2003).15 Generous pre-transition expenditure on health and education and other services left a legacy of high human development.
Limited evidence suggests that post-transition tax reforms have been in the favour of more equality (Mitra and Yemtsov 2006). Looking at Poland, Hungary and Russia, Giammetteo (2006) fi nds that direct taxes reduce income inequality, though their impact is less than that of transfers (see table 5.1). In Central Asia and Russia, economic transi-tion brought an implosion of tax revenues, with a shrinking tax base and poor tax collec-tion.16 In response, many countries reduced social spending and some reformed their tax system. For instance, in Russia in 2000, a fl at income tax of 13% was introduced, along with higher fl at taxes for corporations. Th e implications of such reforms for income ine-quality have not been thoroughly explored.
New challenges lie ahead for the transition economies. Unemployment must be addressed across the region. With the energy sector boom in Russia and Central Asia, regional inequality has increased, with some provinces benefi ting from the new wealth disproportionately.17 On a more positive note, there appears to be a way forward for the region: tellingly in these countries, increased employment has typically coincided with increased equality (World Bank 2005), suggesting the answer may be found in a more holistic approach – one that uses economic and social policy together to pursue growth and equity.
Redistribution in developing countries
In the developing countries, not only is the tax base narrow, but the bulk of employ-ment is in the informal sector, while social transfers are very limited (except in Latin America, where social transfers are higher than in other developing countries). Th e redis-tributive role of tax in developing countries is negligible, because tax revenue is dominated by indirect taxes (such as consumption taxes), which are regressive. While social trans-fers have the potential of reducing inequality, progressive programmes (such as universal pension schemes, social assistance) are underfunded and regressive transfer schemes are dominant.
Th ere is no data set comparable to LIS for developing countries and very few studies have been conducted to analyse welfare regimes and social policy.18 Th e combined results of a number of diff erent studies will therefore be used to show the impact of taxation and social transfers on inequality.
15. However their small size in the EU-accession countries limits their impact.16. Some exceptions to this trend exist in the CIS countries. For instance, Belarus has been able to maintain its level of tax revenue (Gerry and Mickiewicz 2008).17. Notably, in many CIS countries, low labour mobility may not be able to counteract such regional inequity.18. Exceptions include Gough and Wood (2004), Haggard and Kaufman (2008) and United Nations Research Institute for Social Development (UNRISD) research on “Social policy in development contexts” which produced several regional and thematic books including one for Africa, one for Latin America and one for East Asia.

141
5. Redistribution through taxes and social transfers
Latin America
Latin America is one of the most unequal regions of the world in terms of income, access to assets, social services and even political participation. Th ere are extensive social insur-ance programmes with wide employment protection and public provision of education and health care, but minimal social assistance programmes (Barrientos 2004). As pointed out in the fi rst section, Latin America’s social transfers are higher than other developing countries. Looking through a historical lens, Lindert (2004) showed that Latin America was indeed unusual in the developing world: it “spen[t] more on social transfers than did the Europeans before 1930, when their income levels and age distributions were compa-rable” (p. 219). Latin American tax systems are “slightly progressive at best”, but, within the region, some systems are regressive overall, if indirect taxes are included (Lindert, Skoufi as and Shapiro 2006).
What is the impact of social transfers on income inequality in Latin America? Goni et al. (2008) address this question and fi nd that in six countries (Argentina, Brazil, Chile, Colombia, Mexico and Peru) the impact is minimal, reducing the Gini coeffi -cient by around 1.4 points, on average (see fi g. 5.13). (Th is stands in stark contrast to the average 12-point reduction in the Gini coeffi cient in OECD countries resulting from public transfers as shown above.) Colombia is the most successful of the six coun-tries in this regard, having managed to reduce its inequality by 3.4 points by virtue of such public transfers as cash transfers, pensions, unemployment insurance and social assistance. Brazil is next, with a Gini reduction of 1.9 points (see box 5.2), and then comes Chile with 1.5 points, closely followed by Argentina. In Peru, inequality actually increased by 0.2 points aft er social transfers.
Redistribution through direct taxes has even less of an impact on inequality, with an average 0.6 per cent decline in the Gini coeffi cient for the six countries (see fi g. 5.13). Th e highest amount of redistribution through taxes takes place in Colombia, followed by Mexico, Peru, Argentina and Chile. As in most countries, income taxes in the six coun-tries are progressive but their contribution to government revenue is smaller than that of indirect taxes.
Redistribution through the fi scal system is also hampered by the eff ect of indirect taxes and the tax burden on the poor. For example, if indirect taxes such as VAT, excise tax, and import tariff s are included in the analysis, income inequality increased in all the countries, by 0.5 points on average by around 1.4 points in Peru, 0.5 in Brazil, 0.8 in Chile and 0.7 in Colombia.
Looking at individual cases, we see that the tax system slightly increased income ine-quality in Chile, where the Gini coeffi cient increased from 0.488 in 1993 to 0.496 in 1996 (Engel, Galetovic and Raddatz 1999). One reason for this is the eff ect of indirect taxes such as VAT, excise tax and import tariff s. Th e poorest devote around 11 per cent of their income to VAT, the rich only 6 per cent. It should be noted, however, that, as stated ear-lier, indirect taxes in some developed countries like the United Kingdom are even more regressive, increasing inequality by around 4 per cent. If direct and indirect taxes are taken together for the Latin American countries, the post-tax eff ect on inequality becomes neu-tral, on average. Only Mexico, Argentina and Colombia have a tax system that is progres-sive overall and slightly reduces inequality, with a reduction of the Gini coeffi cient of less than 1 point (Goni et al. 2008).
Th e tax burden on the poor also reduces the impact of redistribution. For example, Goni and his co-authors (ibid.) fi nd that the bottom quintiles have a comparatively higher tax burden than the top quintiles. In Argentina, the bottom quintile devotes over 20 per cent of its household revenue to taxes (income, VAT and others), compared to 19 per cent for the top quintile. In other countries a similar trend is observed: in Chile, the poor pay 15 per cent and the rich 12 per cent, while in Peru the poor pay over 20 per cent, the rich pay 13 per cent and the middle-income groups pay around 8 per cent. Colombia and

142
World of Work Report 2008: Income Inequalities in the Age of Financial Globalization
Mexico have a more or less equal tax burden (13 per cent for both rich and poor, while the middle-income groups pay around 8 per cent.)
Th us, if taxes (both direct and indirect) and public transfers are taken into account, we fi nd that overall redistribution in Latin America is minimal. On average, the six Latin American countries considered are able to reduce income inequality through taxes and transfers by only 1.4 point (see fi g. 5.13) as against to around 16 points in OECD coun-tries (if only public transfers and direct taxes are included). Th e reduction in inequality ranges from over 4 per cent in Colombia to 2 per cent in Argentina and 1.5 per cent in Mexico, and even less in Brazil and Chile. In Peru, inequality actually increases by 0.8 per cent aft er taxes and public transfers are taken into account.
Which kind of social transfers?The data reveal that public social protection transfers mostly benefit richer people (Lindert, Skoufi as and Shapiro 2006; United Nations 2006). In Latin America, most of the poor are in informal sector employment and not included in any social protec-tion scheme. For example, in eight Latin American countries 19, only 10 per cent of social protection transfers go to the poorest quintile, compared to 43 per cent that go to the richest (see fi g. 5.14). Social insurance is even more regressive, as the poorest quintile receives only 2 per cent of transfers, whereas the richest receives 58 per cent. Th is is not unexpected, since it is formal sector workers who contribute to social security, through social insurance programmes. Th ere is no universal pension coverage system in the devel-oping countries of Latin America, although in Brazil there are attempts to incorporate poor households into the pension system (see box 5.2) (Uruguay and Bolivia have near-universal pension systems).
Th is does not mean that all social transfers are regressive. Social assistance spending is progressive and pensions may be provided for low-income households, as in Brazil. About 26 per cent of social assistance transfers go to the lowest quintiles. However, of the 7.3 per cent of GDP that is spent on social transfers programmes in the countries under consid-eration, 6.3 per cent goes to social insurance (pensions and unemployment insurance)
19. Argentina, Brazil, Chile, Colombia, Dominican Republic, Guyana, Mexico and Peru.
-0.020
-0.015
-0.010
-0.005
0
0.005
0.010
Impact
Transfers Direct tax Indirecttax
Total redistribution
Social protection
Social insurance(net benefits)
Socialassistance
0
10
20
30
40
50
60
Richest
Poorest
Source: Goni et al. 2008
Figure 5.13. Redistributive impact (average) of transfers and taxes on inequality in six Latin American countries
Source: Lindert, Skoufias and Shapiro 2006
Figure 5.14. Absolute incidence of social security provision in eight countries in Latin America (%)

143
5. Redistribution through taxes and social transfers
and only 1 per cent to social assistance programmes (Goni et al. 2008). Such a low level of public spending suggests that the impact on inequality and poverty is minimal.
Conditional cash transfers to poor families have been regarded as an eff ective means of reducing poverty in Latin America. Th ese programmes started in Mexico and Brazil in the mid-1990s, focusing on school attendance and health care. Similar initiatives were adopted subsequently in other countries in the region – in Argentina, Chile, Colombia, Dominican Republic, Ecuador, Honduras, and Jamaica – and other parts of the world, such as Bangladesh, Burkina Faso, Cambodia, Ethiopia, Lesotho, Pakistan and Turkey. Conditional cash transfers are very progressive, in that about 75 per cent of the spending goes to the two bottom quintiles (ibid.).
Asia and the Pacific
Income inequality is relatively high in the Asia and Pacifi c region. Th ere are some coun-tries which have managed to reduce inequality through economic growth and employment generation: this is the East Asian productivist model, where social policy is an instru-ment for economic growth and nation building, social security is largely provided by the extended family network (Gough 2004; Lindert 2004) and social spending is relatively low, compared with other developing countries (see box 5.3 on Malaysia.) Th e South Asia region, on the other hand, represents a diff erent redistributive model, based on “informal security”, where reliance on networks, linkages, informal rules and personal favours is widespread (Gough and Wood 2004). Th is model is also characterized by a highly organ-ized community-based welfare system and involvement of development organizations in the provision of welfare, together with high levels of remittance fl ows.
According an Asian Development Bank report (Baulch et al 2008), only 17 per cent of social protection expenditure in the Asia and Pacifi c region goes on social assistance programmes (ibid.).20 Fiji has the highest proportion, at around 49 per cent, whereas
20. Th e Asian Development Bank (ADB) recently ventured into creating a social protection index for 31 countries from the Asia and Pacifi c region. Th e ADB defi nes social protection as “the set of policies designed to reduce poverty and vulnerability by promoting effi cient labour markets, diminishing people’s exposure to risks, and enhancing their capacity to protect themselves against hazards and the interruptions/loss of income” (Ortiz 2001). Consequently, it used data from fi ve broad areas: labour market policies and programmes, social insurance, social assistance, micro- or area-based schemes, and child protection. In its fi nal calculation, the ADB used the following indicators to construct the social protection index:
Source: Baulch et al. 2008
Figure 5.15. Social protection expenditure, by category, in Asia and the Pacific (%)
0
10
20
30
40
50
60
70
Pacific
East Asia
All Asia
South Asia
Central Asia
Labour marketprogrammes
Socialinsurance
Socialassistance
Microcreditfinance
Childprotection

144
World of Work Report 2008: Income Inequalities in the Age of Financial Globalization
Bhutan has no social expenditure budget. Although, overall, 55 per cent of social expendi-ture goes on social insurance programmes – generally pension schemes in many countries make up the bulk of their social expenditure. In Malaysia, for example, pensions accounts for 90 per cent of total social protection expenditure (see box 5.3) and in many other coun-tries over 70 per cent. Labour market and child protection are allocated roughly 7 per cent of the social protection budget and microcredit fi nancing on average 13 per cent. Only 35 per cent of the population as a whole is covered by any form of social protection; and as for the poor, the average for Asia and the Pacifi c is only 57 per cent, with individual shares ranging from 1 per cent in Papua New Guinea to 100 per cent in the Cook Islands, India, Japan and the Republic of Korea.
• Total expenditure on all social protection programmes ( percentage of GDP)• Benefi ciaries of social protection programmes targeted at key groups (unemployed, elderly, sick, poor/social
assistance, poor/micro-credit, disabled, children with special needs)• Number of social protection benefi ciaries who are poor• Average social protection expenditure for each poor individual.
Box 5.2. Brazil: Inequality, employment and growthBrazil has received praise for its economic and social development performance between 1990 and the 2000s. It managed to reduce income inequality by around 2 per cent, and at the same time increase employment by around 2 per cent per year and generate economic growth (see fig. 5.16). Its employment to population ratio has been constant at around 62 per cent. How has it managed to do this?
Figure 5.16. Brazil: Change in inequality, employment and growth, 1990-2006 (%)
1990s 2000s-3
-2
-1
0
1
2
3
4
Growth
Employment
Gini coefficient
Source: IILS estimates 2008; growth from World Bank 2008
Brazil has a relatively high level of social spending, at around 25 per cent of GDP (pensions alone account for 11 per cent). Social policy has been a key component of the developmental welfare system, which is organized under three pillars: universal provision of education and health; some social assistance for the poor; and contributory social security schemes and provision by the private sector (Draibe 2007). Health and education expenditure represents around 40 per cent of total public spending on social programmes, while social insurance programme expenditure represents around 50 per cent.
Social benefits largely take the form of contributory social insurances programmes, while social assistance programmes are very limited. It is estimated that pensions alone account for 85 per cent of total cash transfers to households, with other contributory benefits making

145
5. Redistribution through taxes and social transfers
Africa
Much of Africa’s welfare and redistributive system is classifi ed as a generalized “insecurity regime” based on families, clans and patrimonial relations, together with increased inter-vention by international organizations (Gough and Wood 2004).
As shown above, fi scal policy, including taxation and social transfers, is becoming more and more important in reducing poverty and inequality in many developing coun-tries, including those in Africa. However, data on redistribution in Africa is very diffi -cult to obtain. Th ere have been some studies done on social spending and taxation in a few selected countries, including South Africa and Cameroon. For example, taxation and social spending reduced Gini inequality by 10 points in the 1990s in South Africa (McGrath, Janisch and Horner 1997; Nattrass and Seekings 2001). In Cameroon, Tabi, Akwi and Anzah (2006) showed that income tax, indirect taxes (VAT, commodity-spe-cifi c excises and import duties) and other individual taxes (gasoline, petroleum products and excises) tend to be progressive. Mauritius is perhaps the only country in the Africa region which has suffi cient data and in which numerous studies have been done to under-stand the high level of economic growth and its impact on social welfare (see box 5.4).
up 11 per cent of the total and non-contributory benefits 4 per cent. Non-contributory ben-efits include the very well-targeted Bolsa Escola (school attendance benefit) for low-income families and old-age and disability benefits for low-income individuals.
Since pensions account for the bulk of transfers, it is worthwhile looking closer at the Bra-zilian pension system. The social security system was originally designed to cater for those in formal sector employment and so excluded informal sector workers. It has, however, been reformed to include low-income households. Around 64 per cent of employed workers are currently covered by social security (Ansiliero and Paiva 2008). There are two mandatory public pensions, one for private sector workers and the other for civil servants. The private sector pension covers both urban and rural workers. Unlike urban workers, rural workers are not required to contribute in order to be eligible, but only have to provide evidence of 15 years of rural activity (in a way, this becomes a type of social assistance, since it is basi-cally non-contributory). The rural workers have been gradually incorporated into the scheme since the 1970s. Their inclusion on a non-contributory basis is perhaps one of the most redistributive aspects of the scheme. The civil service pension is much more generous than the private sector one, providing around seven times the benefits, on average. Successive governments have tried to reform the system to make it universal.
What is the impact of social transfers and taxation on income inequality?
Private income accounts for 70 per cent to 80 per cent of a household’s disposable income, while the rest comes from social benefits (mainly pensions) (Soares et al. 2006). Pensions increase the revenue of those who earn less than the minimum wage by 5 per cent in 2004, as compared with 2.3 per cent in 1995. As most pensioners live in households with virtually no market income, pensions thus contribute to the reduction of inequality. Indeed, poverty levels are lower among the elderly than the national average.
Brazil has a complex tax system that hurts the poor the most. Although the income tax is progressive, indirect taxes (consumption taxes and VAT) neutralize this effect. For example, in 2004 households with an income of up to twice the national minimum monthly wage spent 46 per cent of their income on indirect taxes, compared with 16 per cent for those who earned more than 30 times the minimum wage (Zockun 2007). Moreover, this tax burden increased by 21 per cent for the poorest between 1996 and 2004.
The case of Brazil shows that universal non-contributory pension schemes are possible for developing countries (Willmore 2007; Arza 2008). It also shows that such schemes, and targeted social transfers generally, especially social assistance, can help reduce income inequality. The Brazilian case demonstrates that the current tax system is a poor redistribu-tive tool and therefore it needs to be reformed. More emphasis should however be placed on redistribution policies, such as social transfers, universal pension coverage and the pro-vision of social services.

146
World of Work Report 2008: Income Inequalities in the Age of Financial Globalization
Only two other countries in Africa have tried to set up a universal welfare system: Botswana and Namibia have both tried to implement a universal pension system.
By contrast with the developed countries, developing countries have never taken the taxation system seriously as an instrument for redistribution, regarding it merely as a way of raising revenue (Chu, Davoodi and Gupta 2000). Although income tax is generally progressive, the magnitude of indirect taxes reduces or neutralizes this pro-gressivity. Even if tax revenue increases, it is unlikely that governments will spend it on
Box 5.3. Malaysia: Inequality, employment and growthSince the mid-1970s, Malaysia has combined high economic growth and increased employ-ment with reduced inequality. Between 1990 and 2007, the Gini coefficient has fluctuated, but on average it has remained fairly stable, dropping only slightly (0.005) over this period. Economic growth in the 1990s averaged over 7 per cent and in the 2000s around 5 per cent (see fig. 5.17). Similarly, employment has grown around 3 per cent per year since 1990, while the employment to population ratio has increased steadily reaching 62 per cent in 2006. Despite Kuznets’ widely acknowledged theory that an increase in economic growth leads to increased income inequality, Malaysia has shown otherwise. How has it managed to achieve this?
Malaysia’s economic development policy and economic management has been described as unconventional and unorthodox. The state-led development plans and the New Economic Policy were meant to reduce poverty and serve as tools for nation-building or “restructuring society”. The government has been active in developing infrastructure and creating human capital through increased investment in education and health facilities, prerequisites for economic growth. In addition, it has given priority to the rural areas and traditionally disad-vantaged ethnicities through targeted programmes and a focus on the agricultural sector.
Economic growth and structural transformation are considered to be the main contributors to the reduction of poverty and inequality. The state-led shift to labour-intensive export-orientated industrialization has created new, well-paid employment, while high growth rates have reduced absolute poverty. Rural-urban remittances and migration, together with training and education initiatives, have helped ensure that the benefits of this growth are equitable.
Malaysia has given priority to the education and health sectors as a way of increasing human capital. This has led to impressive results in literacy rates and general health outcomes. Its expenditure on health and education accounts for around 10 per cent of GDP, compared to a mere 1 per cent for social protection and welfare (since 90 per cent of the social protec-tion budget is used for social insurance schemes). Within social protection, the compulsory saving schemes, especially the Employees Provident Fund, may also have contributed to the decrease in inequality.
Social security is generally taken care of by the family, and to some extent by the pri-vate sector. The high level of intra-family transfers, both across generations and between

147
5. Redistribution through taxes and social transfers
rural and urban areas, has been a key facilitator of Malaysia’s equitable growth. Extended nuclear families have acted as a means of social protection and have invested heavily in social services, with private spending making up roughly 40 per cent of health and educa-tion expenditure.
New challenges exist for equitable growth in Malaysia. Improvements in sexual equality – com-mendable though they are – and decreasing fertility may undermine the ability of families to continue providing social security. Intra-ethnic inequality is increasing, as is inter-regional inequality (Ragayah forthcoming). The labour-intensive industrialization of the past may be unsustainable, given Malaysia’s labour shortage; indeed, since 1990, Malaysia has begun to shift to capital- and technology-intensive industrialization, which may have an impact on equity and employment creation. Together these factors help explain the fluctuations seen in Malaysia’s Gini coefficient over the past two decades; they serve as a warning and demand continued policy innovation if equitable growth is to be sustained.
Figure 5.17. Malaysia: Change in inequality, employment and growth, 1990-2007 (%)
0
2
4
6
8
1990s 2000s
Growth
Employment
Gini coefficient-0.0004
Ginicoefficient-0.0003
Source: Gini coefficient and employment data from IILS estimates 2008; latest Gini data from Ragayah 2008; growth data from World Bank, World Development Indicators 2008.
reducing inequality or poverty, since the poor have little or no infl uence on any budget decisions. Nonetheless, it is important that governments have a judicious progressive expenditure policy, since social transfers, especially social assistance and universal pen-sion coverage, will help reduce inequality more than taxes will. Countries in the devel-oping world should thus give priority to a progressive expenditure policy in order to reduce inequality.

148
World of Work Report 2008: Income Inequalities in the Age of Financial Globalization
Box 5.4. Mauritius: Inequality and growthThe case of Mauritius throws an interesting light on how economic development can take place hand in hand with effective redistribution policies. Between 1980 and 2006, the Mauritius economy grew, on average, 4.1 per cent per year – much faster than the average for devel-oping countries as a whole (see table 5.2). It also managed to increase both its employment rate – by 2 per cent per year between 1990 and 2007 – and the employment to population ratio, which reached over 55 per cent in 2006. At the same time, poverty rates were cut sig-nificantly, dropping from 20 per cent in 1997 to 8 percent in 2006, while the share of national income for the poorest 20 per cent of households grew from 5.6 per cent in 1987 to 6.2 per cent in 2002 (see table 5.3).
Table 5.2. Average growth rates
1980-1989 1990-1999 2000-2006
Growth (%) 4.9 4.2 3.1
Source: World Bank 2008
Table 5.3. Income inequality and poverty in Mauritius, by household
1986/87 1991/92 1996/97 2001/02 2006/07
Income share (% GDP)
Lowest 20 per cent 5.6 6.4 5.9 6.4 6.1
Highest 20% 44.2 43.5 46.2 44.0 45.7
Gini coefficient 0.396 0.379 0.387 0.371 0.389
% below poverty line 19.5 10.6 8.7 7.7 8.0
Source: Central Statistics Office of Mauritius, Household Budget Surveys (http://www.gov.mu/portal/goc/cso/eice64/toc.htm)
Social policy in Mauritius dates back to the 1940s, when the Central Development and Welfare Committee was established. In the 1950s, a social security scheme for plantation workers was instituted. Universal access to health and education is available, including free secondary and university education. There is also a non-contributory pension scheme covering all citizens over the age of 60. In addition, the price of essential commodities (notably rice and flour) is subsi-dized. Social assistance is provided, targeted at vulnerable groups.
Social programmes are funded by general taxation revenues. Personal income tax is markedly progressive: not only are tax rates and the distribution of taxable income progressive in them-selves, but exemption limits are high so that low-income earners pay no tax at all.
Although government expenditure has stayed stable at around 25 to 26 per cent of GDP over the past decades, its focus has shifted from public administration and economic services to social services and social transfers. Social transfers increased from 6.1 per cent of GDP in the mid-1980s to 8.2 per cent in the late 1990s, 9.6 per cent in 2000-01 and 9.3 per cent in 2003-04. About 50 per cent of the transfers are used to finance various universal pension schemes and the rest go on education, parastatal bodies and local government Social assist-ance subsidies are provided for essential commodities (rice and flour) and certain sections of the population (students, the elderly, disabled people and recipients of social assistance enjoy free transport ).
Source: Nath forthcoming, Social policy in Mauritius, Background paper prepared for UNRISD project on “Social policies in small states”.

149
5. Redistribution through taxes and social transfers
C. Policy considerations
Taxes and social transfers can be important tools for redistribution. Yet, despite their potential, they have not been used to the extent needed to keep pace with increasing ine-quality. To the extent that policy makers consider rising income inequality problematic, several policy options can be considered. Th e purpose of these policy options is to address increasing income inequality without adversely aff ecting economic growth.
First, there may be a case for increasing the progressivity of the tax system. To this end, governments could ensure that tax rates on high incomes are not further reduced – an international trend highlighted in this chapter – and limit regressive tax exceptions. In certain countries there may be a case for refraining from further increase in VAT and other indirect taxes (oft en regressive), introduced to compensate for reductions in govern-ment revenue arising from lowered income taxes and trade tariff reductions.
Second, in order to avoid the risk of harmful international tax competition, multilat-eral action may be needed. Indeed there are many countries that cannot enhance the pro-gressivity of their tax system, because doing so may encourage mobile, high-income groups to leave. Of course, any eff orts to curb harmful tax competition must give consideration to cases where countries have legitimately reduced taxes to improve economic effi ciency.
Th ird, tax and social policy need to support employment –a key redistribution mech-anism. Th is means removing tax distortions that aff ect labour market participation.
Fourth, as this chapter has shown, social policy can be used more actively without sacrifi cing growth or employment objectives. Th is was shown to be the case in countries as diverse as Malaysia, Mauritius, Nordic countries and, to a certain extent, Brazil. In some of these countries, social protection was provided for the entire population (or in the case of Brazil, for low-income, rural households) and, at the same time, growth and employ-ment were maintained. Access to basic social services, such as education, health and water, should be universal as these services increase human capital, support economic growth and limit the risk of excessive income inequality. In developing countries, the use of con-ditional cash benefi ts may prove to be an interesting innovation.
References
Ansiliero, G.; Paiva, L. H. 2008. “Th e recent evolution of social security coverage in Brazil”, in International Social Security Review, Vol. 61, No. 3, pp. 1-28.
Arza, C. 2008. “Pension reform in Latin America: Distributional principles, inequalities and alternative policy options”, in Journal of Latin American Studies, Vol. 40, No. 1, pp. 1-28.
Barrientos, A. 2004. “Latin America: Towards a liberal-informal welfare regime”, in Gough; Wood (eds.), pp. 121-168.
Baulch, B. et al. 2008. Social protection index for committed poverty reduction (Manila, Asian Development Bank).
Boadway, R.; Keen, M. 2000. “Redistribution”, in A. Atkinson; F. Bourguignon (eds.): Handbook of income distribution (Amsterdam, Elsevier), pp. 677-789.
Burgess, R.; Stern, N. 1993. “Taxation and development”, in Journal of Economic Literature, Vol. 31, No. 2, pp. 762-830.
Cerami, A. 2003. Th e impact of social transfers in Central and Eastern Europe, LIS Working Paper Series, Paper No. 356 (Luxembourg).
Commission on Growth and Development. 2008. Th e growth report: Strategies for sustained growth and inclusive development. Available at: http://www.growthcommission.org [7 July 2008].
Chu, K.; Davoodi, H.; Gupta, S. 2000. Income distribution and tax and government social spending policies in developing countries, Working Paper 214 (Helsinki, United Nations University, World Institute for Development Economics Research).
Draibe, S. 2007. “Th e Brazilian development welfare state: Rise, decline and perspective”, in M. Riesco (ed.): Latin America: A new developmental welfare state model in the making?

150
World of Work Report 2008: Income Inequalities in the Age of Financial Globalization
(Houndmills, Palgrave-Macmillan/United Nations Research Institute for Social Development (UNRISD)), pp. 239-281.
Engel, E.; Galetovic, A.; Raddatz, C.E. 1999. “Taxes and income distribution in Chile: Some unpleasant redistributive arithmetic”, in Journal of Development Economics, Vol. 59, No. 1, pp. 155-192.
Esping-Andersen, G. 1990. Th e three worlds of welfare capitalism (Cambridge, Polity Press).Estes, R. J. 2004. “Development challenges of the ‘New Europe’ ”, in Social Indicators Research,
Vol. 69, No. 2, pp. 123-166.Fox, L. 2003. Safety nets in transition economies: A primer (World Bank. Social Protection Unit,
Human Development Network).Gemmell, N.; Morrissey, O. 2005. “Distribution and poverty impacts of tax structure reform in
developing countries: How little we know”, in Development Policy Review, Vol. 23, No. 2, pp. 131-144.
Gerry, C. J.; Mickiewicz, T. M. 2008. “Inequality, democracy and taxation: Lessons from the post-communist transition”, in Europe-Asia Studies, Vol. 60, No. 1, pp. 89-111.
Giammatteo, M. 2006. Inequality in transition countries: Th e contributions of markets and government taxes and transfers, LIS Working Paper Series, No. 443 (Luxembourg).
Goni, E. et al. 2008. Fiscal redistribution and income inequality in Latin America, World Bank Policy Research Working Paper. No. 4487.
Gough, I. 2004. “East Asia: Th e limits of productivist regimes”, in Gough; Wood (eds.), pp. 169-201.
Gough, I.; Wood, G. (eds.). 2004. Insecurity and welfare regimes in Asia, Afr ica and Latin America: Social policy in development contexts (Cambridge, Cambridge University Press).
Haggard, S.; Kaufman, R. 2008. Development, democracy and welfare states (Princeton, Princeton University Press).
Harris, T. 1998. Th e eff ects of taxes and benefi ts on household income 1997-98 (London, Offi ce for National Statistics). Available at: http://www.statistics.gov.uk/articles/economic_trends/taxes&%20benefi ts_eff ects_on_household_income_97-98.pdf
International Monetary Fund. 2001. Government Financial Statistics Manual. Available at: http://www.imf.org/external/pubs/ft /gfs/manual/
International Monetary Fund. 2007. Government Finance Statistics CD ROM.Johansson, A. et al. 2008. Taxation and economic growth (Paris, OECD).Jones, F. 2007. Th e eff ects of taxes and benefi ts on household income, 2005/06 (London, Offi ce
for National Statistics). Available at: http://www.statistics.gov.uk/articles/nojournal/taxesbenefi ts200405/Taxesbenefi ts200405.pdf
Kangas, O.; Palme, J. (eds.). 2005. Social policy and economic development in the Nordic countries. Social policy in a development context (Houndmills, Palgrave Macmillan/UNRISD).
Kenworthy, L.; Pontusson, J. 2005. “Rising inequality and the politics of redistribution in affl uent countries”, in Perspectives on Politics, Vol. 3, No. 3, pp. 449-471.
KPMG. 2008. KPMG’s corporate and indirect tax rate survey 2007 (London). Available at: http://www.kpmg.com.om/PDF/KPMG’s%20Corporate%20&%20Indirect%20Tax%20rate%20survey%202007.pdf [7 July 2008].
Lindert, K.; Skoufi as, E.; Shapiro, J. (eds.) 2006. Redistributing income to the poor and the rich: Public transfers in Latin America and the Caribbean. Social Protection Discussion Paper no. 0605, Social Safety Nets Primer Series.
Lindert, P. 2004. Growing public: Social spending and economic growth since the eighteenth century, Vol. 1: Th e story, Vol. 2: Further evidence (Cambridge, Cambridge University Press).
Mahler, V. A.; Jesuit, D. K. 2006. “Fiscal redistribution in the developed countries: new insights from the Luxembourg Income Study”, in Socio-Economic Review, Vol. 4, No. 3, pp. 483-511.
McGrath, M.; Janisch, J.; Horner, C. 1997. Redistribution through the fi scal system in the South Afr ican economy, paper presented at the Economics Society of South Africa Conference, Potchefstroom.
Mitra, P.; Yemtsov, R. 2006. Increasing inequality in transition economies: Is there more to come? World Bank Policy Research Working Paper No. 4007.
Musgrave, R. A. 1959. Th e theory of public fi nance (McGraw-Hill, New York).Nath. Forthcoming. Social policy in Mauritius, Background paper prepared for social policies in
small states project, UNRISD.Nattrass, N.; Seekings, J. 2001. “Democracy and distribution in highly unequal economies: Th e
case of South Africa”, in Th e Journal of Modern Afr ican Studies,Vol. 39, No. 3, pp. 471-498.

151
5. Redistribution through taxes and social transfers
OECD. 2006. Society at a glance: OECD social indicators (Paris).Ortiz, I., (ed.) 2001. Social protection in Asia and the Pacifi c (Manila, Asian Development Bank).Piketty, T.; Saez, E. 2007. “How progressive is the US federal tax system? A historical and
international perspective”, in Journal of Economic Perspectives, Vol. 21, No. 1, pp. 3-24.Pontusson, J. 2005. Inequality and prosperity: Social Europe vs Liberal America (Ithaca and
London, Cornell University Press).Prasad, M.; Deng, Y. 2008. Taxation and the worlds of welfare, LIS, Working Paper Series
No. 480 (Lumbourg).Prasad, N. 2008. “Policies for redistribution: the use of taxes and social transfers”, Discussion
Paper No. 194 (International Institute for Labour Studies, Geneva).Ragayah, H.M.Z. 2008. “Income inequality in Malaysia”, in Asian Economic Policy Review,
Vol. 3, pp. 114-132.Ragayah, H.M.Z. Forthcoming. Sharing the pie: Reviewing income distribution policies in
Malaysia.Soares, F. V. et al. 2006. Cash transfer programmes in Brazil: Impacts on inequality and poverty,
International Poverty Centre Working Paper, No. 21 (UN Development Programme).Tabi, A.J.; Akwi, T.; Anzah, E. 2006. Th e distributive impact of fi scal policy in Cameroon : Tax
and benefi t incidence, Poverty and Economic Policy Research Network (PEP) – Poverty Monitoring, Measurement and Analysis (PMMA) Working Paper 2006-16 (University of Dschang, Cameroon).
United Nations. 2006. Social panorama of Latin America 2005 (Santiago, Economic Commission for Latin America and the Caribbean (ECLAC)).
Willmore, L. 2007. “Universal pensions for developing countries”, in World Development, Vol. 35, No. 1, pp. 24-51.
World Bank. 2005. Growth, poverty and inequality: Eastern Europe and the Former Soviet Union (Washington D.C.).
World Bank. 2008. World Development Indicators Online (WDI). Available at: http://go.worldbank.org/U0FSM7AQ40 [7 October, 2008].
Zockun, M. H. 2007. “Th e current tax system: an obstacle to economic growth and to more equitable income distribution”, in J. Marcovitch (ed.): Th e new Latin American landscape (Sao Paulo University), pp. 101-121.


153
Introduction
As earlier chapters have demonstrated, the current pattern of growing income inequalities observed in the majority of countries needs to be addressed. Income inequality is partly driven by factors which are not conducive to greater economic effi ciency – such as the manner in which fi nancial globalization has developed over the past two decades or so. Observed pat-terns of growing income inequality also entail considerable risks from the point of view of social cohesion and continued political support for pro-growth policies. As noted in Chapter 1, perceptions that the existing distribution of income is not fair are growing.
Policy action, however, should take into account the need for rewarding work eff ort, innovation and skills – key drivers of economic growth and prosperity. In this respect, this report sheds light on policies and approaches for addressing income inequality to help ensure that the gains from economic growth are distributed in a more sustainable manner, while also maintaining economic dynamism. Th is requires action at the interna-tional level, notably as regards reform of the fi nancial architecture. But domestic policies can make a major diff erence as well. Stronger tripartite institutions, well-designed labour regulations and social protection, and respect for basic workers’ rights are particularly important, as earlier chapters have shown.
Th e purpose of this chapter is to show that the domestic policy response is best con-ducted as a coherent package. Th is is the essence of the Decent Work Agenda.
A. Links between Decent Work and income inequality
Th e Decent Work Agenda provides an ideal framework for examining, collectively, the relationships and potential trade-off s among the various components discussed in this year’s World of Work Report. Th e Decent Work Agenda is captured along four strategic objectives, namely, (i) fundamental principles and rights at work and international labour standards; (ii) employment opportunities for women and men; (iii) social protection and social security; and, (iv) social dialogue and tripartism.
Decent Work as a coherent policy package
6. Decent Work as a coherent policy package
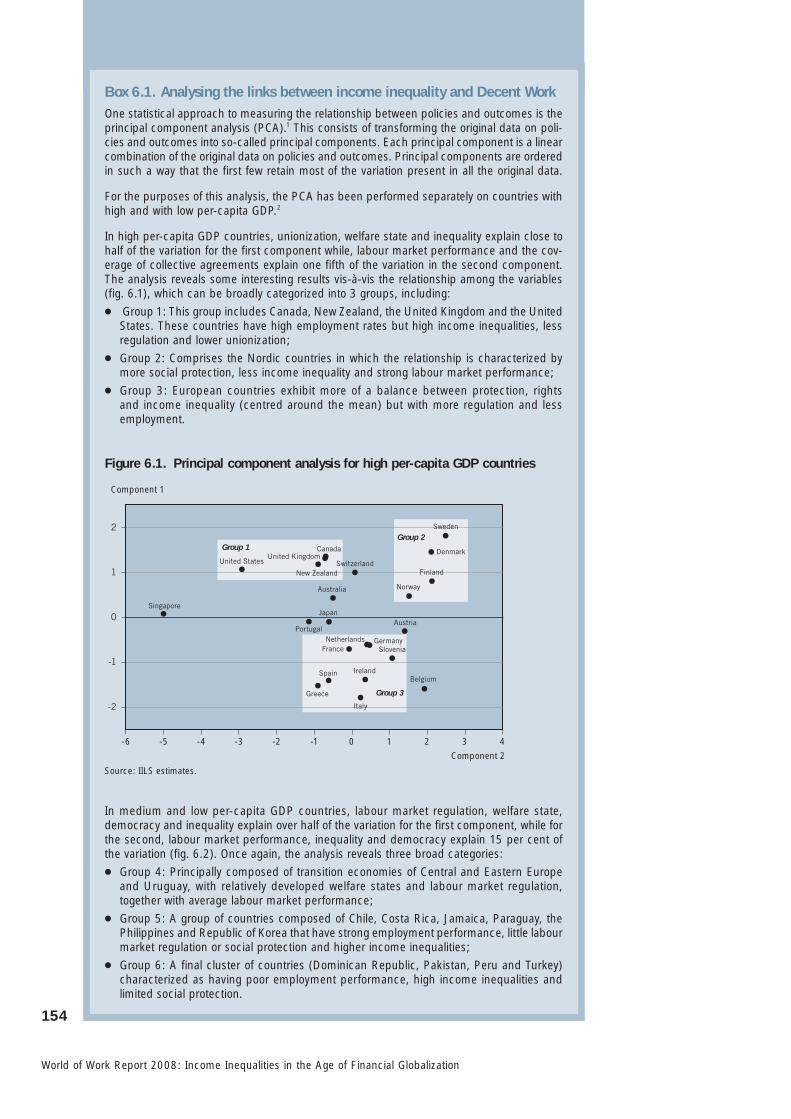
154
World of Work Report 2008: Income Inequalities in the Age of Financial Globalization
Box 6.1. Analysing the links between income inequality and Decent WorkOne statistical approach to measuring the relationship between policies and outcomes is the principal component analysis (PCA).1 This consists of transforming the original data on poli-cies and outcomes into so-called principal components. Each principal component is a linear combination of the original data on policies and outcomes. Principal components are ordered in such a way that the first few retain most of the variation present in all the original data.
For the purposes of this analysis, the PCA has been performed separately on countries with high and with low per-capita GDP.2
In high per-capita GDP countries, unionization, welfare state and inequality explain close to half of the variation for the first component while, labour market performance and the cov-erage of collective agreements explain one fifth of the variation in the second component. The analysis reveals some interesting results vis-à-vis the relationship among the variables (fig. 6.1), which can be broadly categorized into 3 groups, including:
● Group 1: This group includes Canada, New Zealand, the United Kingdom and the United States. These countries have high employment rates but high income inequalities, less regulation and lower unionization;
● Group 2: Comprises the Nordic countries in which the relationship is characterized by more social protection, less income inequality and strong labour market performance;
● Group 3: European countries exhibit more of a balance between protection, rights and income inequality (centred around the mean) but with more regulation and less employment.
Figure 6.1. Principal component analysis for high per-capita GDP countries
Denmark
Finland
Sweden
Group 1Group 2
Group 3
Slovenia
Belgium
Austria
Norway
France
Switzerland
Canada
Germany
Australia
Japan
Ireland
Netherlands
Italy
Spain
United Kingdom
New Zealand
Greece
Portugal
United States
Singapore
-2
-1
0
1
2
Component 1
Component 2
-6 -5 -4 -3 -2 -1 0 1 2 3 4
Source: IILS estimates.
In medium and low per-capita GDP countries, labour market regulation, welfare state, democracy and inequality explain over half of the variation for the first component, while for the second, labour market performance, inequality and democracy explain 15 per cent of the variation (fig. 6.2). Once again, the analysis reveals three broad categories:
● Group 4: Principally composed of transition economies of Central and Eastern Europe and Uruguay, with relatively developed welfare states and labour market regulation, together with average labour market performance;
● Group 5: A group of countries composed of Chile, Costa Rica, Jamaica, Paraguay, the Philippines and Republic of Korea that have strong employment performance, little labour market regulation or social protection and higher income inequalities;
● Group 6: A final cluster of countries (Dominican Republic, Pakistan, Peru and Turkey) characterized as having poor employment performance, high income inequalities and limited social protection.

155
6. Decent Work as a coherent policy package
Figure 6.2. Principal component analysis for medium and low per-capita GDP countries
-2
-1
0
1
2
Component 1
Component 2
-6 -5 -4 -3 -2 -1 0 1 2 3 4
Czech Republic
Hungary
Slovakia
Latvia
LithuaniaPoland
Korea,Republic of
India
Estonia
Pakistan
Turkey
Uruguay
Venezuela
Costa Rica
Peru
Argentina
Dominican Republic
Philippines
El SalvadorMexico
ChileParaguay
Jamaica
Brazil
Group 4
Group 5
Group 6
Source: IILS estimates.
1 The PCA gives a dimensionally reduced image of the original data, while retaining as much as possible the variation present in the data. Detailed calculations are available upon request.2 High per-capita GDP countries include countries with per-capita GDP above the average, and vice-versa for the medium and low per-capita GDP countries.
Individually, each of the former three issues, or an aspect of them, and their rela-tionship to income inequality has been examined in greater detail in Chapters 3, 4 and 5, respectively. And while each chapter develops key messages and policy considera-tions around how best to reverse the trend increase in income inequality, the challenge for policy makers is that many of these issues are inter-related. With that in mind, an attempt is made, using the principal component analysis, to measure the relationship among the various components of the Decent Work Agenda and income inequality (box 6.1). To do so, a set of fi ve variables along the lines of the strategic objectives of the Decent Work Agenda is considered: 1
● income inequality (expressed by the Gini index as elsewhere in the report);
● trade union density and the number of ratifi ed core ILO Conventions;
● the employment rate;
● spending on social protection as a percentage of GDP; and● respect for political rights, including basic workers’ rights.2
Some of the main fi ndings of the analysis are illustrated in Table 6.1. In particular, two broad categories are defi ned as regards high employment rates, i.e. those with relatively high income inequality and those with relatively low income inequality. However, given the complexity of the interactions it is diffi cult to ascertain the extent to which any one
1. Each variable is expressed as the average over the period 1990-2007 and the data cover 47 countries.2. As established by Freedom House in 2007.

156
World of Work Report 2008: Income Inequalities in the Age of Financial Globalization
factor is influencing outcomes related to employment and income inequality. In this regard, it is important to note that the evidence presented here is not intended to be causal in nature but illustrative of the various relationships among the components of the Decent Work Agenda on the one hand, and income inequality on the other.
Nevertheless, the main fi nding from the analysis is that it is possible to avoid excessive income inequality while achieving a high employment rate. Th is is the case for both high and medium/low per-capita GDP counties. For example, among high per-capita GDP countries, Austria, Australia, the Nordics and Switzerland have managed to achieve this. Th ese countries – where employment rates are high and income inequalities relatively low – are characterized by relatively strong, employment-oriented social protection, higher than average coverage of collective agreements and well-respected political rights. Among medium and low per-capita GDP countries, countries like the Czech Republic and Uru-guay have managed to achieve relatively high employment and limited income inequali-ties. Th ey too are associated with relatively developed social protection, stronger tripartite institutions than in other countries, and observance of political rights.
In sum, for policy makers concerned about excessive inequalities while also sus-taining employment, the Decent Work Agenda is an important tool and framework to consider.
B. Policy coherence
Th e above fi ndings highlight the complementary roles of the diff erent components of the Decent Work Agenda. Indeed, it is likely that these objectives work best as a coherent and mutually-reinforcing package. According to the recently-adopted ILO Declaration on Social Justice for a Fair Globalization, “the four strategic objectives are inseparable, inter-related and mutually supportive (…). To optimize their impact, eff orts to promote them should be part of an ILO global and integrated strategy for decent work” (ILO, 2008).
Th e experience of Argentina provides an example of the important role of policy coherence. Argentina’s economic and social crisis of 2001-2002 was marked by high unem-ployment, a regressive distribution of income, and increasing poverty. Novick et al. (2007) explain how Argentina emerged from this recessionary context by mounting a systematic eff ort to integrate policies and also assert that the policy approach was inspired by the concept of decent work.
In particular, in the wake of the 2001 crisis, Argentina embarked on an eff ort to link economic, labour and social policies, in order to transform production, boost employment, improve incomes and income distribution, and stimulate social mobility. Key steps taken by the State included the following:
● the promotion of decent work was explicitly mentioned as a priority objective of gov-ernment policies (a fi rst in Latin America);
● an integrated employment plan entitled More and Better Jobs was launched to pro-mote training of unemployed workers and entry into quality jobs;
● labour legislation was restored, and social protection and social dialogue were promoted;
● a National Plan for the Regularization of Work was launched, and increased staff and resources were dedicated to address high levels of unregistered employment;
● emphasis was placed on analysis and monitoring of labour market developments and on the generation of information to support decision making; and,
● active income policies were established, including the reinstitution of a minimum wage, the encouragement of collective bargaining, and a pensions policy.

157
6. Decent Work as a coherent policy package
Since 2001, Argentina has achieved strong economic growth, and has made signif-icant improvements in a number of social and labour indicators. Novick et al. (2007) emphasize that the coherent nature of the reforms was a key reason why the country was able to make a rapid recovery from crisis conditions: policy coherence gave rise to a vir-tuous circle of demand, employment and investment, which led to a reduction in poverty, lower unemployment, a rise in real wages, and wider coverage of collective bargaining. However, it is important to note that other factors were also likely at play. For example, to a large extent, the economic gains realized by Argentina were due to favourable inter-national conditions and the switch to a fl oating exchange rate, which allowed the country to produce goods that were competitive in the international market.
In many ways Argentina’s strategy refl ects the spirit of the Decent Work Agenda, in that government combined eff orts to boost employment, reduce poverty, and address dis-tributional concerns. Th is coherent policy suite promoted job creation and a strengthening of social dialogue, while limiting increases in income inequality.
Similarly, in the late 1990s, structural change, job losses, expanding poverty and worsening income distribution in Brazil brought increased demands for new forms of government intervention (Marshall, 2004). Th is came in the form of labour market measures to support social protection and employment, including unemployment insurance and training schemes, and assistance to small employers and self employed workers. In 1998, a “package against unemployment” was introduced and while a direct employment creation program was not implemented at the national level, several states and municipalities developed programs on a smaller scale. Widespread social security reform was also undertaken; for example, changes were introduced to create incen-tives for private-sector workers to postpone retirement, based on the length of their contribution to the social security program. Marshall notes that although funding for many of these measures was fairly limited relative to GDP, the new framework of poli-cies constituted a steady, long-term eff ort not only aimed at job creation but also con-cerned with job quality.
Beyond implementation of a coherent package of reforms, ensuring the sustainability and permanence of such reforms is necessary for success, but represents an additional chal-lenge. First, given the nature of the interactions of the various policy planks of the Decent
Table 6.1. Successful employment performers: two illustrative models
Welfarestate 1
Tripartite institutions 2
Violation of Political rights 3
High per-capita GDP countries
High employment / low inequalities(e.g. Austria, Denmark, Finland, Norway, Switzerland and Sweden)
16.2 3.7 1.0
High employment / high inequalities(e.g. New Zealand, United Kingdom and United States)
11.0 1.0 1.0
Medium and low per-capita GDP countries
High employment / low inequalities(e.g. Czech Republic, Estonia, Hungary and Uruguay)
14.1 2.2 1.6
High employment / high inequalities(e.g. Costa Rica, Jamaica, Mexico, Paraguay and Philippines)
2.1 1.2 2.4
Notes: 1. Welfare state is the average share of social protection expenditure as a percentage of GDP. 2. The measure for tripartite institutions ranges from 1 (few collective Conventions) to 4.7 (many). 3. Violation of political rights ranges from 1 to 7, 1 being low in terms of violating political rights.
Source: IILS estimates, see box 6.1.

158
World of Work Report 2008: Income Inequalities in the Age of Financial Globalization
Work Agenda, measuring progress and isolating impacts of various changes is diffi cult and is likely to depend considerably on initial conditions in each country (an area for further work – see below).
Second, successfully institutionalizing a coherent policy suite also depends on the availability of funding, notably as regards the financing of suitable social protection schemes and the development of well-functioning institutions, e.g. training systems that respond to labour market requirements. Th is may mean either a re-allocation of resources or raising new funds.
Finally, the level of political will may well determine the long-run sustainability and success of any coherent policy package as, inevitably, there will be diffi cult choices to be made.
C. Areas for further analysis
Th is report has established a number of facts about income inequality, employment and causal factors. It has also paved the way for policy action in order to address excessive income inequalities, while supporting employment and economic growth.
However, more work needs to be done in order to understand what domestic policies work best, where and under what circumstances. Th e following areas are particularly rel-evant for further research:
● A better understanding is needed regarding one of the key factors behind excessive income inequality in some countries, namely employment informality. Th is calls for an examination of the diverse causes of employment informality and possible policy avenues to promote transitions to formal employment.
● Another domestic policy for which additional research is needed concerns tax policy. Th ere is some agreement – reinforced by analysis in this report - that well-designed social protection can serve both employment and social goals. Yet, little is known about arrangements for funding social protection, especially in the context of developing countries where the tax base is limited and further weakened by the presence of a large informal economy. Th is year’s World of Work Report has also shown that taxes of high incomes have tended to decline, which could be problematic in the context of growing income inequalities, while also weakening the ability of countries to undertake redis-tribution policies. It would be useful to assess whether there is a risk that international tax competition is putting downward pressure on taxation of incomes of high-income groups.
● Finally, it is important to examine in more detail the role of policy coherence between the diff erent planks of the Decent Work Agenda. Th is can best be done in the context of country reviews, which is ideal to analyse policy interactions and possible trade-off s.
Further analysis is also needed to follow-up on the report’s analyses of fi nancial globaliza-tion and corporate governance:
● Th e current fi nancial system calls for reforms in the regulation of the fi nancial archi-tecture, in particular with respect to prudential regulation and fi nancial supervision. However, no consensus exists as to the optimal regulatory framework and proposals vary from tight regulation for money creation by the banking sector (e.g. through high reserve requirements) to only small modifi cations to the current supervisory frame-work (e.g. emphasising macro-prudential regulation to detect systemic risks at an ear-lier stage). Th ese various proposals come with signifi cantly diff erent implications for

159
6. Decent Work as a coherent policy package
job creation and wage growth. Future work in this area should, therefore, focus on those types of regulation that promise a maximum benefi cial impact on Decent Work goals.
● Shedding further light on the design of policies for the development of domestic fi nan-cial systems is also needed, including the role of monetary policy in promoting employ-ment creation in the medium turn. Th is should help to improve upon distortions in the payment and credit system, allow a better channelling of funds to local entrepreneurs and fi rms, and help to regulate liquidity growth in line with economic fundamentals, with a view of stimulating sustainable employment creation.
● More work should be devoted to the question of global and regional responses to cur-rency and banking crises. In particular, the setting-up of regional currency areas to allow smaller and more vulnerable countries to benefi t from a large, diversifi ed mon-etary union should be evaluated from the point of view of its labour market impli-cations. Further analysis is needed regarding the conditions that need to be satisfi ed for currency unions among developing countries to successfully attenuate the risk of external shocks for its members.
● Finally, the issue of executive compensation has attracted considerable attention recently. Some countries have started to take action in this regard, while others are considering several reform options. And, it would be useful to examine the pros and cons of diff erent measures from the point of view of sustainable enterprise develop-ment and Decent Work.
References
Marshall, A. 2004. “Labour market policies and regulations in Argentina, Brazil and Mexico: Programmes and Impacts”, Employment Strategy Paper prepared for the ILO’s project on Employment Challenges in Argentina, Brazil and Mexico: A Comparative Study in the Framework of the Global Employment Agenda (Geneva).
Novick, M. et al. 2007. “In the wake of the crisis: Argentina’s new economic and labour policy directions and their impact”, International Institute for Labour Studies, Research Series 114 (Geneva).
International Labour Organization (ILO). 2008. ILO Declaration on Social Justice for a Fair Globalization (Geneva).

161
Recently published
Cross-border social dialogue and agreements: An emerging global industrial relations fr amework? (2008)Editor: Konstantinos PAPADAKIS
Governance, International Law & Corporate Social Responsibility (2008) Th e theme of a seminar organized by the International Institute for Labour Studies
Pursuing decent work goals: Priorities for research (2008)by Gerry Rodgers and Christiane Kuptsch
Trade and Employment - Challenges for Policy Research (2007)by Marion Jansen and Eddy Lee
Merchants of labour (2006)Edited by Christiane KUPTSCH
Recent Discussion Papers
Executive compensation: trends and policy issues (2008)By Franz Ebert, Konstantinos Papadakis, Raymond Torres
Will the next globalization be great? Evidence on the eff ects of fi nancial globalization on employment and inequality (2008)By Ekkehard Ernst, Verónica Escudero
Labour, globalization and inequality: Are trade unions still redistributive? (2008)By Lucio Baccaro
Impact of changing work patterns on Income Inequality (2008)By Uma Rani
Recent publications of the International Institute for Labour Studies Website: http://www.ilo.org/inst
162
World of Work Report 2008: Income Inequalities in the Age of Financial Globalization
Policies for redistribution: the use of taxes and social transfers (2008)By Naren Prasad
Th e Swedish model: Revival aft er the turbulent 1990s? (2008)By Dominique Anxo, Harald Niklasson
Deepening the Social Dimensions of Regional Integration (2008)By UNU-CRIS
Harnessing globalization for development: Opportunities and obstacles (2008)By Eddy Lee
Th e Infl uence of the EU on the Evolution of National Employment Models (2008)By Jill Rubery, Gerhard Bosch, Steff en Lehndorff
Corporate social responsibility in multinational companies: Management initiatives or negotiated agreements? (2007)By Tony Edwards, Paul Marginson, Paul Edwards, Anthony Ferner, Olga Tregaskis
International Labour Review
In this issue, Vol. 147 (2008), No. 2-3:
Improving the quality of low-wage work: Th e current American experience, by P. Osterman
Th e state of worker protections in the United States: Unregulated work in New York City, by A. Bernhardt, S. McGrath and J. DeFilippis
Monitoring quality in work: European Employment Strategy indicators and beyond, by L. Davoine, C. Erhel and M. Guergoat-Lariviere
Promoting sustainable compliance: Styles of labour inspection and compliance outcomes in Brazil, by R. Pires
Tripartite consultation in China: A fi rst step towards collective bargaining?, by J Shen and J. Benson
Off shore employment parctices: An empirical analysis of routines, wages and labour turnover, by K. Loess, V. V. Miller and D. Yoskowitz