
World Nuclear Fuel - JAIF Nuclear Fuel ... Enrichment 7 SWU $150 per SWU 1050 Fabrication 1 kg $300...
92
Pick a title, any title will do… This is a sample of how our PowerPoint presentation s could look in the future WNU Summer Institute Oxford 13 July 2009 Steve Kidd Director of Strategy & Research World Nuclear Association World Nuclear Fuel Market
Transcript of World Nuclear Fuel - JAIF Nuclear Fuel ... Enrichment 7 SWU $150 per SWU 1050 Fabrication 1 kg $300...

Pick a title, any title
will do…
This is a
sample of
how our
PowerPoint
presentation
s could look
in the future
WNU
Summer
Institute
Oxford
13 July 2009
Steve KiddDirector of Strategy & ResearchWorld Nuclear Association
World Nuclear Fuel
Market
Daejeon – July 09

Beijing – June/July 09

South Africa – June 09

OUTLINE

Outline of today‟s presentation
• Overview of the fuel cycle
• What determines the demand for nuclear fuel?
• Uranium
• Uranium market
• Conversion
• Enrichment
• Fuel fabrication
• Trade in nuclear fuel
• Summary & outlook
nb. This presentation covers the commercial side of nuclear –the technical side is a huge but different area!

WNA Market Report 2007

Why is nuclear fuel important?
• Without it the reactor will not operate!
• Yet if it is so insignificant in nuclear economics,
why are we bothering devoting 90 minutes to it?
• But without cheap fuel, nuclear is dead!
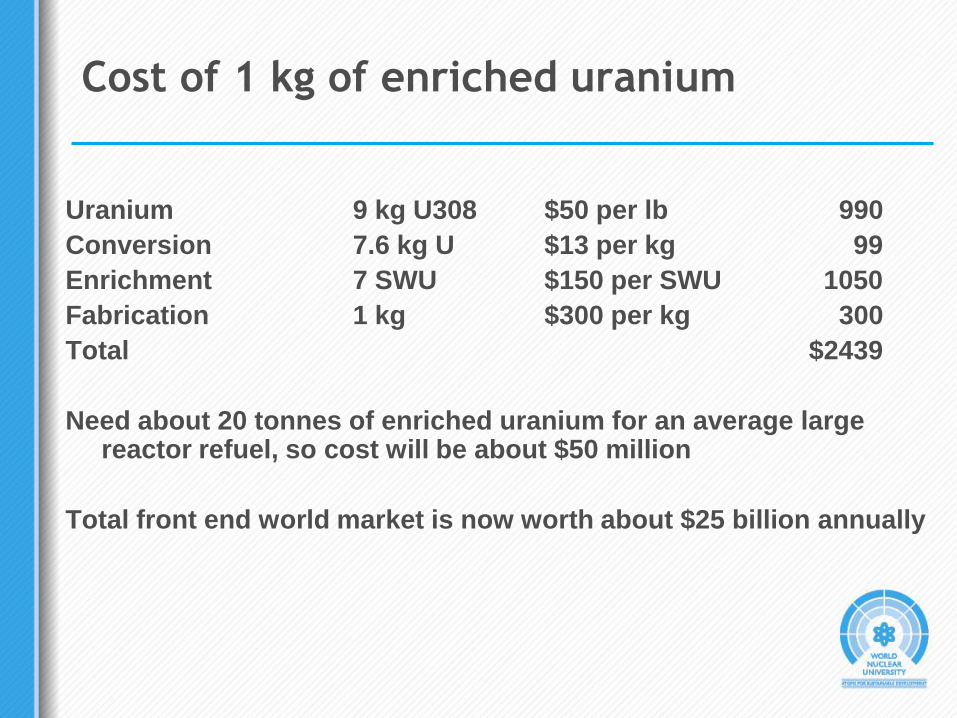
Cost of 1 kg of enriched uranium
Uranium 9 kg U308 $50 per lb 990
Conversion 7.6 kg U $13 per kg 99
Enrichment 7 SWU $150 per SWU 1050
Fabrication 1 kg $300 per kg 300
Total $2439
Need about 20 tonnes of enriched uranium for an average large reactor refuel, so cost will be about $50 million
Total front end world market is now worth about $25 billion annually

OVERVIEW OF THE
FUEL CYCLE


The Nuclear Fuel Cycle - Closed
MiningConversion
Enrichment
Fuel
fabrication
Nuclear Power Plant
Reprocessing
Waste
UraniumPlutonium

Key aspects of fuel cycle
• Complexity!
• Specialisation of producers
• International aspects
• Trade rules & regulations
• Transport difficulties
• Recycling possibilities
• Historical production levels still relevant

DEMAND FOR
NUCLEAR FUEL

Demand for nuclear fuel
Depends on two factors
• Number and size of reactors in operation
• How they are run – load/capacity factors,
enrichment level, burn-up and tails assay

WNA scenario approach
Three scenarios approach to demand –
• Reference case
• Upper case
• Lower case
Generic assumptions underlie each scenario –
on nuclear economics, public acceptance,
impact of climate change debate and
electricity market structure

Scenarios to 2030
• Country-level judgements.
• Existing reactors – consideration of operating lives
(technical, licensing and policy issues) – also power up-
rates.
• New reactors - a) under construction
b) already within planning & licensing
c) proposed without firm commitment

Key countries
• United States
• Europe – United Kingdom, Germany
• China
• India
• Russia
• Other developing countries

Nuclear generating capacity
to 2030, MWe net
0
100000
200000
300000
400000
500000
600000
700000
800000
2003
2004
2005
2006
2007
2008
2009
2010
2011
2012
2013
2014
2015
2016
2017
2018
2019
2020
2021
2022
2023
2024
2025
2026
2027
2028
2029
2030
MW
e n
et
Reference Scenario Upper Scenario Lower Scenario

Forecasting reactor requirements
• Nuclear generating capacity
• Fuel cycle and reactor operating factors – load/capacity
factors, tails assay, enrichment level, fuel burn-up
• MS Excel-based spreadsheet model computes uranium,
conversion and enrichment requirements by year to
2030
• WNA revises forecasts every two years, published in
biennial Market Report
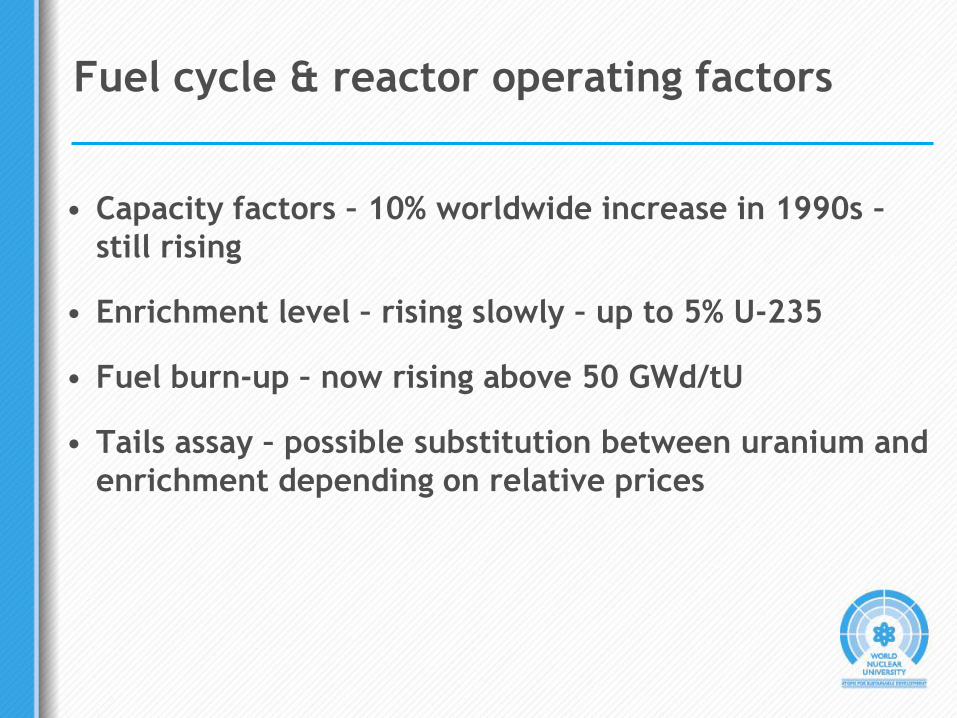
Fuel cycle & reactor operating factors
• Capacity factors – 10% worldwide increase in 1990s –
still rising
• Enrichment level – rising slowly – up to 5% U-235
• Fuel burn-up – now rising above 50 GWd/tU
• Tails assay – possible substitution between uranium and
enrichment depending on relative prices

Uranium requirements to 2030
0
20,000
40,000
60,000
80,000
100,000
120,000
140,000
160,000
180,000
2005
2006
2007
2008
2009
2010
2011
2012
2013
2014
2015
2016
2017
2018
2019
2020
2021
2022
2023
2024
2025
2026
2027
2028
2029
2030
2007 Lower Scenario 2007 Reference Scenario 2007 Upper Scenario
2005 Lower Scenario 2005 Reference Scenario 2005 Upper Scenario

URANIUM

Uranium geology
• Uranium is by no means scarce
• Found in several different types of deposits
• 0.1% grade can be enough for mining today
• Average concentration in Earth‟s crust 2.8
ppm – similar to tin
• Phosphates
• Trace amounts in sea water


Low cost (<$80/kg) uranium reserves,
thousand tonnes U
Australia 714
Kazakhstan 344
Canada 329
South Africa 206
Russia 172
Brazil 157
Namibia 145
Ukraine 127
USA 99
Others 155
Total 2438

Key Lake(Cameco, Cogema)
Crow Butte(Cameco, Kepco Res.)
Rabbit Lake(Cameco)
Ranger(Rio, Cameco,Cogema, JAURDC)
Olympic Dam(WMC)
Arlit + Akouta(Cogema, State of Niger, OURD)
Christensen Ranch(Cogema, Fuel Internat.)
Highland(Cameco)
Rossing (Rio, State of Iran,
State of Sth Africa)
Vaal Reefs(Anglo)
Russia
Uzbekistan
Kazakhstan
Converters
Jouac (Cogema)
Blind River
(Cameco)
Metropolis
(Honywell)
Pierrelatte
(Areva)
Springfields
(BNF)
Angarsk
(Russian Govt)
Beverley(General Atomics)
McLean(Cameco)
Uranium operations & conversion facilities

World uranium production 2008, tU
Canada 9000
Kazakhstan 8521
Australia 8430
Namibia 4366
Russia 3521
Niger 3032
Uzbekistan 2338
USA 1430
Others 3292
Total 43930

Top 10 uranium mines 2008 tonnes U
McArthur River 6383
Ranger 4527
Rossing 3449
Olympic Dam 3344
Priargunsky 3050
Arlit 1743
Rabbit Lake 1368
Akouta 1289
McLean Lake 1249
Akdala 1034

Top 10 companies producing uranium,
2008, tU
Rio Tinto 7975
Cameco 6659
Areva 6318
KazAtomProm 5328
ARMZ 3688
BHP Billiton 3344
Navoi 2338
Uranium One 1107
Paladin 917
General Atomics 636
Others 5620
Total 43930

Uranium production by mining method,
2008
Conventional 62%
In situ leaching (ISL) 28%
By-product 10%
Total 100%

“Western” uranium demand & supply, tU
0
10000
20000
30000
40000
50000
60000
70000
1945
1948
1951
1954
1957
1960
1963
1966
1969
1972
1975
1978
1981
1984
1987
1990
1993
1996
1999
2002
2005
Australia Canada France
Gabon Namibia Niger
South Africa USA Others
Reactor Requirements

Four ages of uranium
• Military, 1945-1967
• Booming civil demand, 1967-1985
• Secondary supply overhang, 1985-2003
• Renewed production growth, 2003 +

“Eastern” uranium supply
0
5000
10000
15000
20000
25000
30000
1945
1948
1951
1954
1957
1960
1963
1966
1969
1972
1975
1978
1981
1984
1987
1990
1993
1996
1999
2002
2005
Former DDR Czechoslovakia Bulgaria Romania Hungary Russia
Ukraine Kazakhstan Tajikistan Uzbekistan Others

Secondary supplies
• Can be regarded as previous uranium production,
held off the market for an extended period
• An important element in nuclear fuel supply
• Ex-military materials
• Commercial inventories
• MOX and RepU fuel

Ex-military materials
• Disarmament treaties have made much military
fissile material surplus to requirements and available
for use in the civil market
• Russian HEU – 500 tonnes to be down-blended
• US HEU – for later
• Plutonium in both US and Russia – use in MOX fuel

Civil inventories
• Utility inventory – pipeline, strategic and excess
• Producer inventory
• Smaller quantities owned by converters, enrichers,
traders & brokers
• Now some speculative uranium holdings by financial
companies
• Depleted uranium – can be economic to re-enrich
this to create fresh fuel

The Nuclear Fuel Cycle - Closed
MiningConversion
Enrichment
Fuel
fabrication
Nuclear Power Plant
Reprocessing
Waste
Uranium Plutonium

MOX and RepU
• Reprocessing plants separate uranium and
plutonium from used fuel
• RepU is re-enriched by centrifuges or blending to
produce fresh fuel
• Extracted plutonium is introduced as the primary
fissile element in MOX fuel
• Major reprocessing plants in France and UK with
one nearing completion in Japan

Future of secondary supplies
• Future of down-blended HEU – the big question?
• Remaining commercial inventories
• Further governmental inventories
• Future of MOX and RepU fuel
• Re-enrichment of depleted uranium (“tails”)

Will the future look like this?
Sorry,
we are out
of material.
Help,
we need
more!
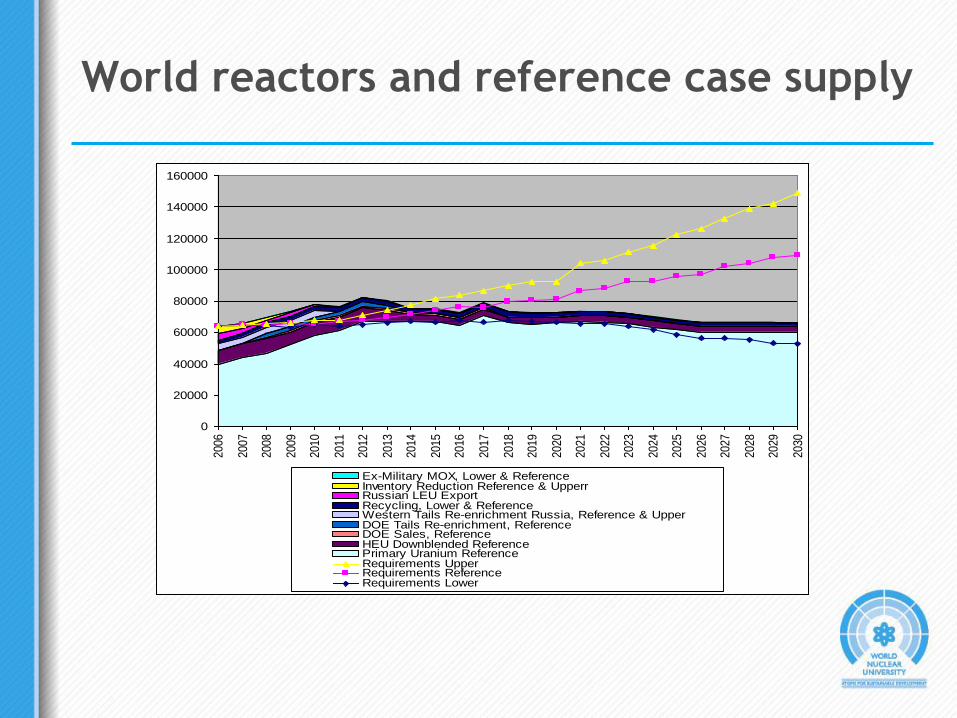
World reactors and reference case supply
0
20000
40000
60000
80000
100000
120000
140000
160000
2006
2007
2008
2009
2010
2011
2012
2013
2014
2015
2016
2017
2018
2019
2020
2021
2022
2023
2024
2025
2026
2027
2028
2029
2030
Ex-Military MOX, Lower & ReferenceInventory Reduction Reference & UpperrRussian LEU ExportRecycling, Lower & ReferenceWestern Tails Re-enrichment Russia, Reference & UpperDOE Tails Re-enrichment, Reference DOE Sales, ReferenceHEU Downblended ReferencePrimary Uranium ReferenceRequirements UpperRequirements ReferenceRequirements Lower

Future uranium production
• Must now increase sharply to (a) cover rising
demand and (b) diminishing secondary supplies
• Recent trend has been for increased dominance by a
small number of major producing companies and
countries
• Canada, Australia, Kazakhstan, Africa
• More exploration now taking place – stimulated by
higher prices
• Over 400 “junior” uranium companies have
suddenly appeared
• Some will eventually produce but how many?

Uranium production plans of Kazakhstan
2007 6,637 tU
2008 8,521 tU
2009 11,900 tU
2010 14,000 tU
2011 17,000 tU
2015 onwards 25,000 tU per annum

Implied requirement for primary uranium
production
0
20000
40000
60000
80000
100000
120000
140000
160000
20062007
20082009
20102011
20122013
20142015
20162017
20182019
20202021
20222023
20242025
20262027
20282029
2030
ton
nes
U
Requirements Lower minus Secondary UpperRequirements Reference minus Secondary UpperRequirements Upper minus Secondary Upper
Conclusions
• Uranium market has sound supply to 2015 but meeting
demand becomes more challenging thereafter, unless
the lower scenario is accurate
• Primary uranium supply needs to rise sharply to meet
rising market demand
• Secondary supplies will remain important
URANIUM MARKET

Features of nuclear fuel market
• Fuel is not generally bought in its fabricated form –rather the reactor operator buys uranium and conversion, enrichment and fuel fabrication services separately
• Many contracts are very long term
• Reactors are only refuelled once per year – buyers don‟t need to be in the market all the time
• Fuel can be easily stored – inventories can play an important part in the market
• Spot market is largely an outlet for smoothing out unforeseen blips in supply and demand
• Spot market prices relevant to many longer term contracts

Market structure
• Few participants
• Small number of transactions – illiquid
• Not transparent – most deals highly confidential
• Data on prices limited – spot market quotations,
estimates of contract prices and historic series

Spot uranium prices – current

Reasons for uranium price rise 2003-now
• Perception that secondary supplies are beginning to
run out
• Lack of investment in new production facilities from
1980s onwards – supply fixed in short run
• Production disruptions in 2003 -emphasized that
supply was fragile
• Expectation that demand will rise from “rebirth” of
nuclear power
• Change in Russian strategy in the market
• Weakening US dollar

CONVERSION

The Nuclear Fuel Cycle - Closed
MiningConversion
Enrichment
Fuel
fabrication
Nuclear Power Plant
Reprocessing
Waste
UraniumPlutonium

Reactors by type
GCR 1%
FBR 1%
PHWR 6%
LWGR 3%
AGR 2%
BWR 22%
PWR 65%
Conversion - basics
• Enrichment for light water reactors requires
conversion of uranium to UF6
• CANDU reactors require direct conversion to UO2
• 4 major UF6 conversion suppliers – Cameco,
Comurhex (Areva), ConverDyn and Rosatom
• UO2 conversion by Cameco and domestic suppliers
in Argentina, China, India and Romania

Key Lake(Cameco, Cogema)
Crow Butte(Cameco, Kepco Res.)
Rabbit Lake(Cameco)
Ranger(Rio, Cameco,Cogema, JAURDC)
Olympic Dam(WMC)
Arlit + Akouta(Cogema, State of Niger, OURD)
Christensen Ranch(Cogema, Fuel Internat.)
Highland(Cameco)
Rossing (Rio, State of Iran,
State of Sth Africa)
Vaal Reefs(Anglo)
Russia
Uzbekistan
Kazakhstan
Converters
Jouac (Cogema)
Blind River
(Cameco)
Metropolis
(Honywell)
Pierrelatte
(Areva)
Springfields
(BNF)
Angarsk
(Russian Govt)
Beverley(General Atomics)
McLean(Cameco)
Uranium operations & conversion facilities
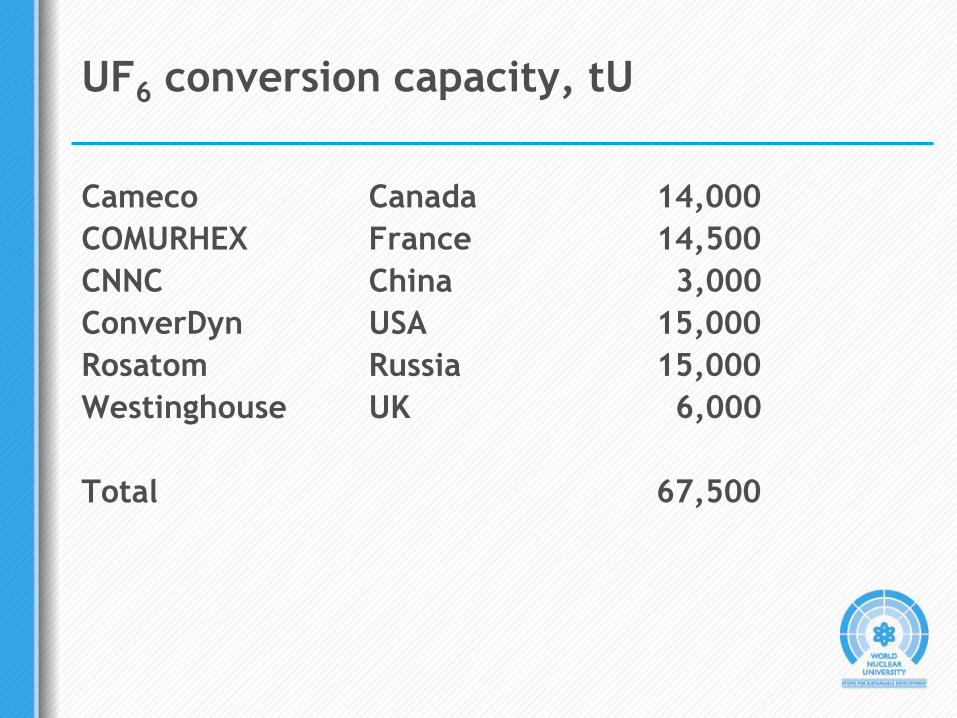
UF6 conversion capacity, tU
Cameco Canada 14,000
COMURHEX France 14,500
CNNC China 3,000
ConverDyn USA 15,000
Rosatom Russia 15,000
Westinghouse UK 6,000
Total 67,500

UO2 conversion capacity, tU
Argentina 160
Canada 2700
China 200
India 435
Korea 400
Romania 150
Total 4045
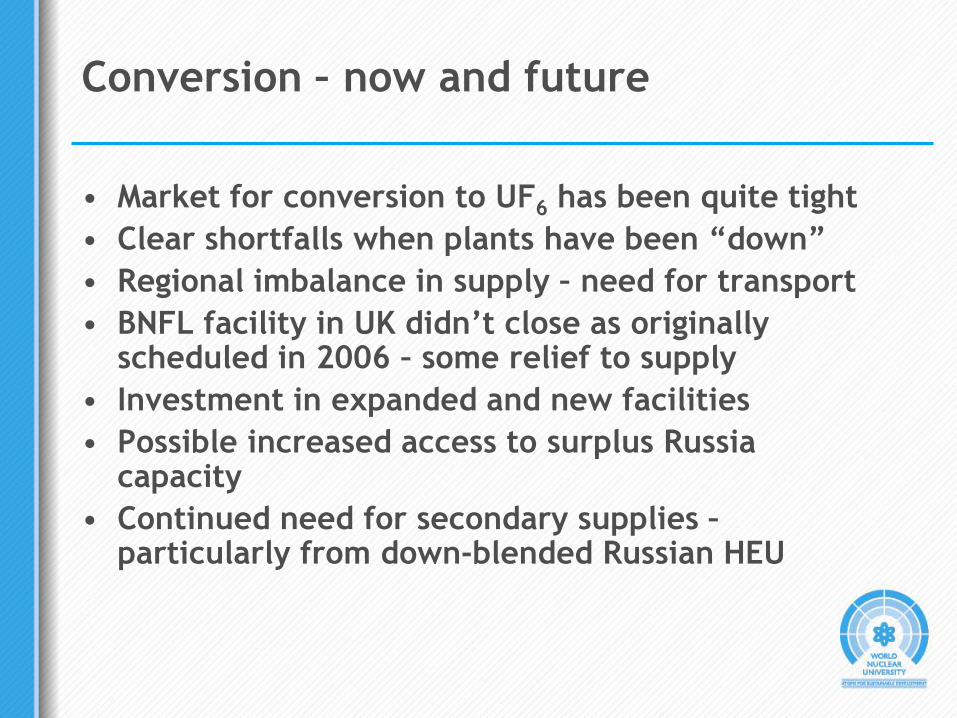
Conversion – now and future
• Market for conversion to UF6 has been quite tight
• Clear shortfalls when plants have been “down”
• Regional imbalance in supply – need for transport
• BNFL facility in UK didn‟t close as originally scheduled in 2006 – some relief to supply
• Investment in expanded and new facilities
• Possible increased access to surplus Russia capacity
• Continued need for secondary supplies –particularly from down-blended Russian HEU

ENRICHMENT

Enrichment - basics
• 90% of current power reactors need fuel where the U-235 isotope is above the natural 0.71% (typically 3-5%)
• Two main technologies – gaseous diffusion and centrifuges
• Investment in laser enrichment so far unrewarded by commercial application
• Large front-end expense for utilities
• Effort expended is measured in separative work units (SWUs)

Centrifuges

What is a SWU?
• A unit unique to the nuclear industry
• A measure of the quantity of work or effort
necessary to create a quantity of enriched uranium
from natural uranium
• A complex unit – detailed mathematical formulae
• Given the huge electricity input in gas diffusion
enrichment plants, the SWU could effectively be
taken as the electricity required to separate the two
isotopes

Enrichment – supply
• Four large suppliers of primary enrichment services
– USEC, Eurodif (Areva), Urenco and Rosatom
• USEC and Eurodif use gas diffusion
• Urenco and Rosatom use centrifuges
• JNFL and CNNC also primary suppliers
• Heavy current investment in new centrifuge plants
by USEC and Urenco in US and by Eurodif in France
(and eventually US too)
• Will SILEX prove commercially viable?

Enrichment capacities, 000 SWUs
CNNC China 1,000
Eurodif France 10,800
JNFL Japan 1,050
Rosatom Russia 25,000
Urenco Germany 1,800
Netherlands 3,500
UK 3,700
USEC USA 11,300
Total 58,150

Enrichment requirements to 2030
0
20000
40000
60000
80000
100000
1200002
00
3
20
04
20
05
20
06
20
07
20
08
20
09
20
10
20
11
20
12
20
13
20
14
20
15
20
16
20
17
20
18
20
19
20
20
20
21
20
22
20
23
20
24
20
25
20
26
20
27
20
28
20
29
20
30
tho
us
an
d S
WU
Lower Scenario Reference Scenario Upper Scenario

Importance of the tails assay
• Reactor operators require enriched uranium and can achieve this by many combinations of uranium and enrichment
• Relatively high enrichment input means lower tails assay (waste stream from the enrichment plant)
• Essentially an economic decision – relative price of U and SWU
• Optimal tails assay – 0.30%-0.35% until 2003-4
below 0.25% now
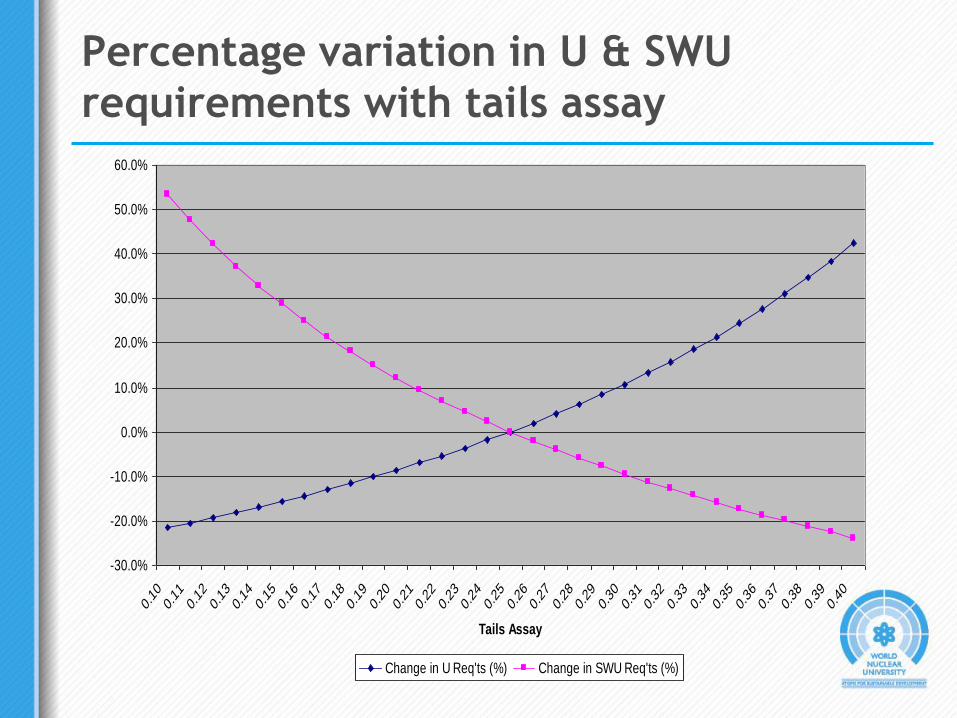
Percentage variation in U & SWU
requirements with tails assay
-30.0%
-20.0%
-10.0%
0.0%
10.0%
20.0%
30.0%
40.0%
50.0%
60.0%
0.10
0.11
0.12
0.13
0.14
0.15
0.16
0.17
0.18
0.19
0.20
0.21
0.22
0.23
0.24
0.25
0.26
0.27
0.28
0.29
0.30
0.31
0.32
0.33
0.34
0.35
0.36
0.37
0.38
0.39
0.40
Tails Assay
Change in U Req'ts (%) Change in SWU Req'ts (%)

Depleted uranium
• Over 1.5 million tonnes in storage throughout the
world
• Volume increasing by 50,000 tonnes per annum
• Use in diluting HEU
• Possibility of re-enrichment to form new reactor
fuel
• Very minor non-nuclear uses owing to density

Enrichment – current issues
• Acute proliferation issues surround this area of the
fuel cycle – similar to reprocessing of used fuel
• Proposals for “regional fuel cycle centres” and fuel
banks?
• Significant dependence on down-blended Russian
HEU – half of SWUs supplied in US in recent years
• Difficulties of access to large Russia capacity for
Western reactor operators
• Significant capacity has been devoted to re-
enrichment of depleted uranium (“tails”)

FUEL FABRICATION

Fuel fabrication - basics
• Reactor fuel is generally in the form of ceramic
pellets
• These are formed from pressed uranium oxide which
is sintered (baked) at high temperature
• Pellets are then encased in metal tubes to form fuel
rods
• Rods are then arranged in fuel assemblies (or
bundles) for introduction into the reactor
• Fundamentally a different process to uranium,
conversion and enrichment – not a bulk commodity
item – but “high tech”

Fuel fabrication

Fuel fabrication – capacities etc
• Annual requirements for LWR fuel fabrication is
about 7,000 tonnes of heavy metal (enriched U)
• Annual requirements for CANDUS and other reactor
types are 2,000-3,000 tU per annum
• Capacity for LWRs is around 11,500 tU per annum
• Production much more “localised” than other areas
of fuel cycle
• “Big boys are Areva NP, Toshiba-Westinghouse, GE-
Hitachi and TVEL
• Important smaller suppliers – CNNC, JNFL, KNFC,
ENUSA

Fuel fabrication – current trends
• PWR fuel market very competitive
• BWR fuel market becoming more competitive
• Now some competition for fuelling Russian-origin
reactors
• Non-LWR fuel requirements tend to be met by
domestic suppliers – for CANDUs, AGRs etc
• Consolidation of suppliers apparent within the sector
– BNFL with Westinghouse/ABB (then Toshiba
acquired it), Framatome-Siemens merger (Areva NP)
and Global Nuclear Fuels (GE and Japanese)
• Still surplus capacity

NUCLEAR TRADE

Trade in the nuclear fuel cycle
• Worldwide nuclear fuel market worth about
US$25 billion per year
• Specialisation is essential for economic reasons
• Security of supply is essential – therefore buyers
pursue supply diversity
• Excluded from WTO, so disputes have to be solved
bilaterally
• Restrictions not necessarily more stringent than in
other energy commodities worldwide

Market segmentation
• Russia fuels all the rectors it sells around the world
• Complete fuel service in many cases
• Gradually breaking down as reactor owners seek
supply diversification
• Czech Republic and Ukraine
• But strong former Soviet Union sales to West

Trade restrictions - direct
• Import tariffs on fabricated fuel
• Australian & Canadian export monitoring
• US restrictions on supply from the former Soviet
Union
• US trade actions on enrichment from Europe
• Euratom controls in Europe

Nuclear fuel from Russia to US
• Arrived on western markets after fall of Soviet
Union
• Arguably depressed price
• US restrictions under „Suspension Agreements‟
• Highly complex…„matched sales‟, „sunset
reviews‟…blah, blah, blah!
• Now centred on enrichment
• HEU agreement only way for US utilities to get
Russian SWUs
• New provisions seem to allow gradual Russian access
to the market
SWUs from Europe to US
• US enrichment sector in poor competitive position
• Urenco and Eurodif winning increased share of US
market
• „Anti-dumping‟ action against them
• Tariffs imposed
• Is enrichment a product or service?
• Question resolved by US Supreme Court!
• Peace in the world?

Trade restrictions – political & indirect
• No direct sanctions today – in contrast to the past -
eg South Africa/Namibia
• Strategic and defence-related restrictions are also
now weaker
• Three Mines Policy in Australia
• State ownership common in the nuclear fuel
producers
• State ownership of power utilities too
• Foreign ownership restrictions

Nuclear law – trade aspects
• Important owing to proliferation concerns and trade
controls
• The concept of “origin” of nuclear materials
• “Substantial transformation”
• “Obligations” attached to materials
• “Prior consent”
• “Swaps” or “exchanges” help get around these

Non-proliferation and safeguards
Non-Proliferation Treaty (NPT)
(Signed 1970; Extended indefinitely 1995. Currently 187 Signatories)
• To stop the further spread of nuclear weapons
• To provide security for non-nuclear weapons states which have given up the nuclear option
• To encourage international cooperation in the peaceful uses of nuclear energy
• To pursue negotiations towards nuclear disarmament leading to the eventual elimination of nuclear weapons

Nuclear Suppliers Group (NSG)
“ … a group of nuclear supplier countries which seeks to contribute to the non-proliferation of nuclear weapons through the implementation of Guidelines for nuclear exports and nuclear related exports…”
1974 Creation of NSG with 7 members (currently 45 members)
1978 NSG Guidelines published as IAEA Document INFCIRC/254, covering export of items especially designed or prepared for nuclear use
1992 NSG Guidelines for “dual use” technologypublished as IAEA Document INFIRC/254, Part2

Nuclear Suppliers Group (NSG)
Impact of the NSG
• Severe limitations on nuclear trade with India and Pakistan,
neither of which has signed the NPT
• Each country has had to develop its domestic nuclear sector
without substantial recourse to outside assistance
• The lack of good quality uranium resources has forced India to
meet its ambitious NPP programme by relying on the
maximum use of recycled fuel, notably in fast reactors, and,
potentially, through the development of thorium-based
reactors
• The NSG has now approved changes to its Guidelines, after
the US/India nuclear deal was signed and approved.

SUMMARY &
OUTLOOK

Summary - 1
• Demand for nuclear fuel is rising steadily – but
different scenarios are possible
• Uranium supply is currently tight
• Secondary supplies are certainly declining
• Conversion market is also tight – needs new
investment?
• Heavy investment in enrichment facilities is taking
place
• Fuel fabrication has surplus capacity

Summary -2
• Major international market in nuclear fuel
• Not completely free trade
• A new nuclear country should get free supply – if
sticks to IAEA safeguards etc
• Are fuel banks, international fuel cycle centres an
unnecessary restriction on free trade?
• National self-sufficiency is maybe a natural reaction
• The only reactors going without fuel have been
Indian

Outlook
• Supply of nuclear fuels will be sufficient to meet
demand, even if requirements rise sharply
• But heavy investment will be needed to improve
fuel cycle infrastructure
• Over the long-term, new reactor designs, much
more efficient in their use of fuel, may
fundamentally change the nature of the fuel market
NOW

THE FUTURE


