World Nondestructive Test Inspection Services Market
88
World Nondestructive Test Inspection Services Market N94C-30 June 2011 An Indestructible Future
description
NDT Market
Transcript of World Nondestructive Test Inspection Services Market

World Nondestructive Test Inspection Services Market
N94C-30June 2011
An Indestructible Future
2N94C-30
Disclaimer
• Frost & Sullivan takes no responsibility for any incorrect information supplied to us by manufacturers orusers
• Quantitative market information is based primarily on interviews and therefore, is subject to fluctuation.
• Frost & Sullivan Research Services are limited publications containing valuable market information providedto a select group of customers in response to orders. Our customers acknowledge, when ordering, thatFrost & Sullivan Research Services are for customers’ internal use and not for general publication ordisclosure to third parties.
• No part of this Research Service may be given, lent, resold or disclosed to non-customers without writtenpermission.
• Furthermore, no part may be reproduced, stored in a retrieval system, or transmitted in any form or by anymeans, electronic, mechanical, photocopying, recording or otherwise, without the permission of thepublisher.
• For information regarding permission, write to:
Frost & Sullivan
7550 IH 10 West, Suite 400
San Antonio, TX 78229 – 5616
USA
© 2011 Frost & Sullivan. All rights reserved. This document contains highly confidential information and is the sole property of Frost & Sullivan. No part of it may be circulated, quoted, copied or otherwise reproduced without the written approval of Frost & Sullivan.
3N94C-30
Certification
• We hereby certify that the views expressed in this research service accurately reflect our views based onprimary and secondary research with industry participants, industry experts, end users, regulatoryorganisations, financial and investment community, and other related sources.
• In addition to the above, our robust in-house forecast & benchmarking models along with theFrost & Sullivan Decision Support Databases have been instrumental in the completion and publishing ofthis research service.
• We also certify that no part of our analyst compensation was, is or will be, directly or indirectly, related tothe specific recommendations or views expressed in this service.
4N94C-30
Table of Contents
Executive Summary
• Definitions and Scope of research
• Growth Opportunities and Total Forecasts
• Key Market Drivers Summary
• Trends
• Key Market Participants
Total World NDT Inspection Services Market
• Market Overview and Definitions
• Market Engineering Measurements
• Industry Challenges
• Market Drivers and Restraints
• Market Trends
• Technology Trends
• Revenue Forecasts
• Trends by End User
• Trends by Geography
• Competitive Environment
• Market Share Analysis
Slide number
10
11
12
13
14
15
17
18
21
22
29
38
40
41
43
46
47
48
5N94C-30
Table of Contents (Contd…)
North American NDT Inspection Services Market
• Market Engineering Measurements
• Revenue Forecast
• Trends by End User
• Competitive Environment
European NDT Inspection Services Market
• Market Engineering Measurements
• Revenue Forecast
• Trends by End User
• Competitive Environment
Asia Pacific NDT Inspection Services Market
• Market Engineering Measurements
• Revenue Forecast
• Trends by End User
• Competitive Environment
Slides number
49
50
51
53
55
57
58
59
61
63
65
66
67
69
71

6N94C-30
Table of Contents (Contd…)
Rest-of-World NDT Inspection Services Market
• Market Engineering Measurements
• Revenue Forecast
• Trends by End User
• Competitive Environment
Strategic Observations and Conclusion
Which Way is the NDT Inspection Services Market Headed?
About Frost & Sullivan
Slides number
73
74
75
77
79
81
82
84
7N94C-30
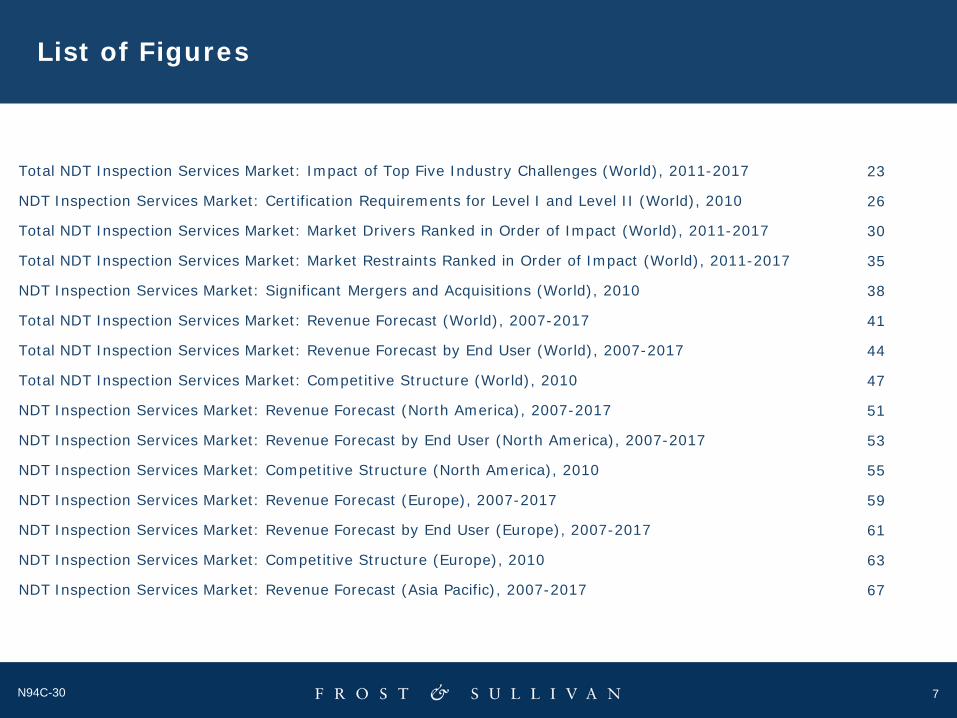
List of Figures
Total NDT Inspection Services Market: Impact of Top Five Industry Challenges (World), 2011-2017
NDT Inspection Services Market: Certification Requirements for Level I and Level II (World), 2010
Total NDT Inspection Services Market: Market Drivers Ranked in Order of Impact (World), 2011-2017
Total NDT Inspection Services Market: Market Restraints Ranked in Order of Impact (World), 2011-2017
NDT Inspection Services Market: Significant Mergers and Acquisitions (World), 2010
Total NDT Inspection Services Market: Revenue Forecast (World), 2007-2017
Total NDT Inspection Services Market: Revenue Forecast by End User (World), 2007-2017
Total NDT Inspection Services Market: Competitive Structure (World), 2010
NDT Inspection Services Market: Revenue Forecast (North America), 2007-2017
NDT Inspection Services Market: Revenue Forecast by End User (North America), 2007-2017
NDT Inspection Services Market: Competitive Structure (North America), 2010
NDT Inspection Services Market: Revenue Forecast (Europe), 2007-2017
NDT Inspection Services Market: Revenue Forecast by End User (Europe), 2007-2017
NDT Inspection Services Market: Competitive Structure (Europe), 2010
NDT Inspection Services Market: Revenue Forecast (Asia Pacific), 2007-2017
23
26
30
35
38
41
44
47
51
53
55
59
61
63
67
8N94C-30
List of Figures (Contd…)
NDT Inspection Services Market: Revenue Forecast by End User (Asia Pacific), 2007-2017
NDT Inspection Services Market: Competitive Structure (Asia Pacific), 2010
NDT Inspection Services Market: Revenue Forecast (ROW), 2007-2017
NDT Inspection Services Market: Revenue Forecast by End User (ROW), 2007-2017
NDT Inspection Services Market: Competitive Structure (ROW), 2010
69
71
75
77
79
9N94C-30
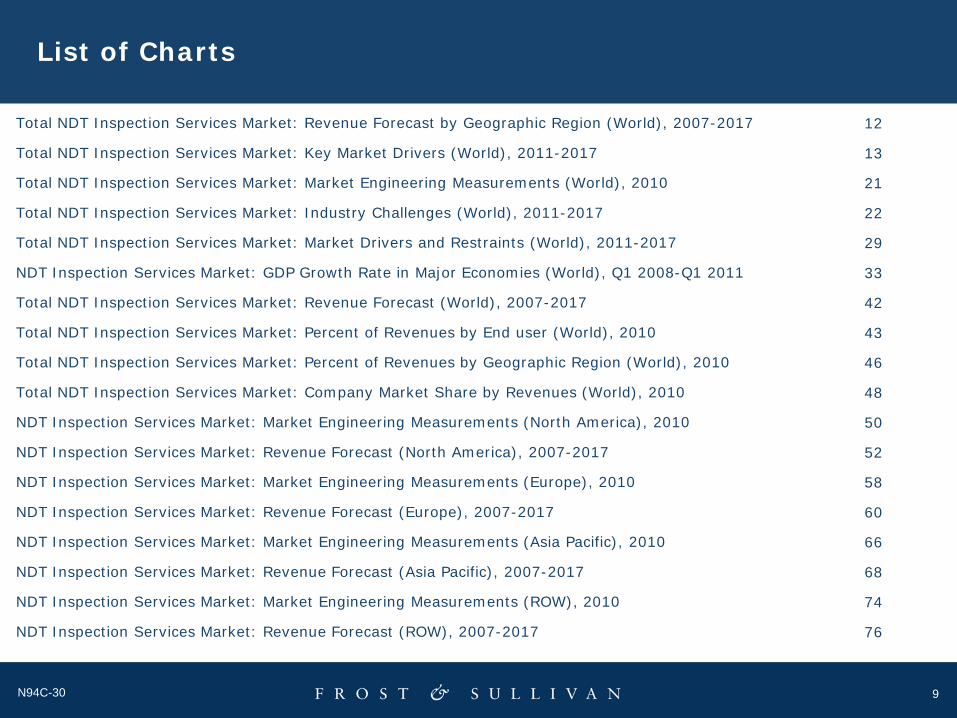
List of Charts
Total NDT Inspection Services Market: Revenue Forecast by Geographic Region (World), 2007-2017
Total NDT Inspection Services Market: Key Market Drivers (World), 2011-2017
Total NDT Inspection Services Market: Market Engineering Measurements (World), 2010
Total NDT Inspection Services Market: Industry Challenges (World), 2011-2017
Total NDT Inspection Services Market: Market Drivers and Restraints (World), 2011-2017
NDT Inspection Services Market: GDP Growth Rate in Major Economies (World), Q1 2008-Q1 2011
Total NDT Inspection Services Market: Revenue Forecast (World), 2007-2017
Total NDT Inspection Services Market: Percent of Revenues by End user (World), 2010
Total NDT Inspection Services Market: Percent of Revenues by Geographic Region (World), 2010
Total NDT Inspection Services Market: Company Market Share by Revenues (World), 2010
NDT Inspection Services Market: Market Engineering Measurements (North America), 2010
NDT Inspection Services Market: Revenue Forecast (North America), 2007-2017
NDT Inspection Services Market: Market Engineering Measurements (Europe), 2010
NDT Inspection Services Market: Revenue Forecast (Europe), 2007-2017
NDT Inspection Services Market: Market Engineering Measurements (Asia Pacific), 2010
NDT Inspection Services Market: Revenue Forecast (Asia Pacific), 2007-2017
NDT Inspection Services Market: Market Engineering Measurements (ROW), 2010
NDT Inspection Services Market: Revenue Forecast (ROW), 2007-2017
12
13
21
22
29
33
42
43
46
48
50
52
58
60
66
68
74
76

10N94C-30
Executive Summary
10
11N94C-30
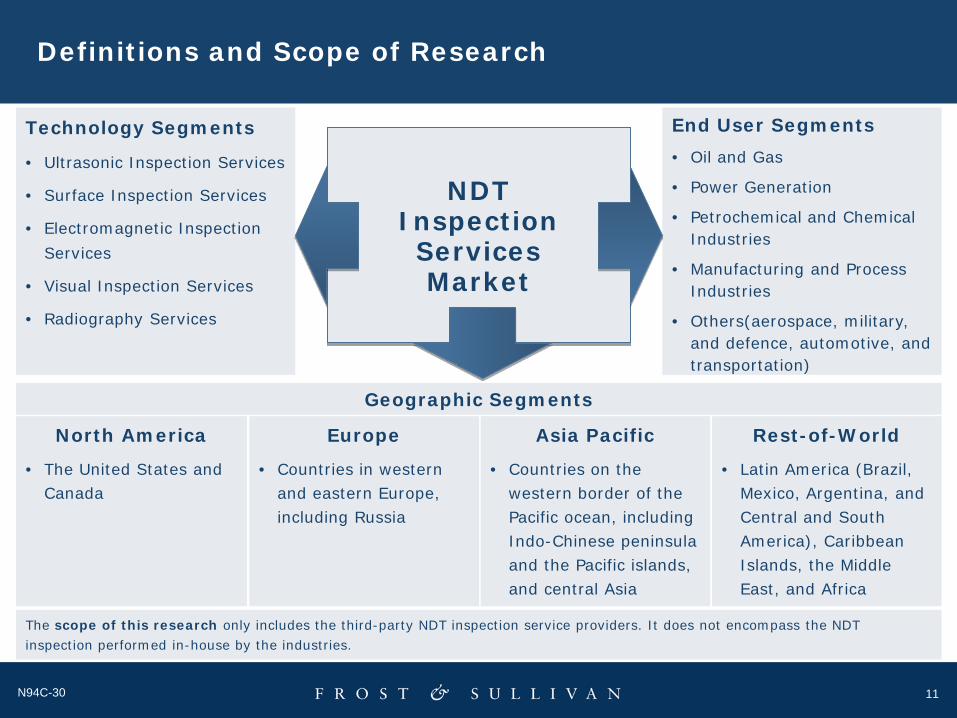
Definitions and Scope of Research
Technology Segments
• Ultrasonic Inspection Services
• Surface Inspection Services
• Electromagnetic Inspection Services
• Visual Inspection Services
• Radiography Services
End User Segments• Oil and Gas
• Power Generation
• Petrochemical and Chemical Industries
• Manufacturing and Process Industries
• Others(aerospace, military, and defence, automotive, and transportation)
Geographic Segments
North America
• The United States and Canada
Rest-of-World
• Latin America (Brazil, Mexico, Argentina, and Central and South America), Caribbean Islands, the Middle East, and Africa
Asia Pacific
• Countries on the western border of the Pacific ocean, including Indo-Chinese peninsula and the Pacific islands, and central Asia
Europe
• Countries in western and eastern Europe, including Russia
NDT Inspection Services Market
The scope of this research only includes the third-party NDT inspection service providers. It does not encompass the NDT inspection performed in-house by the industries.
12N94C-30
Growth Opportunities and Total Forecasts
600.0
1,600.0
2,600.0
3,600.0
4,600.0
5,600.0
6,600.0
2007 2008 2009 2010 2011 2012 2013 2014 2015 2016 2017
Rev
enue
s ($
Millio
n)
North America Europe Asia Pacif ic Rest-of-World
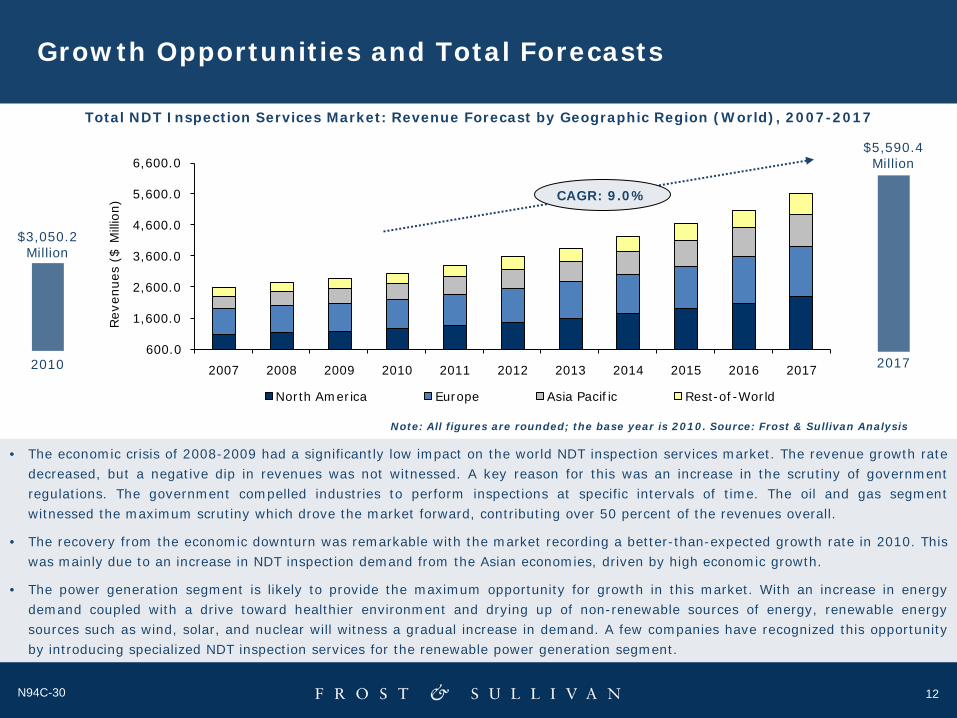
Total NDT Inspection Services Market: Revenue Forecast by Geographic Region (World), 2007-2017
• The economic crisis of 2008-2009 had a significantly low impact on the world NDT inspection services market. The revenue growth ratedecreased, but a negative dip in revenues was not witnessed. A key reason for this was an increase in the scrutiny of governmentregulations. The government compelled industries to perform inspections at specific intervals of time. The oil and gas segmentwitnessed the maximum scrutiny which drove the market forward, contributing over 50 percent of the revenues overall.
• The recovery from the economic downturn was remarkable with the market recording a better-than-expected growth rate in 2010. Thiswas mainly due to an increase in NDT inspection demand from the Asian economies, driven by high economic growth.
• The power generation segment is likely to provide the maximum opportunity for growth in this market. With an increase in energydemand coupled with a drive toward healthier environment and drying up of non-renewable sources of energy, renewable energysources such as wind, solar, and nuclear will witness a gradual increase in demand. A few companies have recognized this opportunityby introducing specialized NDT inspection services for the renewable power generation segment.
Note: All figures are rounded; the base year is 2010. Source: Frost & Sullivan Analysis
$3,050.2 Million
2010 2017
$5,590.4 Million
CAGR: 9.0%
13N94C-30
Key Market Drivers Summary
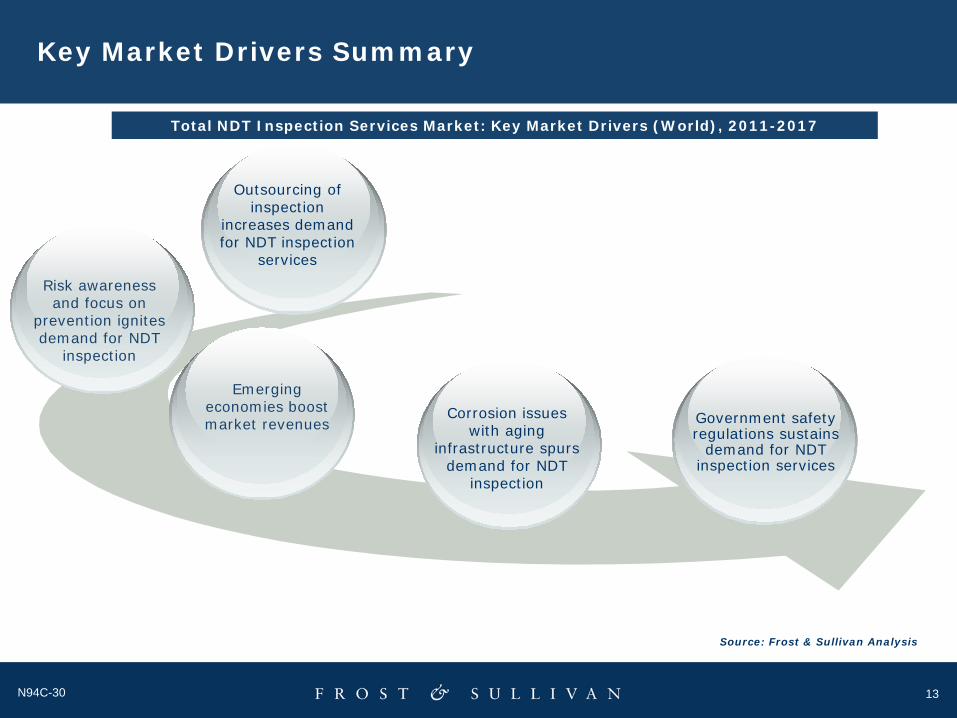
Source: Frost & Sullivan Analysis
Outsourcing of inspection
increases demand for NDT inspection
services
Corrosion issues with aging
infrastructure spurs demand for NDT
inspection
Emerging economies boost market revenues Government safety
regulations sustains demand for NDT
inspection services
Risk awareness and focus on
prevention ignites demand for NDT
inspection
Total NDT Inspection Services Market: Key Market Drivers (World), 2011-2017
14N94C-30
Trends
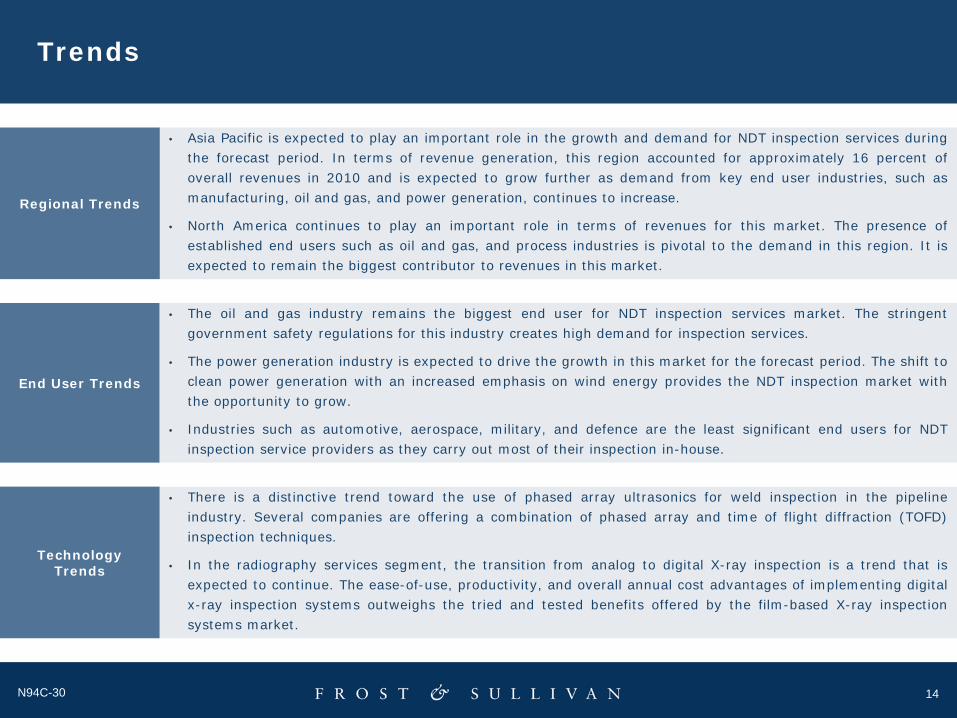
• Asia Pacific is expected to play an important role in the growth and demand for NDT inspection services duringthe forecast period. In terms of revenue generation, this region accounted for approximately 16 percent ofoverall revenues in 2010 and is expected to grow further as demand from key end user industries, such asmanufacturing, oil and gas, and power generation, continues to increase.
• North America continues to play an important role in terms of revenues for this market. The presence ofestablished end users such as oil and gas, and process industries is pivotal to the demand in this region. It isexpected to remain the biggest contributor to revenues in this market.
Regional Trends
End User Trends
• The oil and gas industry remains the biggest end user for NDT inspection services market. The stringentgovernment safety regulations for this industry creates high demand for inspection services.
• The power generation industry is expected to drive the growth in this market for the forecast period. The shift toclean power generation with an increased emphasis on wind energy provides the NDT inspection market withthe opportunity to grow.
• Industries such as automotive, aerospace, military, and defence are the least significant end users for NDTinspection service providers as they carry out most of their inspection in-house.
• There is a distinctive trend toward the use of phased array ultrasonics for weld inspection in the pipelineindustry. Several companies are offering a combination of phased array and time of flight diffraction (TOFD)inspection techniques.
• In the radiography services segment, the transition from analog to digital X-ray inspection is a trend that isexpected to continue. The ease-of-use, productivity, and overall annual cost advantages of implementing digitalx-ray inspection systems outweighs the tried and tested benefits offered by the film-based X-ray inspectionsystems market.
Technology Trends
15N94C-30
Key Market Participants
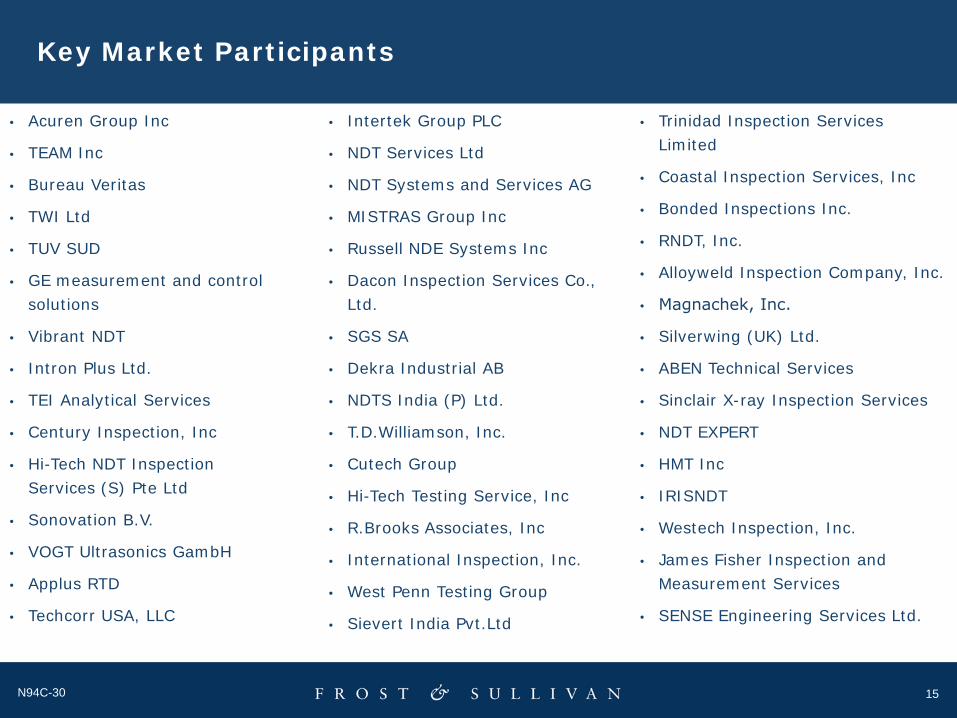
• Acuren Group Inc
• TEAM Inc
• Bureau Veritas
• TWI Ltd
• TUV SUD
• GE measurement and control solutions
• Vibrant NDT
• Intron Plus Ltd.
• TEI Analytical Services
• Century Inspection, Inc
• Hi-Tech NDT Inspection Services (S) Pte Ltd
• Sonovation B.V.
• VOGT Ultrasonics GambH
• Applus RTD
• Techcorr USA, LLC
• Intertek Group PLC
• NDT Services Ltd
• NDT Systems and Services AG
• MISTRAS Group Inc
• Russell NDE Systems Inc
• Dacon Inspection Services Co., Ltd.
• SGS SA
• Dekra Industrial AB
• NDTS India (P) Ltd.
• T.D.Williamson, Inc.
• Cutech Group
• Hi-Tech Testing Service, Inc
• R.Brooks Associates, Inc
• International Inspection, Inc.
• West Penn Testing Group
• Sievert India Pvt.Ltd
• Trinidad Inspection Services Limited
• Coastal Inspection Services, Inc
• Bonded Inspections Inc.
• RNDT, Inc.
• Alloyweld Inspection Company, Inc.
• Magnachek, Inс.
• Silverwing (UK) Ltd.
• ABEN Technical Services
• Sinclair X-ray Inspection Services
• NDT EXPERT
• HMT Inc
• IRISNDT
• Westech Inspection, Inc.
• James Fisher Inspection and Measurement Services
• SENSE Engineering Services Ltd.
16N94C-30
Key Market Participants (Contd…)
• Focus NDT
• ANKO AS
• Diversified NDT Inspection Services Pty. Ltd
• Independent Integrity Inspection Limited
• Trinity NDT
• DJA Inspection Services, Inc.
• Construction Technical Services Arabia Ltd
• Centurion NDT
• Axiom NDT and Offshore Services
• Wavelength NDT Ltd
• Advanced Quality Group, Inc.
• Applied Inspection Ltd
• Baker Testing Services, Inc.

17N94C-30
Total World NDT Inspection Services Market
17
18N94C-30
Market Overview and Definitions
The NDT inspection services market is very fragmented as there are no significant barriers to entry. Also, the initialinvestment required is considerably low. In 2010, the estimated number of active competitors in the world NDT inspectionservices market was over 1,000, with several companies set up regionally, catering to the needs of industries in theirrespective regions.
According to the United States Energy Information Administration (EIA), total world marketed energy consumption contractedby approximately 1.0 percent in 2008 and by an estimated 2.0 percent in 2009. Many new projects, especially for pipelineconstruction, were postponed or cancelled due to a lack of capital. Despite these short-term restraints, growth drivers such asageing infrastructure, safety, and compliance have offset the decline with the market showing slow but positive growth duringthe economic downturn.
Frost & Sullivan’s research indicates that the total world market for NDT inspection services in 2010 was $3,050.2 million witha positive growth rate of 7.0 percent. This market is expected to be valued at $5,590.4 million by 2017.
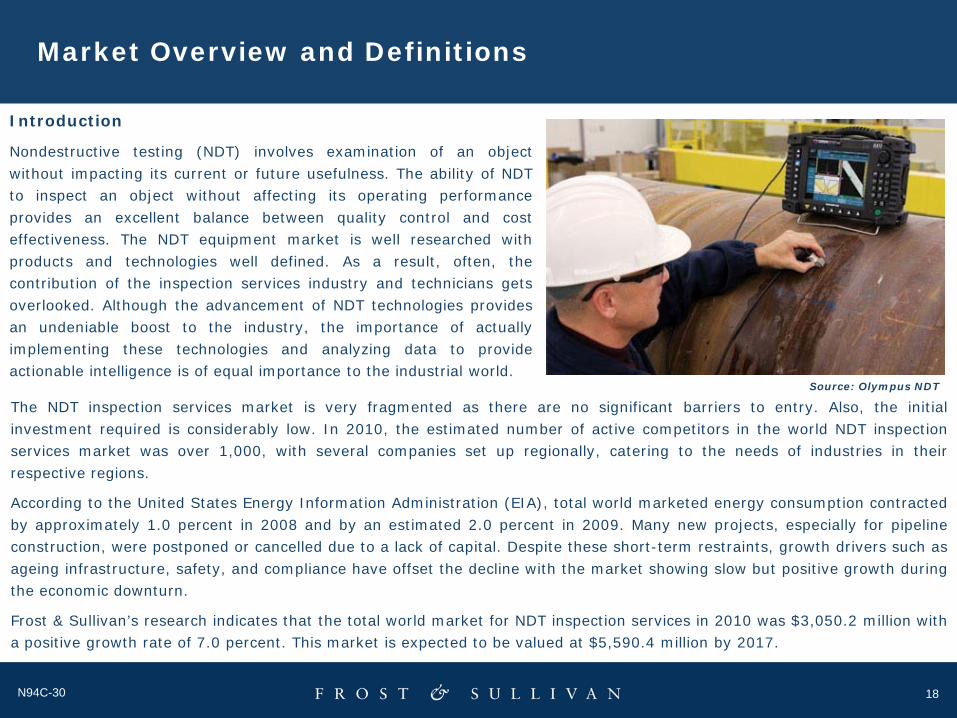
Introduction
Nondestructive testing (NDT) involves examination of an objectwithout impacting its current or future usefulness. The ability of NDTto inspect an object without affecting its operating performanceprovides an excellent balance between quality control and costeffectiveness. The NDT equipment market is well researched withproducts and technologies well defined. As a result, often, thecontribution of the inspection services industry and technicians getsoverlooked. Although the advancement of NDT technologies providesan undeniable boost to the industry, the importance of actuallyimplementing these technologies and analyzing data to provideactionable intelligence is of equal importance to the industrial world.
Source: Olympus NDT
19N94C-30
Market Overview and Definitions (Contd…)
Definitions
For the purpose of this study, the global nondestructive test (NDT) inspection services market has been segmented as:
• Ultrasonic inspection services
• Surface inspection services
• Electromagnetic inspection services
• Visual inspection services
• Radiography services
Ultrasonic inspection Services - Ultrasonic nondestructive testing has been used for over 50 years for a wide range of enduser applications ranging from evaluation of joints, weld inspection, and crack detection. For the purpose of this study, thescope of ultrasonic inspection methods encompasses ultrasonic testing and acoustic emission monitoring (AE).
Surface Inspection Services - For the purpose of this study, the scope of surface inspection methods encompasses liquidpenetrant inspection (LPI), dye penetrant inspection (DPI), and magnetic particle inspection (MPI).
Electromagnetic Inspection Services – For the purpose of this study, the scope of electromagnetic inspection comprises ofeddy current testing (ECT), remote field testing (RFT), magnetic flux leakage (MFL), and alternating current fieldmeasurement (ACFM).
Visual Inspection Services - Visual inspection is by far the most common and simplest NDT technique. For the purpose ofthis study, visual inspection is defined as the examination of surfaces using direct viewing or low magnification techniques.
Radiography Services - It is a method of inspecting materials for hidden flaws by using the ability of short X-rays andgamma rays to penetrate various materials. For the purpose of this study, radiography inspection market includes X-ray,gamma ray, real-time radiography, digital radiography, computed radiography (CR), and computed tomography (CT)inspection services.
20N94C-30
Market Overview and Definitions (Contd…)
This research service provides a global analysis of the NDT inspection services market. In addition, it also provides the totalmarket as well as a breakdown of revenues by four major geographic segments, including:
• North America – The United States and Canada.
• Europe – Countries in western and eastern Europe, including Russia.
• Asia Pacific – Countries on the western border of the Pacific ocean, including those on the Indo-Chinese peninsula and thePacific islands, and central Asia.
• Rest-of-World – Latin America (Brazil, Mexico, Argentina, and Central and South America) and regions not mentionedabove, particularly the Caribbean Islands, the Middle East, and Africa.
This research service also analyzes the total market and each of the segments from an end user perspective. The major endusers of NDT inspection services include:
• Oil and Gas – Includes refineries, both on-shore ad off-shore, and pipelines, both oil and gas.
• Power generation – Energy, utilities, co-generation, renewable and non-renewable power plants.
• Petrochemical and Chemical Industries– Includes ammonium plants, sodium, and other chemical plants.
• Manufacturing and Process Industries – Includes pulp and paper, pharmaceutical, rubber, cement, foundries, and other manufacturing plants.
• Others – Aerospace, military and defence, automotive, civil construction and transportation including railways and roadways.
Frost & Sullivan has not analyzed and broken down the world NDT inspection services market by technologiesbecause in any inspection procedure there is a combination of technologies used for inspection. As a result, theNDT inspection services providers generally provide all the NDT inspection service technologies.
21N94C-30
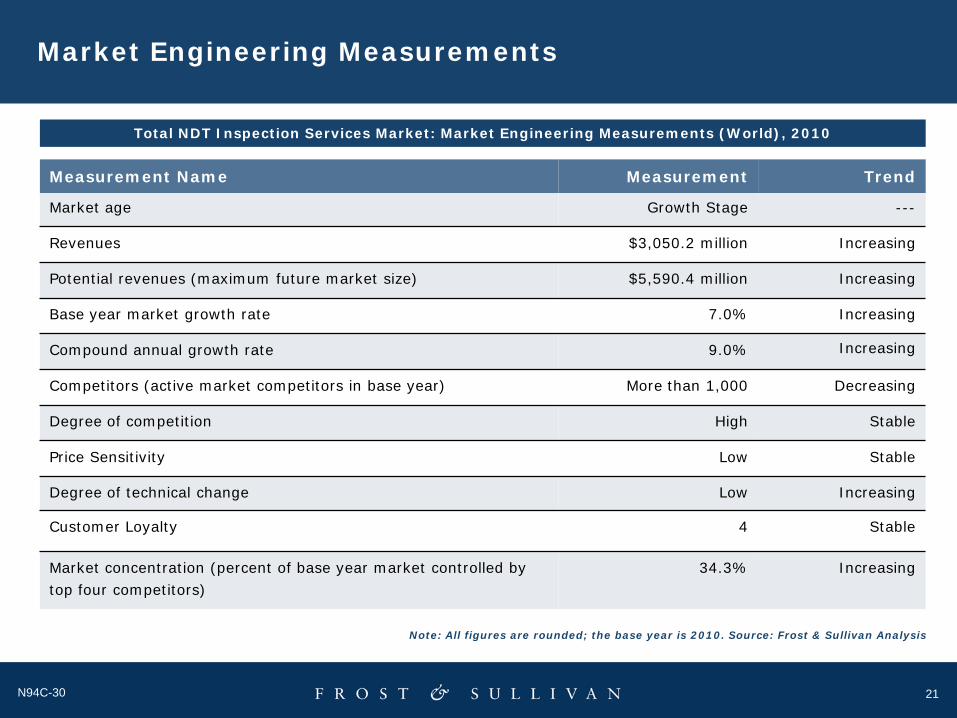
Market Engineering Measurements
Market age Growth Stage ---
Revenues $3,050.2 million Increasing
Potential revenues (maximum future market size) $5,590.4 million Increasing
Base year market growth rate 7.0% Increasing
Compound annual growth rate 9.0% Increasing
Competitors (active market competitors in base year) More than 1,000 Decreasing
Degree of competition High Stable
Price Sensitivity Low Stable
Degree of technical change Low Increasing
Customer Loyalty 4 Stable
Market concentration (percent of base year market controlled by top four competitors)
34.3% Increasing
Measurement Name Measurement Trend
Total NDT Inspection Services Market: Market Engineering Measurements (World), 2010
Note: All figures are rounded; the base year is 2010. Source: Frost & Sullivan Analysis
22N94C-30
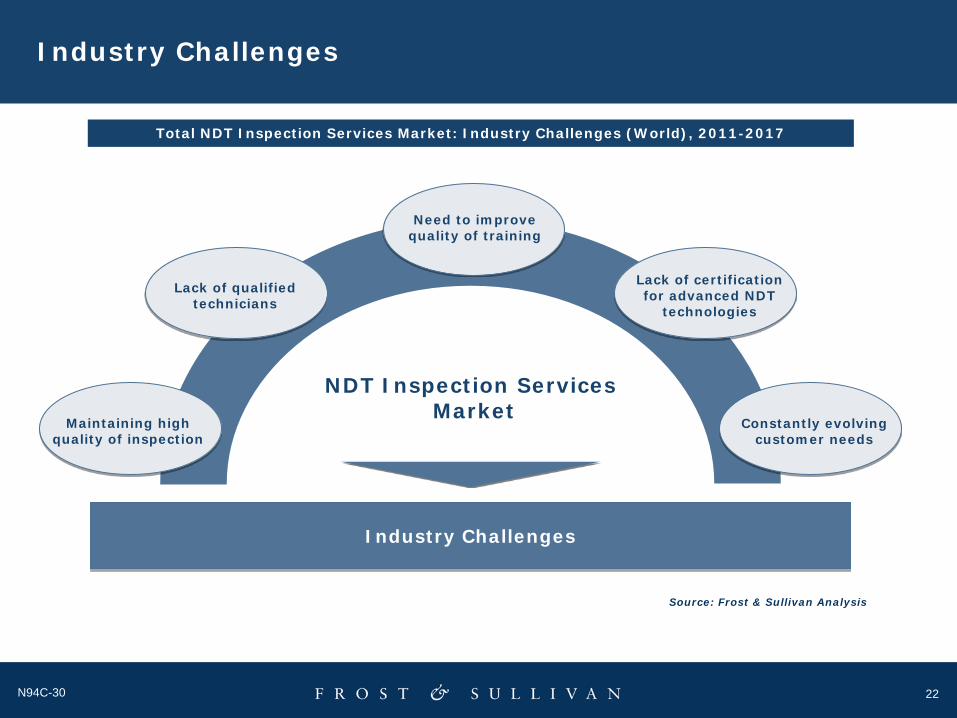
NDT Inspection ServicesMarket
Industry Challenges
Constantly evolving customer needs
Industry Challenges
Source: Frost & Sullivan Analysis
Total NDT Inspection Services Market: Industry Challenges (World), 2011-2017
Maintaining high quality of inspection
Lack of qualified technicians
Need to improve quality of training
Lack of certification for advanced NDT
technologies
23N94C-30
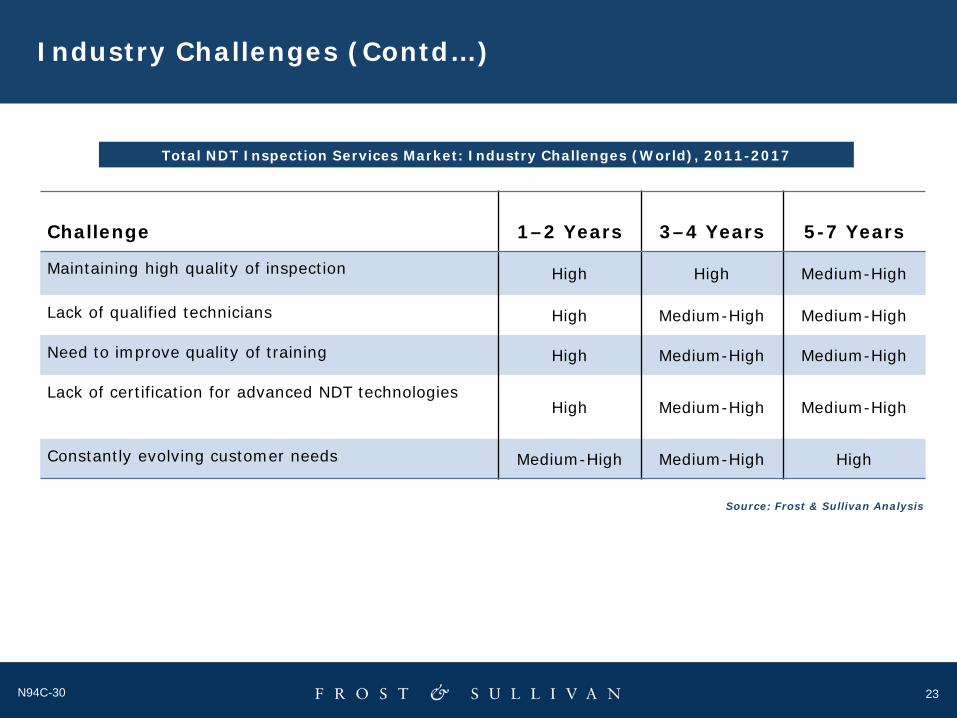
Industry Challenges (Contd…)
Challenge 1–2 Years 3–4 Years 5-7 Years
Maintaining high quality of inspection High High Medium-High
Lack of qualified technicians High Medium-High Medium-High
Need to improve quality of training High Medium-High Medium-High
Lack of certification for advanced NDT technologiesHigh Medium-High Medium-High
Constantly evolving customer needs Medium-High Medium-High High
Total NDT Inspection Services Market: Industry Challenges (World), 2011-2017
Source: Frost & Sullivan Analysis
24N94C-30
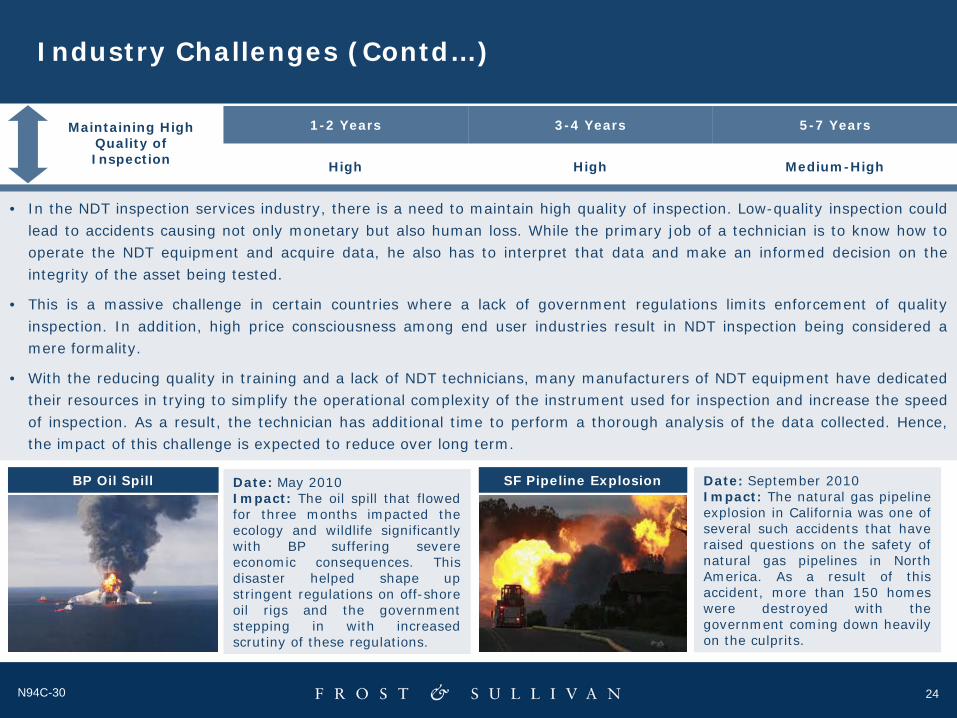
Industry Challenges (Contd…)
1-2 Years 3-4 Years 5-7 Years
High High Medium-High
• In the NDT inspection services industry, there is a need to maintain high quality of inspection. Low-quality inspection couldlead to accidents causing not only monetary but also human loss. While the primary job of a technician is to know how tooperate the NDT equipment and acquire data, he also has to interpret that data and make an informed decision on theintegrity of the asset being tested.
• This is a massive challenge in certain countries where a lack of government regulations limits enforcement of qualityinspection. In addition, high price consciousness among end user industries result in NDT inspection being considered amere formality.
• With the reducing quality in training and a lack of NDT technicians, many manufacturers of NDT equipment have dedicatedtheir resources in trying to simplify the operational complexity of the instrument used for inspection and increase the speedof inspection. As a result, the technician has additional time to perform a thorough analysis of the data collected. Hence,the impact of this challenge is expected to reduce over long term.
Maintaining High Quality of Inspection
BP Oil Spill Date: May 2010Impact: The oil spill that flowedfor three months impacted theecology and wildlife significantlywith BP suffering severeeconomic consequences. Thisdisaster helped shape upstringent regulations on off-shoreoil rigs and the governmentstepping in with increasedscrutiny of these regulations.
Date: September 2010Impact: The natural gas pipelineexplosion in California was one ofseveral such accidents that haveraised questions on the safety ofnatural gas pipelines in NorthAmerica. As a result of thisaccident, more than 150 homeswere destroyed with thegovernment coming down heavilyon the culprits.
SF Pipeline Explosion
25N94C-30
Industry Challenges (Contd…)
1-2 Years 3-4 Years 5-7 Years
High Medium-High Medium-High
Lack of Qualified Technicians
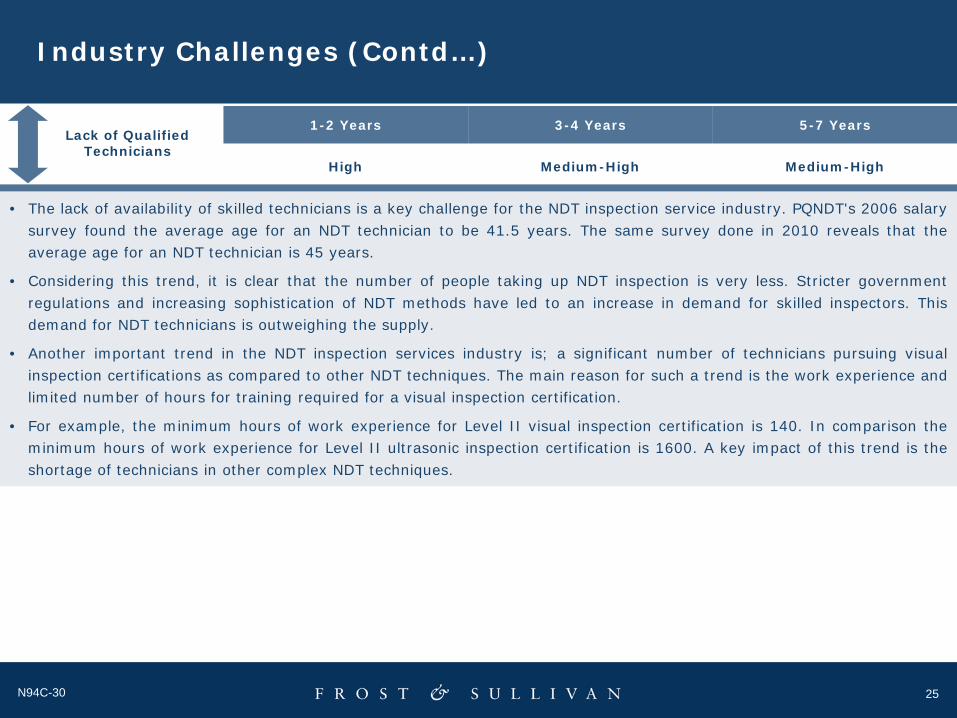
• The lack of availability of skilled technicians is a key challenge for the NDT inspection service industry. PQNDT's 2006 salarysurvey found the average age for an NDT technician to be 41.5 years. The same survey done in 2010 reveals that theaverage age for an NDT technician is 45 years.
• Considering this trend, it is clear that the number of people taking up NDT inspection is very less. Stricter governmentregulations and increasing sophistication of NDT methods have led to an increase in demand for skilled inspectors. Thisdemand for NDT technicians is outweighing the supply.
• Another important trend in the NDT inspection services industry is; a significant number of technicians pursuing visualinspection certifications as compared to other NDT techniques. The main reason for such a trend is the work experience andlimited number of hours for training required for a visual inspection certification.
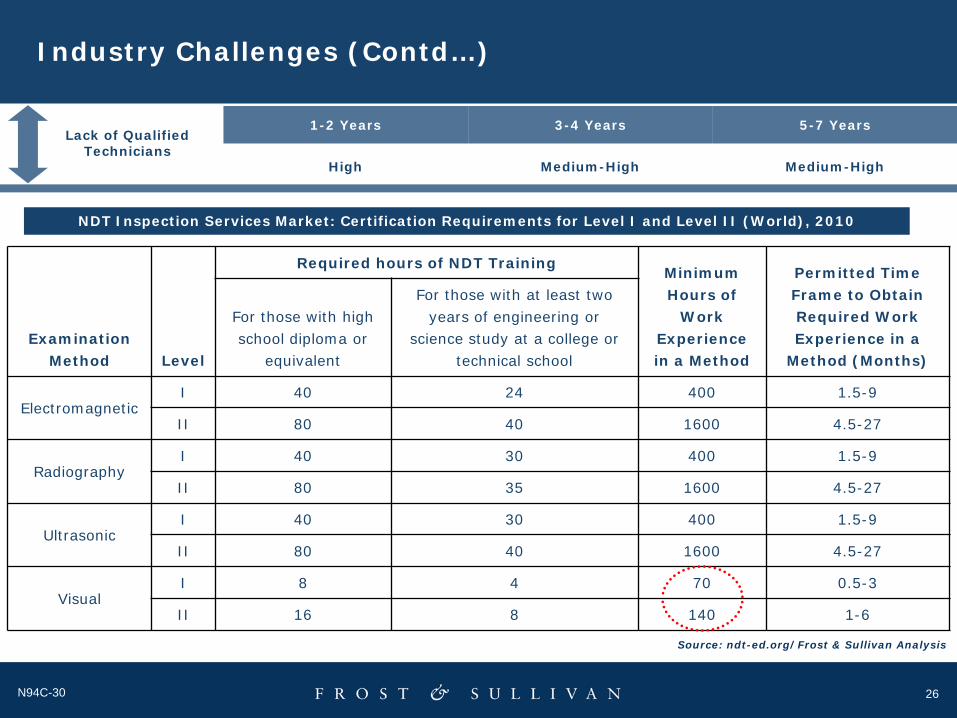
• For example, the minimum hours of work experience for Level II visual inspection certification is 140. In comparison theminimum hours of work experience for Level II ultrasonic inspection certification is 1600. A key impact of this trend is theshortage of technicians in other complex NDT techniques.
26N94C-30
Industry Challenges (Contd…)
1-2 Years 3-4 Years 5-7 Years
High Medium-High Medium-High
Lack of Qualified Technicians
Examination Method Level
Required hours of NDT Training Minimum Hours of
Work Experience in a Method
Permitted Time Frame to Obtain Required Work Experience in a
Method (Months)
For those with high school diploma or
equivalent
For those with at least two years of engineering or
science study at a college or technical school
ElectromagneticI 40 24 400 1.5-9
II 80 40 1600 4.5-27
RadiographyI 40 30 400 1.5-9
II 80 35 1600 4.5-27
UltrasonicI 40 30 400 1.5-9
II 80 40 1600 4.5-27
VisualI 8 4 70 0.5-3
II 16 8 140 1-6
NDT Inspection Services Market: Certification Requirements for Level I and Level II (World), 2010
Source: ndt-ed.org/Frost & Sullivan Analysis
27N94C-30
Industry Challenges (Contd…)
1-2 Years 3-4 Years 5-7 Years
High Medium-High Medium-High
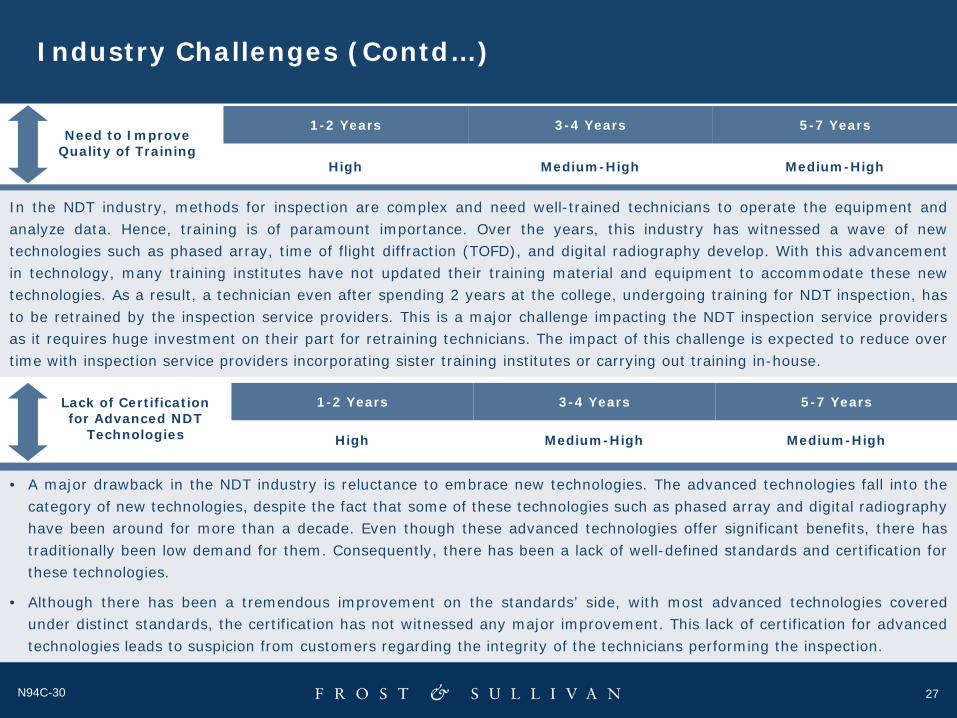
In the NDT industry, methods for inspection are complex and need well-trained technicians to operate the equipment andanalyze data. Hence, training is of paramount importance. Over the years, this industry has witnessed a wave of newtechnologies such as phased array, time of flight diffraction (TOFD), and digital radiography develop. With this advancementin technology, many training institutes have not updated their training material and equipment to accommodate these newtechnologies. As a result, a technician even after spending 2 years at the college, undergoing training for NDT inspection, hasto be retrained by the inspection service providers. This is a major challenge impacting the NDT inspection service providersas it requires huge investment on their part for retraining technicians. The impact of this challenge is expected to reduce overtime with inspection service providers incorporating sister training institutes or carrying out training in-house.
• A major drawback in the NDT industry is reluctance to embrace new technologies. The advanced technologies fall into thecategory of new technologies, despite the fact that some of these technologies such as phased array and digital radiographyhave been around for more than a decade. Even though these advanced technologies offer significant benefits, there hastraditionally been low demand for them. Consequently, there has been a lack of well-defined standards and certification forthese technologies.
• Although there has been a tremendous improvement on the standards’ side, with most advanced technologies coveredunder distinct standards, the certification has not witnessed any major improvement. This lack of certification for advancedtechnologies leads to suspicion from customers regarding the integrity of the technicians performing the inspection.
High Medium-High Medium-High
1-2 Years 3-4 Years 5-7 YearsLack of Certification for Advanced NDT
Technologies
Need to Improve Quality of Training

28N94C-30
Industry Challenges (Contd…)
1-2 Years 3-4 Years 5-7 Years
Medium-High Medium-High High
• Around the world, there have been questions raised regarding the future of energy supplies. These questions ariseespecially due to the concerns surrounding impact of global warming. Global warming is caused by excessive greenhousegas emission. The largest producers of these gases are thermal power plants. According to the EIA International EnergyOutlook 2010, the world marketed energy consumption is likely to increase by 49.0 percent from 2007 to 2035. Thereneeds to be a balance between addressing this demand for energy and trying to decrease the emission of greenhousegases. As a result, there has been a major push towards power generation from renewable energy sources such as wind,solar, and hydroelectric.
• Wind energy has witnessed rapid development in Europe, especially in Germany, Spain, and Denmark. Wind energy poses alot of difficulties toward NDT inspection as there is a lack of standardized methods for testing turbine blades and turbinetowers. On the solar side, photovoltaics have huge potential to generate power in sunnier countries. NDT on PV materials iscarried out on a micro-scale.
• With the advent of power generation from renewable sources of energy, technologies, methods and standards have alsohad to evolve, which poses a challenge for NDT inspection industry in trying to keep pace with ever-changing consumerneeds.
Constantly Evolving Customer
Needs
29N94C-30
Mar
ket D
river
sM
arke
t Res
trai
nts
Low
High
Low
High
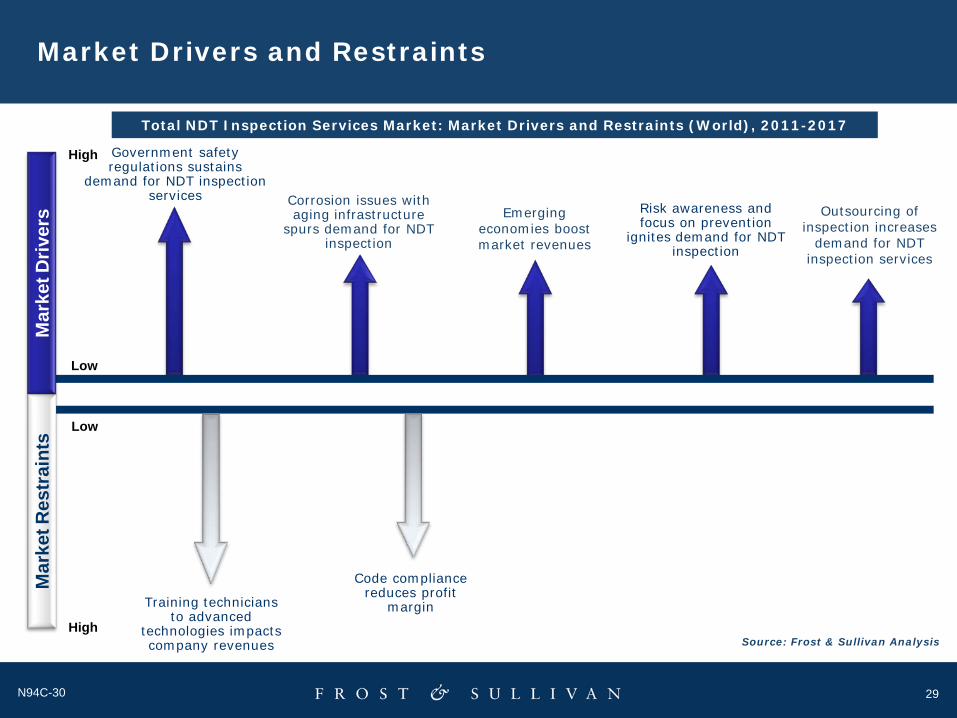
Market Drivers and Restraints
Source: Frost & Sullivan Analysis
Corrosion issues with aging infrastructure
spurs demand for NDT inspection
Government safety regulations sustains
demand for NDT inspection services
Risk awareness and focus on prevention
ignites demand for NDT inspection
Outsourcing of inspection increases
demand for NDT inspection services
Emerging economies boost market revenues
Code compliance reduces profit
marginTraining technicians to advanced
technologies impacts company revenues
Total NDT Inspection Services Market: Market Drivers and Restraints (World), 2011-2017
30N94C-30
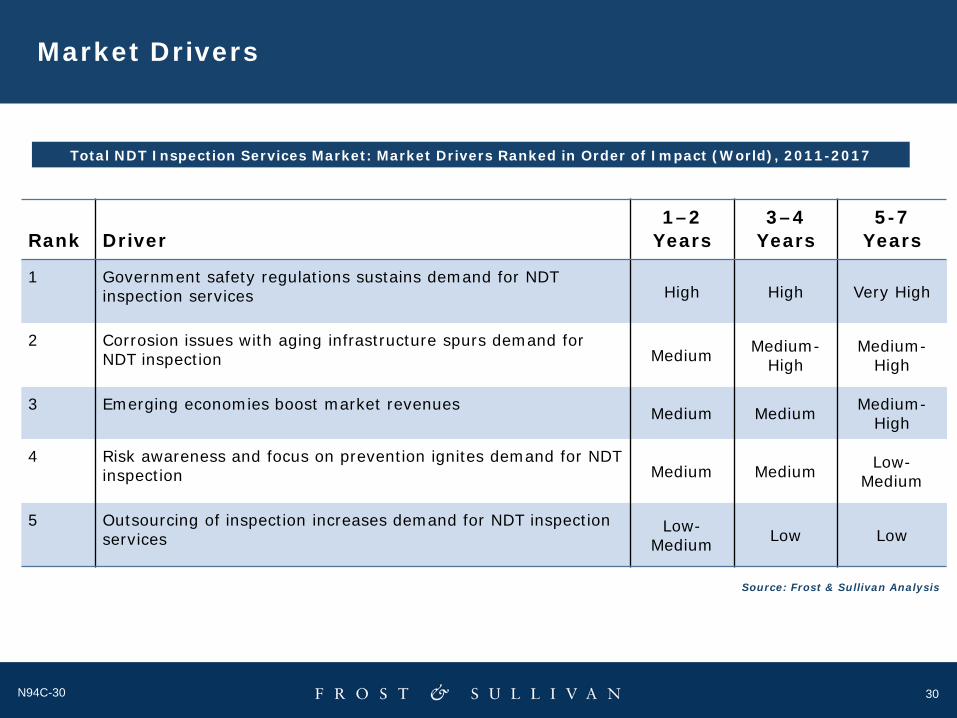
Market Drivers
Rank Driver1–2
Years3–4
Years5-7
Years
1 Government safety regulations sustains demand for NDT inspection services High High Very High
2 Corrosion issues with aging infrastructure spurs demand for NDT inspection Medium Medium-
HighMedium-
High
3 Emerging economies boost market revenues Medium Medium Medium-High
4 Risk awareness and focus on prevention ignites demand for NDT inspection Medium Medium Low-
Medium
5 Outsourcing of inspection increases demand for NDT inspection services
Low-Medium Low Low
Source: Frost & Sullivan Analysis
Total NDT Inspection Services Market: Market Drivers Ranked in Order of Impact (World), 2011-2017
31N94C-30
Market Drivers (Contd…)
1-2 Years 3-4 Years 5-7 Years
High High Very High
Government Safety Regulations Sustains
Demand for NDT Inspection Services
• Compliance-driven inspection due to the strict government regulations is a key driver for the NDT inspection servicesindustry. With accidents such as the British Petroleum (BP) oil spill in the Gulf of Mexico and the pipeline explosion inCalifornia coming under severe public and media scrutiny, there has been increased focus on inspection performed,especially in refineries, pipelines, and off shore oil rigs.
• The existing regulations have become stringent to cover a wide net of industries and there has been an increase in theamount of inspection that needs to be done irrespective of financial viability. These stringent regulations aided in strongperformance for the world NDT inspection services market, despite the economic downturn. Although there was less newconstruction and few projects were stalled. the need for compliance with government safety regulations negated any factorsinhibiting growth.
32N94C-30
Market Drivers (Contd…)
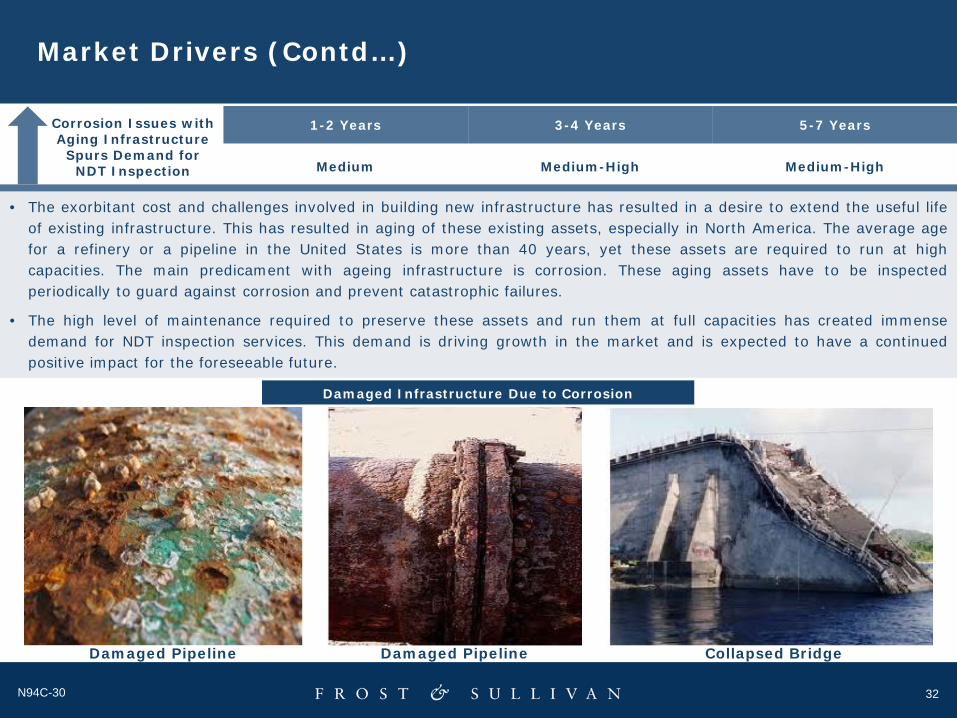
1-2 Years 3-4 Years 5-7 Years
Medium Medium-High Medium-High
Corrosion Issues with Aging Infrastructure
Spurs Demand for NDT Inspection
• The exorbitant cost and challenges involved in building new infrastructure has resulted in a desire to extend the useful lifeof existing infrastructure. This has resulted in aging of these existing assets, especially in North America. The average agefor a refinery or a pipeline in the United States is more than 40 years, yet these assets are required to run at highcapacities. The main predicament with ageing infrastructure is corrosion. These aging assets have to be inspectedperiodically to guard against corrosion and prevent catastrophic failures.
• The high level of maintenance required to preserve these assets and run them at full capacities has created immensedemand for NDT inspection services. This demand is driving growth in the market and is expected to have a continuedpositive impact for the foreseeable future.
Damaged Infrastructure Due to Corrosion
Damaged Pipeline Damaged Pipeline Collapsed Bridge
33N94C-30
Market Drivers (Contd…)
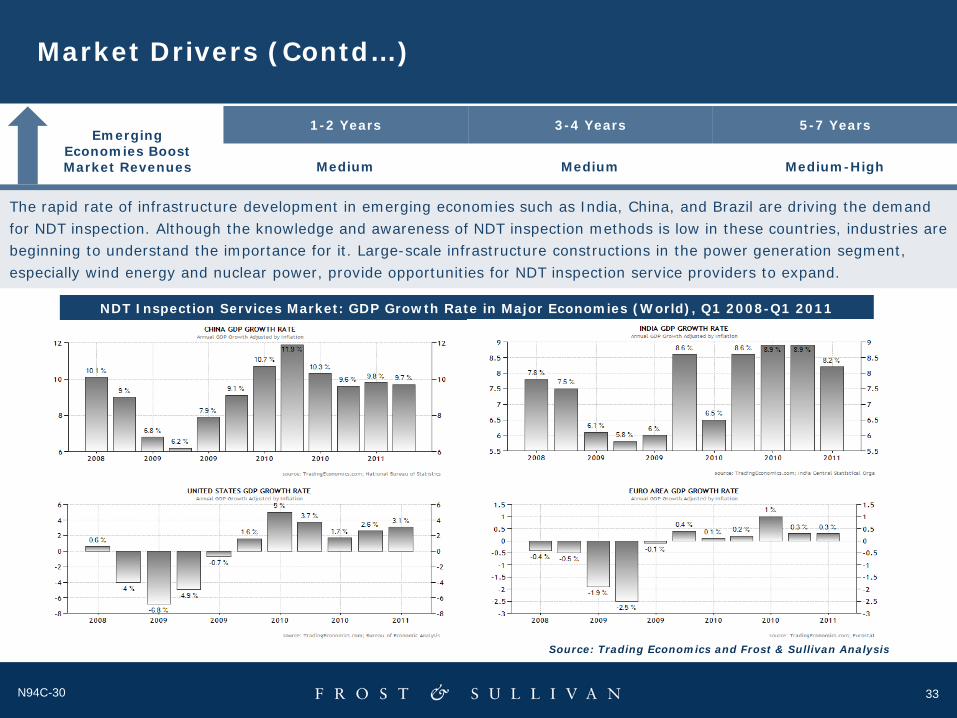
1-2 Years 3-4 Years 5-7 Years
Medium Medium Medium-High
Emerging Economies Boost Market Revenues
The rapid rate of infrastructure development in emerging economies such as India, China, and Brazil are driving the demand for NDT inspection. Although the knowledge and awareness of NDT inspection methods is low in these countries, industries are beginning to understand the importance for it. Large-scale infrastructure constructions in the power generation segment, especially wind energy and nuclear power, provide opportunities for NDT inspection service providers to expand.
Source: Trading Economics and Frost & Sullivan Analysis
NDT Inspection Services Market: GDP Growth Rate in Major Economies (World), Q1 2008-Q1 2011
34N94C-30
Market Drivers (Contd…)
1-2 Years 3-4 Years 5-7 Years
Medium Medium Low-Medium
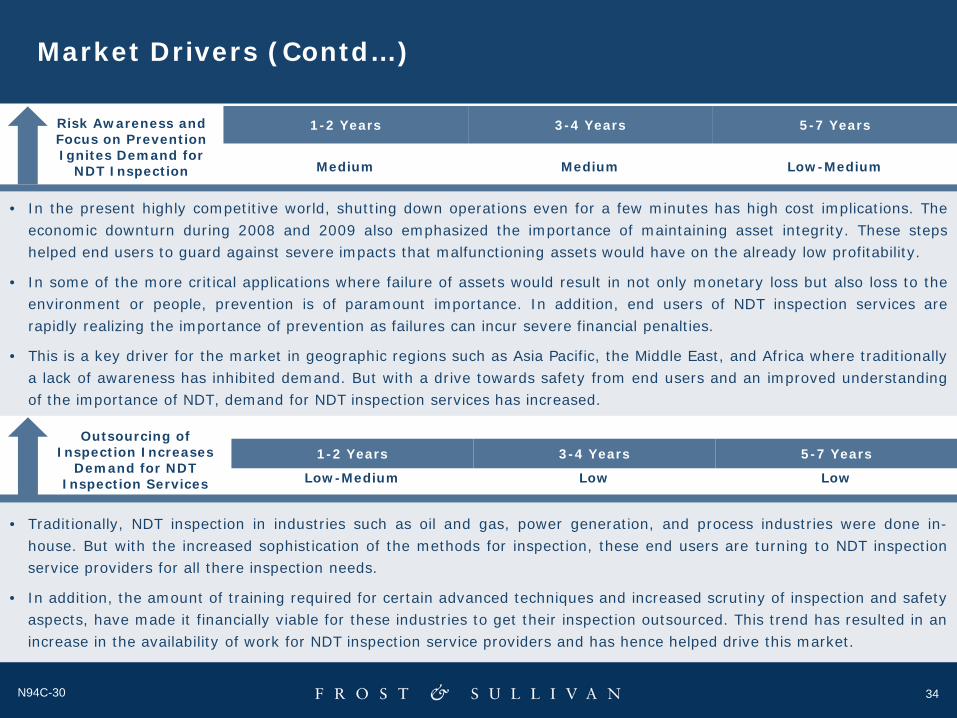
• In the present highly competitive world, shutting down operations even for a few minutes has high cost implications. Theeconomic downturn during 2008 and 2009 also emphasized the importance of maintaining asset integrity. These stepshelped end users to guard against severe impacts that malfunctioning assets would have on the already low profitability.
• In some of the more critical applications where failure of assets would result in not only monetary loss but also loss to theenvironment or people, prevention is of paramount importance. In addition, end users of NDT inspection services arerapidly realizing the importance of prevention as failures can incur severe financial penalties.
• This is a key driver for the market in geographic regions such as Asia Pacific, the Middle East, and Africa where traditionallya lack of awareness has inhibited demand. But with a drive towards safety from end users and an improved understandingof the importance of NDT, demand for NDT inspection services has increased.
• Traditionally, NDT inspection in industries such as oil and gas, power generation, and process industries were done in-house. But with the increased sophistication of the methods for inspection, these end users are turning to NDT inspectionservice providers for all there inspection needs.
• In addition, the amount of training required for certain advanced techniques and increased scrutiny of inspection and safetyaspects, have made it financially viable for these industries to get their inspection outsourced. This trend has resulted in anincrease in the availability of work for NDT inspection service providers and has hence helped drive this market.
Low-Medium Low Low
1-2 Years 3-4 Years 5-7 YearsOutsourcing of
Inspection Increases Demand for NDT
Inspection Services
Risk Awareness and Focus on Prevention Ignites Demand for
NDT Inspection
35N94C-30
Market Restraints
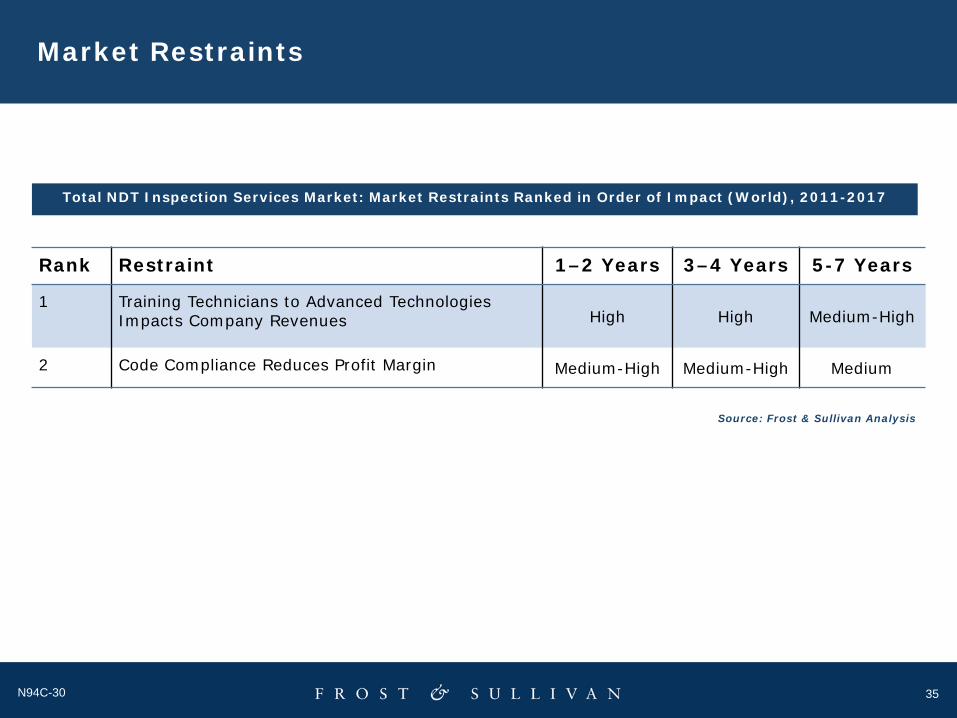
Rank Restraint 1–2 Years 3–4 Years 5-7 Years
1 Training Technicians to Advanced Technologies Impacts Company Revenues High High Medium-High
2 Code Compliance Reduces Profit Margin Medium-High Medium-High Medium
Source: Frost & Sullivan Analysis
Total NDT Inspection Services Market: Market Restraints Ranked in Order of Impact (World), 2011-2017
36N94C-30
Market Restraints (Contd…)
1-2 Years 3-4 Years 5-7 Years
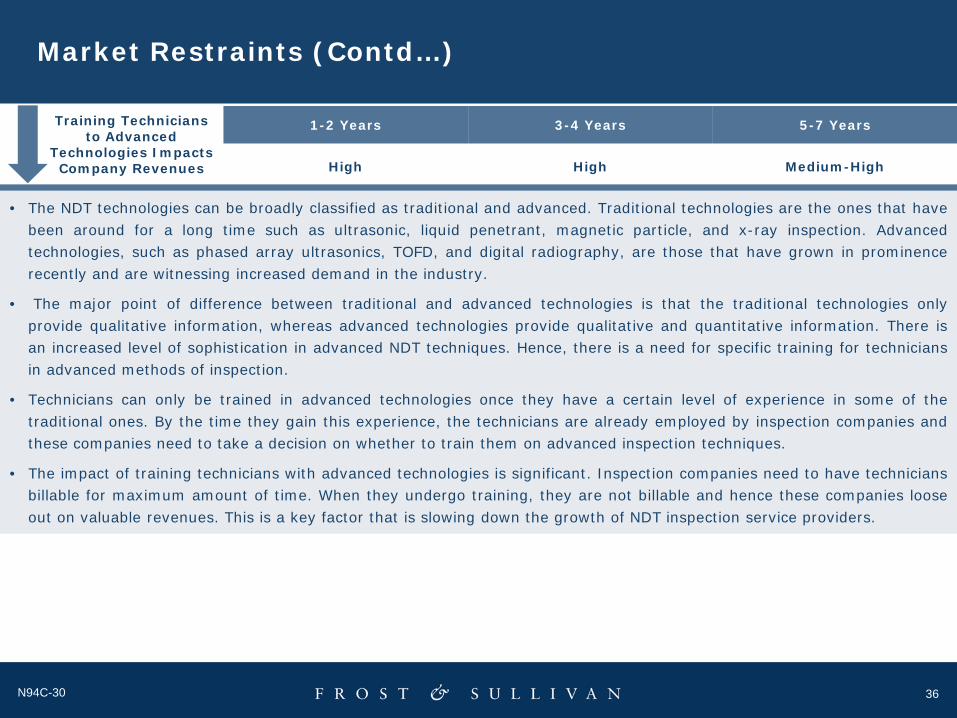
High High Medium-High
Training Technicians to Advanced
Technologies Impacts Company Revenues
• The NDT technologies can be broadly classified as traditional and advanced. Traditional technologies are the ones that havebeen around for a long time such as ultrasonic, liquid penetrant, magnetic particle, and x-ray inspection. Advancedtechnologies, such as phased array ultrasonics, TOFD, and digital radiography, are those that have grown in prominencerecently and are witnessing increased demand in the industry.
• The major point of difference between traditional and advanced technologies is that the traditional technologies onlyprovide qualitative information, whereas advanced technologies provide qualitative and quantitative information. There isan increased level of sophistication in advanced NDT techniques. Hence, there is a need for specific training for techniciansin advanced methods of inspection.
• Technicians can only be trained in advanced technologies once they have a certain level of experience in some of thetraditional ones. By the time they gain this experience, the technicians are already employed by inspection companies andthese companies need to take a decision on whether to train them on advanced inspection techniques.
• The impact of training technicians with advanced technologies is significant. Inspection companies need to have techniciansbillable for maximum amount of time. When they undergo training, they are not billable and hence these companies looseout on valuable revenues. This is a key factor that is slowing down the growth of NDT inspection service providers.
37N94C-30
Market Restraints (Contd…)
1-2 Years 3-4 Years 5-7 Years
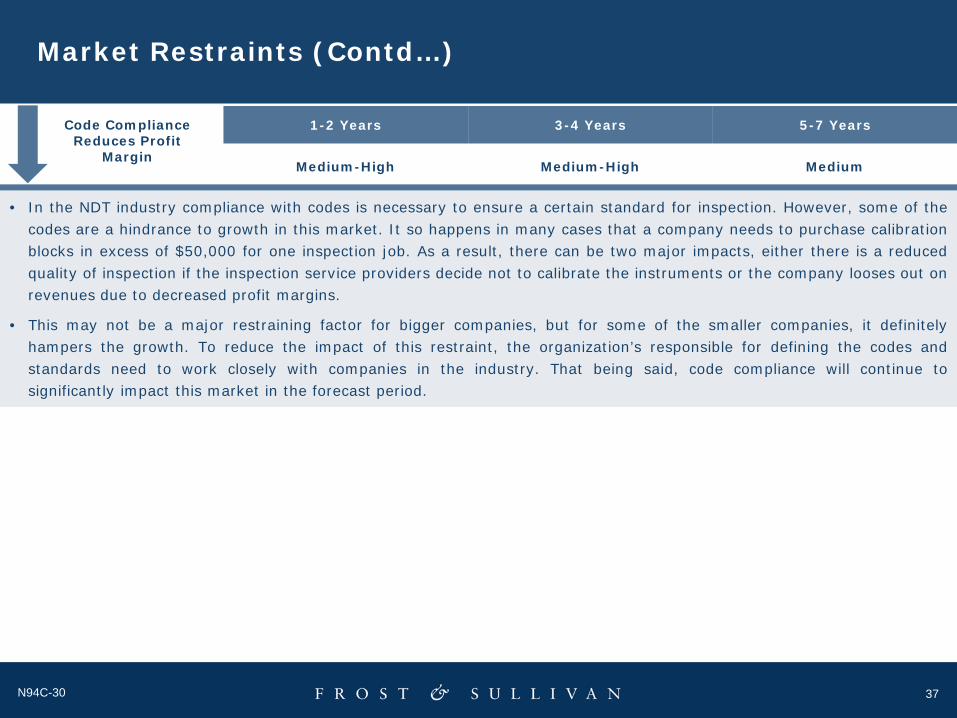
Medium-High Medium-High Medium
Code Compliance Reduces Profit
Margin
• In the NDT industry compliance with codes is necessary to ensure a certain standard for inspection. However, some of thecodes are a hindrance to growth in this market. It so happens in many cases that a company needs to purchase calibrationblocks in excess of $50,000 for one inspection job. As a result, there can be two major impacts, either there is a reducedquality of inspection if the inspection service providers decide not to calibrate the instruments or the company looses out onrevenues due to decreased profit margins.
• This may not be a major restraining factor for bigger companies, but for some of the smaller companies, it definitelyhampers the growth. To reduce the impact of this restraint, the organization’s responsible for defining the codes andstandards need to work closely with companies in the industry. That being said, code compliance will continue tosignificantly impact this market in the forecast period.
38N94C-30
Market Trends
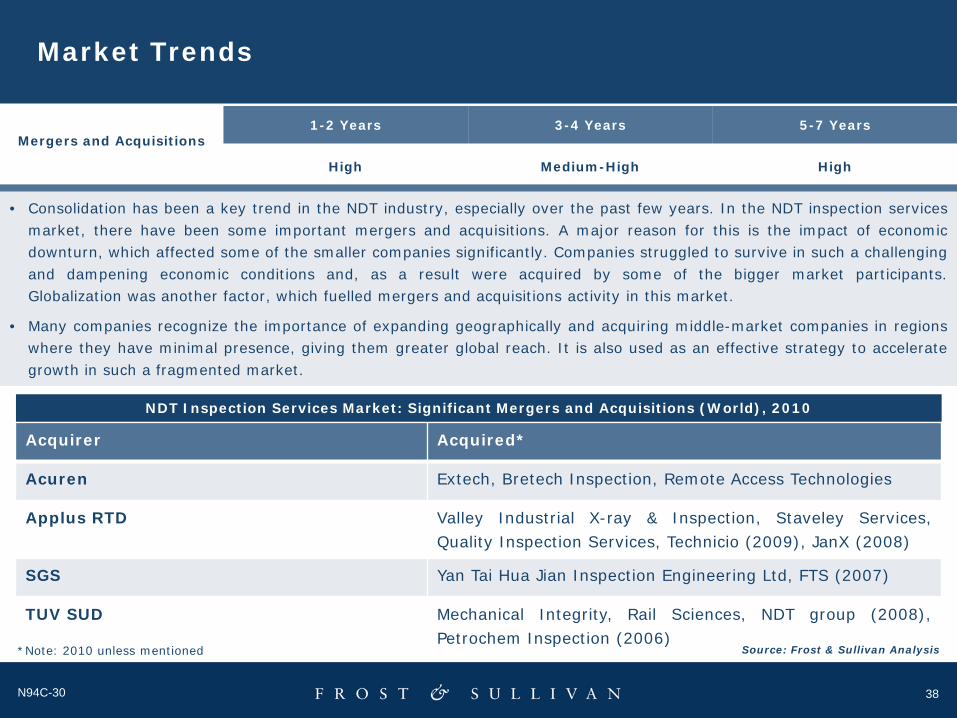
1-2 Years 3-4 Years 5-7 Years
High Medium-High High
Mergers and Acquisitions
• Consolidation has been a key trend in the NDT industry, especially over the past few years. In the NDT inspection servicesmarket, there have been some important mergers and acquisitions. A major reason for this is the impact of economicdownturn, which affected some of the smaller companies significantly. Companies struggled to survive in such a challengingand dampening economic conditions and, as a result were acquired by some of the bigger market participants.Globalization was another factor, which fuelled mergers and acquisitions activity in this market.
• Many companies recognize the importance of expanding geographically and acquiring middle-market companies in regionswhere they have minimal presence, giving them greater global reach. It is also used as an effective strategy to accelerategrowth in such a fragmented market.
Acquirer Acquired*
Acuren Extech, Bretech Inspection, Remote Access Technologies
Applus RTD Valley Industrial X-ray & Inspection, Staveley Services,Quality Inspection Services, Technicio (2009), JanX (2008)
SGS Yan Tai Hua Jian Inspection Engineering Ltd, FTS (2007)
TUV SUD Mechanical Integrity, Rail Sciences, NDT group (2008),Petrochem Inspection (2006)
NDT Inspection Services Market: Significant Mergers and Acquisitions (World), 2010
Source: Frost & Sullivan Analysis*Note: 2010 unless mentioned
39N94C-30
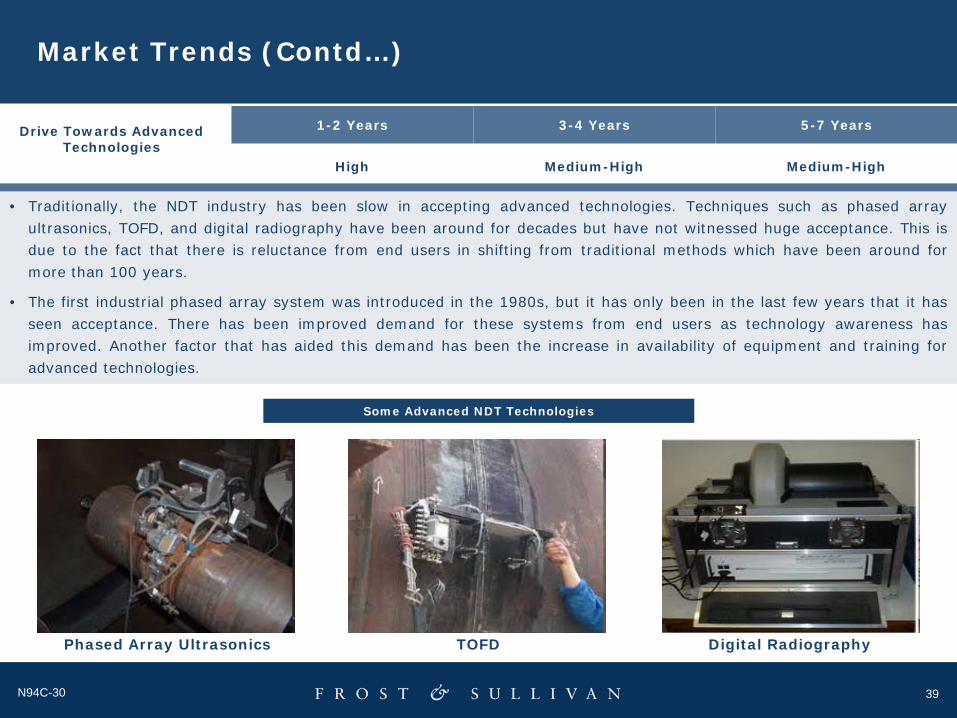
Market Trends (Contd…)
• Traditionally, the NDT industry has been slow in accepting advanced technologies. Techniques such as phased arrayultrasonics, TOFD, and digital radiography have been around for decades but have not witnessed huge acceptance. This isdue to the fact that there is reluctance from end users in shifting from traditional methods which have been around formore than 100 years.
• The first industrial phased array system was introduced in the 1980s, but it has only been in the last few years that it hasseen acceptance. There has been improved demand for these systems from end users as technology awareness hasimproved. Another factor that has aided this demand has been the increase in availability of equipment and training foradvanced technologies.
Drive Towards Advanced Technologies
High Medium-High Medium-High
1-2 Years 3-4 Years 5-7 Years
Phased Array Ultrasonics TOFD Digital Radiography
Some Advanced NDT Technologies
40N94C-30
Technology Trends
• The NDT technologies can be broadly categorized as:-
1. Traditional NDT techniques
2. Advanced NDT techniques
• Traditional NDT Techniques – These are basic techniques that have been in use for a long time. The main techniquesunder traditional NDT are ultrasonic, visual, surface, and radiography. These services are generally offered by all the NDTinspection service providers as they form the base of any inspection. As these techniques are around for a large period oftime, they have well-defined standards and training certification courses.
• Advanced NDT Techniques – These are derived from traditional NDT techniques but are more complex in nature. Theyhave been developed and improved quite recently and hence are not in demand heavily. As a result, all of these techniquesare not offered by NDT inspection service providers. It depends on the availability of highly trained technicians and thedemand from the customers. Some of the main techniques covered under this category are remote field testing, phasedarray ultrasonics, time of flight diffraction (TOFD), alternating current field measurement, guided wave ultrasonics, andmagnetic flux leakage. These are some of the more popular advanced techniques.
• There are many niche technologies as well provided by specialized NDT inspection service providers. One such technologyis process compensated resonance testing. This technique is offered by Vibrant NDT, mainly to the aerospace andautomotive segments.
• Most end users of NDT inspection services use a combination of technologies to meet their inspection needs. The structureor the unit under test is assessed and then a technology or a combination of technologies is recommended for NDTinspection.

41N94C-30
Revenue Forecast
YearRevenue
($ Million)
RevenueGrowth Rate
(%)
2007 2,568.5 ---
2008 2,738.4 6.6
2009 2,850.7 4.1
2010 3,050.2 7.0
2011 3,283.7 7.7
2012 3,555.4 8.3
2013 3,856.9 8.5
2014 4,208.2 9.1
2015 4,609.8 9.5
2016 5,067.4 9.9
2017 5,590.4 10.3
Compound Annual Growth Rate (2010-2017): 9.0%
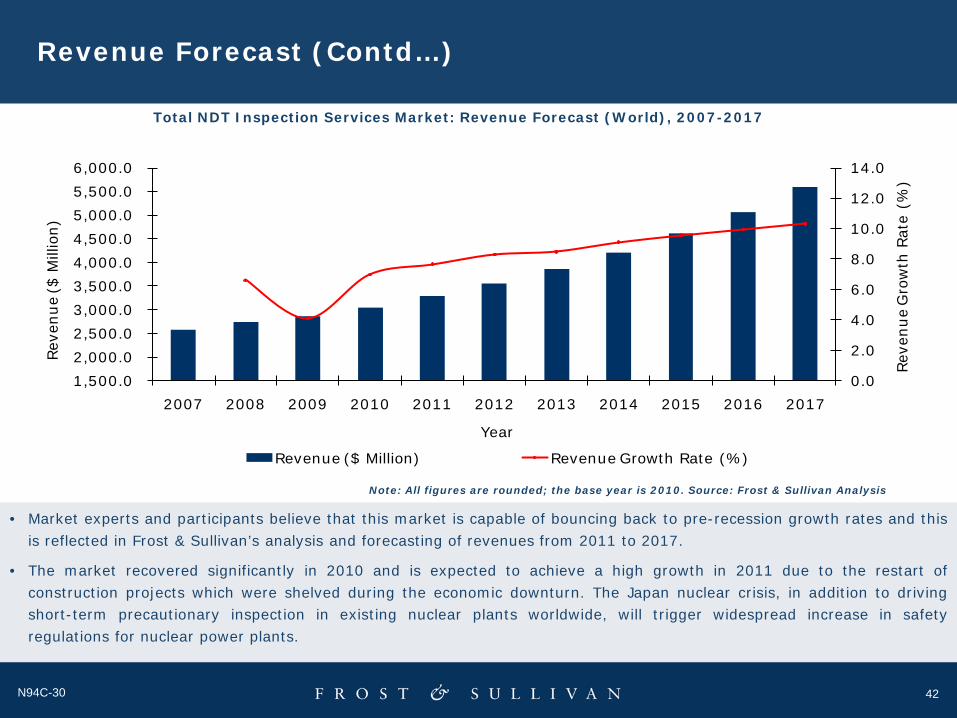
Total NDT Inspection Services Market: Revenue Forecast (World), 2007-2017
Note: All figures are rounded; the base year is 2010.Source: Frost & Sullivan Analysis
• The global economic downturn that hit in late 2008impacted the revenue growth rate of this market. Capitalexpenditure cuts and review of inspection budgetsadversely affected the growth of third-party NDT inspectionservice providers. In 2008, the market witnessed a badending to a possibly good year in terms of revenues. Frost& Sullivan’s analysis shows that the market grew by 6.6percent in 2008.
• 2009 witnessed economic uncertainty affecting capitalexpenditure, and as a result, many new constructionprojects were postponed. This impacted the revenues to acertain extent but the operational expenditure was highdue to compliance-driven inspection of refineries, pipelinesetc despite financial constraints.
• This was one of the key reasons why the market did notdecline in revenues but witnessed a slower revenue growthrate as compared to the previous year.
• Another key reason for significantly low impact of theeconomic downturn in 2009 was increased scrutiny ofinspection by safety regulatory bodies due to high-profileinfrastructure failures and accidents such as the BritishPetroleum (BP) oil spill, California pipeline explosion, andMississippi river bridge collapse.
42N94C-30
Revenue Forecast (Contd…)
Total NDT Inspection Services Market: Revenue Forecast (World), 2007-2017
0.0
2.0
4.0
6.0
8.0
10.0
12.0
14.0
1,500.0 2,000.0 2,500.0 3,000.0 3,500.0 4,000.0 4,500.0 5,000.0 5,500.0 6,000.0
2007 2008 2009 2010 2011 2012 2013 2014 2015 2016 2017
Reve
nue
Gro
wth
Rat
e (%
)
Reve
nue
($ M
illio
n)
Year
Revenue ($ Million) Revenue Growth Rate (%)
Note: All figures are rounded; the base year is 2010. Source: Frost & Sullivan Analysis
• Market experts and participants believe that this market is capable of bouncing back to pre-recession growth rates and thisis reflected in Frost & Sullivan’s analysis and forecasting of revenues from 2011 to 2017.
• The market recovered significantly in 2010 and is expected to achieve a high growth in 2011 due to the restart ofconstruction projects which were shelved during the economic downturn. The Japan nuclear crisis, in addition to drivingshort-term precautionary inspection in existing nuclear plants worldwide, will trigger widespread increase in safetyregulations for nuclear power plants.
43N94C-30
Trends by End User
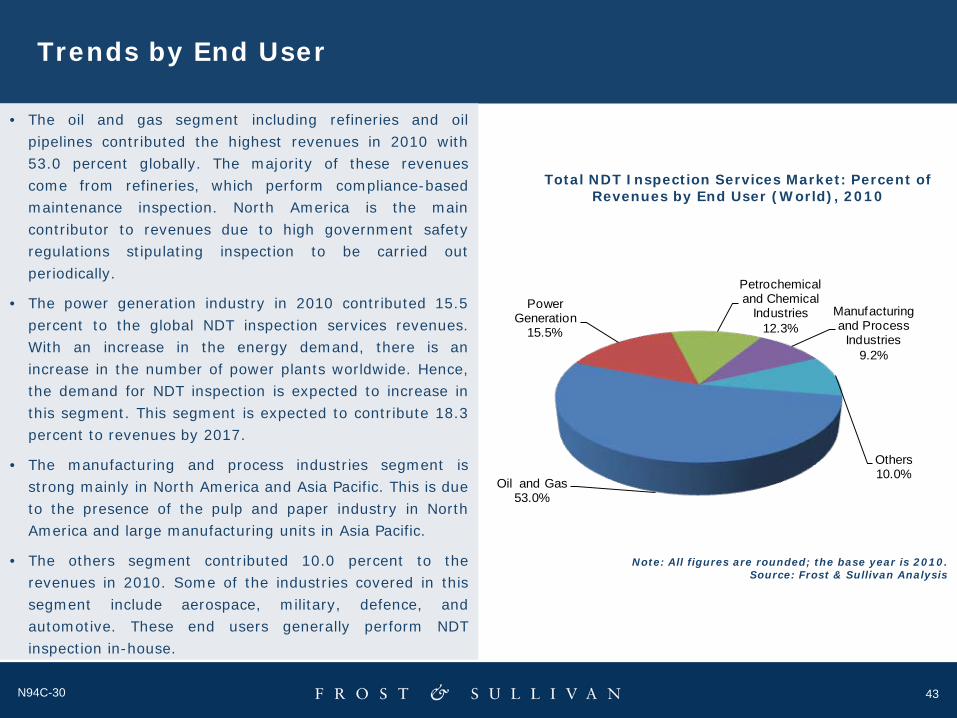
• The oil and gas segment including refineries and oilpipelines contributed the highest revenues in 2010 with53.0 percent globally. The majority of these revenuescome from refineries, which perform compliance-basedmaintenance inspection. North America is the maincontributor to revenues due to high government safetyregulations stipulating inspection to be carried outperiodically.
• The power generation industry in 2010 contributed 15.5percent to the global NDT inspection services revenues.With an increase in the energy demand, there is anincrease in the number of power plants worldwide. Hence,the demand for NDT inspection is expected to increase inthis segment. This segment is expected to contribute 18.3percent to revenues by 2017.
• The manufacturing and process industries segment isstrong mainly in North America and Asia Pacific. This is dueto the presence of the pulp and paper industry in NorthAmerica and large manufacturing units in Asia Pacific.
• The others segment contributed 10.0 percent to therevenues in 2010. Some of the industries covered in thissegment include aerospace, military, defence, andautomotive. These end users generally perform NDTinspection in-house.
Total NDT Inspection Services Market: Percent of Revenues by End User (World), 2010
Note: All figures are rounded; the base year is 2010.Source: Frost & Sullivan Analysis
Oil and Gas53.0%
Power Generation
15.5%
Petrochemical and Chemical
Industries12.3%
Manufacturing and Process
Industries9.2%
Others10.0%
44N94C-30
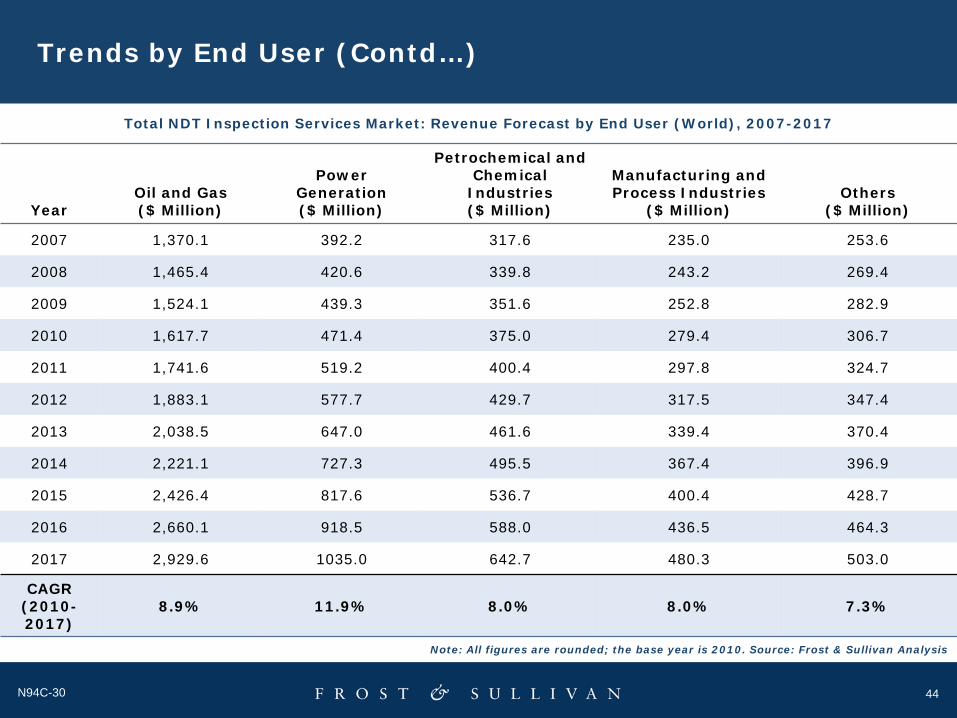
Trends by End User (Contd…)
YearOil and Gas($ Million)
Power Generation($ Million)
Petrochemical and Chemical
Industries($ Million)
Manufacturing and Process Industries
($ Million)Others
($ Million)
2007 1,370.1 392.2 317.6 235.0 253.6
2008 1,465.4 420.6 339.8 243.2 269.4
2009 1,524.1 439.3 351.6 252.8 282.9
2010 1,617.7 471.4 375.0 279.4 306.7
2011 1,741.6 519.2 400.4 297.8 324.7
2012 1,883.1 577.7 429.7 317.5 347.4
2013 2,038.5 647.0 461.6 339.4 370.4
2014 2,221.1 727.3 495.5 367.4 396.9
2015 2,426.4 817.6 536.7 400.4 428.7
2016 2,660.1 918.5 588.0 436.5 464.3
2017 2,929.6 1035.0 642.7 480.3 503.0
CAGR (2010-2017)
8.9% 11.9% 8.0% 8.0% 7.3%
Note: All figures are rounded; the base year is 2010. Source: Frost & Sullivan Analysis
Total NDT Inspection Services Market: Revenue Forecast by End User (World), 2007-2017
45N94C-30
Trends by End User (Contd…)
• In terms of revenue contribution, the oil and gas segment remains the highest and is expected to continue that way till2017. In this segment, maintenance-driven inspection in refineries plays a pivotal role in driving revenues.
• The other segment, oil pipelines, contributes in a small but significant way. With the recent pipeline explosions in NorthAmerica, the inspection in this sector is at an all-time high.
• The power generation industry is expected to witness the highest growth in the NDT inspection services market with CAGRof 11.7 percent. The catalyst for such high growth is the increased importance given to renewable energy.
• The nuclear industry is one of the key users of NDT inspection due to the importance of safety in hazardous surroundings.With more than 60 nuclear power plants under construction worldwide and many more in the pipeline, power generation isexpected to drive this market in the future.
• Manufacturing and process industries are expected to witness slow growth with respect to NDT inspection. The maincontributor in this segment, pulp and paper, has been on a steady decline over the past few years. This has impacted theinvestment in NDT inspection services. As a result, the demand for NDT inspection services has suffered and this trend isexpected to continue over the forecast period.
• That being said, the manufacturing industry is likely to shed its sluggish growth exhibited over the last 2 years due toeconomic downturn and bounce back in a significant way. Hence, demand for NDT inspection in the manufacturing industryis expected to grow.
46N94C-30
Trends by Geography
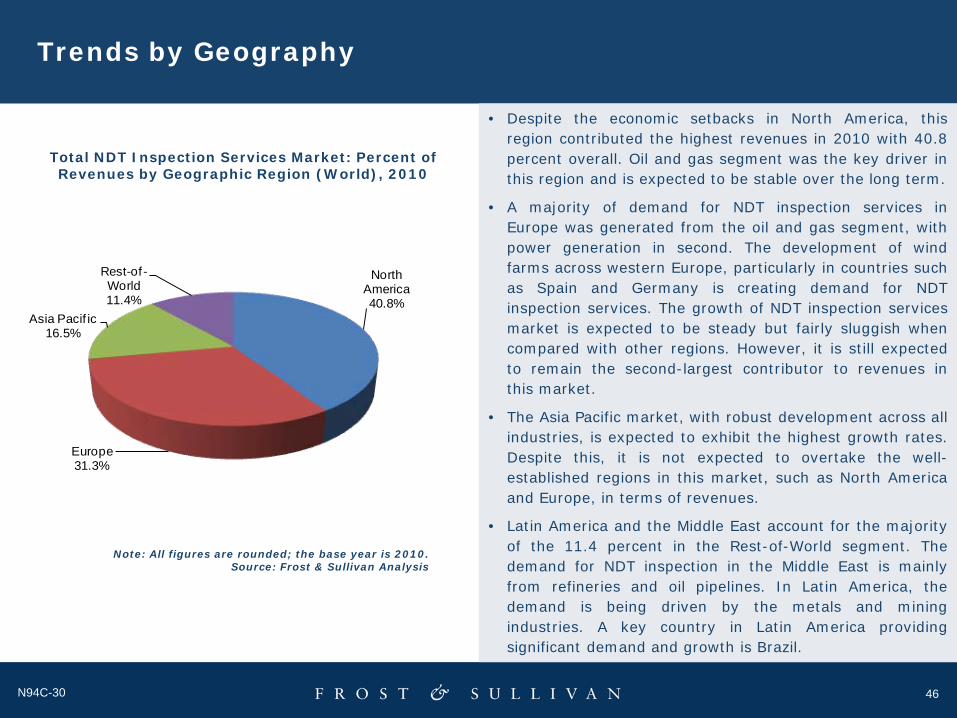
• Despite the economic setbacks in North America, thisregion contributed the highest revenues in 2010 with 40.8percent overall. Oil and gas segment was the key driver inthis region and is expected to be stable over the long term.
• A majority of demand for NDT inspection services inEurope was generated from the oil and gas segment, withpower generation in second. The development of windfarms across western Europe, particularly in countries suchas Spain and Germany is creating demand for NDTinspection services. The growth of NDT inspection servicesmarket is expected to be steady but fairly sluggish whencompared with other regions. However, it is still expectedto remain the second-largest contributor to revenues inthis market.
• The Asia Pacific market, with robust development across allindustries, is expected to exhibit the highest growth rates.Despite this, it is not expected to overtake the well-established regions in this market, such as North Americaand Europe, in terms of revenues.
• Latin America and the Middle East account for the majorityof the 11.4 percent in the Rest-of-World segment. Thedemand for NDT inspection in the Middle East is mainlyfrom refineries and oil pipelines. In Latin America, thedemand is being driven by the metals and miningindustries. A key country in Latin America providingsignificant demand and growth is Brazil.
Total NDT Inspection Services Market: Percent of Revenues by Geographic Region (World), 2010
Note: All figures are rounded; the base year is 2010.Source: Frost & Sullivan Analysis
North America40.8%
Europe31.3%
Asia Pacif ic16.5%
Rest-of -World11.4%
47N94C-30
Competitive Environment
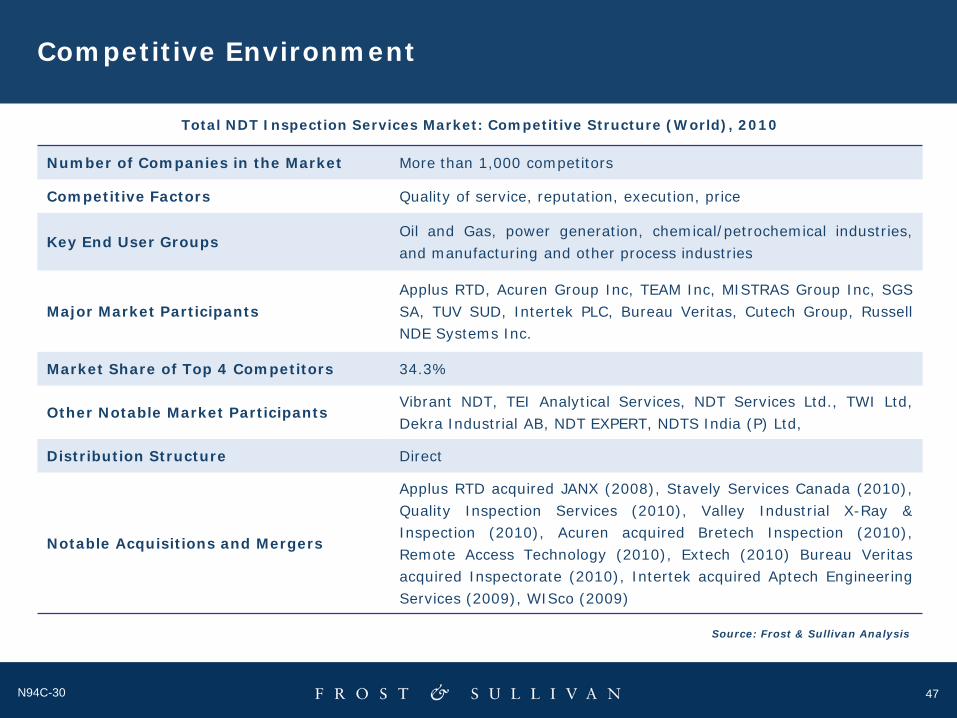
Total NDT Inspection Services Market: Competitive Structure (World), 2010
Number of Companies in the Market More than 1,000 competitors
Competitive Factors Quality of service, reputation, execution, price
Key End User GroupsOil and Gas, power generation, chemical/petrochemical industries,and manufacturing and other process industries
Major Market ParticipantsApplus RTD, Acuren Group Inc, TEAM Inc, MISTRAS Group Inc, SGSSA, TUV SUD, Intertek PLC, Bureau Veritas, Cutech Group, RussellNDE Systems Inc.
Market Share of Top 4 Competitors 34.3%
Other Notable Market ParticipantsVibrant NDT, TEI Analytical Services, NDT Services Ltd., TWI Ltd,Dekra Industrial AB, NDT EXPERT, NDTS India (P) Ltd,
Distribution Structure Direct
Notable Acquisitions and Mergers
Applus RTD acquired JANX (2008), Stavely Services Canada (2010),Quality Inspection Services (2010), Valley Industrial X-Ray &Inspection (2010), Acuren acquired Bretech Inspection (2010),Remote Access Technology (2010), Extech (2010) Bureau Veritasacquired Inspectorate (2010), Intertek acquired Aptech EngineeringServices (2009), WISco (2009)
Source: Frost & Sullivan Analysis
48N94C-30
Market Share Analysis
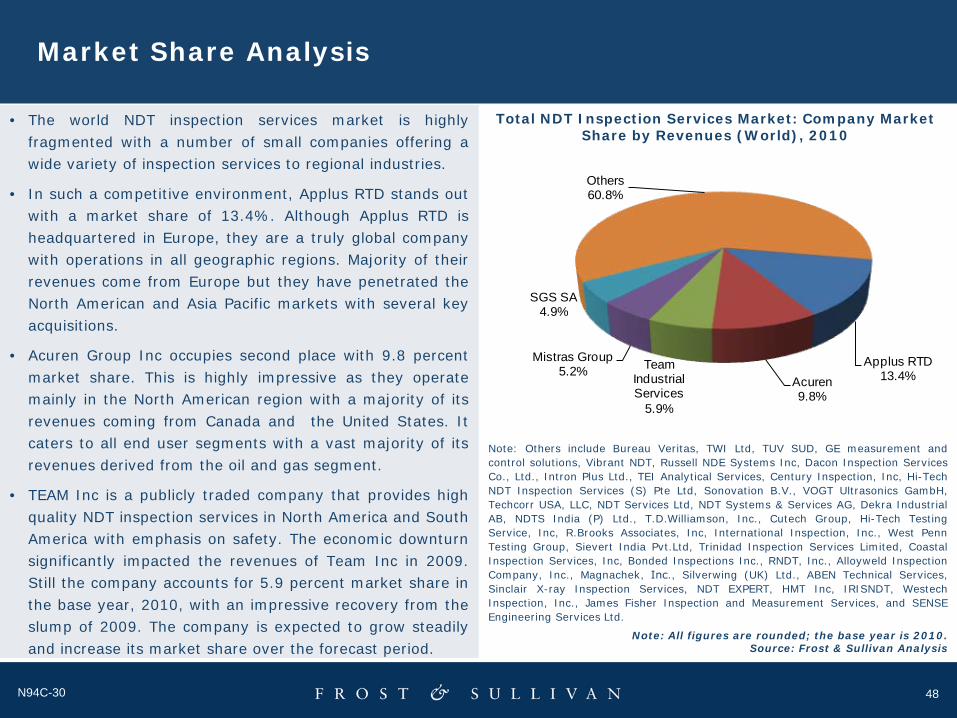
• The world NDT inspection services market is highlyfragmented with a number of small companies offering awide variety of inspection services to regional industries.
• In such a competitive environment, Applus RTD stands outwith a market share of 13.4%. Although Applus RTD isheadquartered in Europe, they are a truly global companywith operations in all geographic regions. Majority of theirrevenues come from Europe but they have penetrated theNorth American and Asia Pacific markets with several keyacquisitions.
• Acuren Group Inc occupies second place with 9.8 percentmarket share. This is highly impressive as they operatemainly in the North American region with a majority of itsrevenues coming from Canada and the United States. Itcaters to all end user segments with a vast majority of itsrevenues derived from the oil and gas segment.
• TEAM Inc is a publicly traded company that provides highquality NDT inspection services in North America and SouthAmerica with emphasis on safety. The economic downturnsignificantly impacted the revenues of Team Inc in 2009.Still the company accounts for 5.9 percent market share inthe base year, 2010, with an impressive recovery from theslump of 2009. The company is expected to grow steadilyand increase its market share over the forecast period.
Total NDT Inspection Services Market: Company Market Share by Revenues (World), 2010
Note: All figures are rounded; the base year is 2010.Source: Frost & Sullivan Analysis
Note: Others include Bureau Veritas, TWI Ltd, TUV SUD, GE measurement andcontrol solutions, Vibrant NDT, Russell NDE Systems Inc, Dacon Inspection ServicesCo., Ltd., Intron Plus Ltd., TEI Analytical Services, Century Inspection, Inc, Hi-TechNDT Inspection Services (S) Pte Ltd, Sonovation B.V., VOGT Ultrasonics GambH,Techcorr USA, LLC, NDT Services Ltd, NDT Systems & Services AG, Dekra IndustrialAB, NDTS India (P) Ltd., T.D.Williamson, Inc., Cutech Group, Hi-Tech TestingService, Inc, R.Brooks Associates, Inc, International Inspection, Inc., West PennTesting Group, Sievert India Pvt.Ltd, Trinidad Inspection Services Limited, CoastalInspection Services, Inc, Bonded Inspections Inc., RNDT, Inc., Alloyweld InspectionCompany, Inc., Magnachek, Inс., Silverwing (UK) Ltd., ABEN Technical Services,Sinclair X-ray Inspection Services, NDT EXPERT, HMT Inc, IRISNDT, WestechInspection, Inc., James Fisher Inspection and Measurement Services, and SENSEEngineering Services Ltd.
Applus RTD13.4%Acuren
9.8%
Team Industrial Services
5.9%
Mistras Group5.2%
SGS SA4.9%
Others60.8%
49N94C-30
North American NDT Inspection Services Market
49
50N94C-30
Market Engineering Measurements
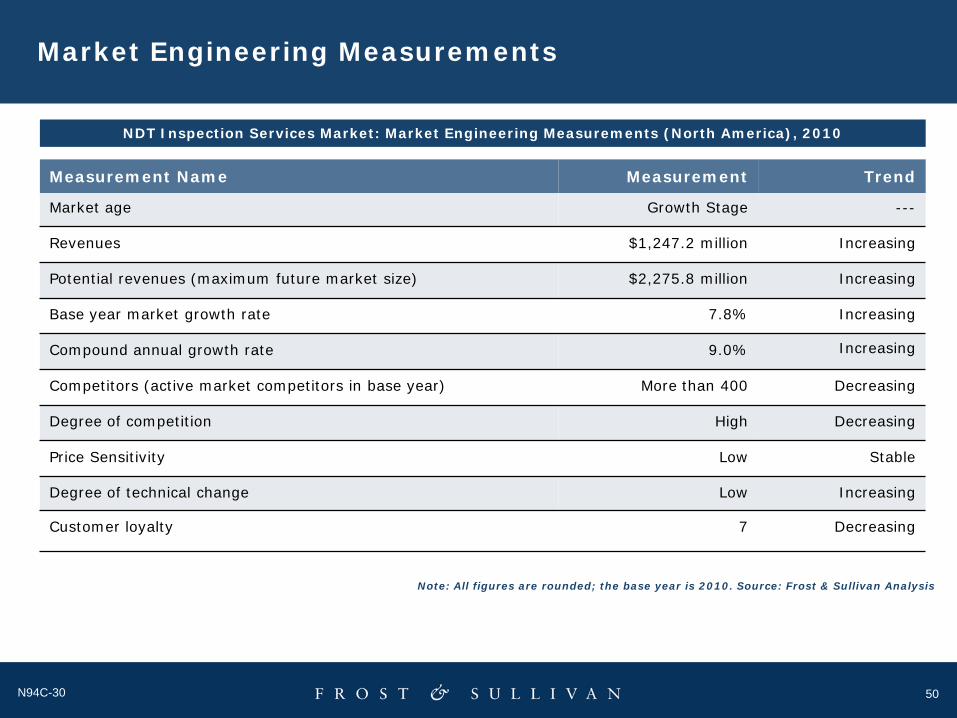
Market age Growth Stage ---
Revenues $1,247.2 million Increasing
Potential revenues (maximum future market size) $2,275.8 million Increasing
Base year market growth rate 7.8% Increasing
Compound annual growth rate 9.0% Increasing
Competitors (active market competitors in base year) More than 400 Decreasing
Degree of competition High Decreasing
Price Sensitivity Low Stable
Degree of technical change Low Increasing
Customer loyalty 7 Decreasing
Measurement Name Measurement Trend
NDT Inspection Services Market: Market Engineering Measurements (North America), 2010
Note: All figures are rounded; the base year is 2010. Source: Frost & Sullivan Analysis
51N94C-30
Revenue Forecast
YearRevenue($ Million)
RevenueGrowth Rate
(%)
2007 1,034.3 ---
2008 1,104.3 6.8
2009 1,156.7 4.7
2010 1,247.2 7.8
2011 1,347.4 8.0
2012 1,459.5 8.3
2013 1,583.3 8.5
2014 1,725.3 9.0
2015 1,886.9 9.4
2016 2,068.3 9.6
2017 2,275.8 10.0
Compound Annual Growth Rate (2010-2017): 9.0%
NDT Inspection Services Market: Revenue Forecast (North America), 2007-2017
Note: All figures are rounded; the base year is 2010.Source: Frost & Sullivan Analysis
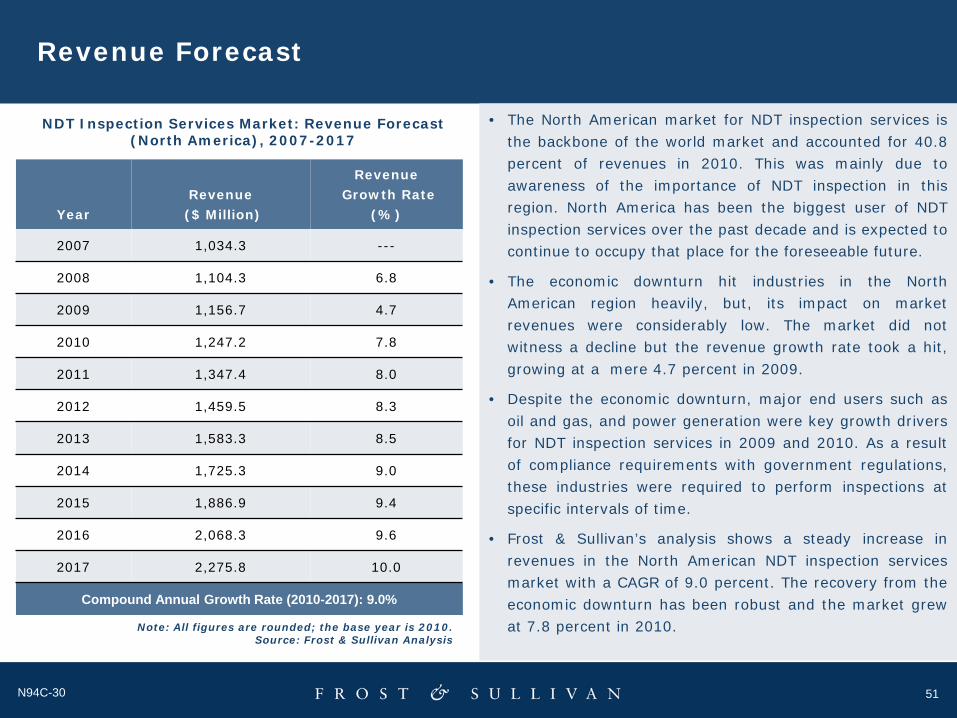
• The North American market for NDT inspection services isthe backbone of the world market and accounted for 40.8percent of revenues in 2010. This was mainly due toawareness of the importance of NDT inspection in thisregion. North America has been the biggest user of NDTinspection services over the past decade and is expected tocontinue to occupy that place for the foreseeable future.
• The economic downturn hit industries in the NorthAmerican region heavily, but, its impact on marketrevenues were considerably low. The market did notwitness a decline but the revenue growth rate took a hit,growing at a mere 4.7 percent in 2009.
• Despite the economic downturn, major end users such asoil and gas, and power generation were key growth driversfor NDT inspection services in 2009 and 2010. As a resultof compliance requirements with government regulations,these industries were required to perform inspections atspecific intervals of time.
• Frost & Sullivan’s analysis shows a steady increase inrevenues in the North American NDT inspection servicesmarket with a CAGR of 9.0 percent. The recovery from theeconomic downturn has been robust and the market grewat 7.8 percent in 2010.
52N94C-30
Revenue Forecast (Contd…)
NDT Inspection Services Market: Revenue Forecast (North America), 2007-2017
Note: All figures are rounded; the base year is 2010. Source: Frost & Sullivan Analysis
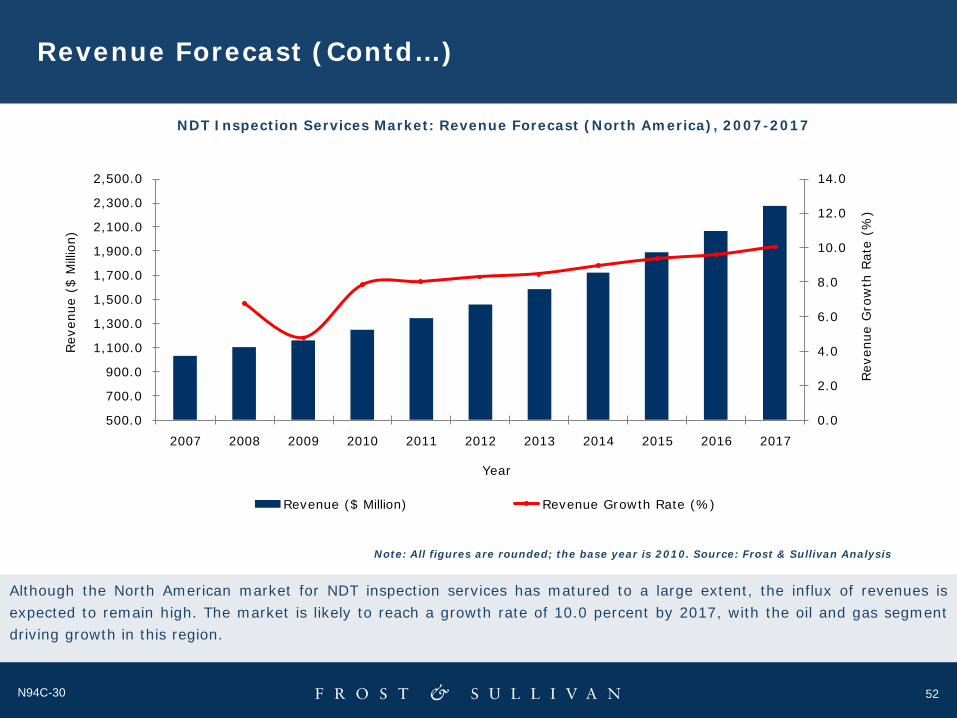
Although the North American market for NDT inspection services has matured to a large extent, the influx of revenues isexpected to remain high. The market is likely to reach a growth rate of 10.0 percent by 2017, with the oil and gas segmentdriving growth in this region.
0.0
2.0
4.0
6.0
8.0
10.0
12.0
14.0
500.0
700.0
900.0
1,100.0
1,300.0
1,500.0
1,700.0
1,900.0
2,100.0
2,300.0
2,500.0
2007 2008 2009 2010 2011 2012 2013 2014 2015 2016 2017
Rev
enue
Gro
wth
Rat
e (%
)
Rev
enue
($
Millio
n)
Year
Revenue ($ Million) Revenue Growth Rate (%)
53N94C-30
Trends by End User
YearOil and Gas($ Million)
Power Generation($ Million)
Petrochemical and Chemical
Industries($ Million)
Manufacturing and Process Industries
($ Million)Others
($ Million)
2007 582.3 130.3 129.3 104.5 87.9
2008 622.8 141.4 138.0 109.3 92.8
2009 652.4 150.4 143.4 113.4 97.1
2010 695.9 164.6 154.7 126.0 106.0
2011 751.8 181.9 165.7 134.7 113.3
2012 812.9 201.4 179.5 143.0 122.7
2013 878.7 226.4 193.2 152.0 133.0
2014 954.1 257.1 208.8 163.9 141.4
2015 1,037.8 292.5 226.4 177.4 152.8
2016 1,131.4 333.0 248.2 192.4 163.3
2017 1,240.3 380.1 270.8 209.4 175.2
CAGR (2010-2017)
8.6% 12.7% 8.3% 7.5% 7.4%
Note: All figures are rounded; the base year is 2010. Source: Frost & Sullivan Analysis
NDT Inspection Services Market: Revenue Forecast by End User (North America), 2007-2017

54N94C-30
Trends by End User (Contd…)
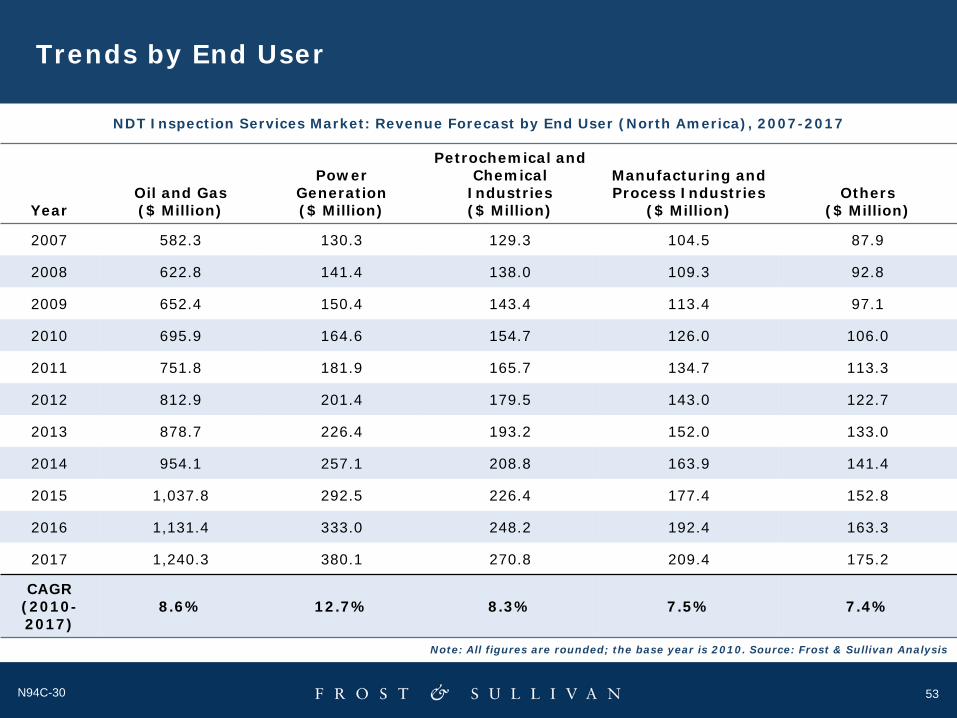
The major end user for NDT inspection services in the North American market is oil and gas, which contributed 55.8 percentto revenues in 2010. One of the main reasons for oil and gas being a key end user is the number of governmentregulations, which stipulate heavy inspection in this segment.
The oil and gas segment is expected to grow at a CAGR of 8.6 percent, which makes it a focal point of revenues. In theUnited States, even though a new refinery has not been constructed for over 30 years, the oil and gas segment is thelargest contributor to revenues. Hence, a significant percentage of revenues in this segment is derived from maintenance-based inspection.
With a CAGR of 12.7 percent, power generation is expected to become a prominent end user for NDT inspection services.The main reason for this is the development being witnessed in the renewable energy sector. A large number of windfarms, and nuclear power plants are being constructed in North America to meet the growing energy demand. This isexpected to contribute significantly to the growth in power generation segment.
The process industry in North America is noteworthy, with pulp and paper being one of the major segments. With a CAGRof 7.5 percent, growth in this segment is likely to be the slowest. A key reason for this is the maturity of the pulp and papermarket in the United States.
55N94C-30
Competitive Environment
NDT Inspection Services Market: Competitive Structure (North America), 2010
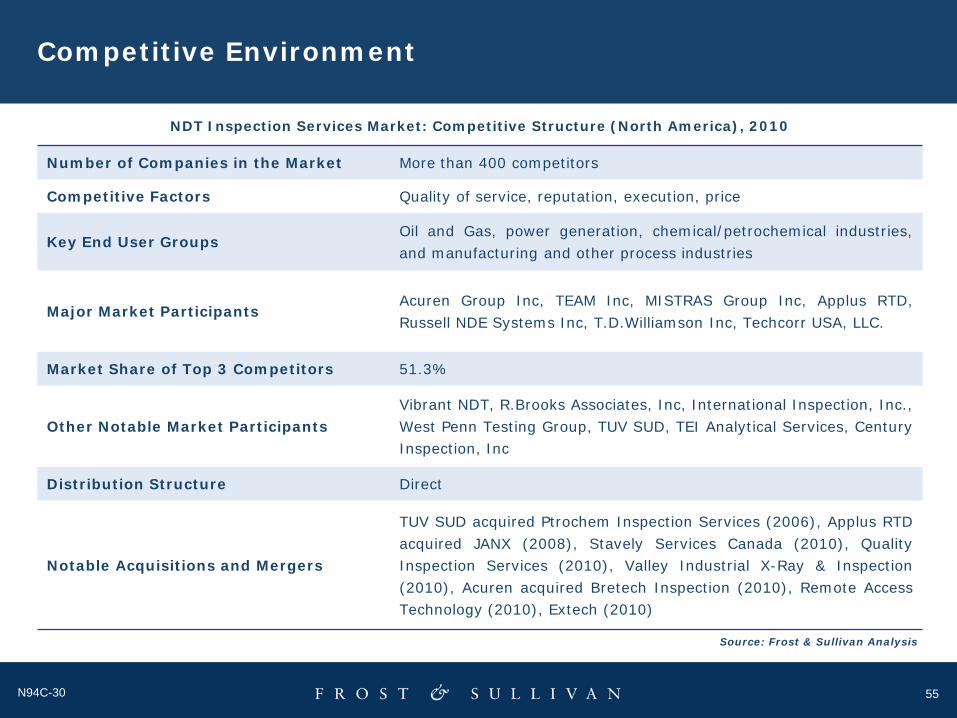
Number of Companies in the Market More than 400 competitors
Competitive Factors Quality of service, reputation, execution, price
Key End User GroupsOil and Gas, power generation, chemical/petrochemical industries,and manufacturing and other process industries
Major Market ParticipantsAcuren Group Inc, TEAM Inc, MISTRAS Group Inc, Applus RTD,Russell NDE Systems Inc, T.D.Williamson Inc, Techcorr USA, LLC.
Market Share of Top 3 Competitors 51.3%
Other Notable Market ParticipantsVibrant NDT, R.Brooks Associates, Inc, International Inspection, Inc.,West Penn Testing Group, TUV SUD, TEI Analytical Services, CenturyInspection, Inc
Distribution Structure Direct
Notable Acquisitions and Mergers
TUV SUD acquired Ptrochem Inspection Services (2006), Applus RTDacquired JANX (2008), Stavely Services Canada (2010), QualityInspection Services (2010), Valley Industrial X-Ray & Inspection(2010), Acuren acquired Bretech Inspection (2010), Remote AccessTechnology (2010), Extech (2010)
Source: Frost & Sullivan Analysis
56N94C-30
Competitive Environment (Contd…)
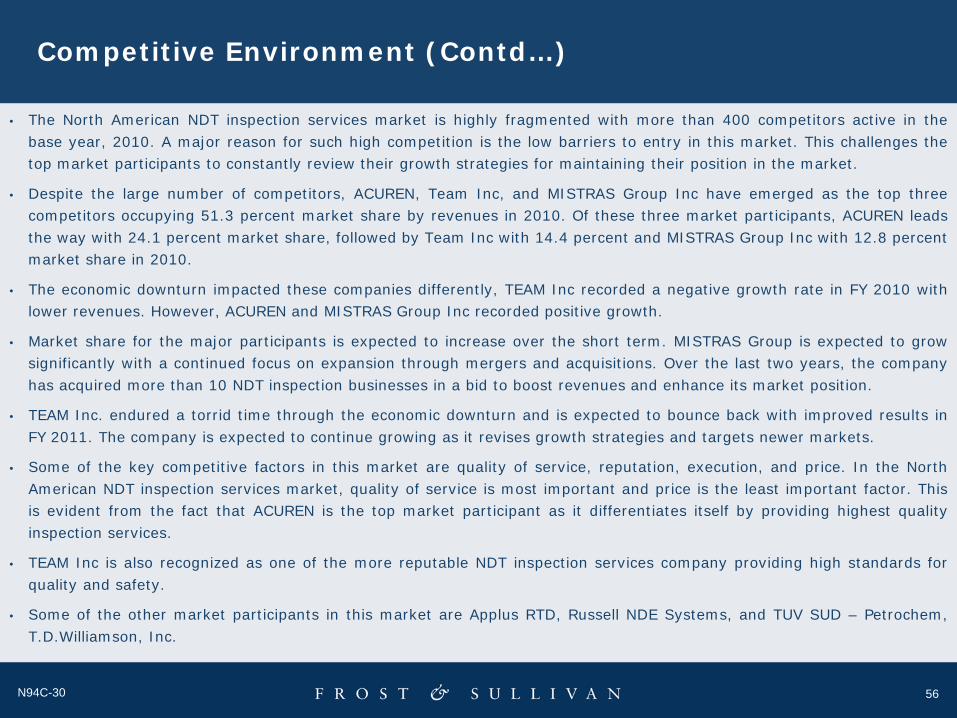
• The North American NDT inspection services market is highly fragmented with more than 400 competitors active in thebase year, 2010. A major reason for such high competition is the low barriers to entry in this market. This challenges thetop market participants to constantly review their growth strategies for maintaining their position in the market.
• Despite the large number of competitors, ACUREN, Team Inc, and MISTRAS Group Inc have emerged as the top threecompetitors occupying 51.3 percent market share by revenues in 2010. Of these three market participants, ACUREN leadsthe way with 24.1 percent market share, followed by Team Inc with 14.4 percent and MISTRAS Group Inc with 12.8 percentmarket share in 2010.
• The economic downturn impacted these companies differently, TEAM Inc recorded a negative growth rate in FY 2010 withlower revenues. However, ACUREN and MISTRAS Group Inc recorded positive growth.
• Market share for the major participants is expected to increase over the short term. MISTRAS Group is expected to growsignificantly with a continued focus on expansion through mergers and acquisitions. Over the last two years, the companyhas acquired more than 10 NDT inspection businesses in a bid to boost revenues and enhance its market position.
• TEAM Inc. endured a torrid time through the economic downturn and is expected to bounce back with improved results inFY 2011. The company is expected to continue growing as it revises growth strategies and targets newer markets.
• Some of the key competitive factors in this market are quality of service, reputation, execution, and price. In the NorthAmerican NDT inspection services market, quality of service is most important and price is the least important factor. Thisis evident from the fact that ACUREN is the top market participant as it differentiates itself by providing highest qualityinspection services.
• TEAM Inc is also recognized as one of the more reputable NDT inspection services company providing high standards forquality and safety.
• Some of the other market participants in this market are Applus RTD, Russell NDE Systems, and TUV SUD – Petrochem,T.D.Williamson, Inc.
57N94C-30
European NDT Inspection Services Market
57
58N94C-30
Market Engineering Measurements
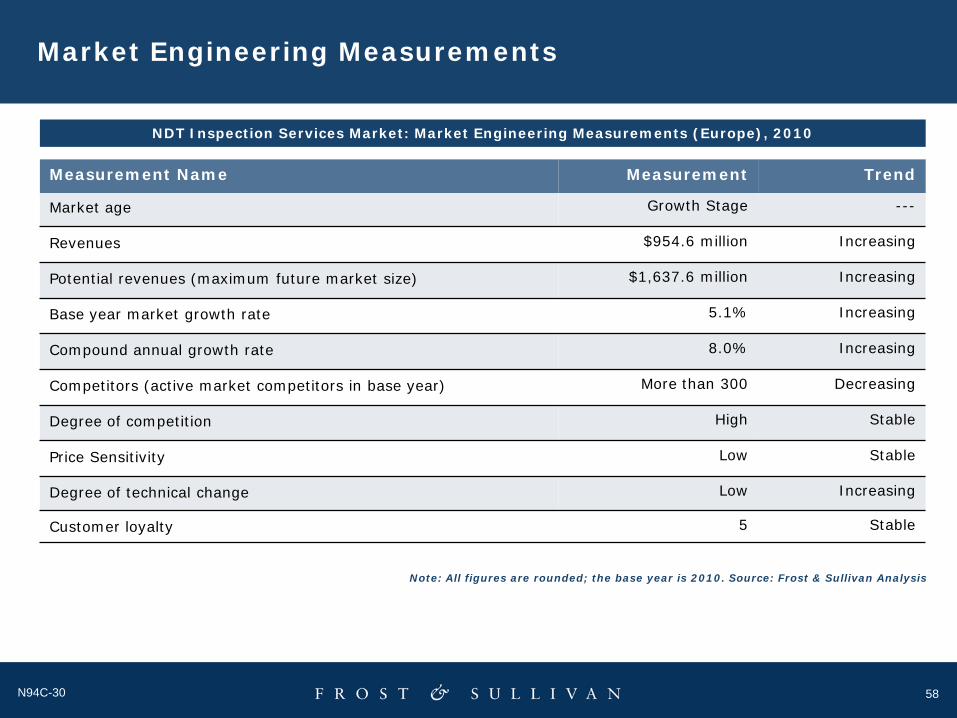
Market age Growth Stage ---
Revenues $954.6 million Increasing
Potential revenues (maximum future market size) $1,637.6 million Increasing
Base year market growth rate 5.1% Increasing
Compound annual growth rate 8.0% Increasing
Competitors (active market competitors in base year) More than 300 Decreasing
Degree of competition High Stable
Price Sensitivity Low Stable
Degree of technical change Low Increasing
Customer loyalty 5 Stable
Measurement Name Measurement Trend
NDT Inspection Services Market: Market Engineering Measurements (Europe), 2010
Note: All figures are rounded; the base year is 2010. Source: Frost & Sullivan Analysis
59N94C-30
Revenue Forecast
YearRevenue
($ Million)
RevenueGrowth Rate
(%)
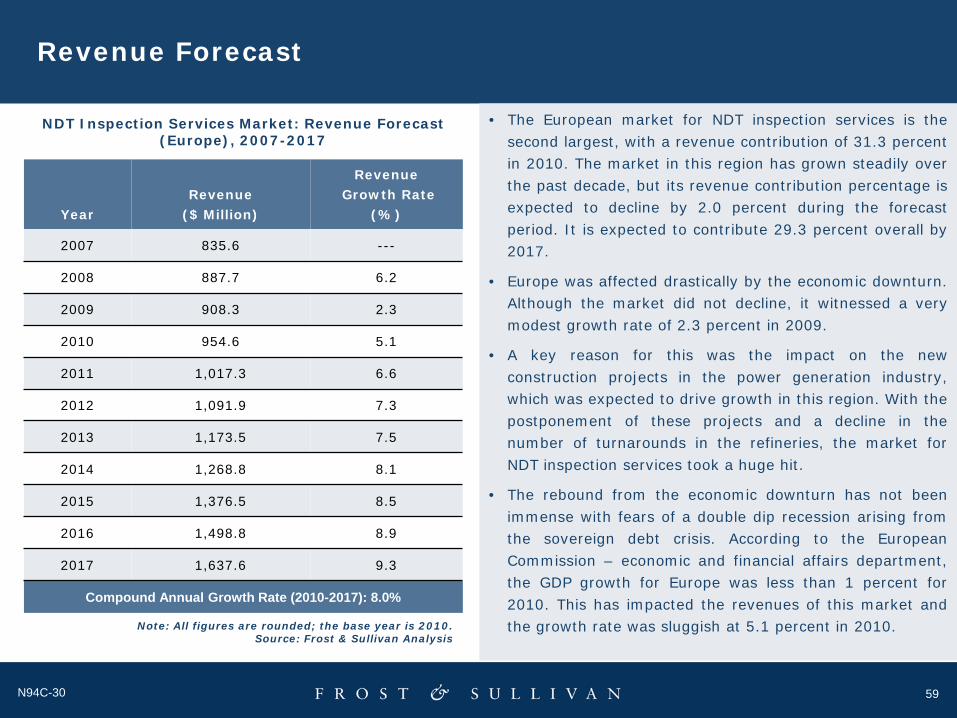
2007 835.6 ---
2008 887.7 6.2
2009 908.3 2.3
2010 954.6 5.1
2011 1,017.3 6.6
2012 1,091.9 7.3
2013 1,173.5 7.5
2014 1,268.8 8.1
2015 1,376.5 8.5
2016 1,498.8 8.9
2017 1,637.6 9.3
Compound Annual Growth Rate (2010-2017): 8.0%
NDT Inspection Services Market: Revenue Forecast (Europe), 2007-2017
Note: All figures are rounded; the base year is 2010.Source: Frost & Sullivan Analysis
• The European market for NDT inspection services is thesecond largest, with a revenue contribution of 31.3 percentin 2010. The market in this region has grown steadily overthe past decade, but its revenue contribution percentage isexpected to decline by 2.0 percent during the forecastperiod. It is expected to contribute 29.3 percent overall by2017.
• Europe was affected drastically by the economic downturn.Although the market did not decline, it witnessed a verymodest growth rate of 2.3 percent in 2009.
• A key reason for this was the impact on the newconstruction projects in the power generation industry,which was expected to drive growth in this region. With thepostponement of these projects and a decline in thenumber of turnarounds in the refineries, the market forNDT inspection services took a huge hit.
• The rebound from the economic downturn has not beenimmense with fears of a double dip recession arising fromthe sovereign debt crisis. According to the EuropeanCommission – economic and financial affairs department,the GDP growth for Europe was less than 1 percent for2010. This has impacted the revenues of this market andthe growth rate was sluggish at 5.1 percent in 2010.
60N94C-30
Revenue Forecast (Contd…)
NDT Inspection Services Market: Revenue Forecast (Europe), 2007-2017
Note: All figures are rounded; the base year is 2010. Source: Frost & Sullivan Analysis
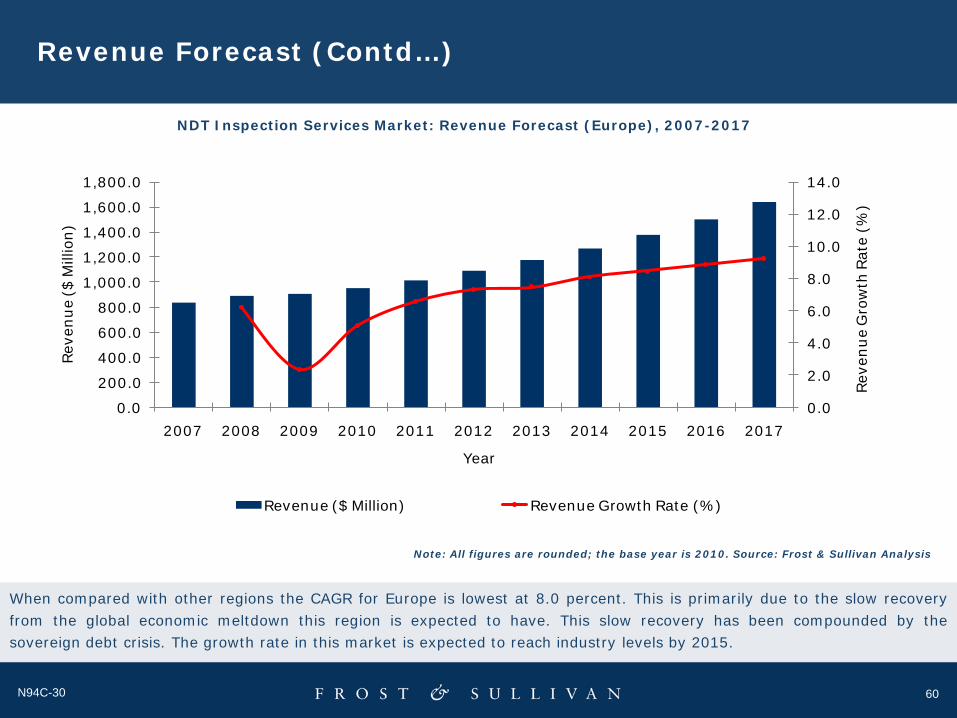
When compared with other regions the CAGR for Europe is lowest at 8.0 percent. This is primarily due to the slow recoveryfrom the global economic meltdown this region is expected to have. This slow recovery has been compounded by thesovereign debt crisis. The growth rate in this market is expected to reach industry levels by 2015.
0.0
2.0
4.0
6.0
8.0
10.0
12.0
14.0
0.0
200.0
400.0
600.0
800.0
1,000.0
1,200.0
1,400.0
1,600.0
1,800.0
2007 2008 2009 2010 2011 2012 2013 2014 2015 2016 2017
Reve
nue
Gro
wth
Rat
e (%
)
Reve
nue
($ M
illio
n)
Year
Revenue ($ Million) Revenue Growth Rate (%)
61N94C-30
Trends by End User
YearOil and Gas($ Million)
Power Generation($ Million)
Petrochemical and Chemical
Industries($ Million)
Manufacturing and Process Industries
($ Million)Others
($ Million)
2007 456.2 147.1 108.6 40.9 82.8
2008 486.5 156.2 116.3 39.9 88.8
2009 497.7 159.9 119.0 40.9 90.8
2010 520.3 168.0 123.1 45.8 97.4
2011 554.4 183.1 130.2 47.8 101.8
2012 594.0 203.1 137.6 50.2 107.0
2013 637.2 224.1 146.7 52.8 112.7
2014 689.0 248.7 154.8 55.8 120.5
2015 746.1 273.9 166.6 60.6 129.3
2016 810.9 301.3 181.4 64.4 140.8
2017 885.9 332.4 196.5 70.4 152.4
CAGR (2010-2017)
7.9% 10.2% 6.9% 6.3% 6.6%
Note: All figures are rounded; the base year is 2010. Source: Frost & Sullivan Analysis
NDT Inspection Services Market: Revenue Forecast by End User (Europe), 2007-2017
62N94C-30
Trends by End User (Contd…)
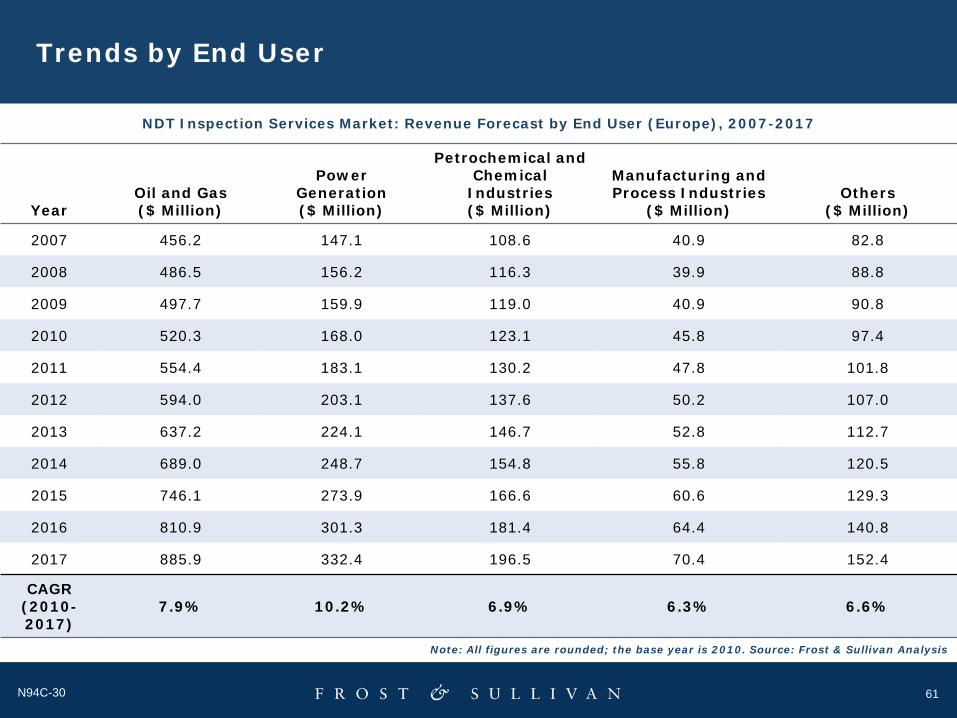
As seen in the North American NDT inspection services market, oil and gas contributed to more than 50 percent of therevenues for 2010 in the European market. It is one of the major sources of revenues for this market because of thenumber of refineries in Eastern Europe. With the number of refineries increasing each year, this end user segment isexpected to remain strong over the forecast period.
The power generation segment is the second-largest user of NDT inspection services with a share of 17.6 percent to theoverall revenues in 2010. With the construction of wind farms, especially in Spain, Germany, and France, the demand forNDT inspection services from this segment is projected to increase. This is shown by the highest CAGR of 10.2 percent,outlining immense growth in this segment.
The manufacturing and process industry segment contributes the least to overall revenues for this region. The percentagerevenue contribution for 2010 is 4.8 percent, and this is expected to decrease further. One of the key reasons for this hasbeen the continuing trend of shifting manufacturing plants to Asia Pacific and Latin America, where the labor is cheap.
With the lowest CAGR of 6.3 percent, this shift has impacted the revenues in this segment and there is no significantchange expected to this trend.
63N94C-30
Competitive Environment
NDT Inspection Services Market: Competitive Structure (Europe), 2010
Number of Companies in the Market More than 300 competitors
Competitive Factors Quality of service, reputation, price, execution
Key End User GroupsOil and Gas, power generation, and chemical/petrochemicalindustries
Major Market ParticipantsApplus RTD , SGS SA, Intertek PLC, Bureau Veritas, NDT Systems &Services AG.
Market Share of Top 3 Competitors 39.9%
Other Notable Market ParticipantsNDT Services Ltd., TWI Ltd, Dekra Industrial AB, TUV RheinlandGroup, Silverwing (UK) Ltd., NDT EXPERT, Sonovation B.V., VOGTUltrasonics GambH, Intron Plus Ltd., Focus NDT
Distribution Structure Direct
Notable Acquisitions and MergersBureau Veritas acquired Inspectorate (2010), Moody Group acquiredPetroSpect Inspection Services (2009), Pro-Inspect (2010), Intertekacquired Aptech Engineering Services (2009), WISco (2009)
Source: Frost & Sullivan Analysis
64N94C-30
Competitive Environment (Contd…)
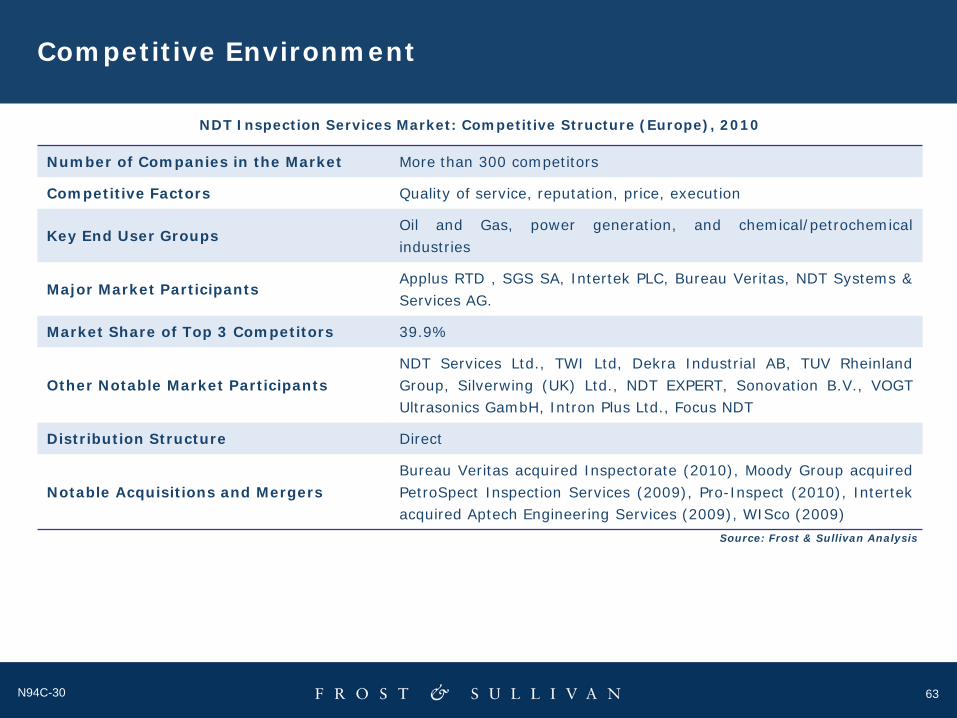
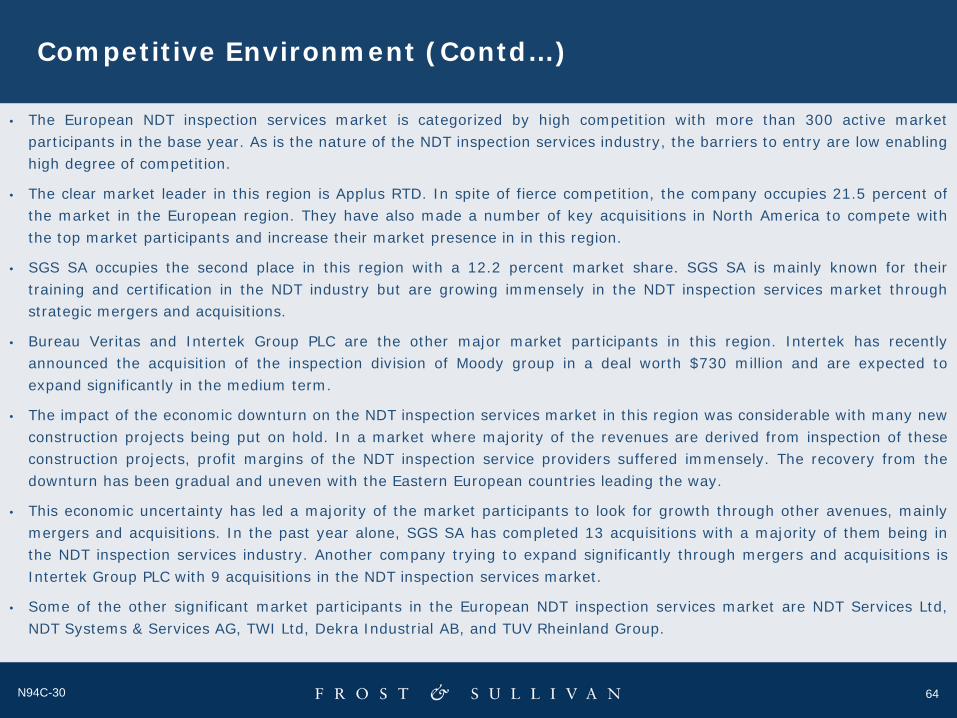
• The European NDT inspection services market is categorized by high competition with more than 300 active marketparticipants in the base year. As is the nature of the NDT inspection services industry, the barriers to entry are low enablinghigh degree of competition.
• The clear market leader in this region is Applus RTD. In spite of fierce competition, the company occupies 21.5 percent ofthe market in the European region. They have also made a number of key acquisitions in North America to compete withthe top market participants and increase their market presence in in this region.
• SGS SA occupies the second place in this region with a 12.2 percent market share. SGS SA is mainly known for theirtraining and certification in the NDT industry but are growing immensely in the NDT inspection services market throughstrategic mergers and acquisitions.
• Bureau Veritas and Intertek Group PLC are the other major market participants in this region. Intertek has recentlyannounced the acquisition of the inspection division of Moody group in a deal worth $730 million and are expected toexpand significantly in the medium term.
• The impact of the economic downturn on the NDT inspection services market in this region was considerable with many newconstruction projects being put on hold. In a market where majority of the revenues are derived from inspection of theseconstruction projects, profit margins of the NDT inspection service providers suffered immensely. The recovery from thedownturn has been gradual and uneven with the Eastern European countries leading the way.
• This economic uncertainty has led a majority of the market participants to look for growth through other avenues, mainlymergers and acquisitions. In the past year alone, SGS SA has completed 13 acquisitions with a majority of them being inthe NDT inspection services industry. Another company trying to expand significantly through mergers and acquisitions isIntertek Group PLC with 9 acquisitions in the NDT inspection services market.
• Some of the other significant market participants in the European NDT inspection services market are NDT Services Ltd,NDT Systems & Services AG, TWI Ltd, Dekra Industrial AB, and TUV Rheinland Group.
65N94C-30
Asia Pacific NDT Inspection Services Market
65
66N94C-30
Market Engineering Measurements
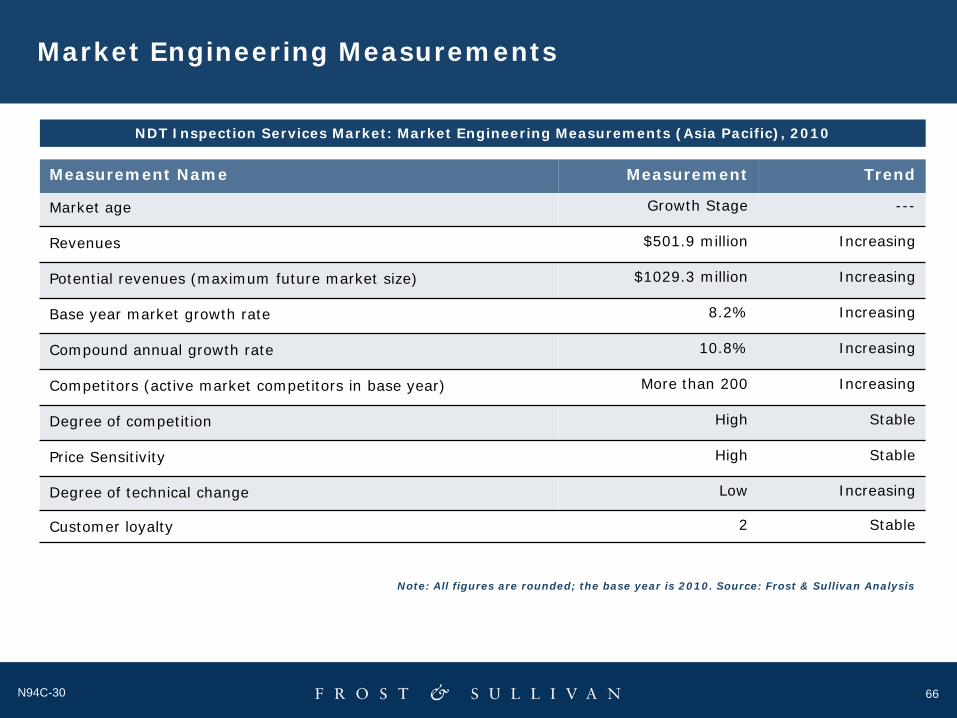
Market age Growth Stage ---
Revenues $501.9 million Increasing
Potential revenues (maximum future market size) $1029.3 million Increasing
Base year market growth rate 8.2% Increasing
Compound annual growth rate 10.8% Increasing
Competitors (active market competitors in base year) More than 200 Increasing
Degree of competition High Stable
Price Sensitivity High Stable
Degree of technical change Low Increasing
Customer loyalty 2 Stable
Measurement Name Measurement Trend
NDT Inspection Services Market: Market Engineering Measurements (Asia Pacific), 2010
Note: All figures are rounded; the base year is 2010. Source: Frost & Sullivan Analysis
67N94C-30
Revenue Forecast
YearRevenue($ Million)
Revenue Growth Rate
(%)
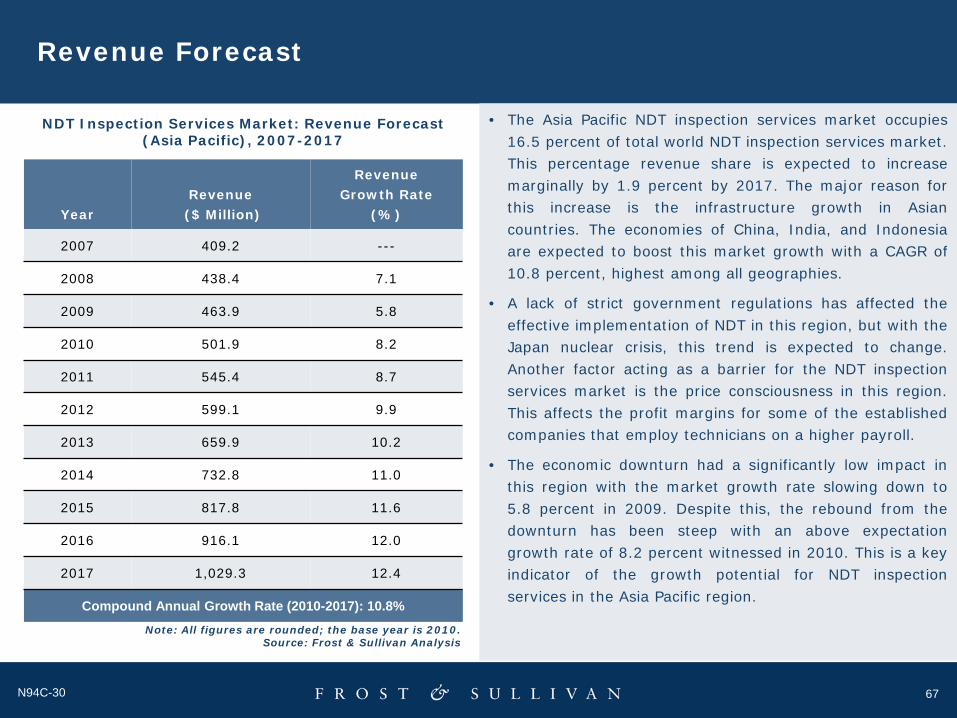
2007 409.2 ---
2008 438.4 7.1
2009 463.9 5.8
2010 501.9 8.2
2011 545.4 8.7
2012 599.1 9.9
2013 659.9 10.2
2014 732.8 11.0
2015 817.8 11.6
2016 916.1 12.0
2017 1,029.3 12.4
Compound Annual Growth Rate (2010-2017): 10.8%
NDT Inspection Services Market: Revenue Forecast (Asia Pacific), 2007-2017
Note: All figures are rounded; the base year is 2010.Source: Frost & Sullivan Analysis
• The Asia Pacific NDT inspection services market occupies16.5 percent of total world NDT inspection services market.This percentage revenue share is expected to increasemarginally by 1.9 percent by 2017. The major reason forthis increase is the infrastructure growth in Asiancountries. The economies of China, India, and Indonesiaare expected to boost this market growth with a CAGR of10.8 percent, highest among all geographies.
• A lack of strict government regulations has affected theeffective implementation of NDT in this region, but with theJapan nuclear crisis, this trend is expected to change.Another factor acting as a barrier for the NDT inspectionservices market is the price consciousness in this region.This affects the profit margins for some of the establishedcompanies that employ technicians on a higher payroll.
• The economic downturn had a significantly low impact inthis region with the market growth rate slowing down to5.8 percent in 2009. Despite this, the rebound from thedownturn has been steep with an above expectationgrowth rate of 8.2 percent witnessed in 2010. This is a keyindicator of the growth potential for NDT inspectionservices in the Asia Pacific region.
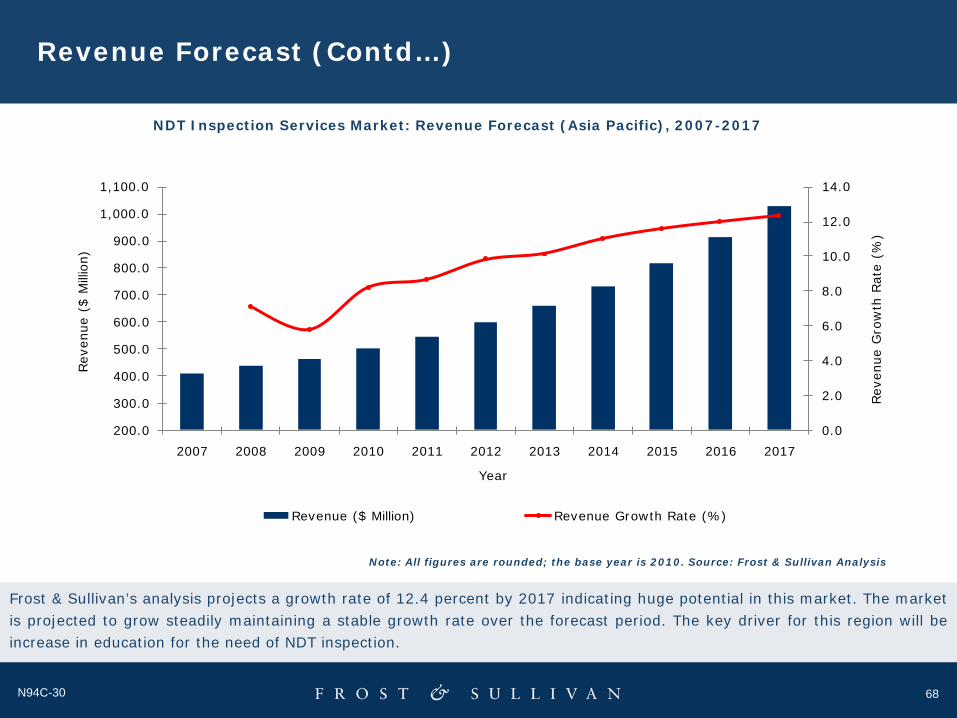
68N94C-30
Revenue Forecast (Contd…)
NDT Inspection Services Market: Revenue Forecast (Asia Pacific), 2007-2017
Note: All figures are rounded; the base year is 2010. Source: Frost & Sullivan Analysis
Frost & Sullivan’s analysis projects a growth rate of 12.4 percent by 2017 indicating huge potential in this market. The marketis projected to grow steadily maintaining a stable growth rate over the forecast period. The key driver for this region will beincrease in education for the need of NDT inspection.
0.0
2.0
4.0
6.0
8.0
10.0
12.0
14.0
200.0
300.0
400.0
500.0
600.0
700.0
800.0
900.0
1,000.0
1,100.0
2007 2008 2009 2010 2011 2012 2013 2014 2015 2016 2017
Rev
enue
Gro
wth
Rat
e (%
)
Rev
enue
($
Millio
n)
Year
Revenue ($ Million) Revenue Growth Rate (%)
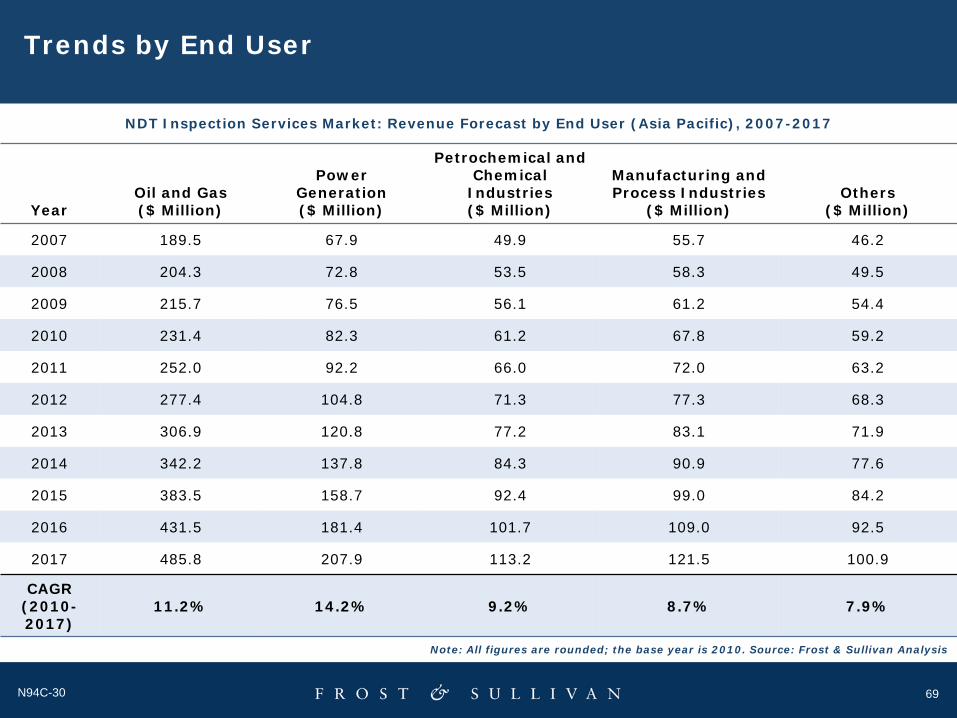
69N94C-30
Trends by End User
YearOil and Gas($ Million)
Power Generation($ Million)
Petrochemical and Chemical
Industries($ Million)
Manufacturing and Process Industries
($ Million)Others
($ Million)
2007 189.5 67.9 49.9 55.7 46.2
2008 204.3 72.8 53.5 58.3 49.5
2009 215.7 76.5 56.1 61.2 54.4
2010 231.4 82.3 61.2 67.8 59.2
2011 252.0 92.2 66.0 72.0 63.2
2012 277.4 104.8 71.3 77.3 68.3
2013 306.9 120.8 77.2 83.1 71.9
2014 342.2 137.8 84.3 90.9 77.6
2015 383.5 158.7 92.4 99.0 84.2
2016 431.5 181.4 101.7 109.0 92.5
2017 485.8 207.9 113.2 121.5 100.9
CAGR (2010-2017)
11.2% 14.2% 9.2% 8.7% 7.9%
NDT Inspection Services Market: Revenue Forecast by End User (Asia Pacific), 2007-2017
Note: All figures are rounded; the base year is 2010. Source: Frost & Sullivan Analysis
70N94C-30
Trends by End User
The biggest end user for NDT inspection services in Asia Pacific is oil and gas. It occupies 46.1 percent of the overall NDTinspection services market. This is not as high when compared with other regions, but a lack of government safetyregulations has resulted in low inspection carried out in this segment. This trend is expected to change with the amount ofinspection projected to increase in this segment. Hence, the market is likely to grow at a CAGR of 11.2 percent.
Power generation is another interesting segment in this market with a projected CAGR of 14.2 percent. This establishes theAsia Pacific power generation NDT inspection services market to be the highest growth market.
There has been a significant increase in the energy demand from this region over the past decade. The supply of energy tomeet this demand has been sluggish and many countries have faced power crisis. The governments of various countries inthis region have finally recognized this shortage, and the construction of both renewable energy and non-renewable energypower plants is expected to increase.
Another end user segment expected to witness growth is manufacturing with the continued outsourcing of manufacturingactivities to this region. High quality and safety standards set by these manufacturing industries leads to an increase indemand for NDT inspection services.
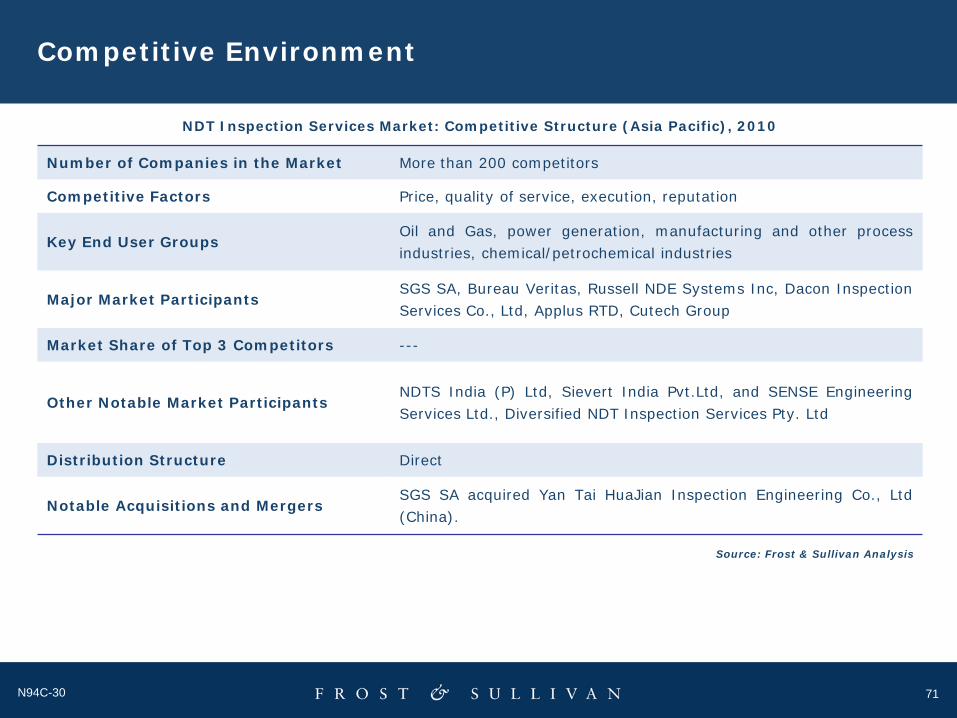
71N94C-30
Competitive Environment
NDT Inspection Services Market: Competitive Structure (Asia Pacific), 2010
Number of Companies in the Market More than 200 competitors
Competitive Factors Price, quality of service, execution, reputation
Key End User GroupsOil and Gas, power generation, manufacturing and other processindustries, chemical/petrochemical industries
Major Market ParticipantsSGS SA, Bureau Veritas, Russell NDE Systems Inc, Dacon InspectionServices Co., Ltd, Applus RTD, Cutech Group
Market Share of Top 3 Competitors ---
Other Notable Market ParticipantsNDTS India (P) Ltd, Sievert India Pvt.Ltd, and SENSE EngineeringServices Ltd., Diversified NDT Inspection Services Pty. Ltd
Distribution Structure Direct
Notable Acquisitions and MergersSGS SA acquired Yan Tai HuaJian Inspection Engineering Co., Ltd(China).
Source: Frost & Sullivan Analysis
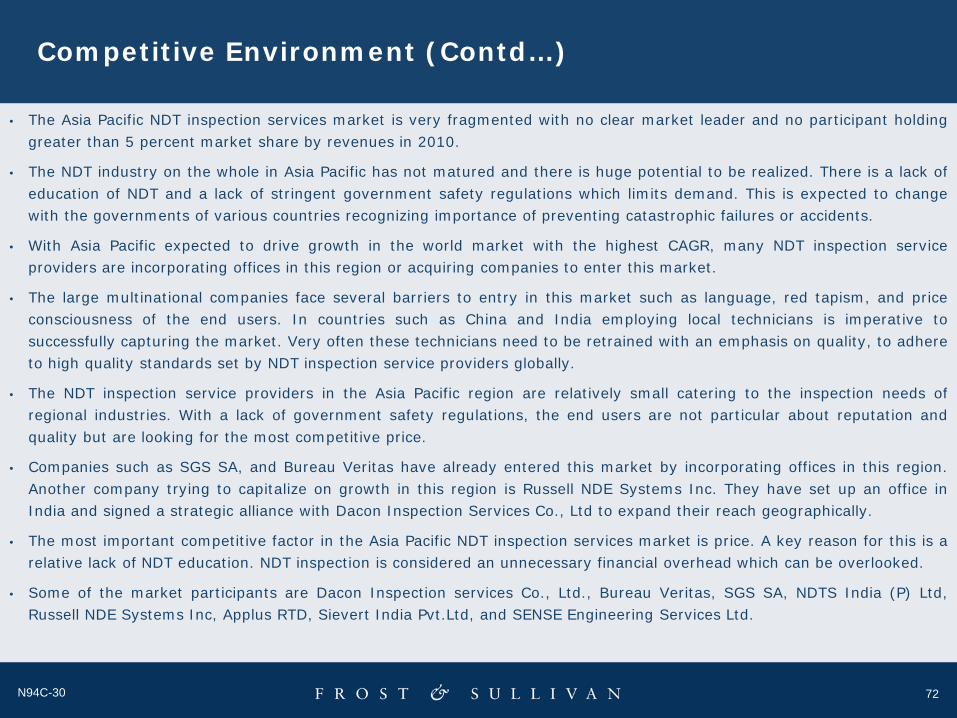
72N94C-30
Competitive Environment (Contd…)
• The Asia Pacific NDT inspection services market is very fragmented with no clear market leader and no participant holdinggreater than 5 percent market share by revenues in 2010.
• The NDT industry on the whole in Asia Pacific has not matured and there is huge potential to be realized. There is a lack ofeducation of NDT and a lack of stringent government safety regulations which limits demand. This is expected to changewith the governments of various countries recognizing importance of preventing catastrophic failures or accidents.
• With Asia Pacific expected to drive growth in the world market with the highest CAGR, many NDT inspection serviceproviders are incorporating offices in this region or acquiring companies to enter this market.
• The large multinational companies face several barriers to entry in this market such as language, red tapism, and priceconsciousness of the end users. In countries such as China and India employing local technicians is imperative tosuccessfully capturing the market. Very often these technicians need to be retrained with an emphasis on quality, to adhereto high quality standards set by NDT inspection service providers globally.
• The NDT inspection service providers in the Asia Pacific region are relatively small catering to the inspection needs ofregional industries. With a lack of government safety regulations, the end users are not particular about reputation andquality but are looking for the most competitive price.
• Companies such as SGS SA, and Bureau Veritas have already entered this market by incorporating offices in this region.Another company trying to capitalize on growth in this region is Russell NDE Systems Inc. They have set up an office inIndia and signed a strategic alliance with Dacon Inspection Services Co., Ltd to expand their reach geographically.
• The most important competitive factor in the Asia Pacific NDT inspection services market is price. A key reason for this is arelative lack of NDT education. NDT inspection is considered an unnecessary financial overhead which can be overlooked.
• Some of the market participants are Dacon Inspection services Co., Ltd., Bureau Veritas, SGS SA, NDTS India (P) Ltd,Russell NDE Systems Inc, Applus RTD, Sievert India Pvt.Ltd, and SENSE Engineering Services Ltd.

73N94C-30
Rest-of-World NDT Inspection Services Market
73

74N94C-30
Market Engineering Measurements
Market age Growth Stage ---
Revenues $346.5 million Increasing
Potential revenues (maximum future market size) $647.7 million Increasing
Base year market growth rate 7.7% Increasing
Compound annual growth rate 9.3% Increasing
Competitors (active market competitors in base year) More than 150 Decreasing
Degree of competition High Stable
Price Sensitivity High Stable
Degree of technical change Low Increasing
Customer loyalty 2 Increasing
Measurement Name Measurement Trend
NDT Inspection Services Market: Market Engineering Measurements (ROW), 2010
Note: All figures are rounded; the base year is 2010. Source: Frost & Sullivan Analysis
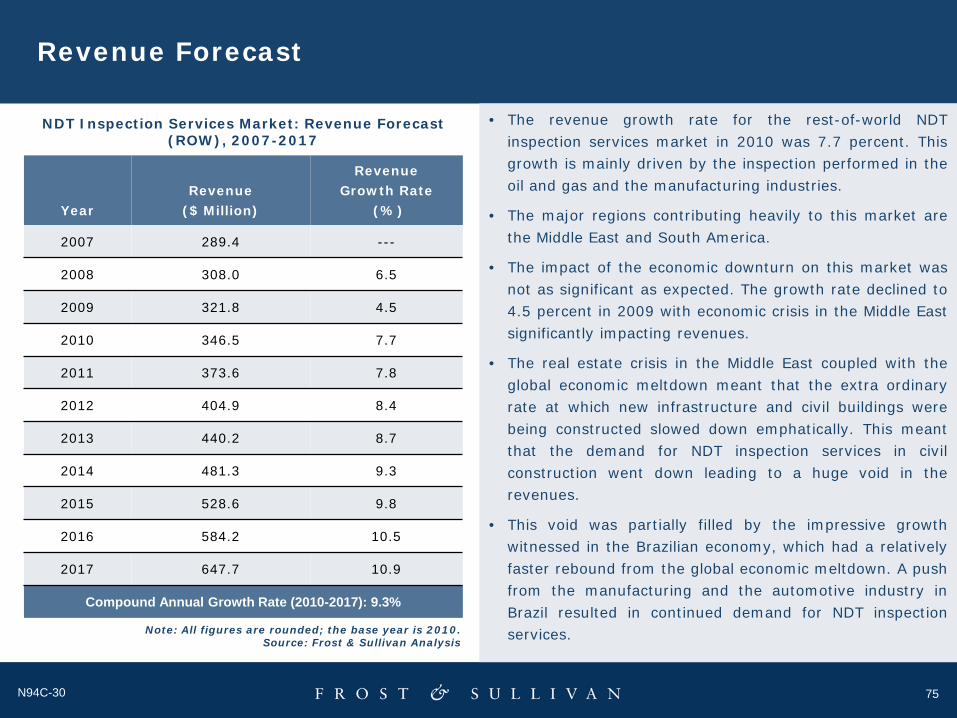
75N94C-30
Revenue Forecast
YearRevenue
($ Million)
Revenue Growth Rate
(%)
2007 289.4 ---
2008 308.0 6.5
2009 321.8 4.5
2010 346.5 7.7
2011 373.6 7.8
2012 404.9 8.4
2013 440.2 8.7
2014 481.3 9.3
2015 528.6 9.8
2016 584.2 10.5
2017 647.7 10.9
Compound Annual Growth Rate (2010-2017): 9.3%
NDT Inspection Services Market: Revenue Forecast (ROW), 2007-2017
Note: All figures are rounded; the base year is 2010.Source: Frost & Sullivan Analysis
• The revenue growth rate for the rest-of-world NDTinspection services market in 2010 was 7.7 percent. Thisgrowth is mainly driven by the inspection performed in theoil and gas and the manufacturing industries.
• The major regions contributing heavily to this market arethe Middle East and South America.
• The impact of the economic downturn on this market wasnot as significant as expected. The growth rate declined to4.5 percent in 2009 with economic crisis in the Middle Eastsignificantly impacting revenues.
• The real estate crisis in the Middle East coupled with theglobal economic meltdown meant that the extra ordinaryrate at which new infrastructure and civil buildings werebeing constructed slowed down emphatically. This meantthat the demand for NDT inspection services in civilconstruction went down leading to a huge void in therevenues.
• This void was partially filled by the impressive growthwitnessed in the Brazilian economy, which had a relativelyfaster rebound from the global economic meltdown. A pushfrom the manufacturing and the automotive industry inBrazil resulted in continued demand for NDT inspectionservices.
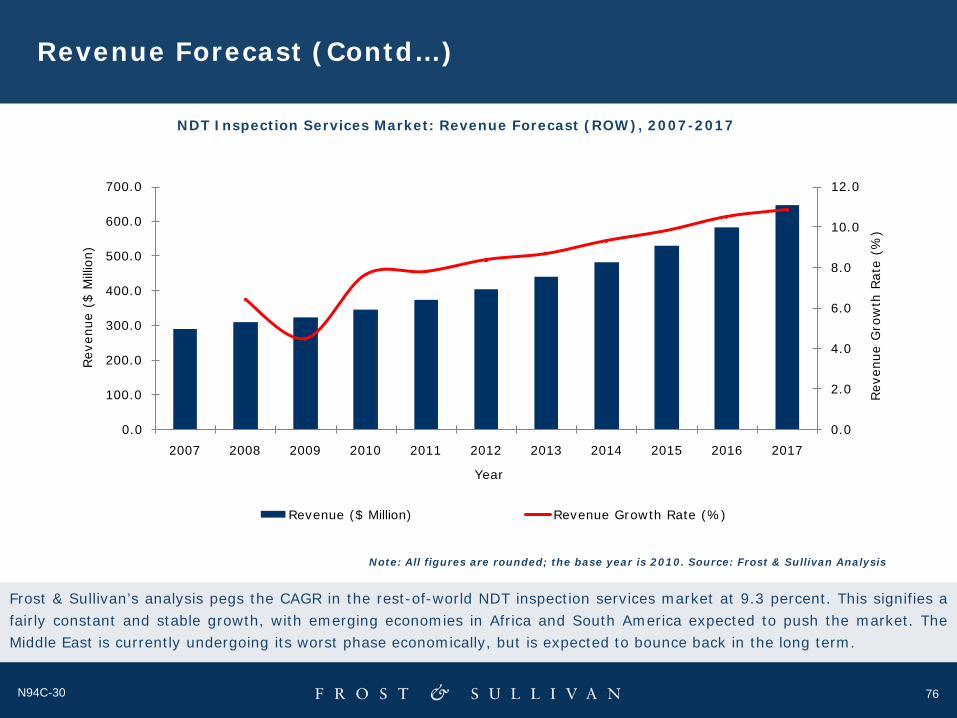
76N94C-30
Revenue Forecast (Contd…)
NDT Inspection Services Market: Revenue Forecast (ROW), 2007-2017
Note: All figures are rounded; the base year is 2010. Source: Frost & Sullivan Analysis
Frost & Sullivan’s analysis pegs the CAGR in the rest-of-world NDT inspection services market at 9.3 percent. This signifies afairly constant and stable growth, with emerging economies in Africa and South America expected to push the market. TheMiddle East is currently undergoing its worst phase economically, but is expected to bounce back in the long term.
0.0
2.0
4.0
6.0
8.0
10.0
12.0
0.0
100.0
200.0
300.0
400.0
500.0
600.0
700.0
2007 2008 2009 2010 2011 2012 2013 2014 2015 2016 2017
Rev
enue
Gro
wth
Rat
e (%
)
Rev
enue
($
Millio
n)
Year
Revenue ($ Million) Revenue Growth Rate (%)
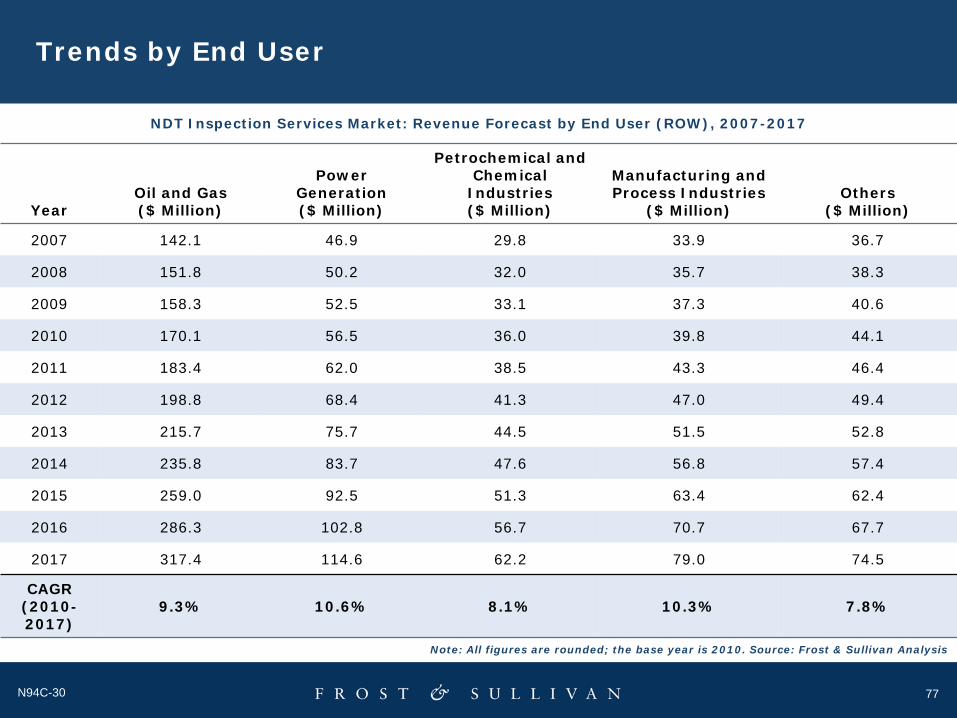
77N94C-30
Trends by End User
YearOil and Gas($ Million)
Power Generation($ Million)
Petrochemical and Chemical
Industries($ Million)
Manufacturing and Process Industries
($ Million)Others
($ Million)
2007 142.1 46.9 29.8 33.9 36.7
2008 151.8 50.2 32.0 35.7 38.3
2009 158.3 52.5 33.1 37.3 40.6
2010 170.1 56.5 36.0 39.8 44.1
2011 183.4 62.0 38.5 43.3 46.4
2012 198.8 68.4 41.3 47.0 49.4
2013 215.7 75.7 44.5 51.5 52.8
2014 235.8 83.7 47.6 56.8 57.4
2015 259.0 92.5 51.3 63.4 62.4
2016 286.3 102.8 56.7 70.7 67.7
2017 317.4 114.6 62.2 79.0 74.5
CAGR (2010-2017)
9.3% 10.6% 8.1% 10.3% 7.8%
Note: All figures are rounded; the base year is 2010. Source: Frost & Sullivan Analysis
NDT Inspection Services Market: Revenue Forecast by End User (ROW), 2007-2017
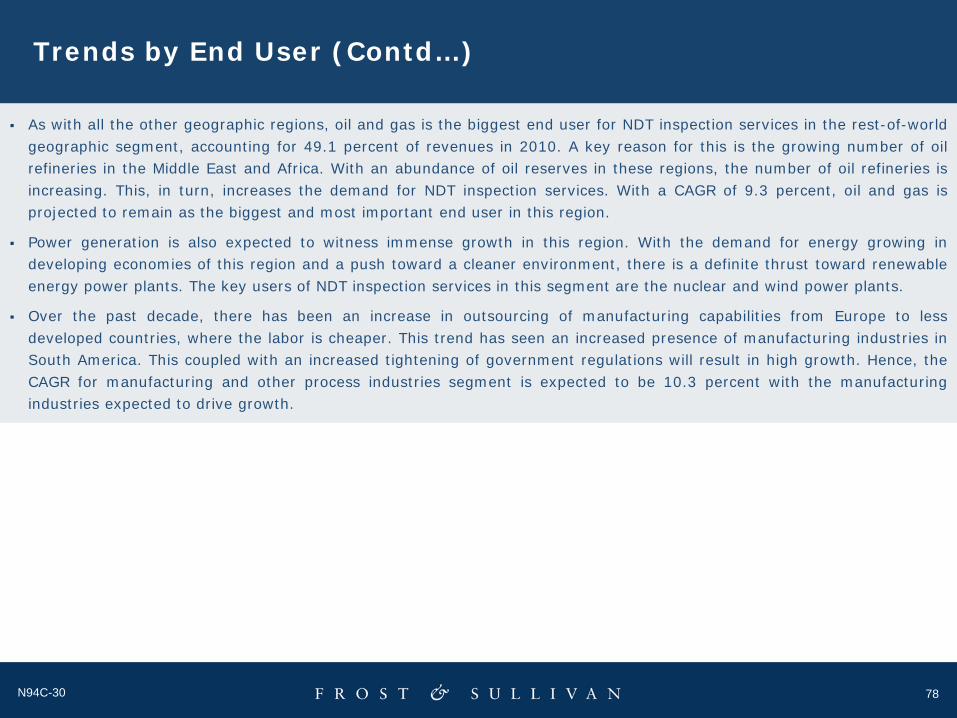
78N94C-30
Trends by End User (Contd…)
As with all the other geographic regions, oil and gas is the biggest end user for NDT inspection services in the rest-of-worldgeographic segment, accounting for 49.1 percent of revenues in 2010. A key reason for this is the growing number of oilrefineries in the Middle East and Africa. With an abundance of oil reserves in these regions, the number of oil refineries isincreasing. This, in turn, increases the demand for NDT inspection services. With a CAGR of 9.3 percent, oil and gas isprojected to remain as the biggest and most important end user in this region.
Power generation is also expected to witness immense growth in this region. With the demand for energy growing indeveloping economies of this region and a push toward a cleaner environment, there is a definite thrust toward renewableenergy power plants. The key users of NDT inspection services in this segment are the nuclear and wind power plants.
Over the past decade, there has been an increase in outsourcing of manufacturing capabilities from Europe to lessdeveloped countries, where the labor is cheaper. This trend has seen an increased presence of manufacturing industries inSouth America. This coupled with an increased tightening of government regulations will result in high growth. Hence, theCAGR for manufacturing and other process industries segment is expected to be 10.3 percent with the manufacturingindustries expected to drive growth.
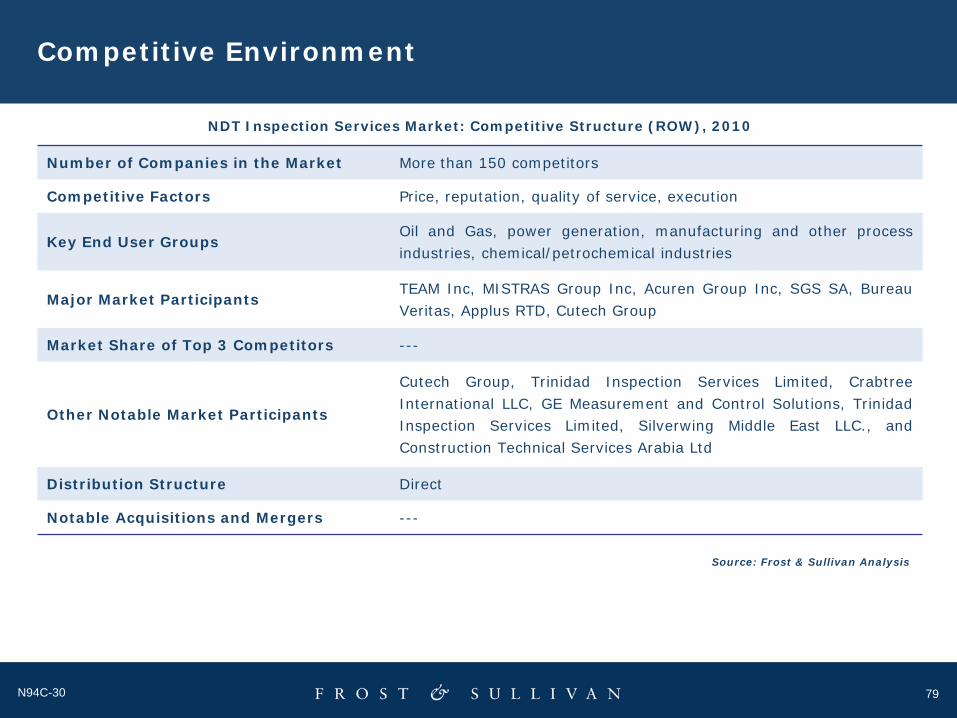
79N94C-30
Competitive Environment
NDT Inspection Services Market: Competitive Structure (ROW), 2010
Number of Companies in the Market More than 150 competitors
Competitive Factors Price, reputation, quality of service, execution
Key End User GroupsOil and Gas, power generation, manufacturing and other processindustries, chemical/petrochemical industries
Major Market ParticipantsTEAM Inc, MISTRAS Group Inc, Acuren Group Inc, SGS SA, BureauVeritas, Applus RTD, Cutech Group
Market Share of Top 3 Competitors ---
Other Notable Market Participants
Cutech Group, Trinidad Inspection Services Limited, CrabtreeInternational LLC, GE Measurement and Control Solutions, TrinidadInspection Services Limited, Silverwing Middle East LLC., andConstruction Technical Services Arabia Ltd
Distribution Structure Direct
Notable Acquisitions and Mergers ---
Source: Frost & Sullivan Analysis
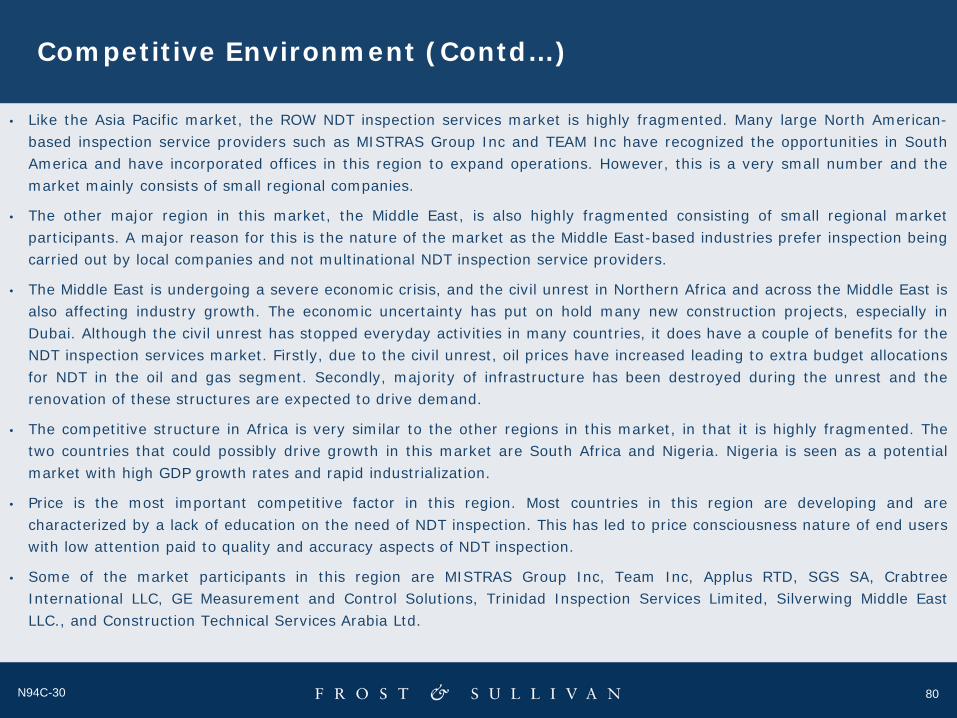
80N94C-30
Competitive Environment (Contd…)
• Like the Asia Pacific market, the ROW NDT inspection services market is highly fragmented. Many large North American-based inspection service providers such as MISTRAS Group Inc and TEAM Inc have recognized the opportunities in SouthAmerica and have incorporated offices in this region to expand operations. However, this is a very small number and themarket mainly consists of small regional companies.
• The other major region in this market, the Middle East, is also highly fragmented consisting of small regional marketparticipants. A major reason for this is the nature of the market as the Middle East-based industries prefer inspection beingcarried out by local companies and not multinational NDT inspection service providers.
• The Middle East is undergoing a severe economic crisis, and the civil unrest in Northern Africa and across the Middle East isalso affecting industry growth. The economic uncertainty has put on hold many new construction projects, especially inDubai. Although the civil unrest has stopped everyday activities in many countries, it does have a couple of benefits for theNDT inspection services market. Firstly, due to the civil unrest, oil prices have increased leading to extra budget allocationsfor NDT in the oil and gas segment. Secondly, majority of infrastructure has been destroyed during the unrest and therenovation of these structures are expected to drive demand.
• The competitive structure in Africa is very similar to the other regions in this market, in that it is highly fragmented. Thetwo countries that could possibly drive growth in this market are South Africa and Nigeria. Nigeria is seen as a potentialmarket with high GDP growth rates and rapid industrialization.
• Price is the most important competitive factor in this region. Most countries in this region are developing and arecharacterized by a lack of education on the need of NDT inspection. This has led to price consciousness nature of end userswith low attention paid to quality and accuracy aspects of NDT inspection.
• Some of the market participants in this region are MISTRAS Group Inc, Team Inc, Applus RTD, SGS SA, CrabtreeInternational LLC, GE Measurement and Control Solutions, Trinidad Inspection Services Limited, Silverwing Middle EastLLC., and Construction Technical Services Arabia Ltd.

81N94C-30
Strategic Observations and Conclusion
81
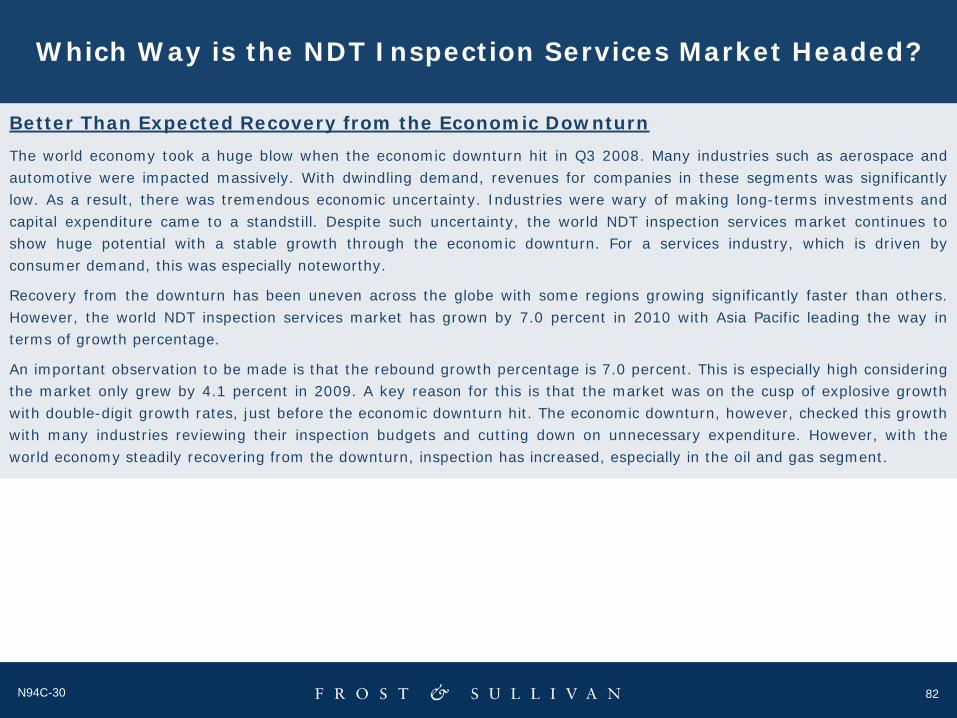
82N94C-30
Which Way is the NDT Inspection Services Market Headed?
Better Than Expected Recovery from the Economic DownturnThe world economy took a huge blow when the economic downturn hit in Q3 2008. Many industries such as aerospace andautomotive were impacted massively. With dwindling demand, revenues for companies in these segments was significantlylow. As a result, there was tremendous economic uncertainty. Industries were wary of making long-terms investments andcapital expenditure came to a standstill. Despite such uncertainty, the world NDT inspection services market continues toshow huge potential with a stable growth through the economic downturn. For a services industry, which is driven byconsumer demand, this was especially noteworthy.
Recovery from the downturn has been uneven across the globe with some regions growing significantly faster than others.However, the world NDT inspection services market has grown by 7.0 percent in 2010 with Asia Pacific leading the way interms of growth percentage.
An important observation to be made is that the rebound growth percentage is 7.0 percent. This is especially high consideringthe market only grew by 4.1 percent in 2009. A key reason for this is that the market was on the cusp of explosive growthwith double-digit growth rates, just before the economic downturn hit. The economic downturn, however, checked this growthwith many industries reviewing their inspection budgets and cutting down on unnecessary expenditure. However, with theworld economy steadily recovering from the downturn, inspection has increased, especially in the oil and gas segment.
83N94C-30
Which Way is the NDT Inspection Services Market Headed?(Contd…)
Impact of Japan Nuclear Crisis on Global NDT Inspection Services MarketThe catastrophic nature of the crisis affecting Japan with the leak of harmful radiation in the Fukushima nuclear reactor hasraised several doubts on the safety aspects of nuclear power plants. This raises important questions on the future of nuclearpower generation. With the NDT inspection services market expected to grow significantly due to demand for nuclear power, adecrease in construction of new plants would have a profound impact.
An immediate reaction to this disaster would point to increase in safety-driven NDT inspection in the nuclear power plants.With many countries, especially in Europe, shutting down operations in their respective nuclear power plants to review safetypolicies, there will be an increase in NDT inspection to a certain degree. But, there are long term affects as well that need tobe accounted for.
For instance, there would be heavy scrutiny during the planning stage for construction of a nuclear power plant which couldlead to a decline in the number of new nuclear power plants. Germany has already announced the it would close down all itsnuclear power plants by 2022. Switzerland has made a similar announcement, approving the phase-out of nuclear power by2034. China has suspended approval to all new nuclear power plants in the country and commissioned a review of the safetyin existing and under construction nuclear power plants.
No doubt there would be a decrease in the number of nuclear power plants constructed over the coming years, nuclear energyis still expected to grow albeit at a slower rate. With the demand for power not expected to recede, development ofalternatives to nuclear energy needs to be accelerated. This is expected to increment the growth in other power generationsegments such as wind energy, hydroelectric energy, and solar energy.

84N94C-30
About Frost & Sullivan
84
85N94C-30
Who is Frost & Sullivan
The Growth Consulting Company
• Founded in 1961, Frost & Sullivan has over 45 years of assisting clients with theirdecision-making and growth issues
• Over 1,700 Growth Consultants and Industry Analysts across 32 global locations
• Over 10,000 clients worldwide - emerging companies, the global 1000 and theinvestment community
• Developers of the Growth Excellence Matrix – industry leading growth positioning toolfor corporate executives
• Developers of T.E.A.M. Methodology, proprietary process to ensure that clients receivea 360o perspective of technology, markets and growth opportunities
• Three core services: Growth Partnership Services, Growth Consulting and CareerBest Practices
86N94C-30
What Makes Us Unique
Exclusively Focused on Growth
Global thought leader exclusively focusedon addressing client growth strategies andplans – Team actively engaged inresearching and developing of growthmodels that enable clients to achieveaggressive growth objectives.
Industry Breadth
Cover the broad spectrum of industries andtechnologies to provide clients with theability to look outside the box and discovernew and innovative ideas.
Global Perspective
32 global offices ensure that clients receivea global coverage/perspective based onregional expertise.
360o Perspective
Proprietary T.E.A.M.TM Methodologyintegrates all 6 critical researchmethodologies to significantly enhance theaccuracy of decision making and lower therisk of implementing growth strategies.
Growth Monitoring
Continuously monitor changing technology,markets and economics and proactivelyaddress clients growth initiatives andposition.
Trusted Partner
Working closely with client Growth Teams– helping them generate new growthinitiatives and leverage all ofFrost & Sullivan assets to accelerate theirgrowth.
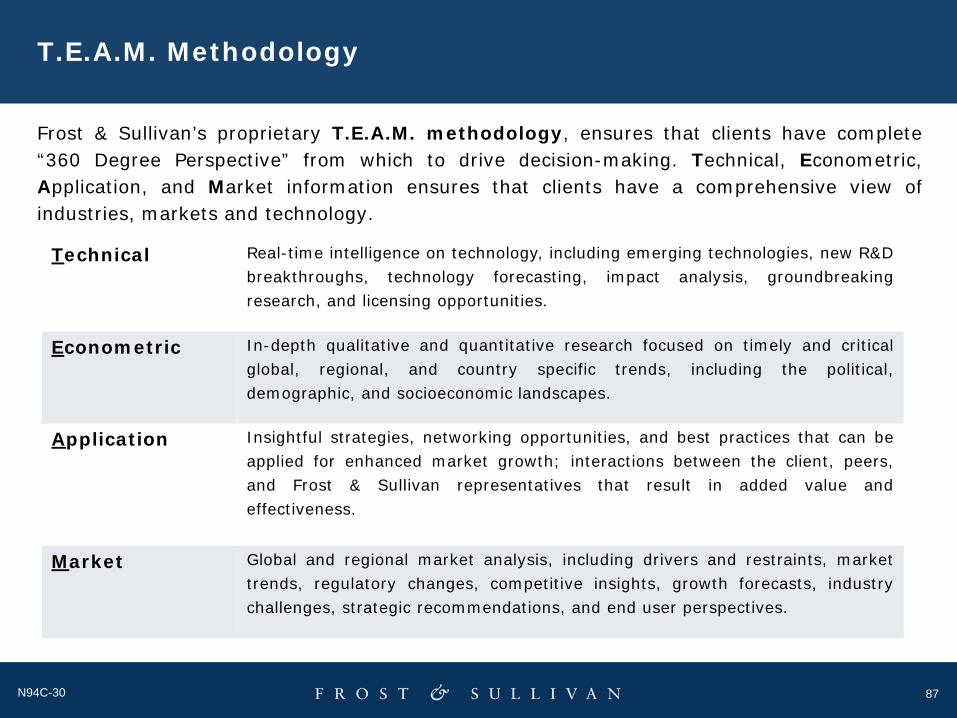
87N94C-30
T.E.A.M. Methodology
Frost & Sullivan’s proprietary T.E.A.M. methodology, ensures that clients have complete“360 Degree Perspective” from which to drive decision-making. Technical, Econometric,Application, and Market information ensures that clients have a comprehensive view ofindustries, markets and technology.
Technical Real-time intelligence on technology, including emerging technologies, new R&Dbreakthroughs, technology forecasting, impact analysis, groundbreakingresearch, and licensing opportunities.
Econometric In-depth qualitative and quantitative research focused on timely and criticalglobal, regional, and country specific trends, including the political,demographic, and socioeconomic landscapes.
Application Insightful strategies, networking opportunities, and best practices that can beapplied for enhanced market growth; interactions between the client, peers,and Frost & Sullivan representatives that result in added value andeffectiveness.
Market Global and regional market analysis, including drivers and restraints, markettrends, regulatory changes, competitive insights, growth forecasts, industrychallenges, strategic recommendations, and end user perspectives.
88N94C-30
Global Perspective
• 1,700 staff across every major market worldwide
• Over 10,000 clients worldwide from emerging to global 1000 companies