World Markets gain, on raised hopes -Market Review
12
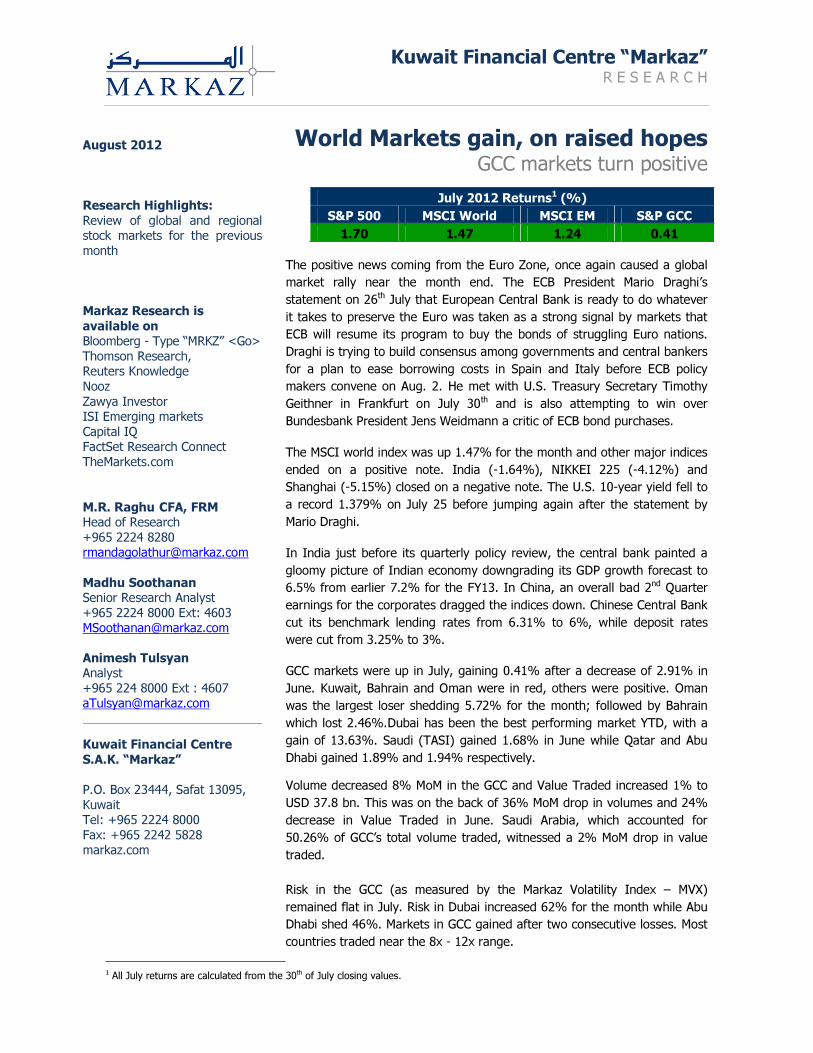
Kuwait Financial Centre “Markaz” R E S E A R C H World Markets gain, on raised hopes GCC markets turn positive July 2012 Returns 1 (%) S&P 500 MSCI World MSCI EM S&P GCC 1.70 1.47 1.24 0.41 The positive news coming from the Euro Zone, once again caused a global market rally near the month end. The ECB President Mario Draghi’s statement on 26 th July that European Central Bank is ready to do whatever it takes to preserve the Euro was taken as a strong signal by markets that ECB will resume its program to buy the bonds of struggling Euro nations. Draghi is trying to build consensus among governments and central bankers for a plan to ease borrowing costs in Spain and Italy before ECB policy makers convene on Aug. 2. He met with U.S. Treasury Secretary Timothy Geithner in Frankfurt on July 30 th and is also attempting to win over Bundesbank President Jens Weidmann a critic of ECB bond purchases. The MSCI world index was up 1.47% for the month and other major indices ended on a positive note. India (-1.64%), NIKKEI 225 (-4.12%) and Shanghai (-5.15%) closed on a negative note. The U.S. 10-year yield fell to a record 1.379% on July 25 before jumping again after the statement by Mario Draghi. In India just before its quarterly policy review, the central bank painted a gloomy picture of Indian economy downgrading its GDP growth forecast to 6.5% from earlier 7.2% for the FY13. In China, an overall bad 2 nd Quarter earnings for the corporates dragged the indices down. Chinese Central Bank cut its benchmark lending rates from 6.31% to 6%, while deposit rates were cut from 3.25% to 3%. GCC markets were up in July, gaining 0.41% after a decrease of 2.91% in June. Kuwait, Bahrain and Oman were in red, others were positive. Oman was the largest loser shedding 5.72% for the month; followed by Bahrain which lost 2.46%.Dubai has been the best performing market YTD, with a gain of 13.63%. Saudi (TASI) gained 1.68% in June while Qatar and Abu Dhabi gained 1.89% and 1.94% respectively. Volume decreased 8% MoM in the GCC and Value Traded increased 1% to USD 37.8 bn. This was on the back of 36% MoM drop in volumes and 24% decrease in Value Traded in June. Saudi Arabia, which accounted for 50.26% of GCC’s total volume traded, witnessed a 2% MoM drop in value traded. Risk in the GCC (as measured by the Markaz Volatility Index – MVX) remained flat in July. Risk in Dubai increased 62% for the month while Abu Dhabi shed 46%. Markets in GCC gained after two consecutive losses. Most countries traded near the 8x - 12x range. 1 All July returns are calculated from the 30 th of July closing values. August 2012 Research Highlights: Review of global and regional stock markets for the previous month Markaz Research is available on Bloomberg - Type “MRKZ” <Go> Thomson Research, Reuters Knowledge Nooz Zawya Investor ISI Emerging markets Capital IQ FactSet Research Connect TheMarkets.com M.R. Raghu CFA, FRM Head of Research +965 2224 8280 [email protected] Madhu Soothanan Senior Research Analyst +965 2224 8000 Ext: 4603 [email protected] Animesh Tulsyan Analyst +965 224 8000 Ext : 4607 [email protected] Kuwait Financial Centre S.A.K. “Markaz” P.O. Box 23444, Safat 13095, Kuwait Tel: +965 2224 8000 Fax: +965 2242 5828 markaz.com
-
Upload
marmore-mena-intelligence -
Category
Documents
-
view
216 -
download
3
description
World Markets gain, on raised hopes -Market Review
Transcript of World Markets gain, on raised hopes -Market Review
Kuwait Financial Centre “Markaz”
R E S E A R C H
World Markets gain, on raised hopes GCC markets turn positive
July 2012 Returns1 (%)
S&P 500 MSCI World MSCI EM S&P GCC
1.70 1.47 1.24 0.41
The positive news coming from the Euro Zone, once again caused a global
market rally near the month end. The ECB President Mario Draghi’s
statement on 26th July that European Central Bank is ready to do whatever
it takes to preserve the Euro was taken as a strong signal by markets that
ECB will resume its program to buy the bonds of struggling Euro nations.
Draghi is trying to build consensus among governments and central bankers
for a plan to ease borrowing costs in Spain and Italy before ECB policy
makers convene on Aug. 2. He met with U.S. Treasury Secretary Timothy
Geithner in Frankfurt on July 30th and is also attempting to win over
Bundesbank President Jens Weidmann a critic of ECB bond purchases.
The MSCI world index was up 1.47% for the month and other major indices
ended on a positive note. India (-1.64%), NIKKEI 225 (-4.12%) and
Shanghai (-5.15%) closed on a negative note. The U.S. 10-year yield fell to
a record 1.379% on July 25 before jumping again after the statement by
Mario Draghi.
In India just before its quarterly policy review, the central bank painted a
gloomy picture of Indian economy downgrading its GDP growth forecast to
6.5% from earlier 7.2% for the FY13. In China, an overall bad 2nd Quarter
earnings for the corporates dragged the indices down. Chinese Central Bank
cut its benchmark lending rates from 6.31% to 6%, while deposit rates
were cut from 3.25% to 3%.
GCC markets were up in July, gaining 0.41% after a decrease of 2.91% in
June. Kuwait, Bahrain and Oman were in red, others were positive. Oman
was the largest loser shedding 5.72% for the month; followed by Bahrain
which lost 2.46%.Dubai has been the best performing market YTD, with a
gain of 13.63%. Saudi (TASI) gained 1.68% in June while Qatar and Abu
Dhabi gained 1.89% and 1.94% respectively.
Volume decreased 8% MoM in the GCC and Value Traded increased 1% to
USD 37.8 bn. This was on the back of 36% MoM drop in volumes and 24%
decrease in Value Traded in June. Saudi Arabia, which accounted for
50.26% of GCC’s total volume traded, witnessed a 2% MoM drop in value
traded.
Risk in the GCC (as measured by the Markaz Volatility Index – MVX)
remained flat in July. Risk in Dubai increased 62% for the month while Abu
Dhabi shed 46%. Markets in GCC gained after two consecutive losses. Most
countries traded near the 8x - 12x range.
1 All July returns are calculated from the 30th of July closing values.
August 2012
Research Highlights:
Review of global and regional
stock markets for the previous
month
Markaz Research is
available on
Bloomberg - Type “MRKZ” <Go>
Thomson Research,
Reuters Knowledge
Nooz
Zawya Investor
ISI Emerging markets
Capital IQ
FactSet Research Connect
TheMarkets.com
M.R. Raghu CFA, FRM Head of Research
+965 2224 8280
Madhu Soothanan
Senior Research Analyst
+965 2224 8000 Ext: 4603
Animesh Tulsyan
Analyst
+965 224 8000 Ext : 4607
Kuwait Financial Centre
S.A.K. “Markaz”
P.O. Box 23444, Safat 13095,
Kuwait
Tel: +965 2224 8000
Fax: +965 2242 5828
markaz.com
R E S E A R C H August 2012
Kuwait Financial Centre “Markaz”
2
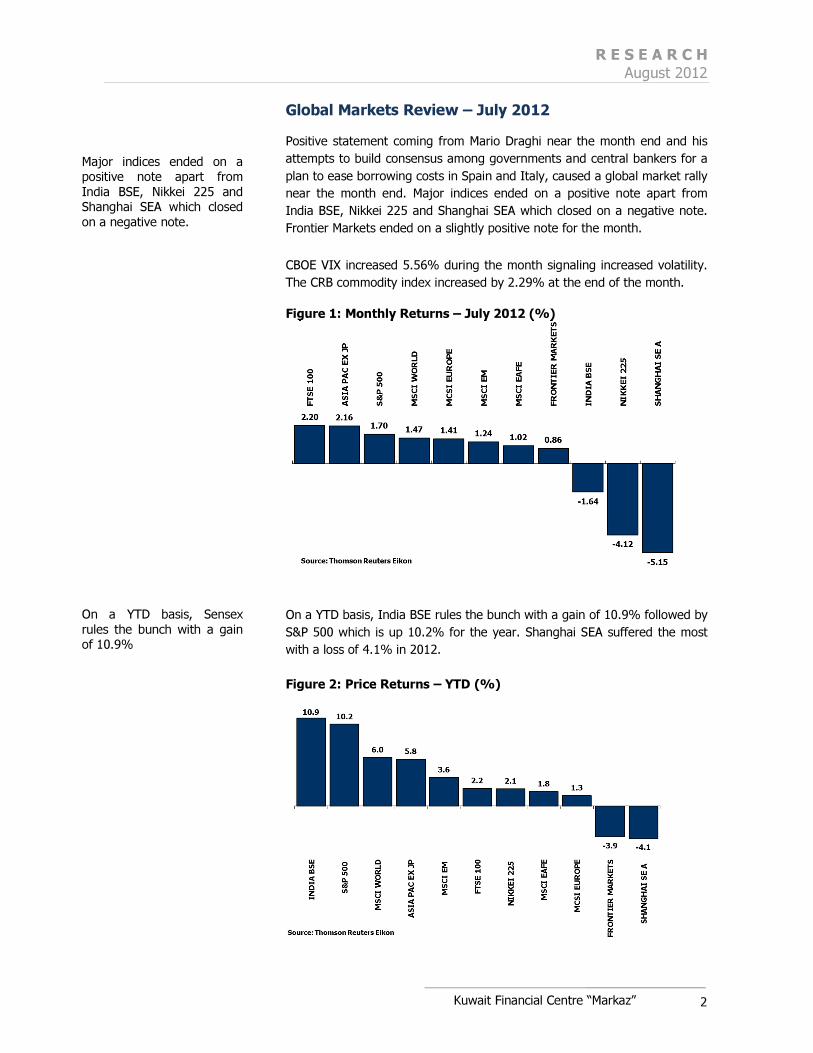
Global Markets Review – July 2012
Positive statement coming from Mario Draghi near the month end and his
attempts to build consensus among governments and central bankers for a
plan to ease borrowing costs in Spain and Italy, caused a global market rally
near the month end. Major indices ended on a positive note apart from
India BSE, Nikkei 225 and Shanghai SEA which closed on a negative note.
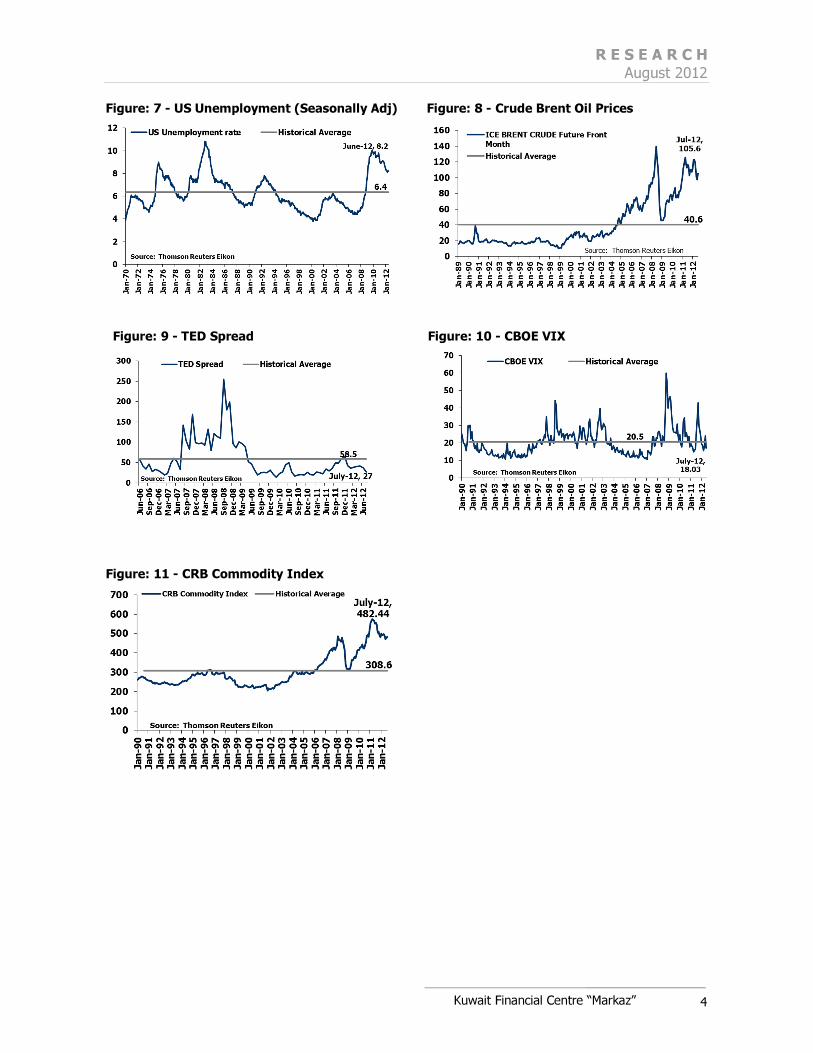
Frontier Markets ended on a slightly positive note for the month. CBOE VIX increased 5.56% during the month signaling increased volatility.
The CRB commodity index increased by 2.29% at the end of the month.
Figure 1: Monthly Returns – July 2012 (%)
On a YTD basis, India BSE rules the bunch with a gain of 10.9% followed by
S&P 500 which is up 10.2% for the year. Shanghai SEA suffered the most
with a loss of 4.1% in 2012.
Figure 2: Price Returns – YTD (%)
Major indices ended on a
positive note apart from
India BSE, Nikkei 225 and
Shanghai SEA which closed
on a negative note.
On a YTD basis, Sensex
rules the bunch with a gain
of 10.9%
R E S E A R C H August 2012
Kuwait Financial Centre “Markaz”
3
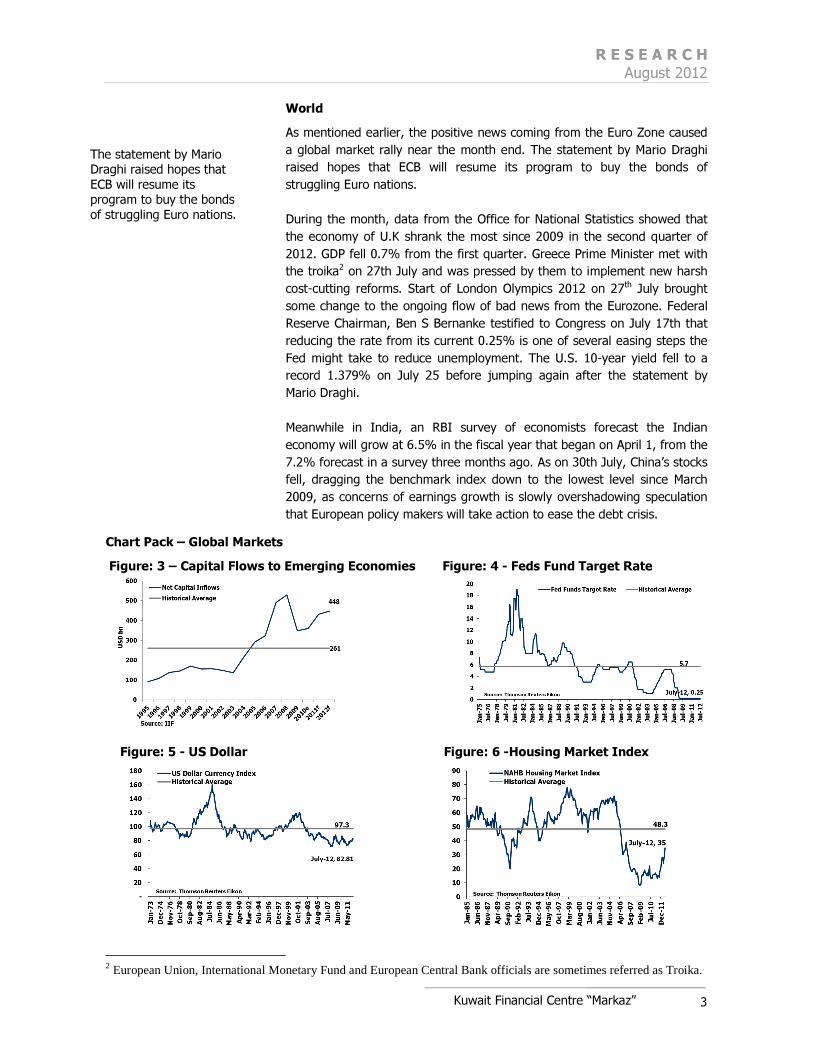
World
As mentioned earlier, the positive news coming from the Euro Zone caused
a global market rally near the month end. The statement by Mario Draghi
raised hopes that ECB will resume its program to buy the bonds of
struggling Euro nations.
During the month, data from the Office for National Statistics showed that
the economy of U.K shrank the most since 2009 in the second quarter of
2012. GDP fell 0.7% from the first quarter. Greece Prime Minister met with the troika2 on 27th July and was pressed by them to implement new harsh
cost-cutting reforms. Start of London Olympics 2012 on 27th July brought
some change to the ongoing flow of bad news from the Eurozone. Federal Reserve Chairman, Ben S Bernanke testified to Congress on July 17th that
reducing the rate from its current 0.25% is one of several easing steps the
Fed might take to reduce unemployment. The U.S. 10-year yield fell to a
record 1.379% on July 25 before jumping again after the statement by
Mario Draghi.
Meanwhile in India, an RBI survey of economists forecast the Indian
economy will grow at 6.5% in the fiscal year that began on April 1, from the
7.2% forecast in a survey three months ago. As on 30th July, China’s stocks
fell, dragging the benchmark index down to the lowest level since March
2009, as concerns of earnings growth is slowly overshadowing speculation
that European policy makers will take action to ease the debt crisis.
Chart Pack – Global Markets
Figure: 3 – Capital Flows to Emerging Economies Figure: 4 - Feds Fund Target Rate
Figure: 5 - US Dollar Figure: 6 -Housing Market Index
2 European Union, International Monetary Fund and European Central Bank officials are sometimes referred as Troika.
The statement by Mario
Draghi raised hopes that
ECB will resume its
program to buy the bonds
of struggling Euro nations.
R E S E A R C H August 2012
Kuwait Financial Centre “Markaz”
4
Figure: 7 - US Unemployment (Seasonally Adj) Figure: 8 - Crude Brent Oil Prices
Figure: 9 - TED Spread Figure: 10 - CBOE VIX
Figure: 11 - CRB Commodity Index
R E S E A R C H August 2012
Kuwait Financial Centre “Markaz”
5
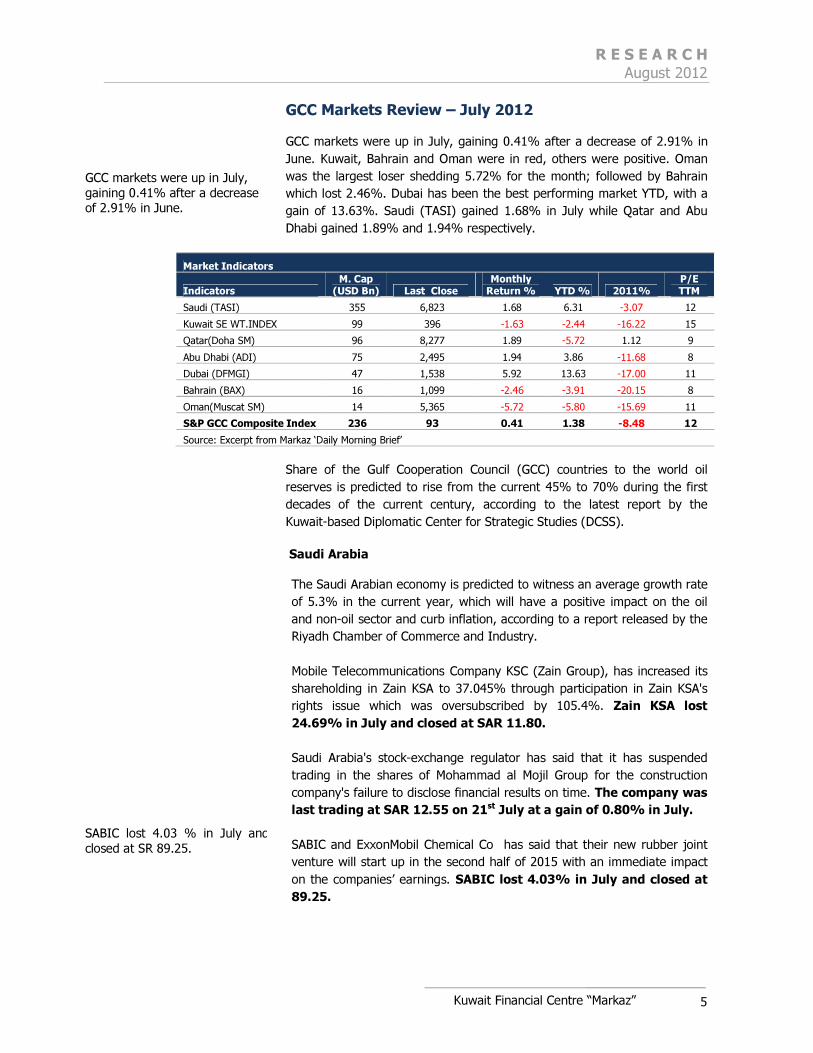
GCC Markets Review – July 2012
GCC markets were up in July, gaining 0.41% after a decrease of 2.91% in
June. Kuwait, Bahrain and Oman were in red, others were positive. Oman
was the largest loser shedding 5.72% for the month; followed by Bahrain
which lost 2.46%. Dubai has been the best performing market YTD, with a
gain of 13.63%. Saudi (TASI) gained 1.68% in July while Qatar and Abu
Dhabi gained 1.89% and 1.94% respectively.
Market Indicators
Indicators M. Cap (USD Bn) Last Close
Monthly Return % YTD % 2011%
P/E TTM
Saudi (TASI) 355 6,823 1.68 6.31 -3.07 12
Kuwait SE WT.INDEX 99 396 -1.63 -2.44 -16.22 15
Qatar(Doha SM) 96 8,277 1.89 -5.72 1.12 9
Abu Dhabi (ADI) 75 2,495 1.94 3.86 -11.68 8
Dubai (DFMGI) 47 1,538 5.92 13.63 -17.00 11
Bahrain (BAX) 16 1,099 -2.46 -3.91 -20.15 8
Oman(Muscat SM) 14 5,365 -5.72 -5.80 -15.69 11
S&P GCC Composite Index 236 93 0.41 1.38 -8.48 12
Source: Excerpt from Markaz ‘Daily Morning Brief’
Share of the Gulf Cooperation Council (GCC) countries to the world oil
reserves is predicted to rise from the current 45% to 70% during the first
decades of the current century, according to the latest report by the
Kuwait-based Diplomatic Center for Strategic Studies (DCSS).
Saudi Arabia
The Saudi Arabian economy is predicted to witness an average growth rate
of 5.3% in the current year, which will have a positive impact on the oil
and non-oil sector and curb inflation, according to a report released by the
Riyadh Chamber of Commerce and Industry.
Mobile Telecommunications Company KSC (Zain Group), has increased its
shareholding in Zain KSA to 37.045% through participation in Zain KSA's
rights issue which was oversubscribed by 105.4%. Zain KSA lost
24.69% in July and closed at SAR 11.80.
Saudi Arabia's stock-exchange regulator has said that it has suspended
trading in the shares of Mohammad al Mojil Group for the construction
company's failure to disclose financial results on time. The company was
last trading at SAR 12.55 on 21st July at a gain of 0.80% in July.
SABIC and ExxonMobil Chemical Co has said that their new rubber joint
venture will start up in the second half of 2015 with an immediate impact
on the companies’ earnings. SABIC lost 4.03% in July and closed at
89.25.
GCC markets were up in July,
gaining 0.41% after a decrease
of 2.91% in June.
SABIC lost 4.03 % in July and
closed at SR 89.25.
R E S E A R C H August 2012
Kuwait Financial Centre “Markaz”
6
United Arab Emirates
National Bank of Abu Dhabi has appointed Mohammed Ali Yasin as the
managing director of its brokerage arm, Abu Dhabi Financial Services. The
company gained 0.36% in July and closed at AED 8.33.
Low-cost carrier Air Arabia, posted over 15% year-on-year second quarter
lift in passenger volumes driven by network expansion and cheap fares.
The company gained 5% in July and closed at AED 0.63.
Emirates NBD is in talks with the U.A.E. central bank about regulations
limiting the amount domestic banks can lend to government related entities
and may get an extension on the September 30 deadline to comply with the
new rules. The company closed flat in July at AED 2.72.
Abu Dhabi Islamic Bank has launched operations in Iraq. It is the first
U.A.E.-based financial institution to get approval from the Iraqi Central Bank
to operate there. The company gained 2.63% in July and closed at
AED 3.12.
Kuwait
Mena Real Estate Co. has said that it is talks to buy a plot of land in Jordan
to set up a tourism and commercial real estate project there, at an
estimated cost of USD 15 million. The company lost 7.04% in July.
Commercial Real Estate Co. has said that the combined cost of two local
restaurant complex projects it plans to put out to tender will likely reach
16.78 million Kuwaiti dinars (USD 59.53 million). The company lost
7.69% in July.
Kuwait's Kipco Asset Management Co. has sold its entire 6.22% stake in the
local Advanced Technology Co. for 7.84 million Kuwaiti dinars (USD27.84
million). The company lost 11.20% in July.
Qatar
Qatar Islamic Bank (QIB) has announced the opening of a new banking
office at the Supreme Council of Health (SCH), as part of the bank's
ongoing expansion strategy to provide banking services all over Qatar. The
company gained 1.31% in July and closed at QAR 104.90.
Qtel announced on 17th July that Qtel International Finance Limited (QIFL),
its wholly owned subsidiary will pay its Global Medium Term Note (GMTN)
holders interest payments on the August 16. The company gained
1.35% in July and closed at QAR 104.90.
Qatar National Bank (QNB), has started accepting China Union Pay (CUP)
Cards on its Point of Sales (POS). This follows an agreement that was
recently signed with CUP, the largest Card Scheme in China and Asia. The
company gained 1.29% in July and closed at QAR 133.00.
National Bank of Abu Dhabi
has appointed Mohammed Ali
Yasin as the managing director
of its brokerage arm, Abu
Dhabi Financial Services
Volume decreased 8% MoM in
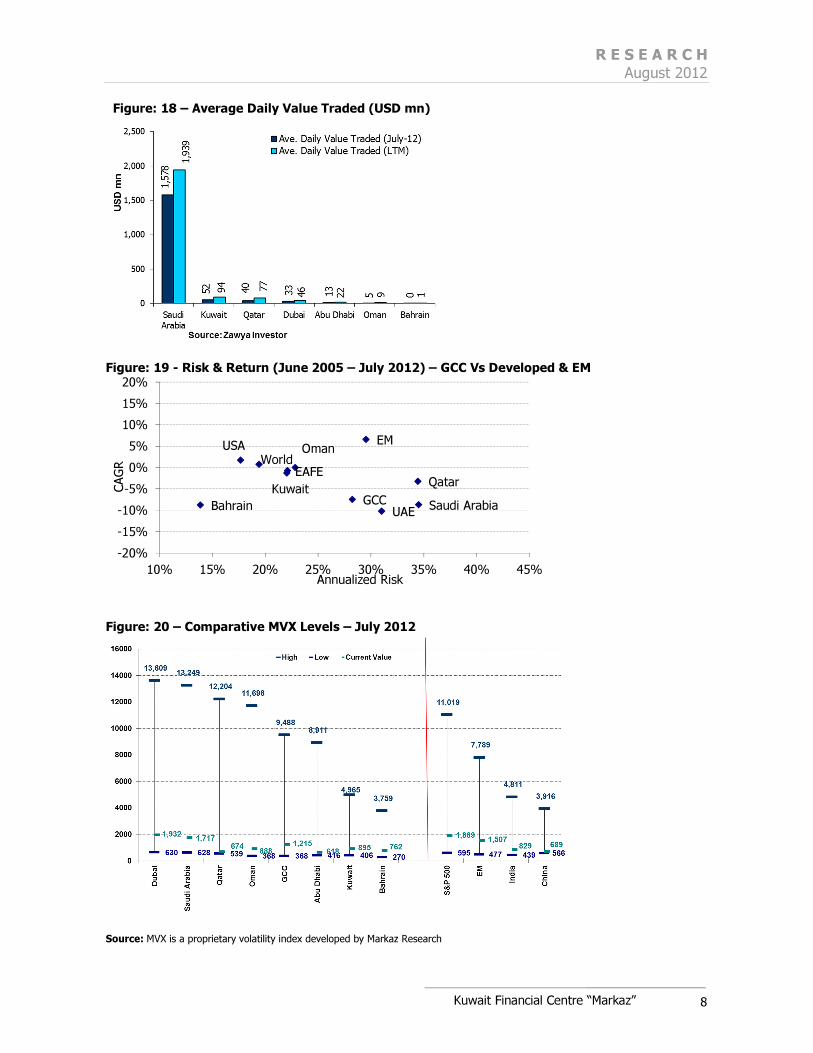
the GCC and Value Traded
increased 1% to USD 37.8 bn.
R E S E A R C H August 2012
Kuwait Financial Centre “Markaz”
7
Liquidity, Risk & Valuation
Volume decreased 8% MoM in the GCC and Value Traded increased 1% to
USD 37.8 bn. This was on the back of 36% MoM drop in volumes and 24%
decrease in Value Traded in June. Saudi Arabia, which accounted for 50.26%
of GCC’s total volume traded, witnessed a 2% MoM increase in value traded.
Risk in the GCC (as measured by the Markaz Volatility Index – MVX)
remained flat in July. Risk in Dubai increased 62% for the month while Abu
Dhabi shed 46%.
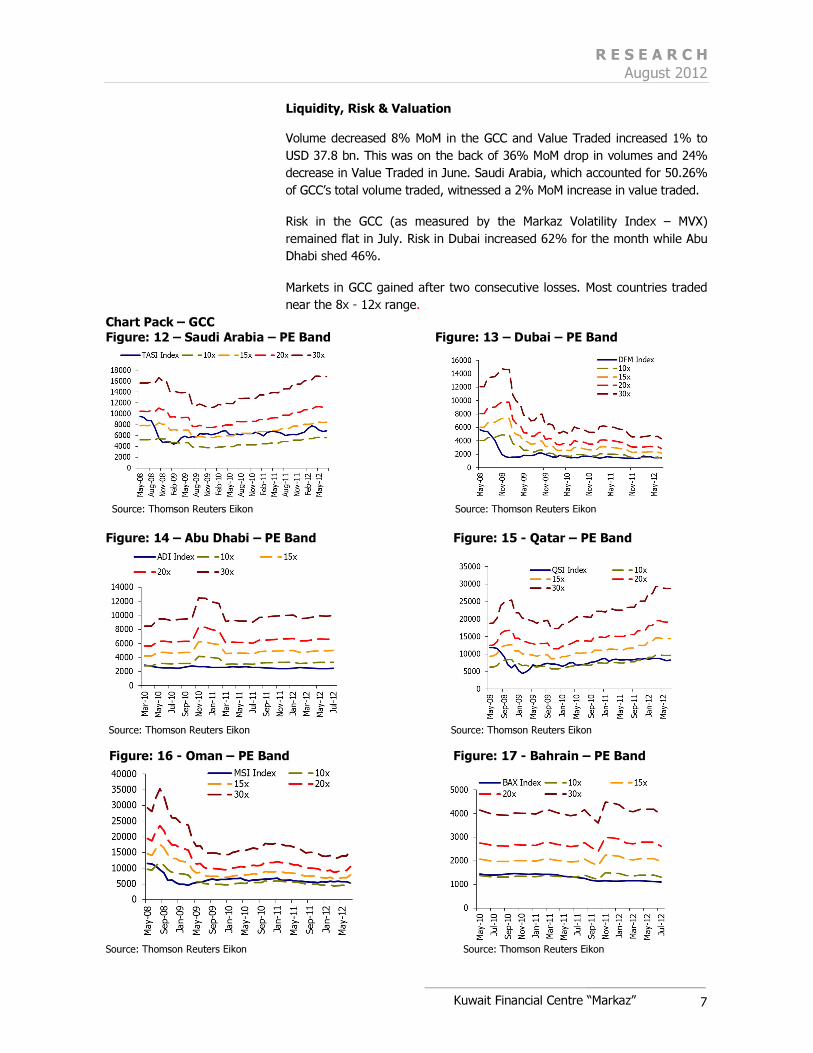
Markets in GCC gained after two consecutive losses. Most countries traded
near the 8x - 12x range.
Chart Pack – GCC
Figure: 12 – Saudi Arabia – PE Band Figure: 13 – Dubai – PE Band
Source: Thomson Reuters Eikon Source: Thomson Reuters Eikon
Figure: 14 – Abu Dhabi – PE Band Figure: 15 - Qatar – PE Band
Source: Thomson Reuters Eikon Source: Thomson Reuters Eikon Figure: 16 - Oman – PE Band Figure: 17 - Bahrain – PE Band
Source: Thomson Reuters Eikon Source: Thomson Reuters Eikon
R E S E A R C H August 2012
Kuwait Financial Centre “Markaz”
8
Figure: 18 – Average Daily Value Traded (USD mn)
Figure: 19 - Risk & Return (June 2005 – July 2012) – GCC Vs Developed & EM
Figure: 20 – Comparative MVX Levels – July 2012
Source: MVX is a proprietary volatility index developed by Markaz Research
EAFEWorld
USA EM
GCC Saudi Arabia
Kuwait
UAE
Qatar
Bahrain
Oman
-20%
-15%
-10%
-5%
0%
5%
10%
15%
20%
10% 15% 20% 25% 30% 35% 40% 45%
CAG
R
Annualized Risk
R E S E A R C H August 2012
Kuwait Financial Centre “Markaz”
9
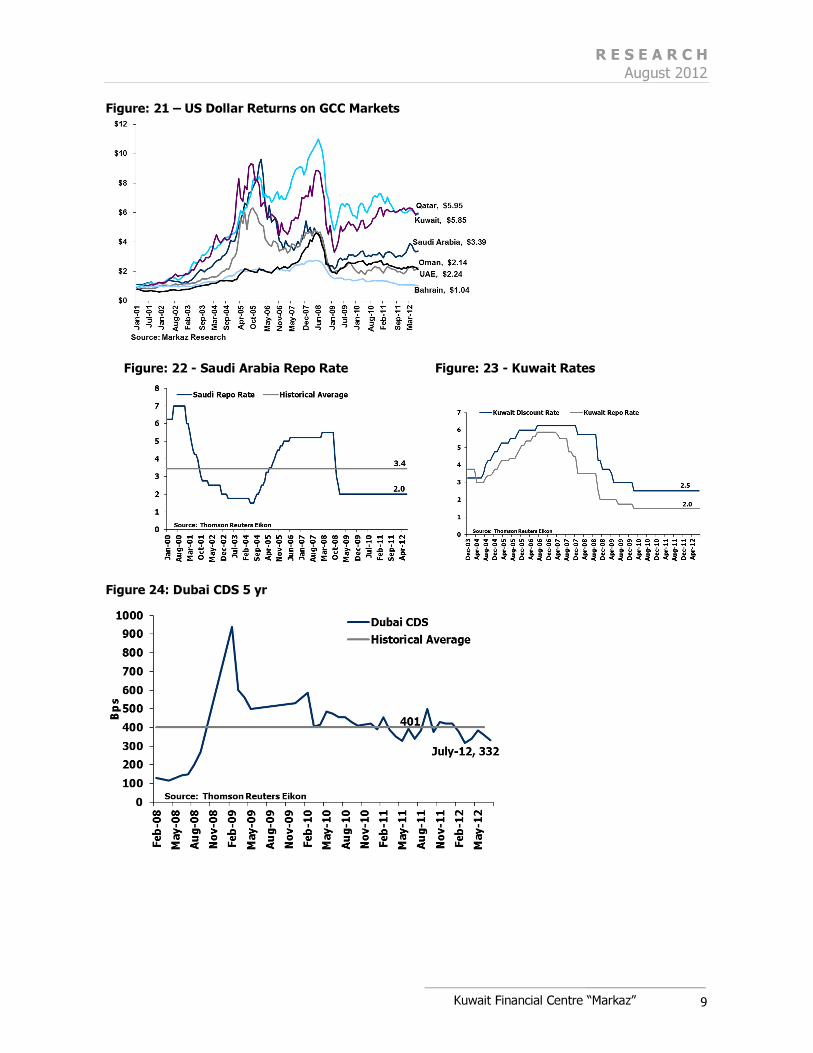
Figure: 21 – US Dollar Returns on GCC Markets
Figure: 22 - Saudi Arabia Repo Rate Figure: 23 - Kuwait Rates
Figure 24: Dubai CDS 5 yr
R E S E A R C H August 2012
Kuwait Financial Centre “Markaz”
10
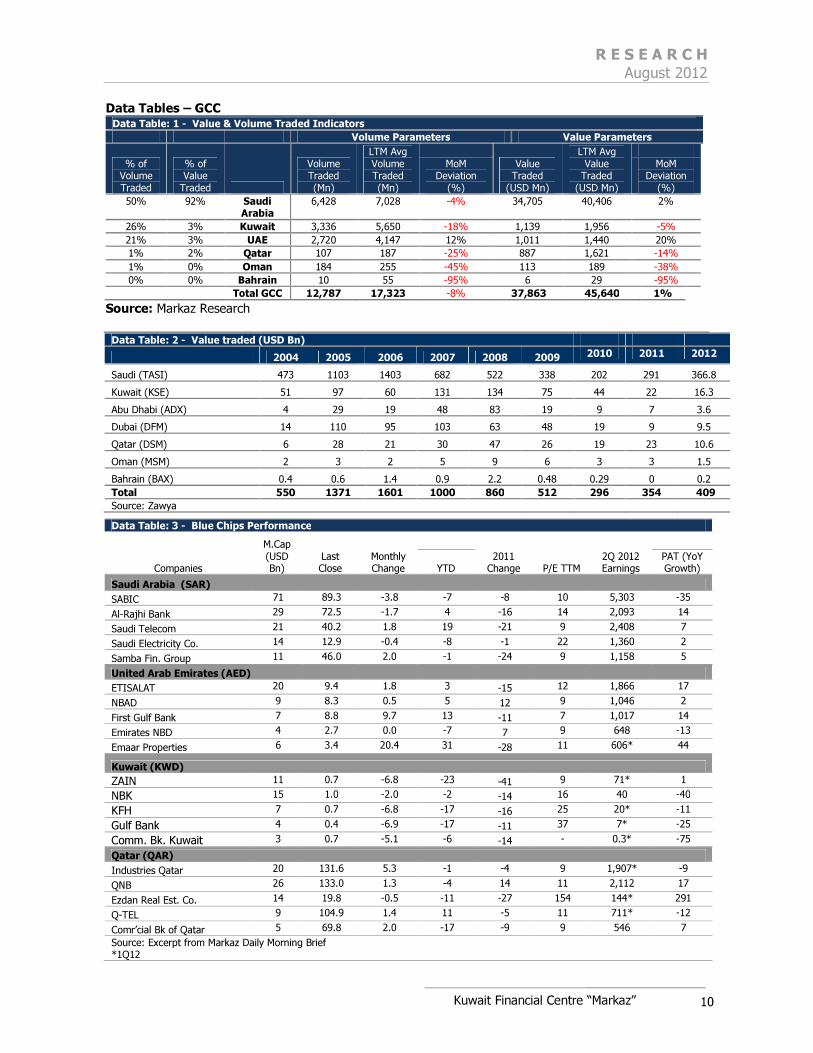
Data Tables – GCC Data Table: 1 - Value & Volume Traded Indicators
Volume Parameters Value Parameters
% of Volume Traded
% of Value Traded
Volume Traded (Mn)
LTM Avg Volume Traded (Mn)
Value Traded
(USD Mn)
LTM Avg Value Traded
(USD Mn)
MoM Deviation
(%)
MoM Deviation
(%)
50% 92% Saudi Arabia
6,428 7,028 -4% 34,705 40,406 2%
26% 3% Kuwait 3,336 5,650 -18% 1,139 1,956 -5%
21% 3% UAE 2,720 4,147 12% 1,011 1,440 20%
1% 2% Qatar 107 187 -25% 887 1,621 -14%
1% 0% Oman 184 255 -45% 113 189 -38%
0% 0% Bahrain 10 55 -95% 6 29 -95%
Total GCC 12,787 17,323 -8% 37,863 45,640 1%
Source: Markaz Research
Data Table: 2 - Value traded (USD Bn)
2004 2005 2006 2007 2008 2009 2010 2011 2012
Saudi (TASI) 473 1103 1403 682 522 338 202 291 366.8
Kuwait (KSE) 51 97 60 131 134 75 44 22 16.3
Abu Dhabi (ADX) 4 29 19 48 83 19 9 7 3.6
Dubai (DFM) 14 110 95 103 63 48 19 9 9.5
Qatar (DSM) 6 28 21 30 47 26 19 23 10.6
Oman (MSM) 2 3 2 5 9 6 3 3 1.5
Bahrain (BAX) 0.4 0.6 1.4 0.9 2.2 0.48 0.29 0 0.2
Total 550 1371 1601 1000 860 512 296 354 409
Source: Zawya
Data Table: 3 - Blue Chips Performance
Companies
M.Cap (USD Bn)
Last Close
Monthly Change
2011 Change P/E TTM
2Q 2012 Earnings
YTD PAT (YoY Growth)
Saudi Arabia (SAR)
SABIC 71 89.3 -3.8 -7 -8 10 5,303 -35
Al-Rajhi Bank 29 72.5 -1.7 4 -16 14 2,093 14
Saudi Telecom 21 40.2 1.8 19 -21 9 2,408 7
Saudi Electricity Co. 14 12.9 -0.4 -8 -1 22 1,360 2
Samba Fin. Group 11 46.0 2.0 -1 -24 9 1,158 5
United Arab Emirates (AED)
ETISALAT 20 9.4 1.8 3 -15 12 1,866 17
NBAD 9 8.3 0.5 5 12 9 1,046 2
First Gulf Bank 7 8.8 9.7 13 -11 7 1,017 14
Emirates NBD 4 2.7 0.0 -7 7 9 648 -13
Emaar Properties 6 3.4 20.4 31 -28 11 606* 44
Kuwait (KWD)
ZAIN 11 0.7 -6.8 -23 -41 9 71* 1
NBK 15 1.0 -2.0 -2 -14 16 40 -40
KFH 7 0.7 -6.8 -17 -16 25 20* -11
Gulf Bank 4 0.4 -6.9 -17 -11 37 7* -25
Comm. Bk. Kuwait 3 0.7 -5.1 -6 -14 - 0.3* -75
Qatar (QAR)
Industries Qatar 20 131.6 5.3 -1 -4 9 1,907* -9
QNB 26 133.0 1.3 -4 14 11 2,112 17
Ezdan Real Est. Co. 14 19.8 -0.5 -11 -27 154 144* 291
Q-TEL 9 104.9 1.4 11 -5 11 711* -12
Comr’cial Bk of Qatar 5 69.8 2.0 -17 -9 9 546 7
Source: Excerpt from Markaz Daily Morning Brief *1Q12
R E S E A R C H August 2012
R E S E A R C H August 2012
Disclaimer
This report has been prepared and issued by Kuwait Financial Centre S.A.K (Markaz), which is regulated by
the Central Bank of Kuwait. The report is owned by Markaz and is privileged and proprietary and is subject
to copyrights. Sale of any copies of this report is strictly prohibited. This report cannot be quoted without the
prior written consent of Markaz. Any user after obtaining Markaz permission to use this report must clearly
mention the source as “Markaz “.This Report is intended to be circulated for general information only and
should not to be construed as an offer to buy or sell or a solicitation of an offer to buy or sell any financial
instruments or to participate in any particular trading strategy in any jurisdiction. The information and
statistical data herein have been obtained from sources we believe to be reliable but in no way are
warranted by us as to its accuracy or completeness. Markaz has no obligation to update, modify or amend
this report.
This report does not have regard to the specific investment objectives, financial situation and the particular
needs of any specific person who may receive this report. Investors are urged to seek financial advice
regarding the appropriateness of investing in any securities or investment strategies discussed or
recommended in this report and to understand that statements regarding future prospects may not be
realized. Investors should note that income from such securities, if any, may fluctuate and that each
security’s price or value may rise or fall. Investors should be able and willing to accept a total or partial loss
of their investment. Accordingly, investors may receive back less than originally invested. Past performance
is historical and is not necessarily indicative of future performance.
Kuwait Financial Centre S.A.K (Markaz) does and seeks to do business, including investment banking deals,
with companies covered in its research reports. As a result, investors should be aware that the firm may
have a conflict of interest that could affect the objectivity of this report. For further information, please contact ‘Markaz’ at P.O. Box 23444, Safat 13095, Kuwait. Tel: 00965 1804800 Fax: 00965
22450647. Email: [email protected]